Experimental Study on Hydrate Formation and Flow Characteristics with High Water Cuts


Abstract
:1. Introduction
2. Experimental Program
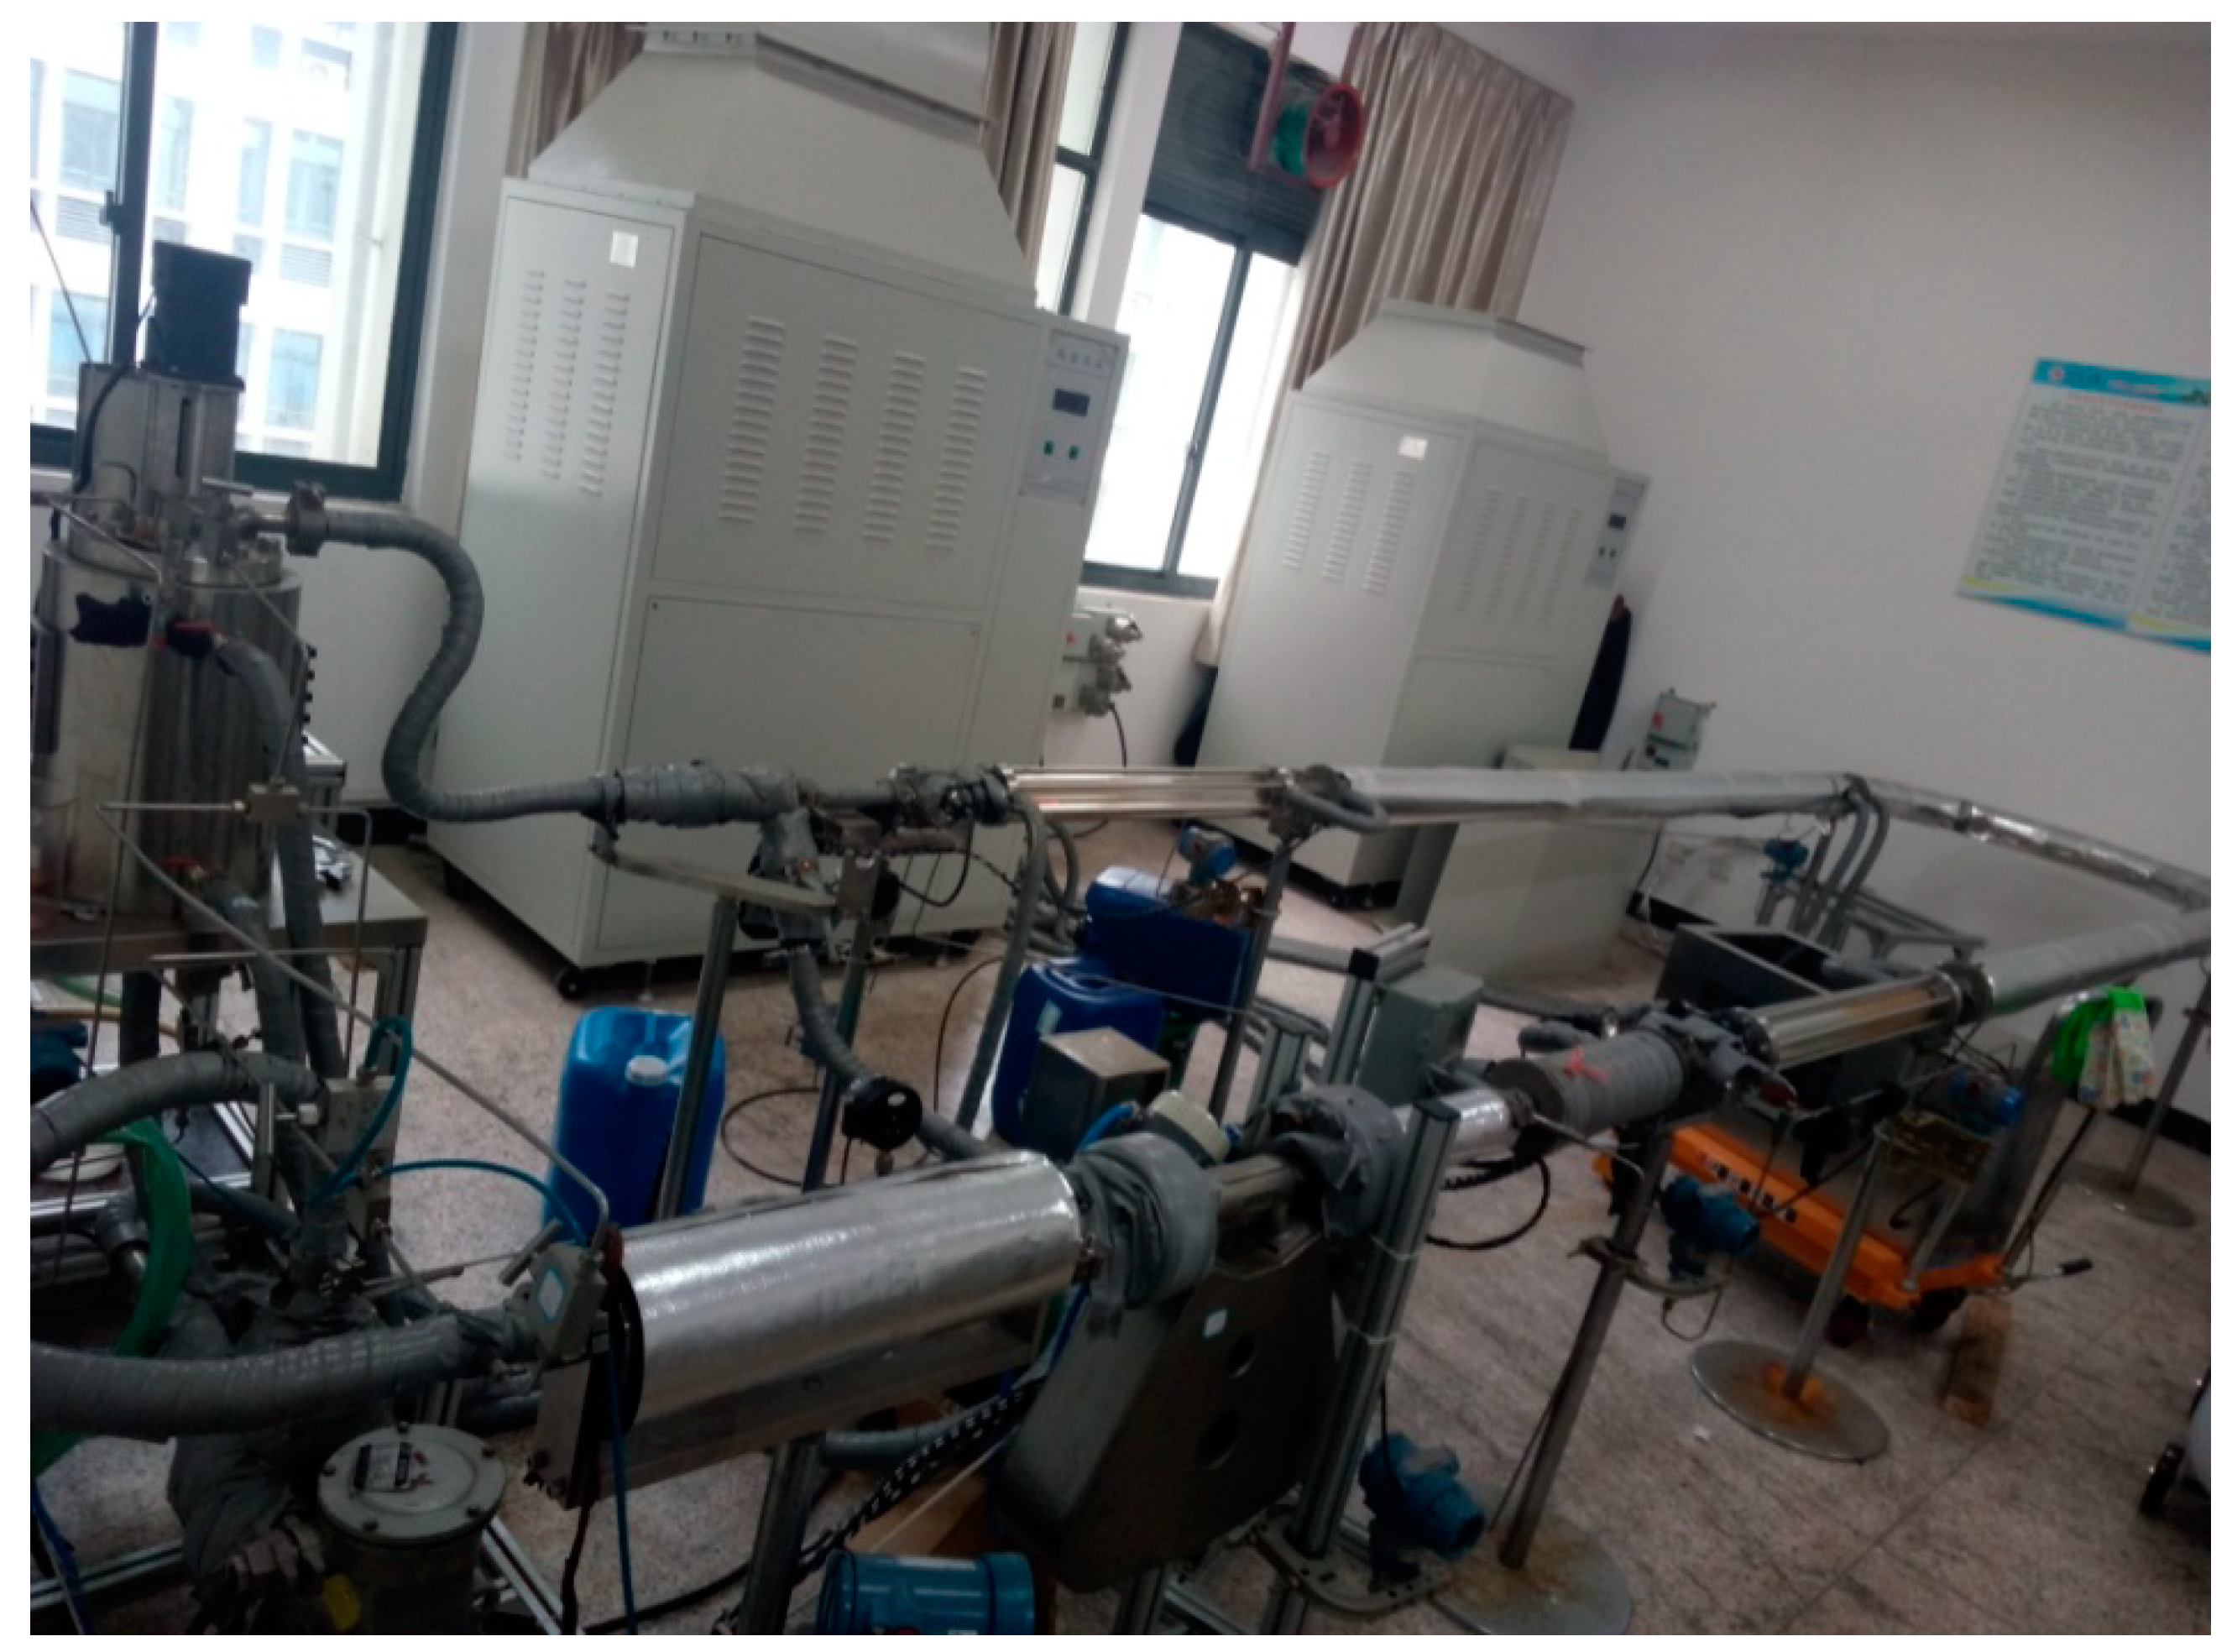
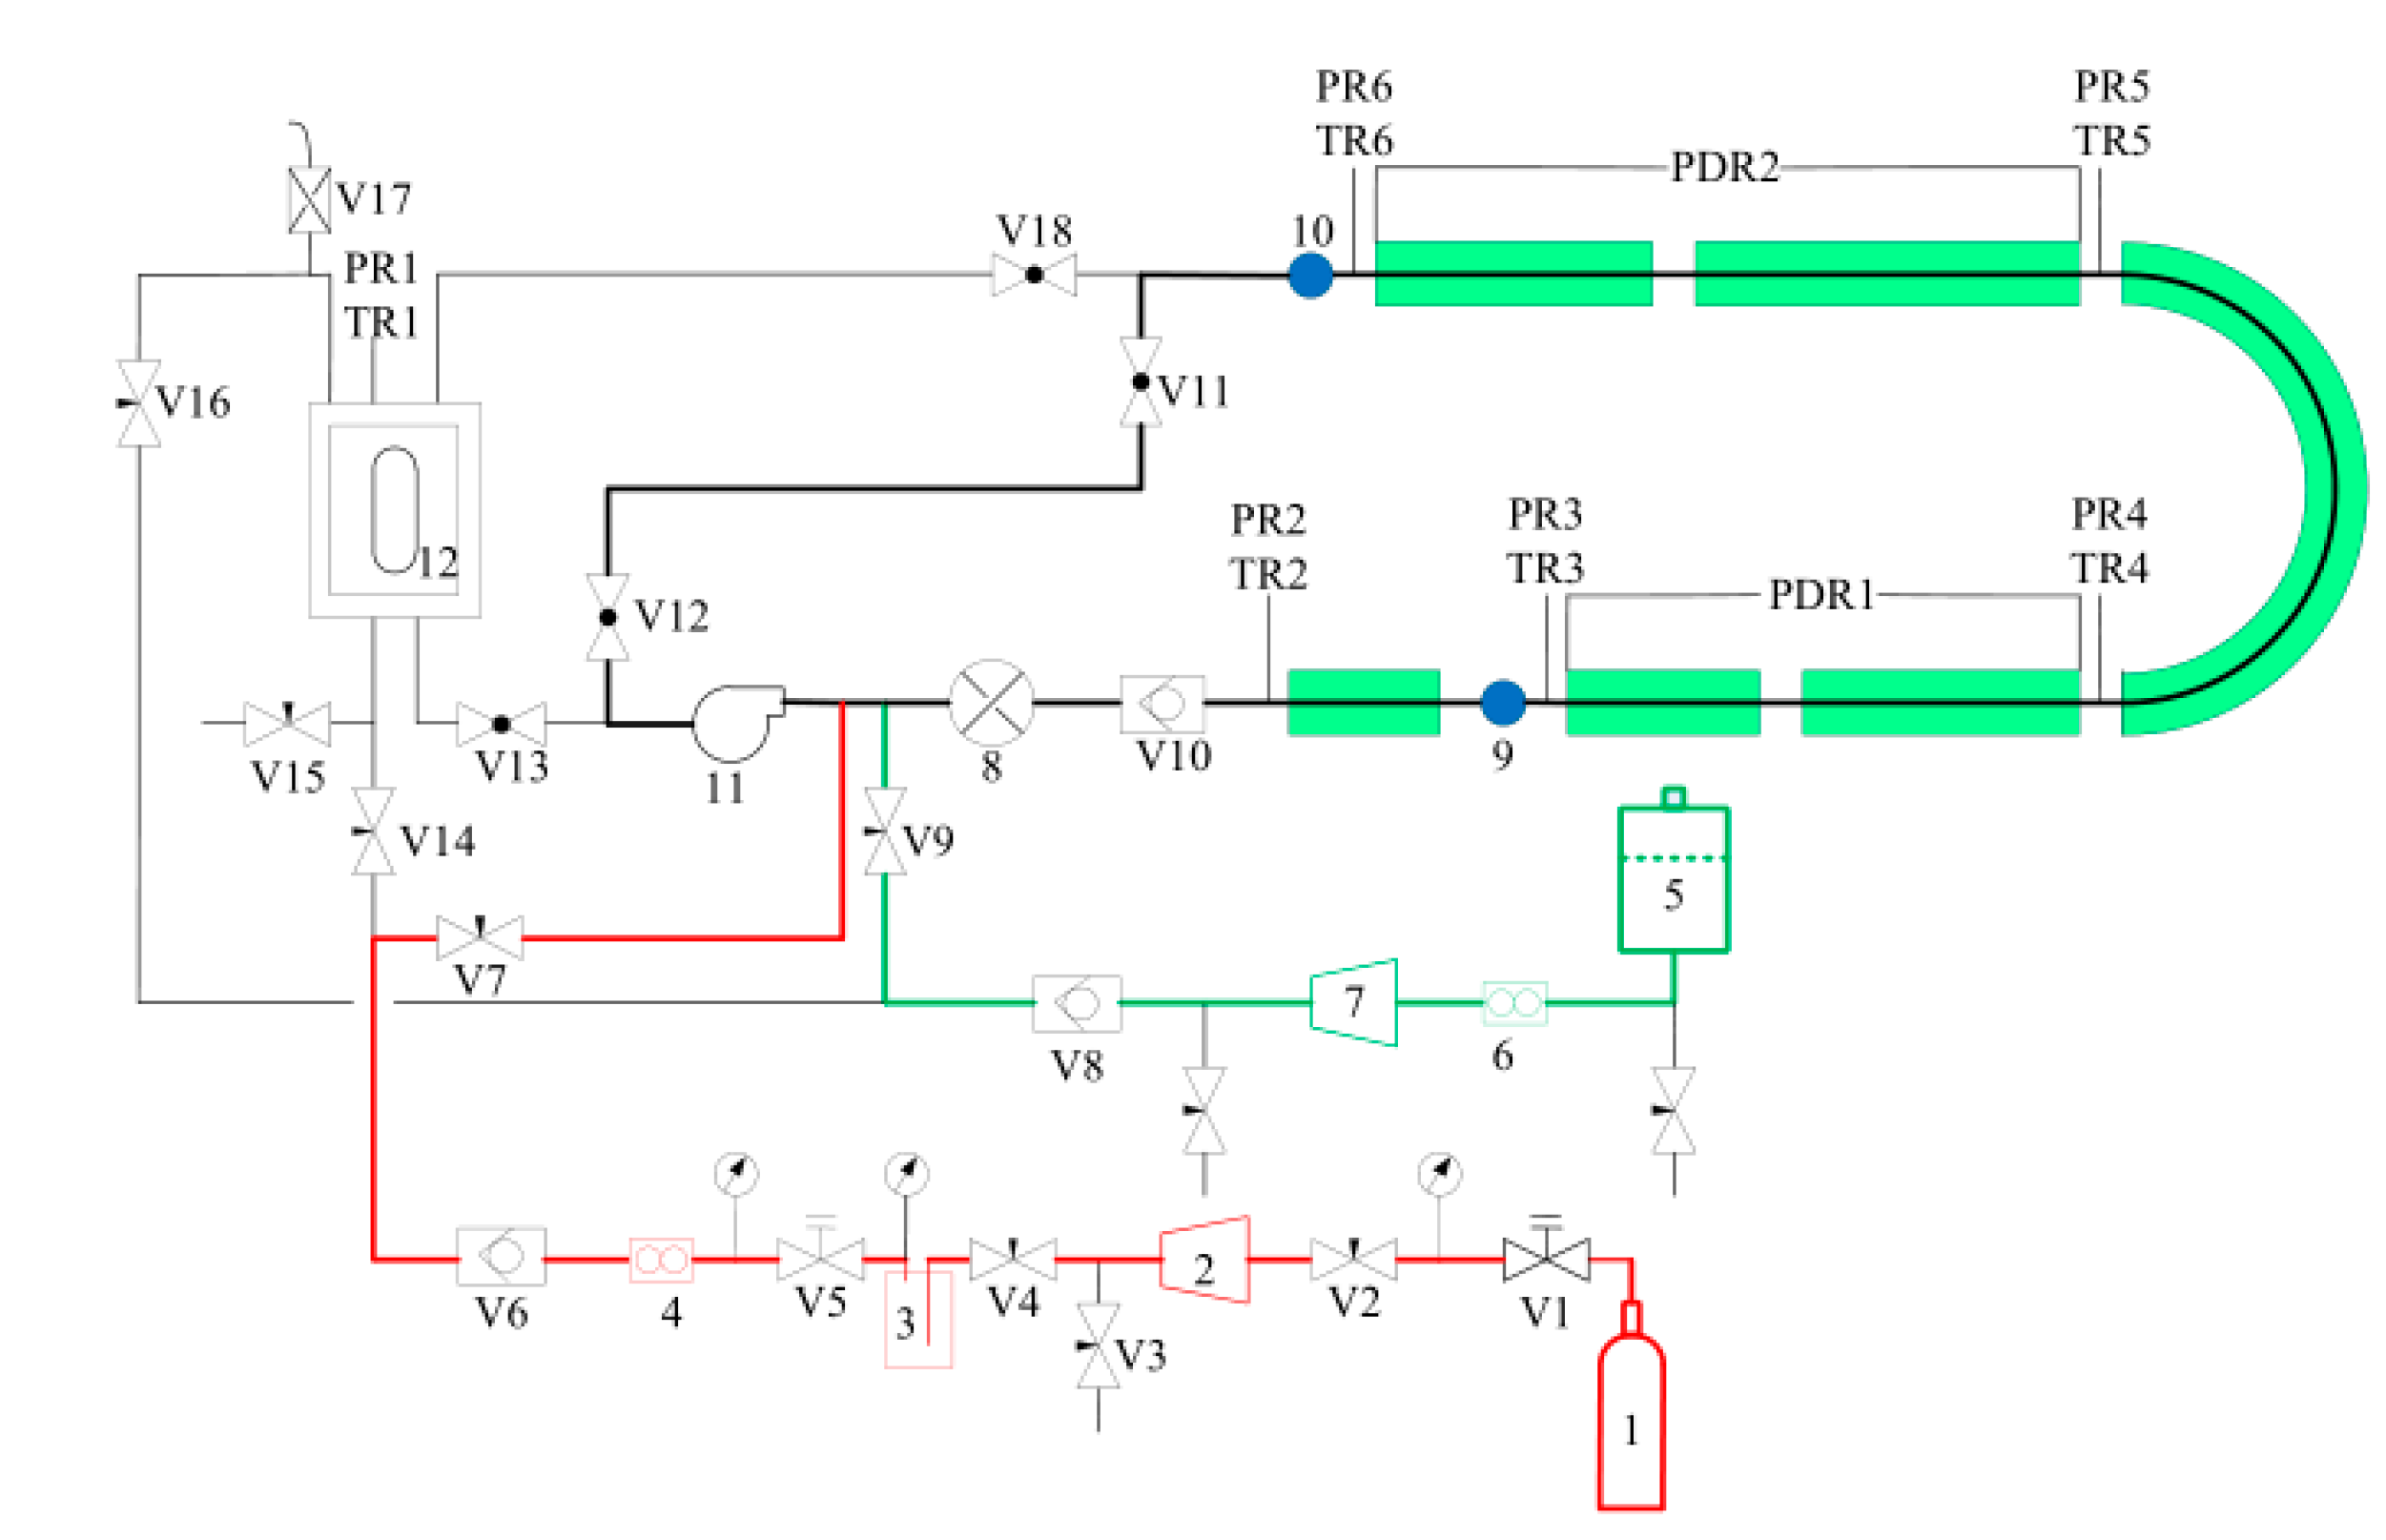
2.1. Experimental Facility
2.2. Experimental Materials
2.3. Operation Procedures
2.4. Test Matrix
3. Results and Discussion
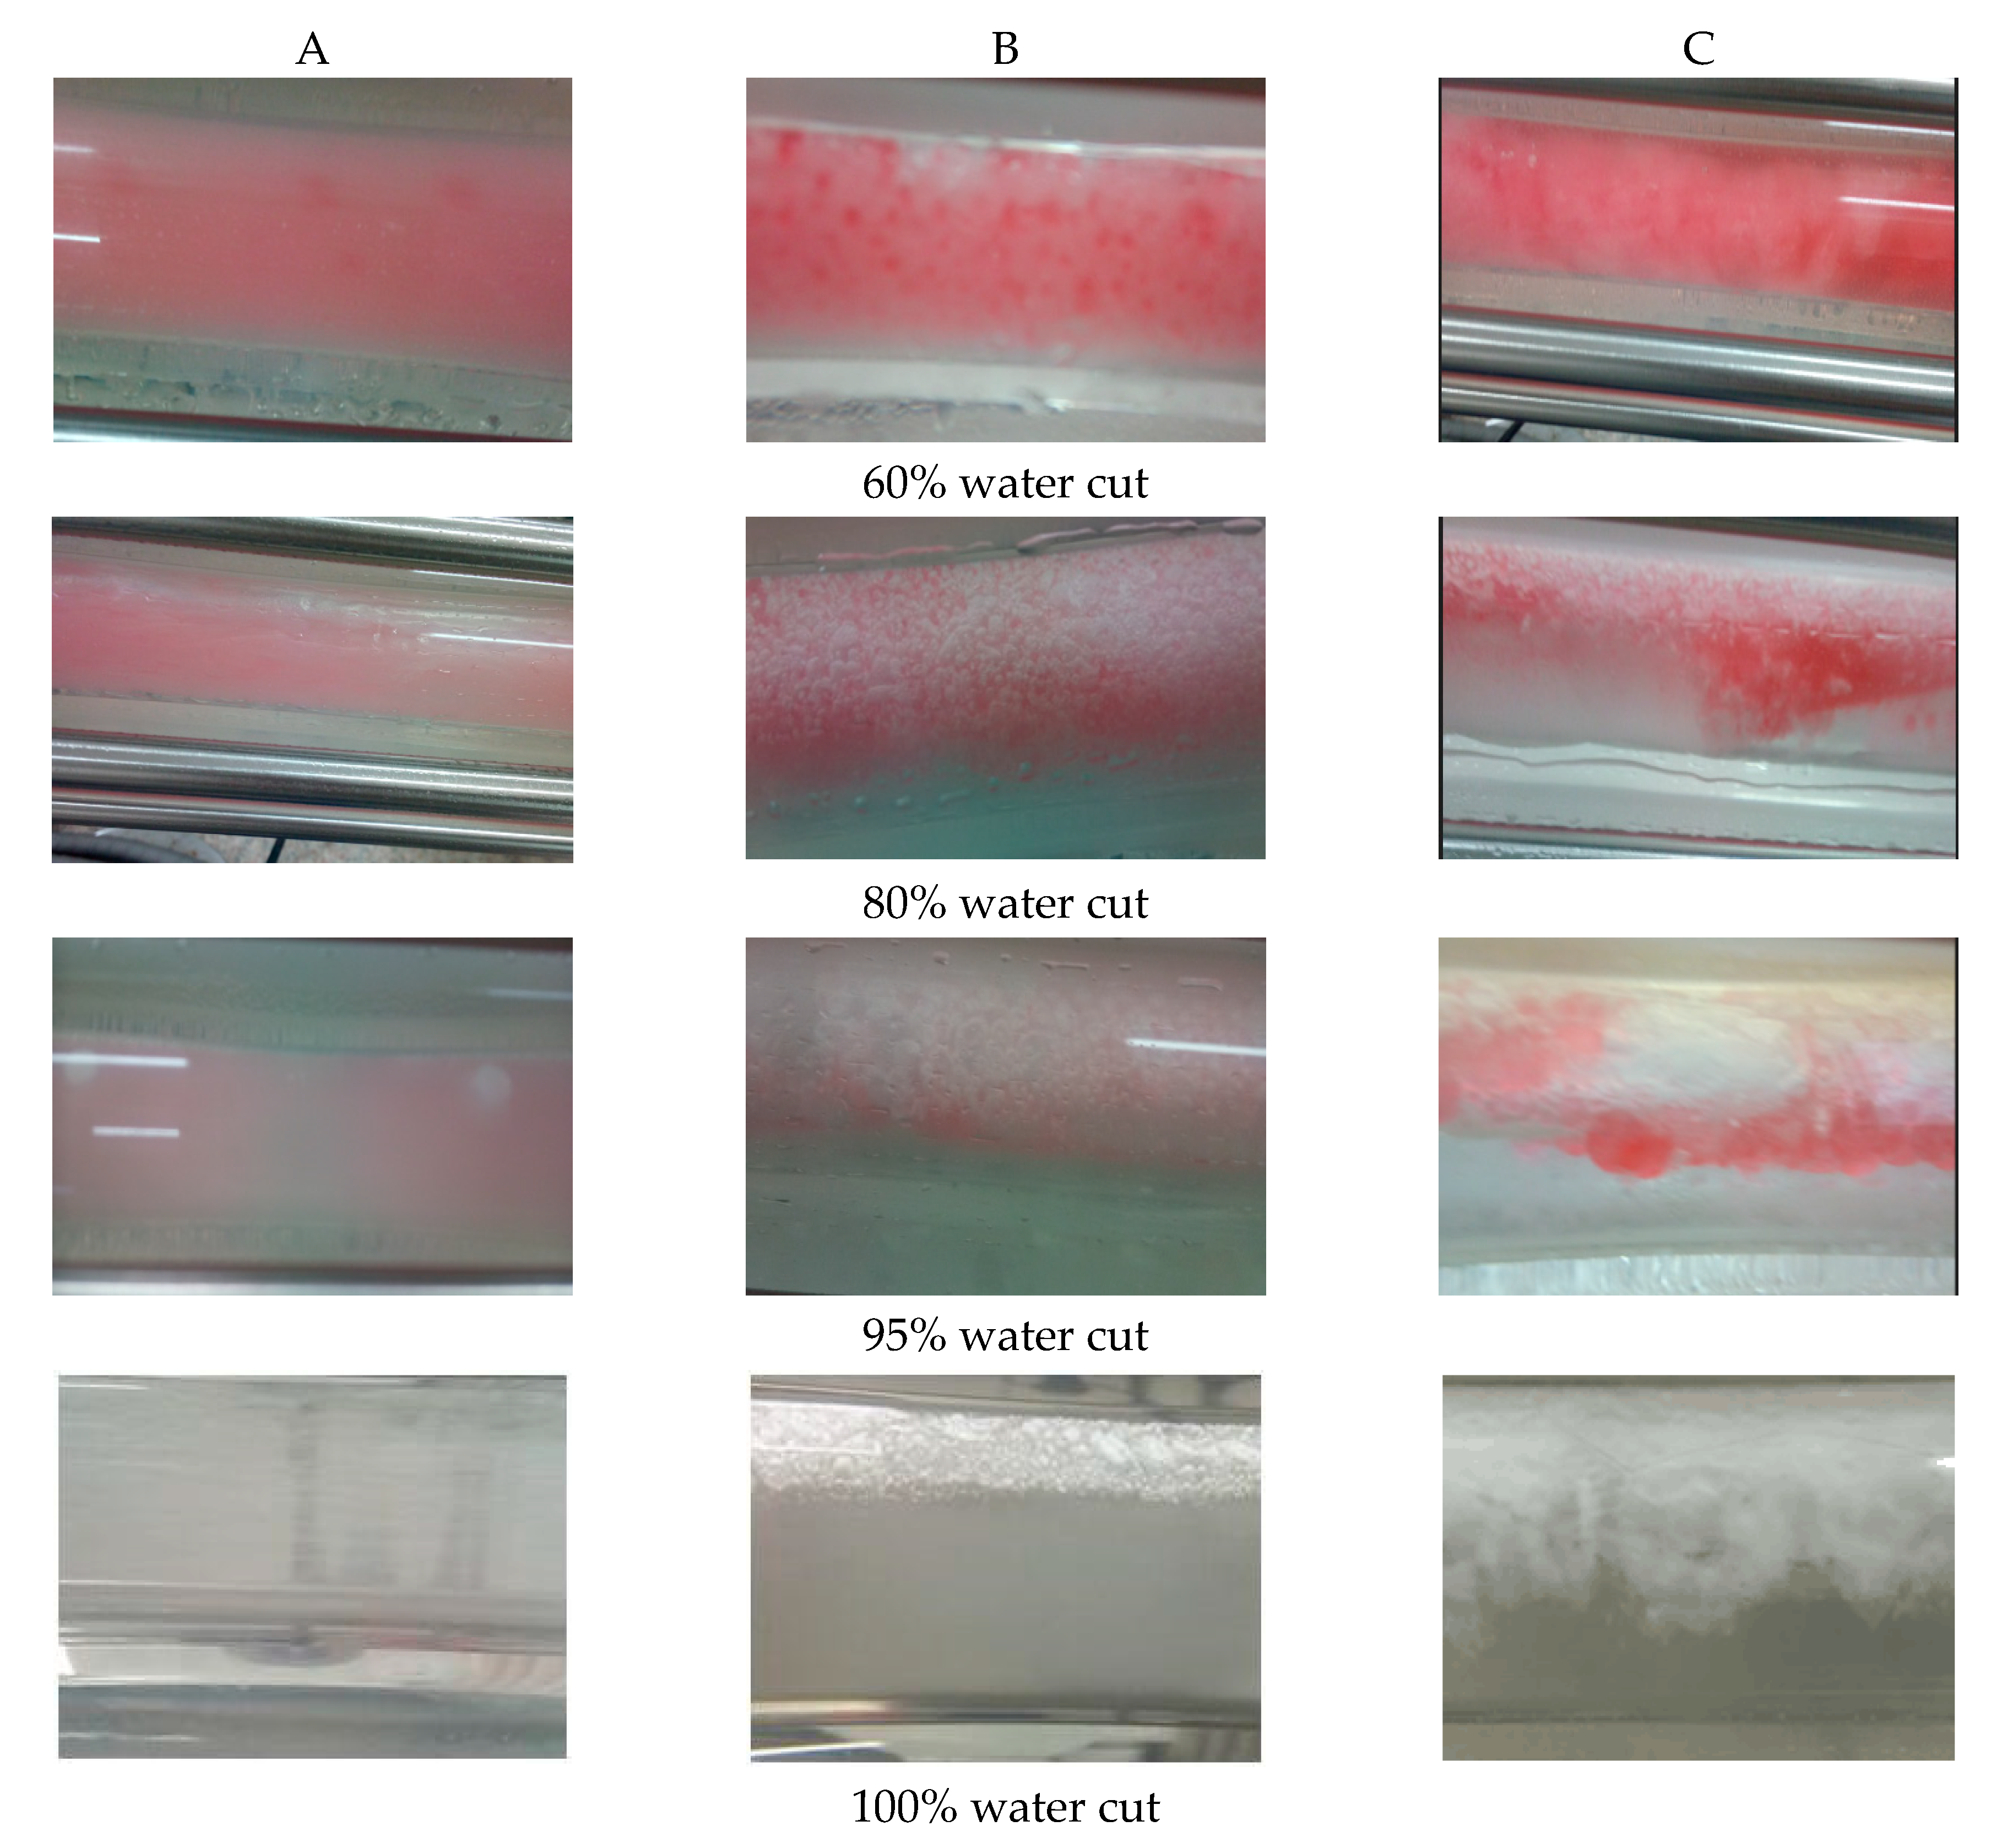
3.1. Experimental Observations
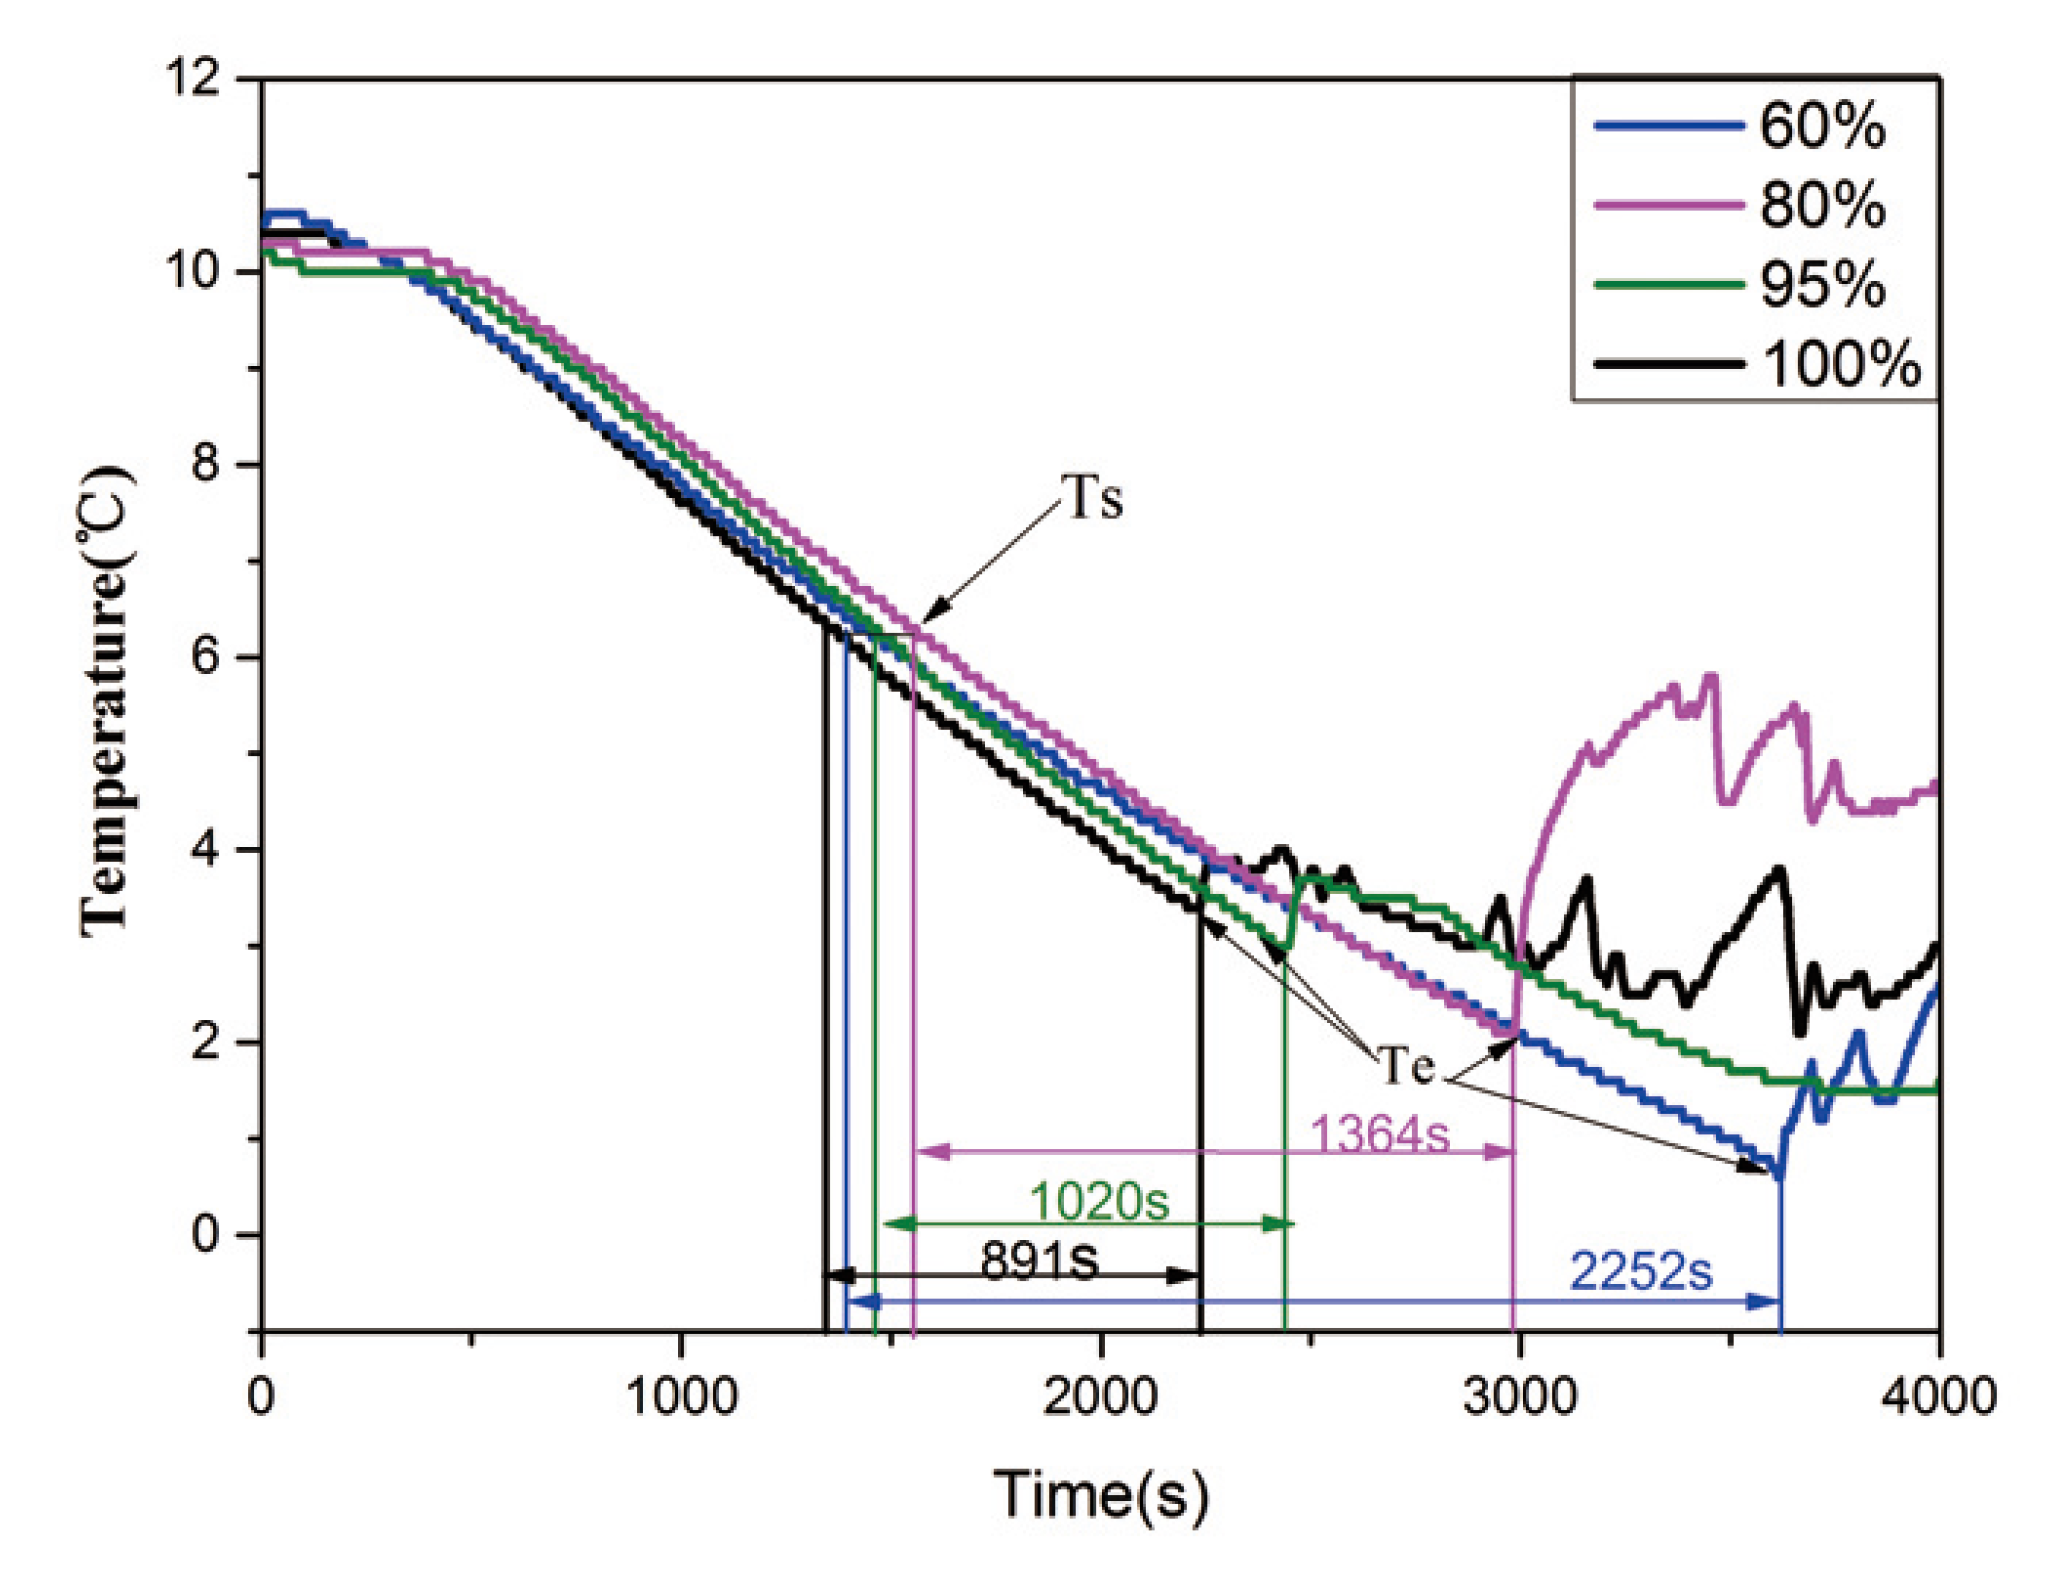
3.2. Effect of Water Cut on Induction Time of Hydrate Formation
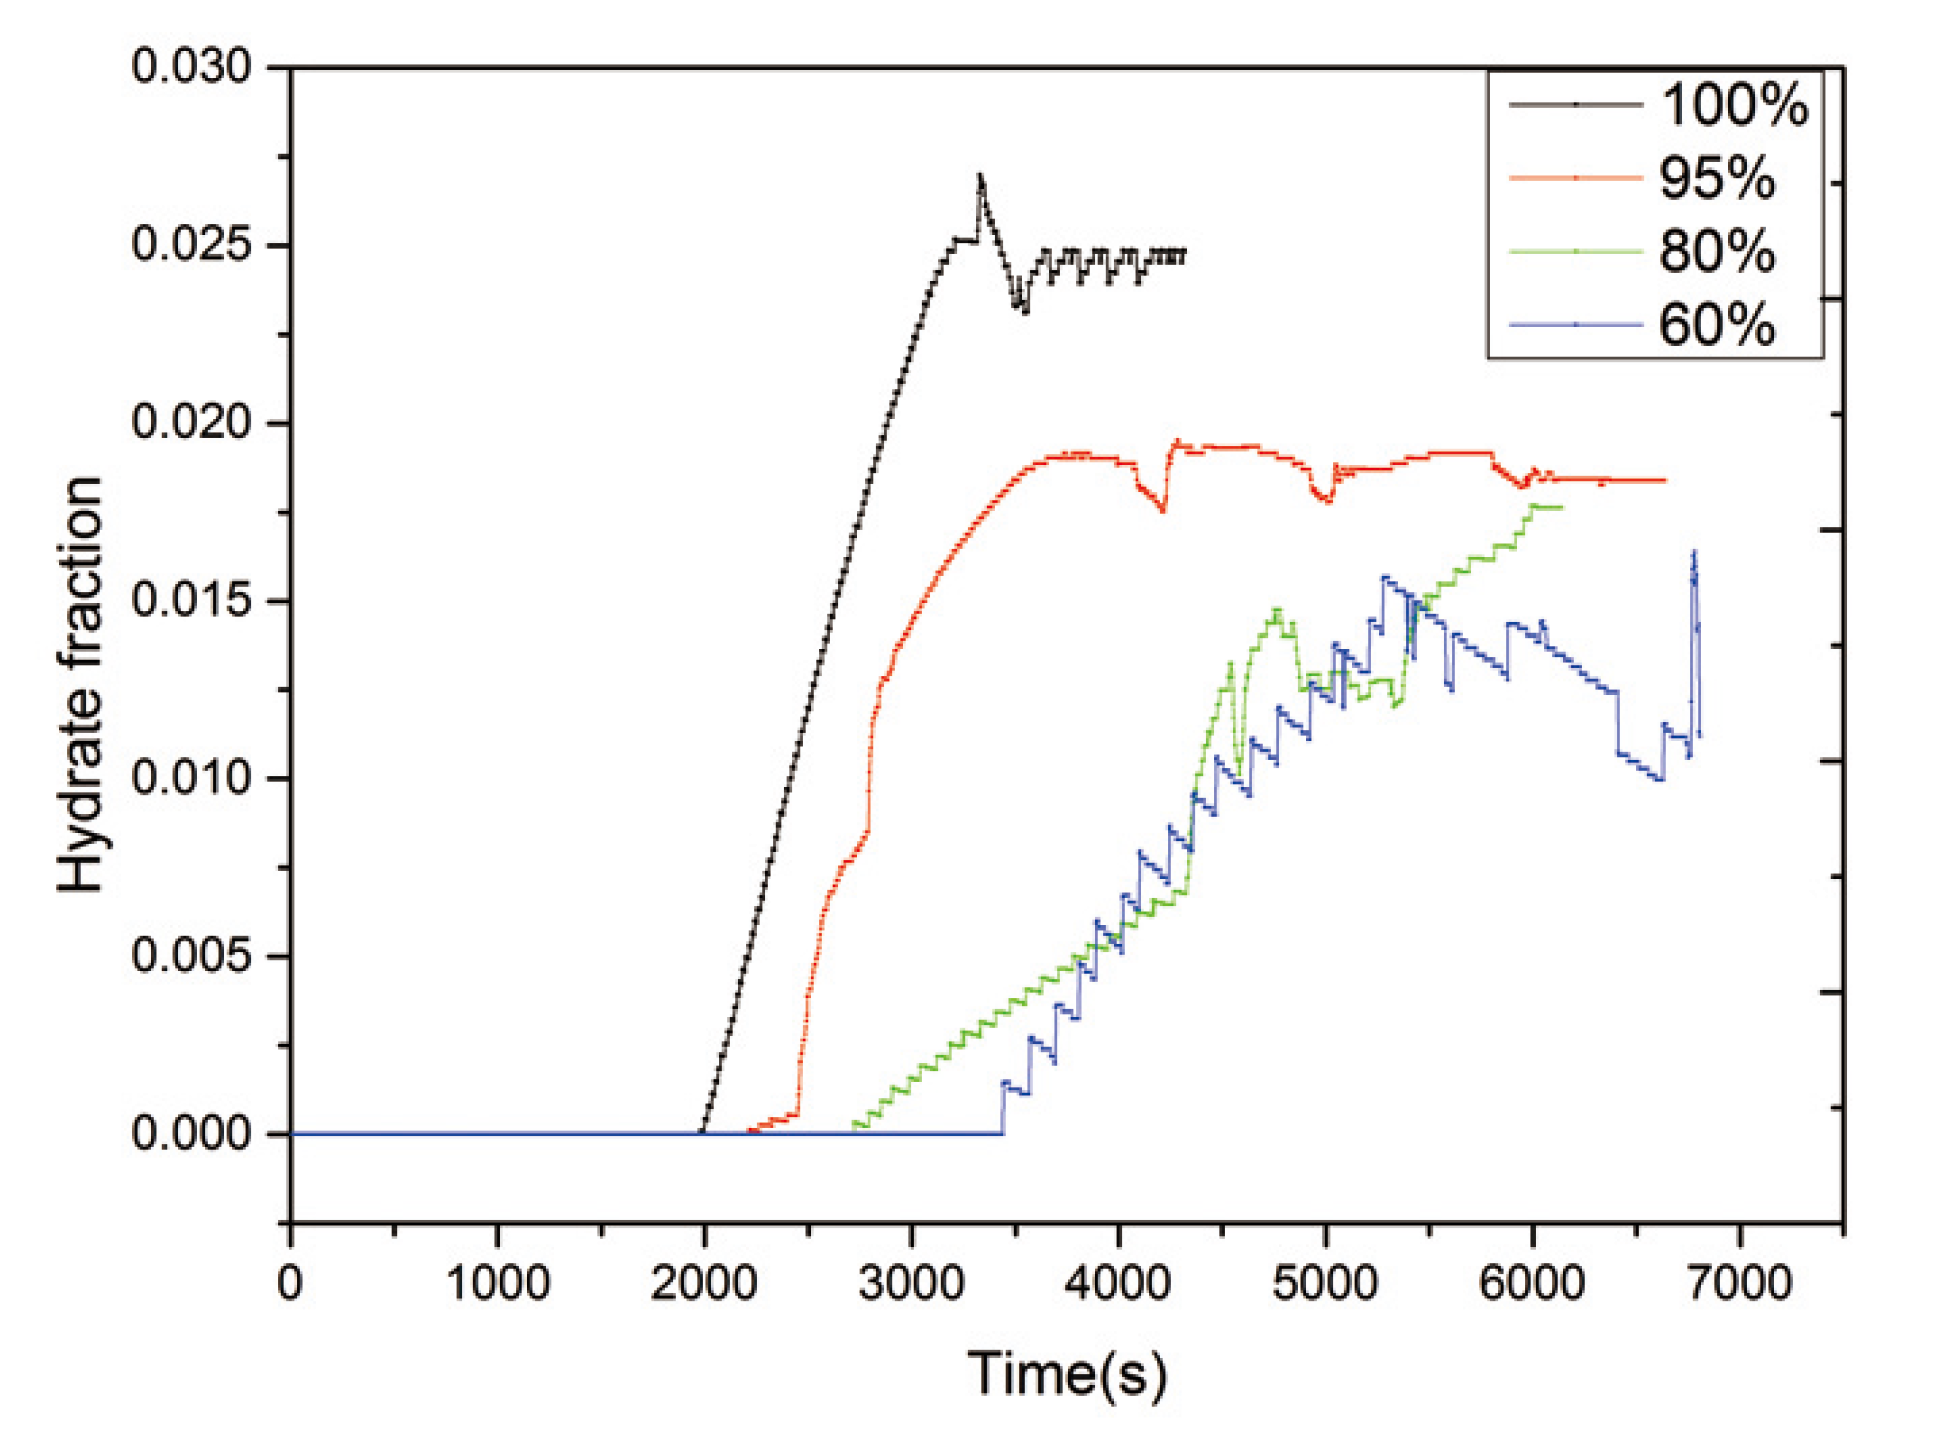
3.3. Effect of Water Cuts on Hydrate Volume Fraction
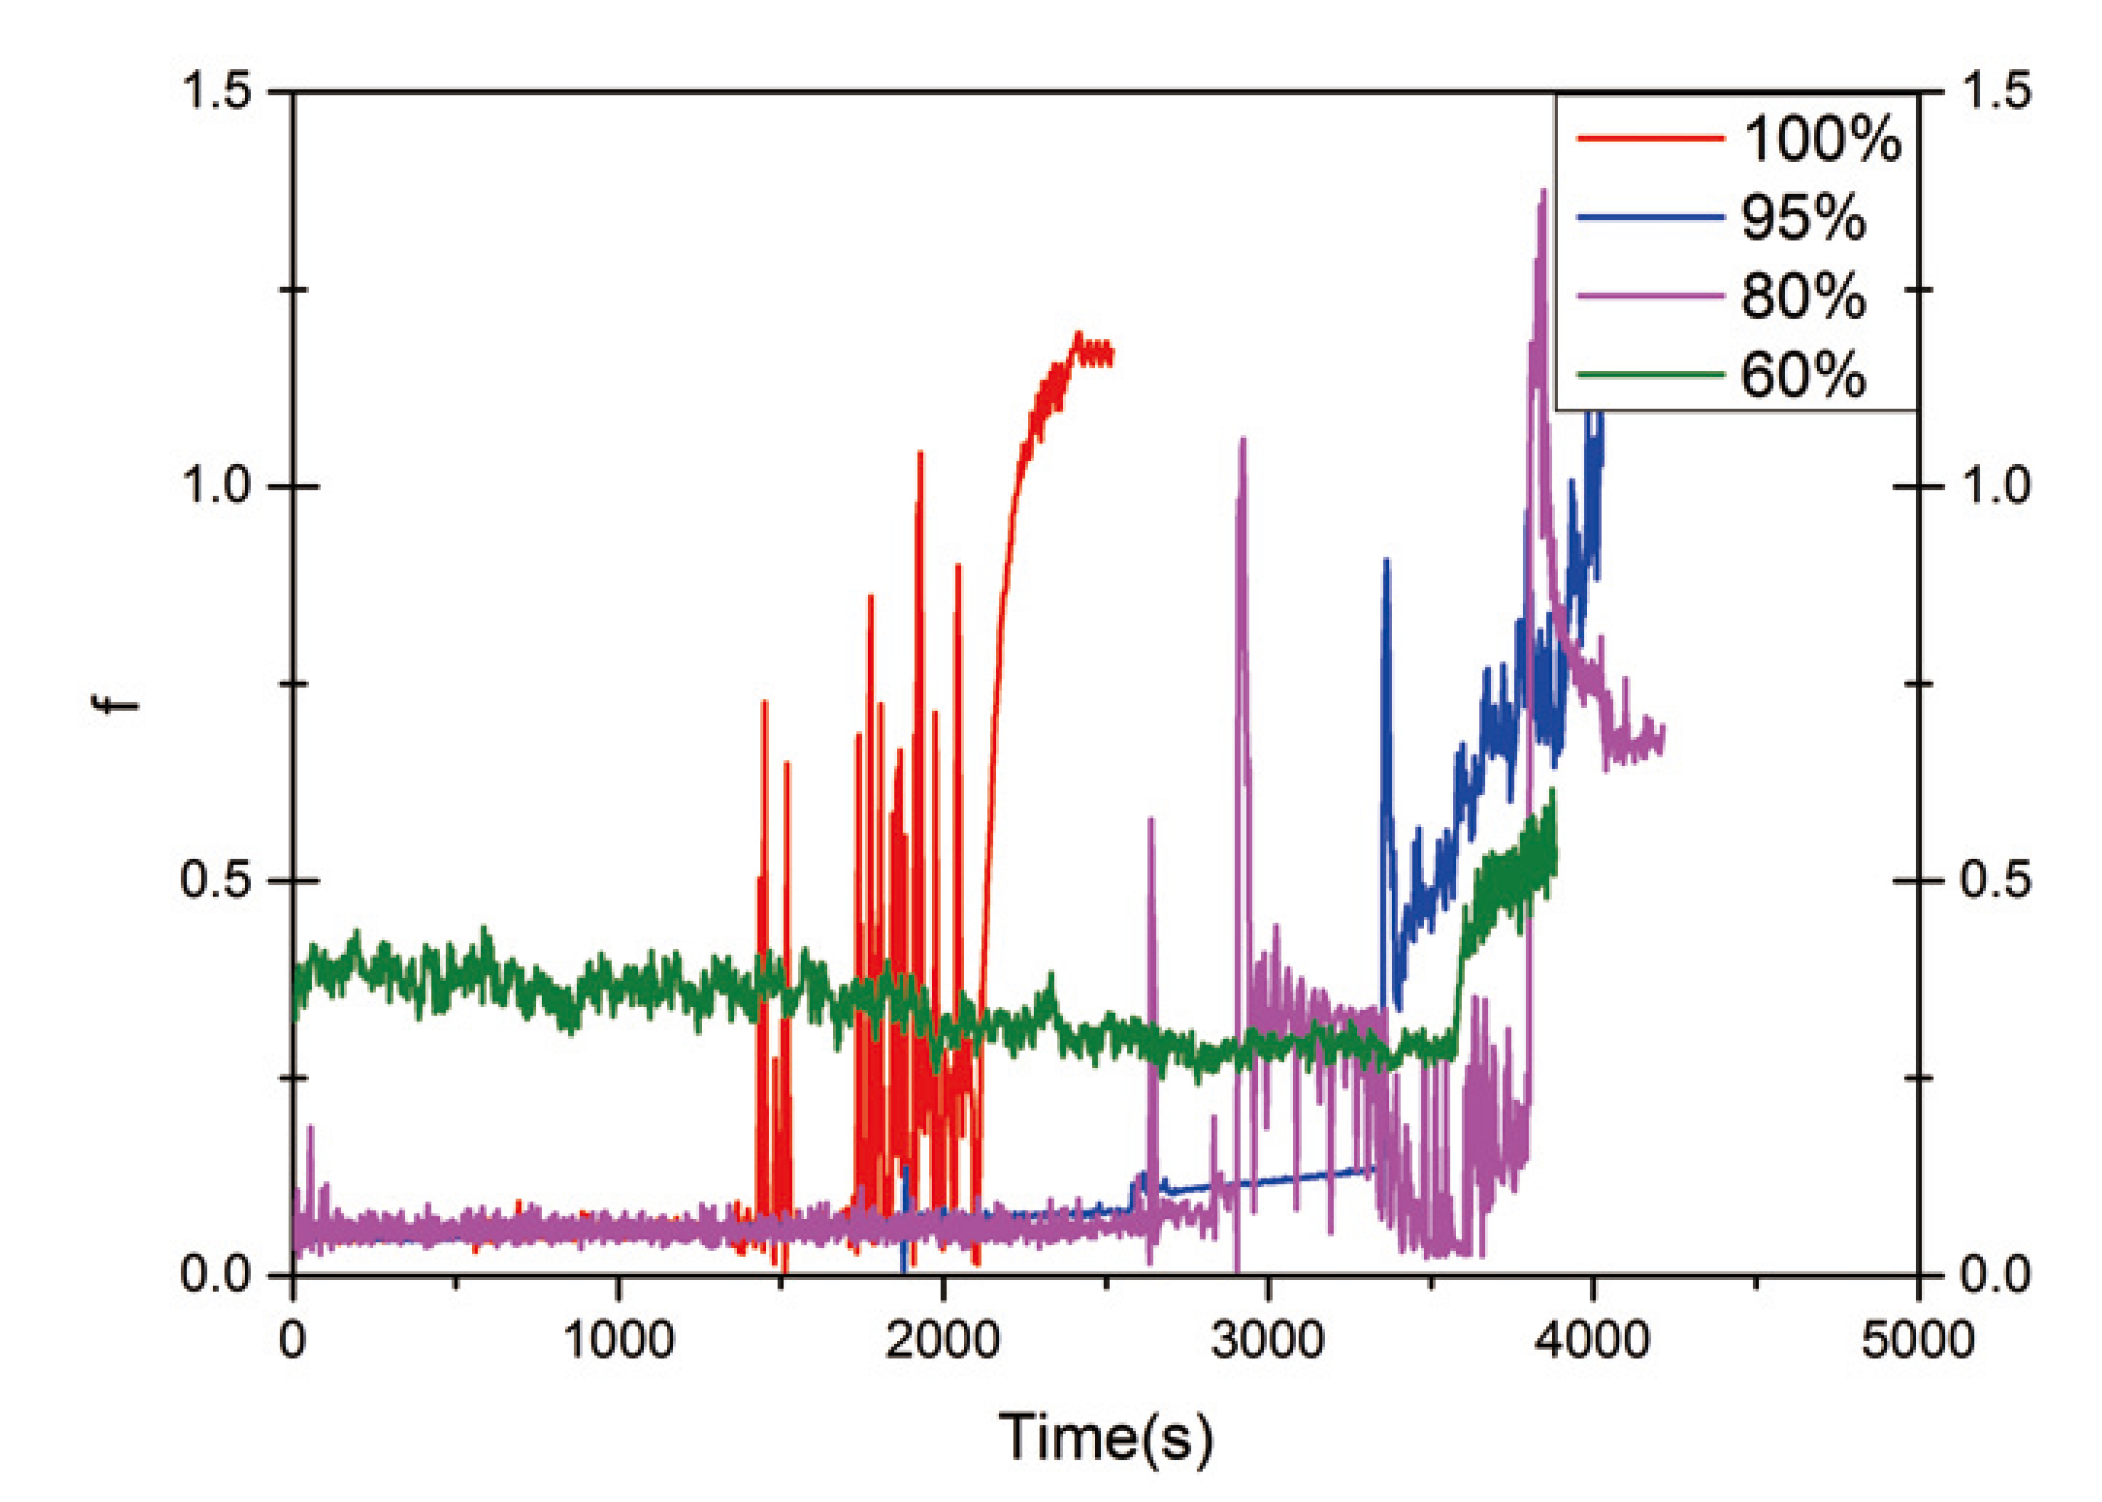
3.4. Effect of Water Cuts on the Friction of the Pipeline
3.5. Effect of Water Cuts on the Safe Flow Time of Hydrate Slurry Flow
3.6. Plugging Mechanism of Hydrate in Medium-High Water Cut
4. Conclusions
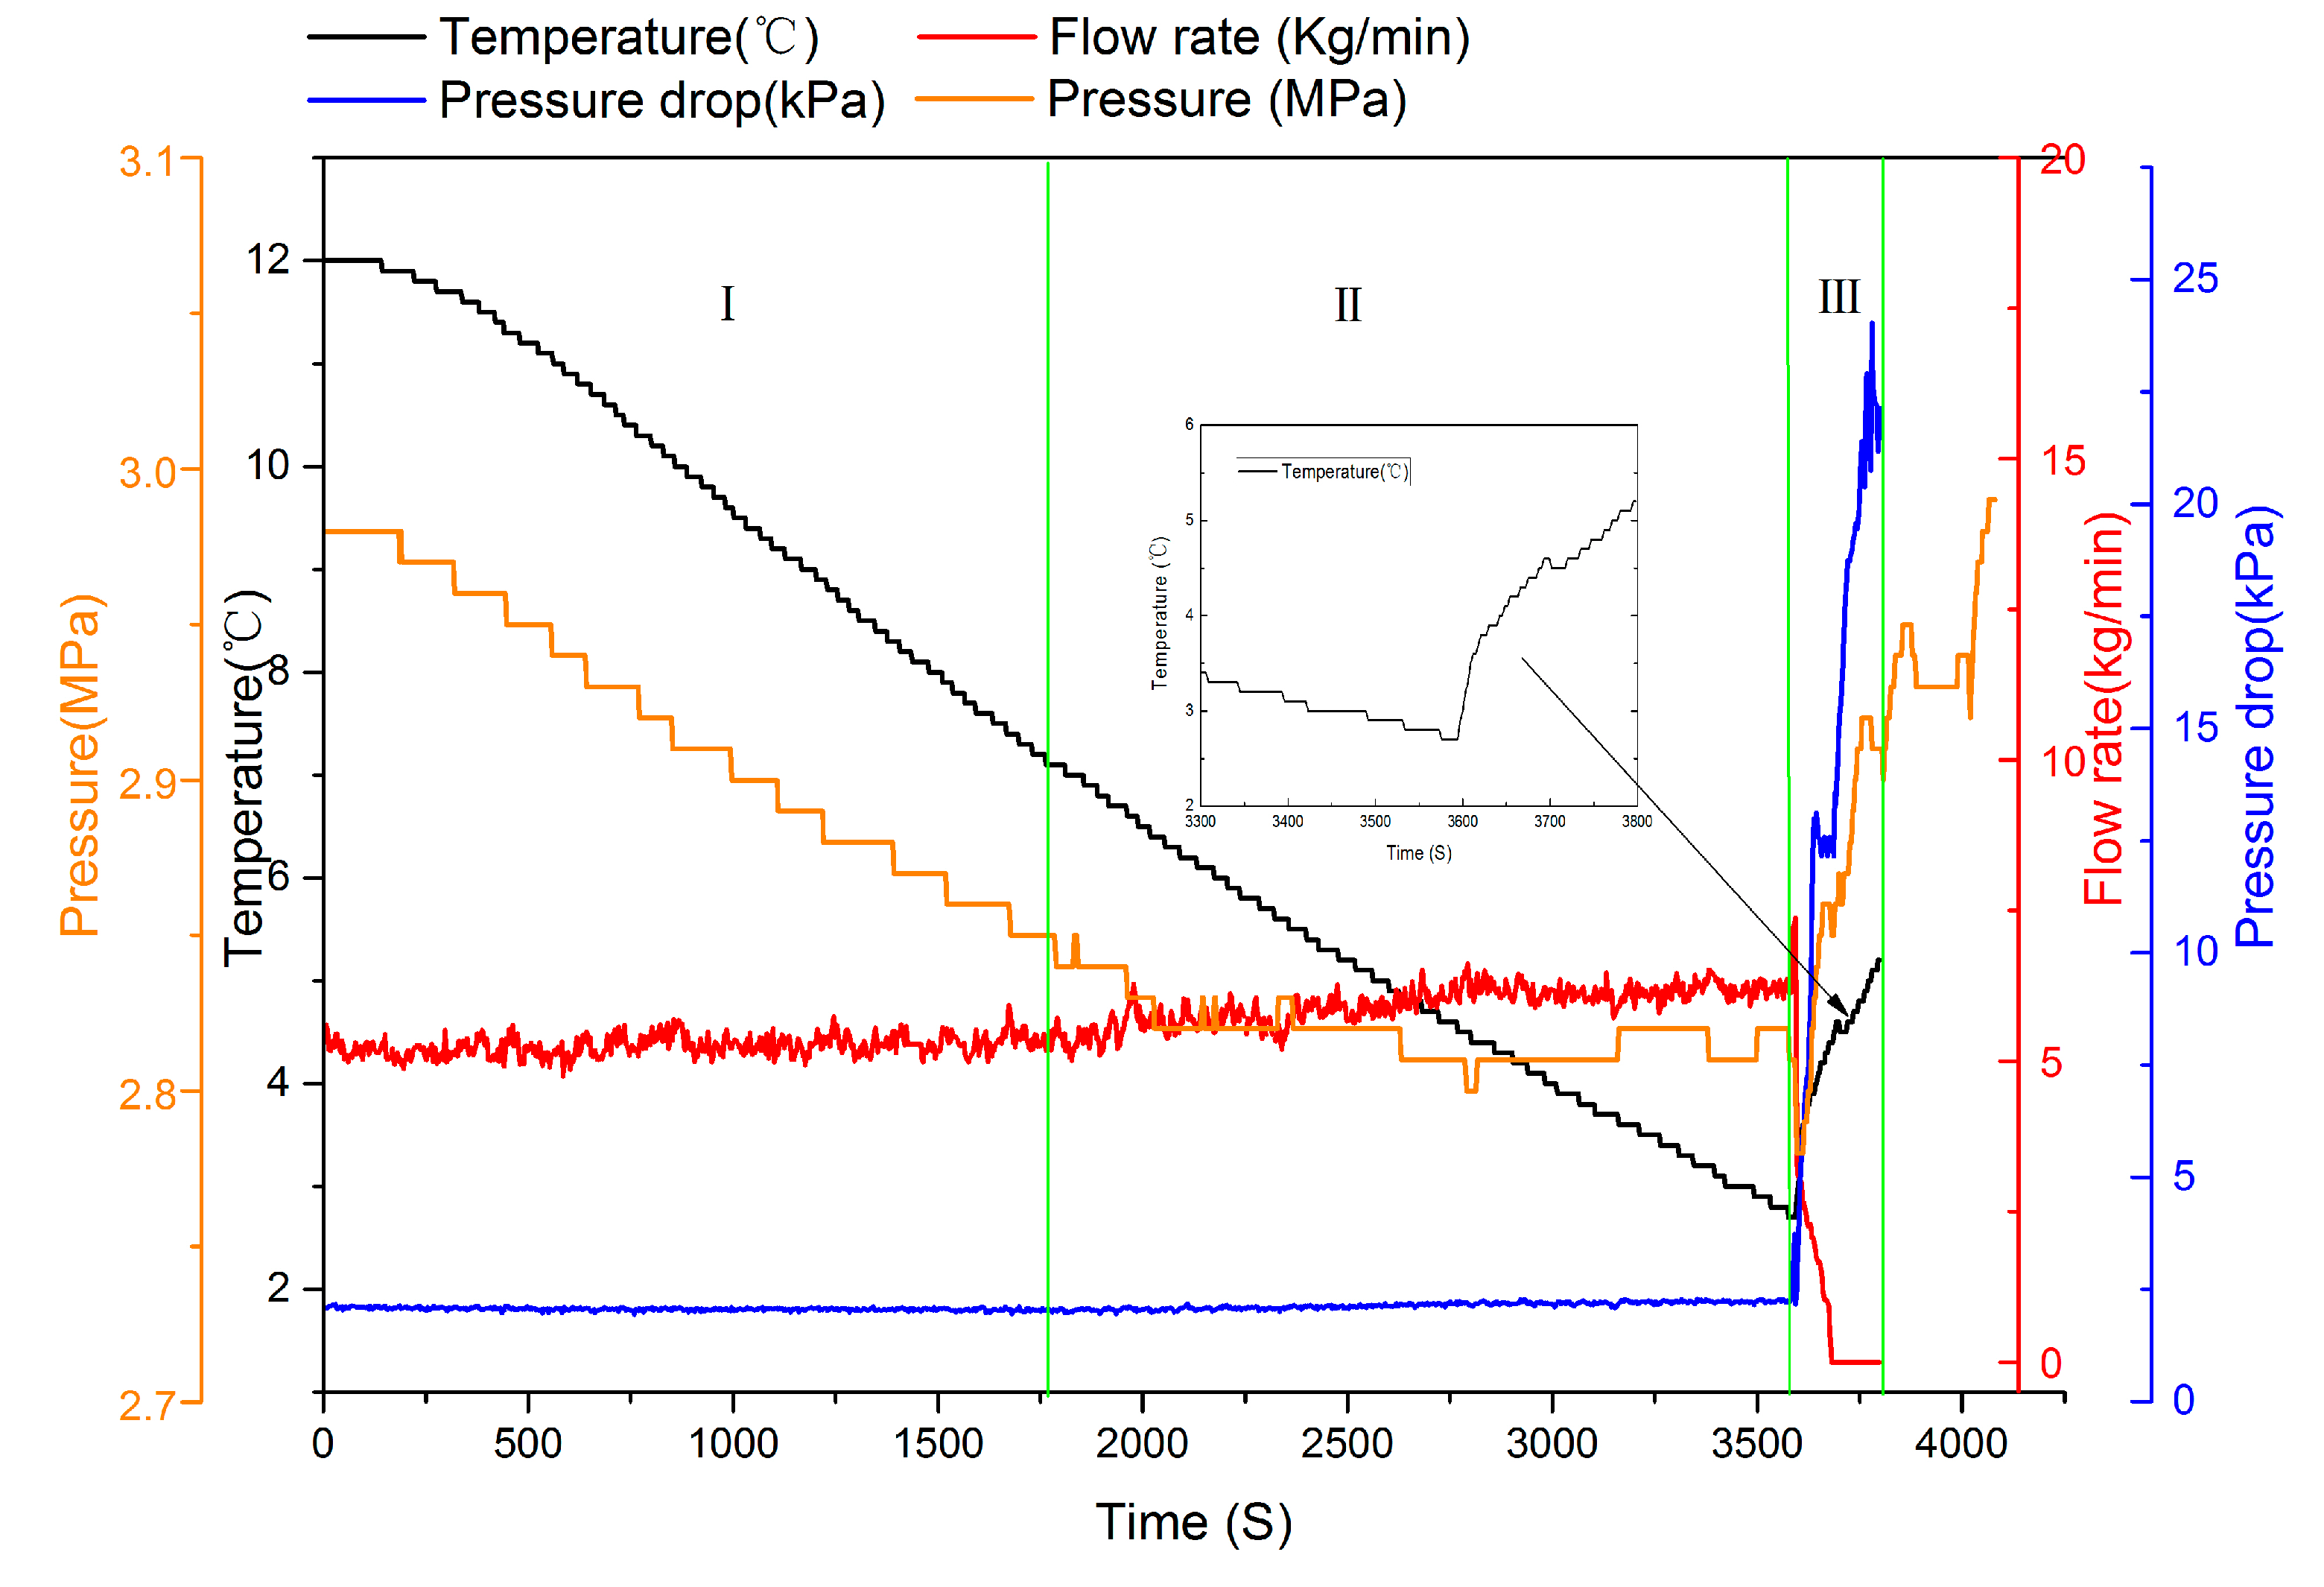
- (1)
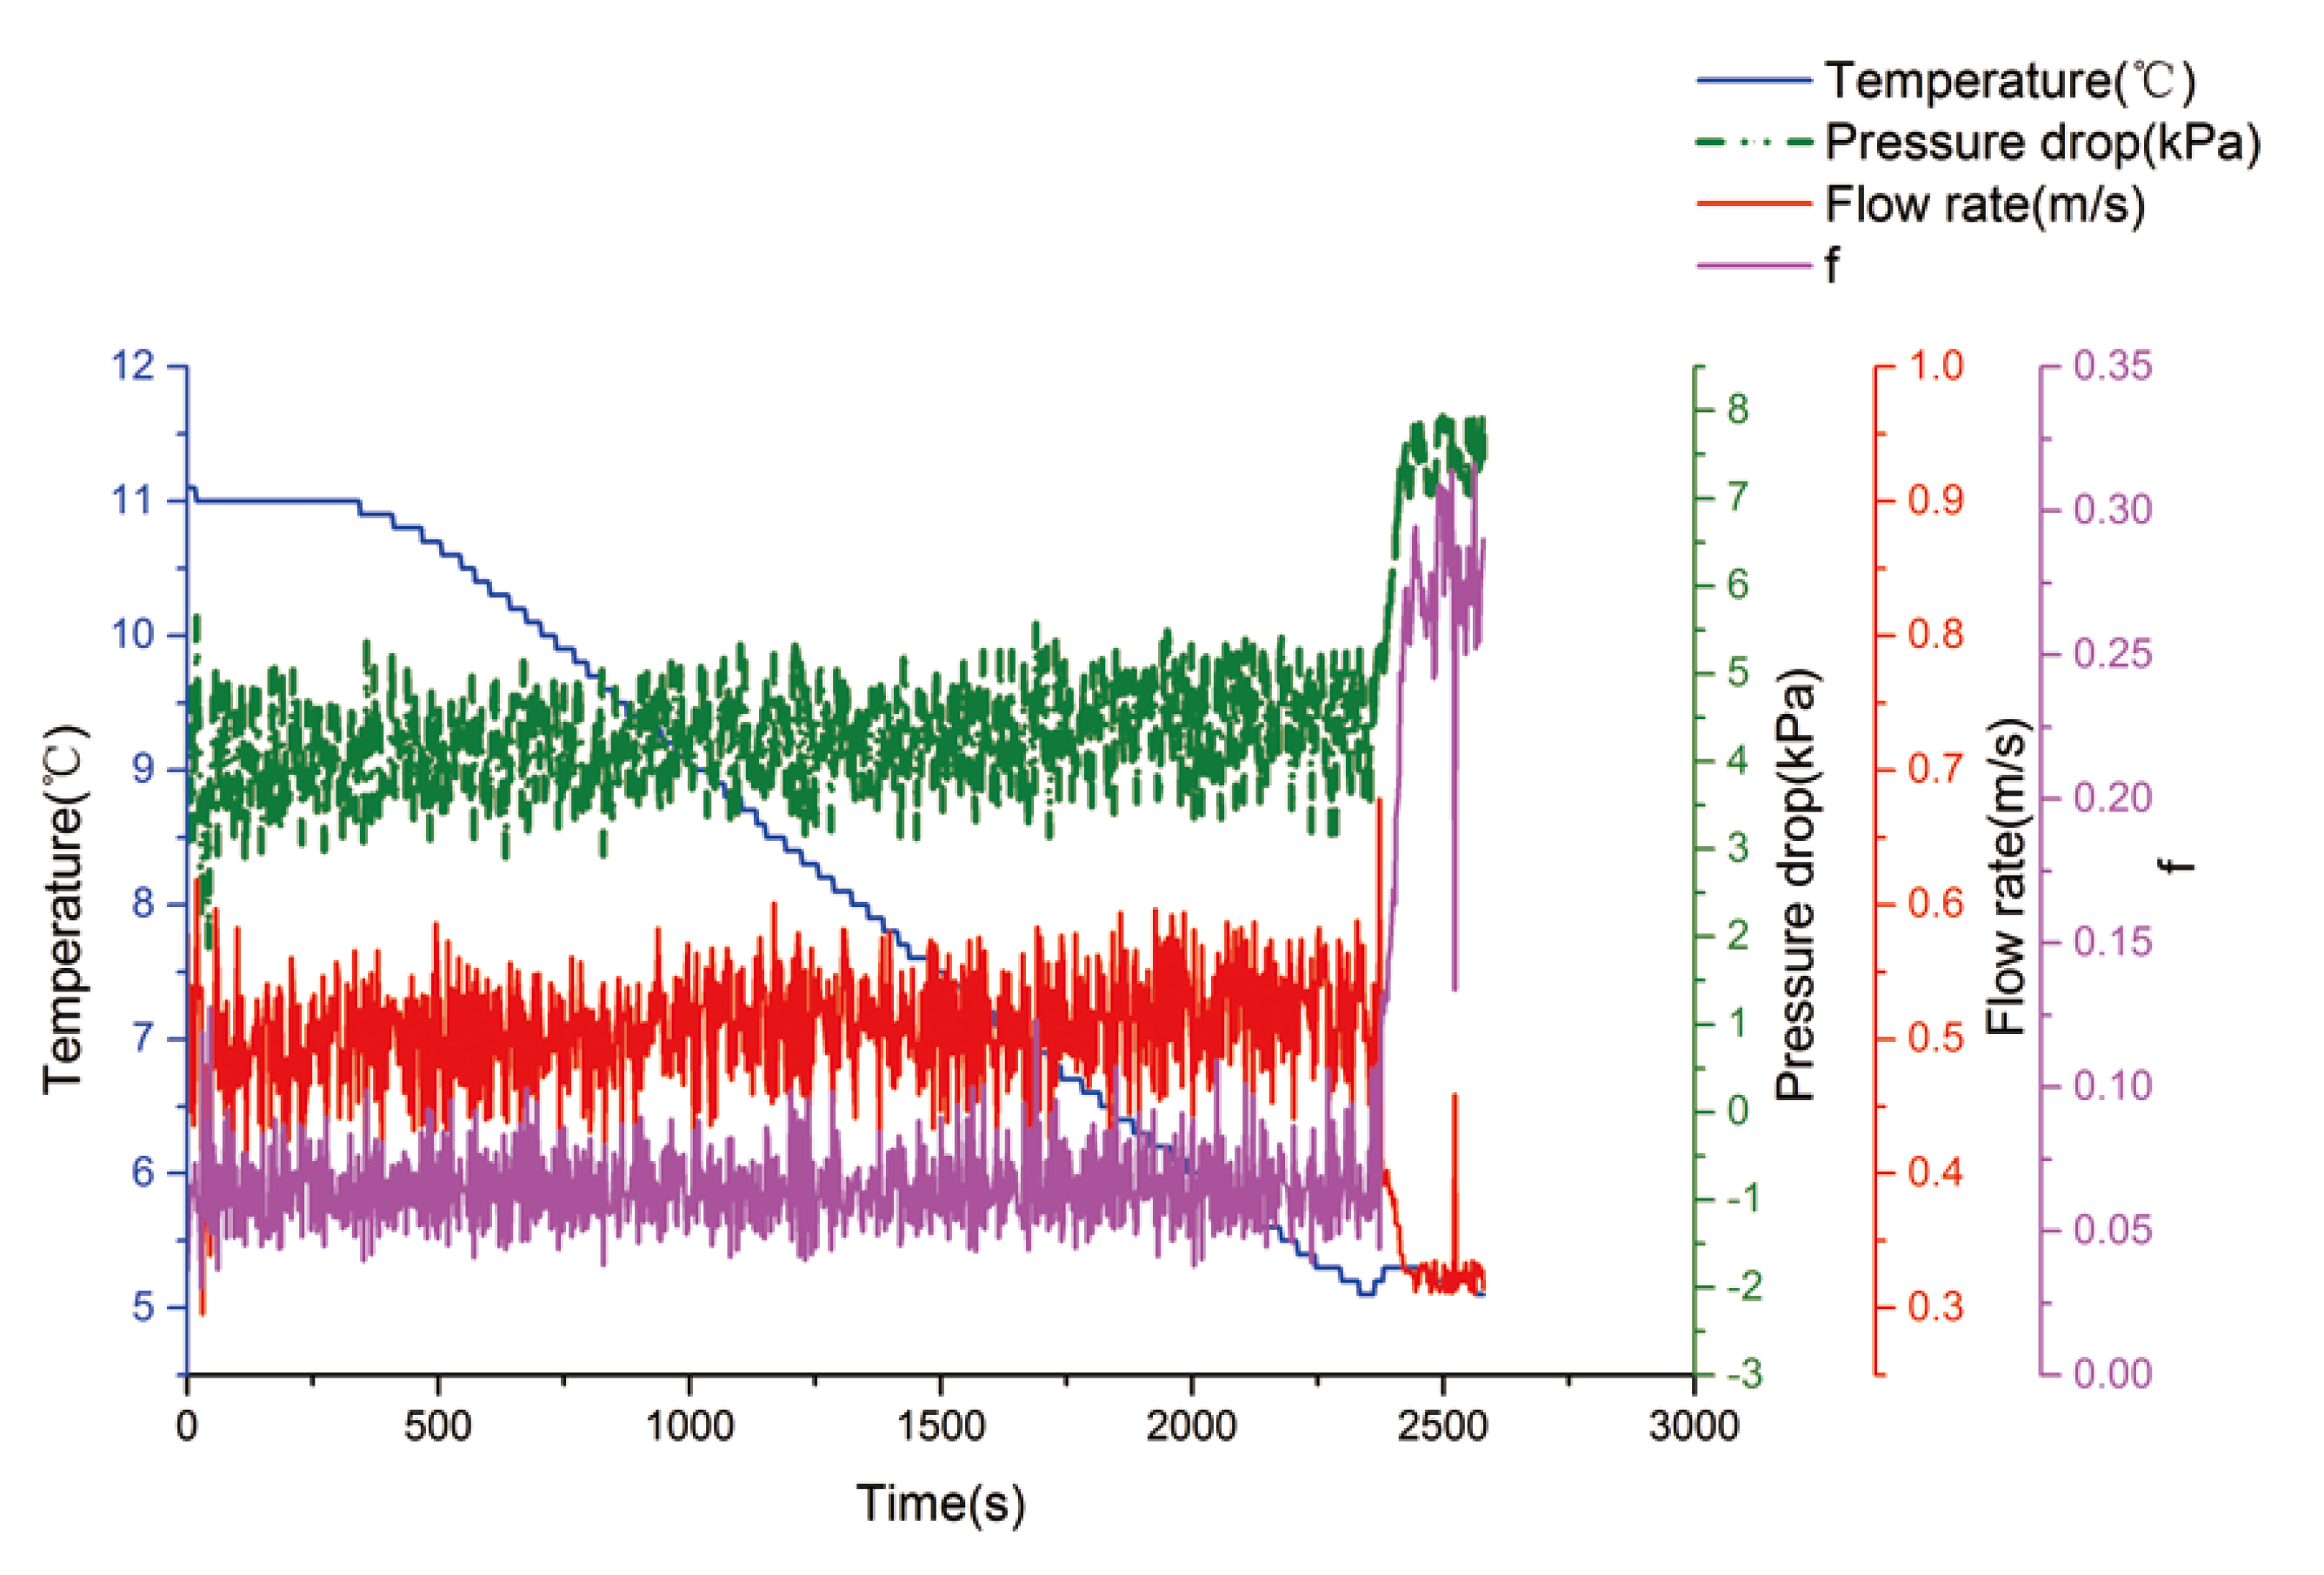
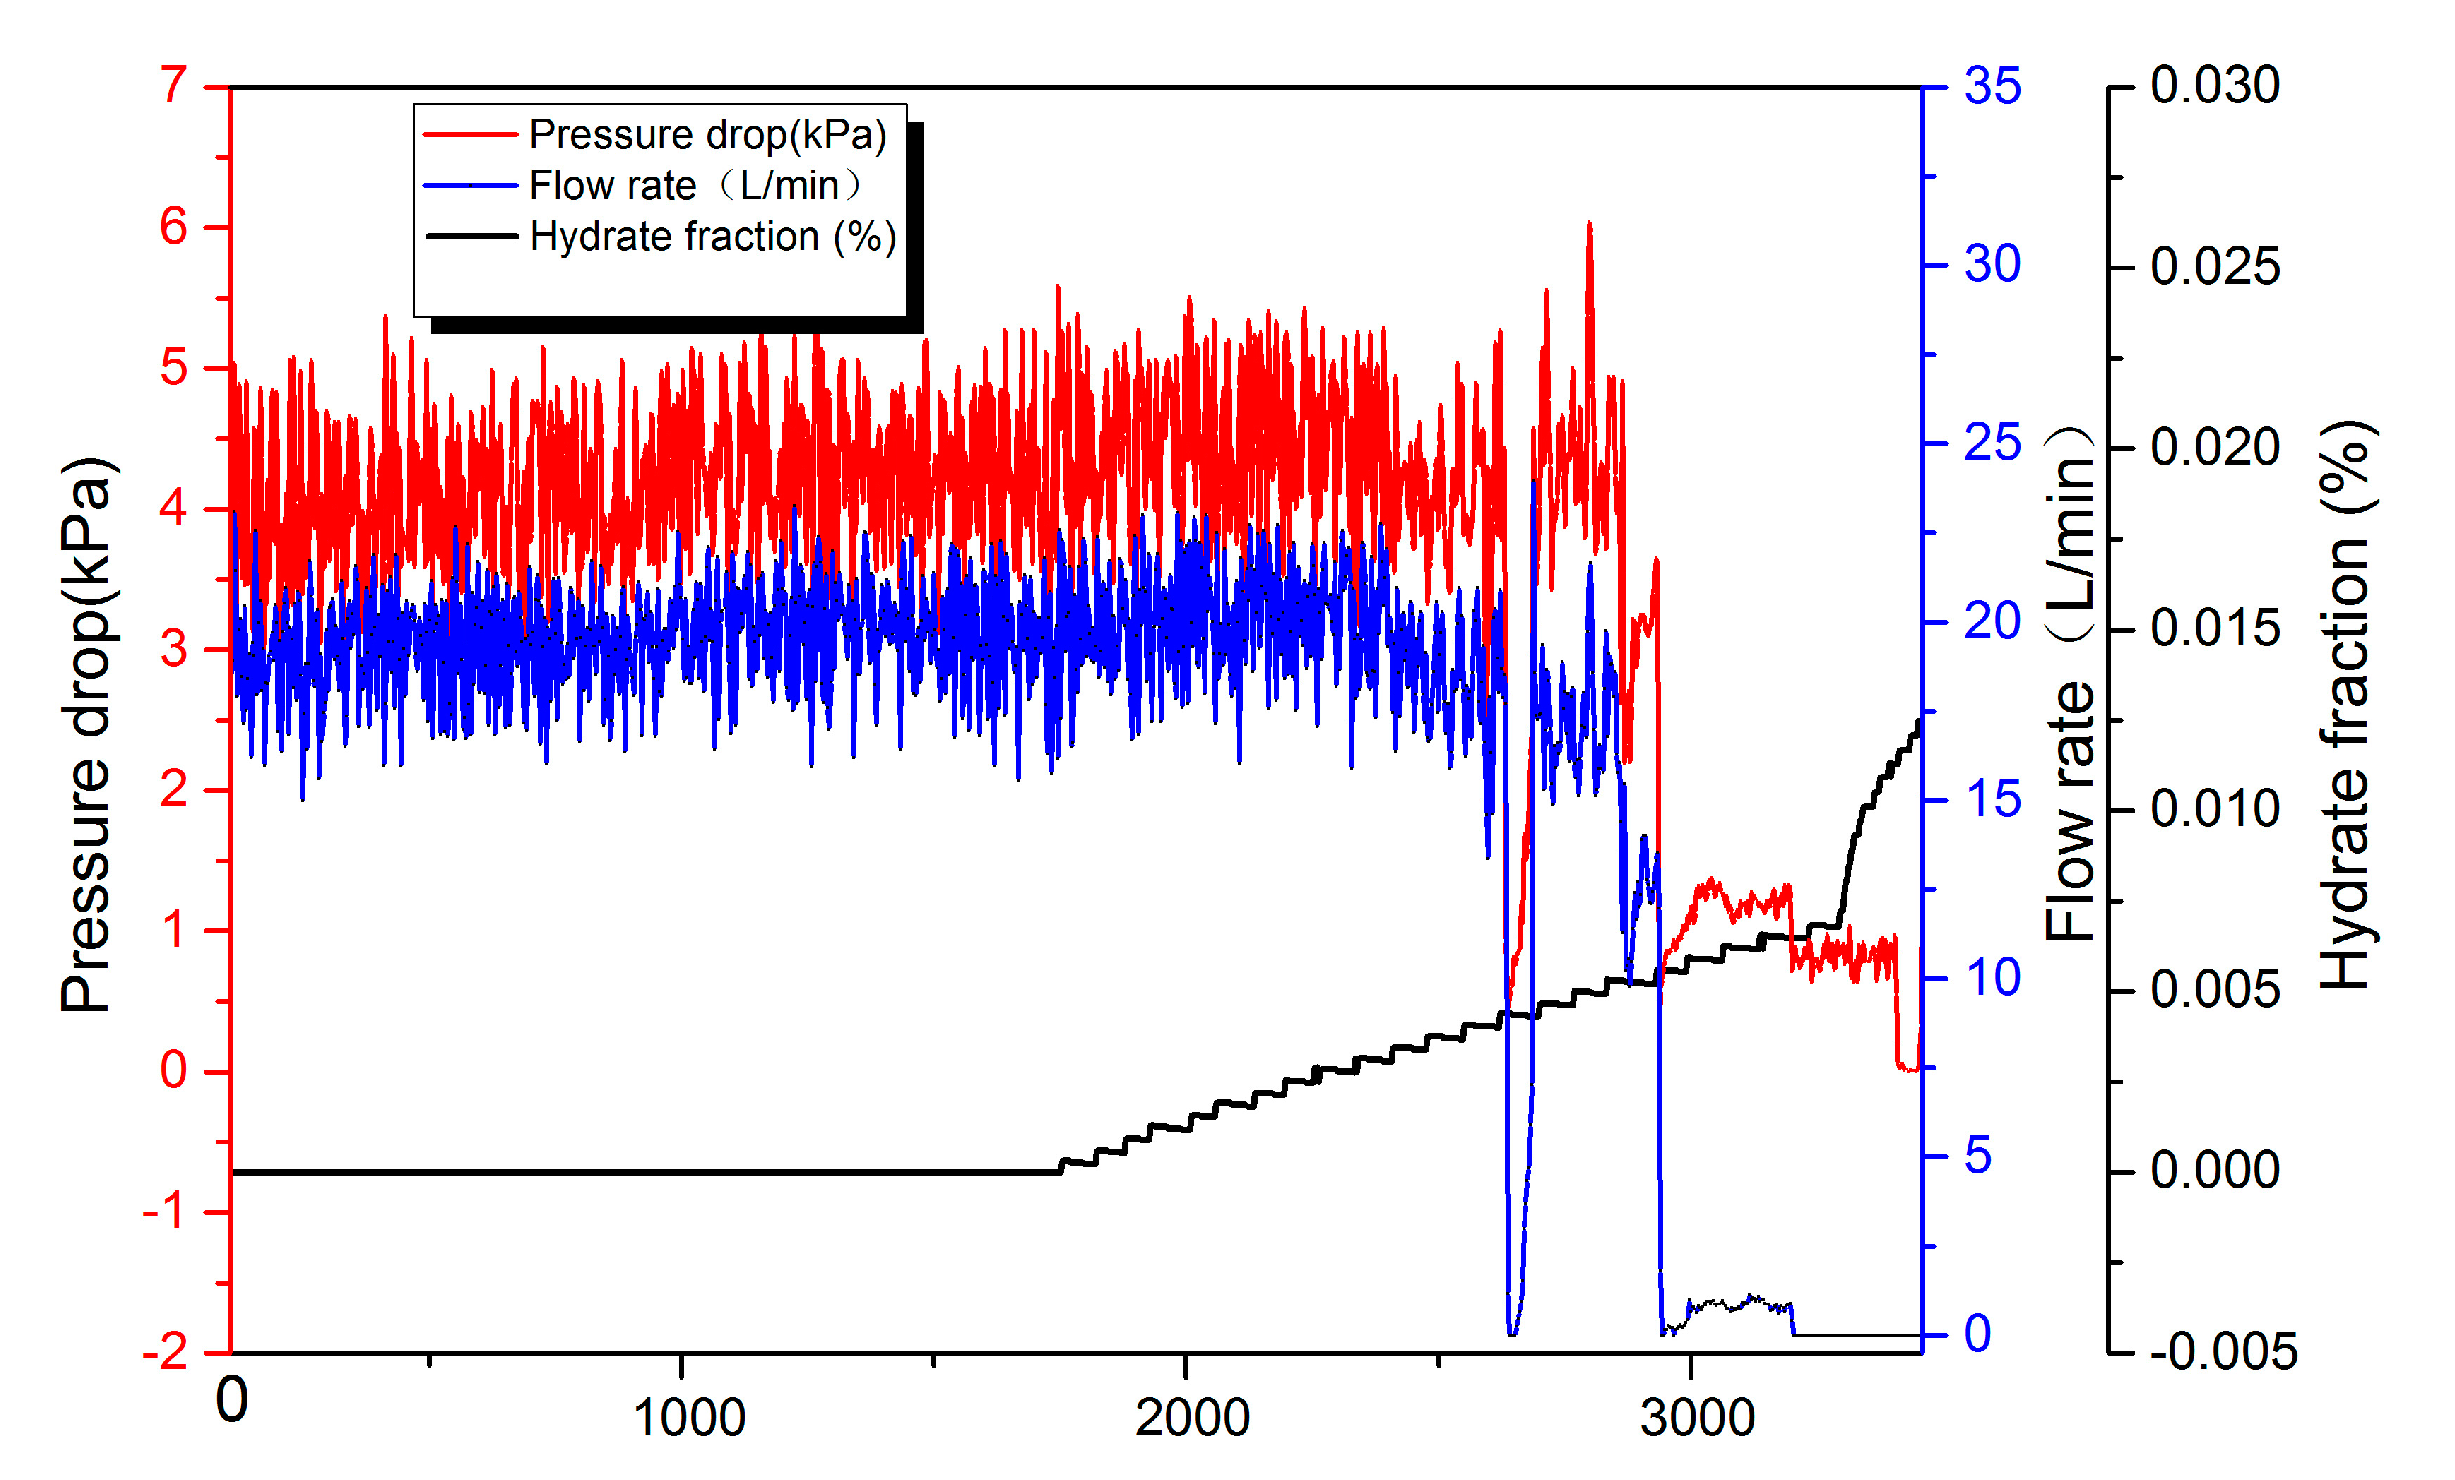
- When a large amount of hydrates start to form, the temperature of the system rises, the pressure suddenly drops, the pressure drop increases, the flow rate decreases, and the fluidity starts to reduce. When a plug occurs, a portion of the oil phase is held by the hydrate aggregate at the upper tube wall.
- (2)
- As the water cut decreases, the hydrate formation induction time increases, and the final volume fraction of hydrate formation decreases.
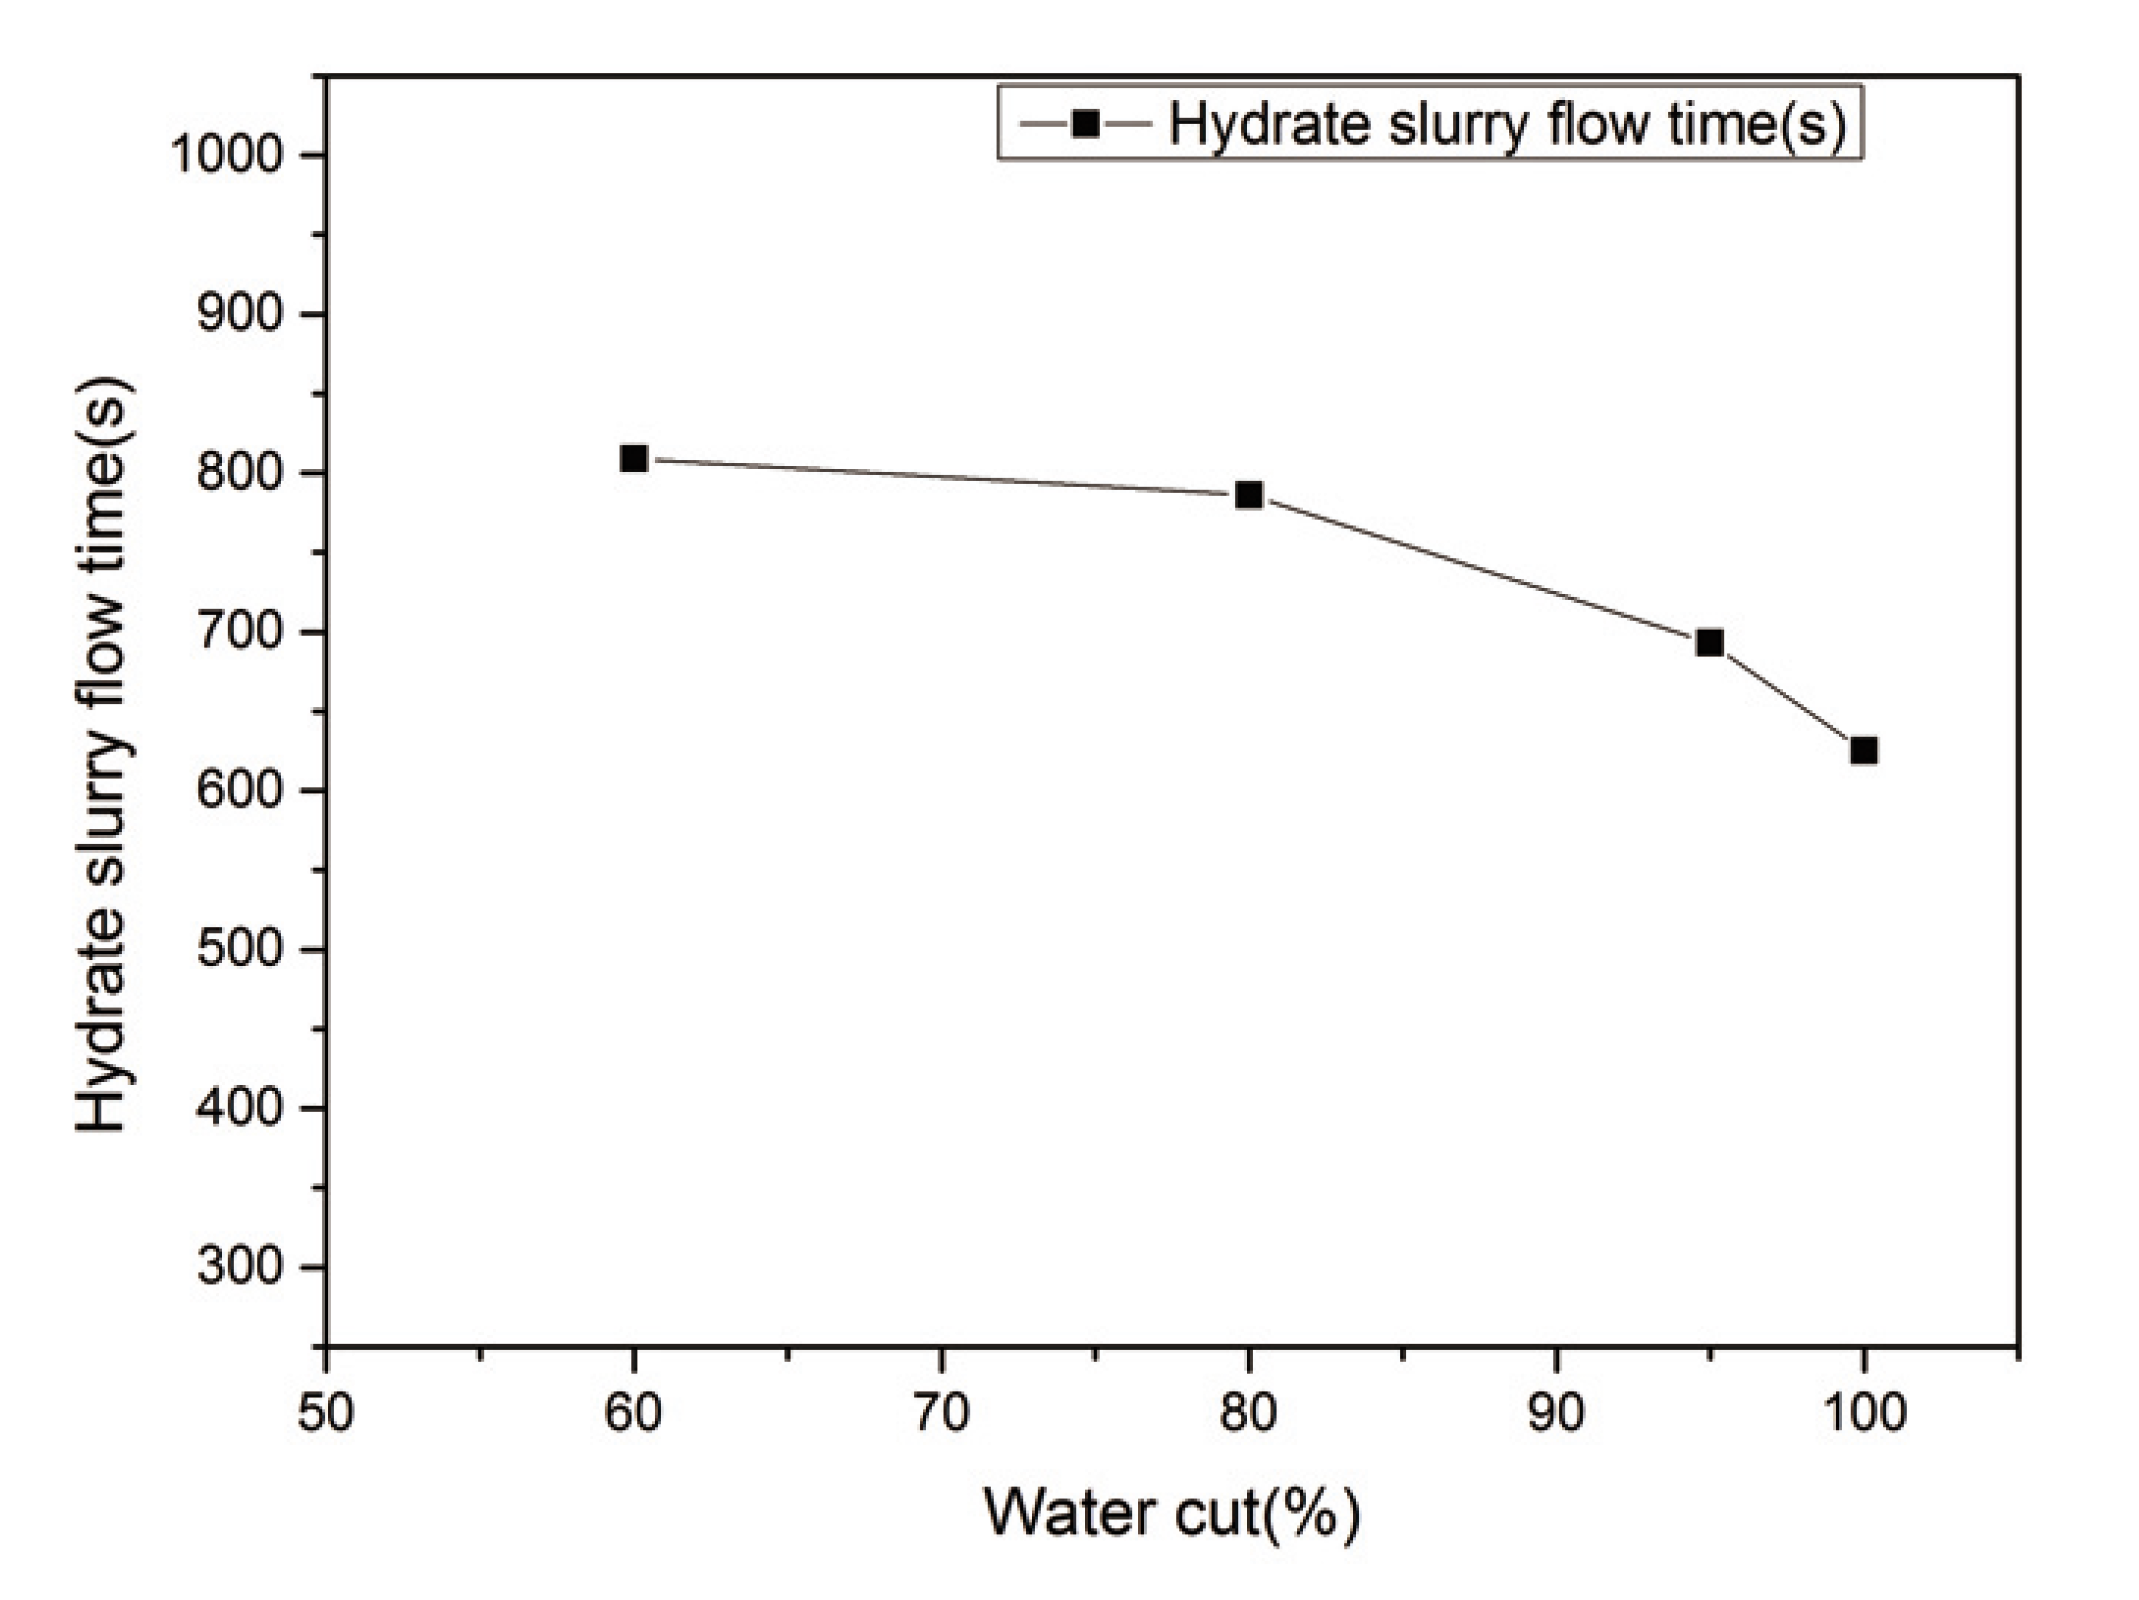
- (3)
- As the water cut increases, the friction coefficient increases, and the flow time decreases in the flow of the slurry.
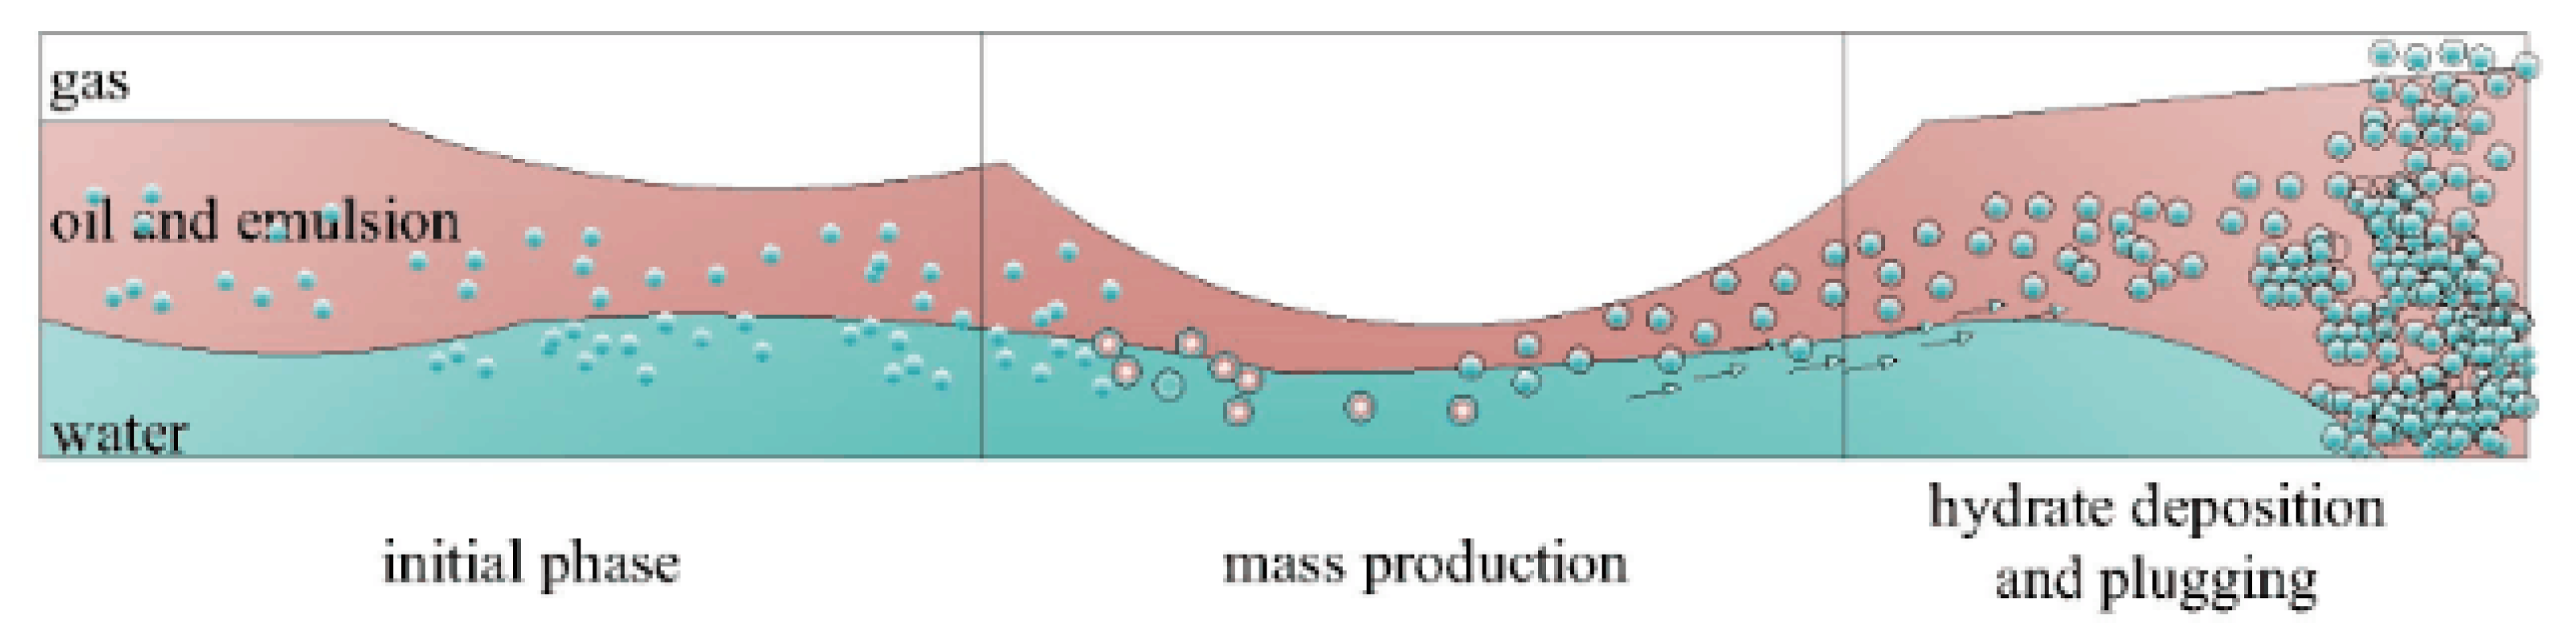
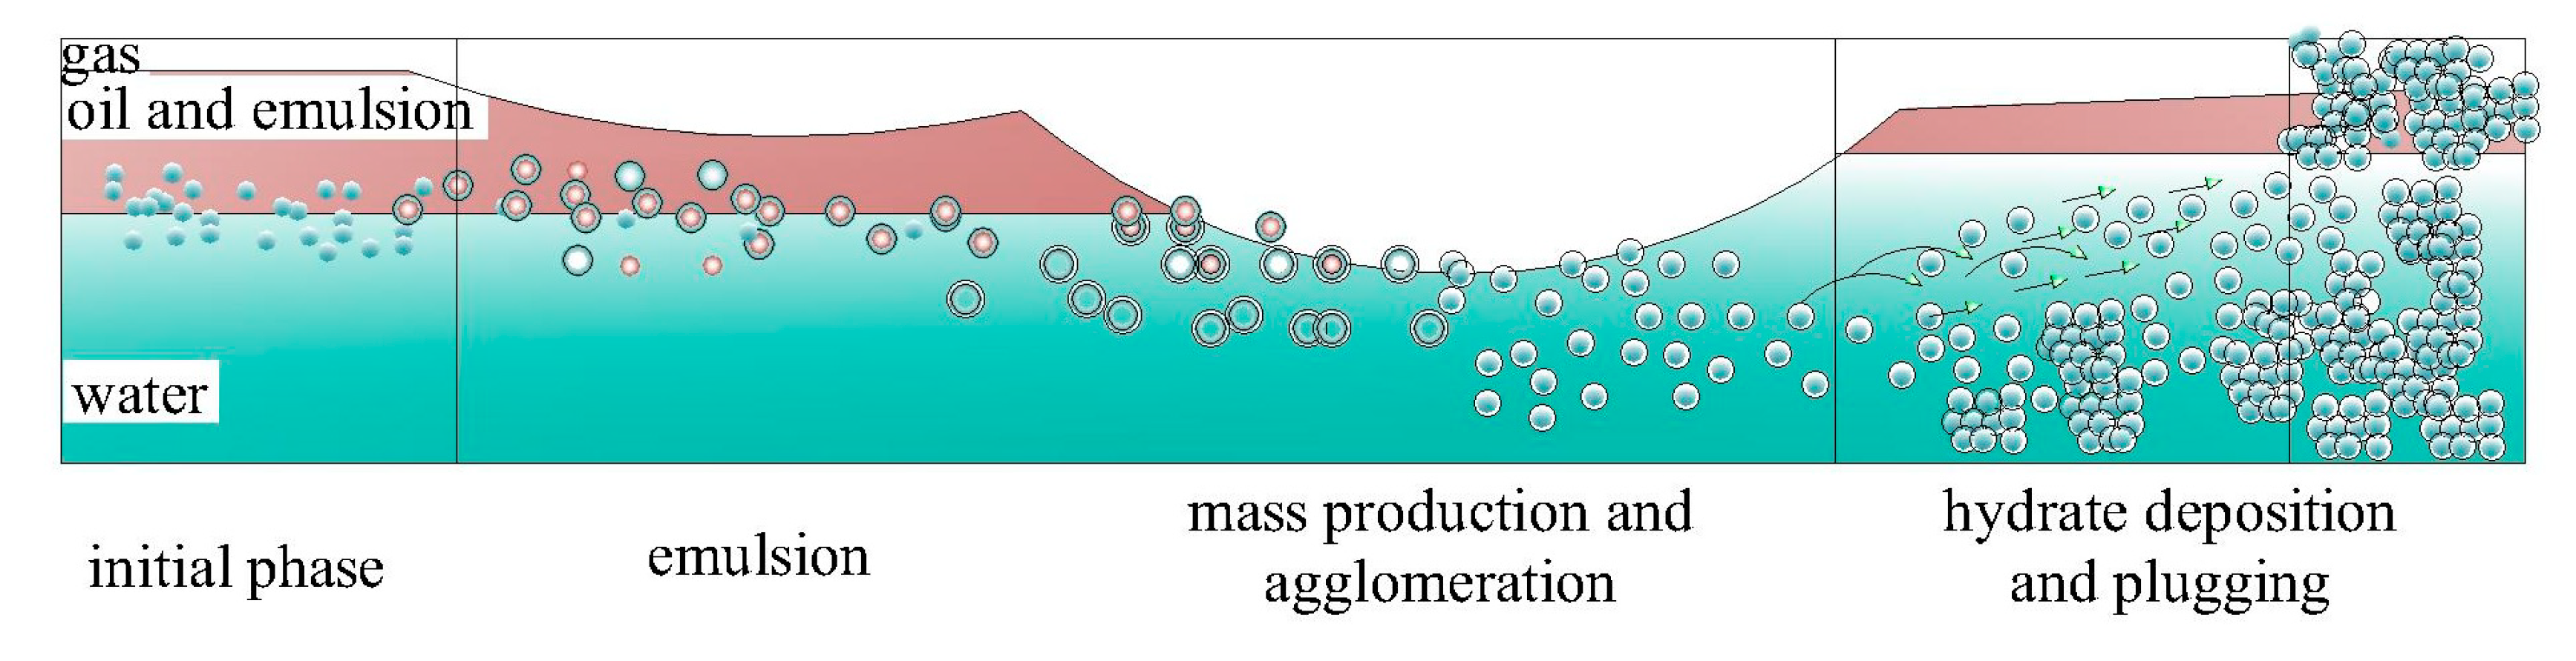
- (4)
- For high water cuts, hydrate nucleation and mass production mainly occur at the gas-water interface. Due to the deposition and aggregation of the hydrates, the change in moving bed to fixed bed will result in plug; for medium water cuts conditions, hydrate nucleation and formation mainly occur at the oil-water interface, and the accumulation of hydrate particles formed by water-in-oil is less. Eventually, it will get plugged due to the increase in viscosity and the accumulation of the deposits.
- (5)
- Moreover, the degree of aggregation among hydrate particles in low water cut systems is less than that in high water cut systems.
Author Contributions
Funding
Conflicts of Interest
References
- Zhou, S.; Yan, H.; Su, D.; Navaneethakannan, S.; Chi, Y. Investigation on the kinetics of carbon dioxide hydrate formation using flow loop testing. J. Nat. Gas Sci. Eng. 2018, 49, 385–392. [Google Scholar] [CrossRef]
- Zhou, S.; Jiang, K.; Zhao, Y.; Chi, Y.; Wang, S.; Zhang, G. Experimental investigation of CO2 hydrate formation in the water containing graphite nanoparticles and tetra-n-butyl ammonium bromide. J. Chem. Eng. Data 2018, 63, 1–22. [Google Scholar] [CrossRef]
- Chi, Y.D. Investigation of Wax Inhibitors on Wax Deposition Based on Flow Loop Testing. M.S. Thesis, University of Tulsa, Tulsa, OK, USA, 2015. [Google Scholar]
- Dubey, A.; Chi, Y.; Daraboina, N. Investigating the Performance of Paraffin Inhibitors under Different Operating Conditions. In Proceedings of the SPE Annual Technical Conference and Exhibition, San Antonio, TX, USA, 9–11 October 2017. [Google Scholar]
- Chi, Y.; Daraboina, N.; Sarica, C. Investigation of inhibitors efficacy in wax deposition mitigation using a laboratory scale flow loop. AIChE J. 2016, 62, 4131–4139. [Google Scholar] [CrossRef]
- Chi, Y.; Daraboina, N.; Sarica, C. Effect of the flow field on the wax deposition and performance of wax inhibitors: Cold finger and flow loop testing. Energy Fuels 2017, 31, 4915–4924. [Google Scholar] [CrossRef]
- Daraboina, N.; Chi, Y.; Sarica, C.; Pereyra, E.; Scott, S.L. Effects of High Pressure on the Performance of Existing Two-Phase Flow Models in Wellbores. In Proceedings of the SPE Annual Technical Conference and Exhibition, Dallas, TX, USA, 24–26 September 2018. [Google Scholar]
- Ersoy, G.; Sarica, C.; Al-Safran, E.; Zhang, H.Q. Three-phase gas-oil-water flow in undulating pipeline. J. Pet. Sci. Eng. 2017, 156, 468–483. [Google Scholar] [CrossRef]
- Chi, Y.; Zhou, S.; Daraboina, N. Experimental Study of Wax Deposition under Two-Phase Gas-Oil Stratified Flow. In Proceedings of the 11th North American Conference on Multiphase Production Technology, Banff, AL, Canada, 6–8 June 2018. [Google Scholar]
- Sloan, E.D. Clathrate Hydrates of Natural Gases, 2nd ed.; CRC Press: Boca Raton, FL, USA, 1998; ISBN 978-0849390784. [Google Scholar]
- Joshi, S.V.; Grasso, G.A.; Lafond, P.G.; Rao, I.; Webb, E.; Zerpa, L.E. Experimental flowloop investigations of gas hydrate formation in high water cut systems. Chem. Eng. Sci. 2013, 97, 198–209. [Google Scholar] [CrossRef]
- Zerpa, L.E.; Rao, I.; Aman, Z.M.; Danielson, T.J.; Koh, C.A.; Sloan, E.D. Multiphase flow modeling of gas hydrates with a simple hydrodynamic slug flow model. Chem. Eng. Sci. 2013, 99, 298–304. [Google Scholar] [CrossRef]
- Wang, S.L.; Rao, Y.C.; Zhou, S.D.; Li, J.; Miao, W. An experimental study on deepwater natural gas transmission based on the hydrate slurry flow technology. Nat. Gas Ind. 2014, 34, 101–107. [Google Scholar]
- Lorenzo, M.D.; Aman, Z.M.; Kozielski, K.; Bruce, W.E.N.; Johns, M.L.; May, E.F. Underinhibited hydrate formation and transport investigated using a single-pass gas-dominated flowloop. Energy Fuels 2014, 28, 7274–7284. [Google Scholar] [CrossRef]
- Lorenzo, M.D.; Aman, Z.M.; Soto, G.S.; Johns, M.; Kozielski, K.A.; May, E.F. Hydrate formation in gas-dominant systems using a single-pass flow loop. Energy Fuels 2014, 28, 3043–3052. [Google Scholar] [CrossRef]
- Sloan, D.; Koh, C.; Sum, A.K.; Ballard, A.L.; Creek, J.; Eaton, M. Natural Gas Hydrates in Flow Assurance, 1st ed.; Elsevier: Amsterdam, The Netherlands, 2010; ISBN 9781856179454. [Google Scholar]
- Chen, J.; Yan, K.L.; Chen, G.J.; Sun, C.Y.; Liu, B.; Ren, N. Insights into the formation mechanism of hydrate plugging in pipelines. Chem. Eng. Sci. 2015, 122, 284–290. [Google Scholar] [CrossRef]
- Akhfash, M.; Aman, Z.M.; Ahn, S.Y.; Johns, M.L.; May, E.F. Gas hydrate plug formation in partially-dispersed water–oil systems. Chem. Eng. Sci. 2016, 140, 337–347. [Google Scholar] [CrossRef]
- Ding, L.; Shi, B.; Lv, X.; Liu, Y.; Wu, H.; Wang, W. Investigation of natural gas hydrate slurry flow properties and flow patterns using a high pressure flow loop. Chem. Eng. Sci. 2016, 146, 199–206. [Google Scholar] [CrossRef]
- Song, G.C.; Li, Y.X.; Wang, W.C.; Jiang, K.; Ye, X.; Zhao, P.F. Investigation of hydrate plugging in natural gas+diesel oil+water systems using a high-pressure flow loop. Chem. Eng. Sci. 2017, 158, 480–489. [Google Scholar] [CrossRef]
- Sandoval, G.A.B.; Soares, E.J.; Thompson, R.L.; Siqueira, R.D.N.; Andrade, R.M.D.; Campos, F. Analysis of CO2 hydrates in crude oils from a rheological point of view. Energy Fuels 2018, 62, 2733–2741. [Google Scholar] [CrossRef]
- Chen, H.T.; Kandasamy, S.B. Effect of chloral hydrate on in vivo kcl-induced striatal dopamine release in the rat. Neurochem. Res. 1996, 21, 695–700. [Google Scholar] [CrossRef] [PubMed]
- Sun, C.Y.; Chen, G.J.; Yang, L.Y. Interfacial tension of methane + water with surfactant near the hydrate formation conditions. J. Chem. Eng. Data 2004, 49, 1023–1025. [Google Scholar] [CrossRef]
- Dai, W.J.; Wang, S.L.; Rao, Y.C.; Lv, X.F.; Liu, B.; Zheng, Y.X. Experiment on anew accelerant—Graphene oxide for accelerating the formation of CO2 hydrate. Nat. Gas Ind. 2016, 36, 83–88. [Google Scholar]
- Zhou, S.; Yu, Y.; Wang, S.; Zhang, G.; Li, H. Research progress in the natural gas hydrate formation model under the pipe flow system. Nat. Gas Ind. 2014, 34, 92–98. [Google Scholar]
- Sarshar, M.; Esmaeilzadeh, F.; Fathikalajahi, J. Induction time of hydrate formation in a flow loop. Theor. Found. Chem. Eng. 2010, 44, 201–205. [Google Scholar] [CrossRef]
- Guo, Y.D. Study on the Formation/Decomposition Process of Hydrate Slurry in Water-in-Oil Emulsion System. Ph.D. Thesis, China University of Petroleum, Beijing, China, 2016. [Google Scholar]
- Duan, Z.H.; Wei, Q. Solubility model of gas (CH4, H2S, CO2, etc.) in aqueous solution. Chin. J. Geol. 2011, 85, 1079–1093. [Google Scholar]
- Zhou, S.; Yu, X.; Jiang, K.; YU, X.; Bian, H.; Chen, X. Effect of wax crystal precipitation on the kinetic characteristics of hydrate formation. J. Nat. Gas Ind. 2018, 38, 103–109. [Google Scholar]
- Klauda, J.B.; Sandler, S.I. A fugacity model for gas hydrate phase equilibria. Ind. Eng. Chem. Res. 2000, 39, 3377–3386. [Google Scholar] [CrossRef]
- Shi, B.; Ding, L.; Liu, Y.; Yang, J.; Song, S.; Wu, H. Hydrate slurry flow property in w/o emulsion systems. RSC Adv. 2018, 8, 11436–11445. [Google Scholar] [CrossRef]
- Lv, X.; Shi, B.; Ying, W.; Jing, G. Study on gas hydrate formation and hydrate slurry flow in a multiphase transportation system. Energy Fuels 2013, 27, 7294–7302. [Google Scholar] [CrossRef]
- Melchuna, A.; Cameirao, A.; Herri, J.M.; Glenat, P. Topological modeling of methane hydrate crystallization from low to high water cut emulsion systems. Fluid Phase Equilib. 2016, 413, 158–169. [Google Scholar] [CrossRef]


| Case | Water Cut Rage | Water Cut (%) | Initial Flow Rate (L/min) |
|---|---|---|---|
| 1 | Pure water | 100 | 18.22 |
| 2 | Extra high water cut | 95 | 18.23 |
| 3 | High water cut | 80 | 17.22 |
| 4 | Medium water cut | 60 | 15.23 |
© 2018 by the authors. Licensee MDPI, Basel, Switzerland. This article is an open access article distributed under the terms and conditions of the Creative Commons Attribution (CC BY) license (http://creativecommons.org/licenses/by/4.0/).
Share and Cite
Zhou, S.; Chen, X.; He, C.; Wang, S.; Zhao, S.; Lv, X. Experimental Study on Hydrate Formation and Flow Characteristics with High Water Cuts. Energies 2018, 11, 2610. https://doi.org/10.3390/en11102610
Zhou S, Chen X, He C, Wang S, Zhao S, Lv X. Experimental Study on Hydrate Formation and Flow Characteristics with High Water Cuts. Energies. 2018; 11(10):2610. https://doi.org/10.3390/en11102610
Chicago/Turabian StyleZhou, Shidong, Xiaokang Chen, Chengyuan He, Shuli Wang, Shuhua Zhao, and Xiaofang Lv. 2018. "Experimental Study on Hydrate Formation and Flow Characteristics with High Water Cuts" Energies 11, no. 10: 2610. https://doi.org/10.3390/en11102610
APA StyleZhou, S., Chen, X., He, C., Wang, S., Zhao, S., & Lv, X. (2018). Experimental Study on Hydrate Formation and Flow Characteristics with High Water Cuts. Energies, 11(10), 2610. https://doi.org/10.3390/en11102610