Numerical Study on the Influence of Mass and Stiffness Ratios on the Vortex Induced Motion of an Elastically Mounted Cylinder for Harnessing Power


Abstract
:1. Introduction
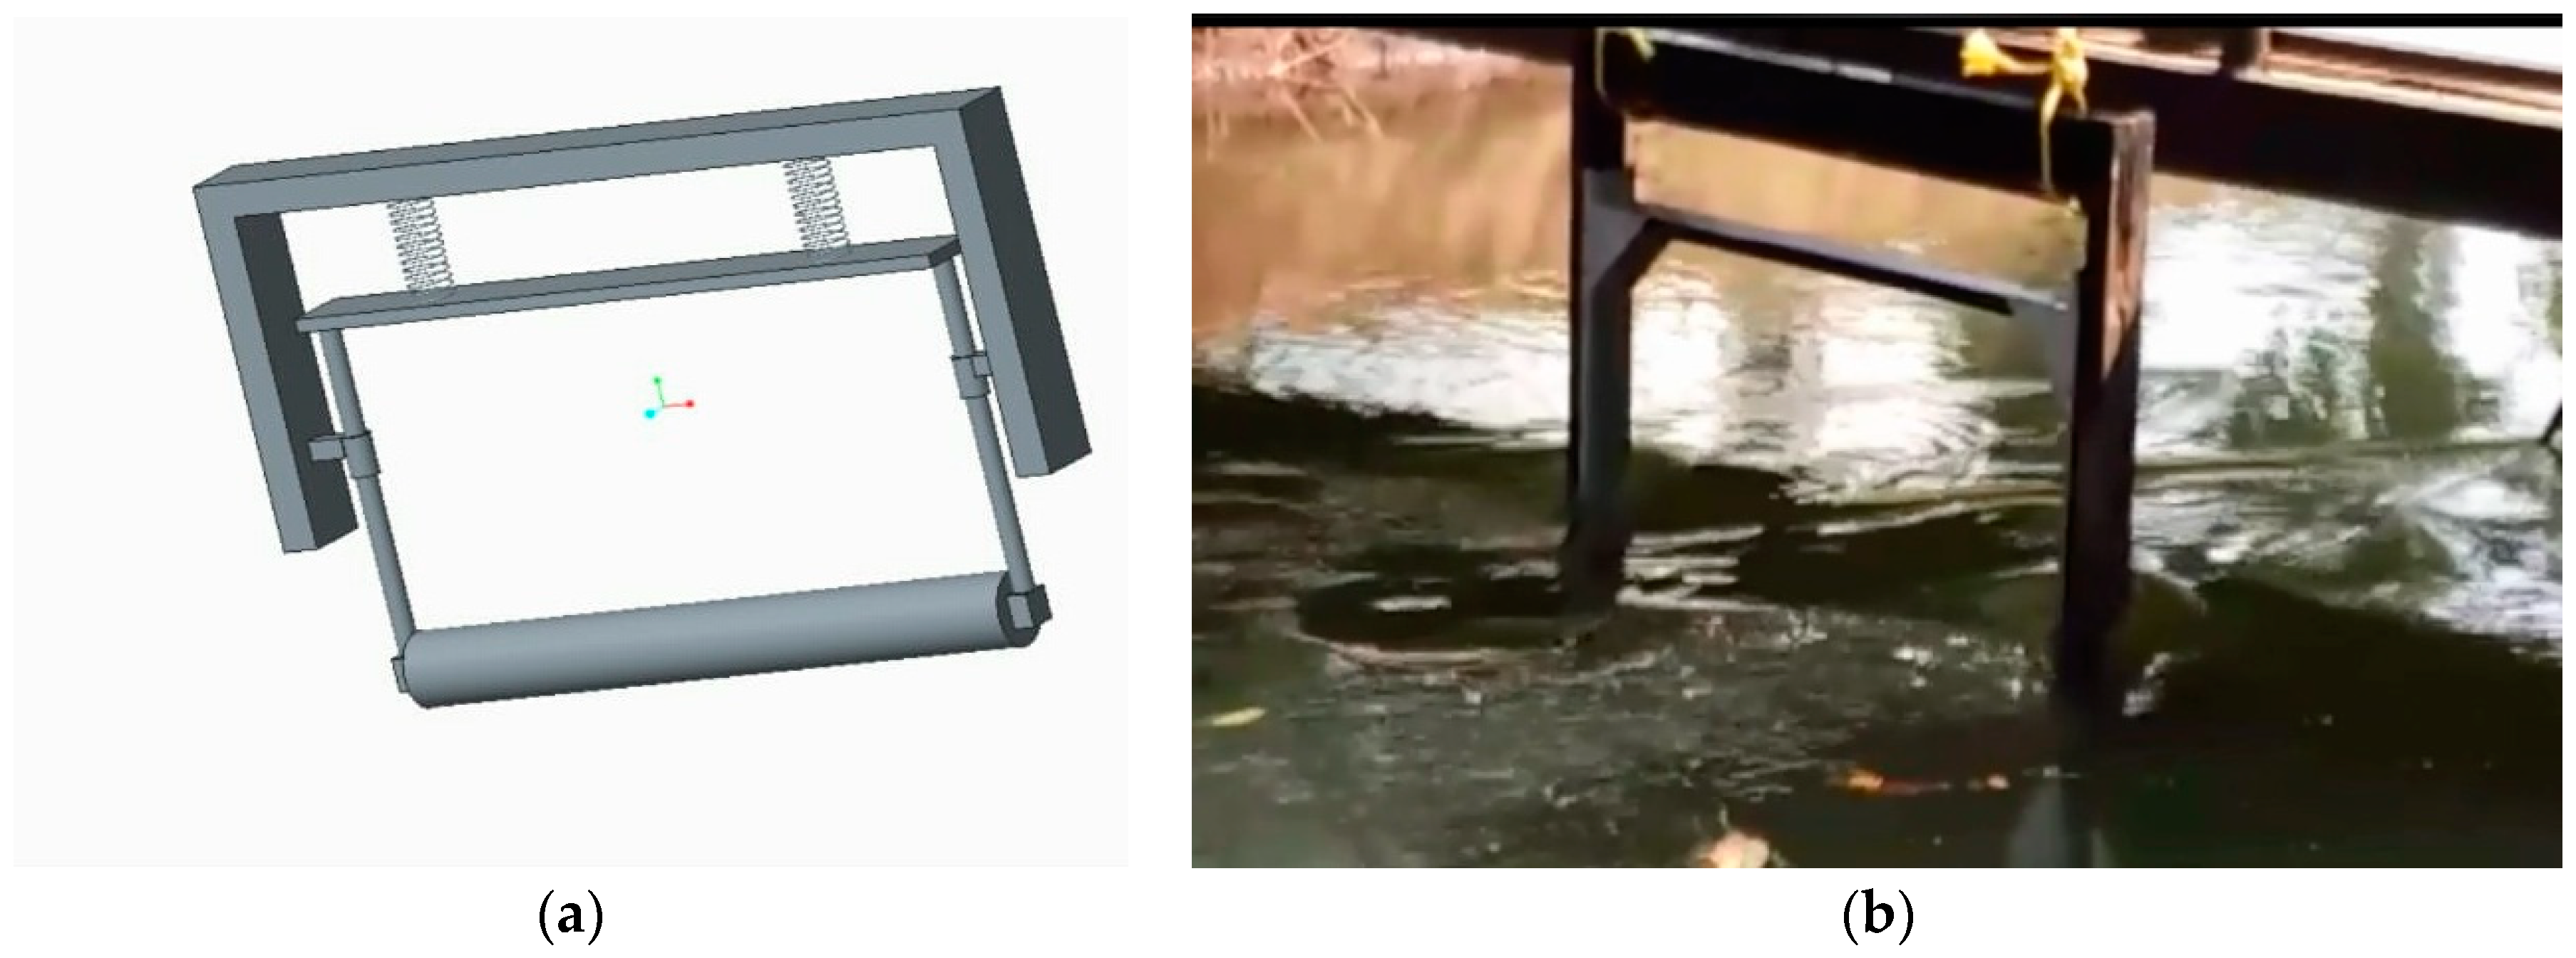
2. The Concept of HVPG
3. Mathematical Model
4. Numerical Determination of Hydrodynamic Lift Forces and Motions
4.1. Modeling the Flow
NITA
4.2. Structural Modeling
4.3. Mesh Deformation
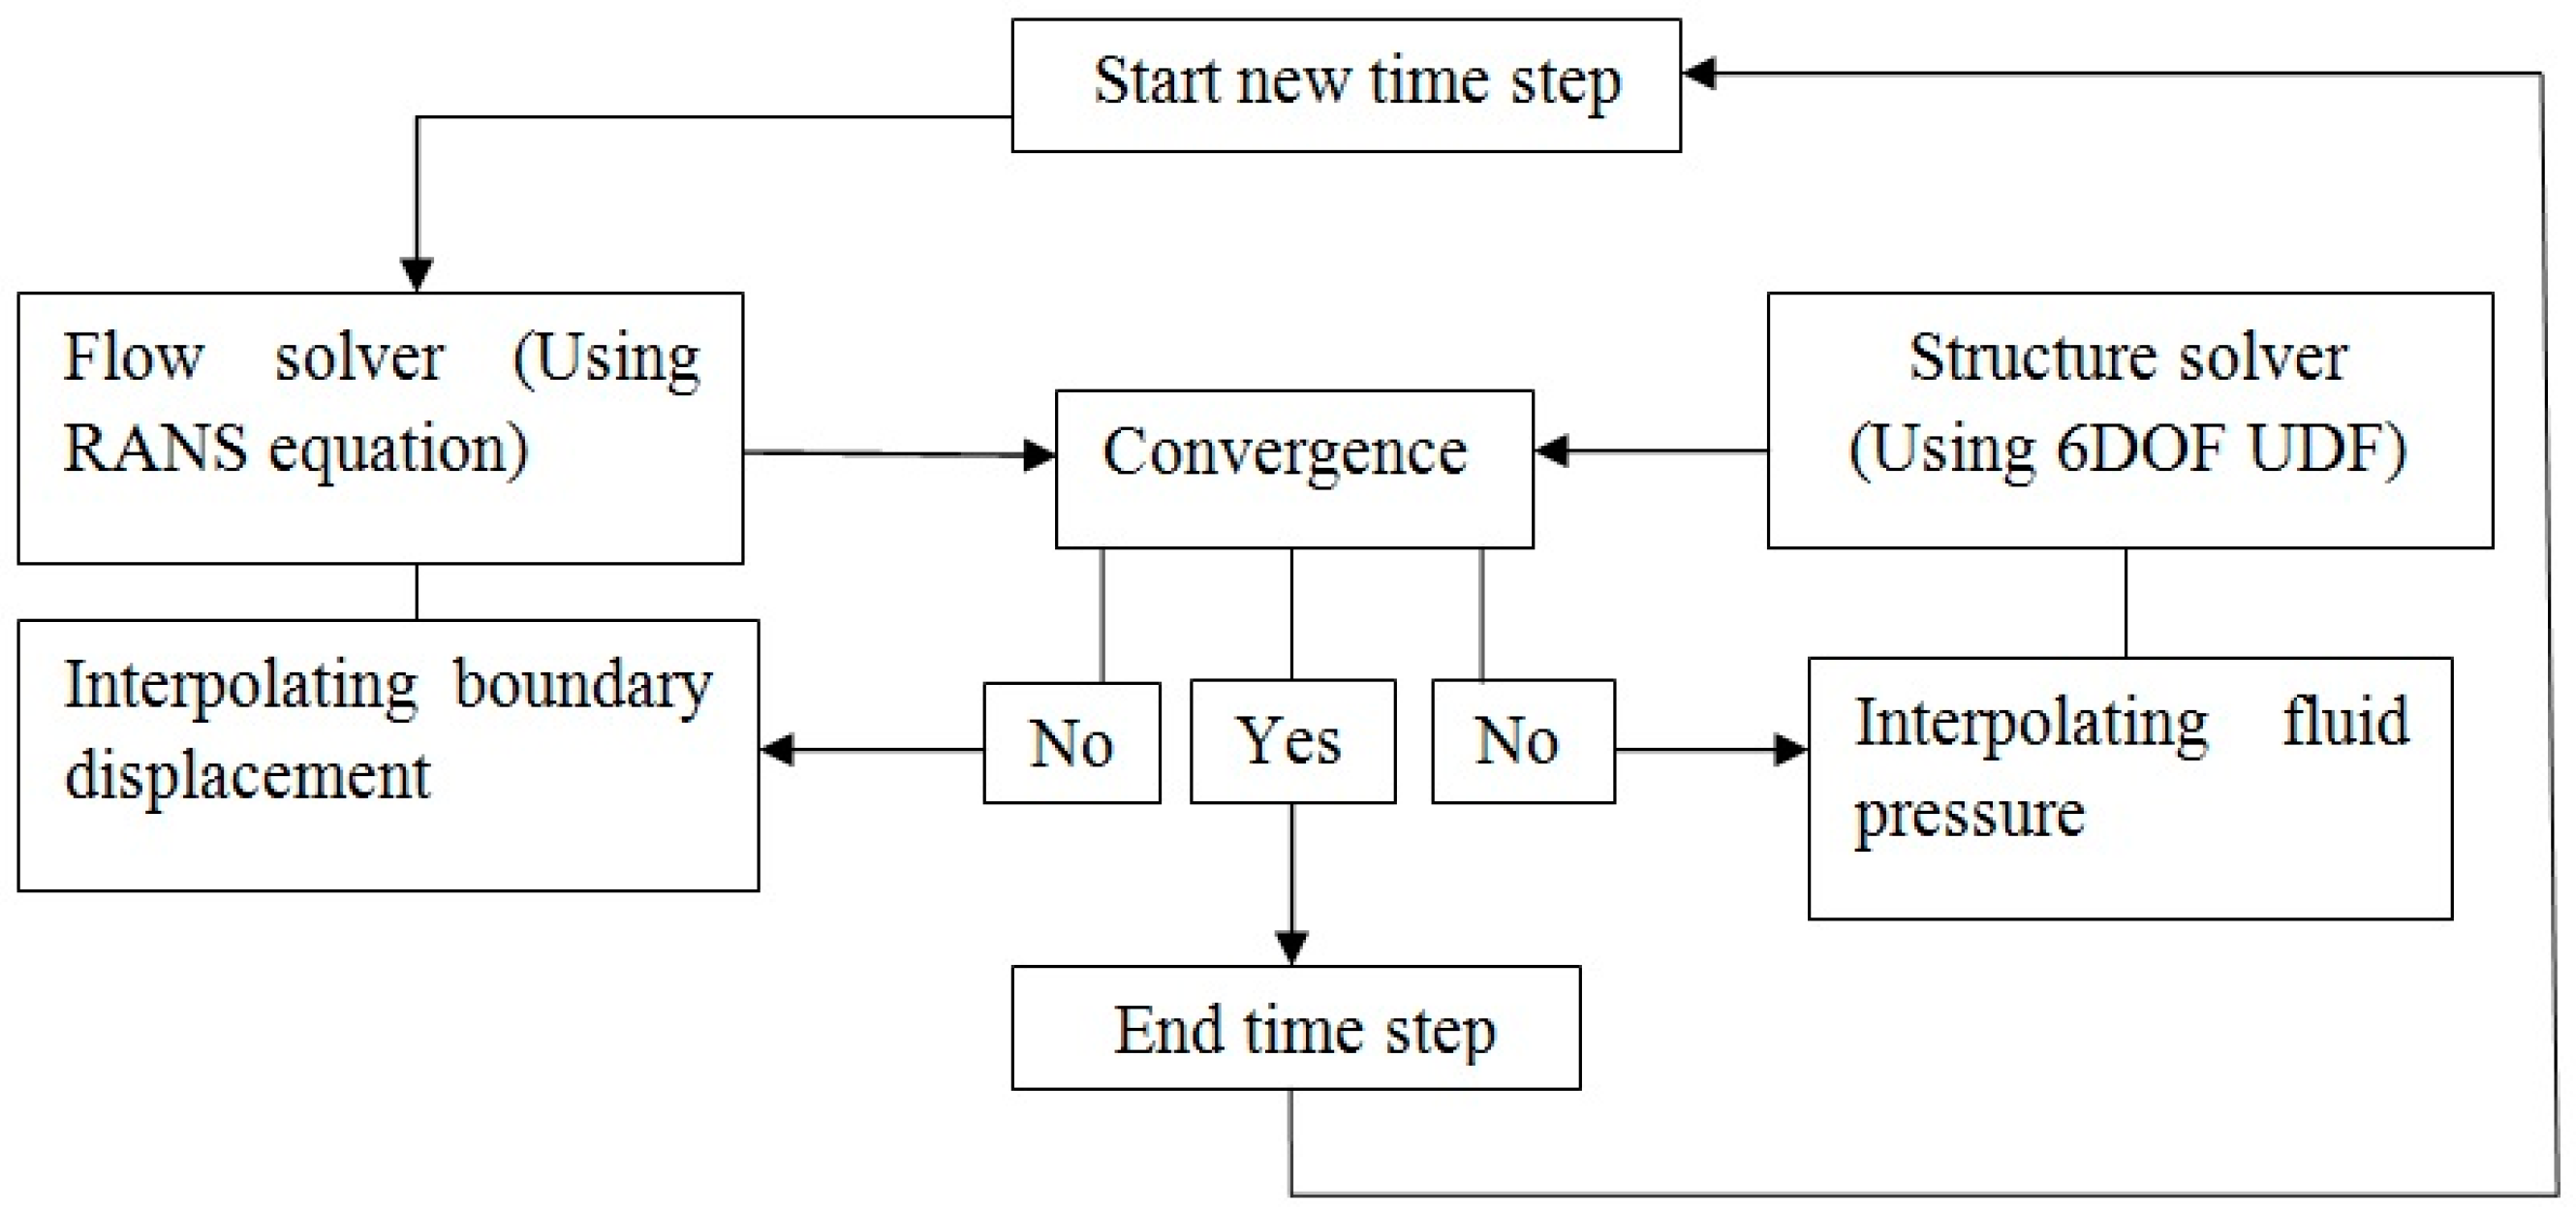
4.4. Fluid Structure Interaction
5. Problem Description
5.1. Simulation Parameters
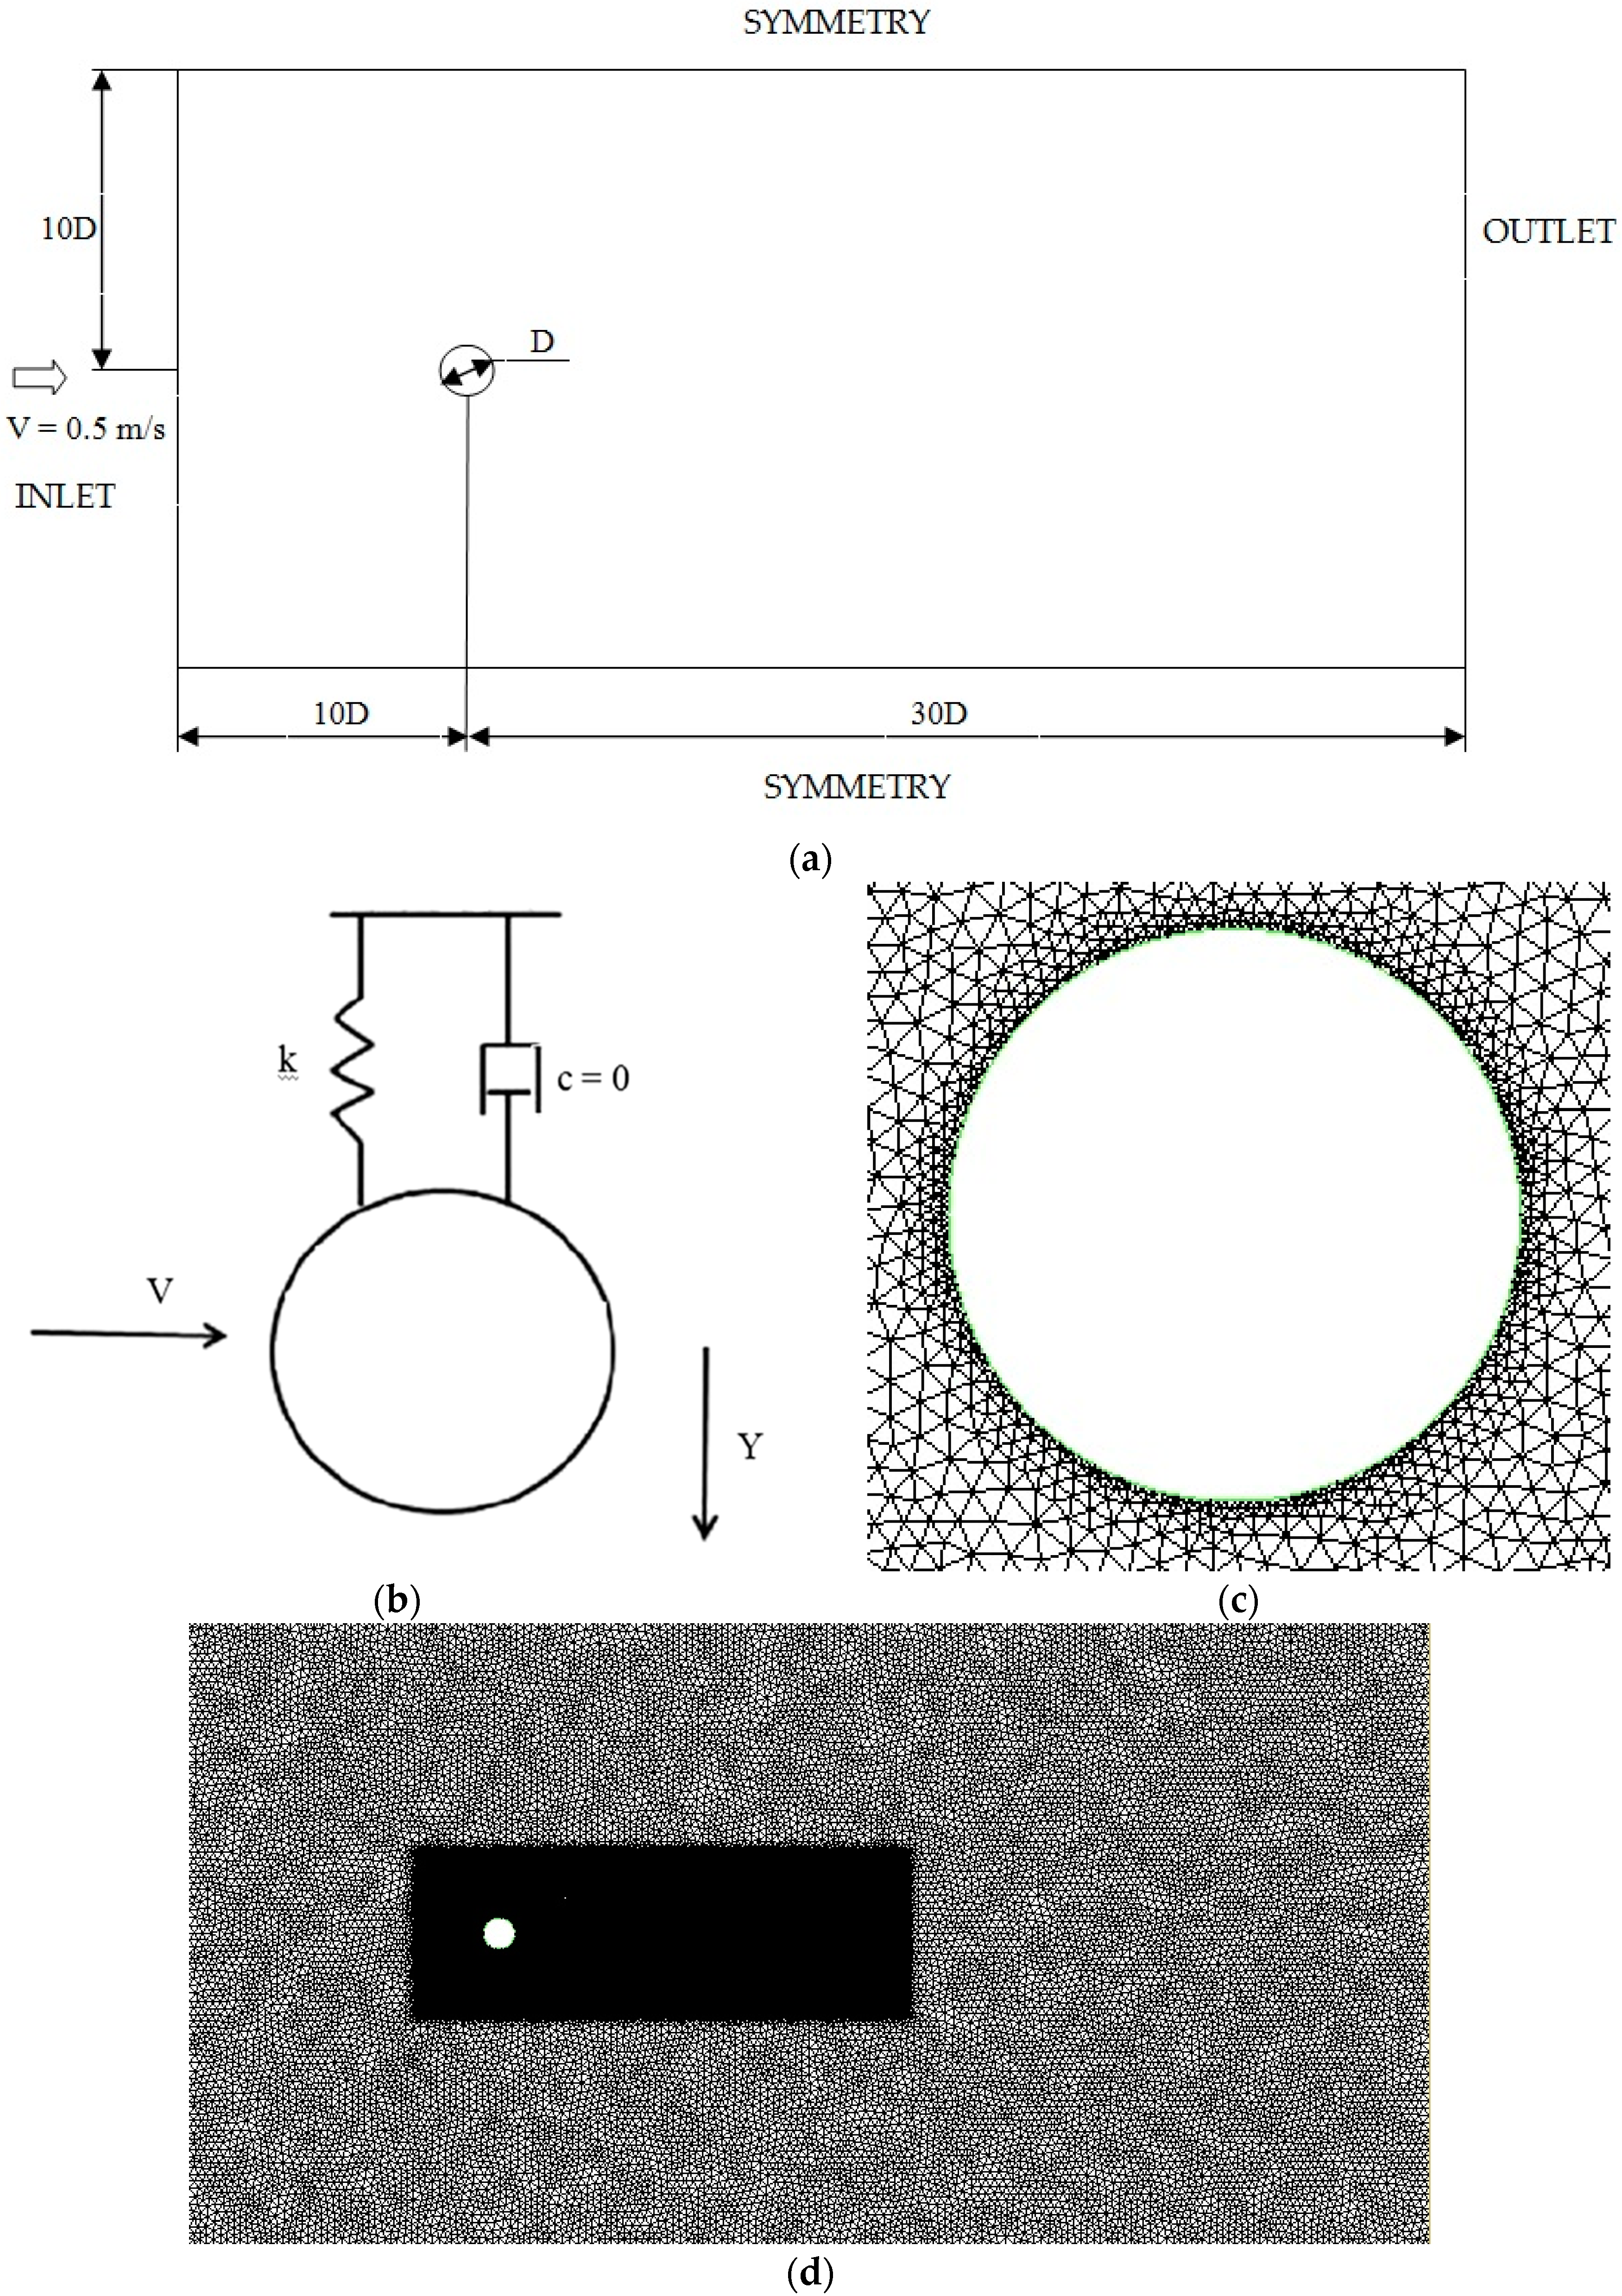
5.2. Fluid Domain and Boundary Conditions
5.3. Mesh Independence Study
6. Results and Discussion
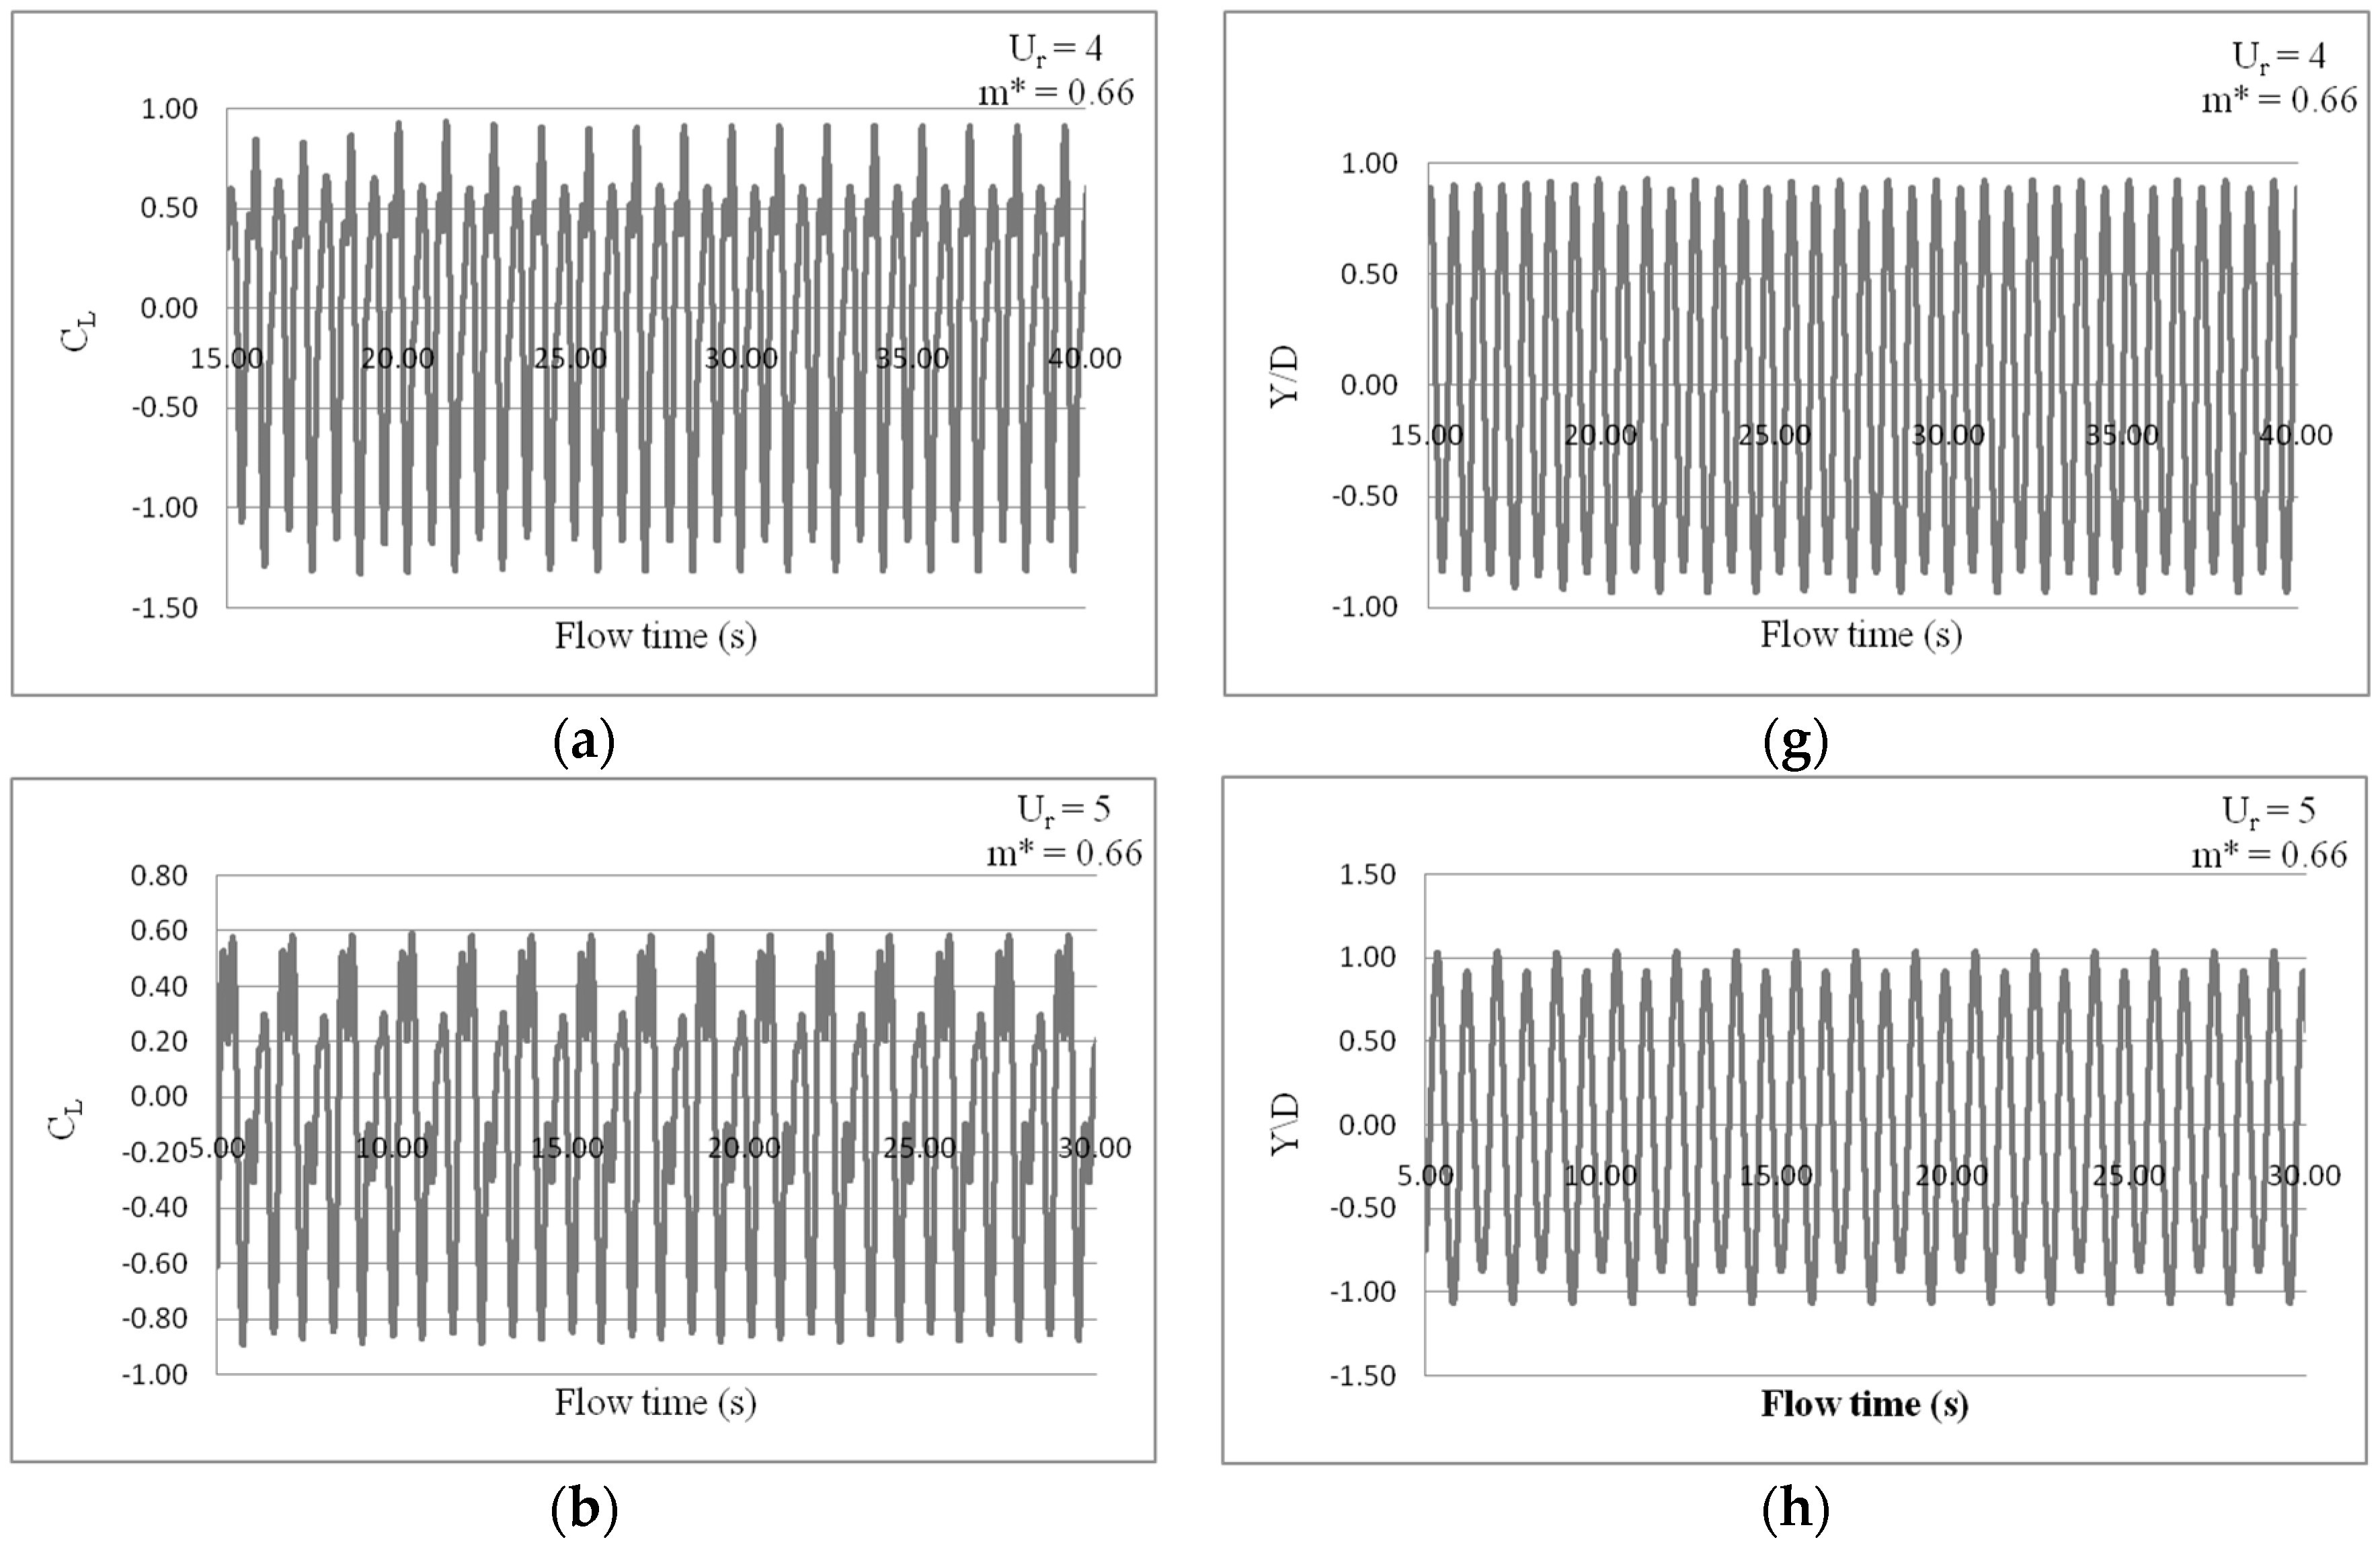
6.1. Case I
6.2. Case II
6.3. Case III
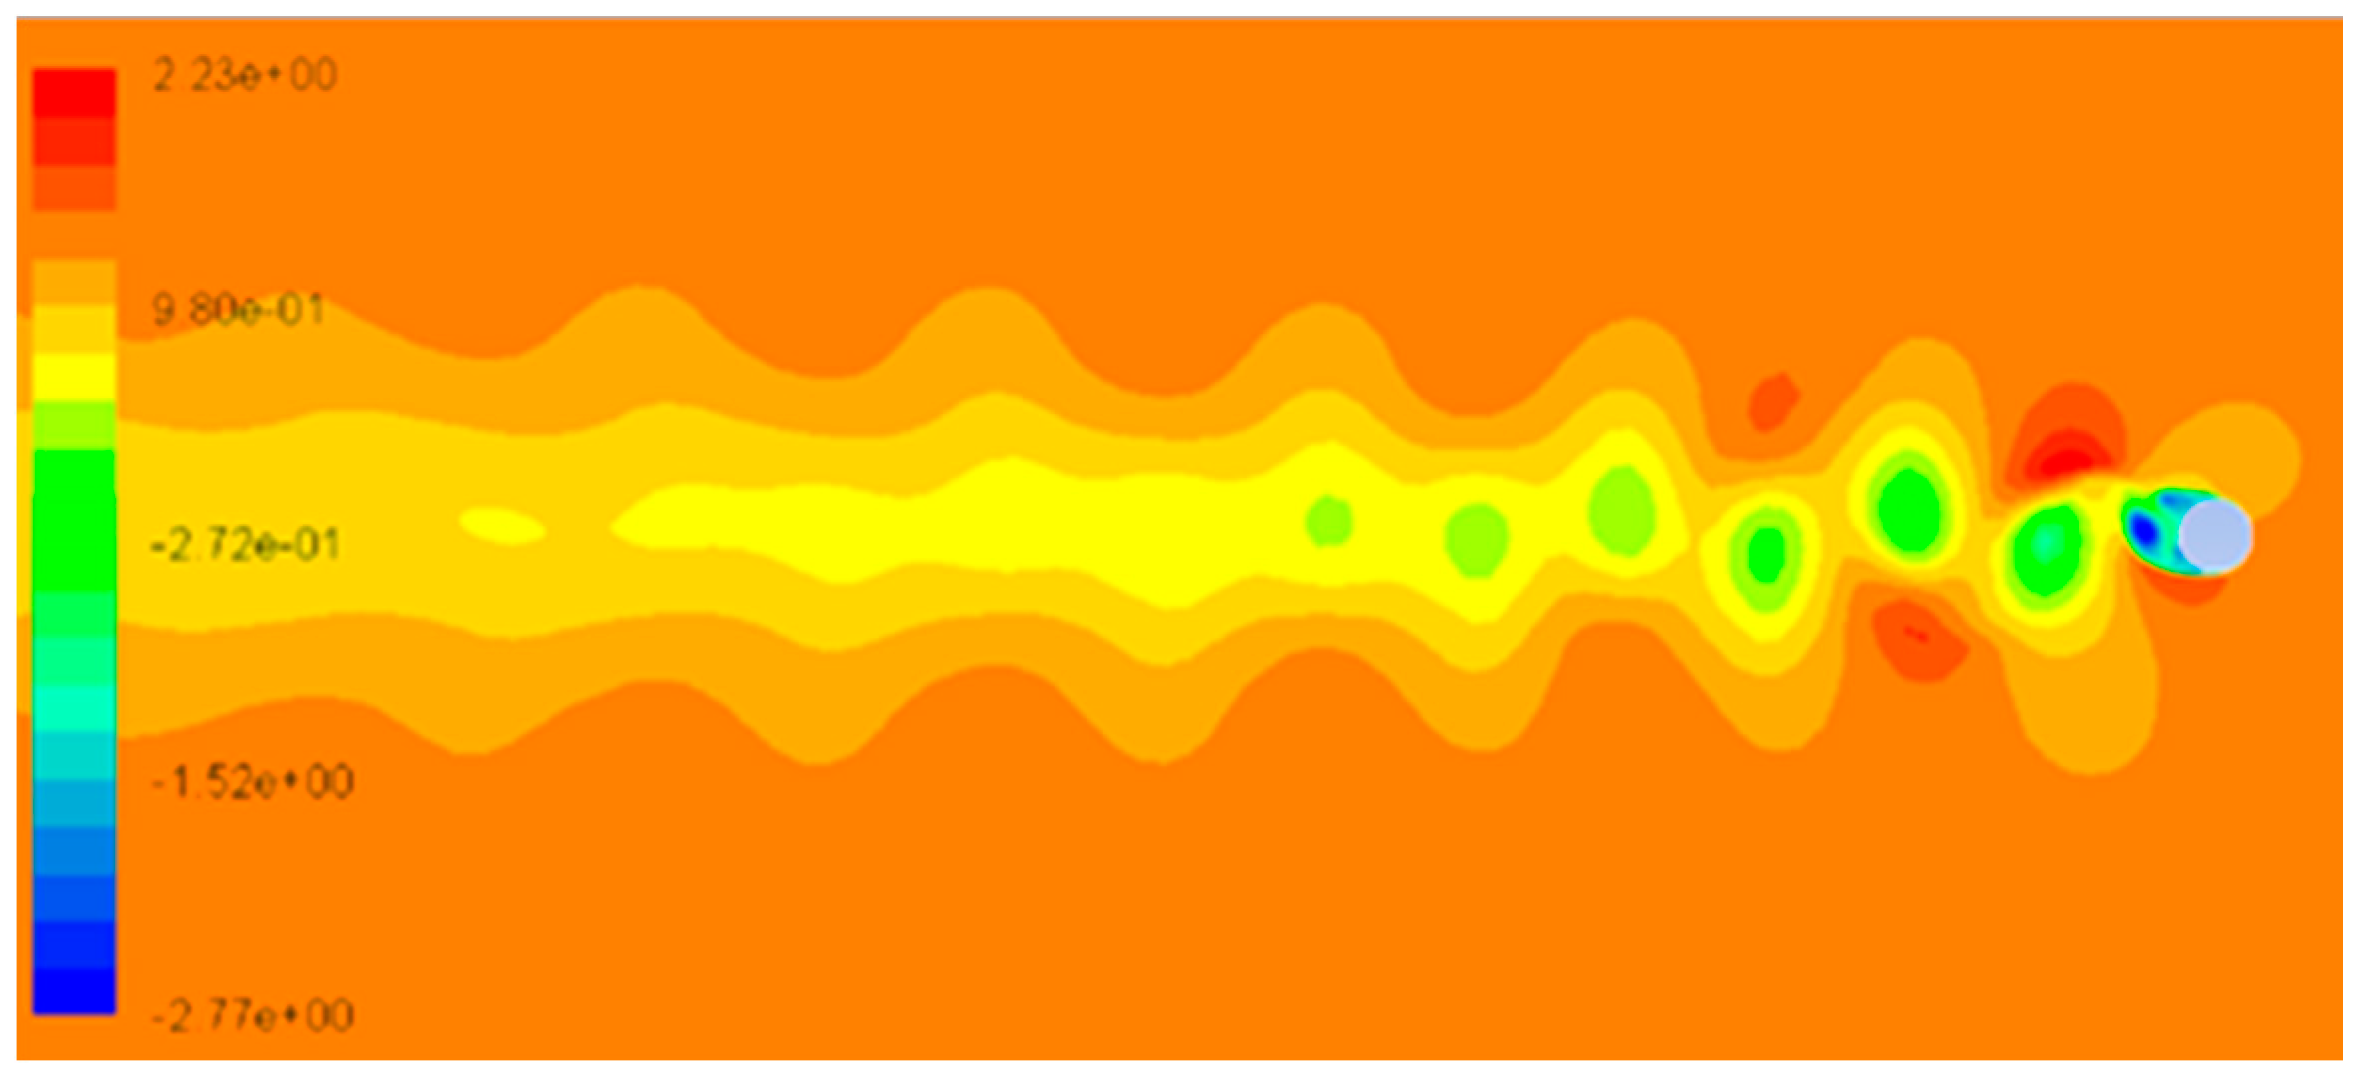
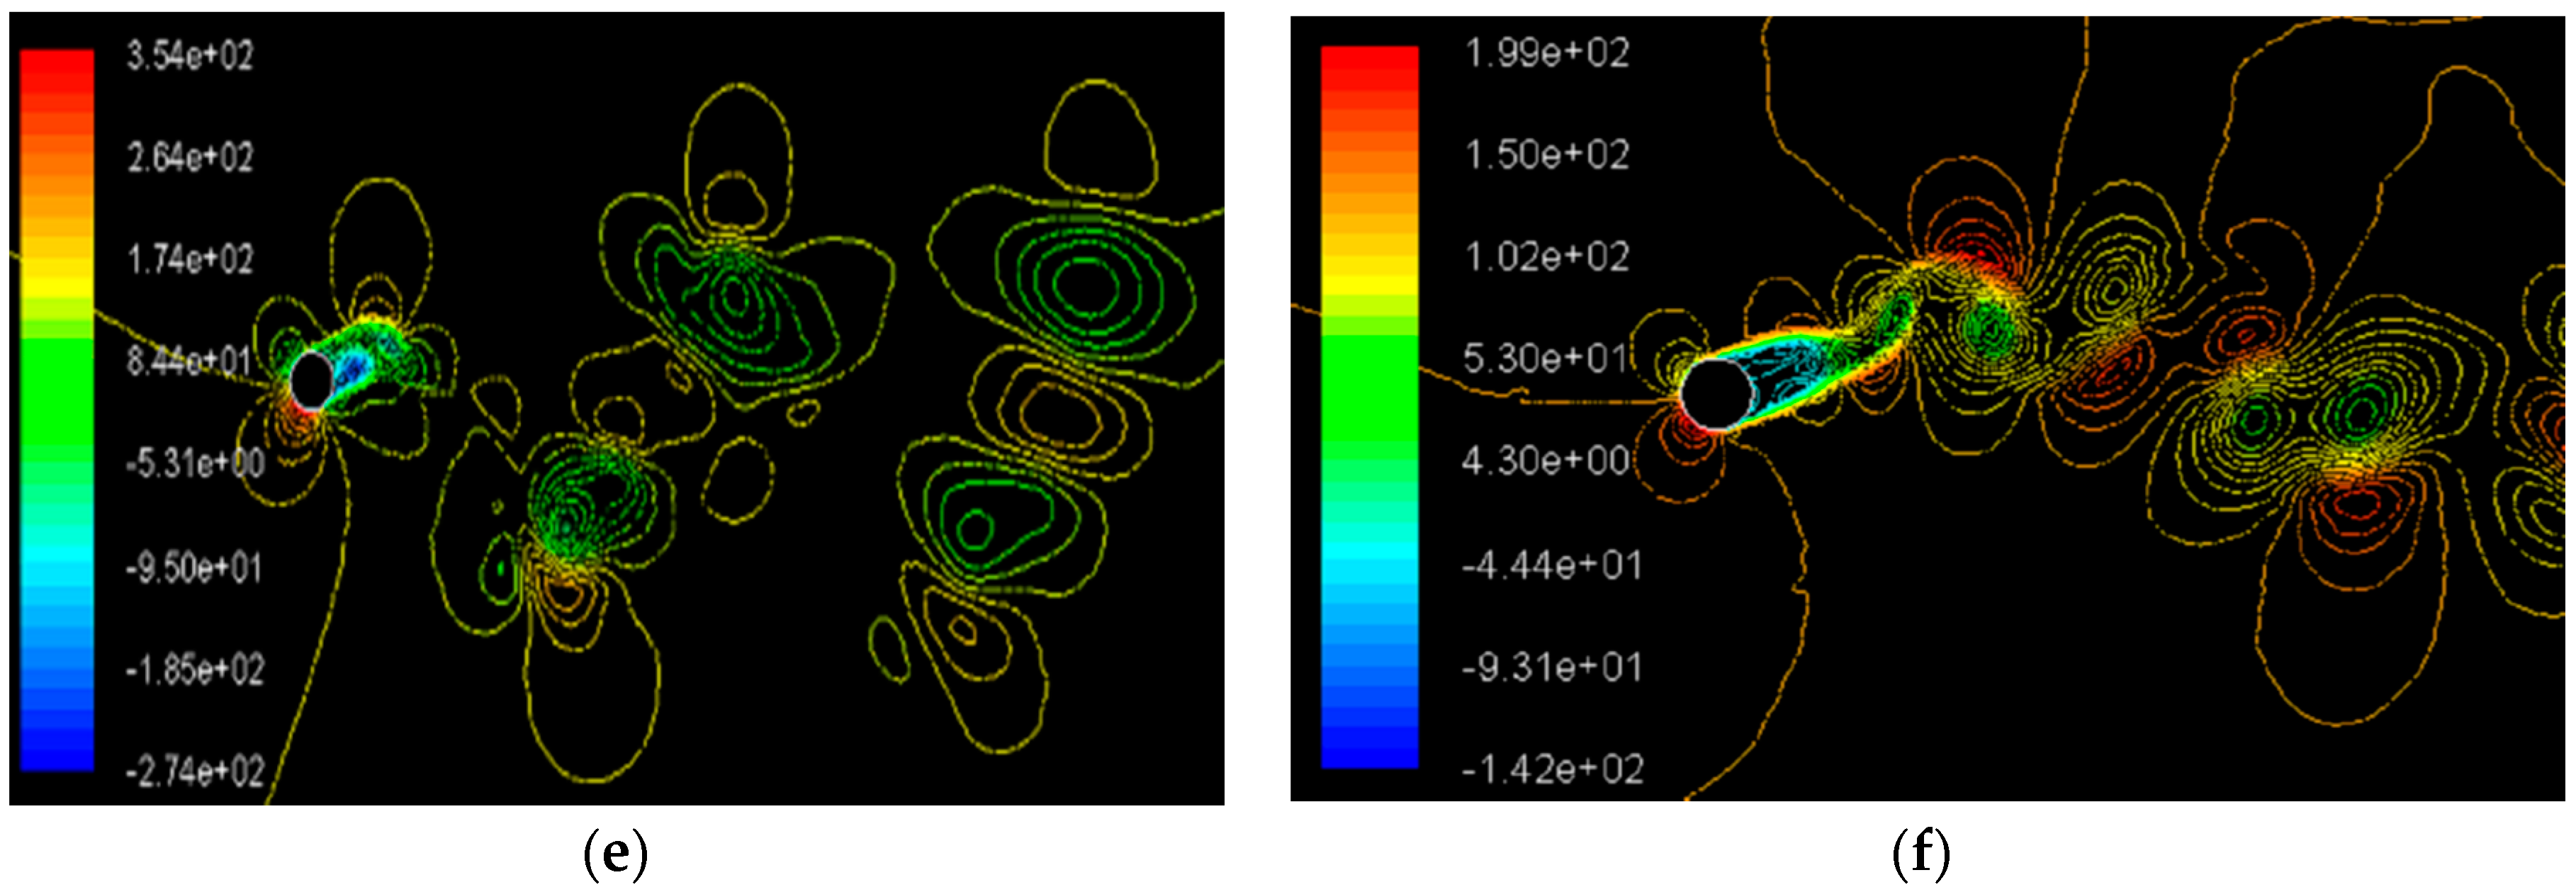
6.4. Shedding Characteristics
7. Field Test Validation of Numerical Results
8. Conclusions
9. Scope for Future Research
Author Contributions
Funding
Acknowledgments
Conflicts of Interest
References
- Gerrard, J.H. The mechanics of the formation region of vortices behind bluff bodies. J. Fluid Mech. 1966, 25, 401–413. [Google Scholar] [CrossRef]
- Gao, Y.; Fu, S.; Xiong, Y.; Zhao, Y.; Liu, L. Experimental study on response performance of vortex-induced vibration on a flexible cylinder. Ships Offshore Struct. 2016, 12, 116–134. [Google Scholar] [CrossRef]
- Bimbato, A.M.; Pereira, L.A.; Hirata, M.H. Suppression of vortex shedding on a bluff body. J. Wind Eng. Ind. Aerodyn. 2013, 122, 16–18. [Google Scholar] [CrossRef]
- Bernitsas, M.; Raghavan, K.; Ben-Simon, Y.; Garcia, E. VIVACE (Vortex Induced Vibration Aquatic Clean Energy): A New Concept in Generation of Clean and Renewable Energy from Fluid Flow. J. Offshore Mech. Arct. Eng. 2006, 130, 041101. [Google Scholar] [CrossRef]
- An, X.; Song, B.; Tian, W.; Ma, C. Design and CFD Simulations of a Vortex-Induced Piezoelectric Energy Conve rter (VIPEC) for Underwater Environment. Energies 2018, 11, 330. [Google Scholar] [CrossRef]
- Janardhanan, S.; Chandran, V.; Varghese, C.; Achuth, D.; Devassy, D.; Mathews, D.C. Hydro vortex power generator design and construction. In Proceedings of the Kerala Technological CONGRESS, KETCON 2018—Human Computer Interface, Thrissur, India, 24 February 2018. [Google Scholar]
- Griffin, O.M. Vortex-Excited Cross-Flow Vibrations of a Single Cylindrical Tube. ASME J. Press. Vessel Technol. 1980, 102, 158–166. [Google Scholar] [CrossRef]
- Khalak, A.; Williamson, C.H.K. Dynamics of a hydroelastic cylinder with very low mass and damping. J. Fluids Struct. 1996, 10, 455–472. [Google Scholar] [CrossRef]
- Narendran, K.; Murali, K.; Sundar, V. Vortex-induced vibrations of elastically mounted circular cylinder at Re of the O(105). J. Fluids Struct. 2015, 54, 503–521. [Google Scholar] [CrossRef]
- Govardhan, R.; Williamson, C.H.K. Defining the ‘modified Griffin plot’ in vortex-induced vibration: Revealing the effect of Reynolds number using controlled damping. J. Fluid Mech. 2006, 561, 147–180. [Google Scholar] [CrossRef]
- Bernitsas, M. Out of the Vortex. Mech. Eng. 2010, 132, 22–27. [Google Scholar] [CrossRef]
- Tian, W.; Mao, Z.; Zhao, F. Design and Numerical Simulations of a Flow Induced Vibration Energy Converter for Underwater Mooring Platforms. Energies 2017, 10, 1427. [Google Scholar] [CrossRef]
- Khan, N.B.; Ibrahim, Z.; Tuan, L.; Javed, M.F.; Jameel, M. Numerical investigation of the vortex-induced vibration of an elastically mounted circular cylinder at high Reynolds number (Re = 104) and low mass ratio using the RANS code. PLoS ONE 2017, 12, e0185832. [Google Scholar] [CrossRef] [PubMed]
- Williamson, C.H.K.; Govardhan, R. Vortex induced vibrations. Annu. Rev. Fluid Mech. 2004, 36, 413–455. [Google Scholar] [CrossRef]
- Achenbach, E.; Heinecke, E. On Vortex Shedding from Smooth and Rough Cylinders in the Range of Reynolds Numbers 6 × 10³ to 5 × 10⁶. J. Fluid Mech. 1981, 109, 239–251. [Google Scholar] [CrossRef]
- Blevins, R.D. Flow-Induced Vibration, 2nd ed.; Van Nostrand Reinhold: New York, NY, USA, 1990; pp. 163–164. ISBN 1-57524-183-8. [Google Scholar]
- Gabbai, R.D.; Benaroya, H. An overview of modeling and experiments of vortex-induced vibration of circular cylinders. J. Sound Vib. 2005, 282, 575–616. [Google Scholar] [CrossRef]
- Anagnostopoulos, P.W.; Bearman, P.W. Response characteristics of a vortex exited cylinder at low Reynolds number. J. Fluids Struct. 1992, 6, 39–50. [Google Scholar] [CrossRef]
- Khalak, A.; Williamson, C.H.K. Investigation of the relative effects of mass and damping in vortex induced vibration of a circular cylinder. J. Wind Eng. Ind. Aerodyn. 1997, 69–71, 341–350. [Google Scholar] [CrossRef]
- IcemCfd, A. 12.0 User’s Ma; Ansys Inc.: Canonsburg, PA, USA, 2009; Volume 5. [Google Scholar]
- Fluent, A. 12.0 Theory Guide; Ansys Inc.: Canonsburg, PA, USA, 2009; Volume 5. [Google Scholar]
- Menter, F.R. Two-equation eddy-viscosity turbulence models for engineering applications. AIAA J. 1994, 32, 1598–1605. [Google Scholar] [CrossRef] [Green Version]
- Anton, G. Analysis of Vortex-Induced Vibration of Risers. Master’s Thesis, Applied Mechanics, Chalmers University of Technology, Gothenburg, Sweden, 2012. [Google Scholar]
- Vandiver, J.K. Damping parameters for flow-induced vibration. J. Fluids Struct. 2012, 35, 105–119. [Google Scholar] [CrossRef]
- Schlichting, H. Boundary Layer Theory, 8th ed.; McGraw-Hill Book Company: New York, NY, USA, 1979; ISBN 13 978-3540662709. [Google Scholar]
- Iaccarino, G.; Mishra, A.A.; Ghili, S. Eigenspace perturbations for uncertainty estimation of single-point turbulence closures. Phys. Rev. Fluids 2017, 2, 024605. [Google Scholar] [CrossRef]
- Mishra, A.A.; Gianluca, I. Uncertainty Estimation for Reynolds-Averaged Navier Stokes Predictions of High-Speed Aircraft Nozzle Jets. AIAA J. 2017, 55, 3999–4004. [Google Scholar] [CrossRef]
- Govardhan, R.; Williamson, C.H.K. Modes of vortex formation and frequency response for a freely-vibrating cylinder. J. Fluid Mech. 2000, 420, 85–130. [Google Scholar] [CrossRef]
- Chen, W.; Zhang, Q.; Li, H.; Hu, H. An experimental investigation on vortex induced vibration of a flexible inclined cable under a shear flow. J. Fluids Struct. 2015, 54, 297–311. [Google Scholar] [CrossRef]
- Feng, C.C. The Measurements of Vortex Induced Effects in Flow Past a Stationary and Oscillating Circular and D-Section Cylinders. Master’s Thesis, The University of British Columbia, Vancouver, BC, Canada, 1968. [Google Scholar]
- Naudascher, E.; Rockwell, D. Flow Induced Vibration—An Engineering Guide; Dover Publications Inc.: Mineola, NY, USA, 2005; pp. 37–38. ISBN 13 978-0-486-44282-2. [Google Scholar]
- Domal, V.; Sharma, R. An experimental study on vortex-induced vibration response of marine riser with and without semi-submersible. J. Eng. Marit. Environ. 2017, 232, 176–198. [Google Scholar] [CrossRef]


| Properties | Values | Units |
|---|---|---|
| Diameter of the cylinder (D) | 0.0762 | m |
| Aspect ratio of the cylinder (L/D) | 13.12 | - |
| Flow velocity (V) | 0.5 | m/s |
| Reynolds Number of flow (Re) | 3.8 × 10⁴ | - |
| Mass ratio (m*) | 0.66 | - |
| Ur | k* | |
|---|---|---|
| 4 | 11.17 | 1.3 |
| 5 | 6.9 | 1.0 |
| 6 | 4.81 | 0.84 |
| 8 | 2.7 | 0.63 |
| 10 | 1.73 | 0.51 |
| 12 | 1.21 | 0.42 |
| Re | m* | Ur | Nodes | Ymax/D | |
|---|---|---|---|---|---|
| Grid I | 3.8 × 10⁴ | 2.45 | 8 | 35,487 | 1.241 |
| Grid II | 49,995 | 1.220 | |||
| Grid III | 70,857 | 1.219 | |||
| Grid IV | 98,475 | 1.219 | |||
| Narendran et al. (2015) | 0.3–2.4 × 10⁵ | 2.45 | 8 | - | 1.160 |
| Mass Ratio, m* | Ur | CL | Y/D | fv (Hz) | St | Shedding Characteristics | |
|---|---|---|---|---|---|---|---|
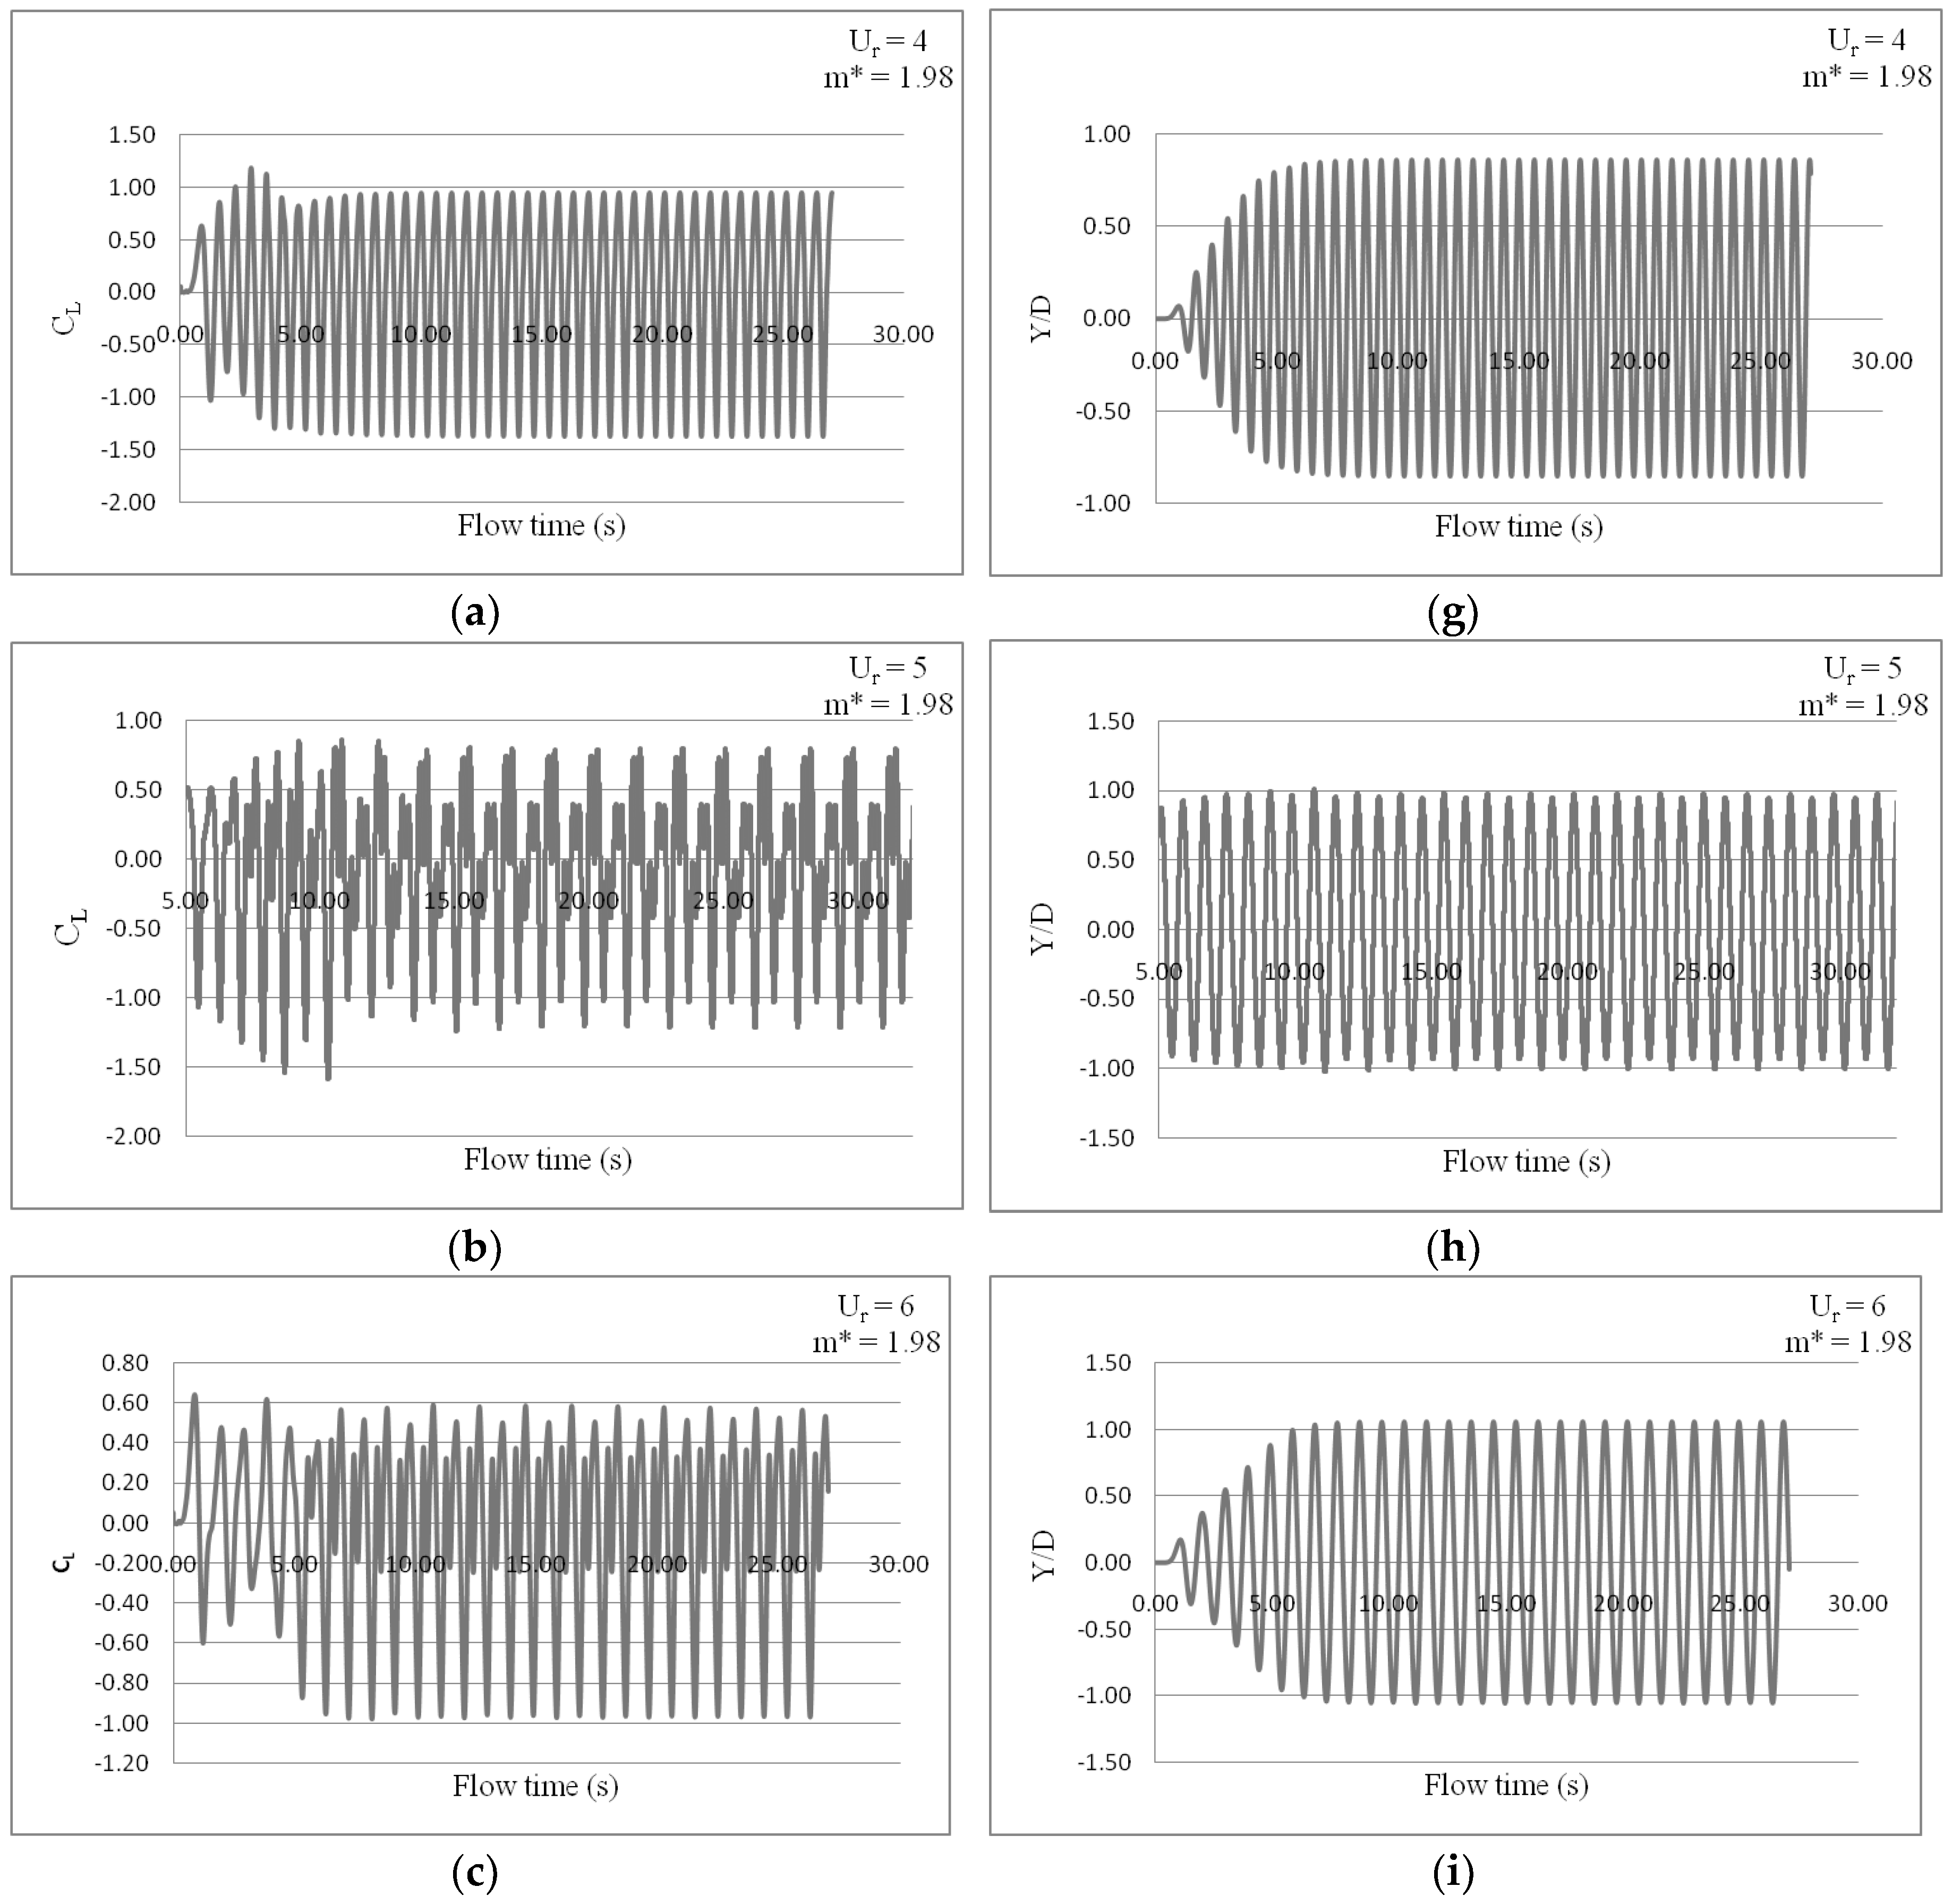
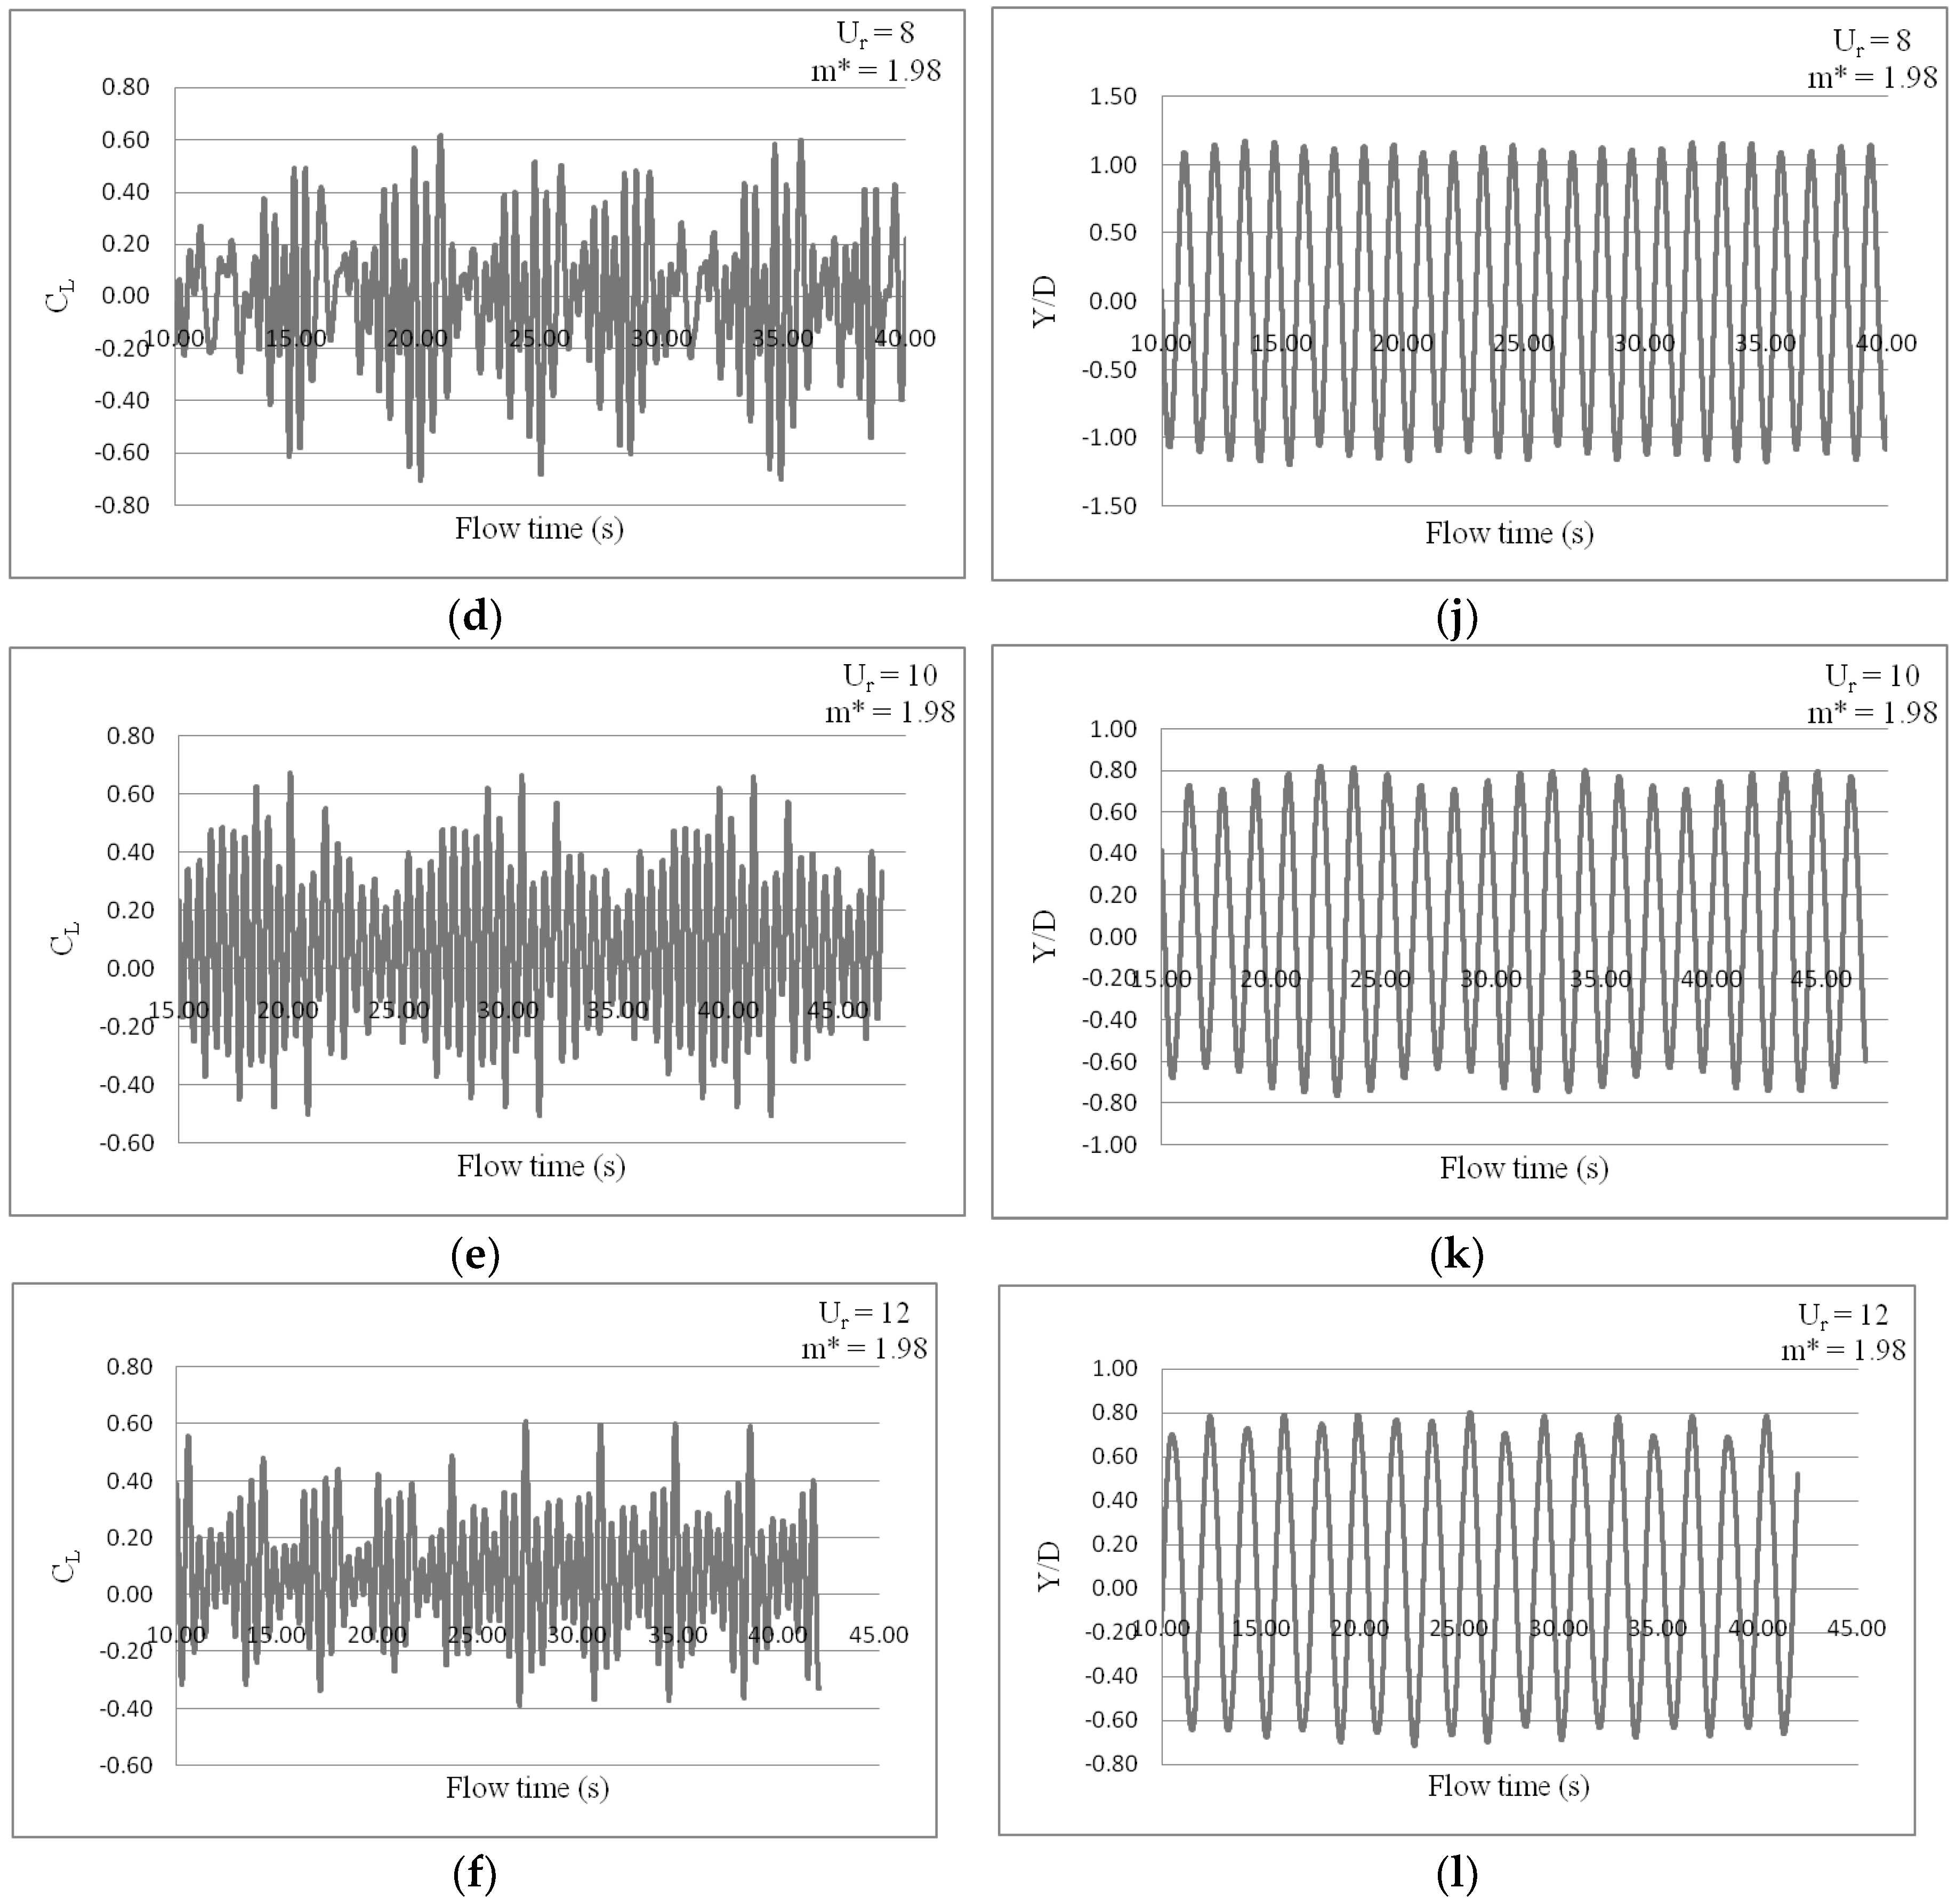
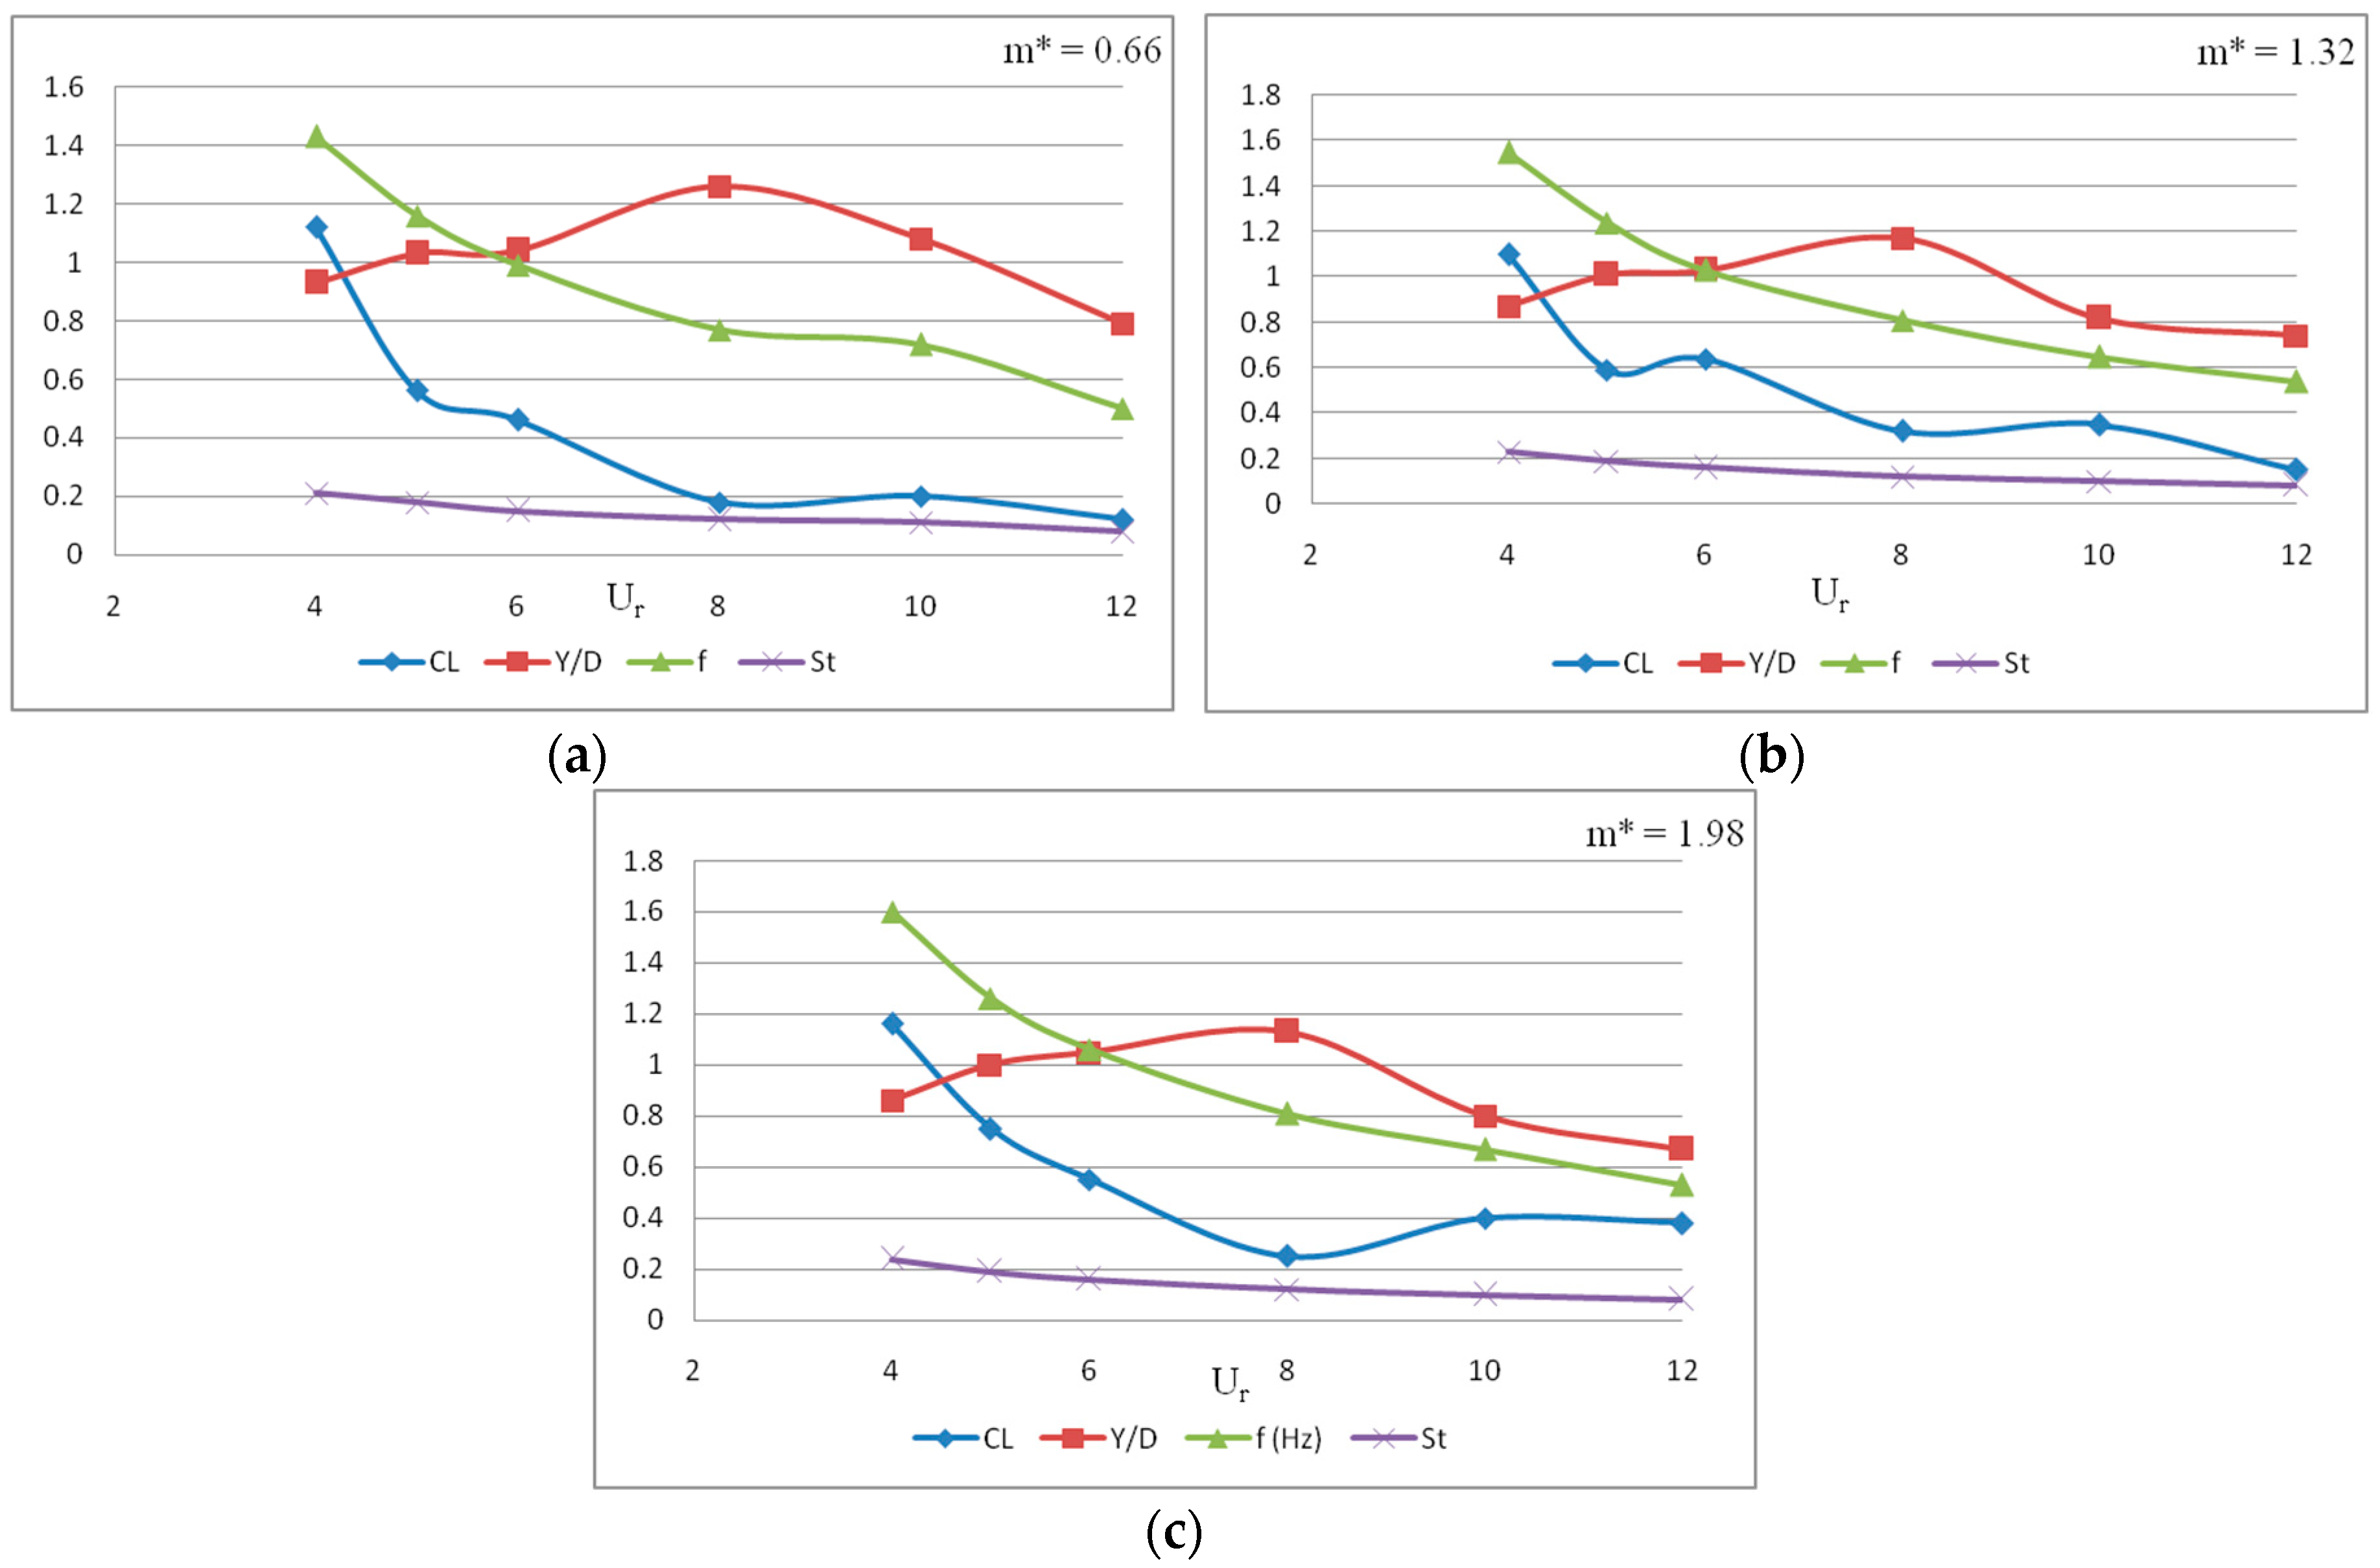
| m* = 1.98 | 4 | 1.16 | 0.86 | 1.6 | 1.04 | 0.24 | 2P Lift force oscillates about zero value once during one time period of oscillation of the cylinder. |
| 5 | 0.75 | 1.0 | 1.26 | 1.04 | 0.19 | 2P Lift force oscillates twice during one time period of oscillation of the cylinder. | |
| 6 | 0.55 | 1.05 | 1.06 | 1.03 | 0.16 | 2P Lift force oscillates twice during one time period of oscillation of the cylinder. | |
| 8 | 0.25 | 1.13 | 0.81 | 1.01 | 0.12 | 2P Lift force oscillates thrice during one time period of oscillation of the cylinder. | |
| 10 | 0.4 | 0.8 | 0.67 | 0.98 | 0.1 | 2P Lift force oscillates thrice during one time period of oscillation of the cylinder. Beat phenomenon is observed with time period 10.53 s. | |
| 12 | 0.38 | 0.67 | 0.53 | 1.04 | 0.08 | 2P Lift force oscillates 3.5 times during one time period of oscillation of the cylinder. | |
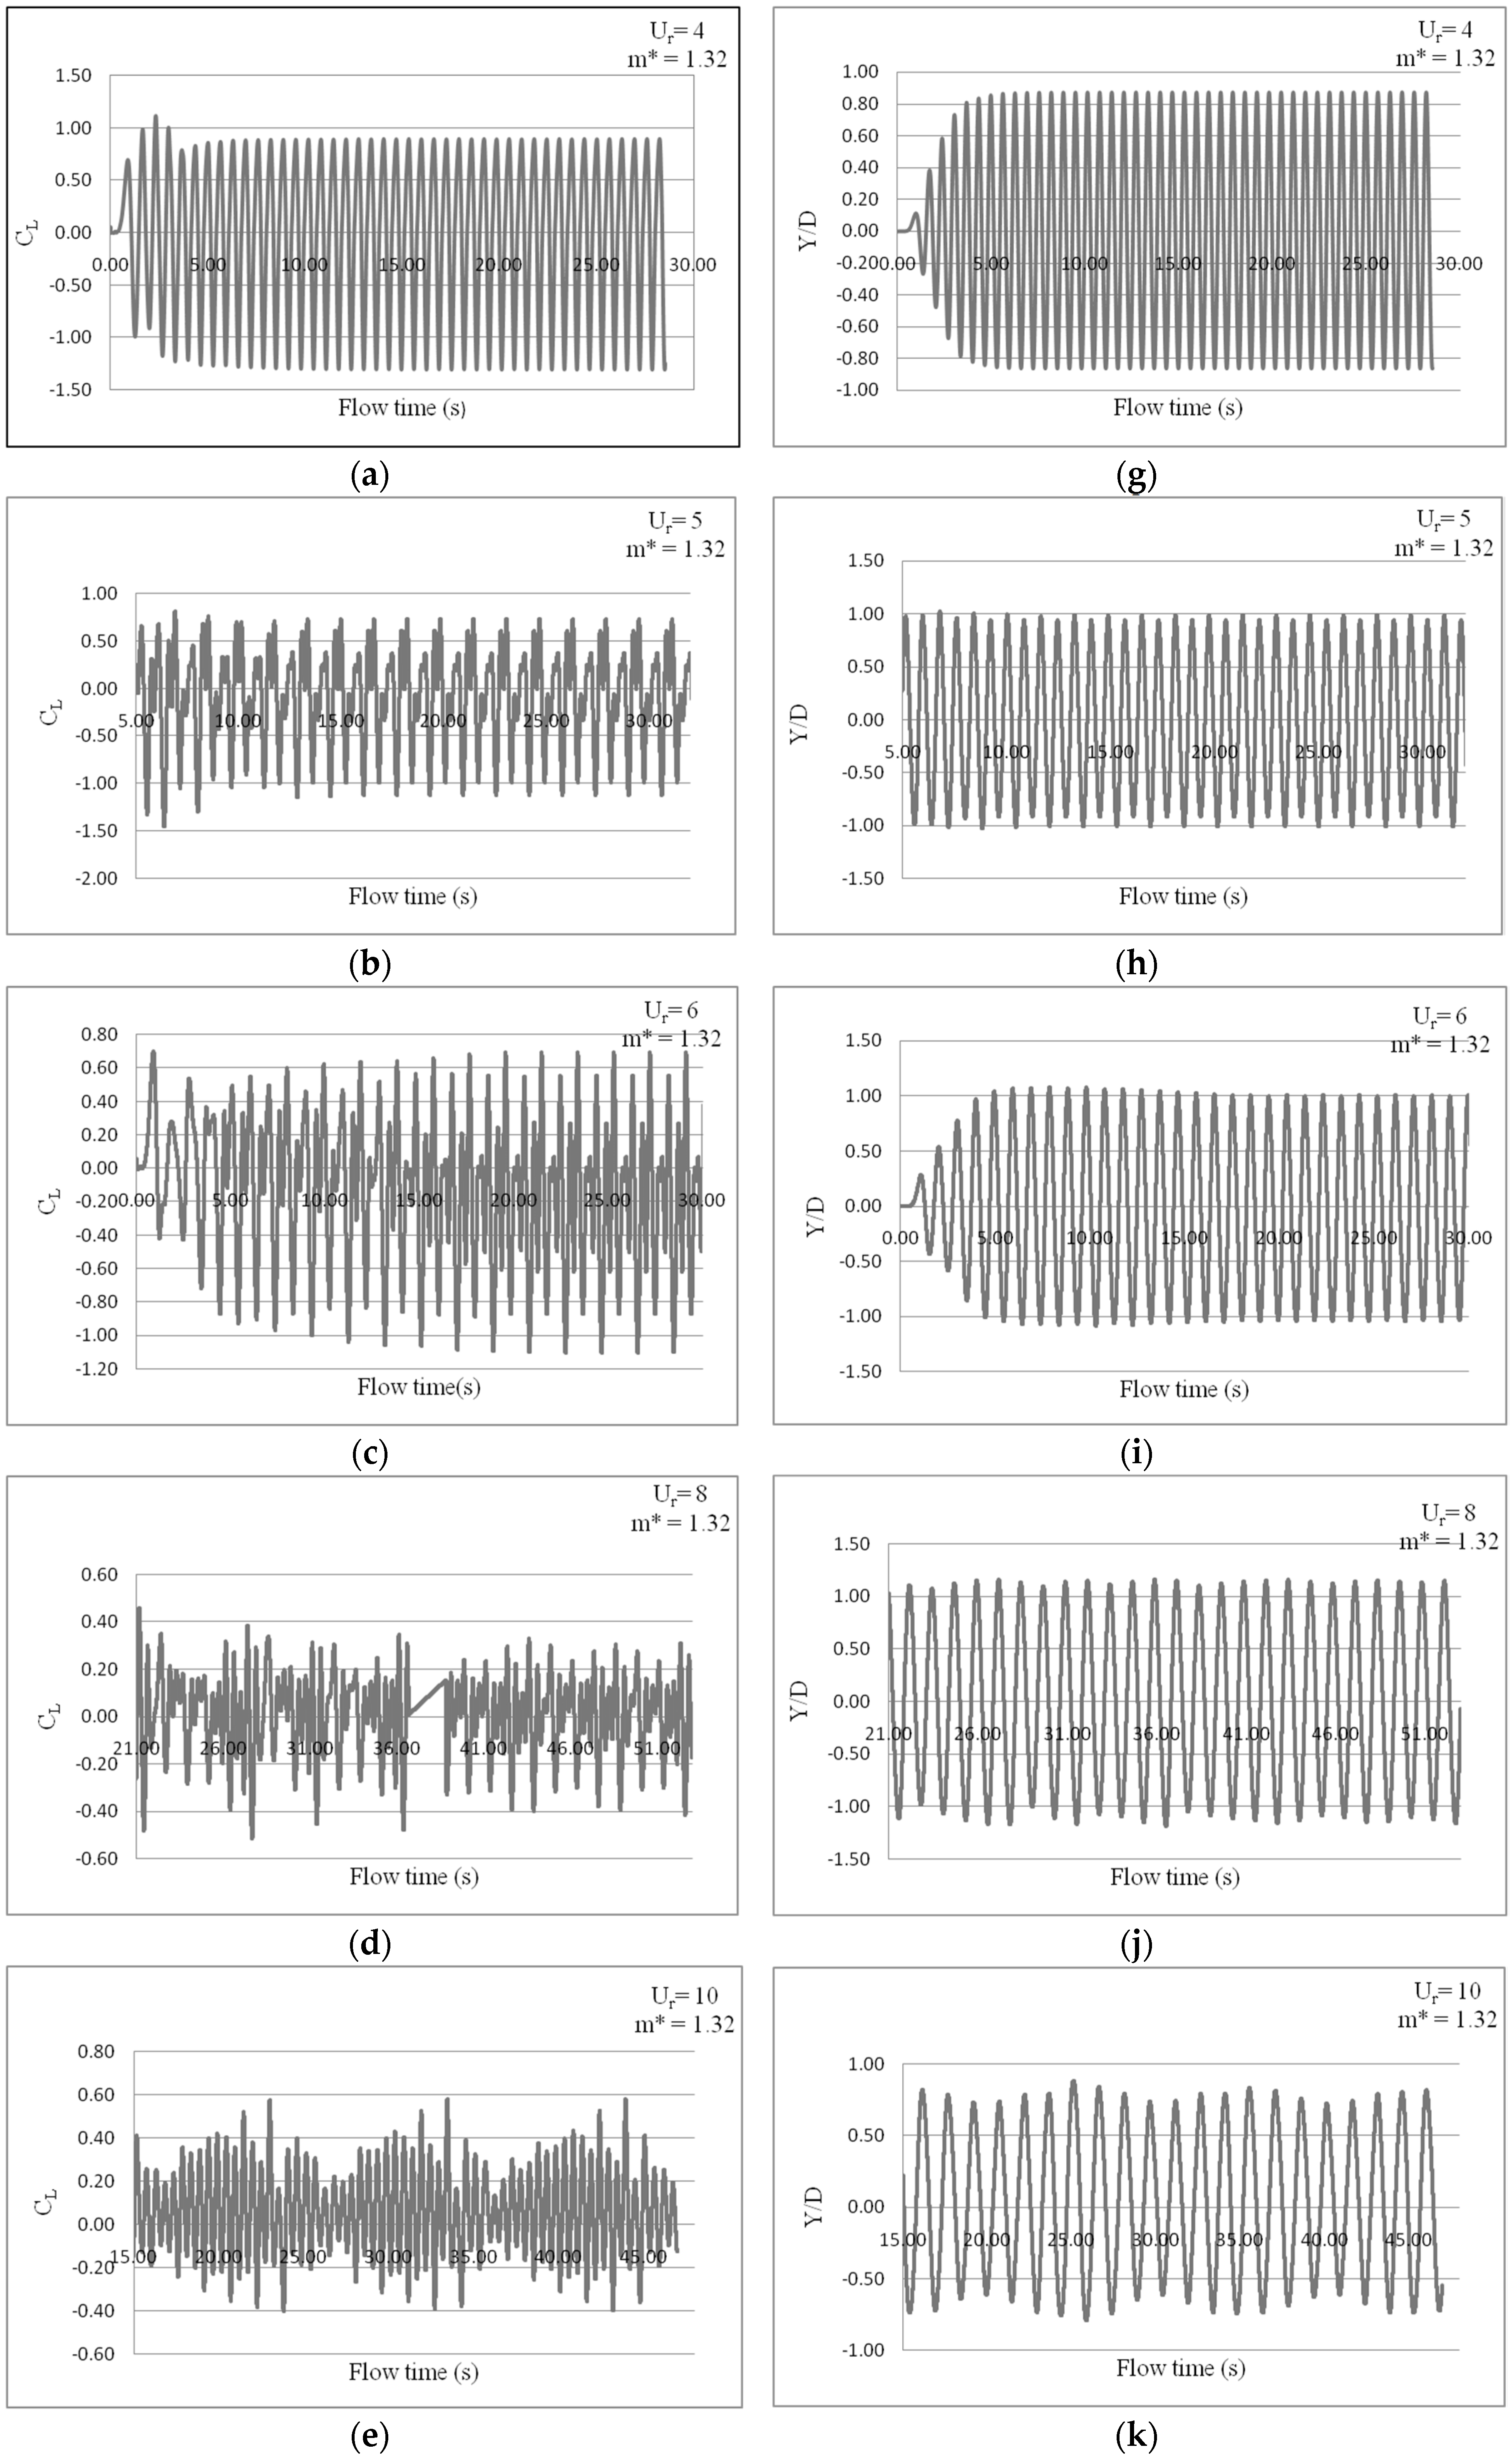
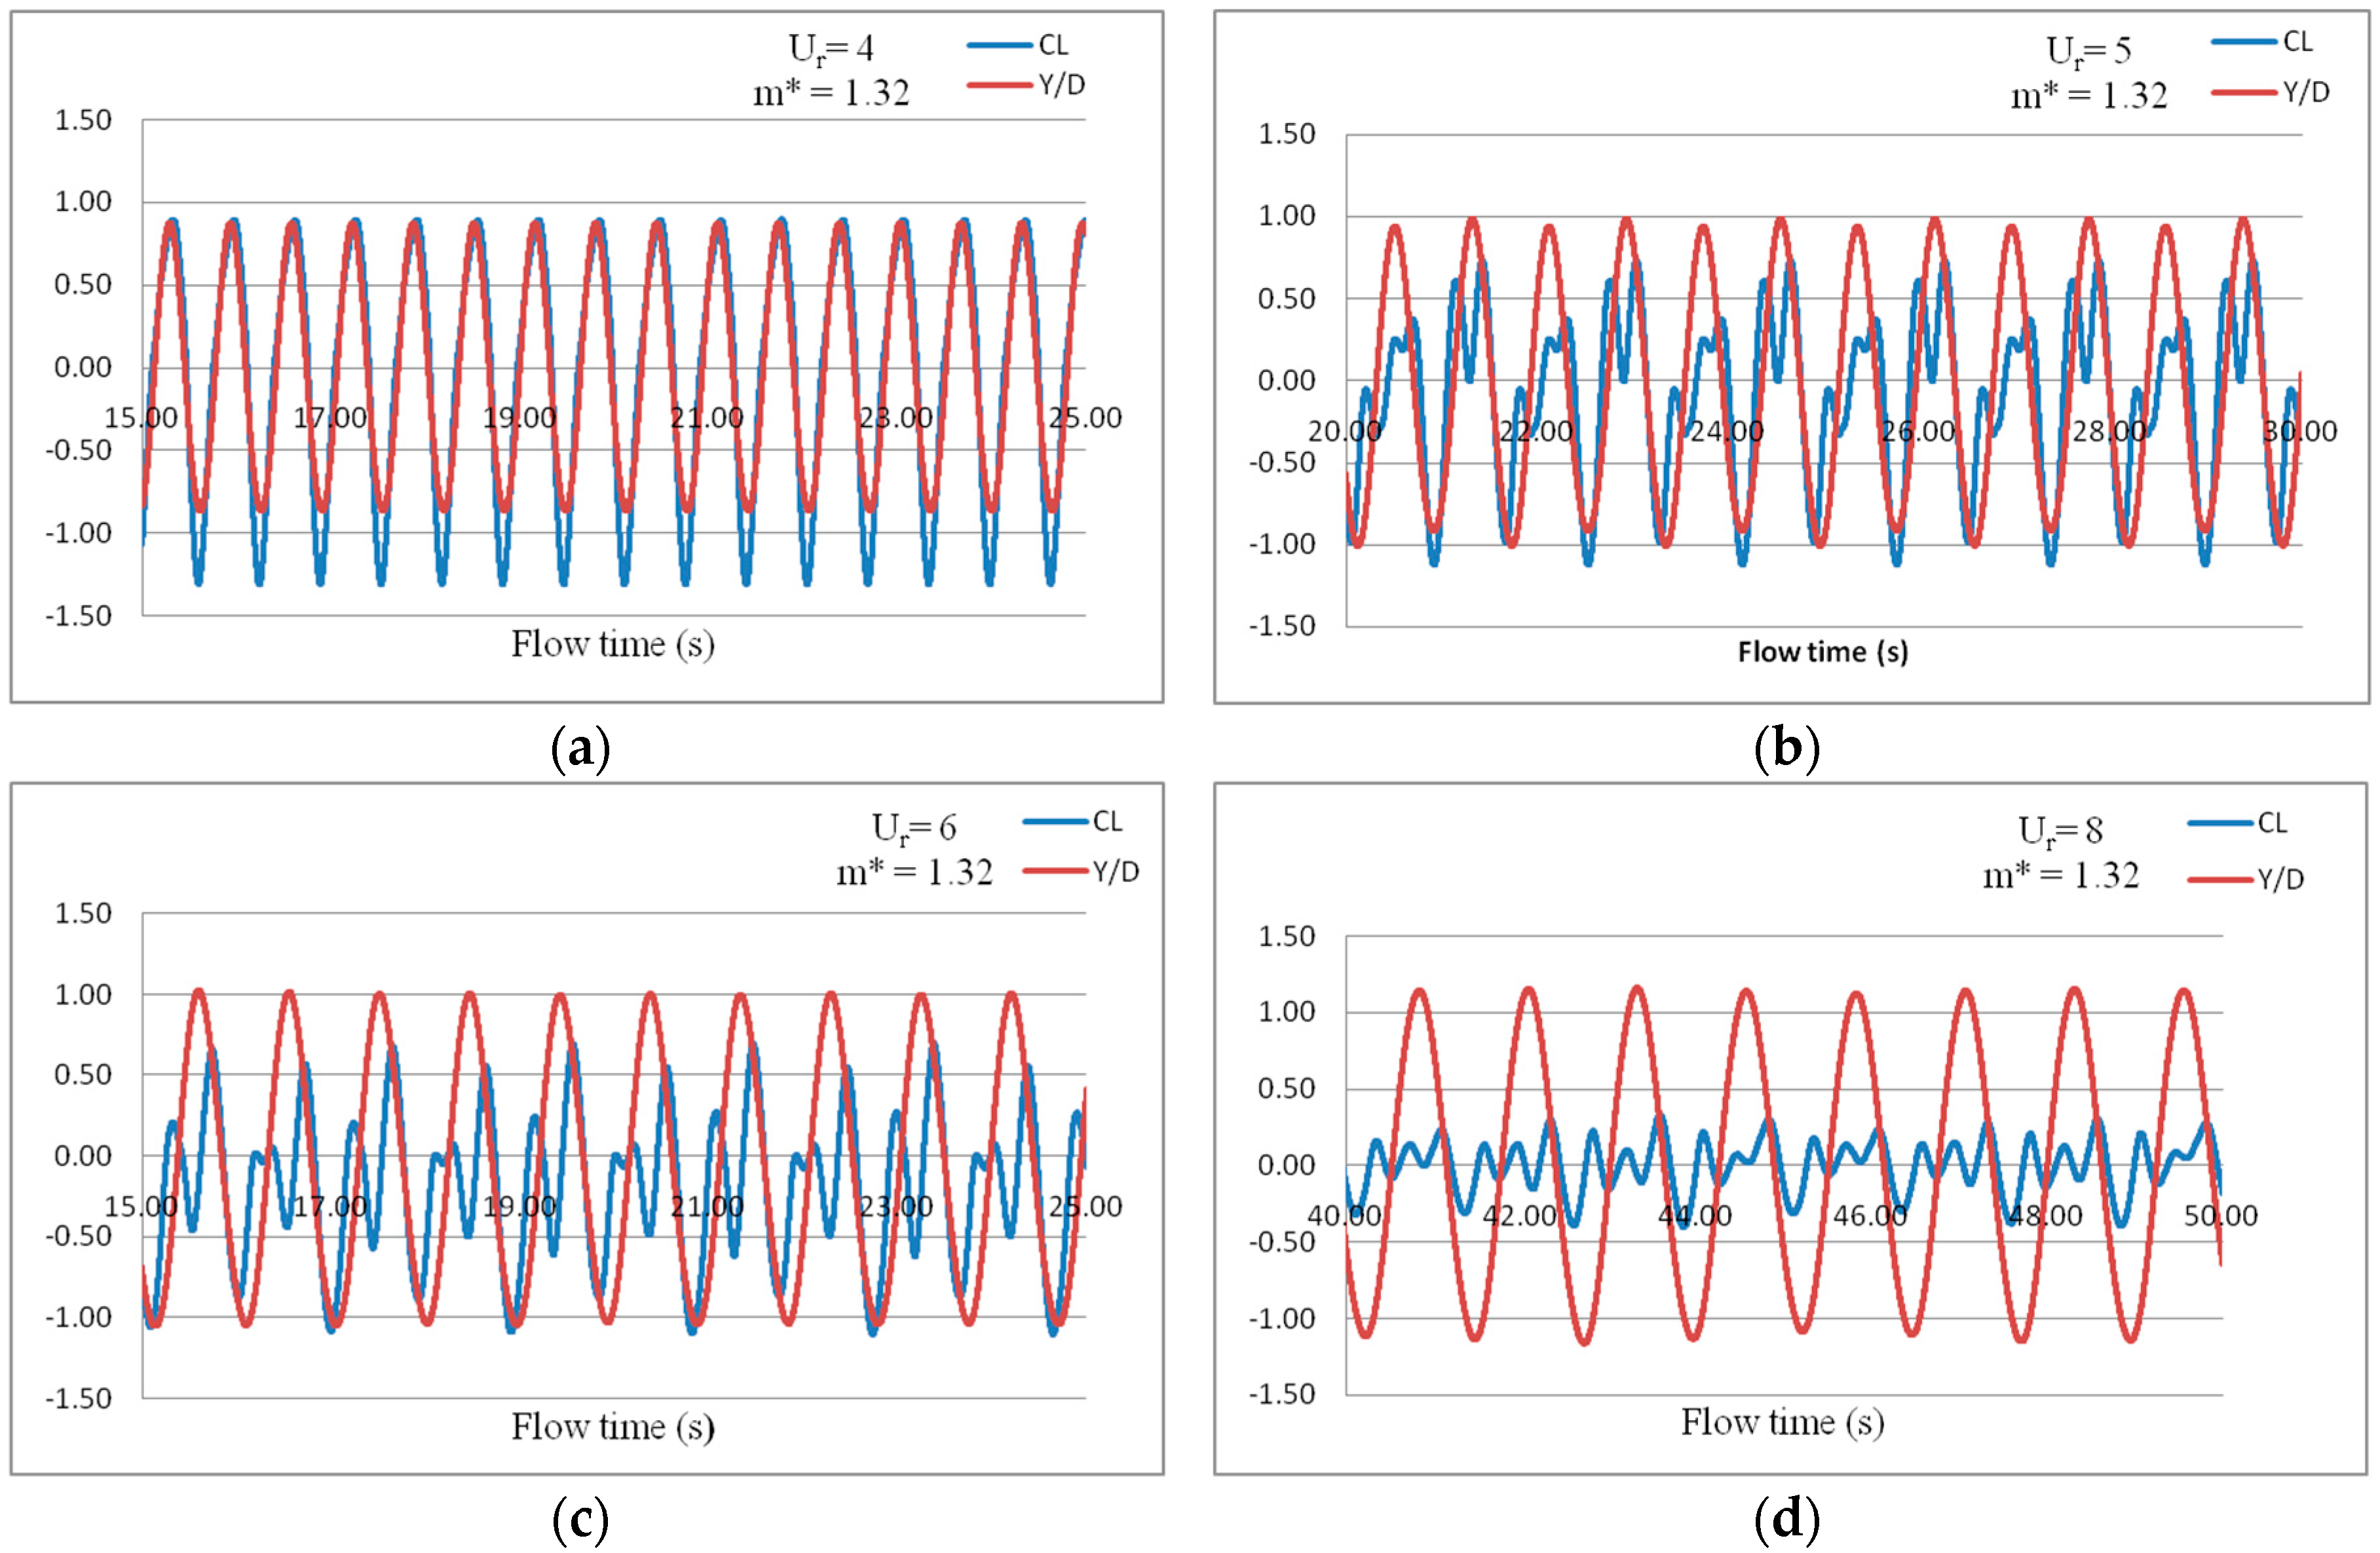
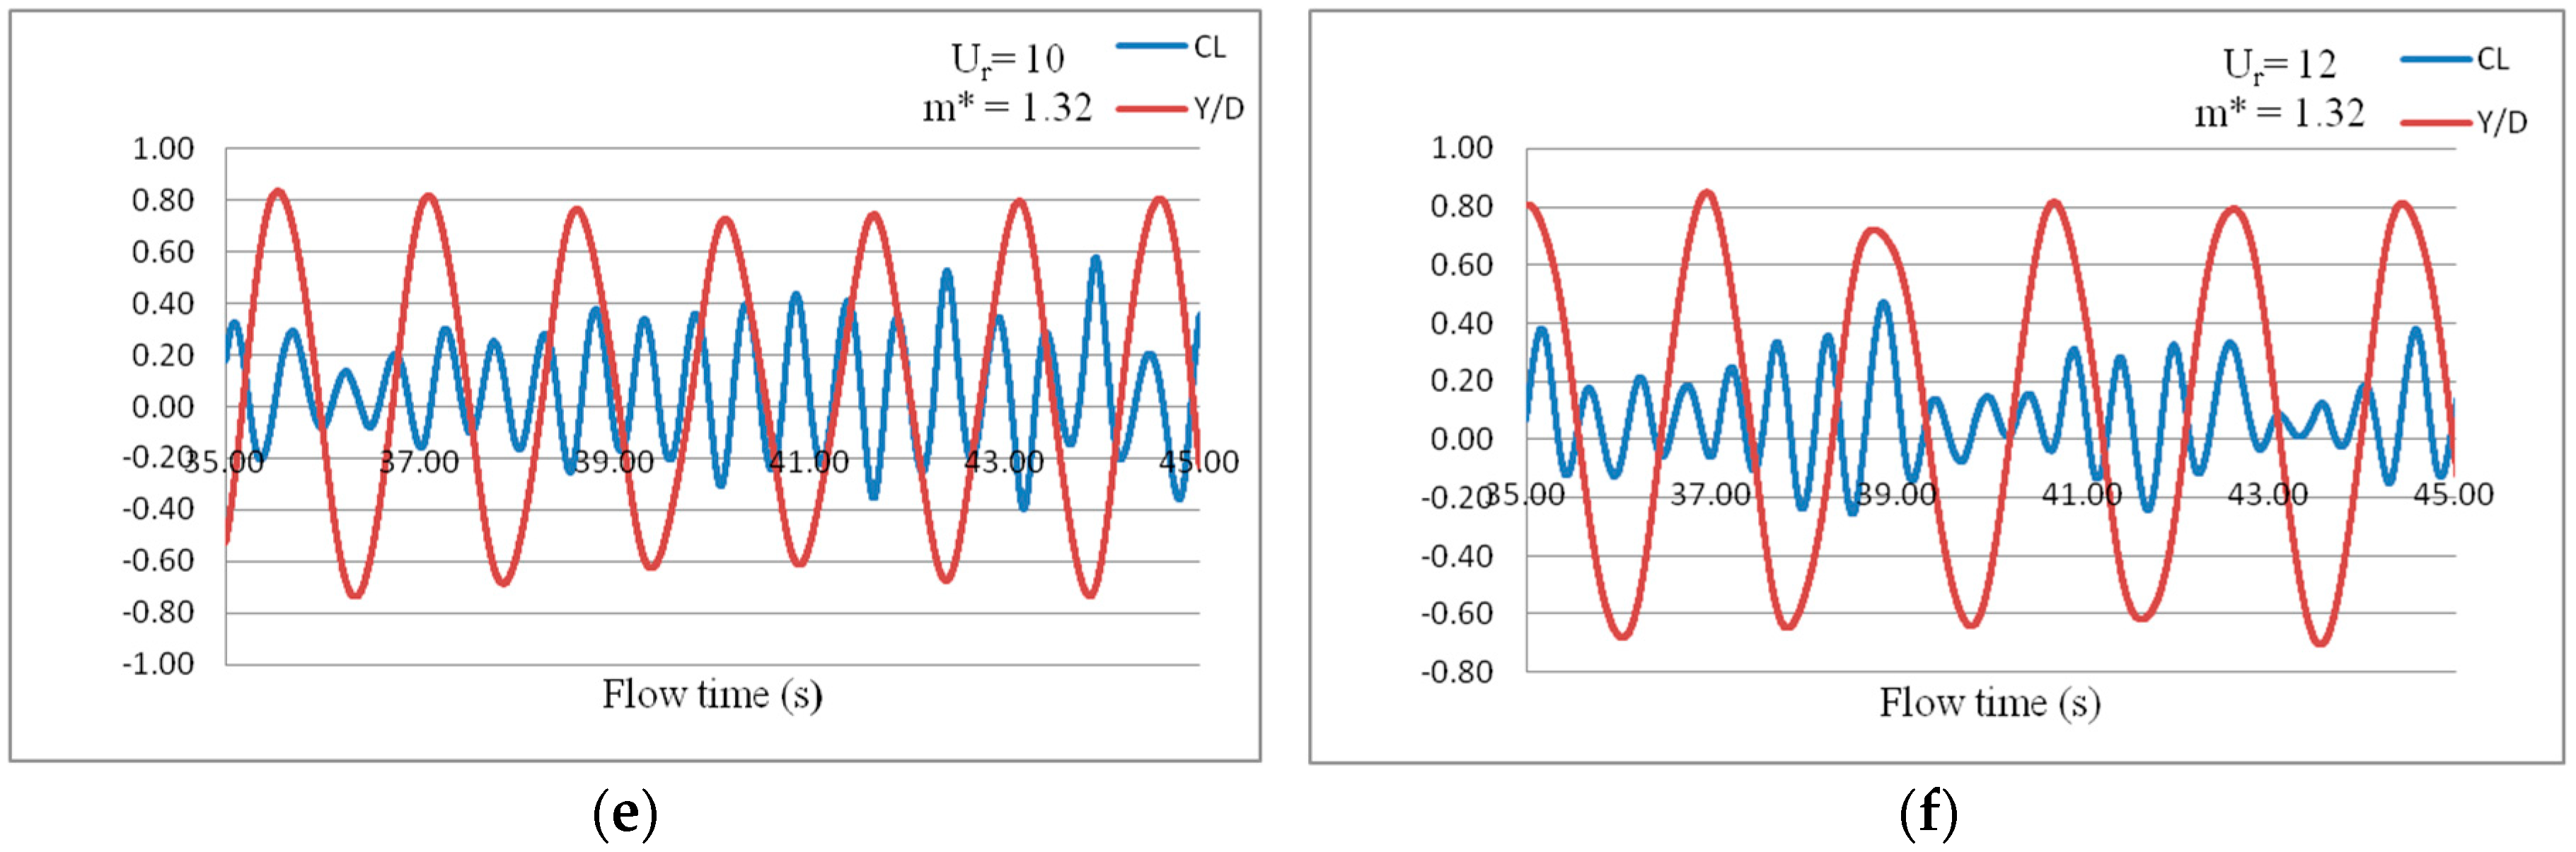
| m* = 1.32 | 4 | 1.1 | 0.87 | 1.55 | 1.07 | 0.23 | 2P Lift force oscillates about zero value once during one time period of oscillation of the cylinder. |
| 5 | 0.59 | 1.01 | 1.24 | 1.06 | 0.19 | 2P Lift force oscillates twice during one time period of oscillation of the cylinder. | |
| 6 | 0.64 | 1.03 | 1.03 | 1.06 | 0.16 | 2P Lift force oscillates twice during one time period of oscillation of the cylinder. | |
| 8 | 0.32 | 1.17 | 0.81 | 1.01 | 0.12 | 2P Lift force oscillates thrice during one time period of oscillation of the cylinder. | |
| 10 | 0.35 | 0.82 | 0.65 | 1.02 | 0.1 | 2P Lift force oscillates thrice during one time period of oscillation of the cylinder. Beat phenomenon is observed with time period 10.42 s. | |
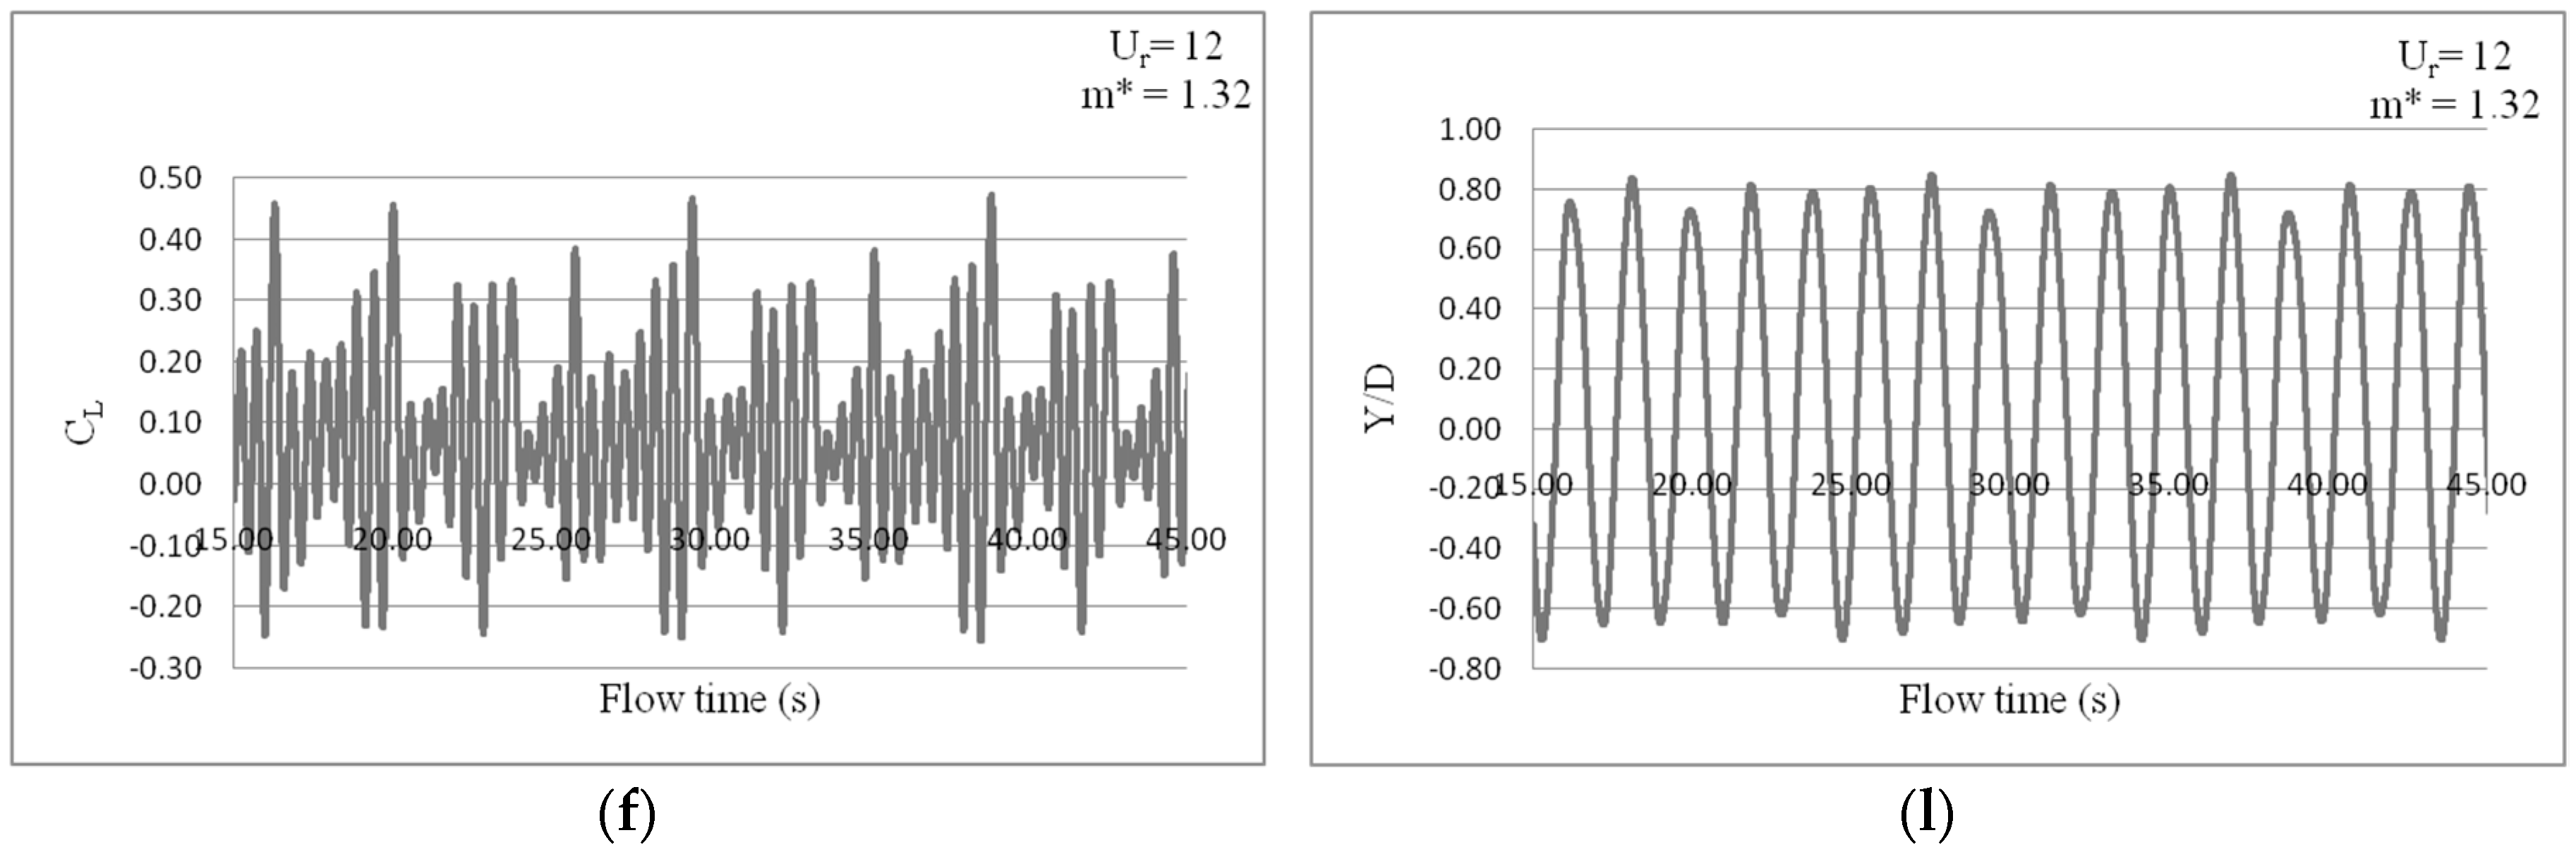
| 12 | 0.15 | 0.74 | 0.54 | 1.01 | 0.082 | 2P Lift force oscillates 3.5 times during one time period of oscillation of the cylinder. | |
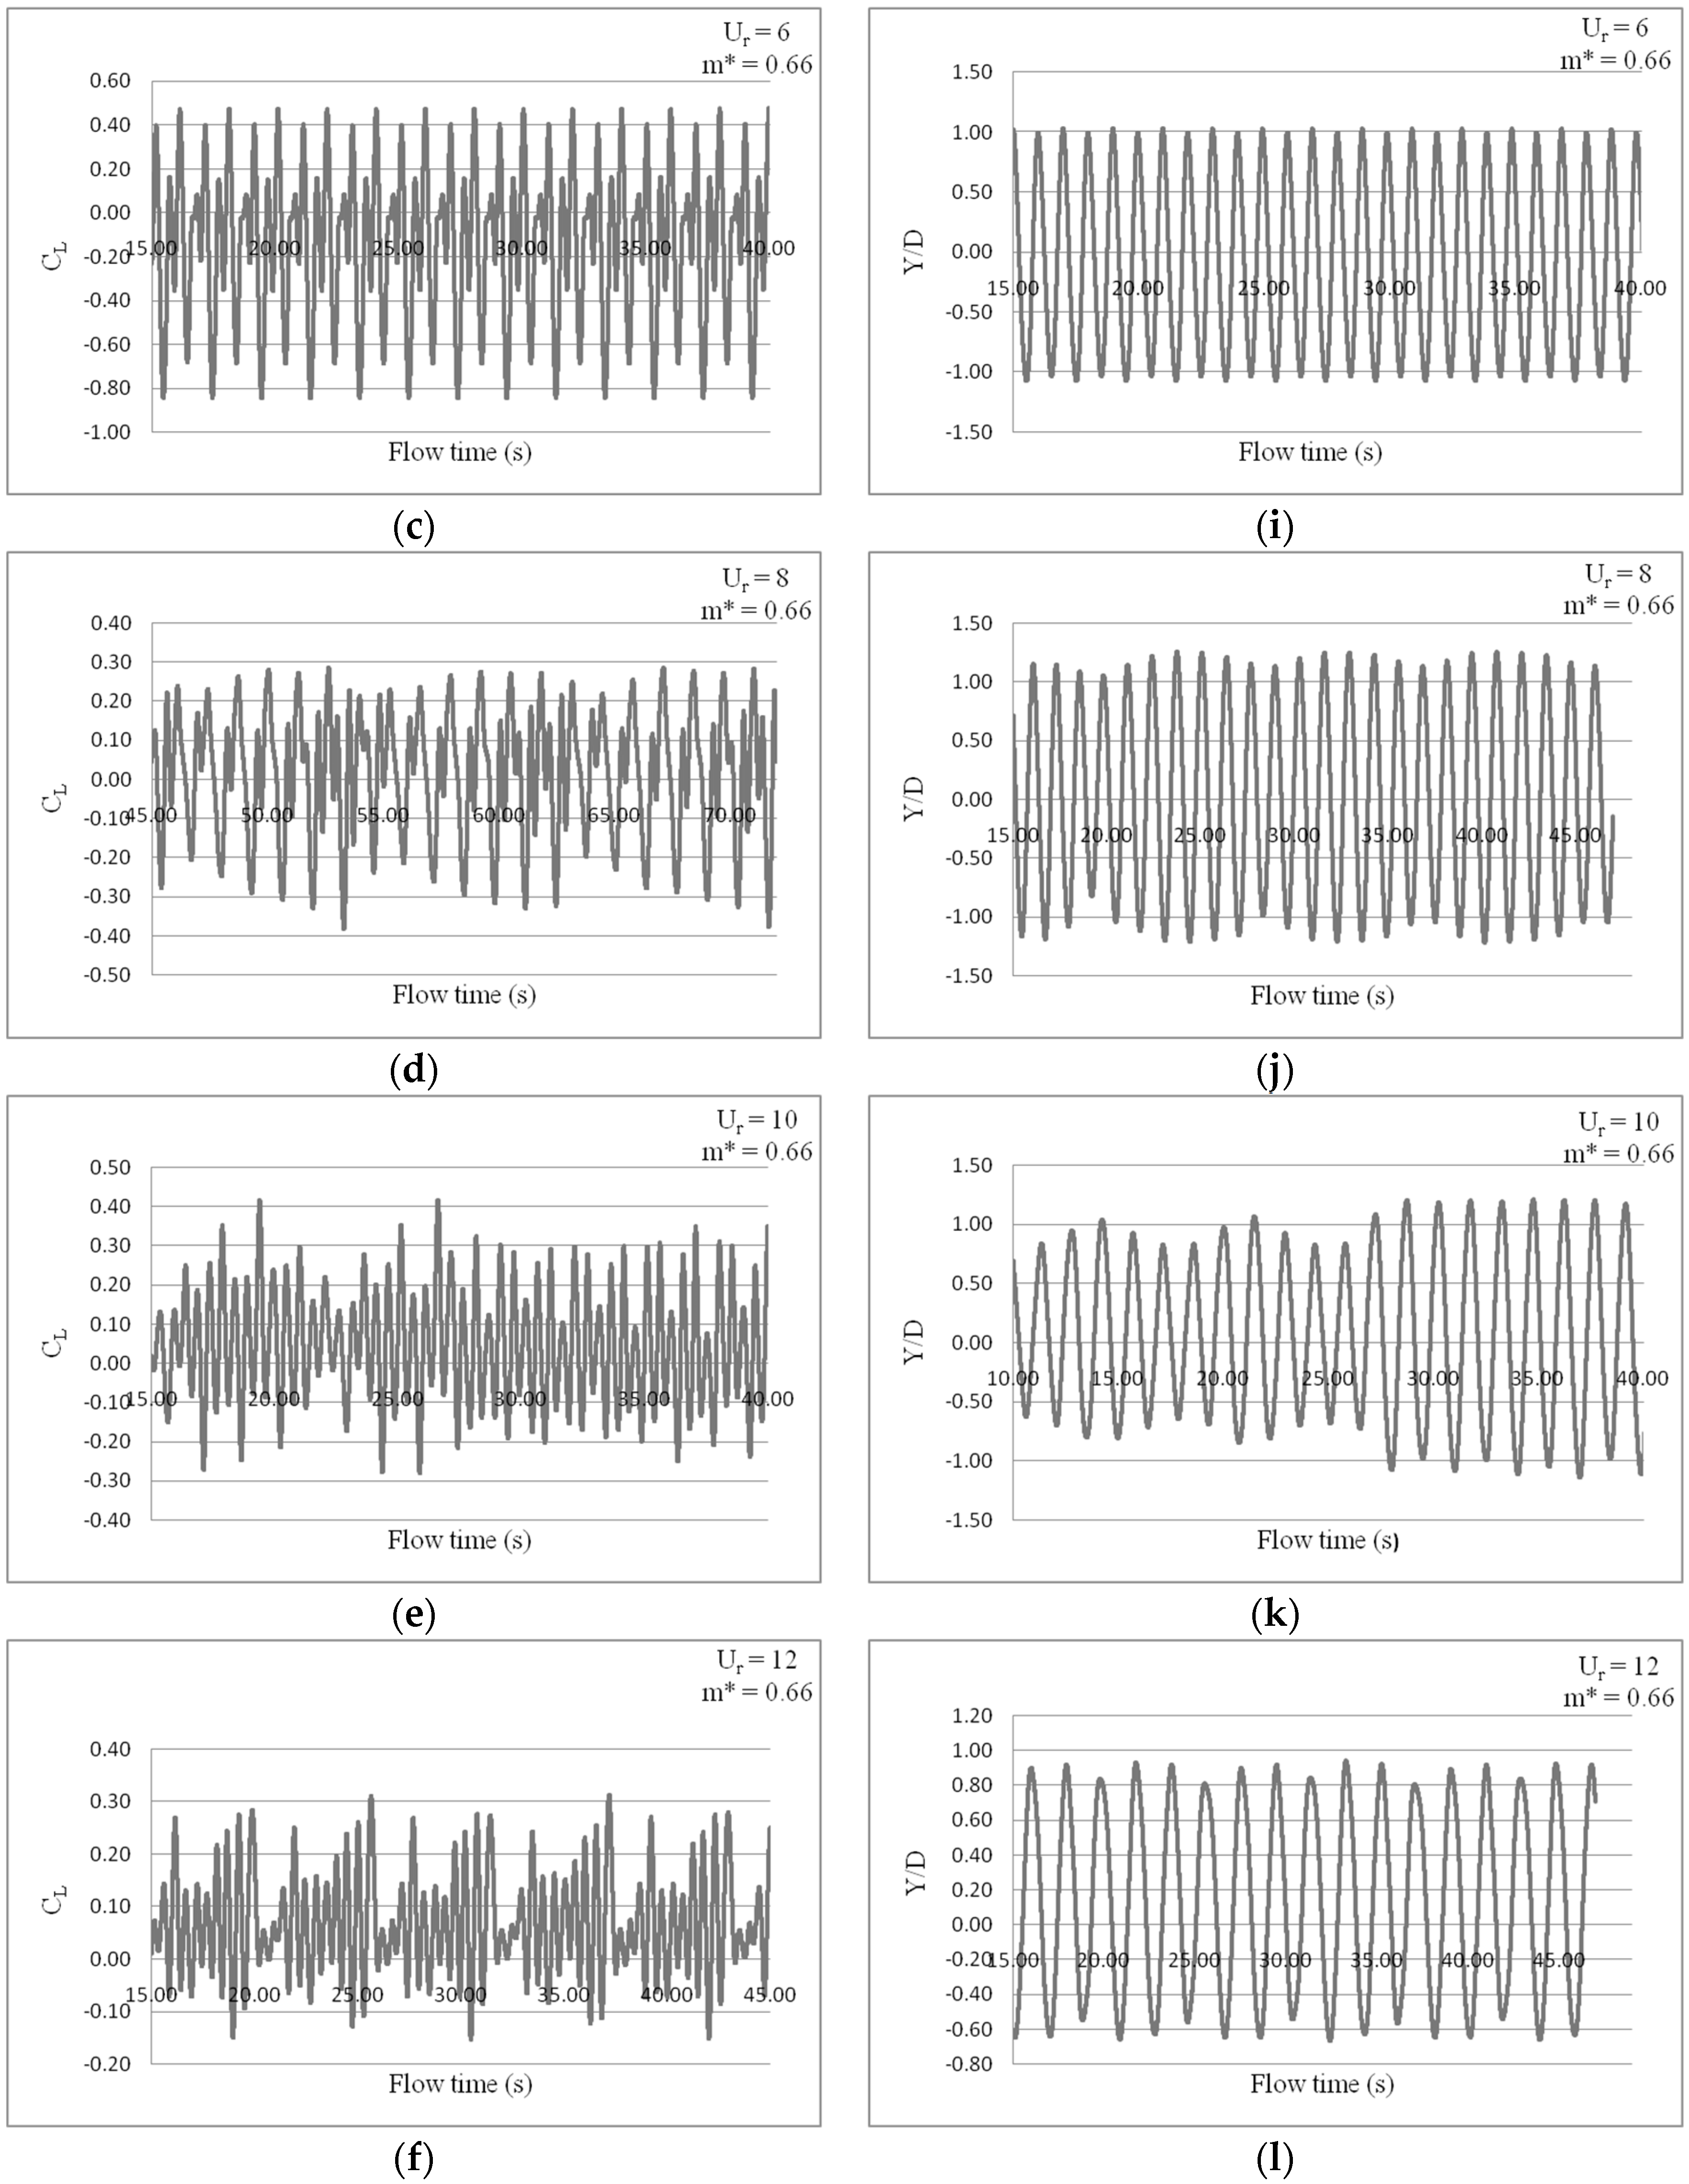
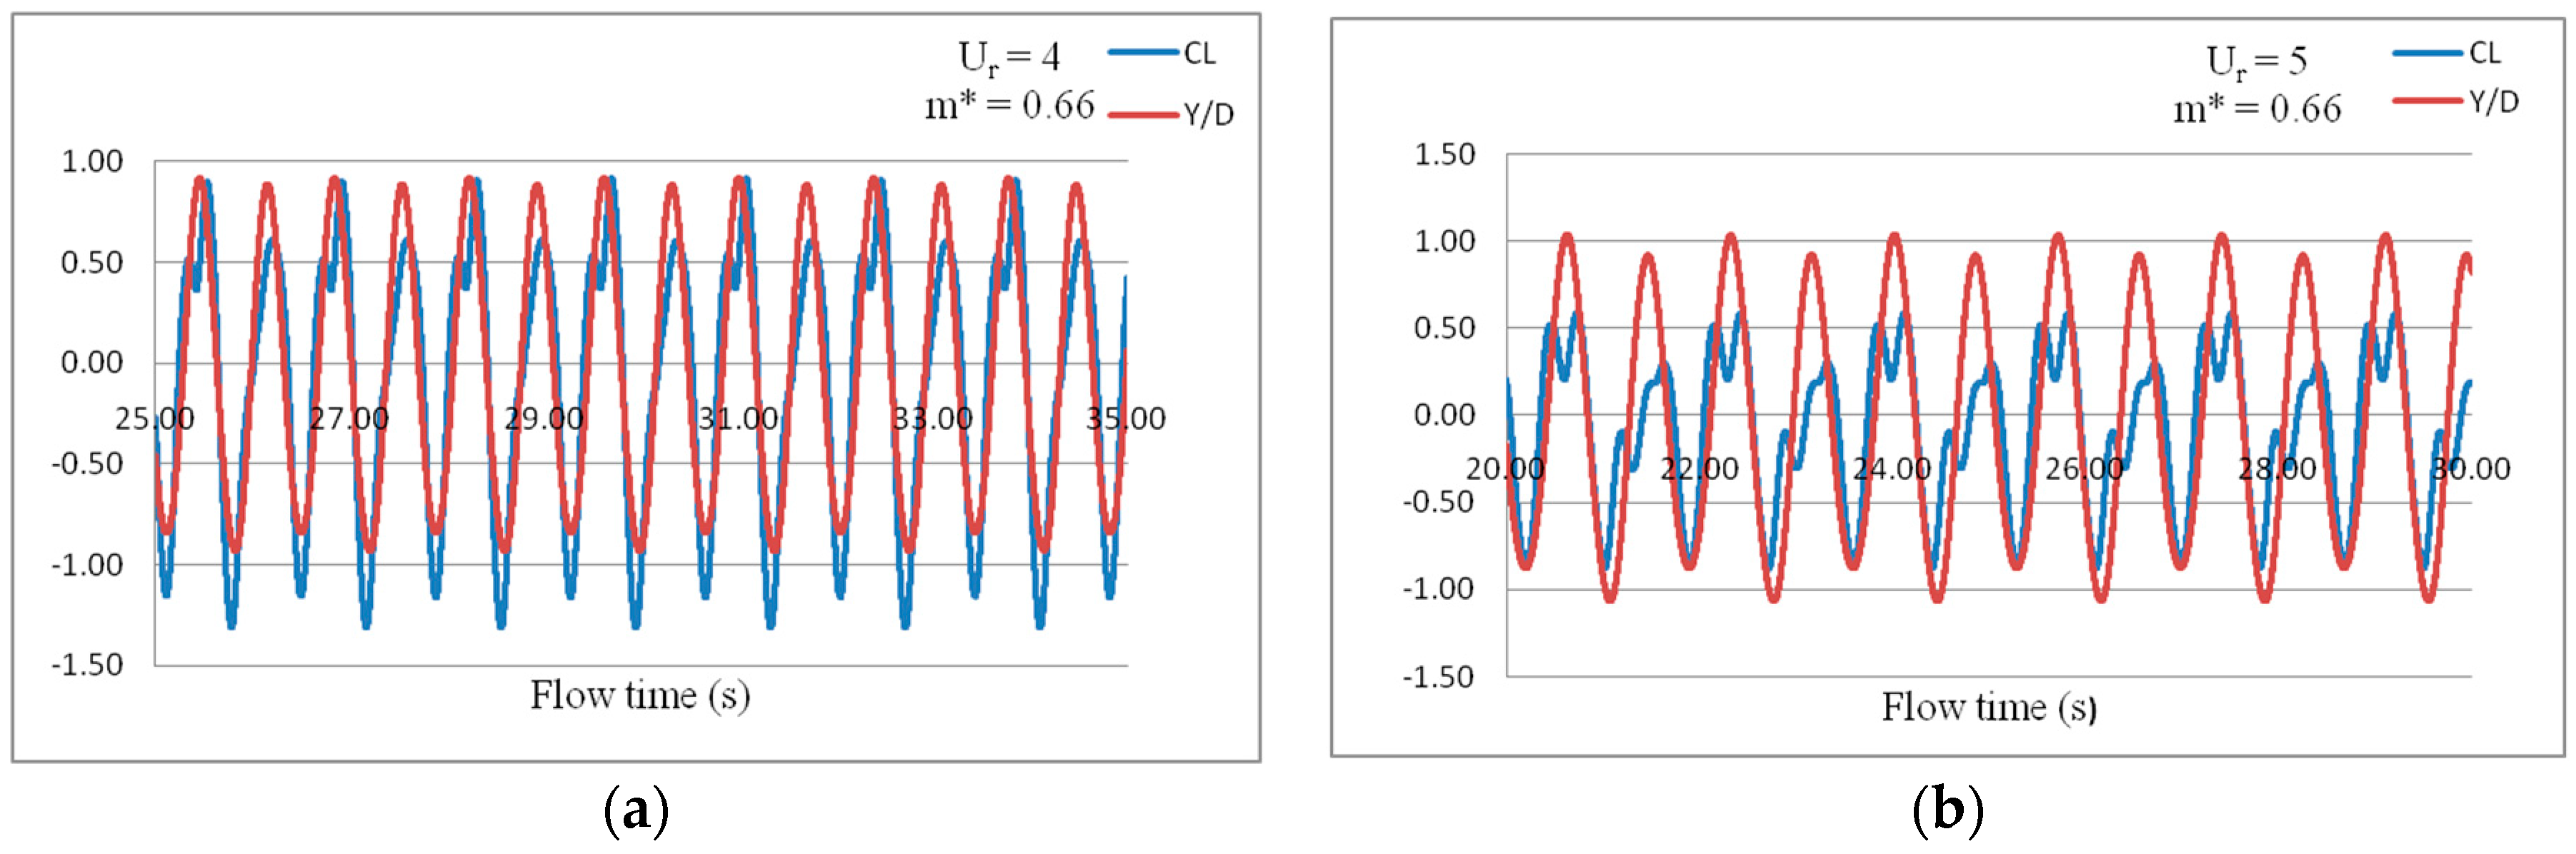
| m* = 0.66 | 4 | 1.12 | 0.93 | 1.43 | 1.14 | 0.21 | 2P Lift force oscillates about zero value once during one time period of oscillation of the cylinder. |
| 5 | 0.56 | 1.03 | 1.16 | 1.13 | 0.18 | 2P Lift force oscillates twice during one time period of oscillation of the cylinder. | |
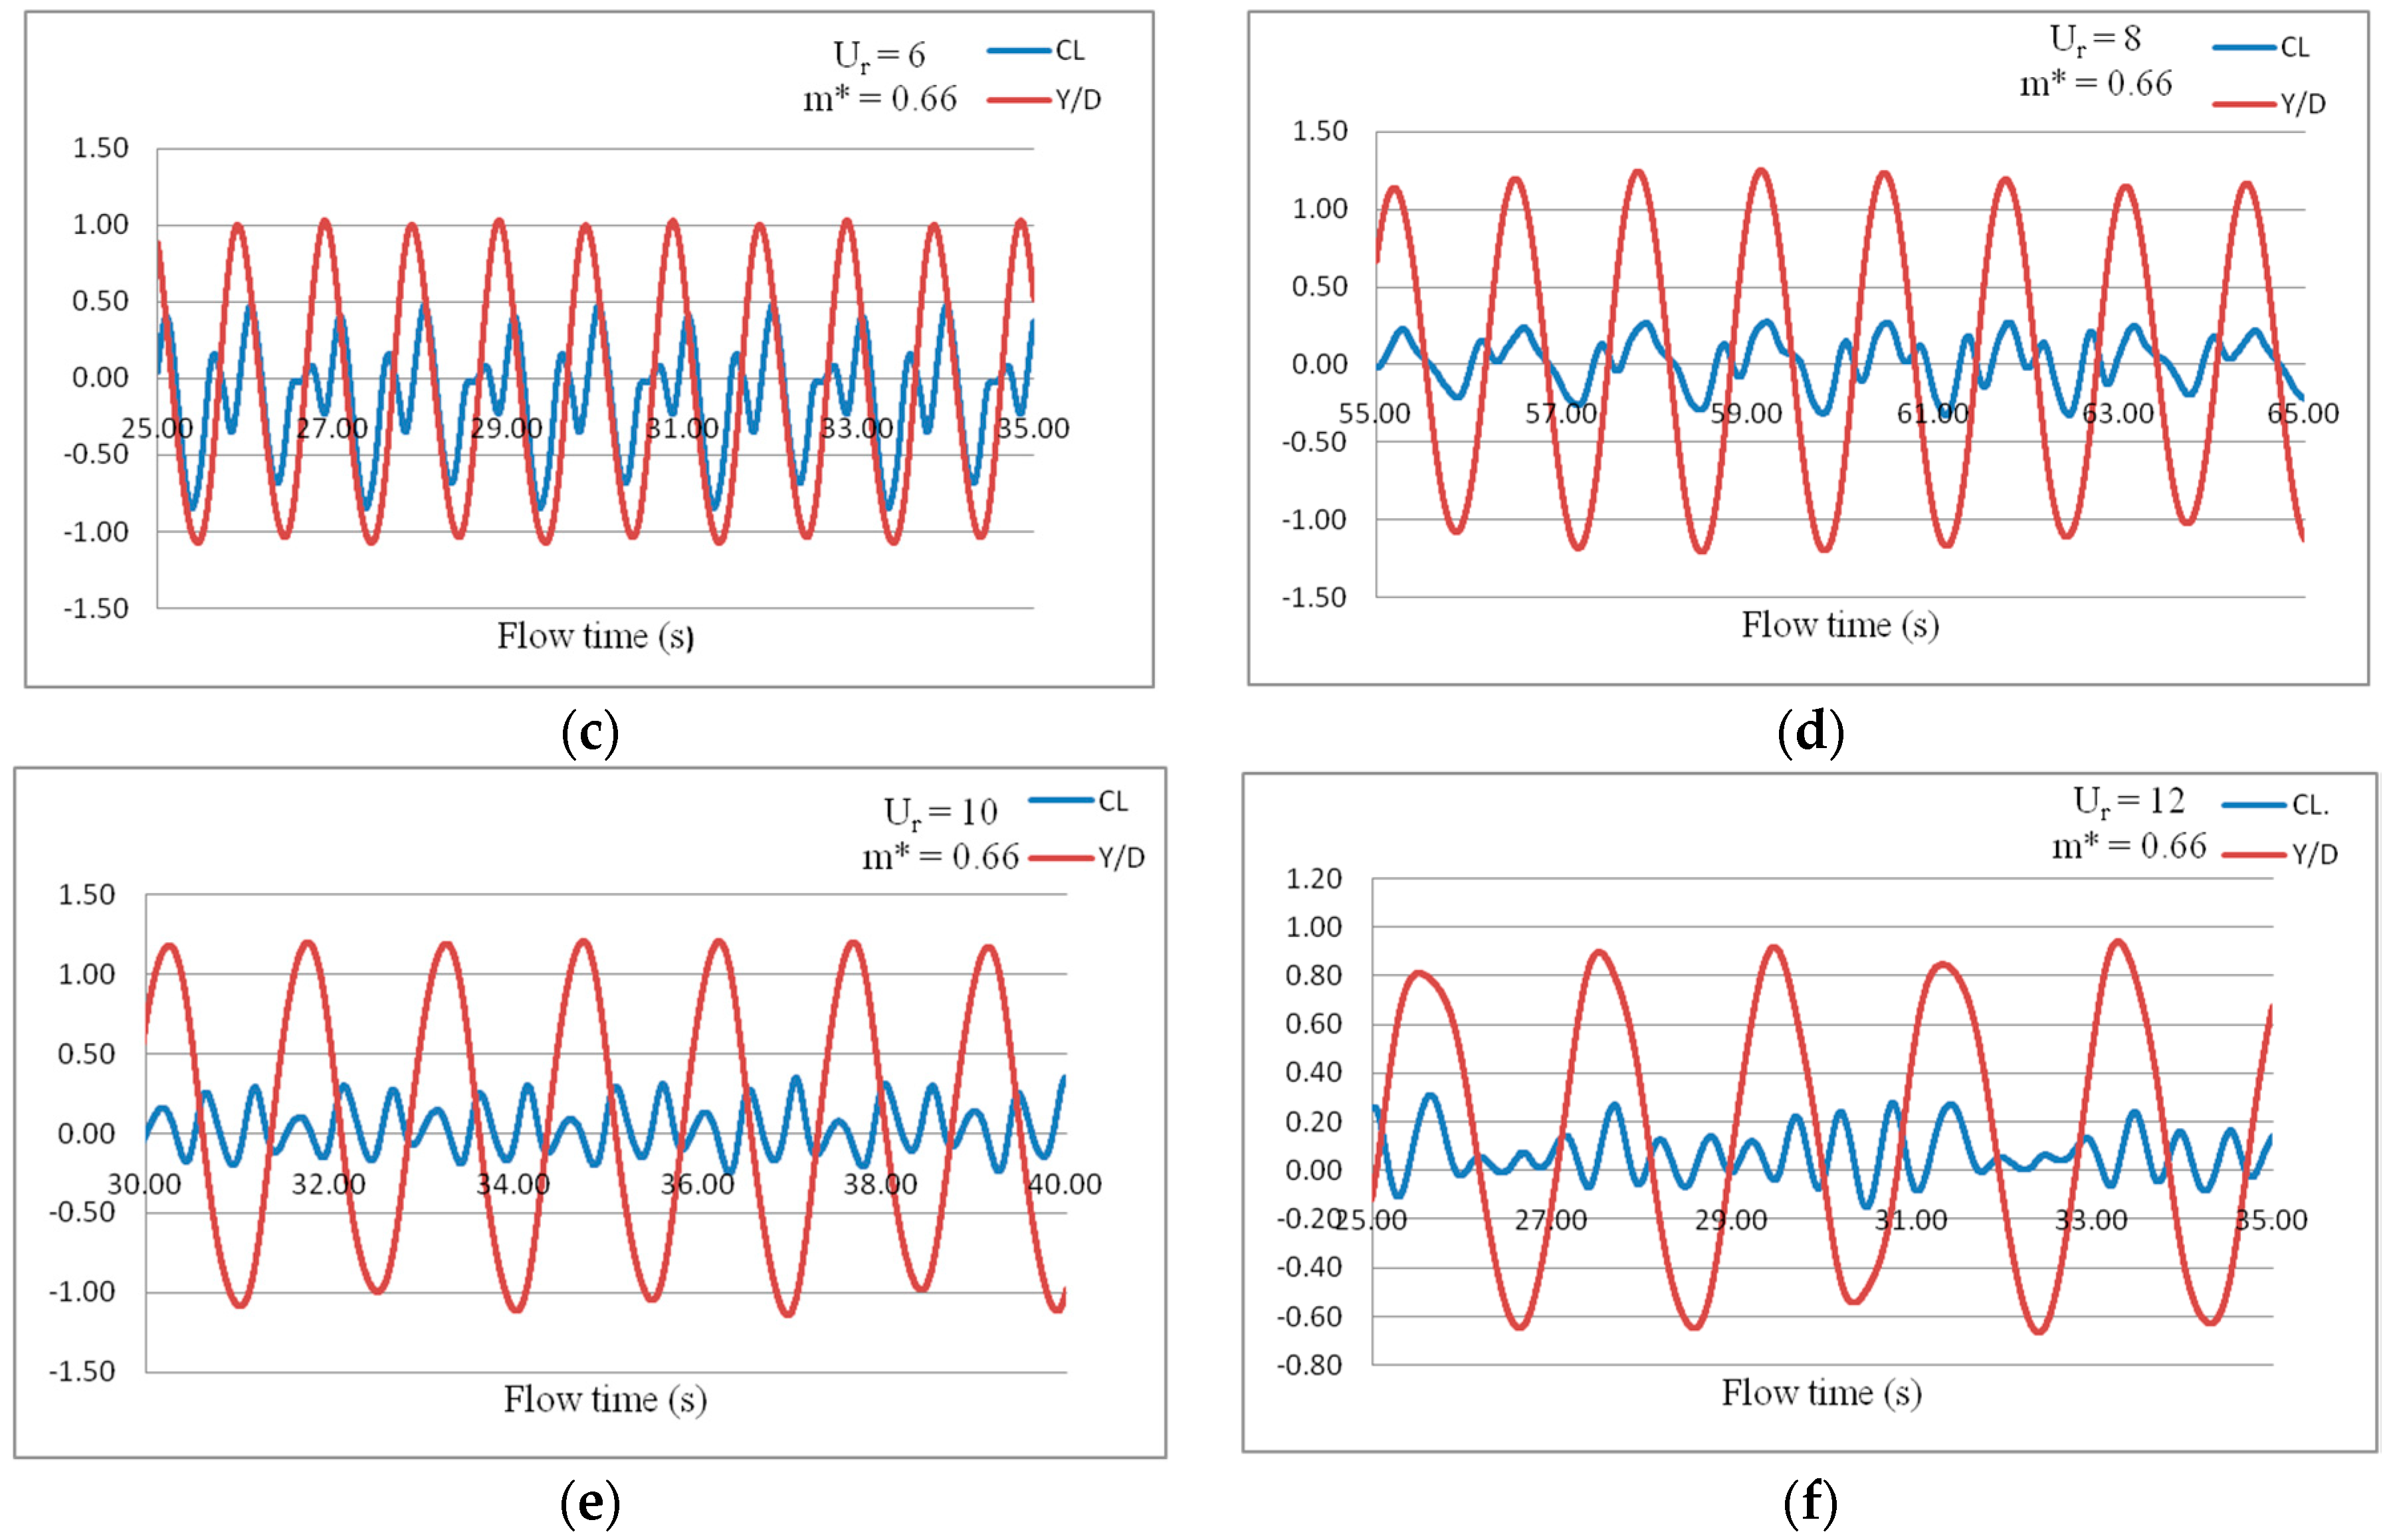
| 6 | 0.46 | 1.04 | 0.99 | 1.10 | 0.15 | 2P Lift force oscillates twice during one time period of oscillation of the cylinder. | |
| 8 | 0.18 | 1.26 | 0.77 | 1.06 | 0.12 | 2P Lift force oscillates thrice during one time period of oscillation of the cylinder. Beat phenomenon is observed with time period 7.84 s. | |
| 10 | 0.2 | 1.08 | 0.72 | 1.1 | 0.11 | 2P Lift force oscillates thrice during one time period of oscillation of the cylinder. No beat is observed. | |
| 12 | 0.12 | 0.79 | 0.5 | 1.1 | 0.08 | 2P Lift force oscillates 3.5 times during one time period of oscillation of the cylinder. |
| Re | m* | Ur | k* | CL | Y/D | Pavg (W) | |
|---|---|---|---|---|---|---|---|
| 3.8 × 10⁴ | 0.66 | 4 | 11.17 | 1.12 | 0.93 | 0.74 | 7.90 |
| 5 | 6.9 | 0.56 | 1.03 | 0.65 | 3.44 | ||
| 6 | 4.81 | 0.46 | 1.04 | 0.54 | 2.38 | ||
| 8 | 2.7 | 0.18 | 1.26 | 0.49 | 0.85 | ||
| 10 | 1.73 | 0.2 | 1.08 | 0.34 | 0.64 | ||
| 12 | 1.21 | 0.12 | 0.79 | 0.21 | 0.24 | ||
| 1.32 | 4 | 11.17 | 1.1 | 0.87 | 0.69 | 7.26 | |
| 5 | 6.9 | 0.59 | 1.01 | 0.63 | 3.55 | ||
| 6 | 4.81 | 0.64 | 1.03 | 0.54 | 3.28 | ||
| 8 | 2.7 | 0.32 | 1.17 | 0.46 | 1.40 | ||
| 10 | 1.73 | 0.35 | 0.82 | 0.26 | 0.86 | ||
| 12 | 1.21 | 0.15 | 0.74 | 0.19 | 0.28 | ||
| 1.98 | 4 | 11.17 | 1.16 | 0.86 | 0.69 | 7.57 | |
| 5 | 6.9 | 0.75 | 1 | 0.63 | 4.47 | ||
| 6 | 4.81 | 0.55 | 1.05 | 0.55 | 2.87 | ||
| 8 | 2.7 | 0.25 | 1.13 | 0.44 | 1.05 | ||
| 10 | 1.73 | 0.4 | 0.8 | 0.25 | 0.95 | ||
| 12 | 1.21 | 0.38 | 0.67 | 0.18 | 0.64 |
| Re | m* | Ur | k* | Yfield (cm) | Y/Dfileld | Y/Dnumerical |
|---|---|---|---|---|---|---|
| 3.8 × 10⁴ | 0.66 | 4 | 11.17 | 5.5 | 0.72 | 0.93 |
| 8 | 2.7 | 7.5 | 0.98 | 1.26 | ||
| 12 | 1.21 | 4.5 | 0.59 | 0.79 |
© 2018 by the authors. Licensee MDPI, Basel, Switzerland. This article is an open access article distributed under the terms and conditions of the Creative Commons Attribution (CC BY) license (http://creativecommons.org/licenses/by/4.0/).
Share and Cite
Chandran, V.; M., S.; Janardhanan, S.; Menon, V. Numerical Study on the Influence of Mass and Stiffness Ratios on the Vortex Induced Motion of an Elastically Mounted Cylinder for Harnessing Power. Energies 2018, 11, 2580. https://doi.org/10.3390/en11102580
Chandran V, M. S, Janardhanan S, Menon V. Numerical Study on the Influence of Mass and Stiffness Ratios on the Vortex Induced Motion of an Elastically Mounted Cylinder for Harnessing Power. Energies. 2018; 11(10):2580. https://doi.org/10.3390/en11102580
Chicago/Turabian StyleChandran, Vidya, Sekar M., Sheeja Janardhanan, and Varun Menon. 2018. "Numerical Study on the Influence of Mass and Stiffness Ratios on the Vortex Induced Motion of an Elastically Mounted Cylinder for Harnessing Power" Energies 11, no. 10: 2580. https://doi.org/10.3390/en11102580