Design and Optimization of Multiple Circumferential Casing Grooves Distribution Considering Sweep and Lean Variations on the Blade Tip

School of Aerospace Engineering, Tsinghua University, Beijing 100084, China
*
Author to whom correspondence should be addressed.
Energies 2018, 11(9), 2401; https://doi.org/10.3390/en11092401
Submission received: 18 August 2018
/
Revised: 8 September 2018
/
Accepted: 9 September 2018
/
Published: 11 September 2018
(This article belongs to the Special Issue Engineering Fluid Dynamics 2018)
Abstract
:This paper focuses on the design and optimization of the axial distribution of the circumferential groove casing treatment (CGCT). Effects of the axial location of multiple casing grooves on the flow structures are numerically studied. Sweep and lean variations are then introduced to the blade tip, and their influences on the grooves are discussed. The results show that the ability of the CGCT to relieve the blockage varies with the distribution of grooves, and the three-dimensional blading affects the performance of both the blade and the CGCT. Accordingly, a multi-objective optimization combining the CGCT design with the sweep and lean design is conducted. Objectives, including the total pressure ratio and the adiabatic efficiency, are set at the design point; meanwhile, the choking mass flow and the near-stall performance are constrained. The coupling between the CGCT and the blade is improved, which contributes to an optimal design point performance and a sufficient stall margin. The sweep and lean in the tip redistribute the spanwise and chordwise loading, which enhances the ability of the CGCT to improve the blade’s performance. This work shows that the present CGCT-blade integrated optimization is a practical engineering strategy to develop the working capacity and efficiency of a compressor blade while achieving the stall margin extension.
1. Introduction
The compressor of modern aero-engines has a high stage loading to fulfill the requirement of a high thrust–weight ratio. A high stage loading increases the potential risks of tip stall in some rotors [1]. A casing treatment is usually adopted to enhance the rotor’s stability when the stall margin of the tip-critical rotor is insufficient. Two types of casing treatment, namely, axial slots and circumferential grooves (see Figure 1), are commonly used. Although the circumferential groove casing treatment (CGCT) typically generates less stall margin improvement, it has a smaller efficiency penalty and greater mechanical integrity than axial slots [2,3]. Consequently, a CGCT is more practical than axial slots if the efficiency cannot be sacrificed.
The mechanism of a CGCT for extending the stall margin is relevant to the alteration of the flow structures near the blade tip. Rabe and Hah [4] conducted experimental and numerical investigations on a rotor with three different CGCT configurations. They found that the CGCT could reduce the incidence angle and suppress the flow separation. Müller et al. [5] simulated four CGCT configurations under both design and off-design conditions, and they noticed that the grooves segmented the tip leakage vortex (TLV) and alleviated the blockage, which delayed the spillage of the low-energy fluid from the leading edge of the adjacent blade. Sakuma et al. [6] studied the effects of a single circumferential groove with different axial locations on NASA Rotor 37. They concluded that the CGCT reduced both the tip loading and the momentum of the tip leakage flow.
The axial location of the circumferential grooves significantly affects the rotor’s performance. However, the design guidelines for the CGCT’s axial distribution have not been unified. Houghton and Day [7] examined the effects of a single circumferential groove at different axial locations. They reported that whereas the groove located at the 8% and 50% points of the axial tip chord length () achieved the maximum stall margin improvement, the groove near the leading edge, near the trailing edge, and at the 18% point of were inefficient. The research carried out by Du et al. [8] showed that the groove located between the 50% and 60% points of was the most effective for the stall margin extension; however, the groove located at approximately 20% point of was actually harmful to the rotor’s stability. Choi [9] tested a single casing groove at different positions. The groove installed near the leading edge was found to be the most effective for expanding the stable operating range with a small efficiency loss. The numerical study of Mao et al. [10] shows that a single groove located within the front 40% point of had obvious benefits to the efficiency and stall margin. Although the axial location of the CGCT plays a significant role in affecting the rotor’s performance and stability, there is not an acknowledged conclusion on this issue. Nevertheless, most of the previous studies used a single circumferential groove to simplify the analysis of the effects of the CGCT’s axial location on a stall. Those researchers [4,11,12] who used multiple grooves to seek a larger stall margin improvement and higher peak efficiency usually chose to adjust the depth and width of each groove while fixing their axial locations. Because the effects of multiple grooves are by no means a simple accumulation of the individual grooves’ effects [13], it is necessary to fill the gap between the single groove study and the practical application of multiple grooves. In this paper, efforts are made to design and optimize the axial distribution of multiple grooves, which also contributes to the understanding of the CGCT’s influences on the stall.
The benefits of a CGCT are obtained by altering the tip flow structures. The flow structures near the blade tip are also affected by the 3D shape of the blade. Researchers [14,15,16,17,18] have found that sweeps and leans can suppress the shockwave-boundary layer interaction, redistribute the spanwise loading, reduce the accumulation of the low energy fluids near the casing and impact the strength of the TLV and the secondary flow. Thus, the three-dimensional (3D) blade design is supposed to interact with the CGCT design. Houghton and Day [7] proposed the idea combining the casing treatment design with the blade design to maximize the effectiveness of the casing treatment. Recently, Hah [19] studied the inner workings of axial slots and suggested that casing treatments could be designed by optimizing the casing groove shape and the blade loading near the tip. However, the topic of the CGCT-blade integrated design or optimization has been rarely studied in the open literature. It is noteworthy that only Kim et al. [11] and Goinis and Nickle [20] have done some pioneer work in this field. Moreover, with the increasing use of 3D blading techniques in modern compressor rotors and fans, the CGCT design should consider the interactions between the grooves and a swept or leaned blade. With this motivation, effects of the sweep and lean on the CGCT design are studied in this paper. The CGCT-blade integrated optimization is further performed to achieve an ideal CGCT-blade combination.
This paper is organized as follows. First, the numerical methods are described and validated. Second, the flow fields of the baseline blade with different CGCTs are simulated and compared. Third, the sweep and lean are introduced to the blade tip. The performance of the modified blade with the CGCT is predicted, and the influences of the 3D blading on the CGCT design are discussed. Finally, the CGCT-blade integrated optimization is conducted. By this process, an optimal CGCT-blade combination is obtained. The mechanism by which the sweep and lean variations affect the effectiveness of CGCT is revealed.
2. Parameterization of the Blade and CGCT
The compressor studied in this paper is the Notre Dame Transonic Axial Compressor (ND-TAC) that has been experimentally tested at the University of Notre Dame. The details of the experimental setup can be found in the papers of Cameron et al. [21] and Kelly et al. [22]. The parameters of the original rotor blade are listed in Table 1.
At the full rotational speed, the corrected choking mass flow of the rotor is approximately 10.1 kg/s and the design mass flow rate is 9.67 kg/s. In addition, the actual mean tip clearance used in the computational fluid dynamics (CFD) simulation is 0.6858 mm. The ND-TAC rotor is tip-critical and it exhibits a spike-type stall behavior [23]. The application of a CGCT to enhance the stability of the ND-TAC [24,25] has demonstrated the effectiveness of CGCTs in this rotor. However, the variation of the design point performance resulting from CGCT was not discussed, or of concern. This paper focuses on the design and optimization of the axial distribution of a CGCT with consideration of the 3D blading design, which aims at developing a novel CGCT-blade integrated optimization strategy to improve the design point performance while extending the stall margin.
In this paper, the sweep and lean are introduced to the blade tip to investigate the effects of 3D blading on the CGCT design. The sweep is defined as the shift of the airfoil section along the local chord line. The upstream shift is called the forward sweep, and the downstream shift is the backward sweep. The movement of the section that is perpendicular to the local chord line is defined as the lean. If the direction of the lean is towards the pressure side, the lean is defined as a positive lean; otherwise, it is a negative lean.
The blade is generated by a third-order B-spline interpolation based on fourteen airfoils stacked from the hub to the casing. The sweep and lean are manipulated by two third-order Bezier curves. The values of the sweep and lean are defined by the percentage of the baseline-blade mean chord length and the baseline-blade mean leading-trailing edge deviation , respectively. Initially, the leading edge (LE) and corresponding trailing edge (TE) for each baseline 2D airfoil are expressed in cylindrical coordinates (). Then, and are calculated by Equations (1) and (2), respectively:
Next, the values of and of all of the 2D airfoils are averaged to obtain the mean value for the baseline blade. The above definitions of the sweep and lean adopted in this paper are essentially consistent with the conventional method that defines the sweep and lean by the absolute axial displacement and the circumferential angle. Still, the geometry changes defined by the relative variation can be more intuitive. Figure 2a,b illustrate the distributions of the sweep and lean along the blade span. The abscissa is the percentage of the mean chord length and the mean deviation. Both the sweep and the lean are regulated by five equally distributed control points from root to tip. In this study, only the control point at the blade tip is variable, which causes the 3D shape of the last 35% of the blade span to be affected by the sweep and lean variations.
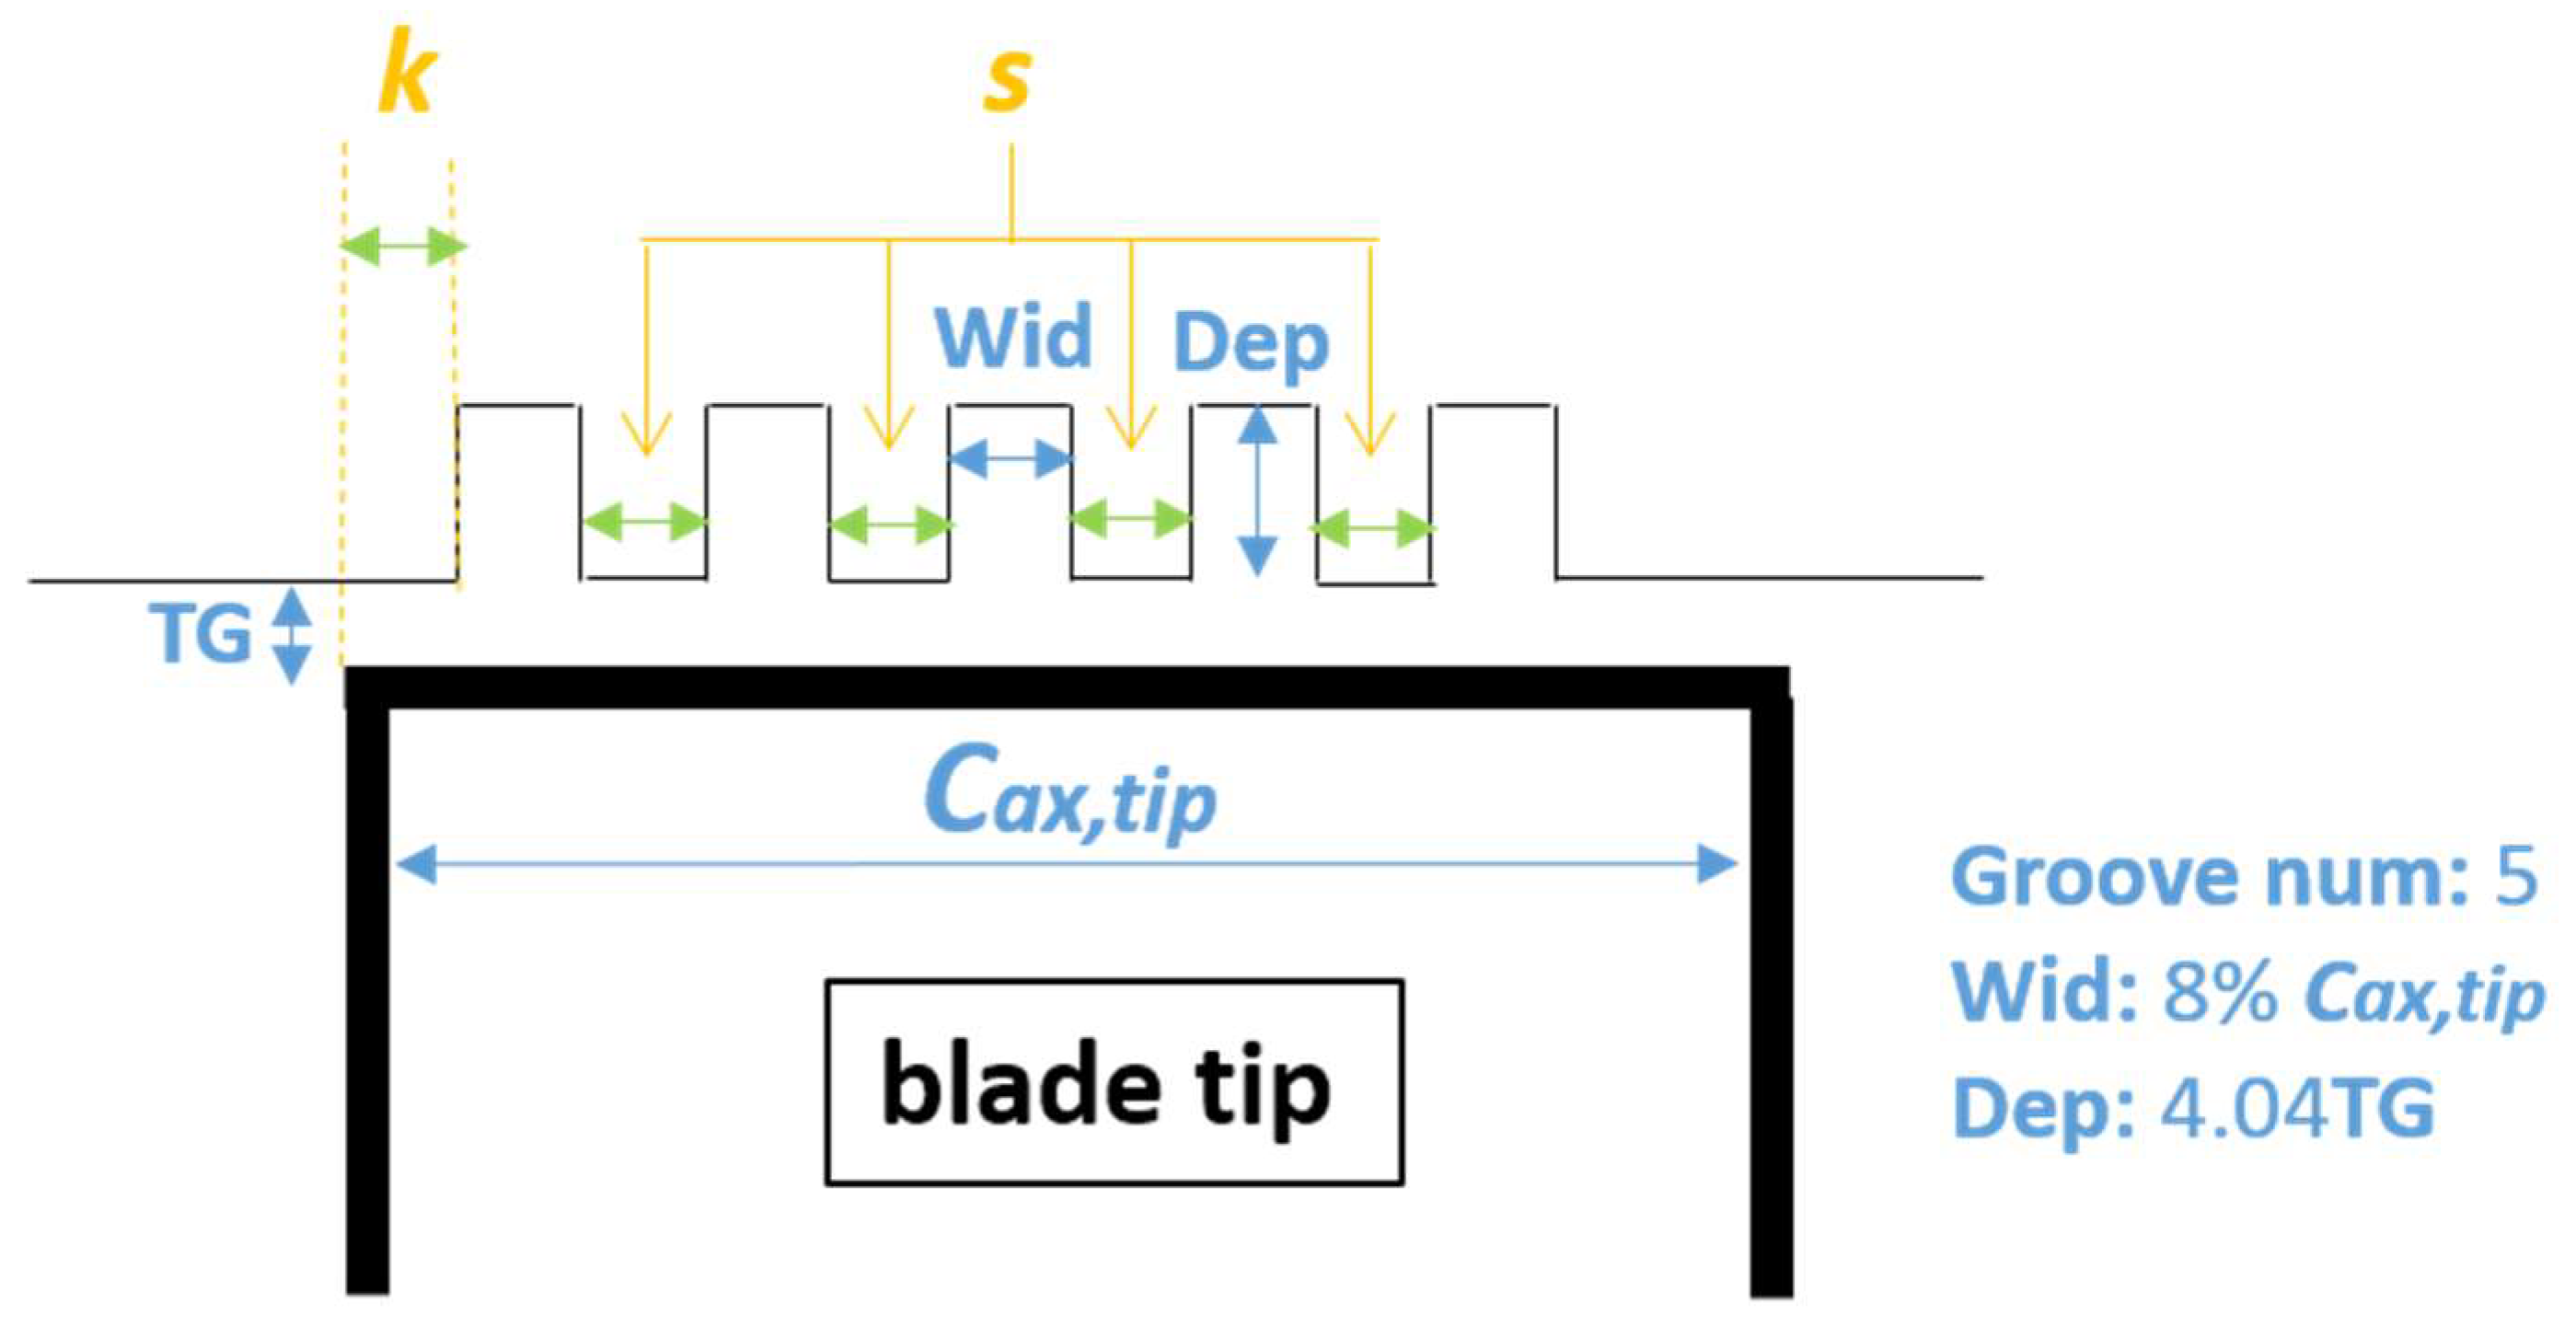
With respect to the CGCT design, the groove number, width and depth of the grooves are fixed. Only the axial coverage of the CGCT is variable. The parameterization of the CGCT is shown in Figure 3. The groove number, along with the depth and width of each groove are given in the right side of the figure. The distance between any two adjacent grooves remains equal, to facilitate the manufacturing of the CGCT. In this figure, the abbreviation of “TG” means the tip gap. The depth of each groove is 4.04 times the tip gap size. The width of each groove is approximately equal to its depth. The dimension of the casing grooves refers to the previous research [24,25]. A few CFD tests, which are not provided in this paper, were also carried out to ensure the rationality of the parameter selection. Note that the width and depth design are not the interest of this paper; thus, only the axial coverage of the overall CGCT configuration installed on the casing can be controlled by two variables and , which correspond to the distance between the first groove and the blade’s leading edge and the distance between two adjacent grooves, respectively. The variables and are non-dimensionalized by the axial chord length .
3. Numerical Methods
An in-house CFD code called NSAWET (Navier-Stokes Analysis based on Window-Embedment Technique) is employed to solve the 3D compressible Reynold averaged Navier-Stokes (RANS) equation. An improved version of the HLL-Riemann solver by restoring the contact surface (HLLC) is selected to compute the convective flux [26]. The third-order monotone upstream-centred scheme for conservation laws (MUSCL) [27] with a Van Albada limiter [28] is adopted to ensure accuracy on non-uniform and skew cells. The k-ω shear stress transport (SST) turbulence model [29] is used to compute the turbulent viscosity. Moreover, the time marching is achieved by the Lower-Upper Symmetric-Gauss-Seidel (LU-SGS) implicit algorithm [30]. When the CGCT is adopted, the flux exchange between the groove-casing interfaces are dealt with using an overlap-area weighted reconstruction method [31]. The accuracy of NSAWET as applied to turbomachinery has been validated by previous studies [24,32,33].
The rotor is simulated in the single passage that is discretized by the multi-block structured mesh. The total pressure, total temperature, and axial flow angles are uniformly specified at the inlet boundary. With a given back pressure at the hub, a simplified radial equilibrium equation is employed to compute the radial distribution of the static pressure on the outlet plane. With a steady RANS, the stall point is approached by increasing the back pressure until a further 50 Pa increment will lead to an abrupt mass flow drop and the divergence of the computation. An automatic proportion- integration-differentiation (PID) conditioner [34] is embedded in the NSAWET code to adjust the back pressure until the mass flow converges to the target value at both the design point and the near-stall point.
The grid convergence study is conducted with three sets of meshes, corresponding to the coarse mesh, medium mesh, and fine mesh. The total grid numbers of the three sets of meshes are 73.6 million, 1.45 million, and 2.96 million, respectively. Figure 4 shows the details of the medium grid. The grid of circumferential grooves is shown in red, and the grid in the passage is shown in black. This set of mesh has 65 cells distributed along the whole blade span, and another 25 cells inside the tip gap in the radial direction. The wall unit of the first grid layer that is normal to the wall boundary, is strictly maintained below 1, in accordance with the requirements of the SST turbulence model. Each circumferential groove is discretized by a straight H block that has 40, 36, and 50 cells in the stream-, span- and pith-wise directions, respectively.
Figure 5 gives a comparison between the CFD results and the experimental data. The uncertainty in the measured total pressure ratio (), the measured total temperature ratio (), and the measured mass flow are 0.5%, 0.5%, and 1.0%, respectively. Figure 5a,b show the speed curve predicted by the three sets of meshes. All of the three meshes are capable of achieving a good agreement with the experimental data at the design point. The coarse mesh predicts a higher stall mass flow than the experimental data, due to the very sparse grid distribution in the passage. The speed curve obtained by the medium mesh is very close to the curve obtained by the fine mesh over the entire operating mass flow. The differences in the at the design point and the near-stall point between these two meshes are less than 0.15%, and this value reduces to 0.04% for the differences. The results of the medium and fine mesh show that the deviation of between CFD and experimental data occurs near the surge boundary. The present computation also slightly underestimates . These numerical errors may be caused by the drawbacks of the turbulence model and the insufficient ability of the steady RANS for precisely capturing the large separation under near-stall conditions. Despite the numerical errors, the whole tendency of the speed curve predicted by the medium mesh and fine mesh coincides with the experimental data from choke to stall. In Figure 5c,d, the spanwise distributions of and predicted by the medium mesh at the downstream plane also show an acceptable agreement with the experimental data. To sum up, CFD results obtained by the medium mesh are close to the experimental data at the design point and the near-stall point. Because the optimization objectives are set at the design point, and the goal of the optimization is to gain a relative improvement based on the baseline blade, it is suitable to use the medium mesh to undertake CFD investigations to achieve a favorable balance between the accuracy and the computational cost.
4. CGCT Application Tests
The effects of the CGCT and its axial coverage are first analyzed on the baseline blade that is installed with different CGCT configurations. Then, the sweep and lean are introduced to the blade tip. Influences of 3D blading on the performance of the CGCT are discussed. The mass flow rates of the design point and near-stall point are taken as 9.67 kg/s and 8.95 kg/s, respectively. The abbreviations adopted hereafter for each type of rotor are explained in Table 2.
4.1. Effects of the CGCT on the Performance of the Baseline Blade
By increasing the parameter from 0 to 40% of , five CGCT configurations with different axial coverage are generated. The parameter is fixed as 5% of in all five of the CGCT configurations. Table 3 lists the axial coverages of these five CGCT configurations which are installed on the baseline blade. From CT_a to CT_e, the position of the CGCT is moved from the leading edge area to the trailing edge area.
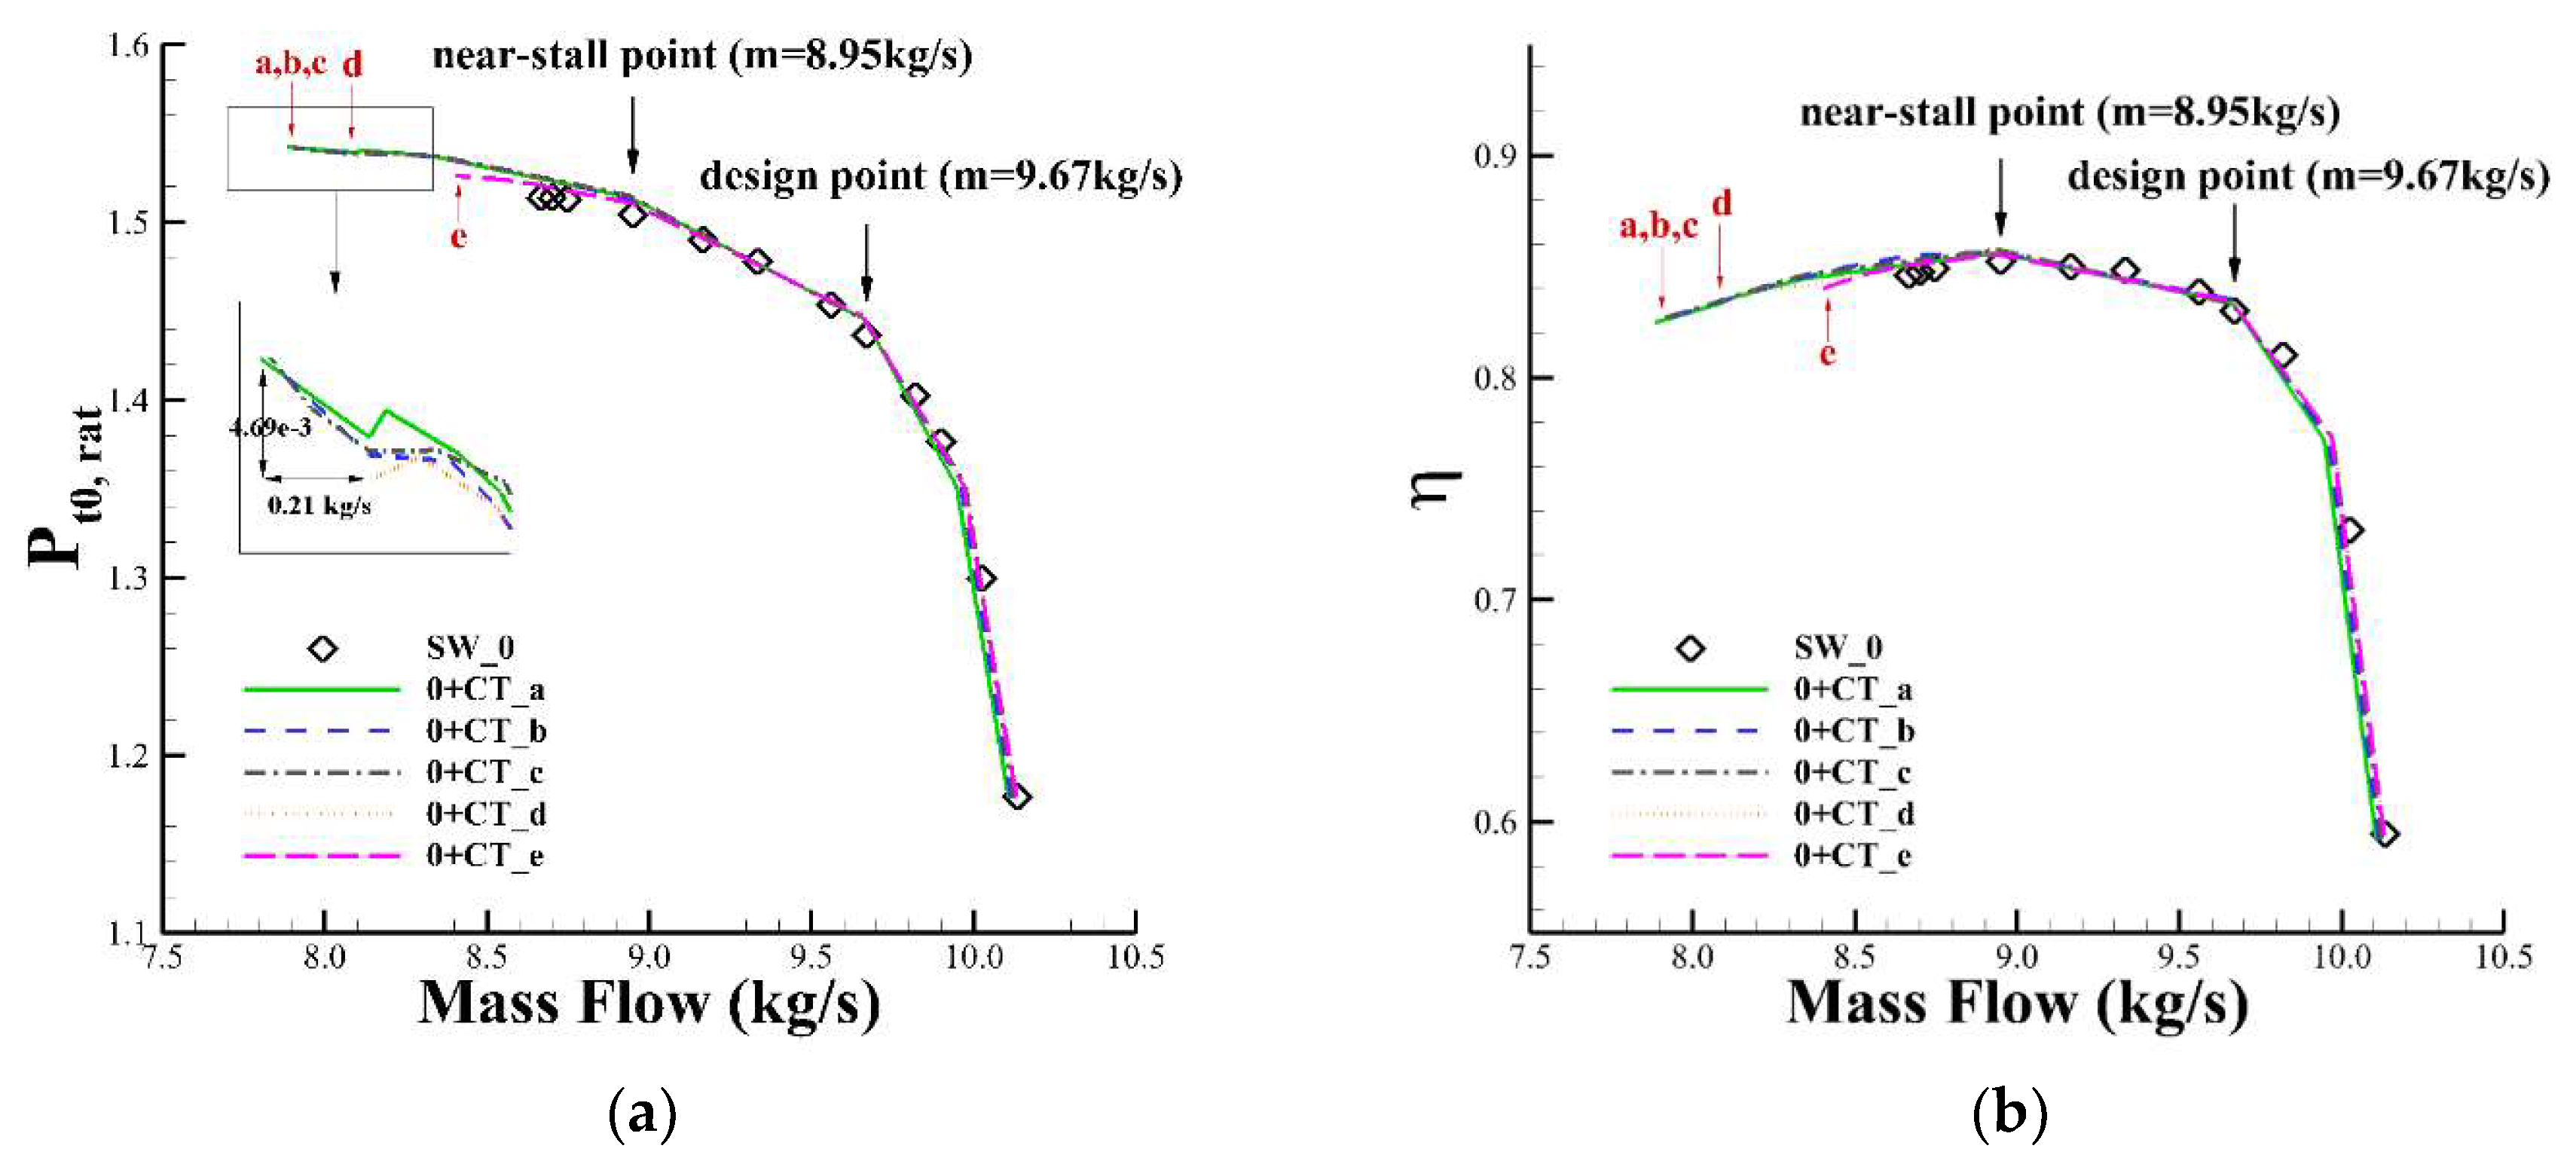
The speed curves of the ND-TAC rotor with and without installing the CGCT are shown in Figure 6. At both the design point and the near-stall point, all of the CGCT configurations improve both the total pressure ratio and the adiabatic efficiency (). The stall mass flows of all of the grooved casing rotor are lower than that of the solid casing rotor. Specifically, the zoom-in of the stall point in Figure 6a shows that the stall mass flows of CT_a, CT_b and CT_c are very close. When the CGCT is moved to the trailing edge area, the ability of the CGCT to delay a stall dramatically decreases, which is reflected by the increased stall mass flows of CT_d and CT_e.
At the design point, the spanwise distribution of the total pressure ratio, as well as the adiabatic efficiency at 25% of the tip chord length downstream of the trailing edge are shown in Figure 7. In Figure 7a, the CGCT decreases the total pressure ratio above 95% of the span but enhances the working capacity of the rest of the span, which demonstrates that the CGCT redistributes the spanwise loading. In Figure 7b, the increase of the efficiency concentrated in the blade tip indicates that the CGCT reduces the aerodynamic loss in the tip region. The baseline rotor installed with CT_e is found to have the highest total pressure ratio below 80% of the span and the highest efficiency above 90% of the span.
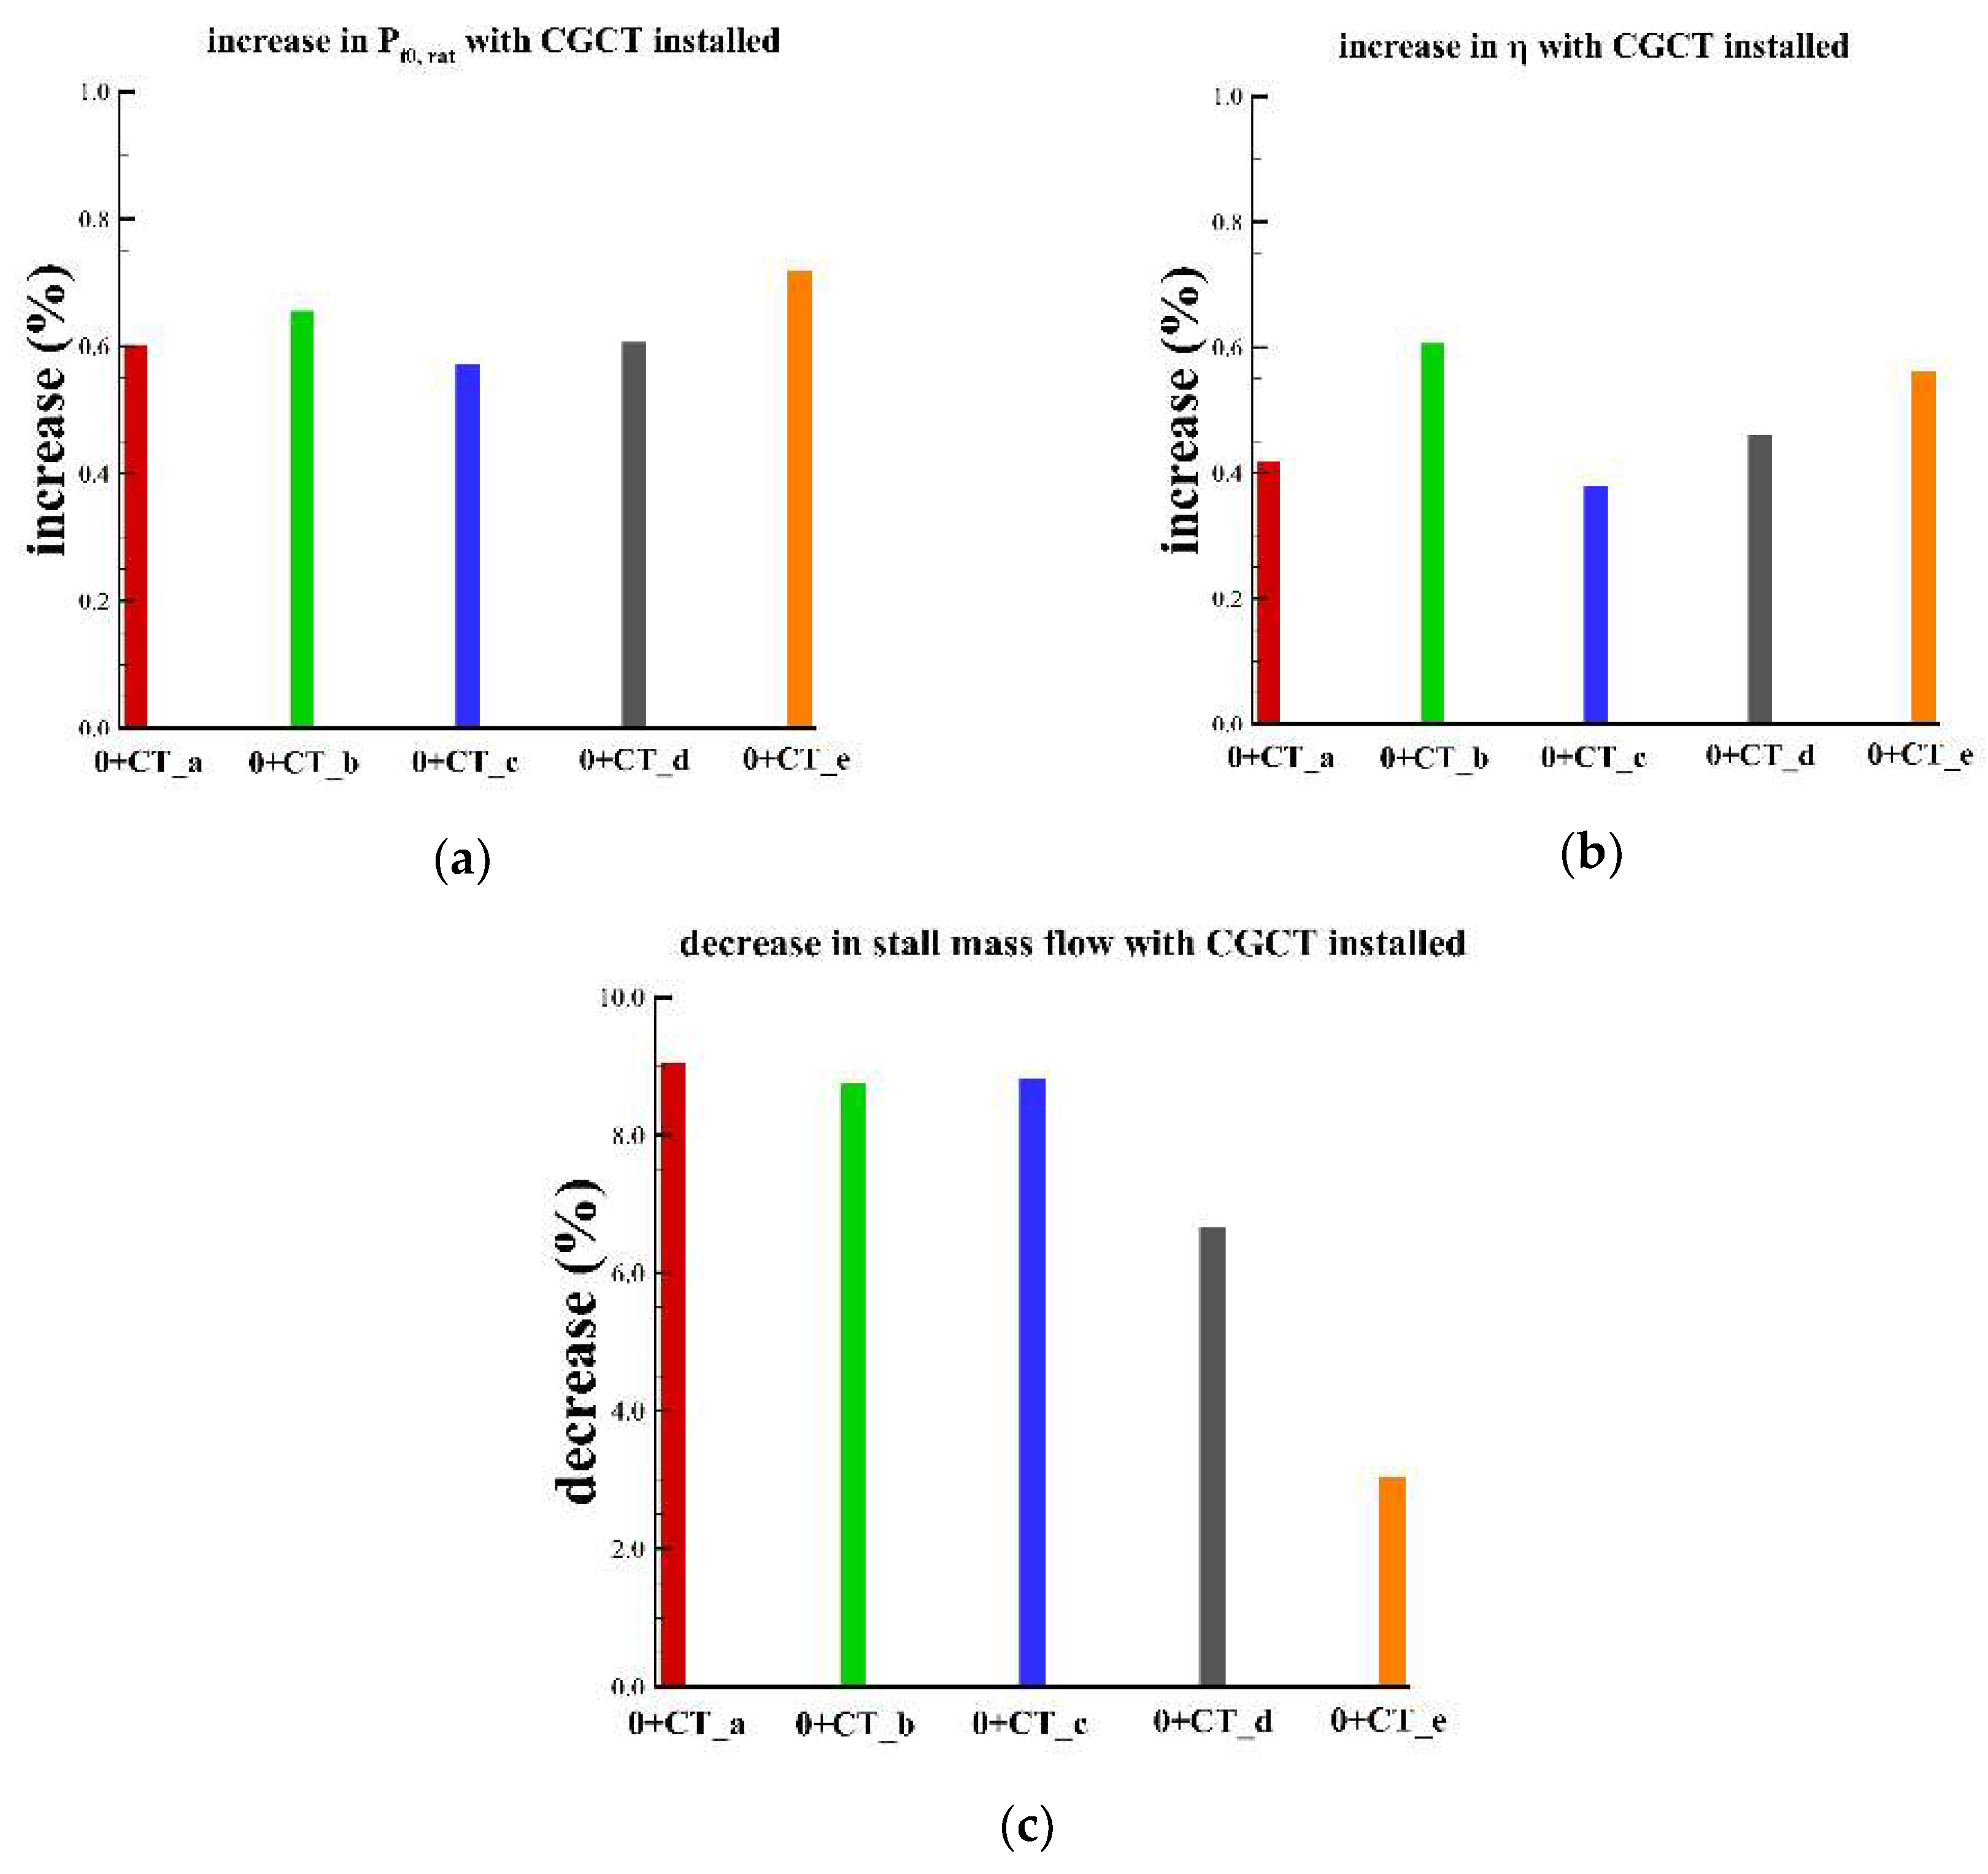
The design point performance and the stall mass flow of the ND-TAC rotor with different CGCTs installed are summarized in Table 4. The performance improvement and the decrease of the stall mass flow due to the installation of different CGCTs are shown in Figure 8. Although the grooved casing rotor 0 + CT_e has the most significant improvement in the design performance, the stall mass flow of 0 + CT_e is obviously higher than the corresponding stall mass flows of the other CGCT cases. The greatest difference between the five grooved casing rotors is more than 0.1% for the design point performance, and is more than 6% for the stall mass flow. In the present CGCT tests, the optimal performance at the design point and near-stall point are not obtained by the same CGCT configuration. The effectiveness of the CGCT varies with its axial coverage.
As indicated by Figure 8, the differences between CT_c and CT_e in the design point performance and the stall mass flow are the most obvious. Thus, the flow fields of 0 + CT_c and 0 + CT_e are extracted for comparison and analysis.
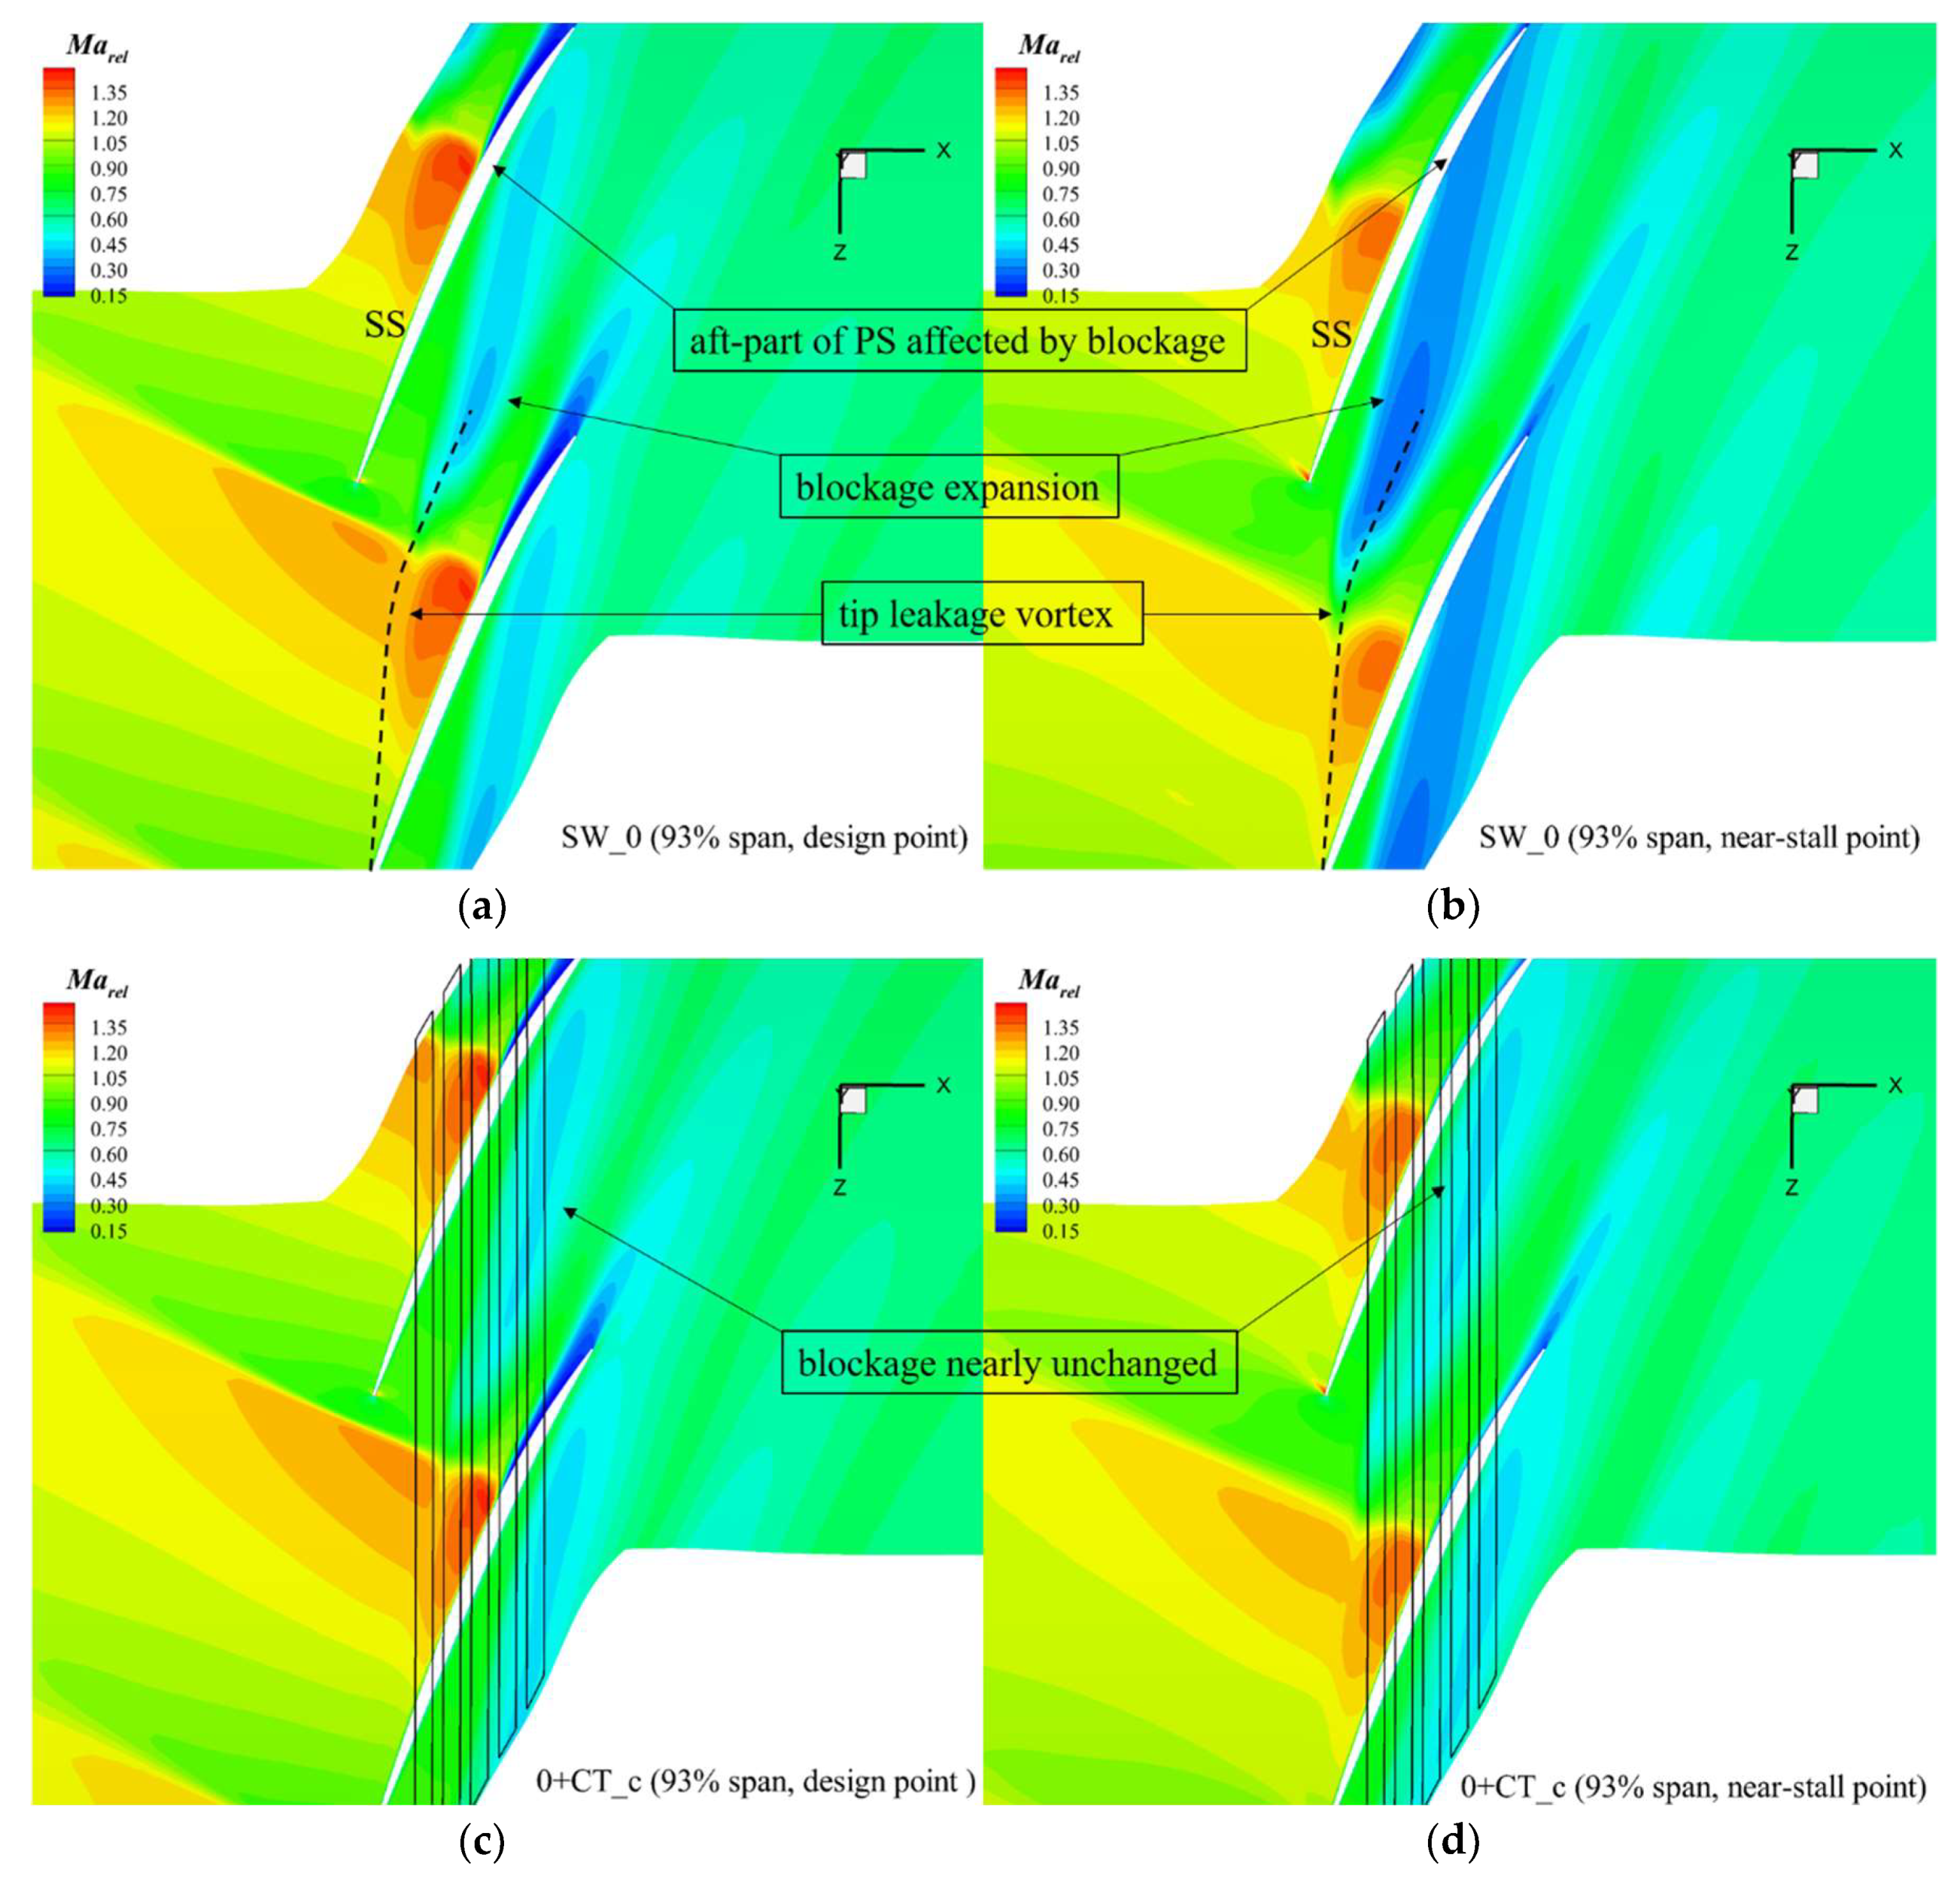
In Figure 9, the blockage at 93% of the span formed by the TLV after passing the shockwave is characterized by the relative Mach number contours. Common effects of CT_c and CT_e on the flow fields in the tip region are alleviations of blockages at both the design point and the near-stall point. When the mass flow decreases with the variation of the operating point, the behaviors of the low Mach number region in 0 + CT_c are basically unchanged (see Figure 9c,d). By contrast, from the design point to the near-stall point, the low Mach number area in 0 + CT_e expands rapidly, and the average speed in this blockage region is also reduced (see Figure 9e,f). The rapid growth of the blockage in 0 + CT_e implies that CT_e that locates between 40% of and 100% of is less effective at delaying the stall than CT_c that locates between 20% of and 80% of . However, at the design point, the blockage in 0 + CT_e is smaller than that in 0 + CT_c (see Figure 9c,e), which indicates that CT_e is more helpful at relieving the blockage under a high-mass-flow condition than CT_c is. Therefore, the Mach number contours plotted in Figure 9 demonstrates that 0 + CT_e has a stronger working ability at the design point, but a smaller stall margin than 0 + CT_c has. In addition, the blockage that originates downstream of the shockwave and then extends to the aft-part of the pressure side (PS) is supposed to affect the blade’s aft-loading. If the blade’s chordwise loading is redistributed due to the 3D blading, the effectiveness of CGCT can be changed.
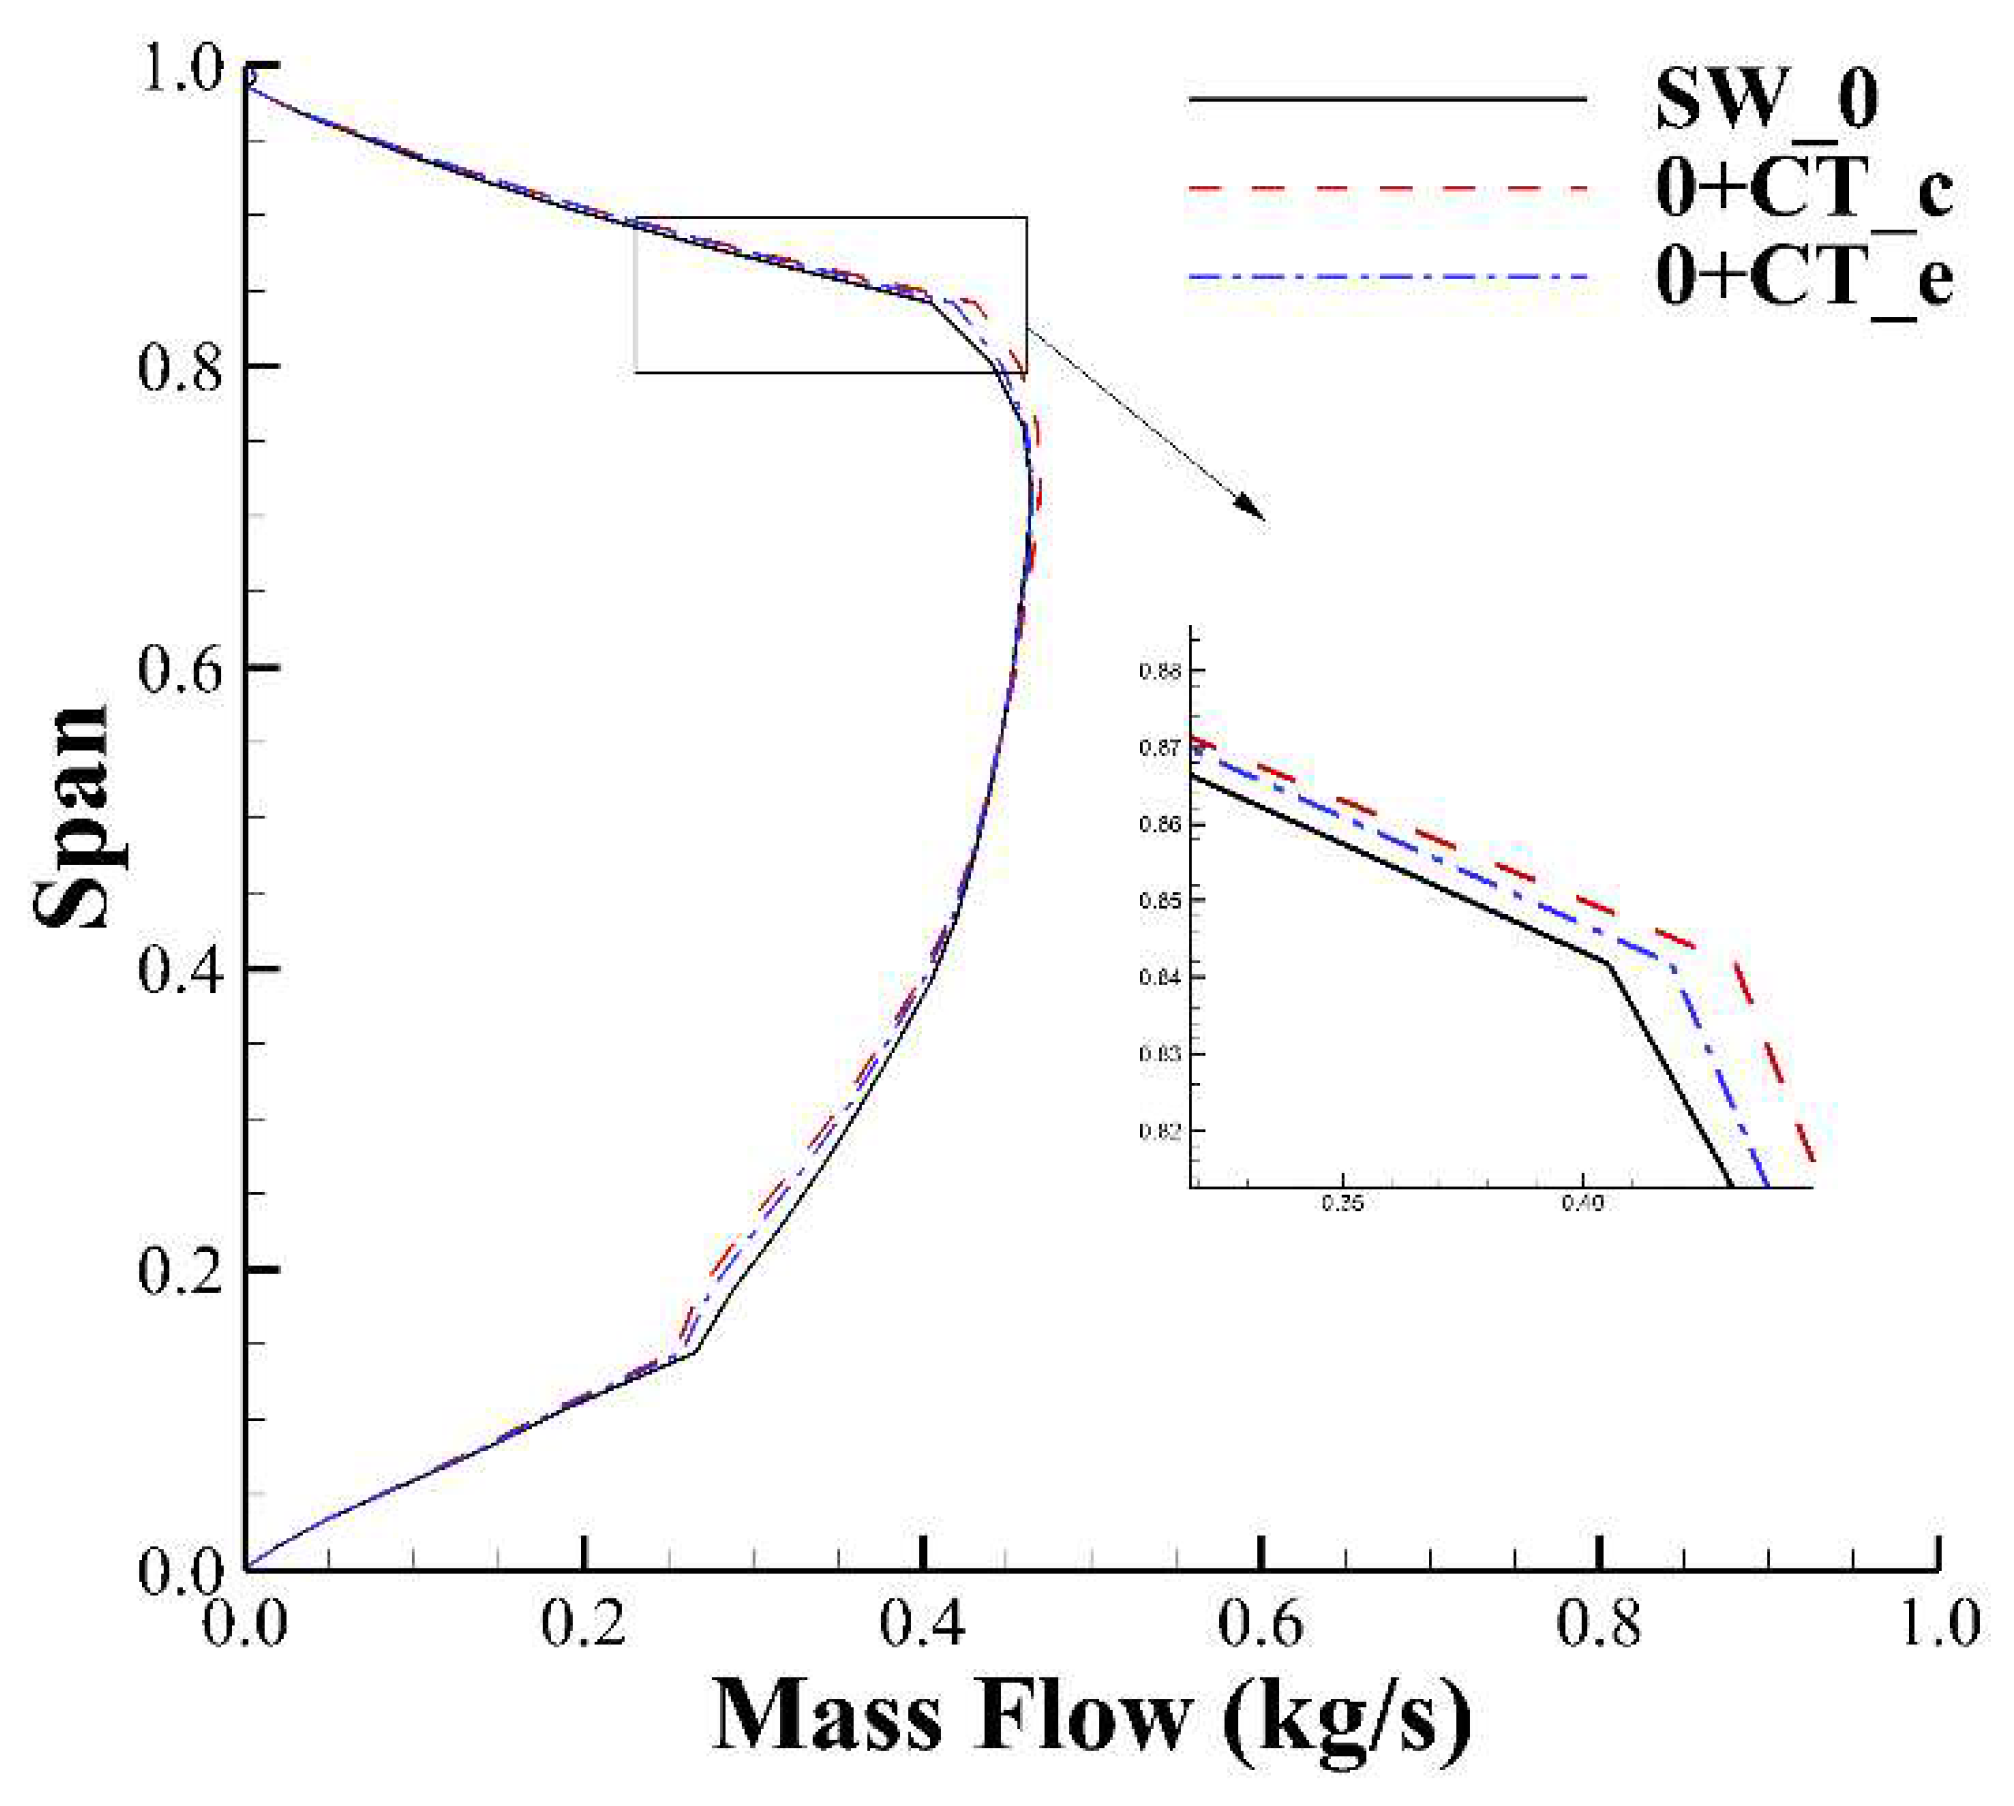
Figure 10 quantitatively compares the mass flow distribution along the span at the near-stall condition. It shows that both CT_c and CT_e increase the mass flow near the blade tip due to the reduction of the blockage. The mass flow of 0 + CT_c near the blade tip region is higher than that of 0 + CT_e, which demonstrates the conclusion drawn from Figure 9 that CT_c is more effective to alleviate the blockage at a low-mass-flow condition. It explains why 0 + CT_c presents a larger stall margin than 0 and 0 + CT_e. Moreover, Figure 10 also shows that the mass flow near the blade root is reduced by CGCT, which indicates that CGCT not only alters the tip flow field, but also changes the flow behaviors at the non-tip region.
Along the trajectory of the TLV, seven planes perpendicular to the Z-axis are extracted, and the entropy contours on them at the design point are shown in Figure 11. The yellow square in the figure encloses the cross-section where the core of the TLV interacts with the shockwave. Apparently, the entropy in this area of 0 + CT_e is less than the corresponding entropy of 0 + CT_c, which indicates that the strength of the shock-TLV interaction in 0 + CT_e is weaker than that in 0 + CT_c. Consequently, the high-entropy region marked by the dashed black square in the low-speed area of 0 + CT_e is smaller. The variations of the entropy distributions demonstrate that at the design point, CT_e is more effective at increasing the efficiency than CT_c is.
The distributions of the relative total pressure (), non-dimensionalized by the inlet total pressure in the tip clearance, are plotted in Figure 12. Figure 12a shows that the improvement of induced by CT_e after the 40% point of is higher than the corresponding improvement for CT_c at the design point; however, at the near-stall point, Figure 12b shows that CT_c is more effective at increasing after the 30% point of than CT_e is. The variation of in the tip clearance proves that the effectiveness of different CGCT configurations varies with the operating conditions.
4.2. Effects of the Sweep and Lean on the Effectiveness of the CGCT
As shown in Table 4, in terms of both the design point performance and the stall margin, the performance of CT_b is more satisfactory than the other CGCT configurations. In this section, CT_b is applied to four re-stacked rotor blades named FS, BS, PL, and NL to test the effects of the sweep and lean. The sweep and lean distributions adopted in this study are given in Figure 2. The 3D shapes of the four blades are plotted in Figure 13. Compared with the baseline ND-TAC blade, the control point of the sweep at 100% span is forward and backward shifted by 12% of the mean chord length to form the blades FS and BS, respectively. Moreover, the control point of the lean at 100% of the span is positively and negatively shifted by 3.5% of the mean leading-trailing edge deviation to produce the blades PL and NL, respectively. Although the position of the blade tip airfoil in the flow passage is changed in accordance with the sweep and lean, the geometry parameters of the 2D airfoil, including the thickness, camber and chord length, are unchanged. Additionally, the relative position of the circumferential grooves to the blade tip is fixed, regardless of how the blade is re-stacked.
The CFD results show that when CT_b is installed, all four of the re-stacked blades are able to operate at the mass flow rate of 8.10 kg/s, which is approximately 0.60 kg/s lower than the stall mass flow rate of the baseline blade. Therefore, the stall margin of the re-stacked blades with CT_b installed is sufficient. Consequently, we focus on the performance of these blades instead of the stall margin.
Figure 14 shows the performance variations of re-stacked blades at both the design point and the near-stall point induced by CT_b. The forward and backward sweep result in a slight design performance deterioration, but the backward sweep leads to greater loss in and than the forward sweep (see symbol ∆ and ∇ in Figure 14a). After installing CT_b on the swept rotor’s casing, the performance is improved significantly. The performance improvement induced by CT_b in blade FS is more than the corresponding improvement in the baseline blade 0 and blade BS (see Figure 14b). In addition, after introducing the sweep to the tip, the improvement of the near-stall performance induced by CT_b in FS and BS is more than twice the corresponding improvement in blade 0 (see Figure 14d). The positive-leaned blade PL has a slightly higher design performance than blade 0. By contrast, the negative lean causes a performance deterioration (see symbol ◇ and ○ in Figure 14a). The performance improvement after installing CT_b in blade PL is less than the corresponding improvement in blade 0; however, the performance improvement of NL induced by CT_b is more than what we find in blade 0 (see Figure 14b,d).
From the above quantitative comparisons, it can be concluded that the sweep and lean introduced to the blade tip affect both the working capacity and the efficiency of the blade. The sweep and negative lean slightly decrease the solid casing rotor’s performance. Moreover, the effectiveness of the CGCT is also altered by the sweep and lean. In these tests, the effectiveness of the CGCT at improving the solid casing rotor’s performance is magnified by the forward sweep and negative lean in the tip.
Figure 15 shows the variations of the spanwise total pressure ratio distribution caused by the sweep and lean in the blade tip. In Figure 15a, whereas the forward sweep in the tip reduces the working ability of the blade tip, the backward sweep reduces the working ability of the rest of the blade span without changing the tip performance. When CT_b is installed on the casing, the total pressure ratio of the forward swept blade FS is greatly improved from the root to 90% of the span. The performance improvement is even larger than the corresponding improvement to the baseline blade with CT_b installed; however, for the backward swept blade BS, the performance improvement induced by CT_b is less than the corresponding improvement in FS at the same spanwise position. In Figure 15b, the negative lean reduces the total pressure ratio along the entire span, whereas the positive lean slightly increases the total pressure ratio in the tip. The differences between the grooved leaned blades PL + CT_b and NL_CT_b are not as obvious as the differences between the grooved swept blades FS + CT_b and BS + CT_b.
Figure 16 shows the radial relative velocities at each groove-casing interface. varies with the sweep in the tip (see Figure 16a–c). As shown in Figure 16d, compared with the baseline blade, the forward sweep reduces the aspiration of the front three grooves, and the backward sweep increases the aspiration of the front two grooves while obviously reducing the aspiration of the last one. Figure 16e) shows that the injection of fluids from the grooves to the passage is suppressed by the forward sweep in the front four grooves. By contrast, in the backward swept blade BS, the injection of the front four grooves is enhanced. To sum up, the forward sweep tends to decrease the injection and aspiration of grooves, while the backward sweep shows an opposite trend to the forward sweep in terms of affecting the fluid exchange at the groove–casing interfaces. The sweep is found to shift the spanwise loading as well as the chordwise loading [35]; therefore, the aspiration and injection of the grooves in the corresponding area vary with the changes of the blade loading.
Although the relative position between the circumferential grooves and the tip airfoil is unchanged when the sweep and lean are introduced, the interactions between the blade and CGCT are altered, which impacts the performance of the blade and the effectiveness of the grooves. The effects of the 3D blading on the CGCT suggest that it is promising to achieve better design point performance while ensuring an adequate stable operating range by considering 3D blading in the process of the CGCT design.
5. CGCT-Blade Integrated Optimization
Because the CGCT-blade interactions are found to play a significant role in altering the rotor’s performance and stability, we undertake an integrated optimization of the CGCT-blade combination. The goal is to verify the effectiveness of the CGCT design strategy that introduces 3D blading to the blade tip during the optimization of the grooves’ axial distribution.
5.1. Optimization Setup
The sweep and lean of the blade tip and the axial distribution of the circumferential grooves are optimized together. The total number of design variables is four. The variation ranges of the sweep and lean at the blade tip are [−12%, +12%] and [−3.5%, +3.5%], respectively. The ranges of and controlling the grooves’ location are [−0.8%, +20%] and [1.6%, 12%], respectively. A negative value of means that the first groove is upstream of the leading edge. The variation range of equals 0.2–1.5 times the width of the groove. Since the width of each groove is 8% of , the start position of groove can be expressed by Equation (3):
where .
A hybrid aerodynamic optimization algorithm HSADE [36] is used in this paper to search a Pareto Front. HSADE combines the differential evolution (DE) algorithm with the radial basis function (RBF) response surface. Specifically, DE is a stochastic evolutionary optimization algorithm, well-known for its robustness, its strong global searching ability, and its suitability for high-dimensional problems [36]. RBF evaluates the similarity between the candidate design variables and known samples in the design space to predict their corresponding objective functions by interpolation. The results are used to construct the response surface for searching for potential optimal individuals. The Pareto Front is a group of optimal individuals that are not dominated by any other individuals obtained by the multi-objective optimization. To sum up, embedding RBF response surfaces into the basic DE improves the local searching ability of the basic DE, which helps to boost the convergence while obtaining an ideal Pareto Front.
The population size of each generation is nine. The total pressure ratio and the adiabatic efficiency at the design point are set as the two objectives for the optimization. Three operating conditions, namely, the choking point, design point, and near-stall point, are computed for each design in the optimization process. The operating conditions, design constraints, and objectives of the CGCT-blade integrated optimization problem are listed in Table 5. Note that the stall mass flow of the baseline ND-TAC rotor is 8.67 kg/s, and a baseline CGCT can decrease the stall mass flow by more than 0.7 kg/s; therefore, the near-stall condition of the rotor with the CGCT is set at 8.10 kg/s. Once the optimized blade with the CGCT is able to operate at 8.10 kg/s with a total pressure ratio of at least 1.511, the newly obtained CGCT-blade combination is considered to have a sufficient stall margin. The purpose of the CGCT-blade optimization is to obtain improvements to and at the design point, as well as a favorable stall margin.
5.2. Results and Analysis
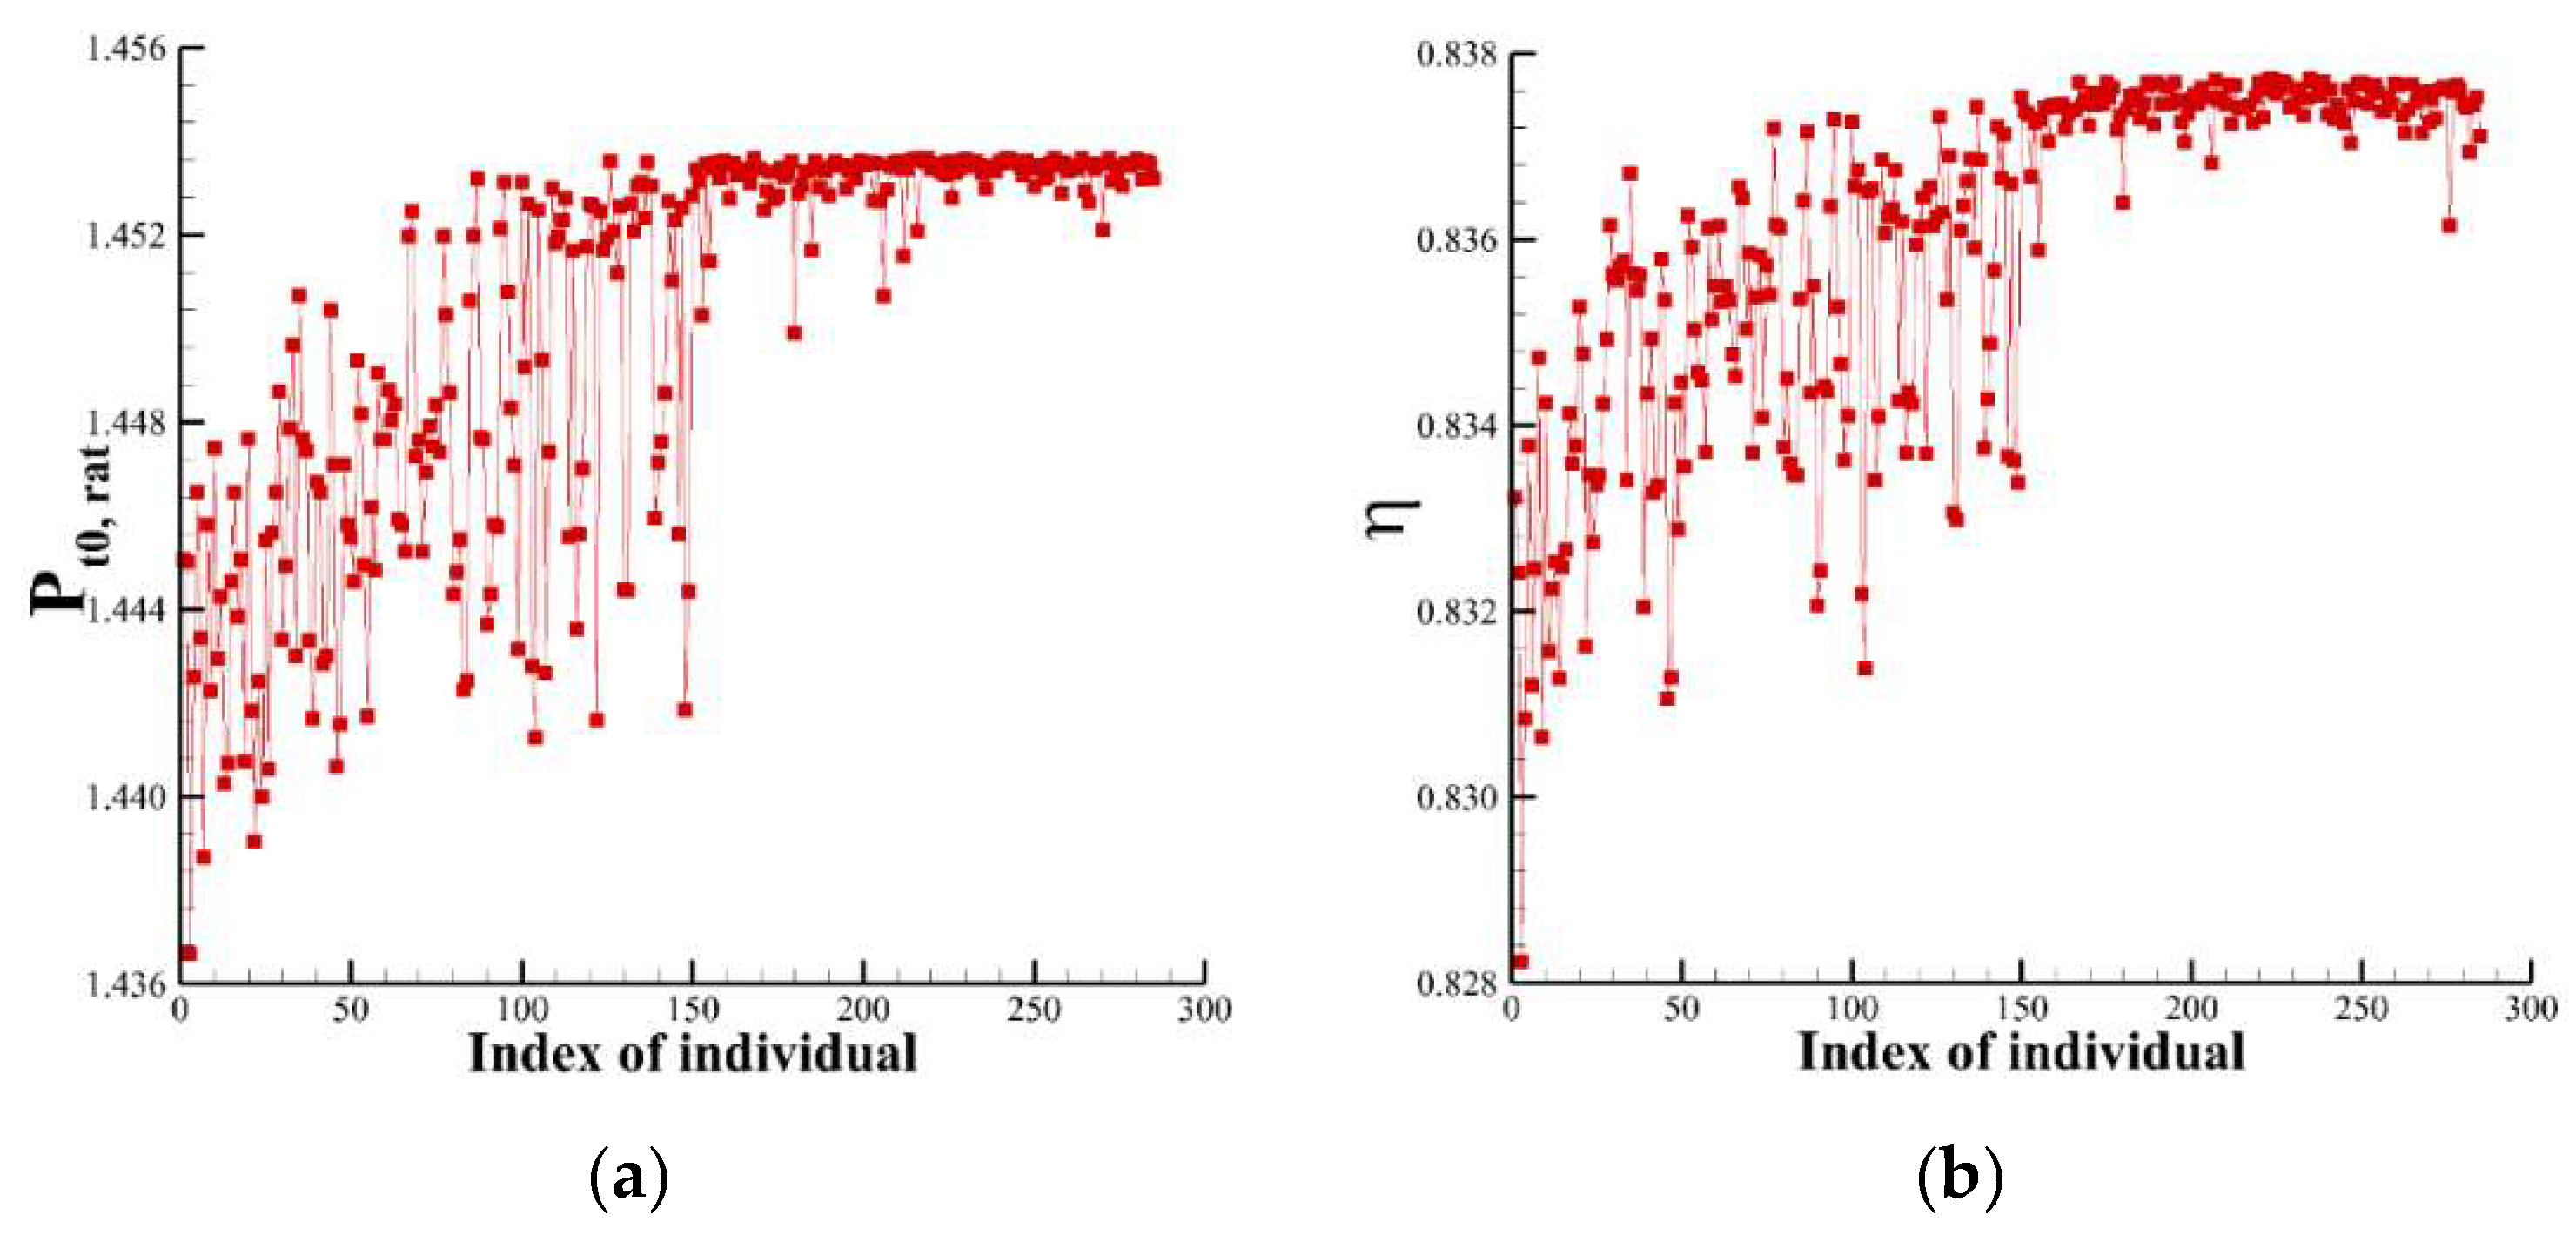
The optimization ran for 3400 CPU hours on a cluster with 300 cores in total, and it converged after 32 generations. The optimization histories of the two objectives are plotted in Figure 17. The performance differences between the individuals in the last few generations are small, and the objective values are concentrated on a narrow strip, which indicates that the optimization has converged.
The values of the two design objectives of the individuals produced in the CGCT-blade optimization are plotted in Figure 18a. Performances of baseline blade 0, swept blade FS, BS, and leaned blade PL and NL, which have been discussed in Section 4.2, are also indicated in the figure with blue deltas. Compared with the tested blades, the CGCT-blade integrated optimization further improves the total pressure ratio and the adiabatic efficiency . The result verifies the effectiveness of the CGCT-blade integrated optimization strategy. The Pareto Front of the optimization is shown in Figure 18b. The difference between these optimal individuals is less than 0.02% for and no greater than 0.05% for .
Table 6 shows the average design performance of the grooved tested blades and the grooved optimized blades on the Pareto Front. The average performance of all of the grooved swept and leaned blades manually generated for the test is slightly lower than the performance of grooved baseline blade 0 + CT_b. Compared with 0 + CT_b, the CGCT-blade integrated optimization improves and by 0.53% and 0.29%, respectively. When the optimization results are compared with the solid-casing baseline blade, the above two values increase to 1.19% and 0.90%, respectively.
For the optimal individuals on the Pareto Front, the average values and variances of the four design variables are shown in Table 7. The differences between these optimal individuals are very small. The optimal blades are characterized by a forward swept and positive leaned tip. The distance between two adjacent grooves is approximately 7.7% of , which is approximately 96% of the grooves’ width. By substituting the average values of and into Equation (3), we find that the axial coverage of the CGCT obtained in the optimization is located between 11.7% and 82.5% of .
The CGCT-blade combination ID 277 marked by the black circle in Figure 18b is taken as the representative of the optimization for further analysis. The values of the sweep, lean, k, and s of ID 277 are 12.0000%, 2.8466%, 11.7790%, and 7.6247%, respectively. For the sake of simplicity, the blade of ID 277 is named “P”, and the CGCT of ID 277 is named “CT_p” in the following discussion.
To eliminate the influence of the grid density and numerical errors on the prediction of the performance gains, the fine mesh used to conduct the grid convergence study is generated in the passage of blade P for validation. The design point performance predicted by the medium and fine mesh are compared in Table 8. Although the medium mesh slightly overestimates and when compared with the fine mesh, the improvements in and predicted by the medium mesh are close to the improvements given by the fine mesh. Therefore, it is proved that the refinement of the grid does not change the trend of the optimization, and the performance improvement predicted by the medium mesh in the optimizer is reliable. The analysis based on results of the medium mesh is performed to further investigate the inner mechanisms.
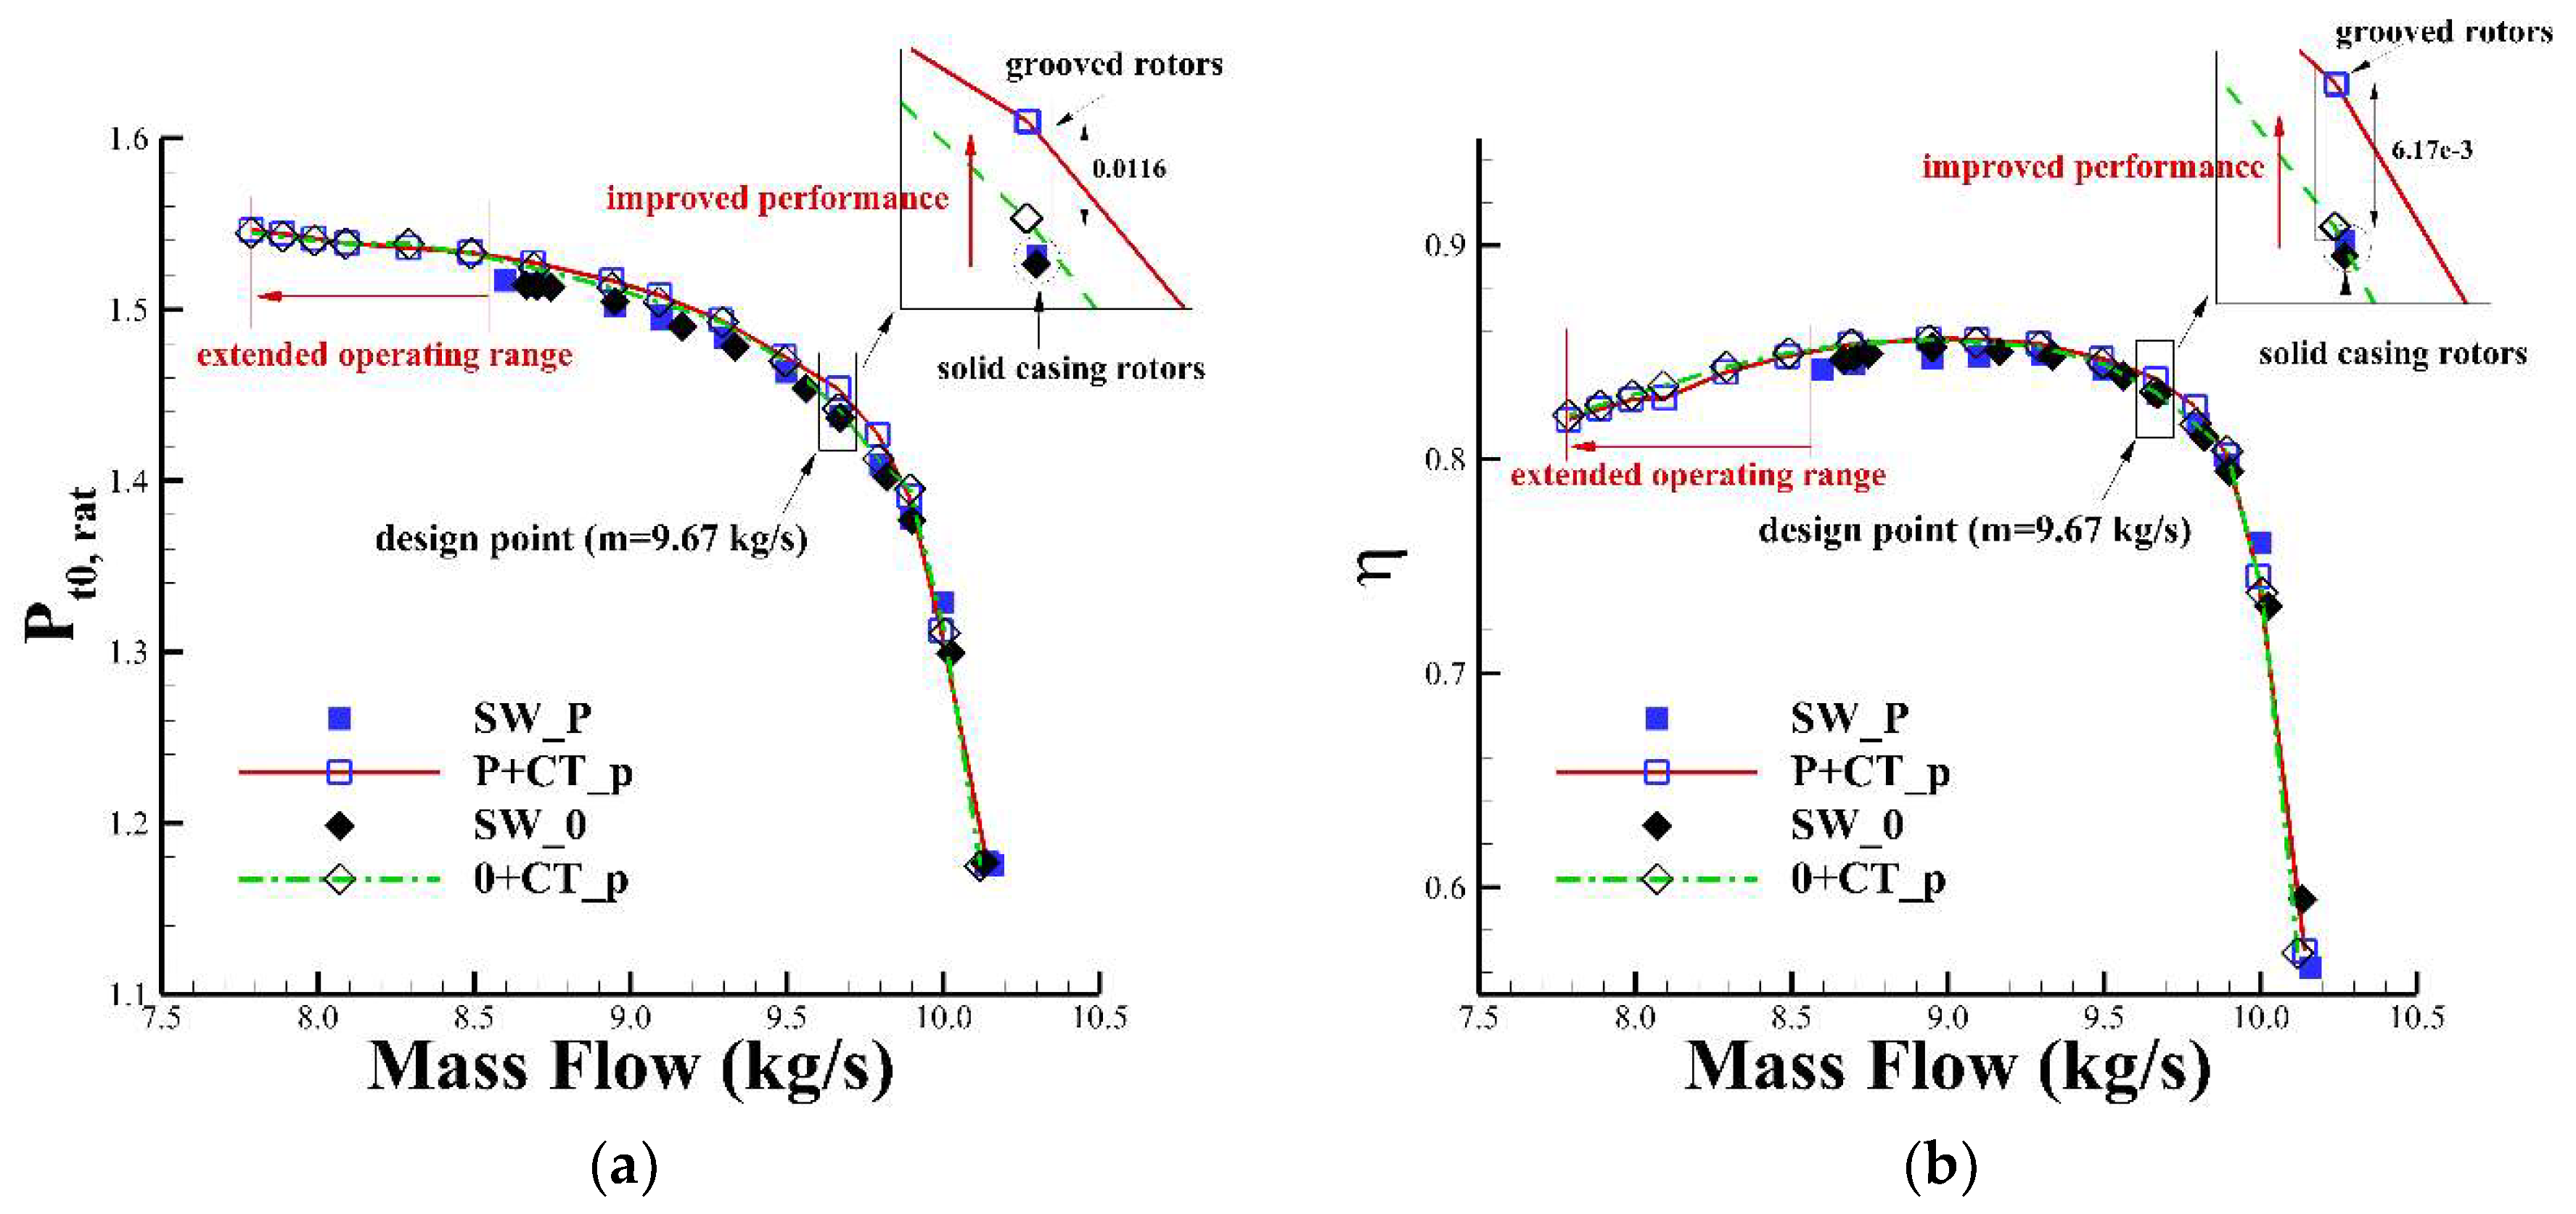
The speed curves of ID 277 with and without the CGCT are shown in Figure 19. The baseline blade installed with CT_p is also simulated for comparison. As shown by the blue solid squares and the black solid diamonds, the design point performance of the solid casing blade P is almost identical with the performance of the baseline blade, which indicates that the benefits of CGCT-blade integrated optimization are not obtained by improving the solid casing blade’s performance. After installing CGCT, the stall mass flow is reduced below 8 kg/s in both rotors, and the near-stall performance of both are very similar, which shows that the ability of optimized grooves CT_p to extend the stall margin does not vary with the re-shape of the baseline blade. The zoom-in views at the design point show that the performance improvement induced by optimized grooves CT_p in the optimized blade P is larger than the corresponding improvement in the baseline blade. This result demonstrates that the CGCT-blade integrated optimization which alters the 3D shape of the blade and the axial distribution of the CGCT simultaneously, improves the CGCT-blade interactions to pursue an optimal CGCT-blade combination.
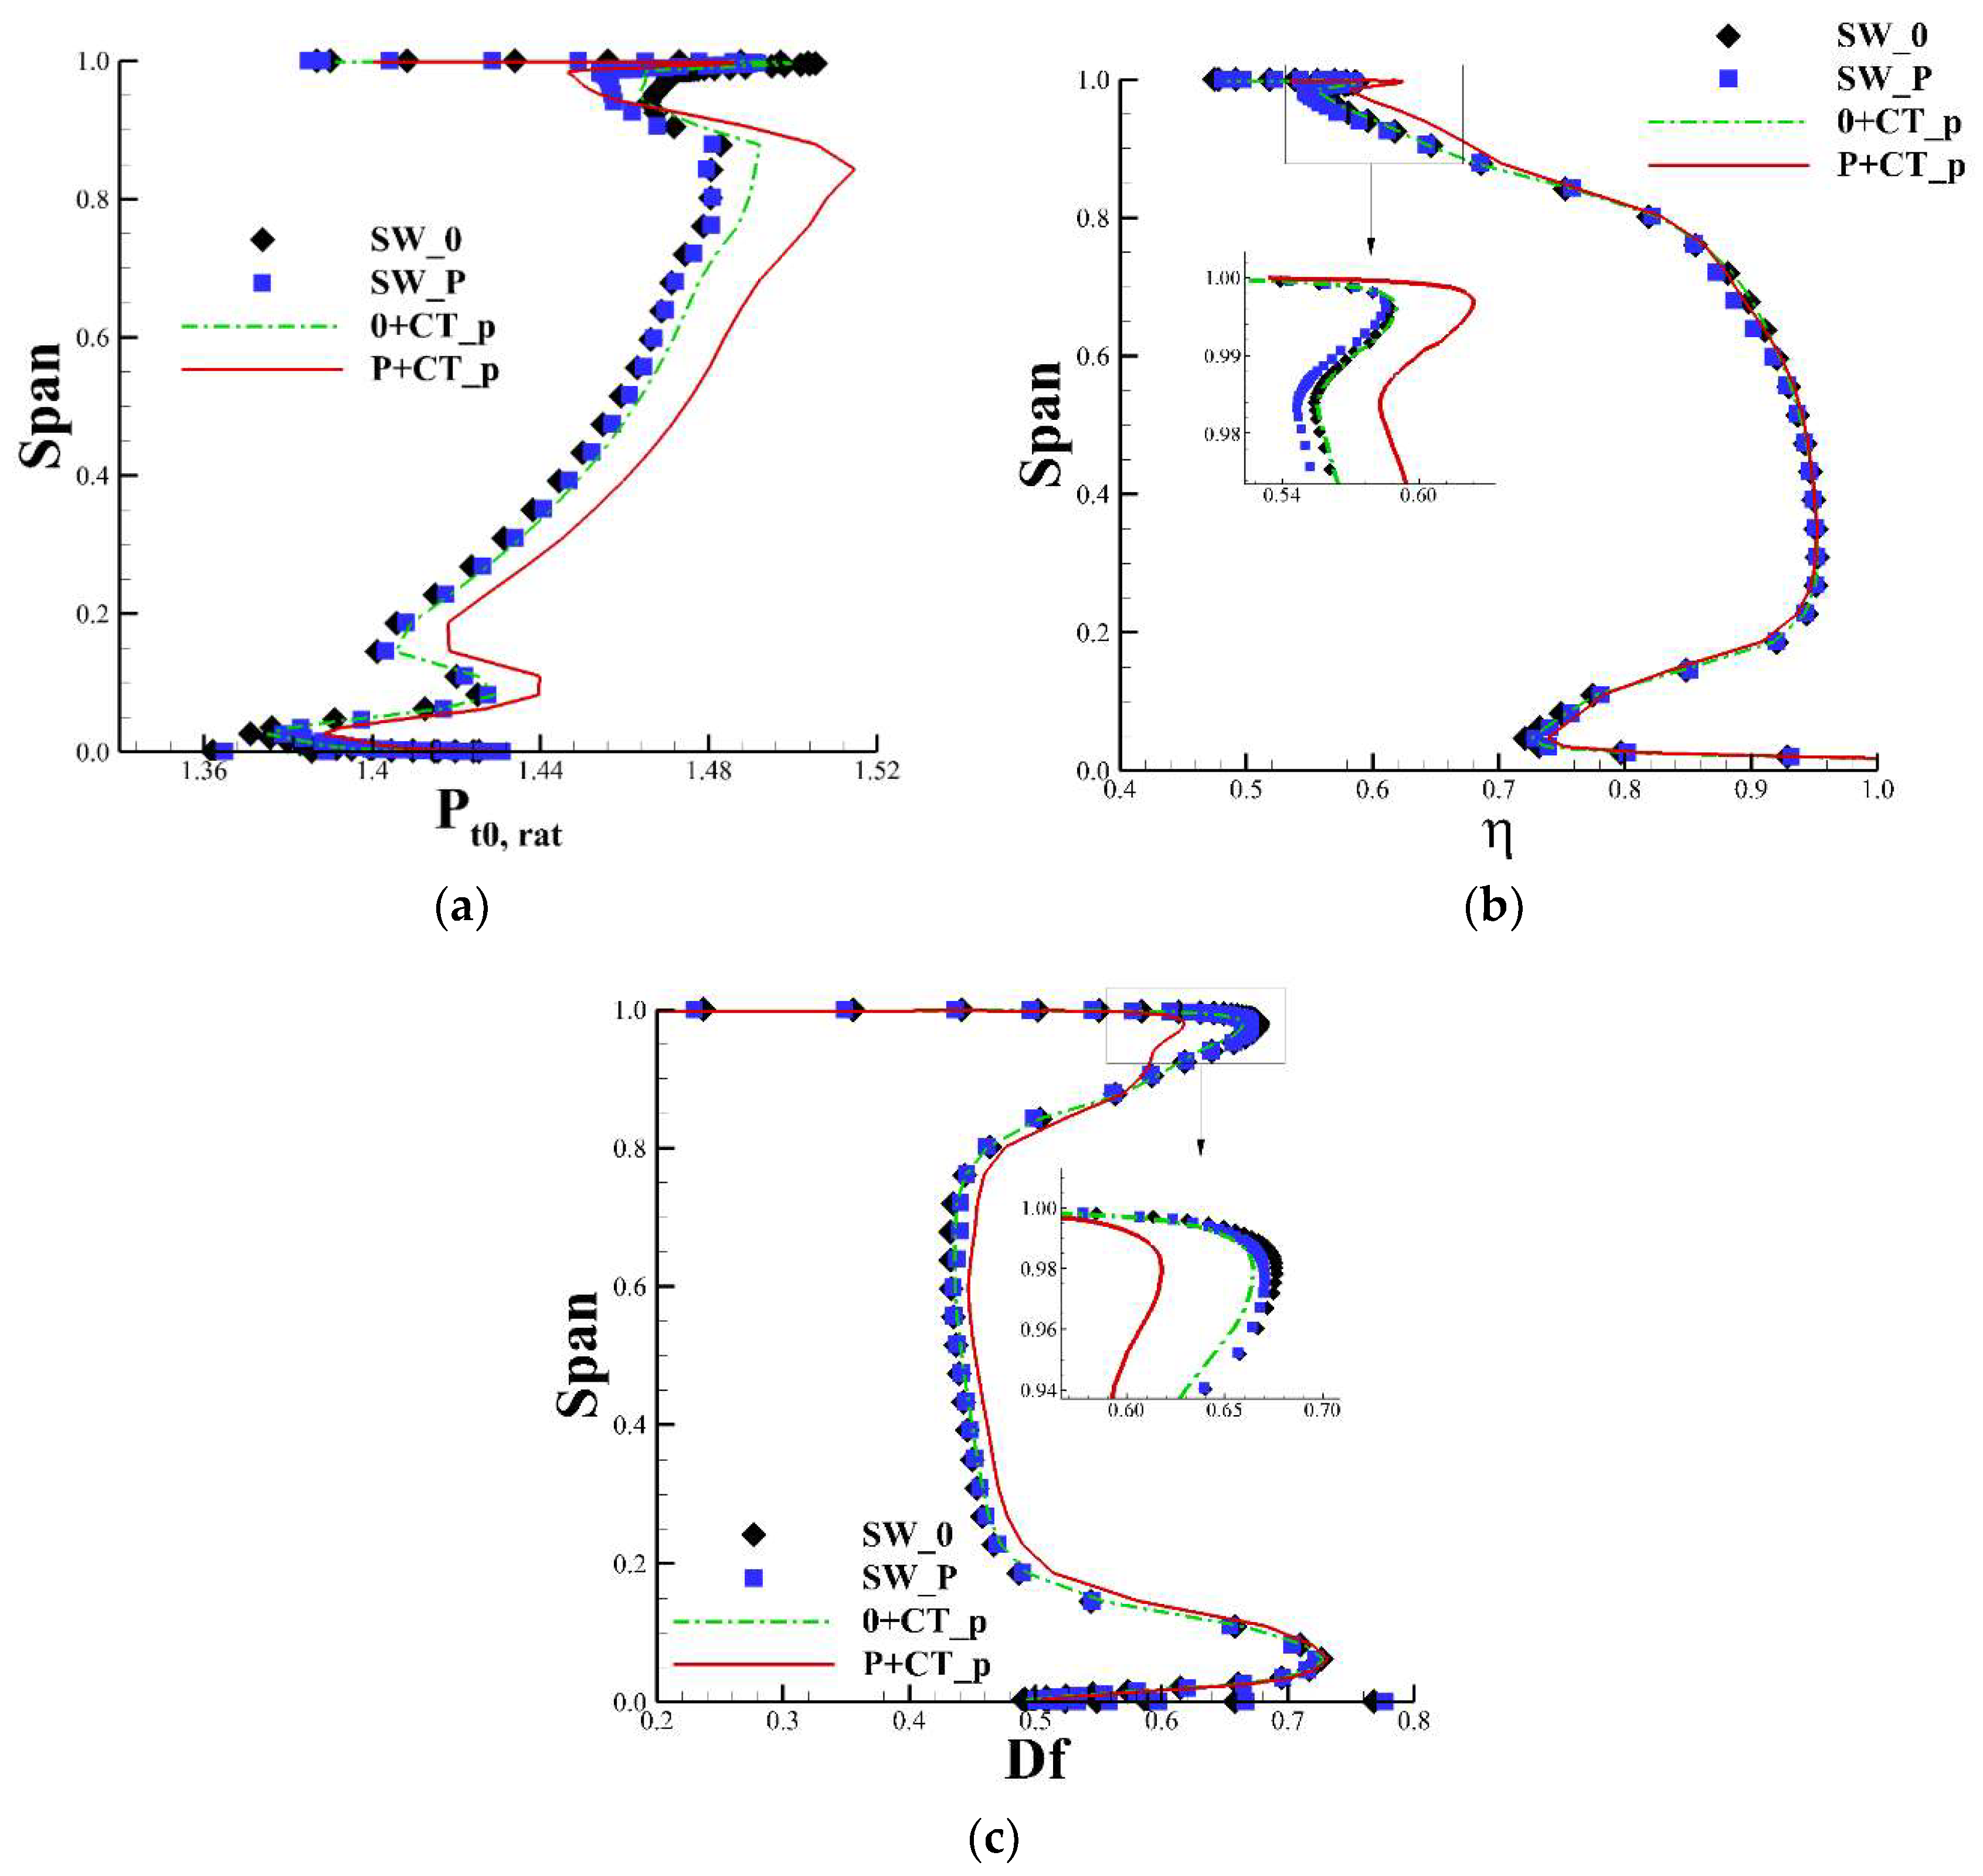
The working capacities and efficiencies of the baseline blade and optimized blade with and without installing CT_p are compared along the spanwise direction in Figure 20. In Figure 20a, the total pressure ratio of optimized blade P is reduced only in the tip region by the forward sweep and positive lean. When CT_p is installed, the total pressure ratio continues to decrease above 90% of the span, however, it increases below 90% of the span. Moreover, the total pressure ratio improvement induced by CT_p below 90% of the span in optimized blade P is obviously larger than the improvement in the baseline blade. Figure 20b shows that the efficiency improvement induced by CT_p is concentrated in the region above 85% of the span. The improvement of the efficiency in optimized blade P is also larger than the corresponding improvement in the baseline blade. The comparison of the diffusion factors in the spanwise direction is shown in Figure 20c. In the solid casing rotor, the forward sweep and positive lean in optimized blade P slightly reduce the tip loading; however, when CT_p is installed, optimized blade P has a more significant tip loading reduction than what the baseline blade has. Meanwhile, the enhancement of the loading in the non-tip region induced by CT_p is larger in optimized blade P than that in the baseline blade 0, which indicates that the forward swept and positive leaned blade tip improves the effectiveness of CT_p. These three plots demonstrate that the good performance of the optimal CGCT-blade combination is attributable to the redistributed spanwise loading caused by the CGCT-blade interactions in the tip region. Because the optimization does not change the design point performance of the solid casing rotor, the spanwise loading redistribution works to improve the CGCT-blade interactions, which is helpful to achieve a better overall performance of the CGCT-blade combination.
Figure 20a shows that the difference in the total pressure ratio between 0 + CT_p and P + CT_p is remarkable at 85% of the span; thus, the static pressure () distributions at the corresponding position are plotted in Figure 21 for comparison. The forward sweep and positive lean in the tip of blade P push the shockwave downstream, leading to a larger aft-loading in chordwise direction. After installing CT_p, on the pressure side is increased. Compared with CT_p in the baseline blade, the zoom-in view in this figure shows that CT_p in the optimized blade is more effective at increasing on the pressure side between 50% and 95% of the chord length. Note that in this section of the optimized blade with a solid casing equals of the baseline blade with a solid casing, which means the increase of induced by CGCT is further improved after the CGCT-blade optimization.
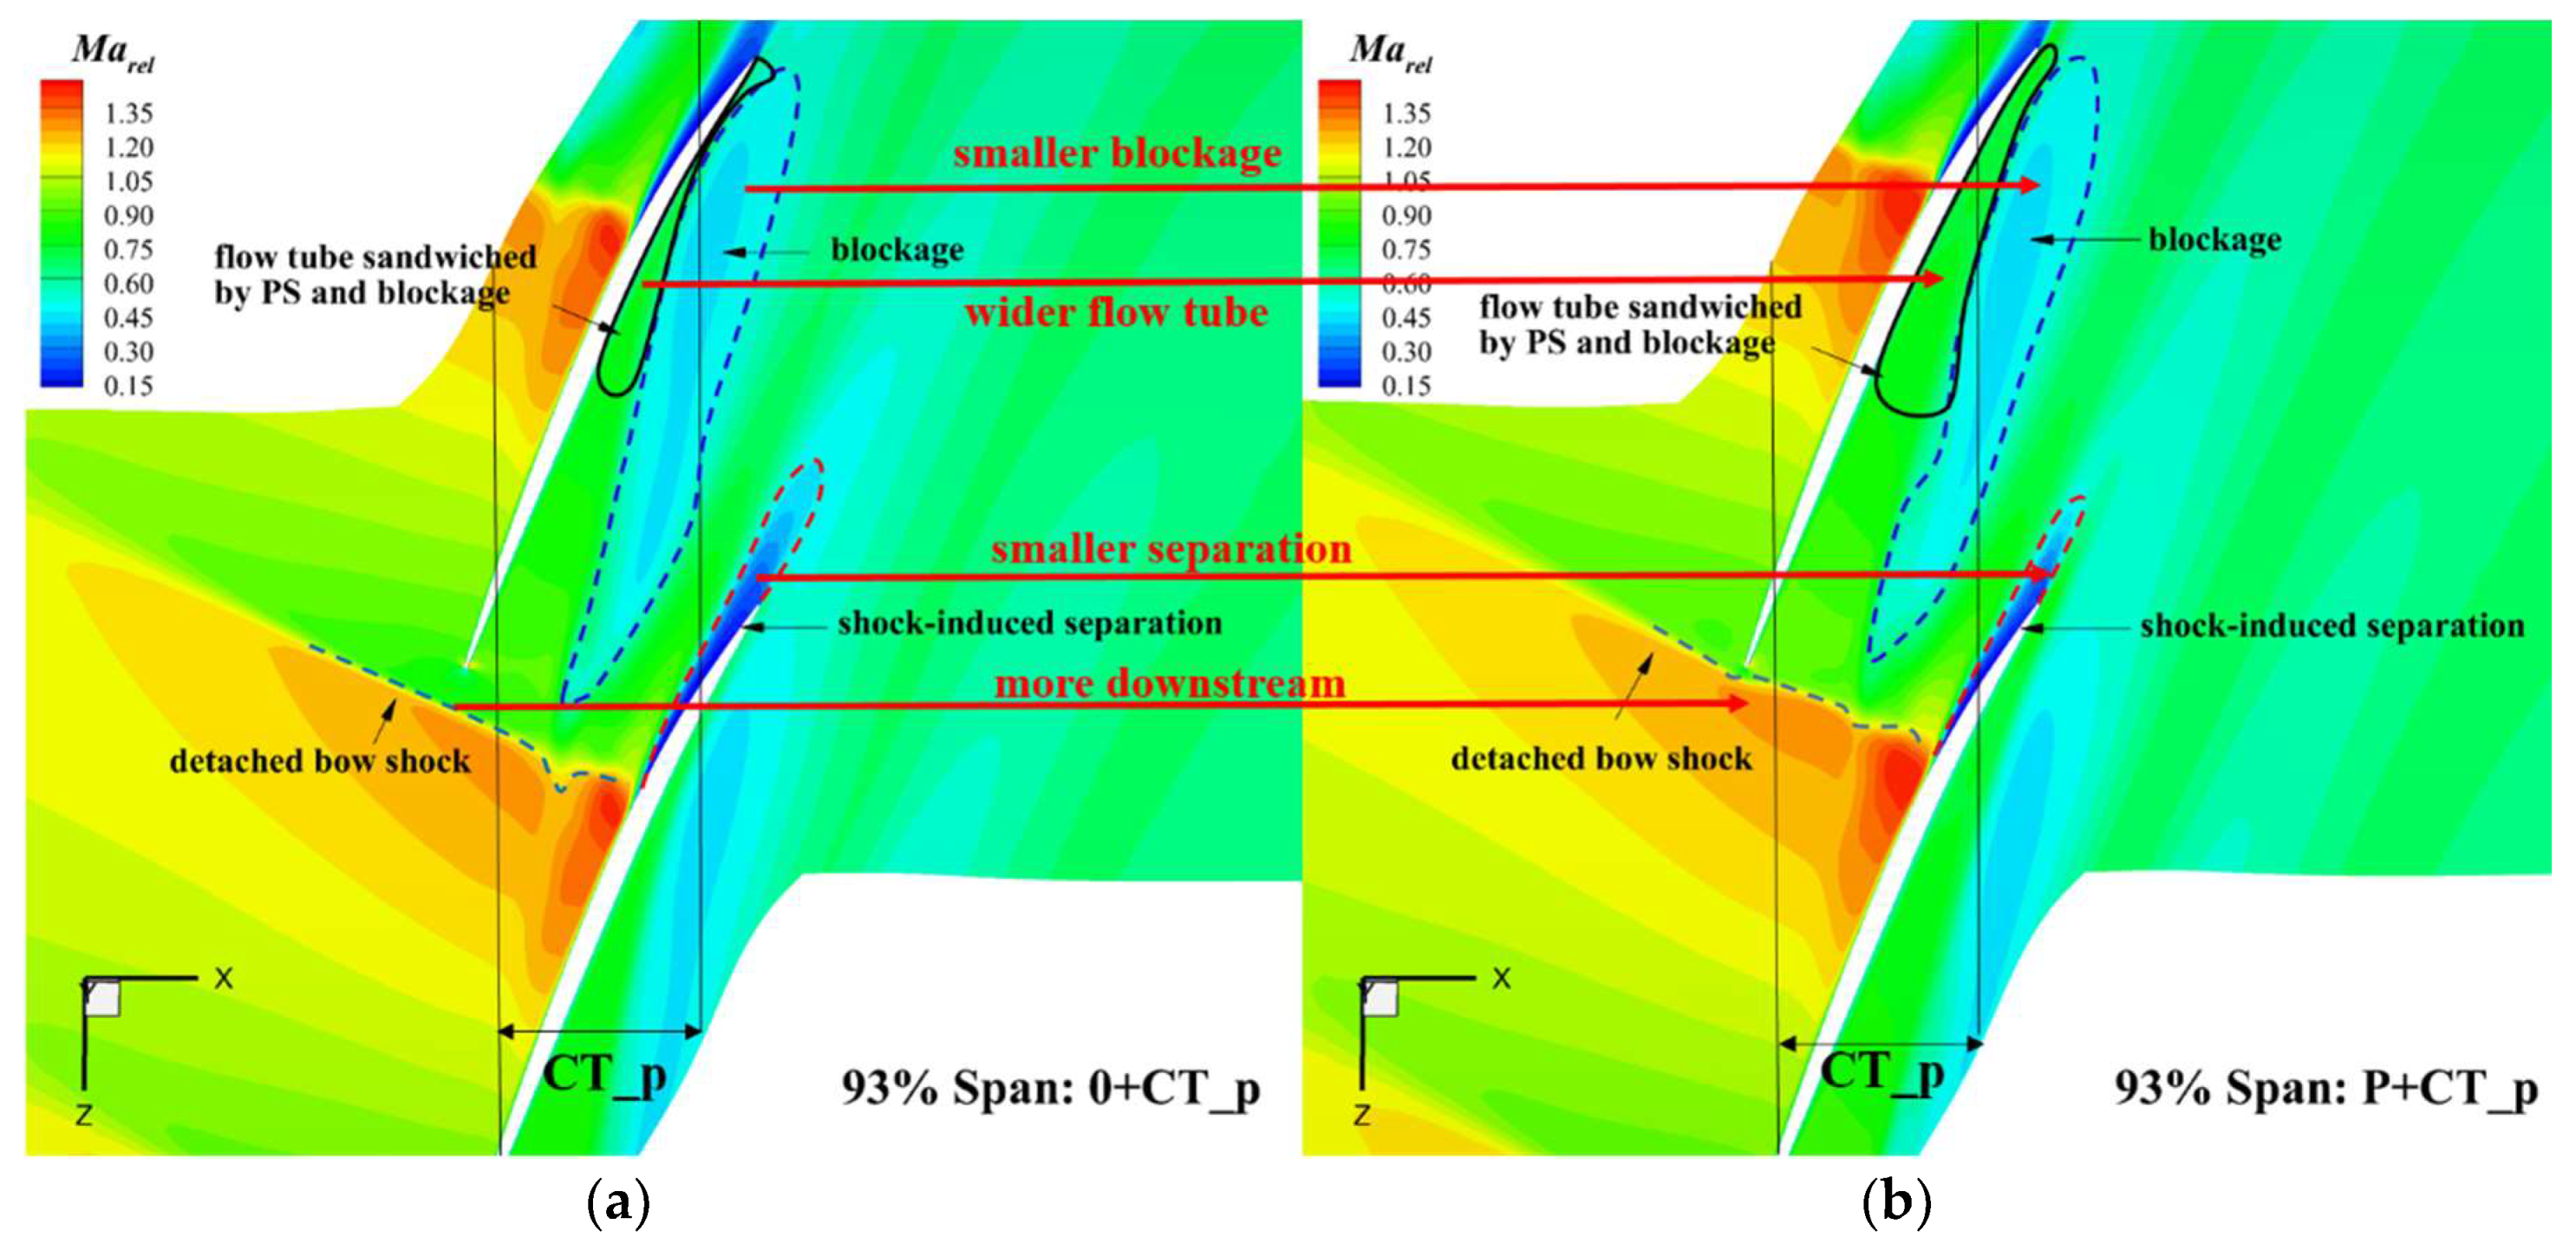
At 93% of the span, flow structures of 0 + CT_p and P + CT_p are shown in Figure 22. The main differences between the two flow fields are illustrated in this figure. The detached bow shock in the flow passage of blade P that has a forward swept and positive leaned tip is closer to the downstream. The area of the shock-induced separation on the suction side (SS) of blade P is also smaller. Moreover, because CGCT in blade P is more effective at relieving the blockage than CGCT in the baseline blade is, the flow tube sandwiched between PS and the blockage expands, which decelerates the near-wall flow inside the tube and increases the static pressure in the aft-part of the blade tip (see Figure 21). To sum up, when the airfoil is more aft-loaded in chordwise direction due to the forward sweep and positive lean, the effectiveness of CGCT to enhance the working capacity of the aft-part of the blade is improved.
6. Conclusions
This paper studies multiple circumferential casing grooves’ axial distribution design and optimization. The conventional CGCT design with a given blade is developed into a CGCT-blade integrated optimization. In the process of the optimization, the performance of CGCT-blade combinations is evaluated at the choking point, design point and near-stall point, which fulfills the constraints while improving the objectives. The work can be summarized as follows:
(1) A CGCT-blade combination with good design point performance does not necessarily results in good near-stall performance. For the ND-TAC rotor, the most effective CGCT that leads to the greatest working capacity improvement in the blade at the design point is located between 40% and 100% of the tip chord length; however, this CGCT configuration results in the smallest stall margin enhancement, because the grooves near the trailing edge are ineffective at suppressing the growth of the blockage in the tip region. Therefore, it is suggested that the CGCT design should coordinate the effects of CGCT under both the design and near-stall conditions.
(2) The sweep and lean introduced to the tip alter the CGCT-blade interactions, leading to the performance variations. The working ability of the blade at different span, as well as the fluid exchange between the passage and the grooves, are affected by the 3D blading, thus, it is promising to obtain a better CGCT-blade combination if the sweep and lean are introduced in the process of the CGCT design.
(3) The CGCT-blade integrated optimization improves the coupling between the CGCT and the blade tip, which strengthens the ability of the CGCT in improving the rotor’s design point performance. Compared with the baseline blade and all of the tested re-stacked blades with CGCTs, the CGCT-blade integrated optimization achieves the highest total pressure ratio and adiabatic efficiency while maintaining a sufficient stall margin. In the optimal CGCT-blade combination, a forward swept and positive leaned tip are generated, together with a CGCT located between 11.7% and 82.5% of . In the spanwise direction, the blade loading is reduced in the tip region. In the chordwise direction, the detached bow shock is pushed downstream and the blade is more aft-loaded. These variations in loading are good for the CGCT to reduce the blockage and enhance the working capacity of the non-tip span and aft-part of the blade.
The newly developed CGCT-blade integration optimization method is helpful for advancing the understanding of CGCT-blade interactions. The combination of the CGCT and the 3D blading technique breaks the boundary between the CGCT design and the blade design. However, this design strategy is only verified in the ND-TAC rotor with the assistance of CFD. Efforts are needed to validate the effectiveness of this method in other types of rotors by both CFD calculations and experiments.
In future work, the CGCT-blade integrated design and optimization method will be refined by introducing more design variables to increase the design freedom of both the blade and CGCT.
Author Contributions
Formal Analysis, Software, Writing–Review & Editing, W.S.; Methodology, Data Curation, Project Administration, Y.Z.; Conceptualization, Resources, Supervision, H.C.
Funding
This work was supported by the National Natural Science Foundation of China (Grant No. 11872230).
Acknowledgments
The authors would like to thank the Notre Dame Turbomachinery Laboratory for providing the geometry and the experimental data of the ND-TAC.
Conflicts of Interest
The authors declare no conflict of interest.
Nomenclature
| Rotational speed (rpm) | |
| Blade tip velocity (m/s) | |
| Blade number | |
| Radius of casing (mm) | |
| Radius of hub (mm) | |
| Tip gap size (mm) | |
| Mass flow (kg/s) | |
| Stall mass flow (kg/s) | |
| Total pressure ratio | |
| Total temperature ratio | |
| Adiabatic efficiency | |
| Relative Mach number | |
| Non-dimensional relative total pressure | |
| Df | Diffusion factor |
| Relative radial velocity (m/s) | |
| Axial chord length (mm) | |
| Static pressure (Pa) | |
| PS | Pressure side |
| SS | Suction side |
References
- Broichhausen, K.D.; Ziegler, K.U. Supersonic and Transonic Compressors: Past, Status and Technology Trends. In Proceedings of the ASME Turbo Expo 2005: Power for Land, Sea, and Air, Reno, NV, USA, 6–9 June 2005; pp. 63–74. [Google Scholar] [CrossRef]
- Fujita, H.; Takata, H. A Study on Configurations of Casing Treatment for Axial Flow Compressors. Bull. JSME 1984, 27, 1675–1681. [Google Scholar] [CrossRef] [Green Version]
- Hathaway, M.D. Passive Endwall Treatments for Enhancing Stability; NASA Rep. No. TM-2007-214409; NASA Glenn Research Center: Cleveland, OH, USA, 2007.
- Rabe, D.C.; Hah, C. Application of Casing Circumferential Grooves for Improved Stall Margin in a Transonic Axial Compressor. In Proceedings of the ASME Turbo Expo 2002: Power for Land, Sea, and Air, Amsterdam, The Netherlands, 3–6 June 2002; pp. 1141–1153. [Google Scholar] [CrossRef]
- Müller, M.W.; Schiffer, H.-P.; Hah, C. Effect of Circumferential Grooves on the Aerodynamic Performance of an Axial Single-Stage Transonic Compressor. In Proceedings of the ASME Turbo Expo 2007: Power for Land, Sea, and Air, Montreal, QC, Canada, 14–17 May 2007; pp. 115–124. [Google Scholar] [CrossRef]
- Sakuma, Y.; Watanabe, T.; Himeno, T.; Kato, D.; Murooka, T.; Shuto, Y. Numerical Analysis of Flow in a Transonic Compressor with a Single Circumferential Casing Groove: Influence of Groove Location and Depth on Flow Instability. J. Turbomach. 2013, 136, 031017. [Google Scholar] [CrossRef]
- Houghton, T.; Day, I. Stability Enhancement by Casing Grooves: The Importance of Stall Inception Mechanism and Solidity. J. Turbomach. 2012, 134, 021003. [Google Scholar] [CrossRef]
- Du, J.; Li, J.; Gao, L.; Lin, F.; Chen, J. The Impact of Casing Groove Location on Stall Margin and Tip Clearance Flow in a Low-Speed Axial Compressor. J. Turbomach. 2016, 138, 121007. [Google Scholar] [CrossRef]
- Minsuk Choi Effects of circumferential casing grooves on the performance of a transonic axial compressor. Int. J. Turbo Jet-Engines 2010, 32, 361–371. [CrossRef]
- Mao, X.; Liu, B.; Tang, T.; Zhao, H. The impact of casing groove location on the flow instability in a counter-rotating axial flow compressor. Aerosp. Sci. Technol. 2018, 76, 250–259. [Google Scholar] [CrossRef]
- Kim, J.H.; Choi, K.J.; Kim, K.Y. Aerodynamic analysis and optimization of a transonic axial compressor with casing grooves to improve operating stability. Aerosp. Sci. Technol. 2013, 29, 81–91. [Google Scholar] [CrossRef]
- Zhao, Q.; Zhou, X.; Xiang, X. Multi-objective optimization of groove casing treatment in a transonic compressor. Proc. Inst. Mech. Eng. Part A J. Power Energy 2014, 228, 626–637. [Google Scholar] [CrossRef]
- Houghton, T.O. Axial Compressor Stability Enhancement; University of Cambridge: Cambridge, UK, 2010. [Google Scholar]
- Denton, J.D.; Xu, L. The Effects of Lean and Sweep on Transonic Fan Performance. In Proceedings of the ASME Turbo Expo 2002: Power for Land, Sea, and Air, Amsterdam, The Netherlands, 3–6 June 2002; Volume 1, pp. 23–32. [Google Scholar] [CrossRef]
- Denton, J.D.; Xu, L. The exploitation of three-dimensional flow in turbomachinery design. Proc. Inst. Mech. Eng. Part C J. Mech. Eng. Sci. 1998, 213, 125–137. [Google Scholar] [CrossRef]
- Wadia, A.R.; Szucs, P.N.; Crall, D.W. Inner Workings of Aerodynamic Sweep. J. Turbomach. 1998, 120, 671. [Google Scholar] [CrossRef]
- Hah, C.; Puterbaugh, S.L.; Wadia, A. Control of Shock Structure and Secondary Flow Field inside Transonic Compressor Rotors through Aerodynamic Sweep. In Proceedings of the ASME 1998 International Gas Turbine and Aeroengine Congress and Exhibition, Stockholm, Sweden, 2–5 June 1998; pp. 1–15. [Google Scholar] [CrossRef]
- Gallimore, S.J.; Bolger, J.J.; Cumpsty, N.A.; Taylor, M.J.; Wright, P.I.; Place, J.M.M. The Use of Sweep and Dihedral in Multistage Axial Flow Compressor Blading—Part I: University Research andMethods Development. J. Turbomach. 2002, 124, 521–532. [Google Scholar] [CrossRef]
- Hah, C. The Inner Workings of Axial Casing Grooves in a One and a Half Stage Axial Compressor with a Large Rotor Tip Gap: Changes in Stall Margin and Efficiency. J. Turbomach. 2018, accepted. [Google Scholar]
- Goinis, G.; Nicke, E. Optimizing surge margin and efficiency of a transonic compressor. In Proceedings of the ASME Turbo Expo 2016: Turbomachinery Technical Conference and Exposition, Seoul, Korea, 13–17 June 2016; pp. 1–12. [Google Scholar] [CrossRef]
- Cameron, J.D.; Cameron, J.D.; Morris, S.C.; Morris, S.C.; Corke, T.C.; Corke, T.C. A Transonic Axial Compressor Facility for Fundamental Research and Flow Control Development. Mech. Eng. 2006. [Google Scholar] [CrossRef]
- Kelly, R.; Hickman, A.R.; Shi, K.; Morris, S.C.; Jemcov, A. Very Large Eddy Simulation of a Transonic Axial Compressor Stage. In Proceedings of the 52nd AIAA/SAE/ASEE Joint Propulsion Conference, Salt Lake City, UT, USA, 25–27 July 2016; pp. 1–13. [Google Scholar] [CrossRef]
- Cameron, J.D.; Morris, S.C. Spatial Correlation Based Stall Inception Analysis. In Proceedings of the ASME Turbo Expo 2007: Power for Land, Sea, and Air, Montreal, QC, Canada, 14–17 May 2007; pp. 433–444. [Google Scholar] [CrossRef]
- Chen, H.; Huang, X.; Shi, K.; Fu, S.; Ross, M.; Bennington, M.A.; Cameron, J.D.; Morris, S.C.; McNulty, S.; Wadia, A. A Computational Fluid Dynamics Study of Circumferential Groove Casing Treatment in a Transonic Axial Compressor. J. Turbomach. 2013, 136, 031003. [Google Scholar] [CrossRef]
- Shi, K.; Chen, H.X.; Fu, S. Numerical investigation of the casing treatment mechanism with a single circumferential groove. Sci. China Phys. Mech. Astron. 2013, 56, 353–365. [Google Scholar] [CrossRef]
- Toro, E.F.; Spruce, M.; Speares, W. Restoration of the contact surface in the HLL-Riemann solver. Shock Waves 1994, 4, 25–34. [Google Scholar] [CrossRef]
- Van Leer, B. Towards the ultimate conservative difference scheme III. Upstream-centered finite-difference schemes for ideal compressible flow. J. Comput. Phys. 1977, 23, 263–275. [Google Scholar] [CrossRef]
- Van Albada, G.D.; Van Leer, B.; Roberts, W.W. A comparative study of computational methods in cosmic gas dynamics. Astron. Astrophys. 1982, 108, 76–84. [Google Scholar] [CrossRef]
- Menter, F.R. Improved two-equation k-omega turbulence models for aerodynamic flows. NASA Tech. Memo. 1992, 1–31. [Google Scholar] [CrossRef]
- Yoon, S.; Jameson, A. Lower-upper Symmetric-Gauss-Seidel method for the Euler and Navier-Stokes equations. AIAA J. 1988, 26, 1025–1026. [Google Scholar] [CrossRef] [Green Version]
- Chen, H.X.; Fu, S.; Li, F.W. Navier-Stokes simulations for transport aircraft wing-body combinations with deployed high-lift systems. J. Aircr. 2003, 40, 883–890. [Google Scholar] [CrossRef]
- Huang, X.; Chen, H.; Fu, S. CFD Investigation on the Circumferential Grooves Casing Treatment of Transonic Compressor. In Proceedings of the ASME Turbo Expo 2008: Power for Land, Sea and Air, Berlin, Germany, 9–13 June 2008; pp. 1–9. [Google Scholar]
- Chen, H.; Huang, X.; Fu, S. CFD Investigation on Stall Mechanisms and Casing Treatment of a Transonic Compressor. In Proceedings of the 42nd AIAA/ASME/SAE/ASEE Joint Propulsion Conference & Exhibit, Sacramento, CA, USA, 9–12 July 2006. [Google Scholar] [CrossRef]
- Siller, U.; Voß, C.; Nicke, E. Automated Multidisciplinary Optimization of a Transonic Axial Compressor. In Proceedings of the 47th AIAA Aerospace Sciences Meeting Including The New Horizons Forum and Aerospace Exposition, Orlando, FL, USA, 5–8 January 2009; pp. 1–12. [Google Scholar] [CrossRef]
- Ji, L.; Chen, J.; Lin, F. Review and Understanding on Sweep in Axial Compressor Design. In Proceedings of the ASME Turbo Expo 2005: Power for Land, Sea, and Air, Reno, NV, USA, 6–9 June 2005; pp. 1–9. [Google Scholar] [CrossRef]
- Deng, K.; Chen, H. A Hybrid Aerodynamic Optimization Algorithm Based on Differential Evolution and RBF Response Surface. In Proceedings of the 17th AIAA/ISSMO Multidisciplinary Analysis and Optimization Conference, Washington, DC, USA, 13–17 June 2016. [Google Scholar] [CrossRef]
Figure 1.
Illustration of axial slots and circumferential grooves in a top view: (a) axial slots; (b) circumferential grooves.
Figure 1.
Illustration of axial slots and circumferential grooves in a top view: (a) axial slots; (b) circumferential grooves.
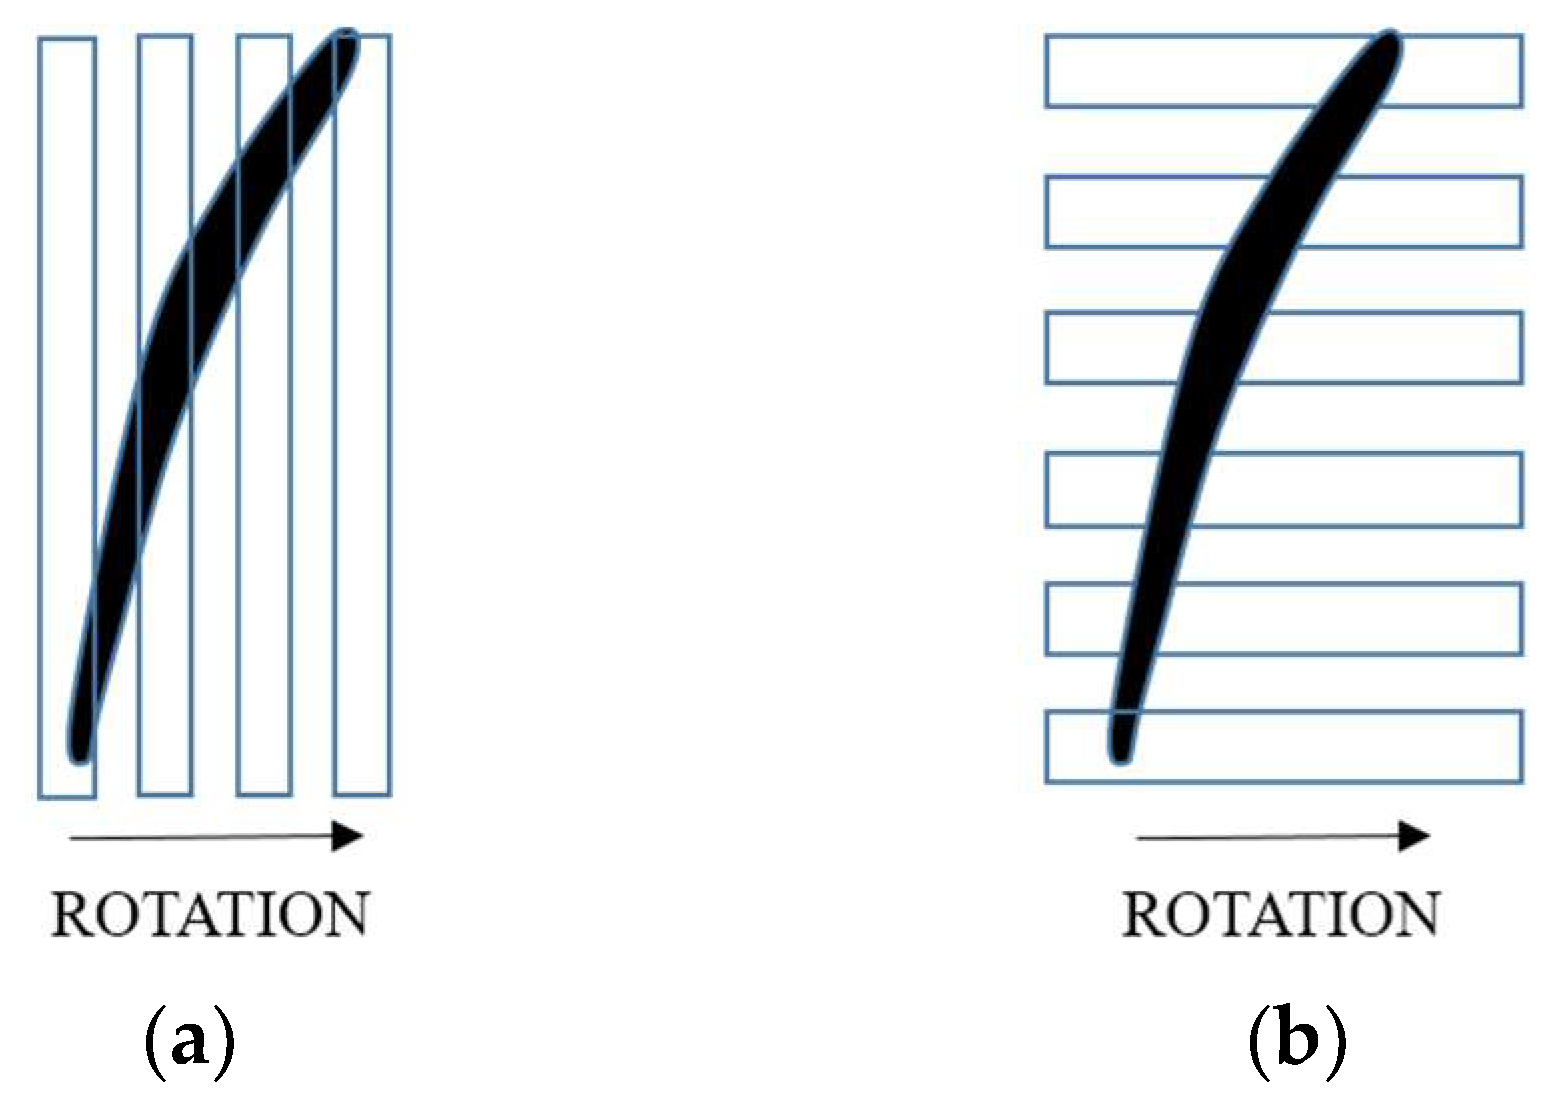
Figure 2.
Illustration of the parameterization of the sweep and lean: (a) The sweep; (b) the lean.
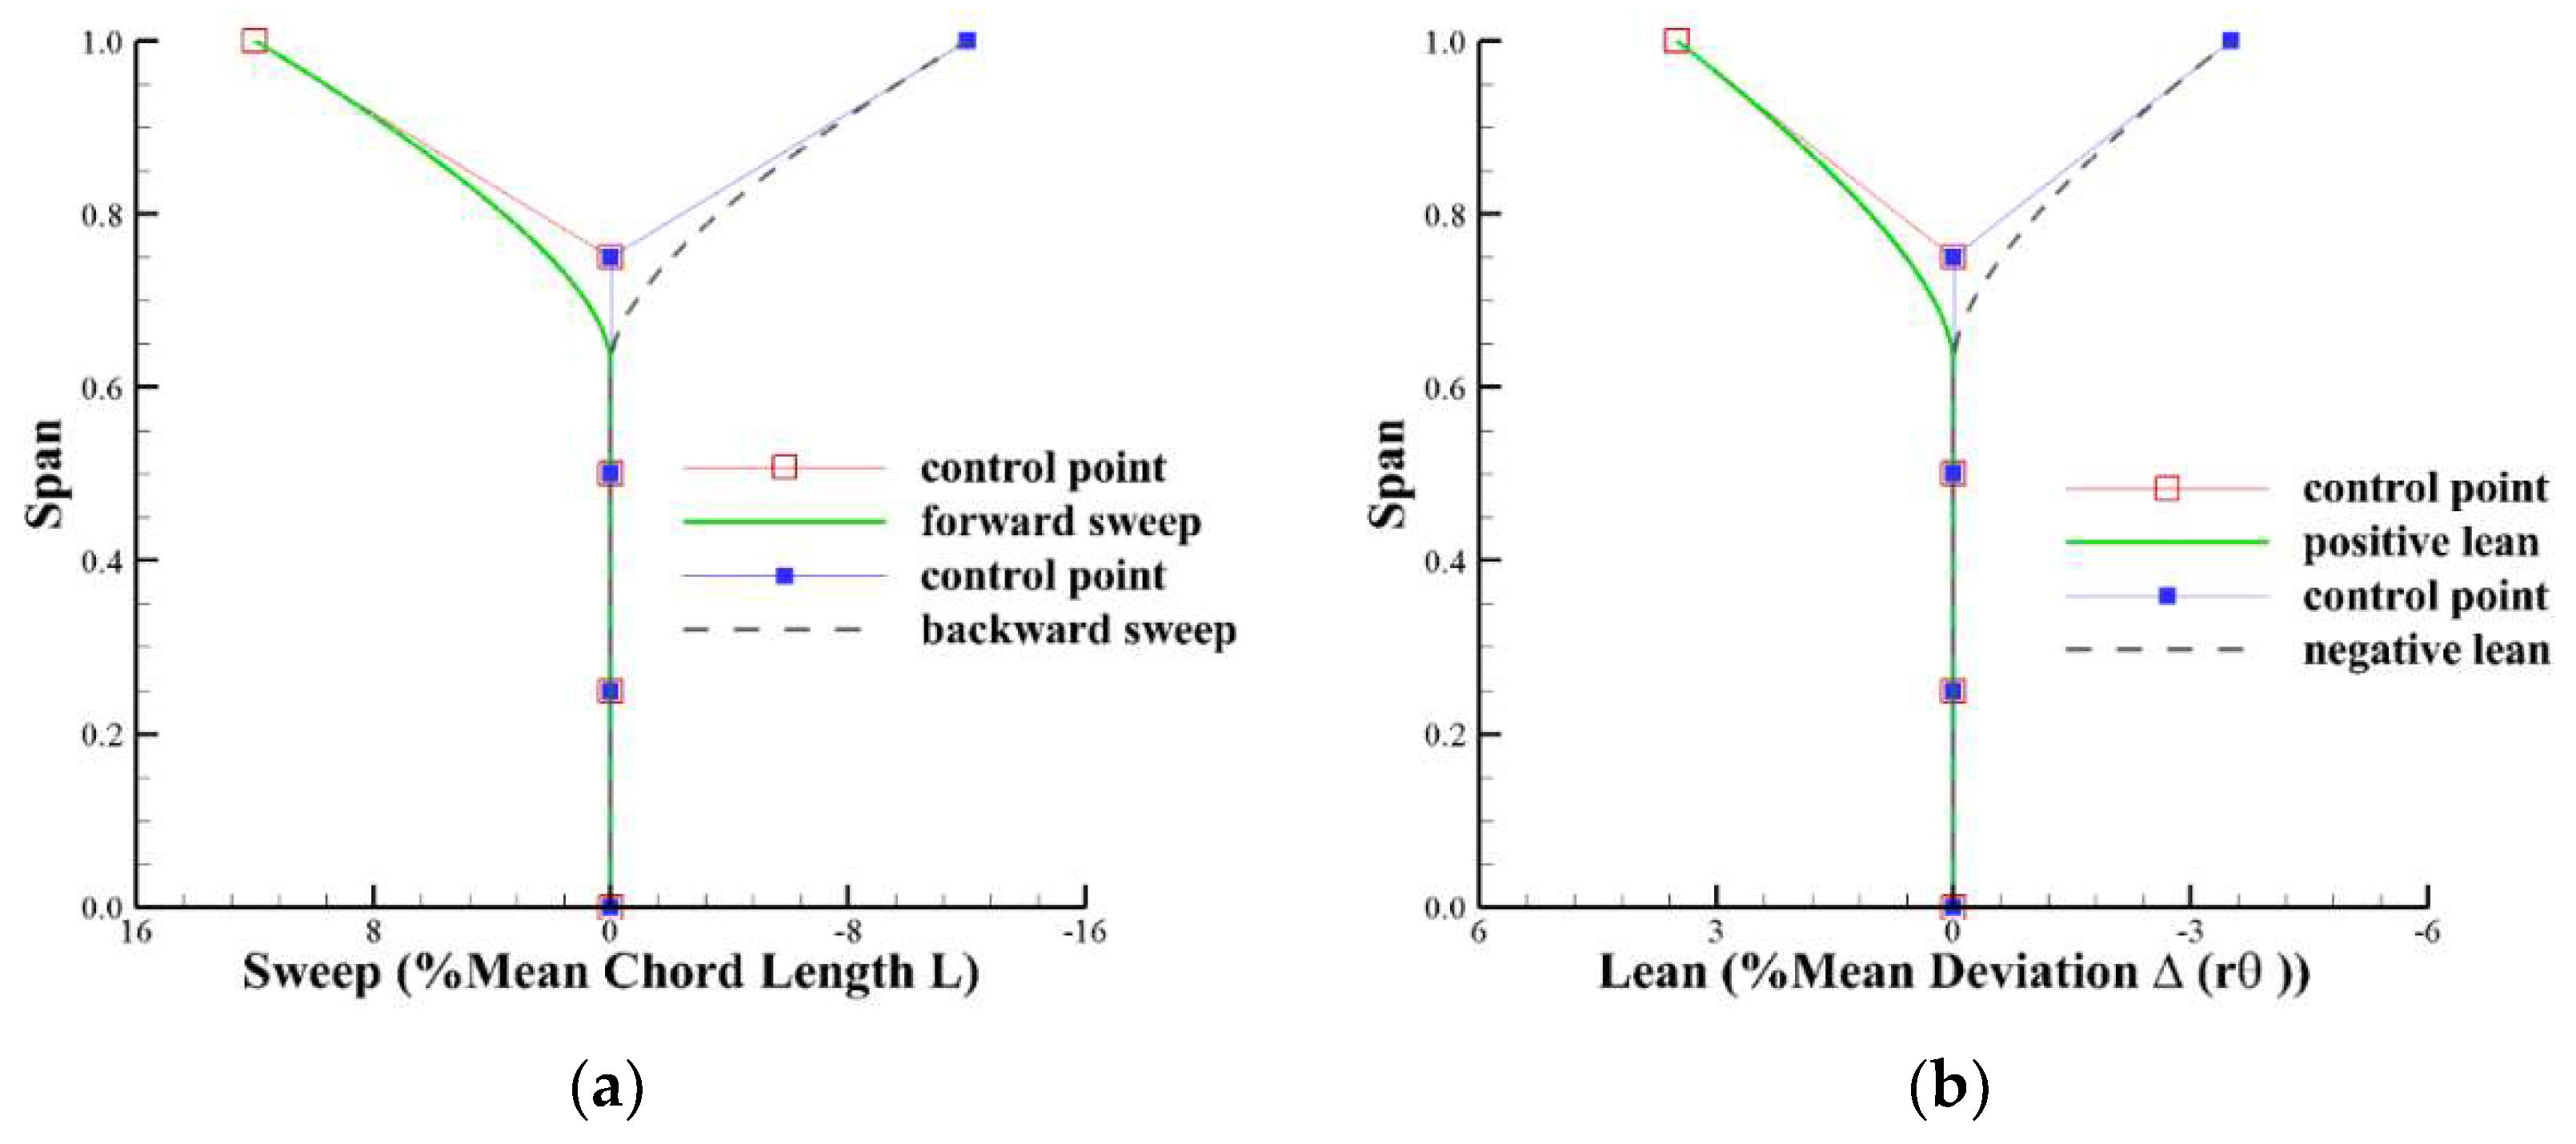
Figure 3.
Illustration of the circumferential groove casing treatment (CGCT) design parameters.

Figure 4.
Structured mesh in the computational domain. (a) The geometry of the baseline rotor blade with five circumferential grooves installed on the casing; (b) the side view of the grid distribution on the blade surface; (c) the top view of the grid distribution on the casing; (d) the grid distribution near the leading edge of the blade tip.
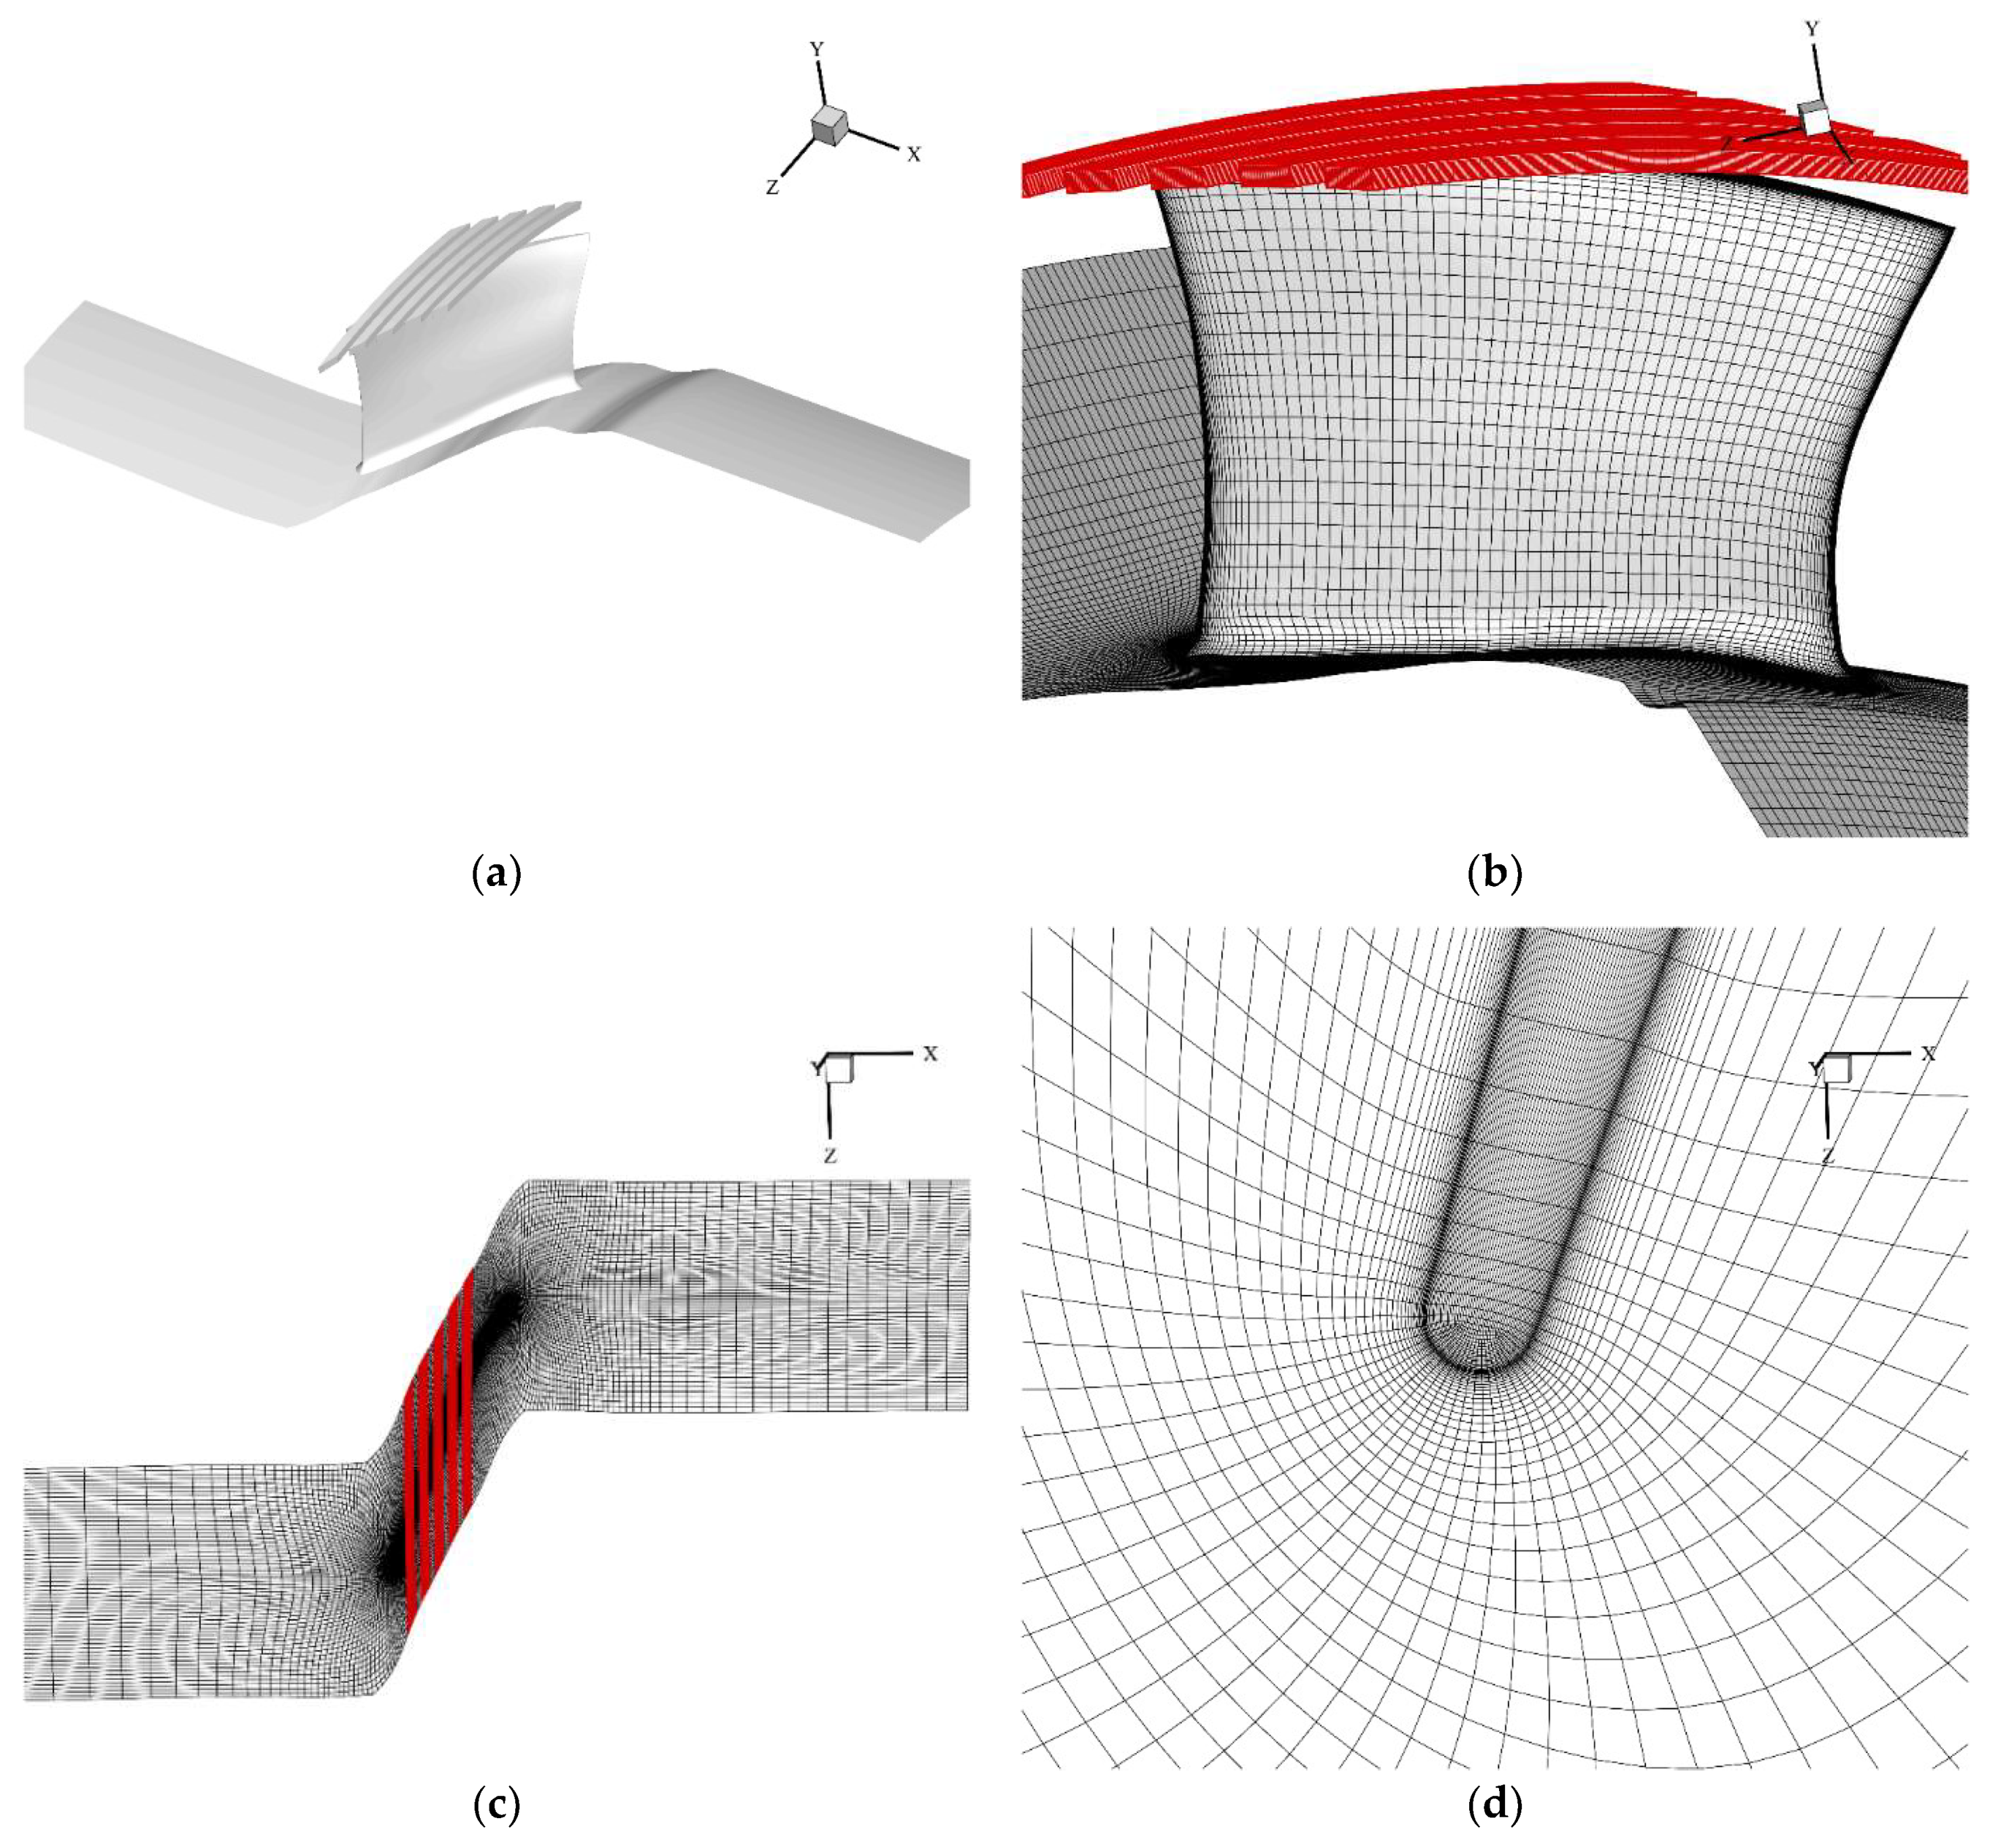
Figure 5.
Validation of the computational results. (a) The total pressure ratio versus the mass flow rate; (b) the total temperature ratio versus the mass flow rate; (c) the exit total pressure ratio versus the spanwise location at the mass flow of 9.344 kg/s; (d) the exit total temperature ratio versus the spanwise location at the mass flow of 9.344 kg/s.
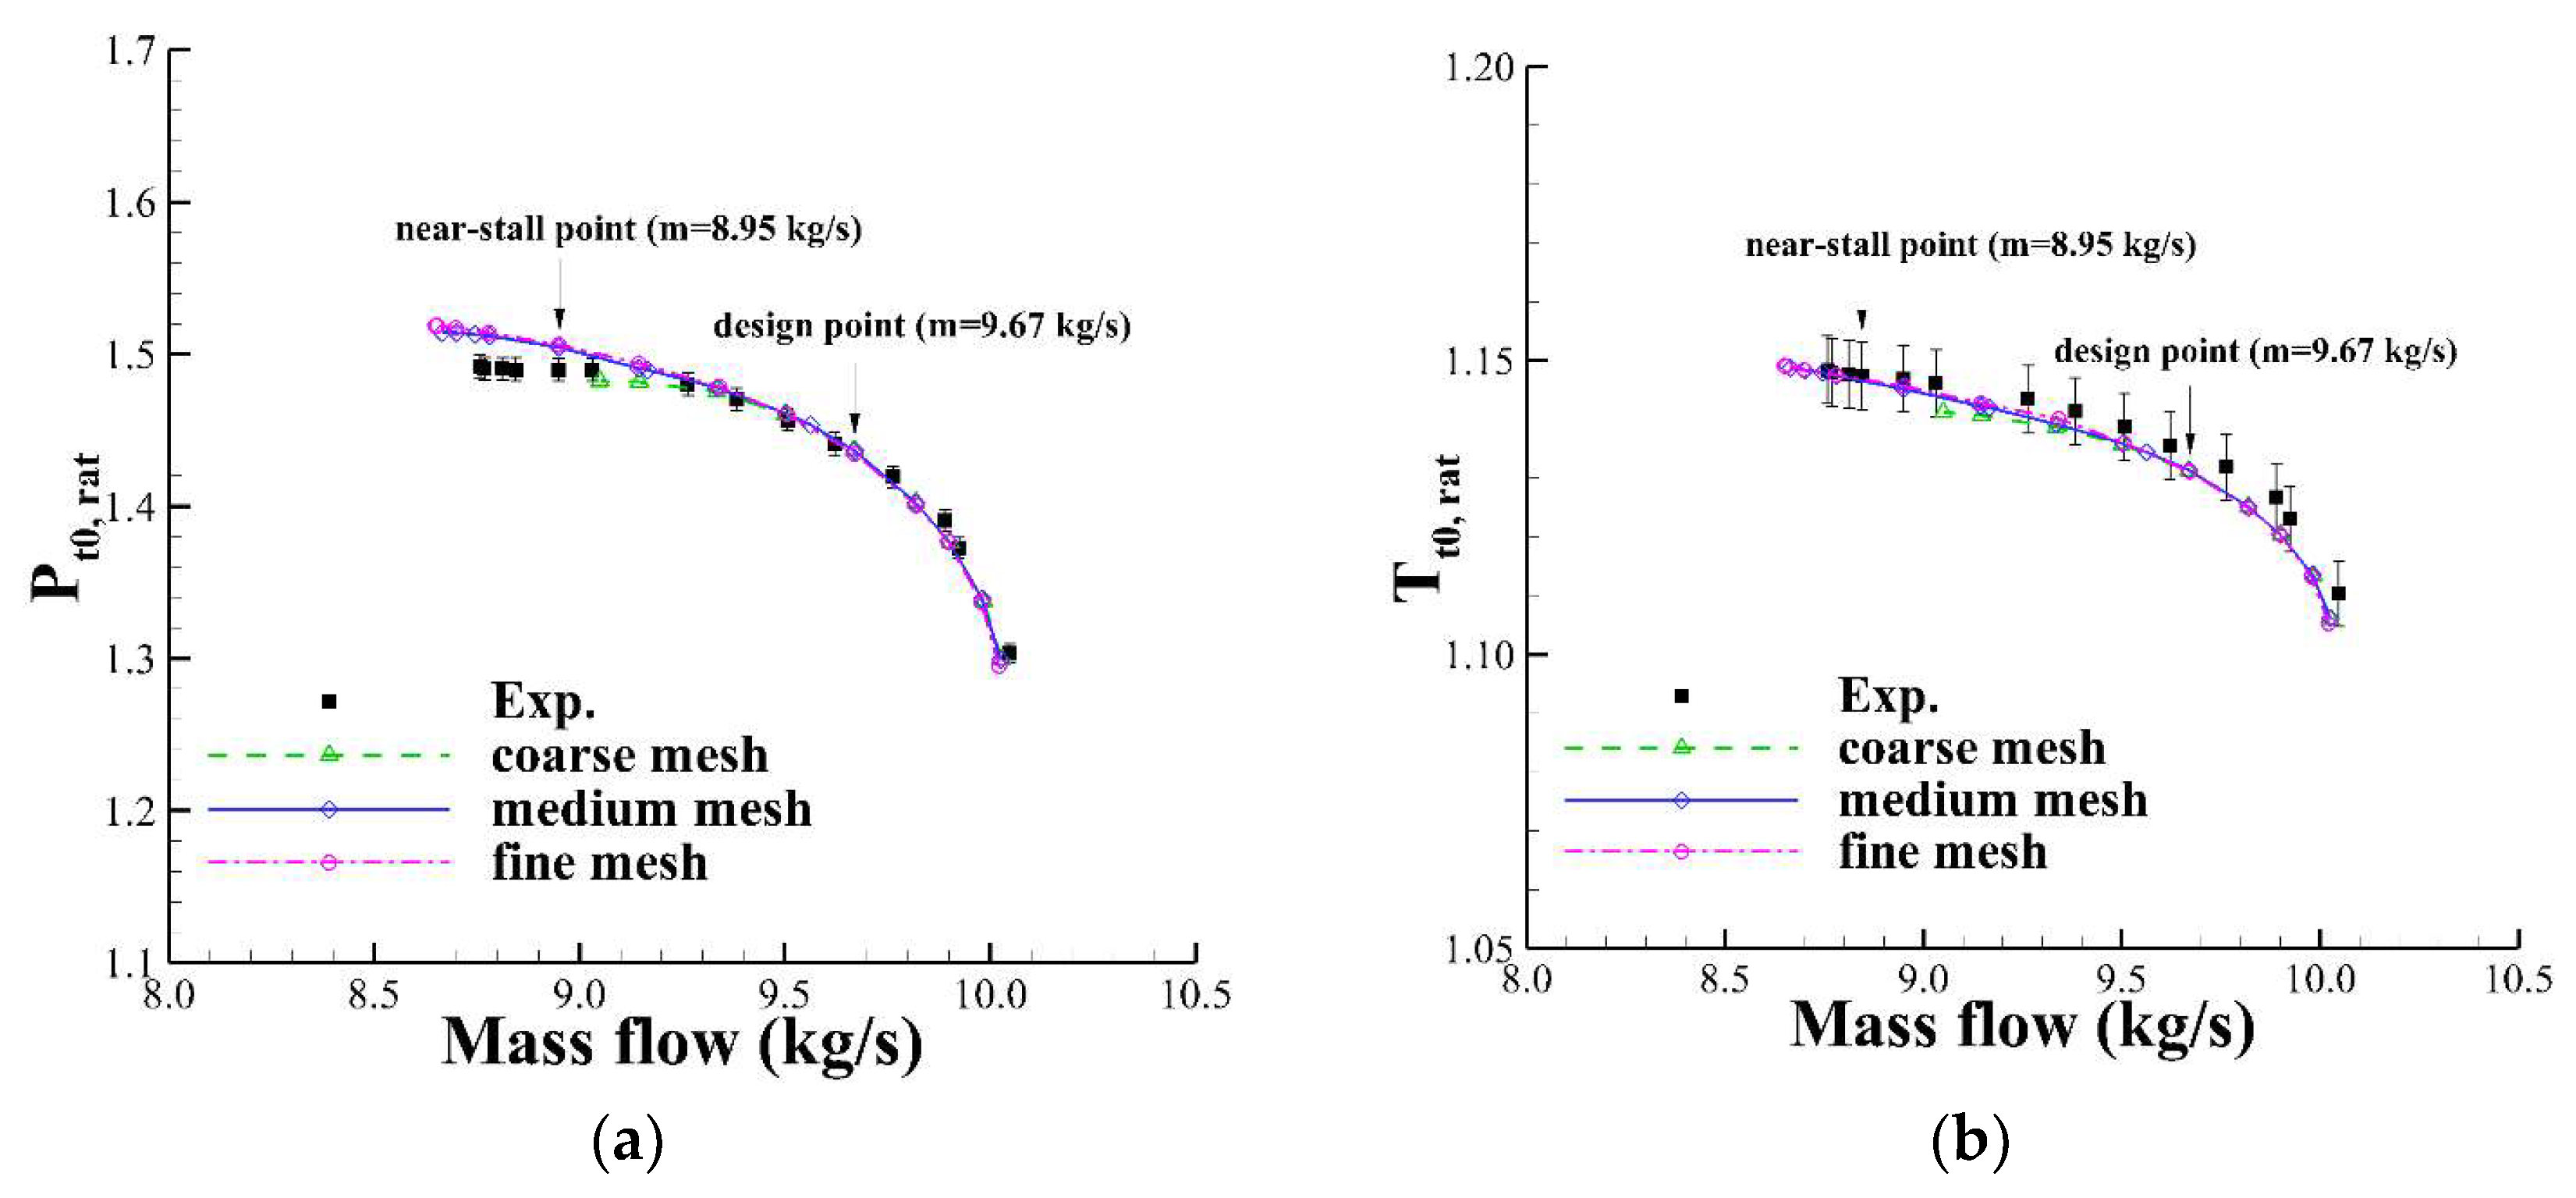
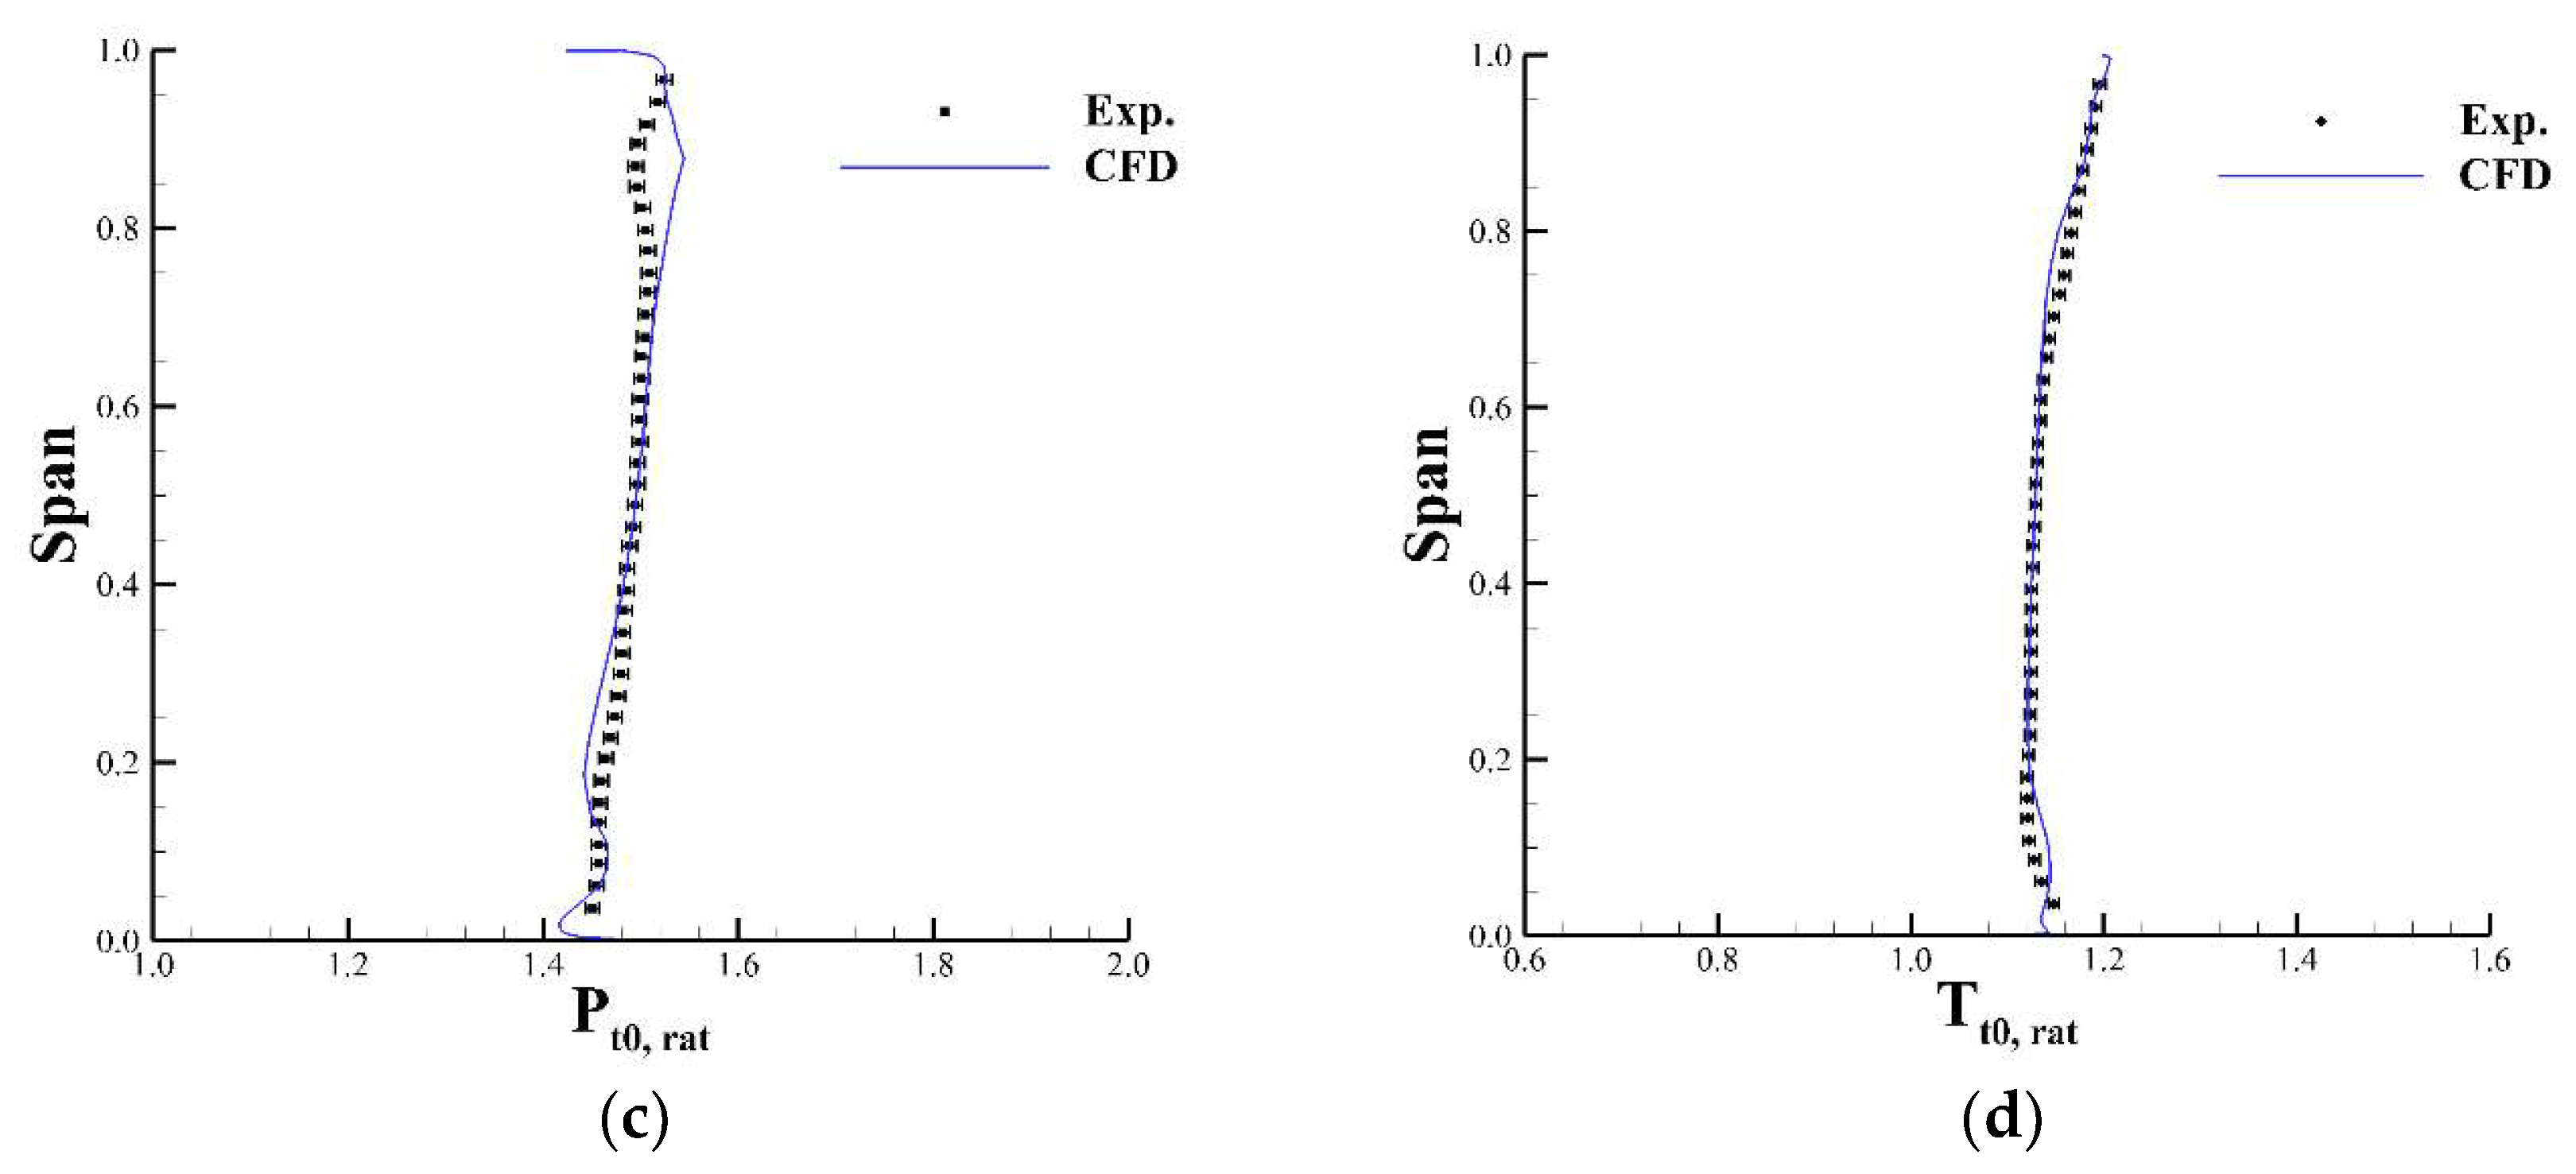
Figure 6.
Speed curves of the baseline blade installed with five CGCT configurations. (a) The total pressure ratio versus the mass flow rate; (b) the adiabatic efficiency versus the mass flow rate.
Figure 6.
Speed curves of the baseline blade installed with five CGCT configurations. (a) The total pressure ratio versus the mass flow rate; (b) the adiabatic efficiency versus the mass flow rate.

Figure 7.
Spanwise distribution of (a) the total pressure ratio, and (b) the adiabatic efficiency at the design point.
Figure 7.
Spanwise distribution of (a) the total pressure ratio, and (b) the adiabatic efficiency at the design point.
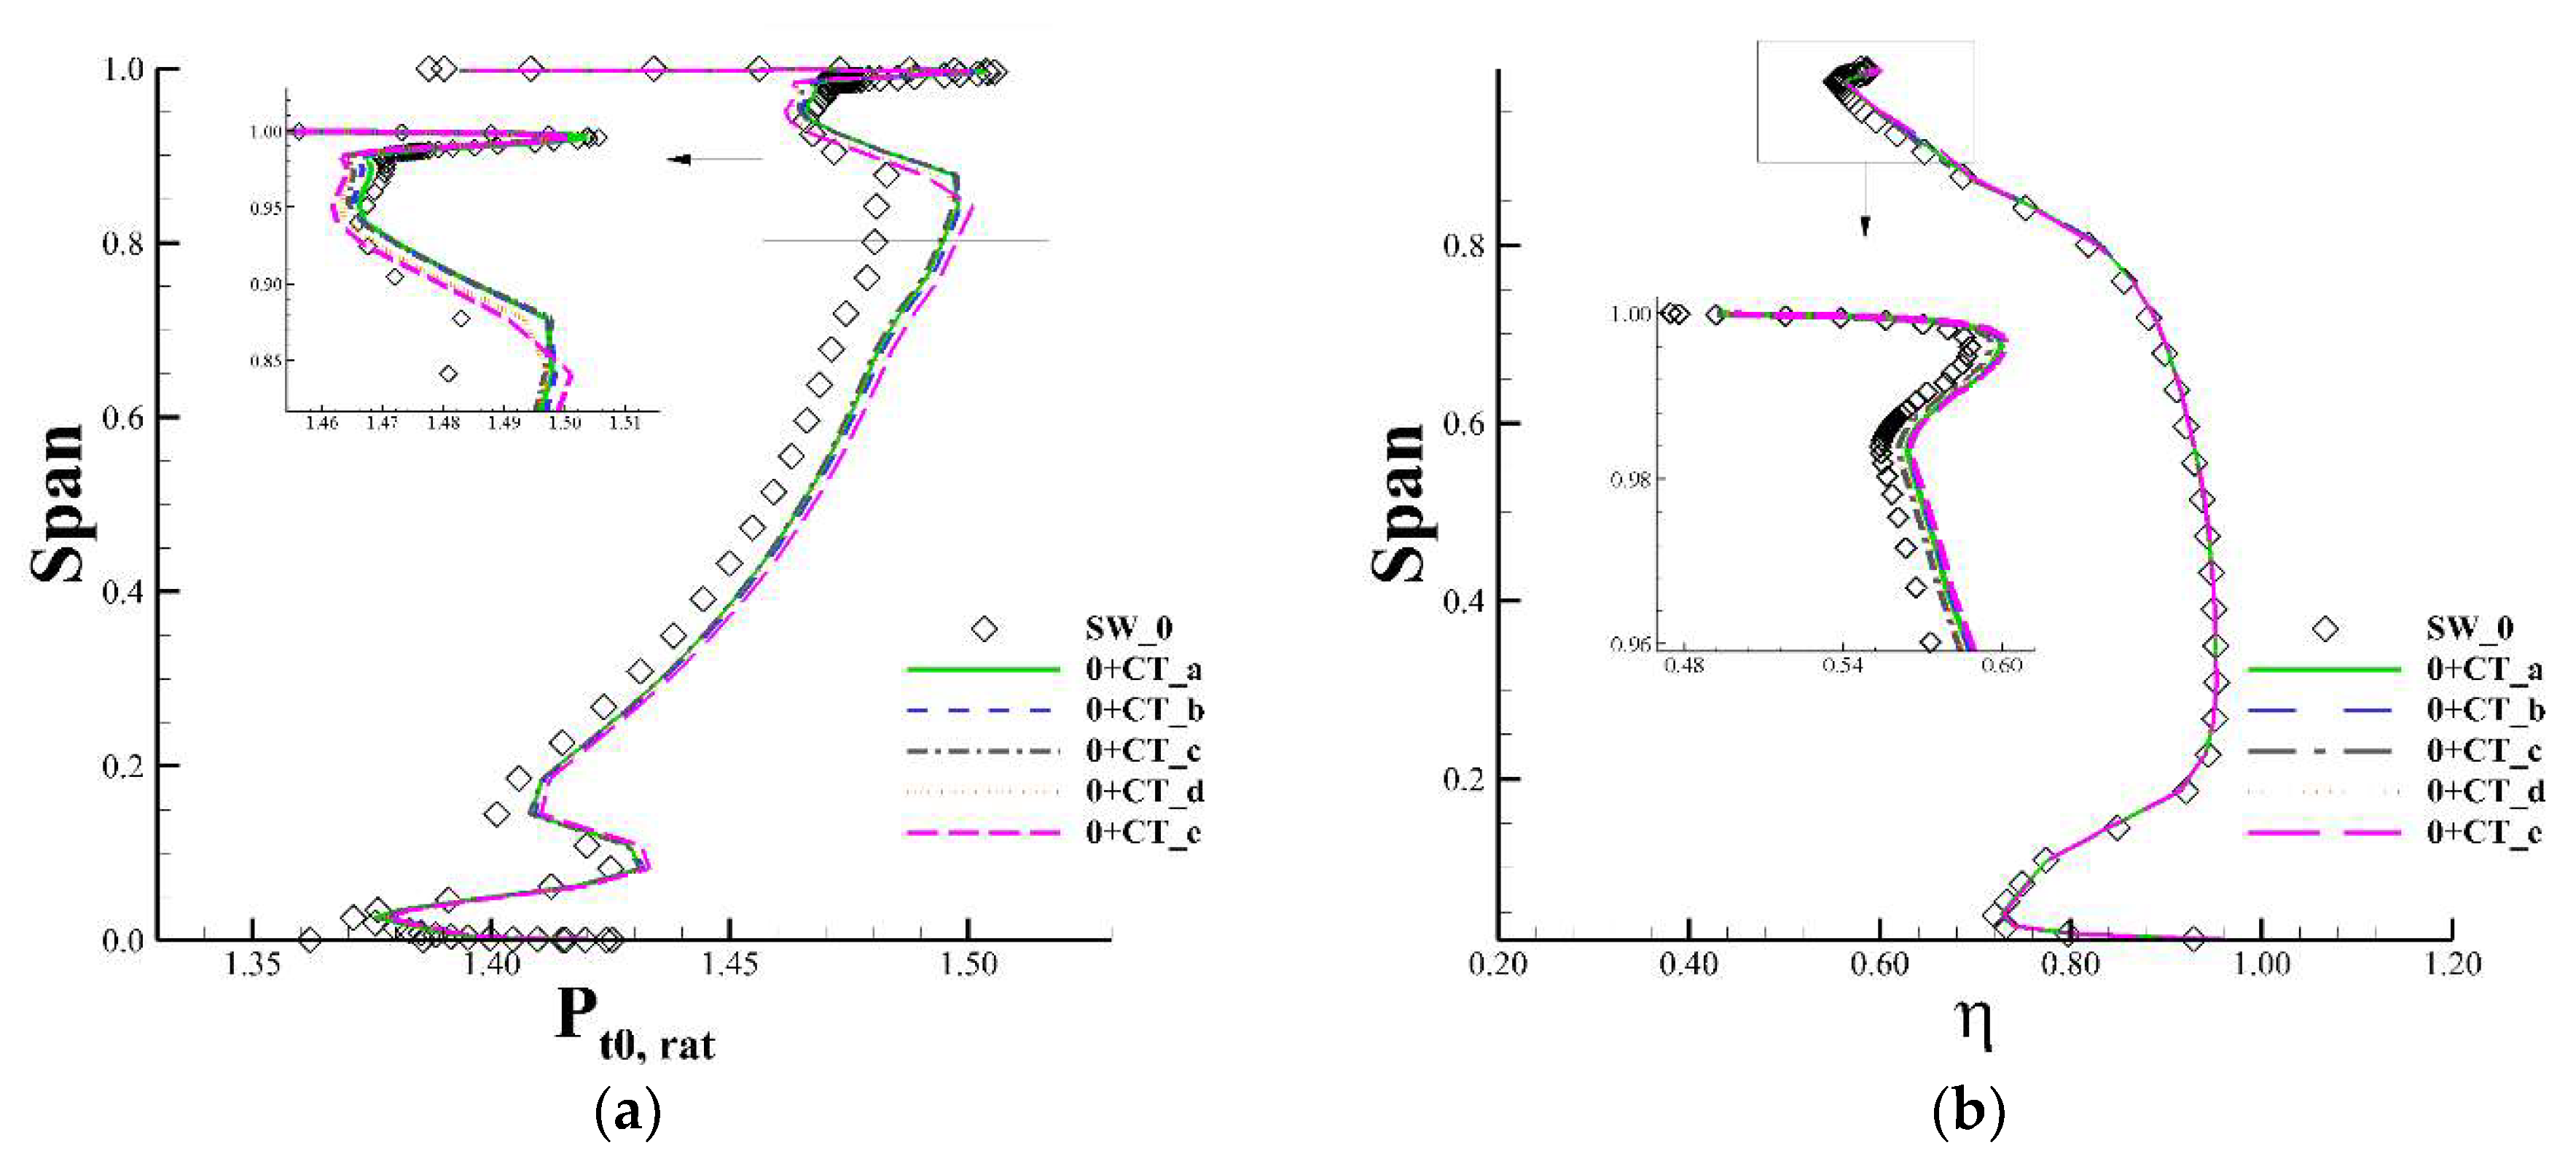
Figure 8.
Variation of the (a) total pressure ratio, (b) the adiabatic efficiency, and (c) the stall mass flow when different CGCTs are installed on the baseline blade at the design point.
Figure 8.
Variation of the (a) total pressure ratio, (b) the adiabatic efficiency, and (c) the stall mass flow when different CGCTs are installed on the baseline blade at the design point.

Figure 9.
The relative Mach number contours on the S1 plane for (a) SW_0 at the design point; (b) SW_0 at the near-stall point; (c) 0 + CT_c at the design point; (d) 0 + CT_c at the near-stall point, (e) 0 + CT_e at the design point, and (f) 0 + CT_e at the near-stall point.
Figure 9.
The relative Mach number contours on the S1 plane for (a) SW_0 at the design point; (b) SW_0 at the near-stall point; (c) 0 + CT_c at the design point; (d) 0 + CT_c at the near-stall point, (e) 0 + CT_e at the design point, and (f) 0 + CT_e at the near-stall point.


Figure 10.
The spanwise mass flow distribution at the near-stall point.

Figure 11.
The entropy contours on the Z-planes at the design point in (a) 0 + CT_c and (b) 0 + CT_e.
Figure 11.
The entropy contours on the Z-planes at the design point in (a) 0 + CT_c and (b) 0 + CT_e.
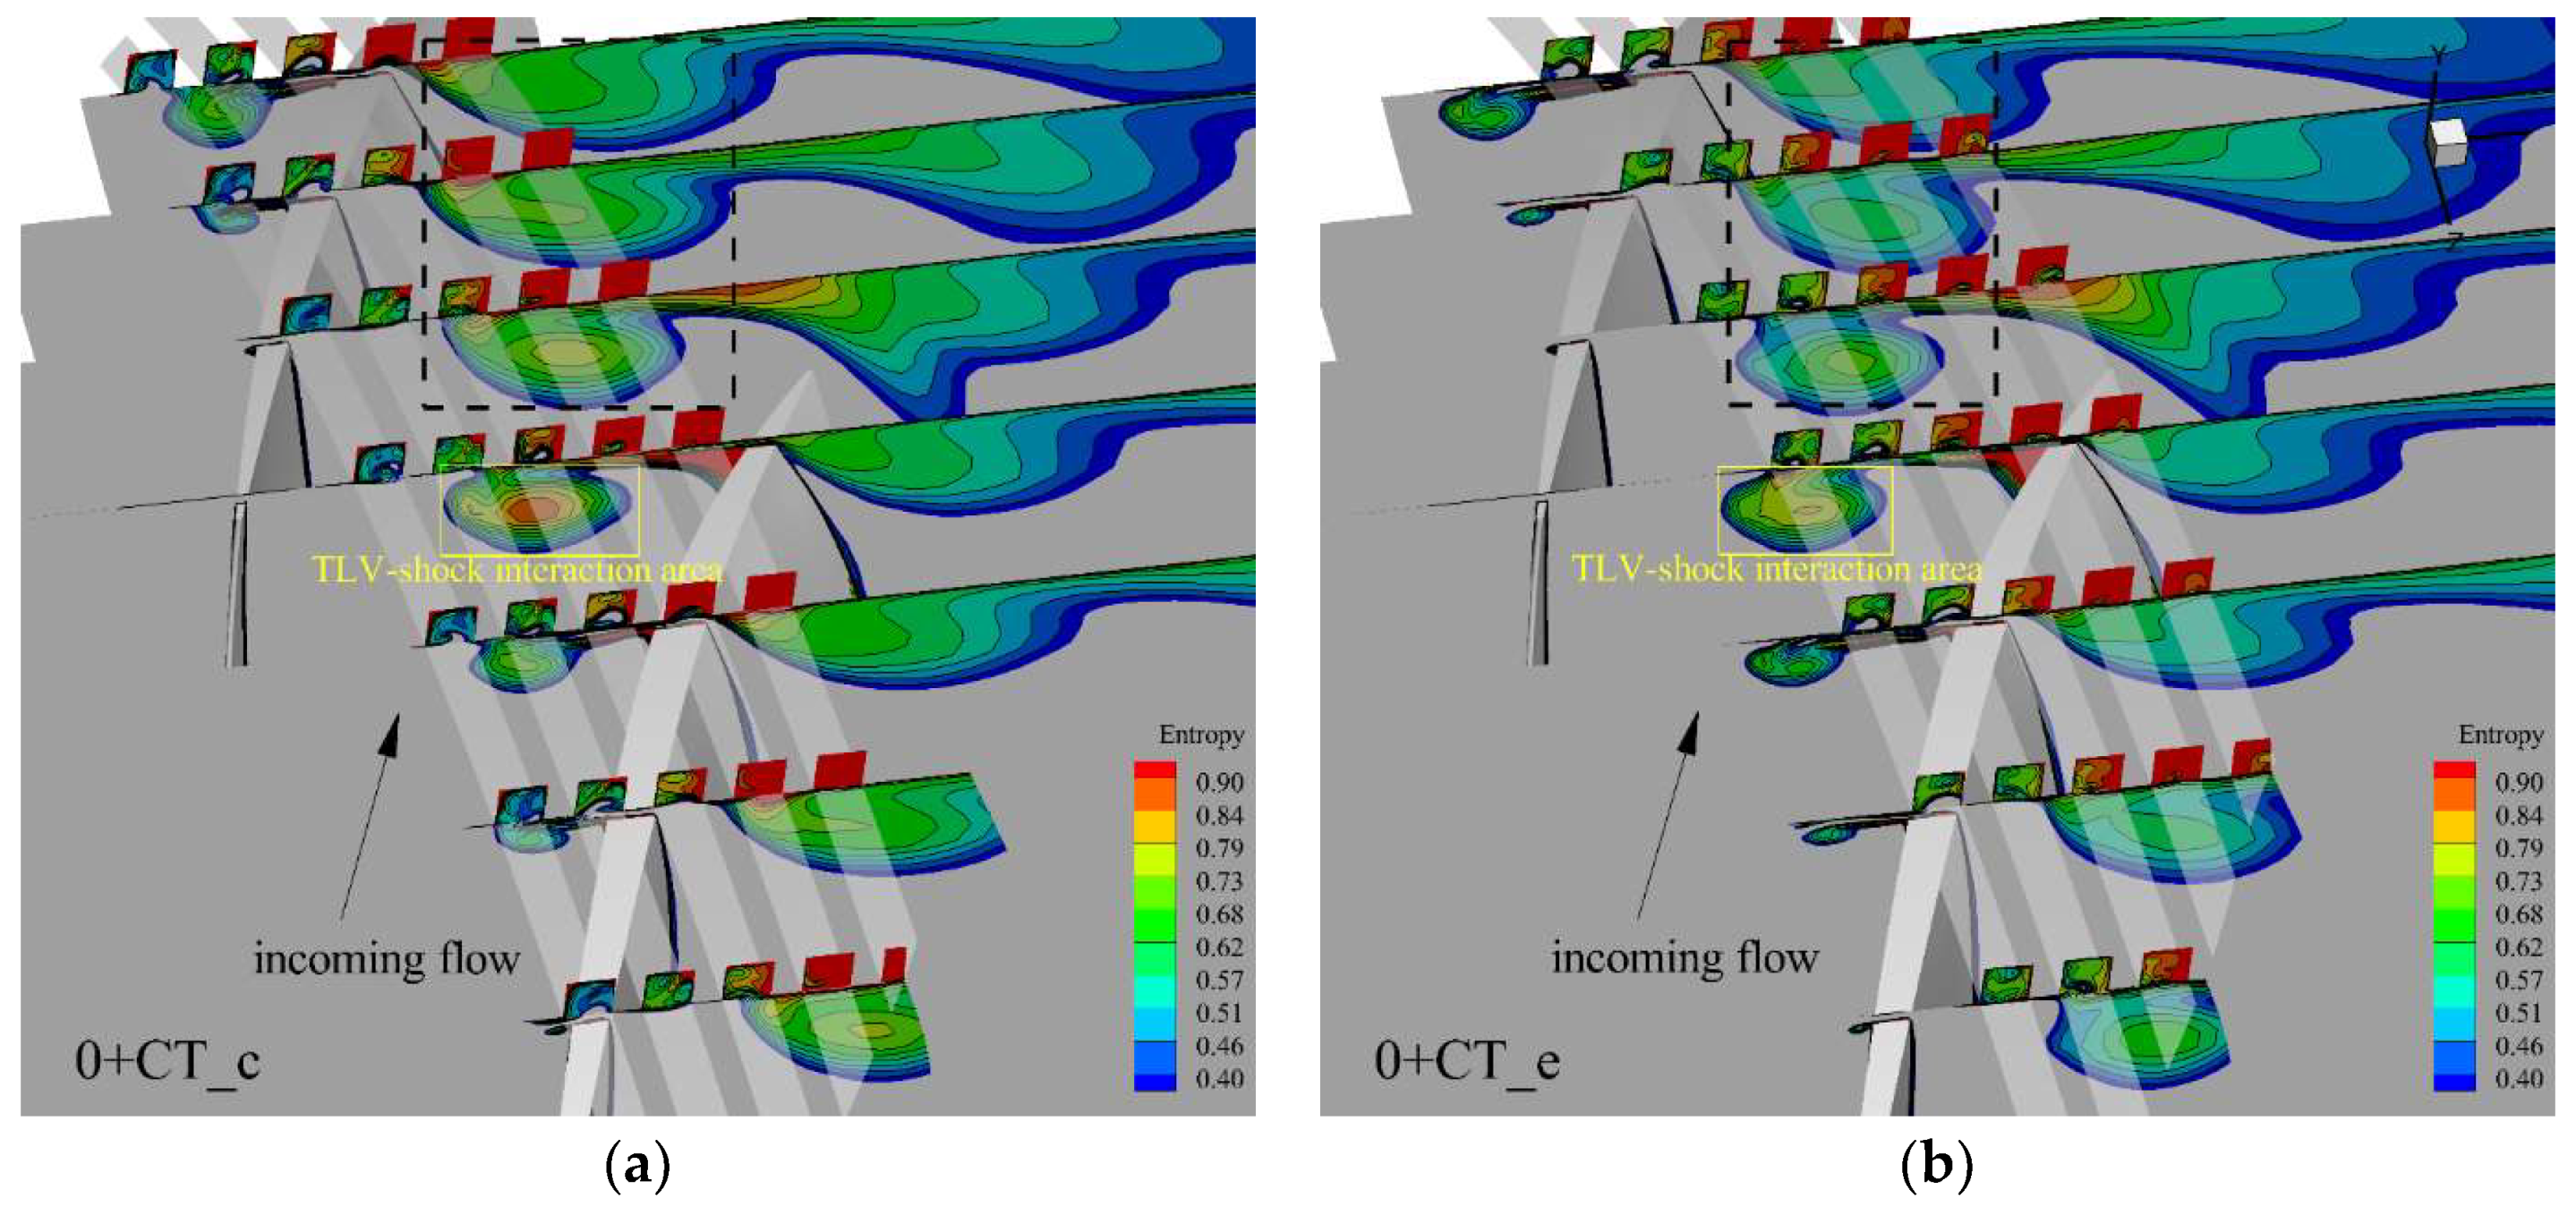
Figure 12.
Distribution of the non-dimensional relative total pressure in the tip gap at (a) the design point and (b) the near-stall point.
Figure 12.
Distribution of the non-dimensional relative total pressure in the tip gap at (a) the design point and (b) the near-stall point.
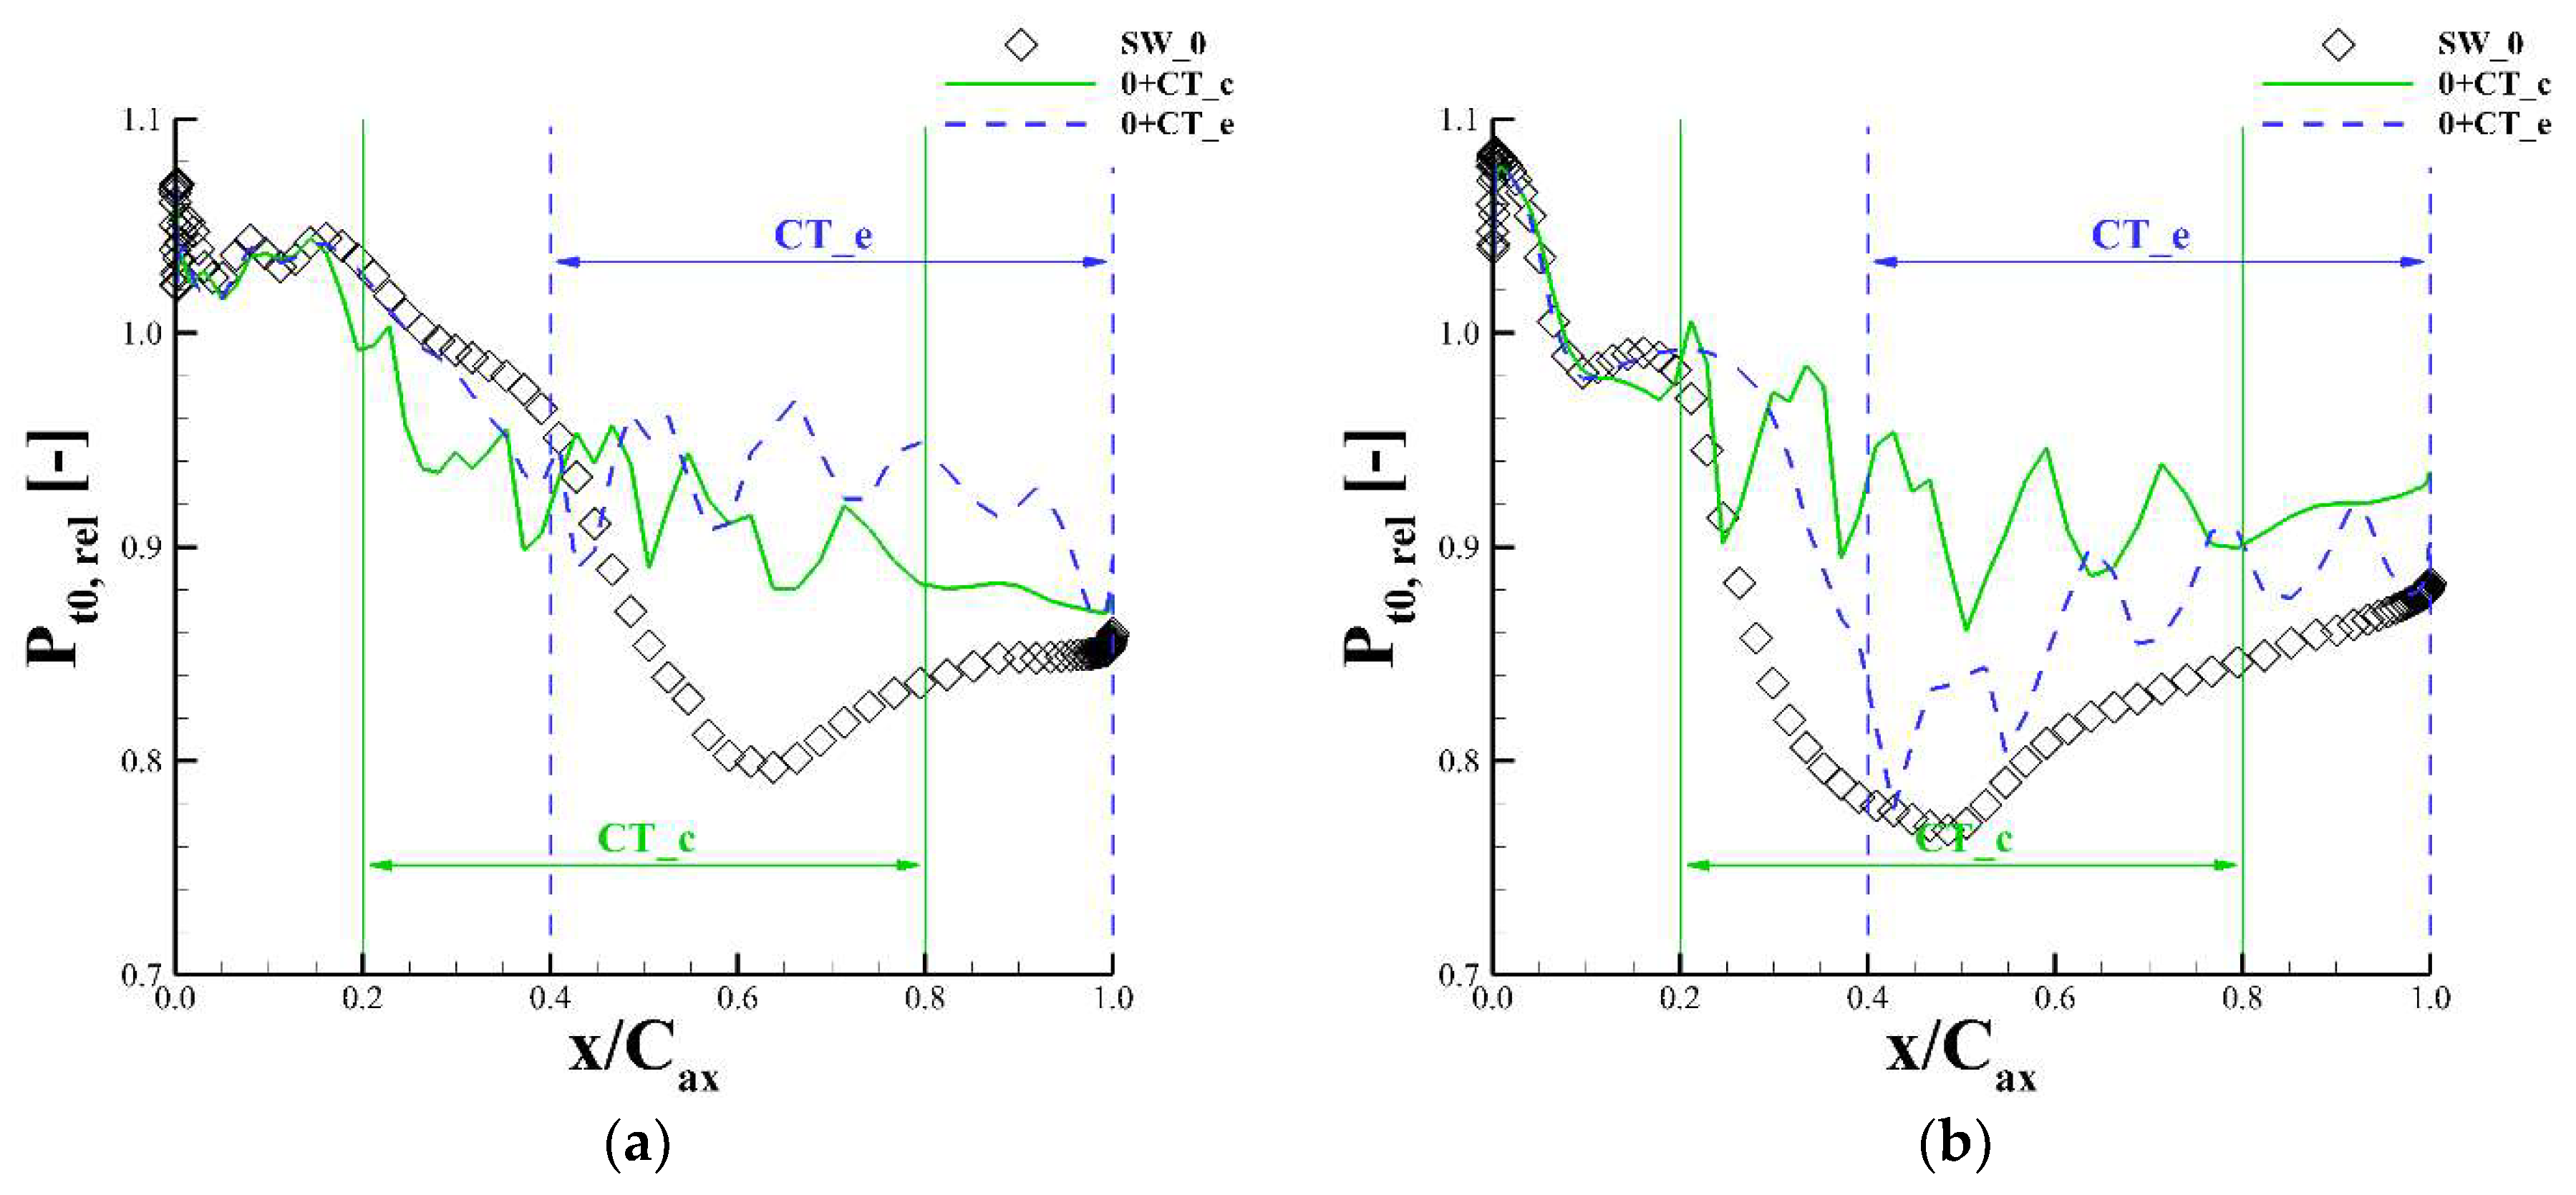
Figure 13.
3D shapes of the four re-stacked blades: (a) the tip of the forward swept blade FS; (b) the tip of the backward swept blade BS; (c) the tip of the positive leaned blade PL; (d) the tip of the negative leaned blade NL.
Figure 13.
3D shapes of the four re-stacked blades: (a) the tip of the forward swept blade FS; (b) the tip of the backward swept blade BS; (c) the tip of the positive leaned blade PL; (d) the tip of the negative leaned blade NL.
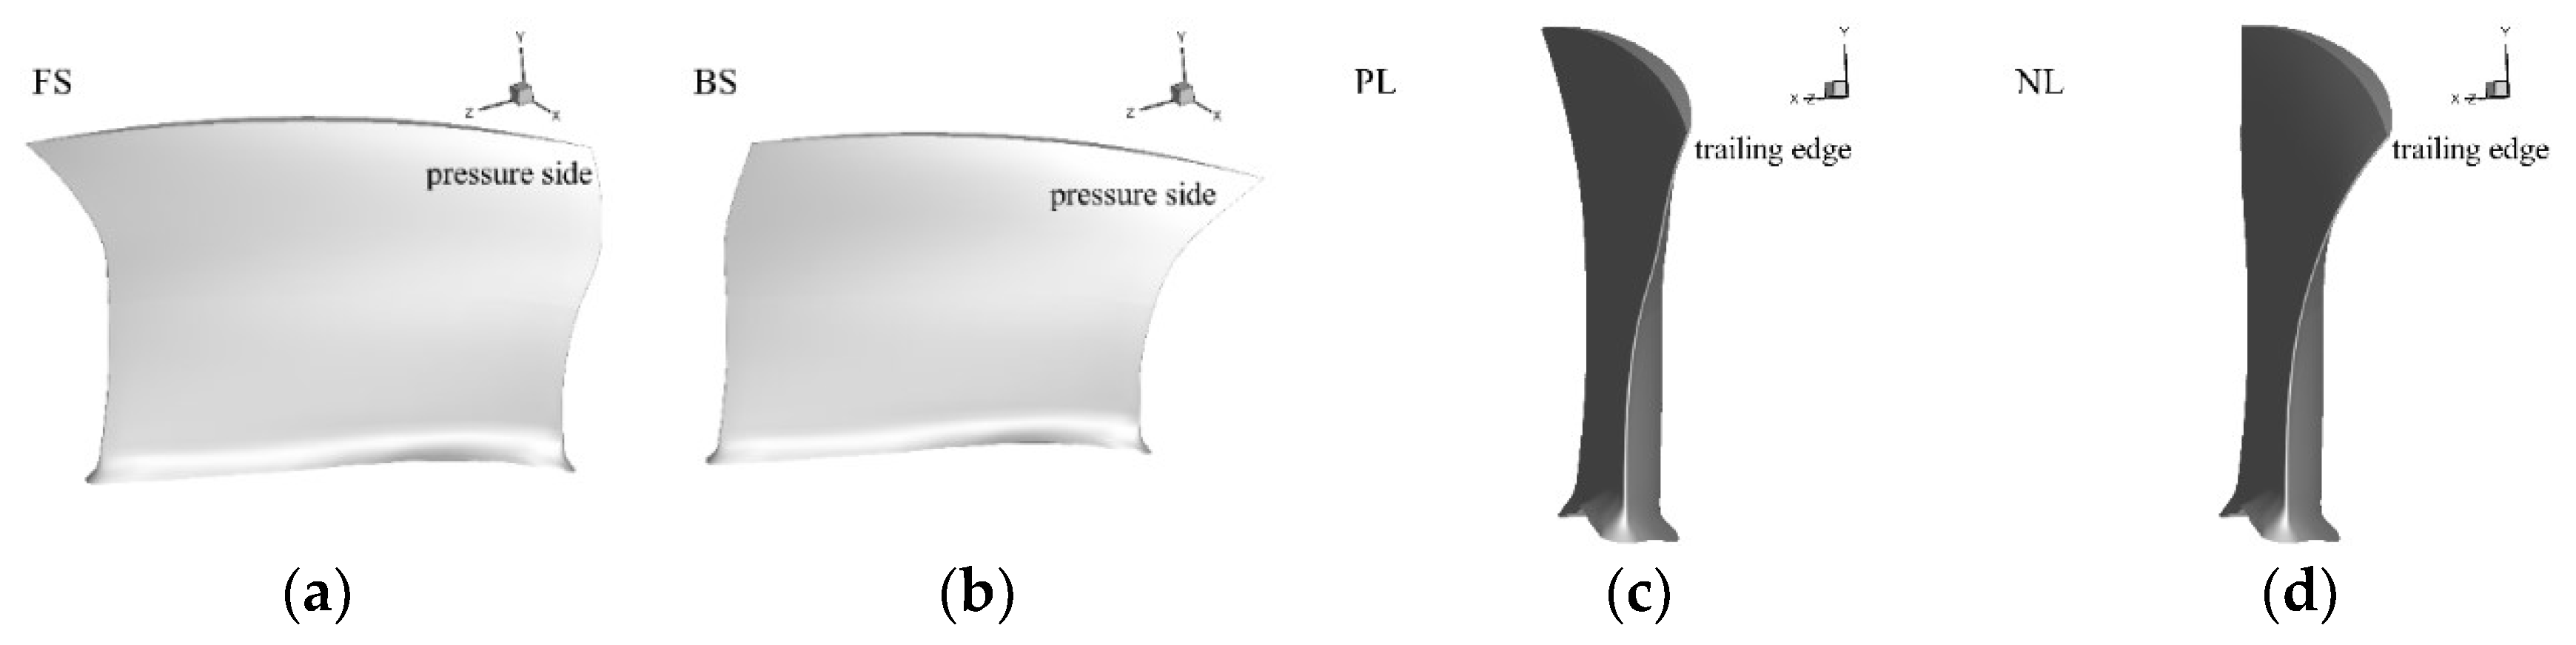
Figure 14.
Performance variations of re-stacked blades induced by CT_b at the design point and the near-stall point: (a) and at the design point; (b) the improvements in and of the grooved casing rotors relative to the respective solid casing rotors at the design point; (c) and at the near-stall point; (d) the improvements in and of the grooved casing rotors relative to the respective solid casing rotors at the near-stall point.
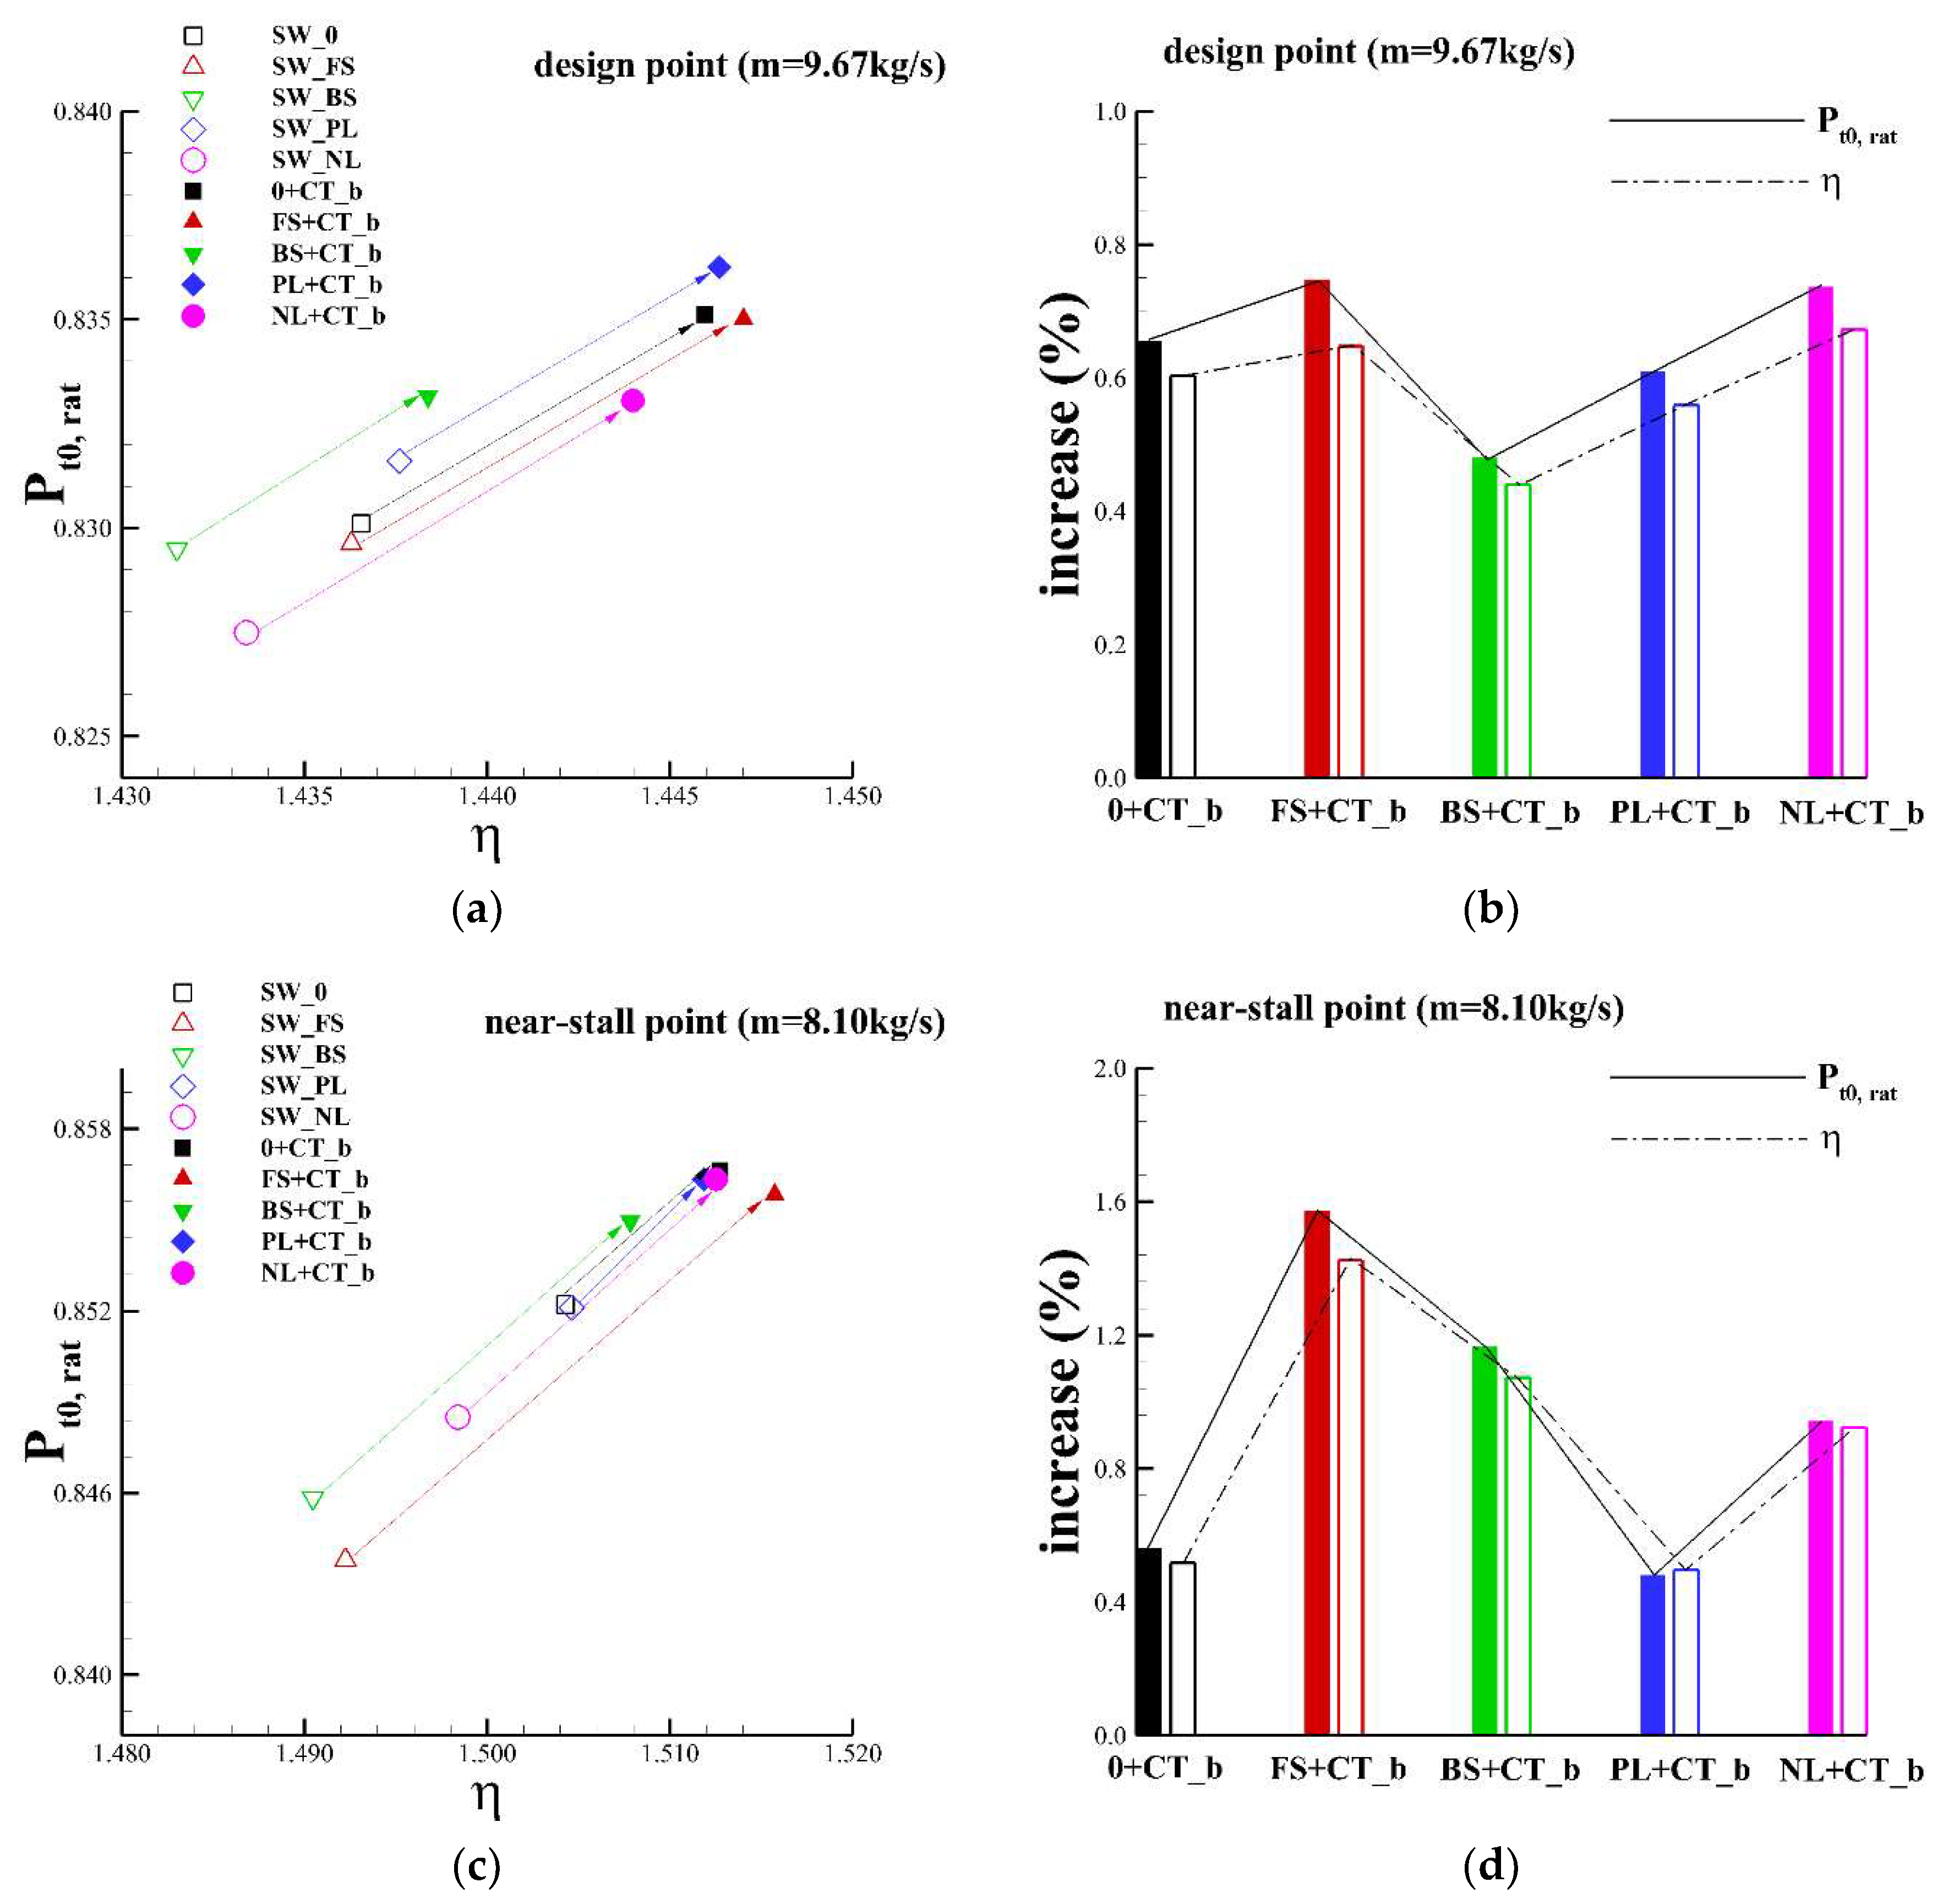
Figure 15.
Spanwise distribution of the total pressure ratio at the design point for (a) swept blades and (b) leaned blades.
Figure 15.
Spanwise distribution of the total pressure ratio at the design point for (a) swept blades and (b) leaned blades.
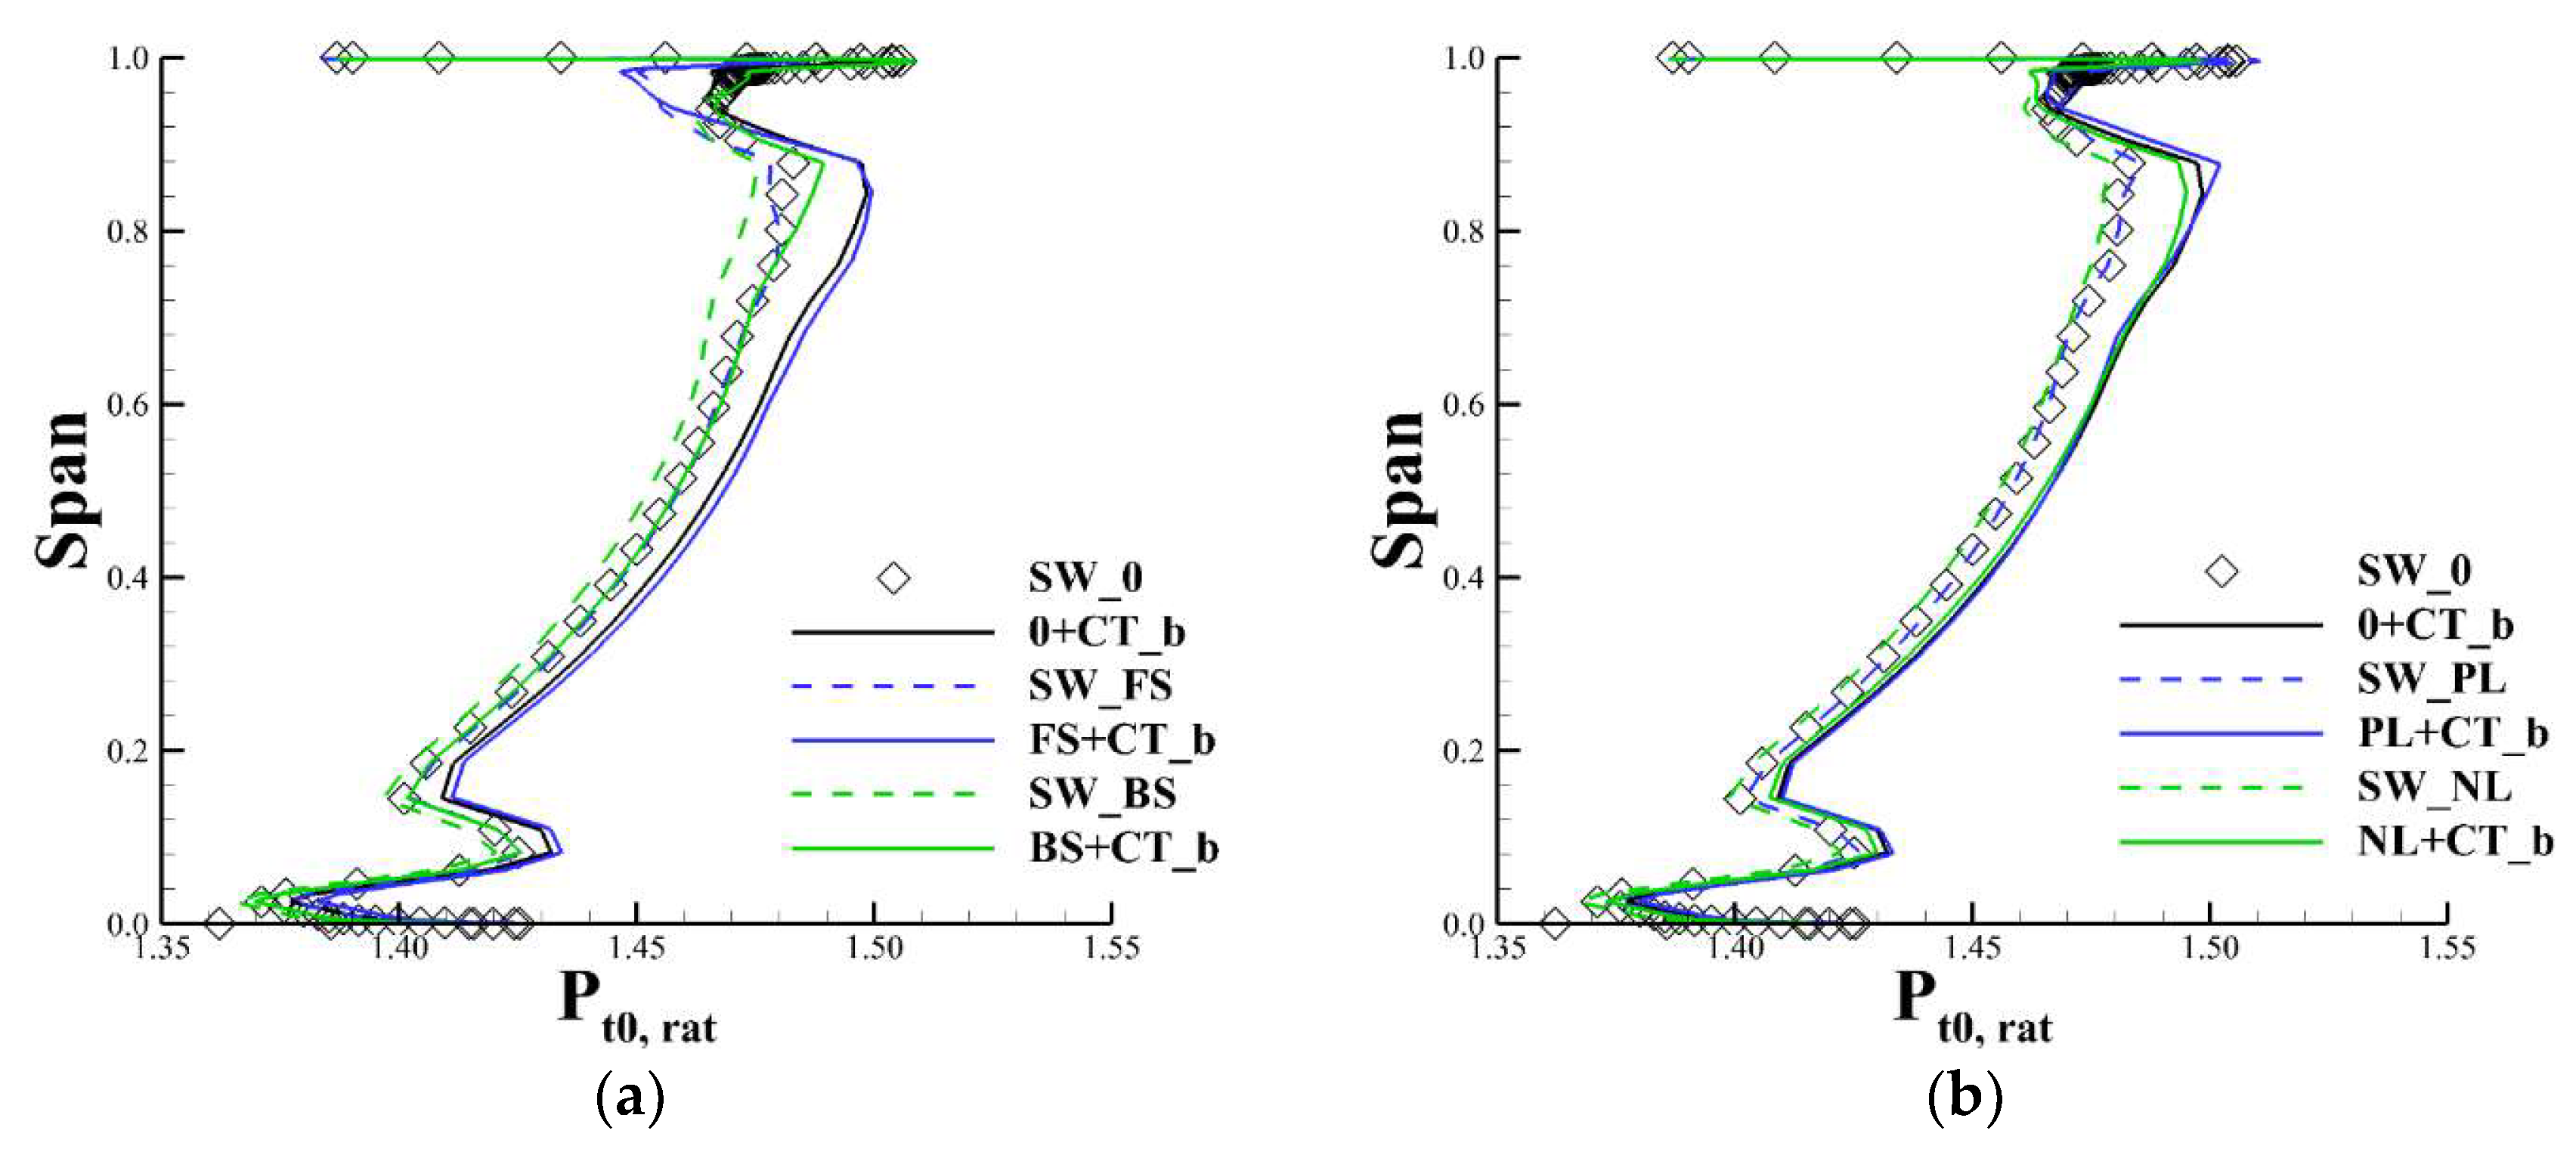
Figure 16.
Comparison of the radial relative velocity at the casing-groove interfaces (a) 0 + CT_b; (b) FS + CT_b; (c) BS + CT_b; (d) maximal radial velocity at each interface (aspiration); (e) minimal radial velocity at each interface (injection).
Figure 16.
Comparison of the radial relative velocity at the casing-groove interfaces (a) 0 + CT_b; (b) FS + CT_b; (c) BS + CT_b; (d) maximal radial velocity at each interface (aspiration); (e) minimal radial velocity at each interface (injection).
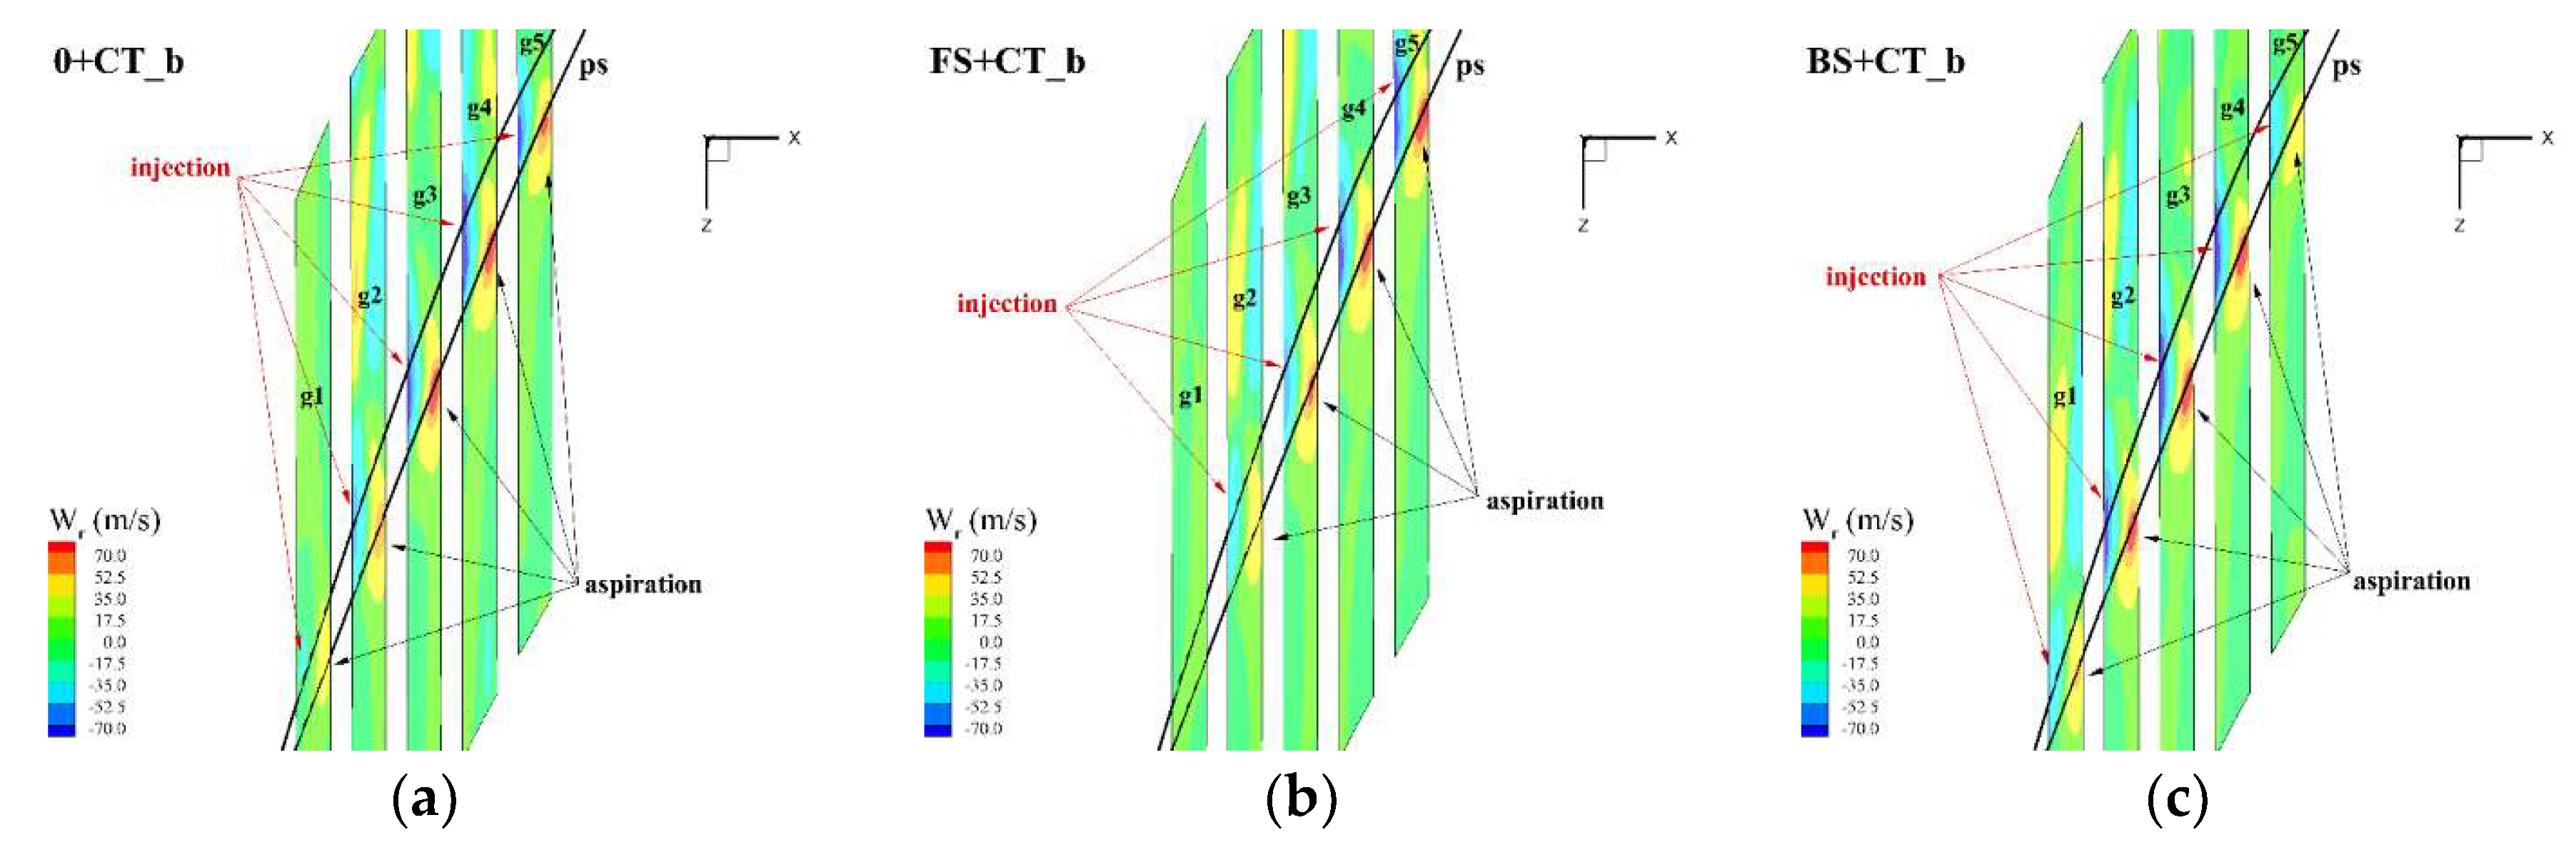
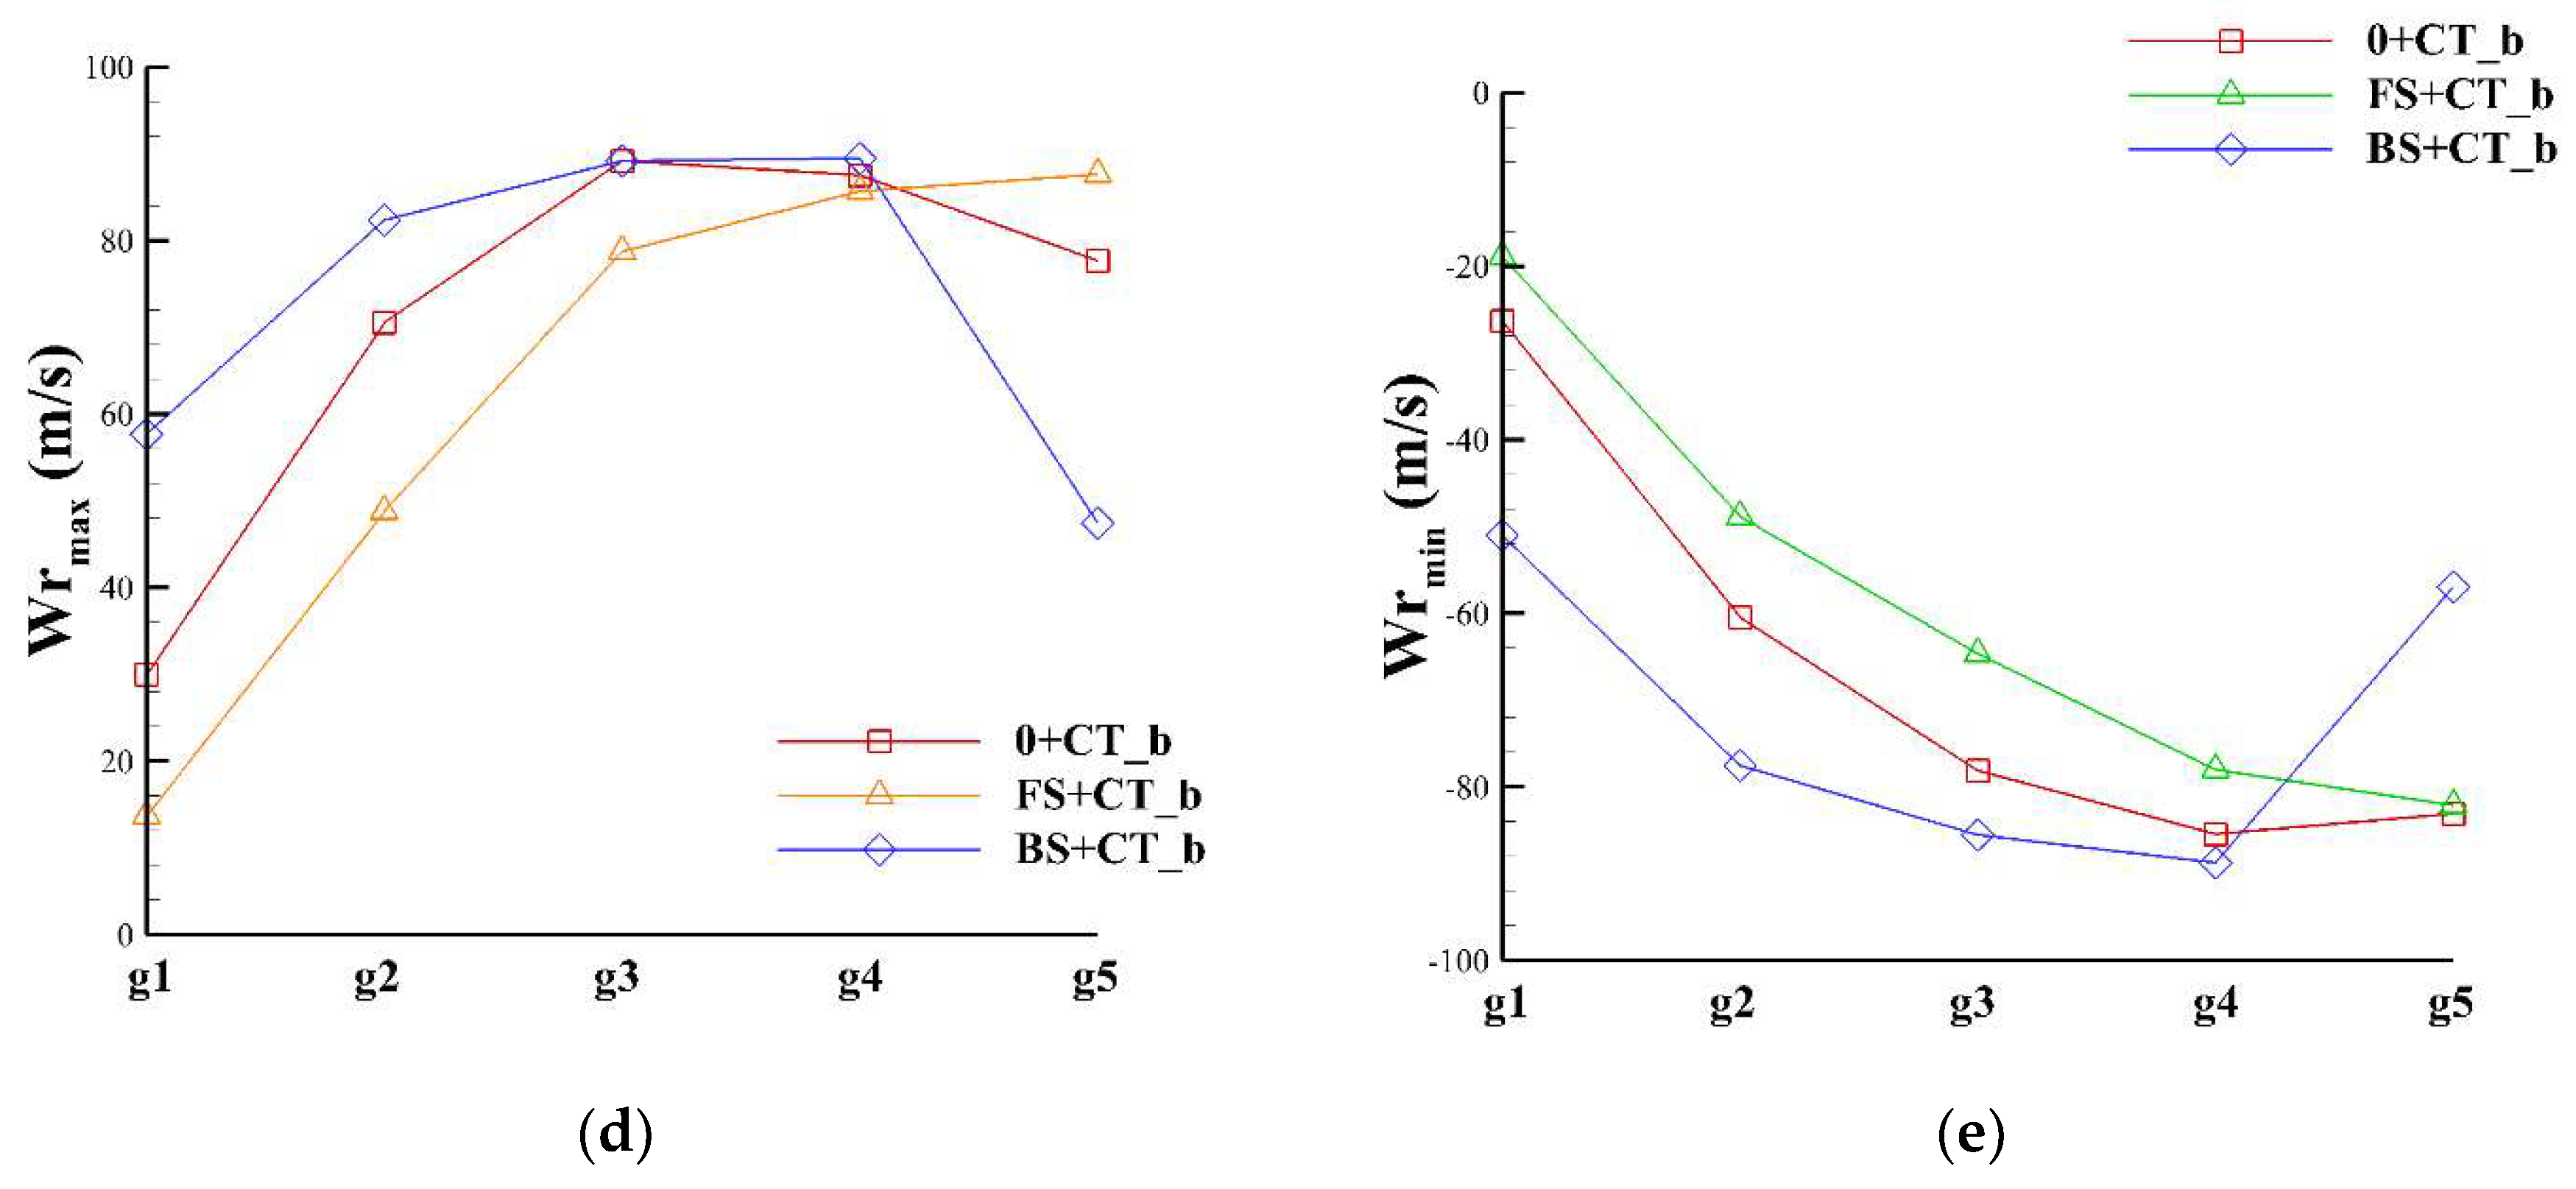
Figure 17.
Convergence histories of the two design objectives: (a) the total pressure ratio, and (b) the adiabatic efficiency.
Figure 17.
Convergence histories of the two design objectives: (a) the total pressure ratio, and (b) the adiabatic efficiency.

Figure 18.
Design objectives of the CGCT-blade integrated optimization results for (a) all qualifying individuals, and (b) 18 optimal individuals on the Pareto Front.
Figure 18.
Design objectives of the CGCT-blade integrated optimization results for (a) all qualifying individuals, and (b) 18 optimal individuals on the Pareto Front.
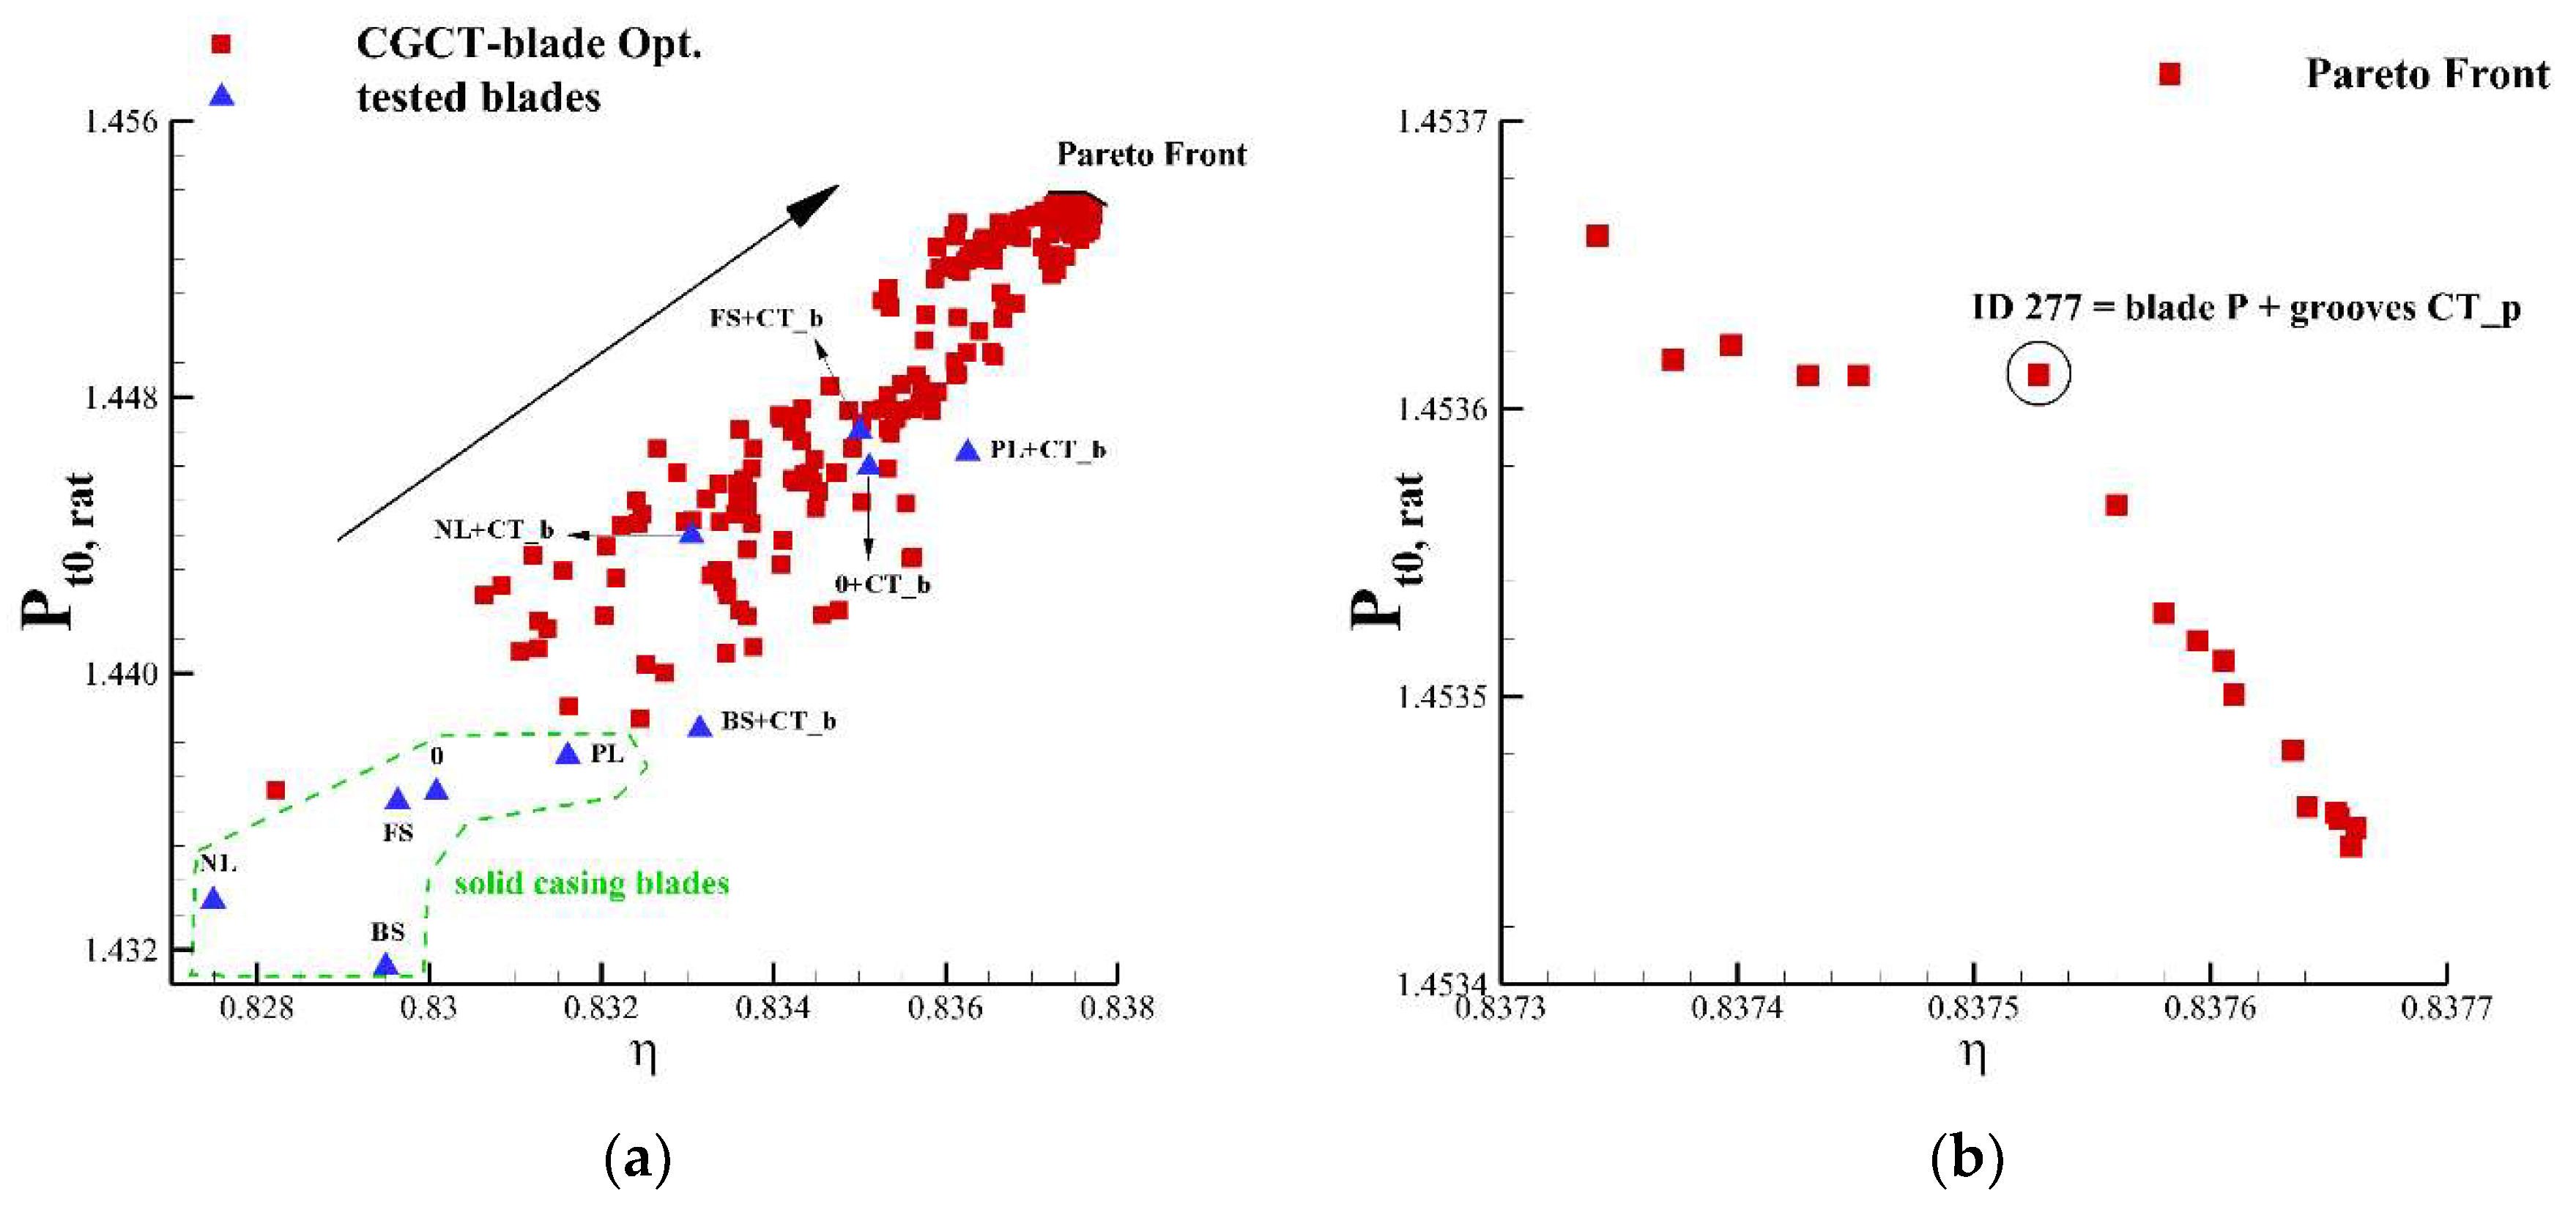
Figure 19.
Speed curves of optimal blade ID 277 for (a) the total pressure ratio versus the mass flow rate; (b) the adiabatic efficiency versus the mass flow rate.
Figure 19.
Speed curves of optimal blade ID 277 for (a) the total pressure ratio versus the mass flow rate; (b) the adiabatic efficiency versus the mass flow rate.

Figure 20.
Spanwise distribution of (a) the total pressure ratio, (b) the adiabatic efficiency, and (c) the diffusion factor at the design point for optimal blade P and baseline blade 0 with and without CT_p.
Figure 20.
Spanwise distribution of (a) the total pressure ratio, (b) the adiabatic efficiency, and (c) the diffusion factor at the design point for optimal blade P and baseline blade 0 with and without CT_p.

Figure 21.
Static pressure distribution at 85% of the span in baseline blade 0 and optimized blade “P” with and without CT_p.
Figure 21.
Static pressure distribution at 85% of the span in baseline blade 0 and optimized blade “P” with and without CT_p.
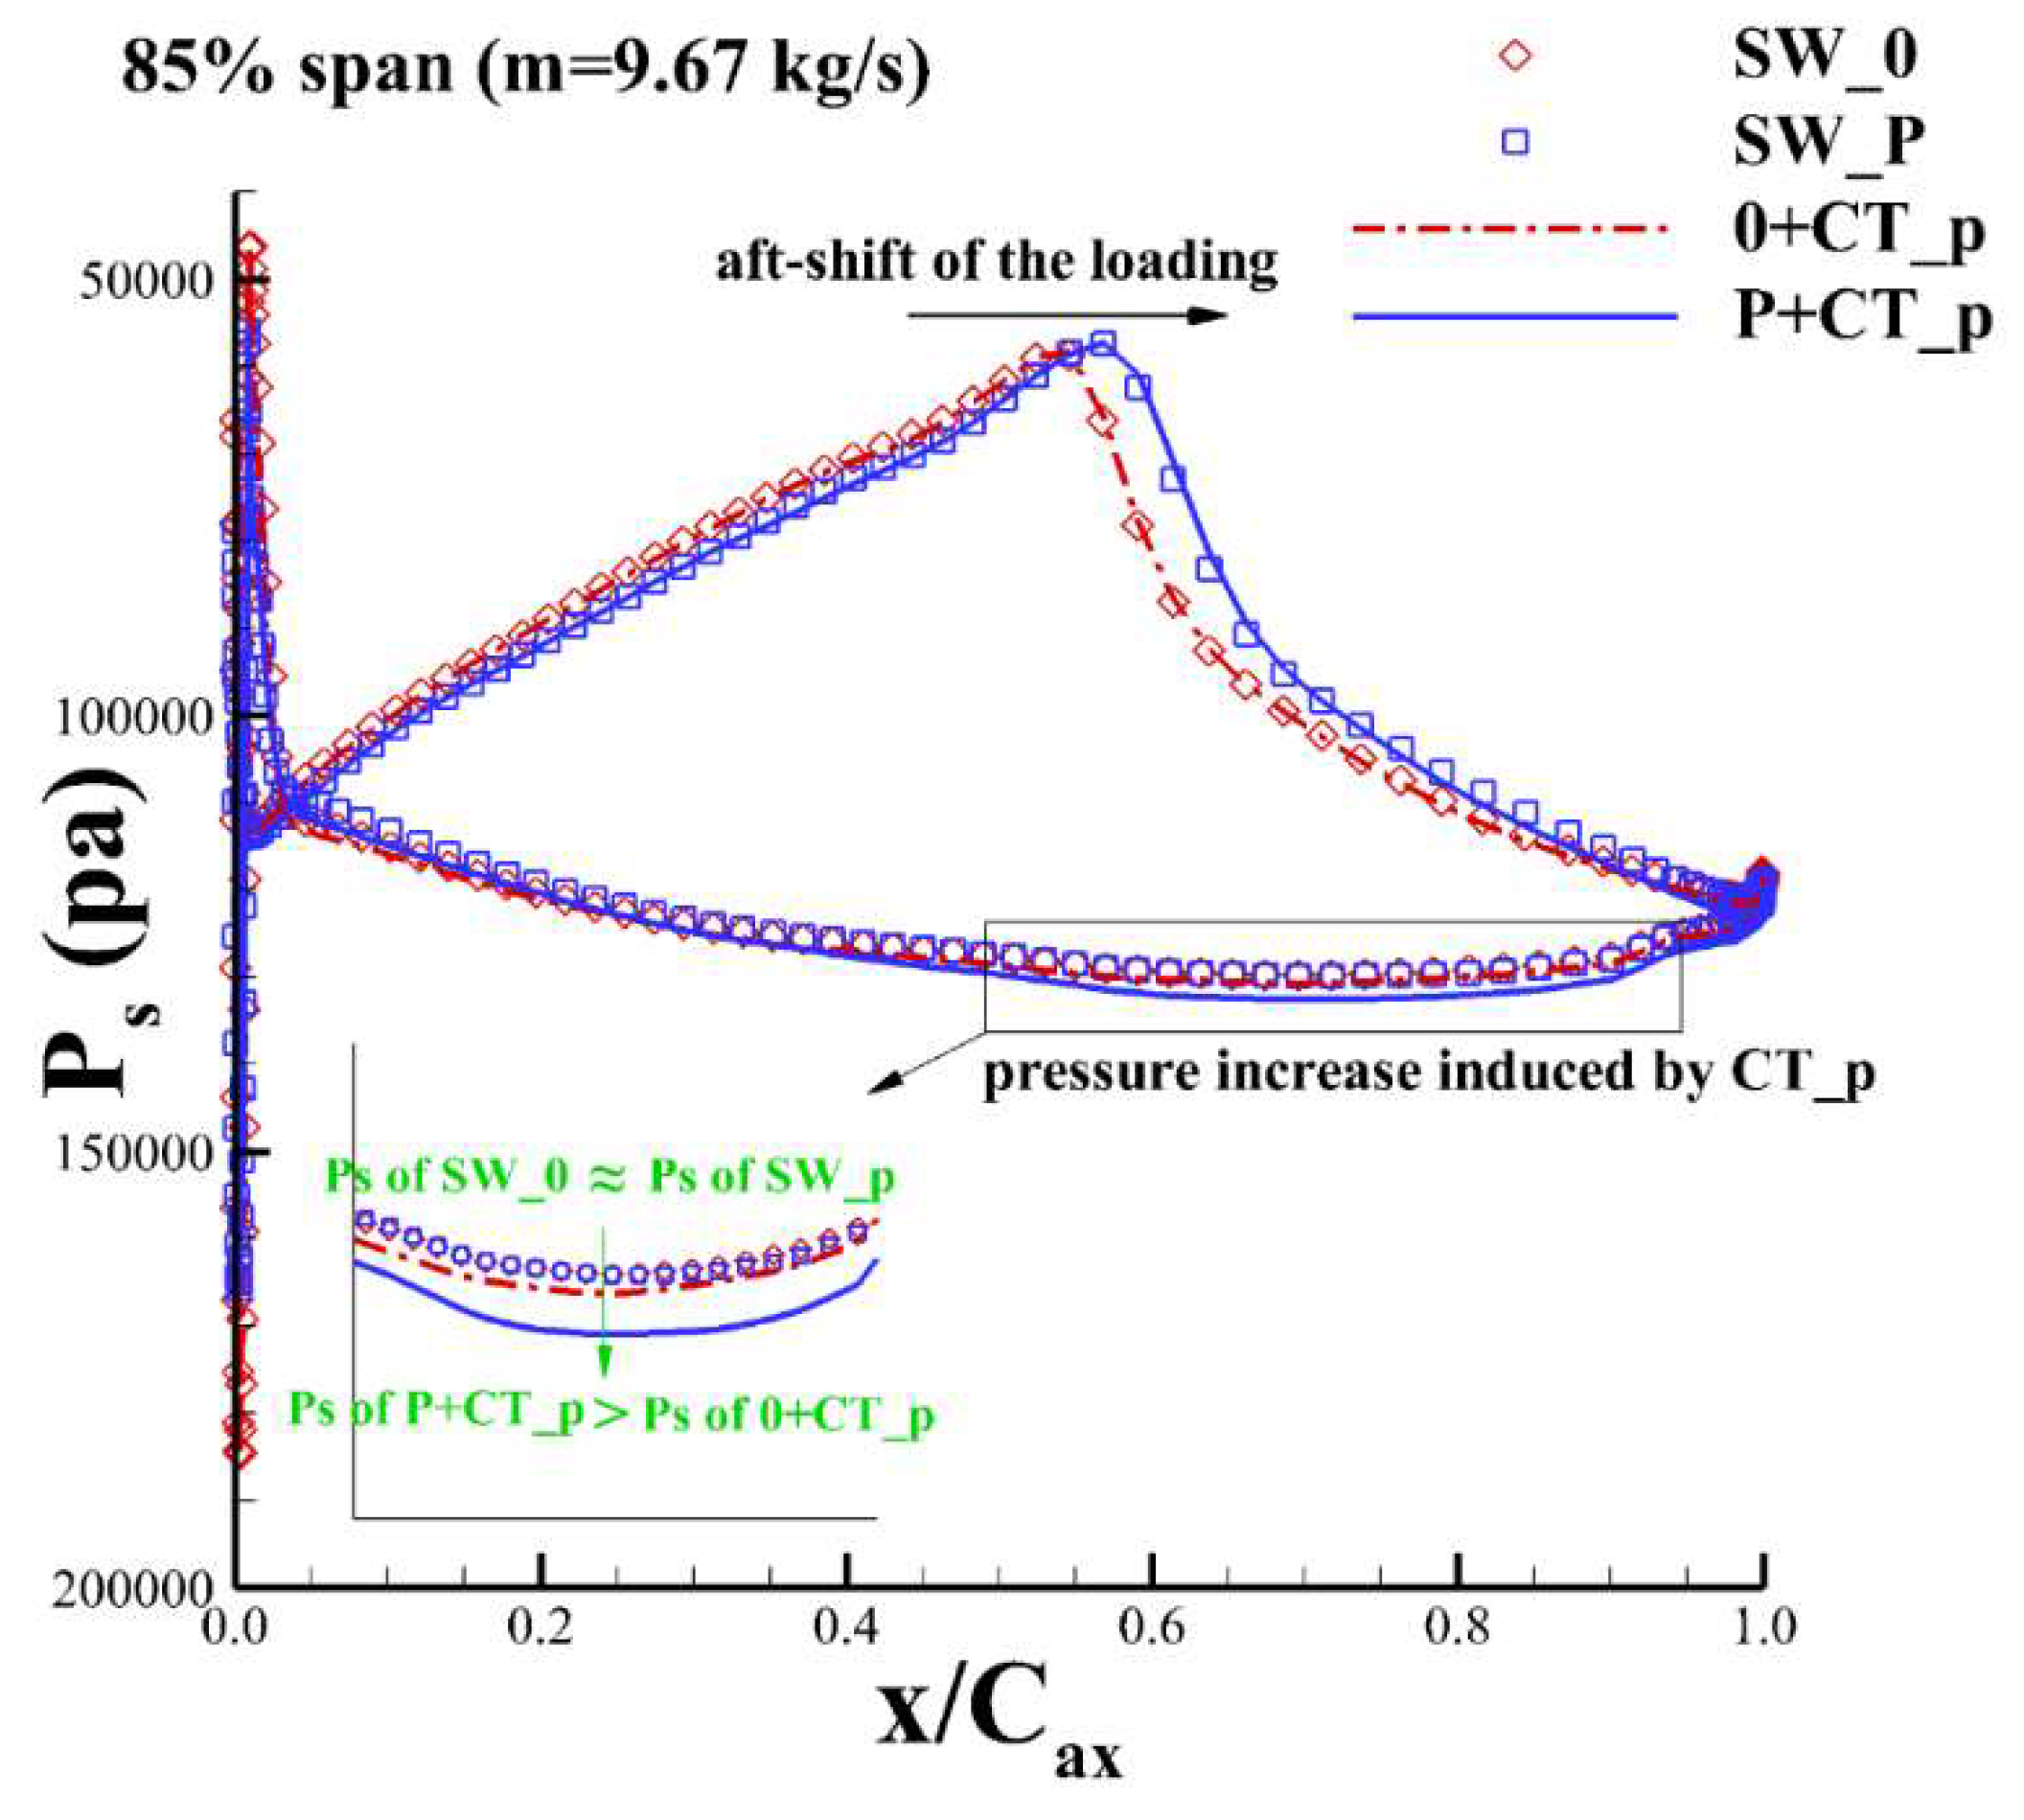
Figure 22.
Comparison of flow structures between the baseline blade with CT_p and the optimized blade with CT_p at the design point: (a) baseline blade with optimized CGCT: 0 + CT_p; (b) optimized CGCT-blade combination: P + CT_p.
Figure 22.
Comparison of flow structures between the baseline blade with CT_p and the optimized blade with CT_p at the design point: (a) baseline blade with optimized CGCT: 0 + CT_p; (b) optimized CGCT-blade combination: P + CT_p.


Table 1.
Design parameters of the Notre Dame Transonic Axial Compressor (ND-TAC) rotor.
| Symbol | Value | Symbol | Value |
|---|---|---|---|
| (rpm) | 14,686 | Axial Chord (mm) | 35.56 |
| (m/s) | 352 | (mm) | 228.6 |
| Solidity | 1.21 | (mm) | 171.45 |
| 20 | (mm) | 0.762 |
Table 2.
Definitions of the individual abbreviations.
| Name | Definition |
|---|---|
| SW_* | solid casing rotor, including SW_0, SW_FS, SW_BS, SW_PL and SW_NL |
| CT_* | CGCT configuration, including CT_a, CT_b, CT_c, CT_d and CT_e |
| 0 | baseline ND-TAC rotor |
| FS | re-stacked rotor with forward swept tip |
| BS | re-stacked rotor with backward swept tip |
| PL | re-stacked rotor with positive leaned tip |
| NL | re-stacked rotor with negative leaned tip |
Table 3.
Five circumferential groove casing treatment configurations for testing.
| Name | Axial Coverage (% ) |
|---|---|
| CT_a | 0–60% |
| CT_b | 10–70% |
| CT_c | 20–80% |
| CT_d | 30–90% |
| CT_e | 40–100% |
Table 4.
Effects of the CGCT on the rotor’s design point performance (, ) and the stall mass flow rate ().
Table 4.
Effects of the CGCT on the rotor’s design point performance (, ) and the stall mass flow rate ().
| Name | Relative to SW_0 | Relative to SW_0 | Relative to SW_0 | |||
|---|---|---|---|---|---|---|
| SW_0 | 1.43655 | - | 0.83008 | - | 8.666 | - |
| 0 + CT_a | 1.44519 | 0.602% | 0.83355 | 0.418% | 7.882 | −9.044% |
| 0 + CT_b | 1.44596 | 0.655% | 0.83511 | 0.606% | 7.907 | −8.759% |
| 0 + CT_c | 1.44475 | 0.571% | 0.83323 | 0.379% | 7.901 | −8.820% |
| 0 + CT_d | 1.44525 | 0.606% | 0.83391 | 0.461% | 8.089 | −6.663% |
| 0 + CT_e | 1.44685 | 0.717% | 0.83474 | 0.561% | 8.403 | −3.033% |
Table 5.
Definition of the CGCT-blade integrated optimization problem.
| Working Conditions | Constraints | Objectives |
|---|---|---|
| choking point | - | |
| design point (m = 9.67 kg/s) | - | max and max |
| near-stall point (m = 8.10 kg/s) | - |
Table 6.
The average performance at the design point.
| Type | ||
|---|---|---|
| SW_0 | 1.43655 | 0.83008 |
| 0 + CT_b | 1.44596 | 0.83511 |
| tested blades with CT_b | 1.44393 | 0.83437 |
| CGCT-blade integrated opt. | 1.45354 | 0.83755 |
Table 7.
Averages and variances of the values of design variables of the individuals on the Pareto Front.
Table 7.
Averages and variances of the values of design variables of the individuals on the Pareto Front.
| Statistics | 3D Blading | CGCT Distribution | ||
|---|---|---|---|---|
| Sweep (%) | Lean (%()) | (%) | (%) | |
| average | 11.9669 | 2.9675 | 11.6883 | 7.7067 |
| variance | 0.0419 | 0.3449 | 0.0028 | 0.0673 |
Table 8.
Effects of the grid density on the predicted design point performance.
| Performance and Variations | Medium Mesh (Used in the Optimization) | Fine Mesh (Used for Validation) |
|---|---|---|
| of baseline blade 0 | 1.43655 | 1.43449 |
| of grooved blade 0 + CT_b | 1.44596 | 1.44101 |
| of optimized grooved blade P + CT_p | 1.45361 | 1.45009 |
| Improvement in (P+CT_p versus 0) | 1.1876% | 1.0875% |
| Improvement in obtained by optimization (P+CT_p versus 0+CT_b) | 0.5291% | 0.6301% |
| of baseline blade 0 | 0.83008 | 0.82853 |
| of grooved blade 0 + CT_b | 0.83511 | 0.83178 |
| of optimized grooved blade P +CT_p | 0.83753 | 0.83626 |
| Improvement in (P+CT_p versus 0) | 0.8975% | 0.9330% |
| Improvement in (P+CT_p versus 0+CT_b) | 0.2898% | 0.5386% |
© 2018 by the authors. Licensee MDPI, Basel, Switzerland. This article is an open access article distributed under the terms and conditions of the Creative Commons Attribution (CC BY) license (http://creativecommons.org/licenses/by/4.0/).
Share and Cite
MDPI and ACS Style
Song, W.; Zhang, Y.; Chen, H. Design and Optimization of Multiple Circumferential Casing Grooves Distribution Considering Sweep and Lean Variations on the Blade Tip. Energies 2018, 11, 2401. https://doi.org/10.3390/en11092401
AMA Style
Song W, Zhang Y, Chen H. Design and Optimization of Multiple Circumferential Casing Grooves Distribution Considering Sweep and Lean Variations on the Blade Tip. Energies. 2018; 11(9):2401. https://doi.org/10.3390/en11092401
Chicago/Turabian StyleSong, Weimin, Yufei Zhang, and Haixin Chen. 2018. "Design and Optimization of Multiple Circumferential Casing Grooves Distribution Considering Sweep and Lean Variations on the Blade Tip" Energies 11, no. 9: 2401. https://doi.org/10.3390/en11092401
Note that from the first issue of 2016, this journal uses article numbers instead of page numbers. See further details here.