A Multi-Attribute Expansion Planning Model for Integrated Gas–Electricity System


1
Faculty of Engineering, Ferdowsi University of Mashhad, Mashhad 9177948944, Iran
2
Department of Energy Technology, Aalborg University, Aalborg East 9220, Denmark
*
Author to whom correspondence should be addressed.
Energies 2018, 11(10), 2573; https://doi.org/10.3390/en11102573
Submission received: 11 August 2018
/
Revised: 26 August 2018
/
Accepted: 29 August 2018
/
Published: 27 September 2018
Abstract
:Gas-fired power plants are environmentally friendly because of their high efficiency rates and low CO2 emissions. On the other hand, the output power of renewable generators is stochastic, meaning that additional capacity must be held in reserve throughout the system. Gas-fired power plants are ideally suited to mitigate renewable uncertainties as they are more flexible and can easily be fired up in just a few minutes, and subsequently be shut down. Increased use of gas-fired power plants makes gas and electricity networks more dependent, so that adequacy in fuel supply of electricity network becomes a majority. However expansion planning of gas and electricity systems is accomplished by private gas and electricity companies, having no effective data exchange mechanism together. So there is a need to provide a model that coordinates the expansion planning of gas and electricity networks. On the other hand, expansion cost of either gas or electricity network and risk criteria of integrated energy system may have priority in decision-making process. With different challenging attributes, there is a gap in the literature to provide a model that takes into account the privacy of energy parties with a minimum data exchange, while considering different attributes in decision-making process. In this paper a multi-attribute decision-making (MADM) method for co-expansion planning of gas and electricity systems is introduced. The proposed MADM method supposes that a central entity as Ministry of Energy (ME) is responsible for coordinated expansion planning of gas and electricity networks, while taking into account the privacy of gas and electricity energy parties. Decision-making attributes are conflicting and the proposed method selects the best plan based on a compromise among the attributes. Different attributes including gas expansion cost (GEC), electricity expansion cost (EEC), minimum of maximum regret (MMR) and β-robustness (β_R) are considered to find the best plan with regard to the preferences of independent gas and electricity network operators. In this regard, two multi-attribute decision analysis methodologies are employed: analytical hierarchy process (AHP) is used as a simple way to weight and rank all the attributes objectively and find the relative importance of various plans, and the weighted sum method to provide a general composite index and finding the final appropriate plan. A real case study in the Khorasan province of Iran, which has a high penetration level of gas-consuming generation units (GCGU), is utilized to demonstrate the effectiveness of proposed MADM method. Results are compared with a Pareto optimal method to qualify the accuracy of proposed method.
1. Introduction
By discovery of shale gas and increase in the resources of natural gas, gas price is decreased in the market. On the other hand natural gas has less pollution than other fossil types such as coal and gasoline [1]. All of these encourage investors to turn to gas-fired power plants. Gas-fired power plants have flexibility to mitigate renewable uncertainty [2] and we can see that as old coal power plants are retiring, they are replaced with gas-fired power plants [3]. On the other hand system balancing and flexibility of a power system incorporated with high level of renewables can be accomplished by integrating power to gas technology and gas-fired power plants [4]. All of these make gas and electricity networks highly dependent.
By increasing the use of gas-fired power plants, failure in a gas network can impose on electricity network operation [5] and fuel supply in electricity network becomes a majority. Investment in gas system must consider natural gas needed for growing gas-fired power plants. In many countries gas and electricity networks are designed and operated independent of each other [6]. On the other hand, in a combined gas–electricity expansion planning problem different attributes including the expansion cost of participants in integrated energy system and the risk level of system are challenging the expansion planning problem [7]. For this purpose there is a need to develop a model that responds to those worries. Without a coordinated expansion plan of gas and electricity systems it may lead to waste of costs.
Historically gas and electricity networks have independent network operators that decide on expansion and operation of its subordinating network, individually [8]. Electricity network operator decides on expansion of its network without considering fuel availability while gas network operator decides on expansion of its network neglecting the topology changes of the electricity network. However, by increasing the interdependency of gas and electricity networks, there is a need to have a coordinated expansion planning model. So far different models for expansion of gas and electricity networks have been proposed in a centralized manner where a central entity is responsible for expansion and operation of both gas and electricity networks. While in many countries gas and electricity networks have different operators without a data sharing mechanism. So, in this paper it is supposed that a central entity as the Ministry of Energy (ME) is responsible for coordinated expansion planning of gas and electricity networks that preserve subsystems’ privacy. Also different attributes including expansion cost of either gas or electricity network and system risk attributes must be addressed in the co-expansion planning formulation. In this way, ME coordinates the expansion planning of gas and electricity networks while considering the weight of different challenging attributes in decision-making process.
Recently some works have focused on gas–electricity expansion planning. A leader-follower approach is introduced in [6] that electricity network is supposed to be leader and gas network is supposed to be follower. The model presented in [9] formulates the expansion of electricity distribution lines and elements within energy hubs. In this way, the proposed model provides optimal reconfiguration in electricity and natural gas distribution systems. Authors in [10] introduce a multi-area and multistage model where a central decision maker integrates the expansion planning of gas and electricity infrastructures. A centralized model that integrates the expansion planning of gas and electricity distribution networks is presented in [11]. This model is suitable for utilities that own both gas and electricity networks. The proposed centralized model in [12] minimizes the gas and electricity networks operational and expansion costs. In this model electricity network expansion is implemented by increasing transmission line capacity. Additionally it allocates the planned power generating units. In [13], the joint expansion planning problem is developed to maximize the social welfare of the combined gas and electricity networks expansion planning. In this model, the adaption cost to new conditions has been used to deal with uncertainties such as gas and electricity market prices. The work presented in [14] provides an integrated framework to solve the problem of gas and electricity networks expansion planning. Proposed method incorporates a three-level procedure to solve the transmission, generation and gas network expansion problem by using genetic algorithm. A carbon oriented model of a gas–electricity expansion problem is introduced in [15] that considers profit-to-cost maximization objective function with a market prices of gas and electricity as several scenarios. Co-optimization planning problem in [16] provides a system with optimal size, location, installation time of new electricity and natural gas resources. The co-optimization model is decomposed into a centralized master investment problem and two operation subproblems representing the feasibility and the optimality of the proposed model. The centralized linear method in [17], leads to the minimum investment and operation cost of a gas–electricity expansion problem. Wherein gas and electricity market interactions are simulated by an iteration process and the market information will be used to guide the network expansion co-planning. Authors in [18], introduce a robust model that proposes centralized gas and electricity expansion planning with the grid resilience considered as a set of constraints. The centralized expansion planning model presented in [19] uses a two-stage stochastic optimization framework to represent uncertainty in demand growth. A similar model is provided in [20] that considers uncertainties in load growth through a two-stage stochastic programming model. In this method the first stage is the planning stage and the second stage is operating stage. A planning model of gas distribution pipelines, gas-fired power generators, and capacitor banks is presented in [21], which is solved using a sequential planning approach. Expansion planning of gas and electricity networks with bidirectional energy conversion is formulated in [22] as a bi-level problem, wherein the upper-level optimizes the expansion plan and the lower-level is formulated as optimal operation. A centralized planning model for gas and electricity networks considering a joint N-1 and probabilistic reliability criterion is presented in [23]. A static stochastic cost minimization model is provided in [24] which considers renewable uncertainties as well as load growth and gas price uncertainties in expansion planning of gas and electricity networks. The model presented in [25] provides an integrated mixed-integer linear programming approach to security-constrained expansion planning of gas and electricity networks. In this model N-1 contingency is simultaneously considered in both gas and electricity networks. A least-cost planning model for transmission lines and pipelines of an energy hub is presented in [26]. In this model gas and electricity networks are designed for an economic supply while satisfying the reliability criteria. A combined model for expansion planning of gas and electricity networks is presented in [27] that introduces an elasticity model of gas price to consider the market feedbacks during high-stress condition. The chance-constrained planning model provided in [28] minimizes the investment cost in gas and electricity infrastructures to manage uncertainties in demand.
In this paper, a multi-attribute decision making (MADM) method [29] for co-expansion planning of a gas–electricity system is introduced. The proposed method is a useful tool for decision making about planning of systems with multiple independent operators such as a gas–electricity system. Different attributes including gas expansion cost (GEC), electricity expansion cost (EEC), minimum of maximum regret (MMR), and β-robustness (β-R) are considered to find the best plan. Both gas and electricity system operators are supposed to be independent of each other and the best plan is obtained by ME in collaboration among private gas and electricity entities. In this way, the stochastic nature of different plans in the case of different attributes, is accomplished by considering all the possible plans for the expansion of gas and electricity systems. Different plans are examined in a real case study, and a comprehensive view of the future of integrated gas–electricity systems can be found in the case of choosing each of the plans. Analytical hierarchy process (AHP) is used as a simple way to rank all the attributes objectively and find the relative importance of various plans. Using the proposed MADM method, gas consumption of GCGUs is shared among gas and electricity network operators and consequently privacy of gas and electricity energy parties is preserved with a minimum data exchange. Results of MADM are compared with those of a Pareto optimal method to better understand the model. In the proposed MADM method, it is assumed the investments on other generation technologies than the GCGUs have been already decided, thus the problem of this paper is to provide an expansion plan for GCGUs.
The main contributions of the proposed methodology are as follows.
- With the proposed MADM method, a decision maker has freedom to choose a plan in which either the expansion cost of each of the energy parties or risk level of the system has priority in decision making.
- Using the proposed MADM method, privacy of gas and electricity network operators is preserved with a minimum data exchange.
The remainder of paper is organized as follows. In Section 2, the operation model of gas and electricity networks is described. In Section 3, the expansion planning model is defined and the proposed MADM methodology is illustrated. In Section 4, the proposed method is evaluated and a discussion is presented on the results. A case study in the Khorasan province of Iran, which has a high penetration level of GCGUs, is utilized to demonstrate the effectiveness of proposed method.
2. Operation Model
In order to model the expansion planning of gas and electricity systems, feasible operation of subproblems are initially discussed. In developing our expansion-planning model, the term “load curtailment” is frequently used, which denotes a type of demand response program through which responsive loads (curtailable loads) can be directly controlled by the system operator at certain times. It should also be noted that operation subproblems of gas and electricity networks are modeled independently where data exchanged among gas and electricity networks only involves gas consumption of GCGUs.
2.1. Electricity Network Operation
Research manuscripts reporting large datasets that are deposited in a publicly available database should specify where the data have been deposited and provide the relevant accession numbers. If the accession numbers have not yet been obtained at the time of submission, please state that they will be provided during review. They must be provided prior to publication.
In the electricity operation subproblem, fuel cost of generation units is considered as the operation cost of electricity system. The purpose of operation problem is to supply demand at a minimum cost during the planning period. The operation subproblem of the electricity network is based on three load periods t for each day including peak-load, mid-load and off-load. The optimal operation of electricity system during one day can be modeled as follows.
s. t.
The objective function of this subproblem is comprised of two terms. The first is the fuel cost of generation units and the second is the value of the curtailed load. To simplify the load flow studies while checking the feasibility of solutions in terms of meeting the technical constraints, DC power-flow is incorporated in the operation problem. In this problem, constraints (2) and (3) are operation cost and fuel consumption volume of generating units at period t respectively. The load balance is defined as constraint (4). The power flow in transmission lines is calculated as constraint (5). The voltage angle of reference bus is assigned to zero in constraint (6). Generation of power-generating units is bounded using (7). The power flow in transmission lines is restricted by (8). Curtailment in loads is limited using constraint (9). This model is not used for short-term scheduling of generating units; it is used to take into account operational cost in expansion planning. Hence, short-term constraints such as minimum up and down times are ignored.
2.2. Gas Network Operation
The main purpose of a gas system operation subproblem is to supply the demands at a minimum cost. Although in short-term studies of a gas network, a dynamic model can resolve the gas network impacts from dynamic situation such as GCGUs ramping [30]; in long-term expansion planning studies of a gas network, steady state formulation completely ensures the feasible operation of gas transportation system [31]. In a feasible operation of gas system, pressure at different nodes must be at a pre-defined boundary and compressors ensure such pressure feasibility [32]. The gas network operation subproblem is accomplished on a daily basis as follows.
s. t.
The objective function of gas system operation subproblem (10) includes two parts: gas supply cost and value of curtailed load. Gas flow in pipelines is defined using Weymouth constraints for passive and active pipelines which are defined as (11) and (12), respectively [33]. Active pipeline refers to pipelines with a compressor while passive refers to those without a pipeline. Pressure in different nodes of gas system is bounded by (13). Gas flow in pipelines is restricted by (14). Gas flow for active pipelines is supposed to be unidirectional as described in (15) [34]. Supply in different nodes is limited by (16). Curtailed load is restricted using (17). Constraint (18) ensures gas flow balance in each node. Compressor energy consumption is defined as the natural gas needed for operation and is estimated using (19) [35]. The relationship between input and output pressure of compressors is defined by (20) [36]. Constraint (21) is the only coupling constraint among gas and electricity networks and specifies the fuel consumption of GCGUs in each node of gas network, which is imported from the electricity operation subproblem.
3. Expansion Planning Model
In this paper, a MADM method is used to coordinate the expansion planning of gas and electricity systems. The proposed method uses expansion cost of gas and electricity networks as attributes in the decision making process. The cost minimization model considered in the co-expansion planning of a gas–electricity system is a static model. It means that decisions which are made in the beginning of planning period must satisfy the gas–electricity system in the whole planning period.
The cost minimization model of gas and electricity networks is described in Section 3.1. The proposed attributes in decision-making process are defined in Section 3.2, while the MADM method is introduced in Section 3.3. Finally, solution procedure is described in Section 3.4.
3.1. Cost Minimization Model of Expansion
All the possible plans for the expansion of gas and electricity systems are considered to have a comprehensive view of the future of integrated gas–electricity systems. In the case of choosing each of plans, a set of candidate transmission lines, generation units and pipelines are considered. The expansion cost of each plan with regard to the feasible operation subproblems of electricity and gas networks is calculated as (22) and (23) and (24) and (25) for electricity and gas networks respectively.
The objective of the electricity expansion planning problem (22)–(24) is the expansion cost of electricity system according to the specified plan. Expansion cost is comprised of investment cost of expansion plan k and present value of operation cost of electricity network over a planning period. Operation cost of electricity network () is obtained by (1) for each day d of year y assuming expansion plan k is added to the network. Investment cost includes cost of both transmission lines and generation units of expansion plan k. This problem is subjected to the constraints of electricity operation subproblem (1), which ensures feasible operation of the electricity system and the investment budget of electricity network as defined in (24).
The second problem (25)–(27) defines expansion cost of gas system. Expansion cost of gas system comprises of two terms including investment cost of expansion plan k and present value of gas network operation cost over planning period. Operation cost of gas network () is obtained by (10) for each day d of year y assuming that expansion plan k is added to the network. Expansion problem of gas system is subjected to the constraints of gas system operation subproblem (10) and the investment budget of gas network as defined in (27).
3.2. Proposed Attributes
In the proposed MADM method, four attributes including EEC, GEC, MMR and β_R are considered to find the best plan with regard to the preferences of gas and electricity system operators.
3.2.1. EEC
This attribute denotes the operational planning cost for electricity system which includes the costs of investment and operation as shown in (22)–(24) for each expansion plan k.
3.2.2. GEC
GEC comprises of two terms including investment and operation costs of gas system for each expansion plan k. It is calculated in the same manner as EEC using (25)–(27).
3.2.3. MMR
MMR as a risk measurement method is defined as the minimum of inappropriateness among maximum regret of EEC and GEC in each plan [37]. Maximum regret is defined as the distance of either GEC or EEC of the proposed plan k, rather than the minimum of GEC and EEC among whole plans, respectively. To better explain the proposed attribute, suppose that maximum regret of a plan, in the case of GEC is 2 and for EEC is 1. Then the MMR will be assigned to 1. By this explanation, maximum regret of plan k for EEC and GEC is defined as (28) and (29), respectively.
Wherein and express the minimum expansion cost of electricity and gas networks, respectively. Using the calculated maximum regrets, MMR of each plan k is obtained by (30).
MMR encourages the avoidance of regret. Although MMR attribute has some deficiencies, it is an important factor in deciding on the final plan.
3.2.4. β_R
β_R is considered as another criteria to measure the risk level of system. The β_R attribute selects the plan that has the minimum of maximum over-costs with respect to the related optimal plan over different plans. This attribute calculates the over-cost percentage associated with EEC and GEC for each plan k, rather than the minimum of EEC and GEC in the whole plans, respectively. Then it considers the maximum value of obtained over-cost percentage among EEC and GEC for each plan k, and ranks them with the so-called nine-point scale. β_R is calculated by (31) according to the obtained maximum regret that was defined by (28) and (29).
Ranking the plans using β_R attribute has the advantage of flexibility so that this attribute can adjust the degree of robustness for each plan.
3.3. Decision Making with MADM
MADM represents a decision-making approach that is concerned with structuring and evaluating multiple conflicting criteria. Generally, there is not a unique optimal solution for such problems so it is needed to use decision-maker’s priorities to distinguish between solutions. This methodology is based on comparing different plans in the case of evaluating attributes applicable to all of these plans. AHP is used to measure the values of these attributes, normalizing the measured values and determining the weights according to the relative importance of the attribute. In this way, MADM integrates the weights and the normalized values of the attributes, in order to obtain an integrated value for each plan and rank the plans using the obtained values.
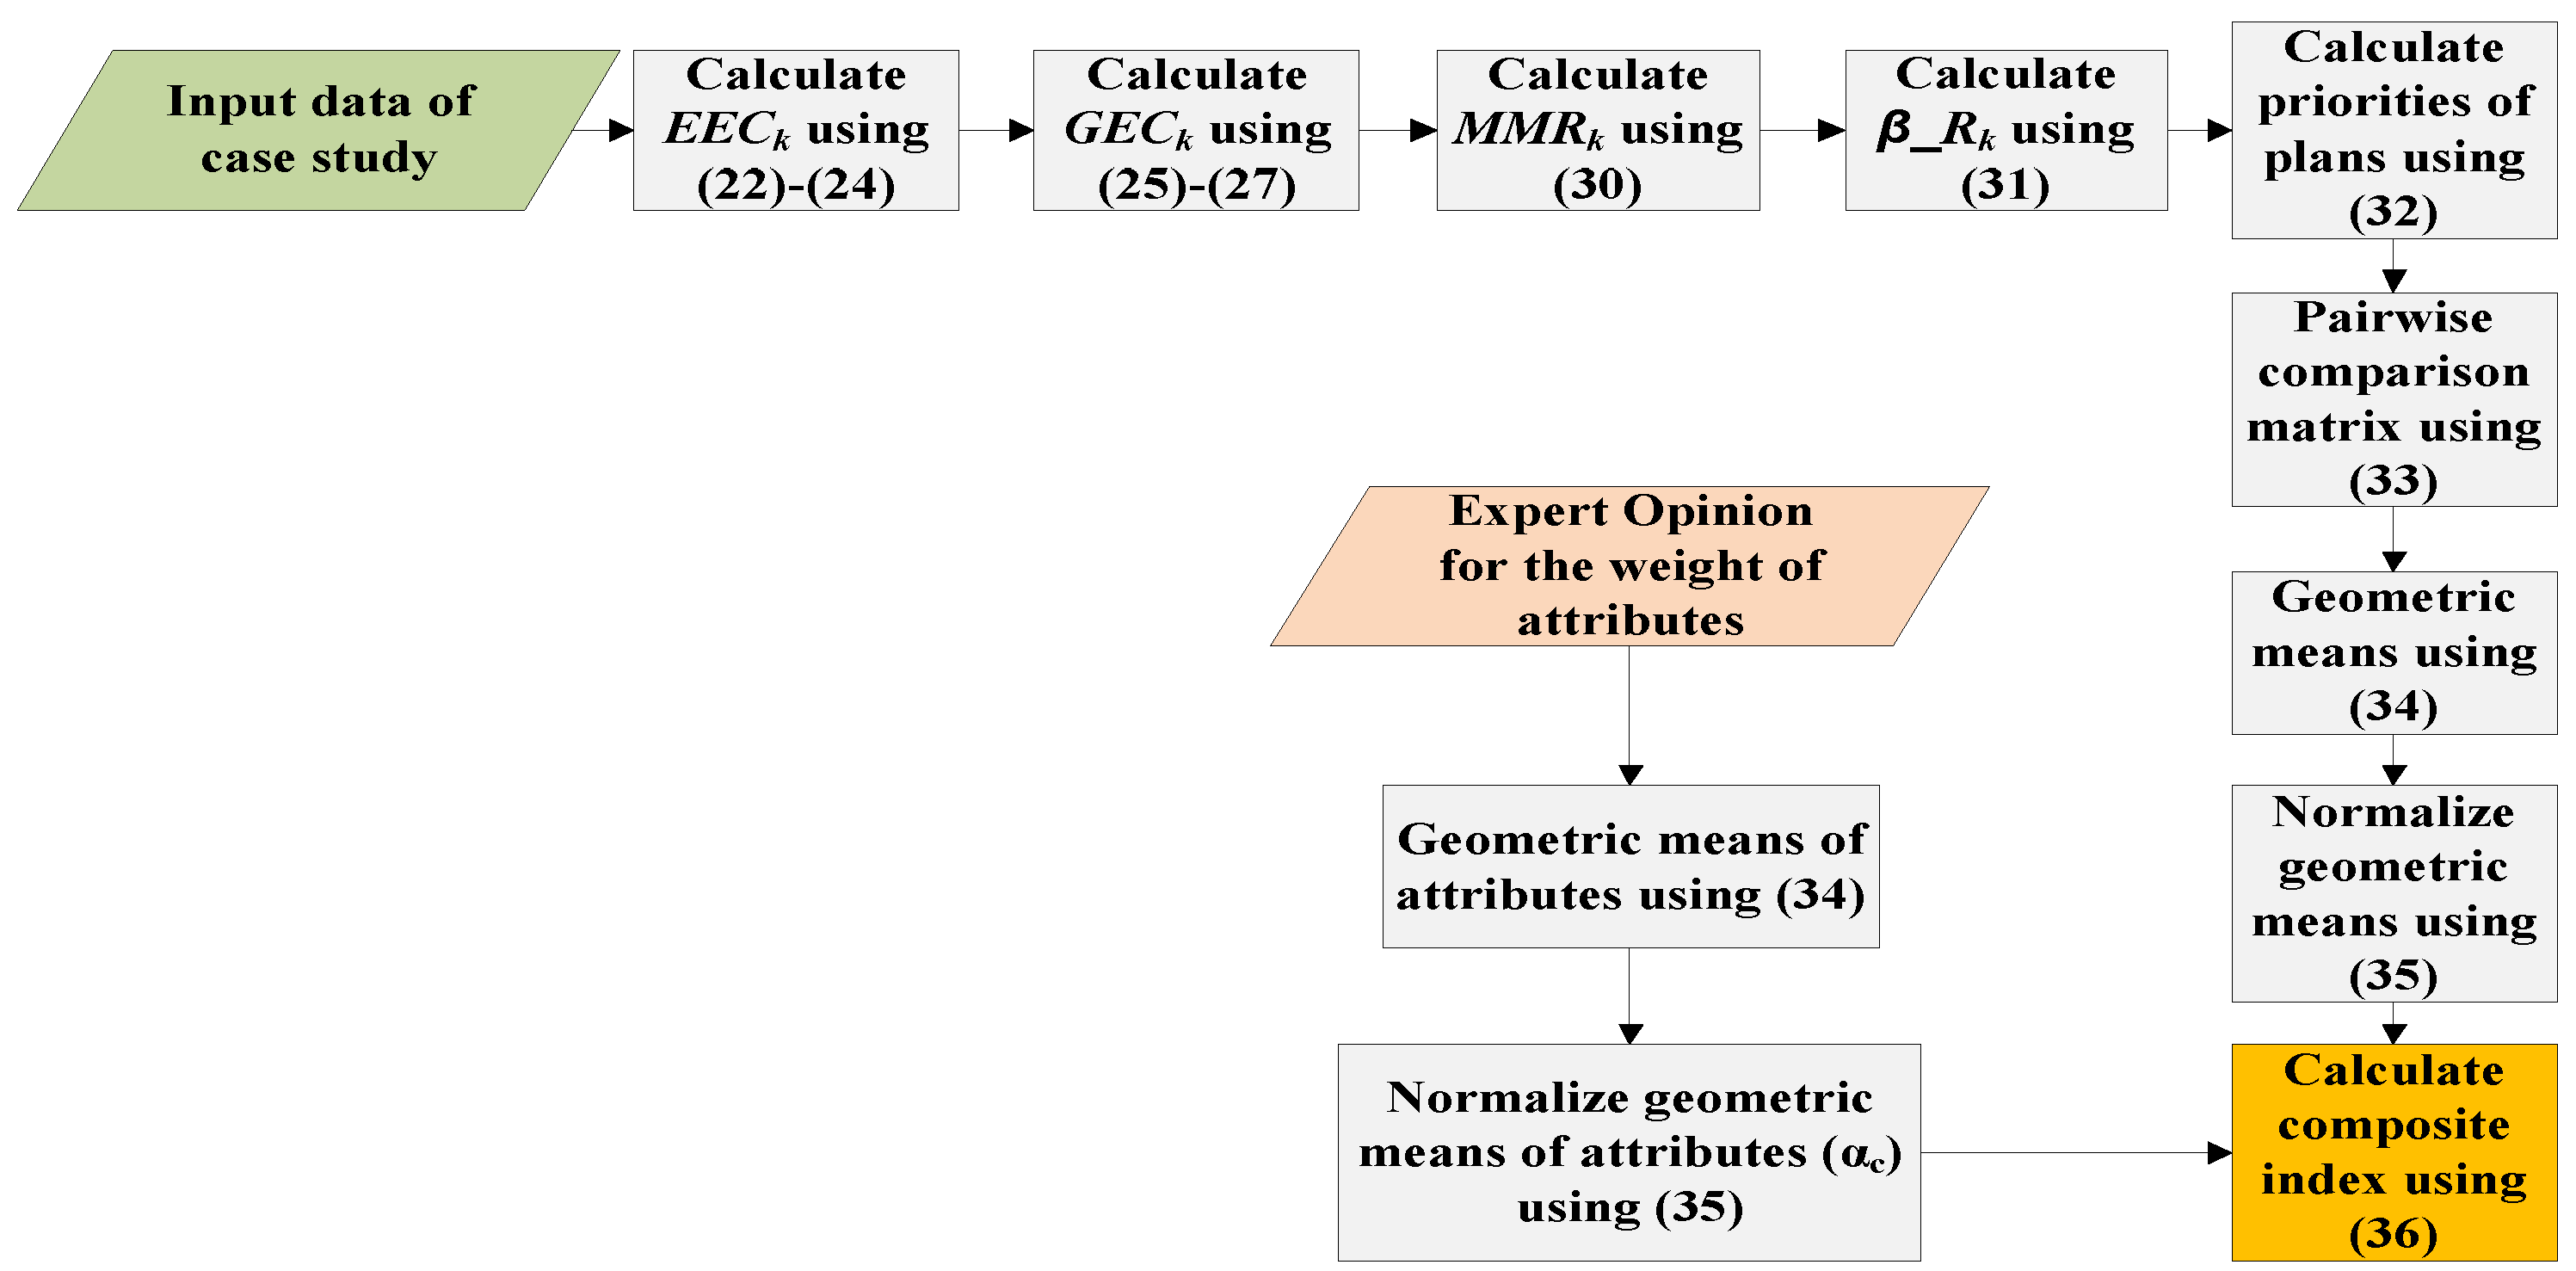
In this step, MADM is utilized for co-expansion planning of gas and electricity systems. In the proposed MADM method, ME is responsible for expansion planning of the gas–electricity energy system. To deal with the uncertainties in the case of different plans, uncertainties are captured by several possible plans. With regard to AHP, all feasible plans in the gas–electricity system are explored and ranked based on different attributes as described in (32)–(36) and then the final appropriate plan is chosen according to the composite index ().
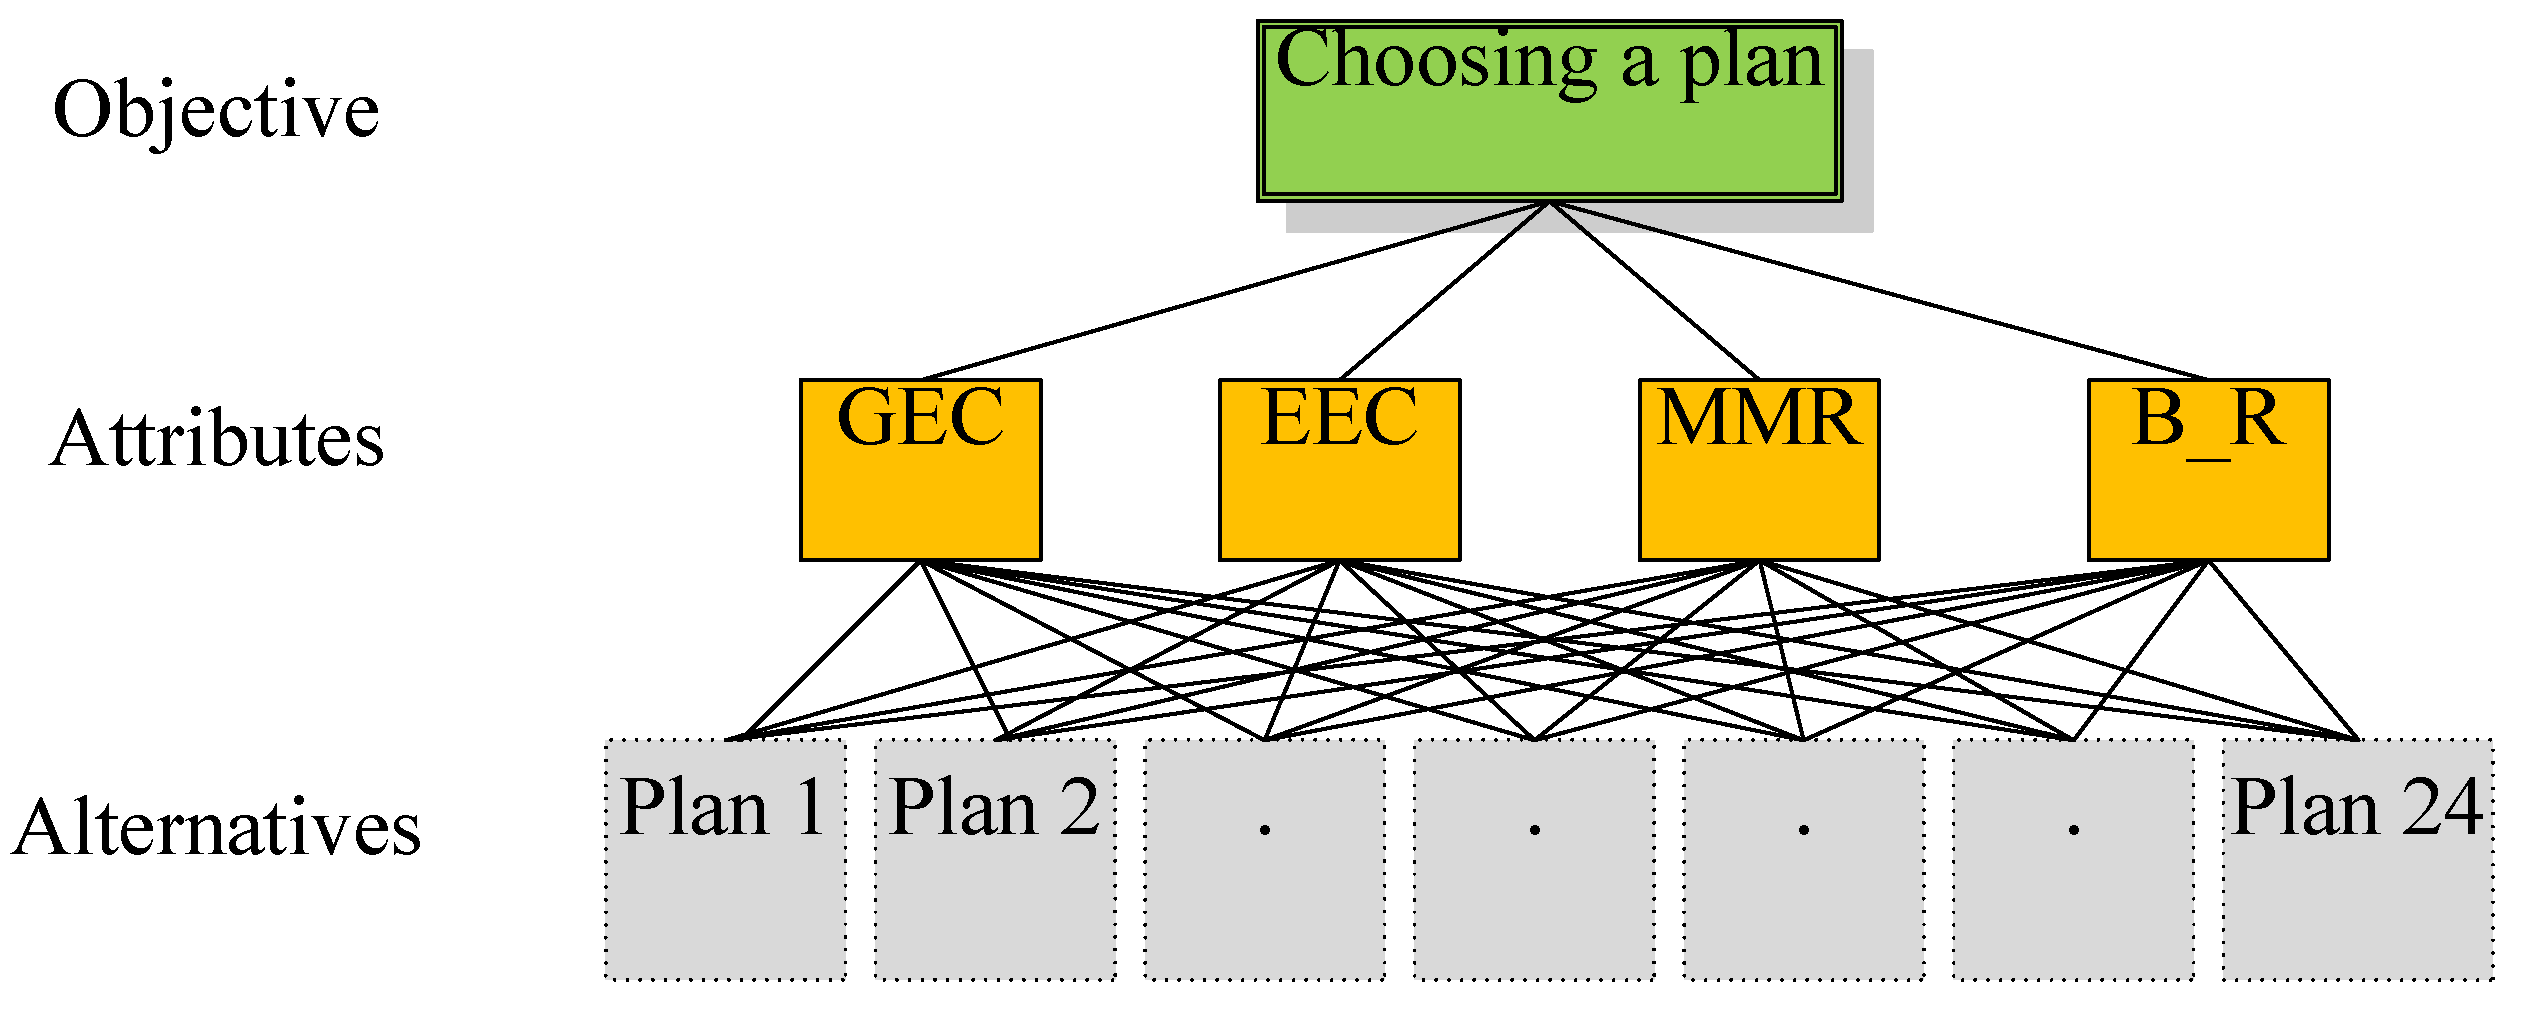
In the AHP method, according to the defined attributes, the hierarchy process is firstly structured as shown in Figure 1. Then priorities of plans at each attribute are determined using (32). Priorities are obtained using the variance of measured amount for plan k in the case of attribute c and priorities are scored by a nine-point scale (w) as shown in Table 1 [38]. AHP uses this nine-point scale as a ratio scale to judge between two quantities. Measured amount for plan k in the case of each attribute (), is dependent on the proposed attributes of MADM. In this paper four attributes including GEC, EEC, MMR and β-R are considered and the procedure to obtain is described in Section 4.1.
A set of pairwise comparison matrices (), with regard to (32) is constructed as (33). The pairwise comparison matrices () express the priorities of all elements for each attribute c of the hierarchy. The preference in pairwise () is quantified using the so-called nine-point scale.
The geometric mean is used to combine the obtained pair comparisons of (33) for plan k in the case of attribute c and it is calculated as (34) [39].
To compare the geometric means (), obtained values must be normalized. The normalized value () is named as eigenvalue and it is calculated by (35).
The composite index () is a sum of weighted attributes and it is calculated using (36). A plan with maximum composite index is the best plan.
Weight of the attributes is defined according to the relative importance from the viewpoint of a decision maker as ME. The preference in weights is quantified using the so-called nine-point scale that was shown in Table 1. However, to have comparable weights, the eigenvalues of weights () are calculated. is obtained in the same procedure as pairwise eigenvalues using (34) and (35).
3.4. Solution Method
In the proposed MADM method, ME as a decision maker chooses a plan with the highest rate as defined in (36). The mixed-integer nonlinear problems (22)–(27) are implemented in the General Algebraic Modeling System (GAMS 24.9.1 software) [40] and solved with Bonmin solver available in GAMS on an Intel Core 2 Due at 2.67 GHz, with 4 GB RAM. The proposed models for electricity and gas networks need 938 and 641 s, respectively to reach solution. Although the proposed problem is a mixed-integer nonlinear problem, the Bonmin solver has shown good advantages in providing optimal results [41]. The solving procedure used in the proposed MADM is shown in Figure 2 and can be briefly explained as follows.
| Step 1 | Calculate EEC for each plan according to the optimization problem (22)–(24) |
| Step 2 | Calculate GEC for each plan according to the optimization problem (25)–(27) |
| Step 3 | Calculate MMR for each plan using (30) |
| Step 4 | Calculate β_R for each plan using (31) |
| Step 5 | Measure the priorities of plans at each attribute using (32) |
| Step 6 | Build the pairwise comparison matrix using (33) |
| Step 7 | Calculate the geometric mean for each row of the pairwise comparison matrix using (34) |
| Step 8 | Normalize the calculated geometric means using (35) |
| Step 9 | Compute the composite index of MADM method using (36) |
4. Discussion
The proposed investment method is tested on real gas and electricity systems of Khorasan province, Iran.
4.1. Data
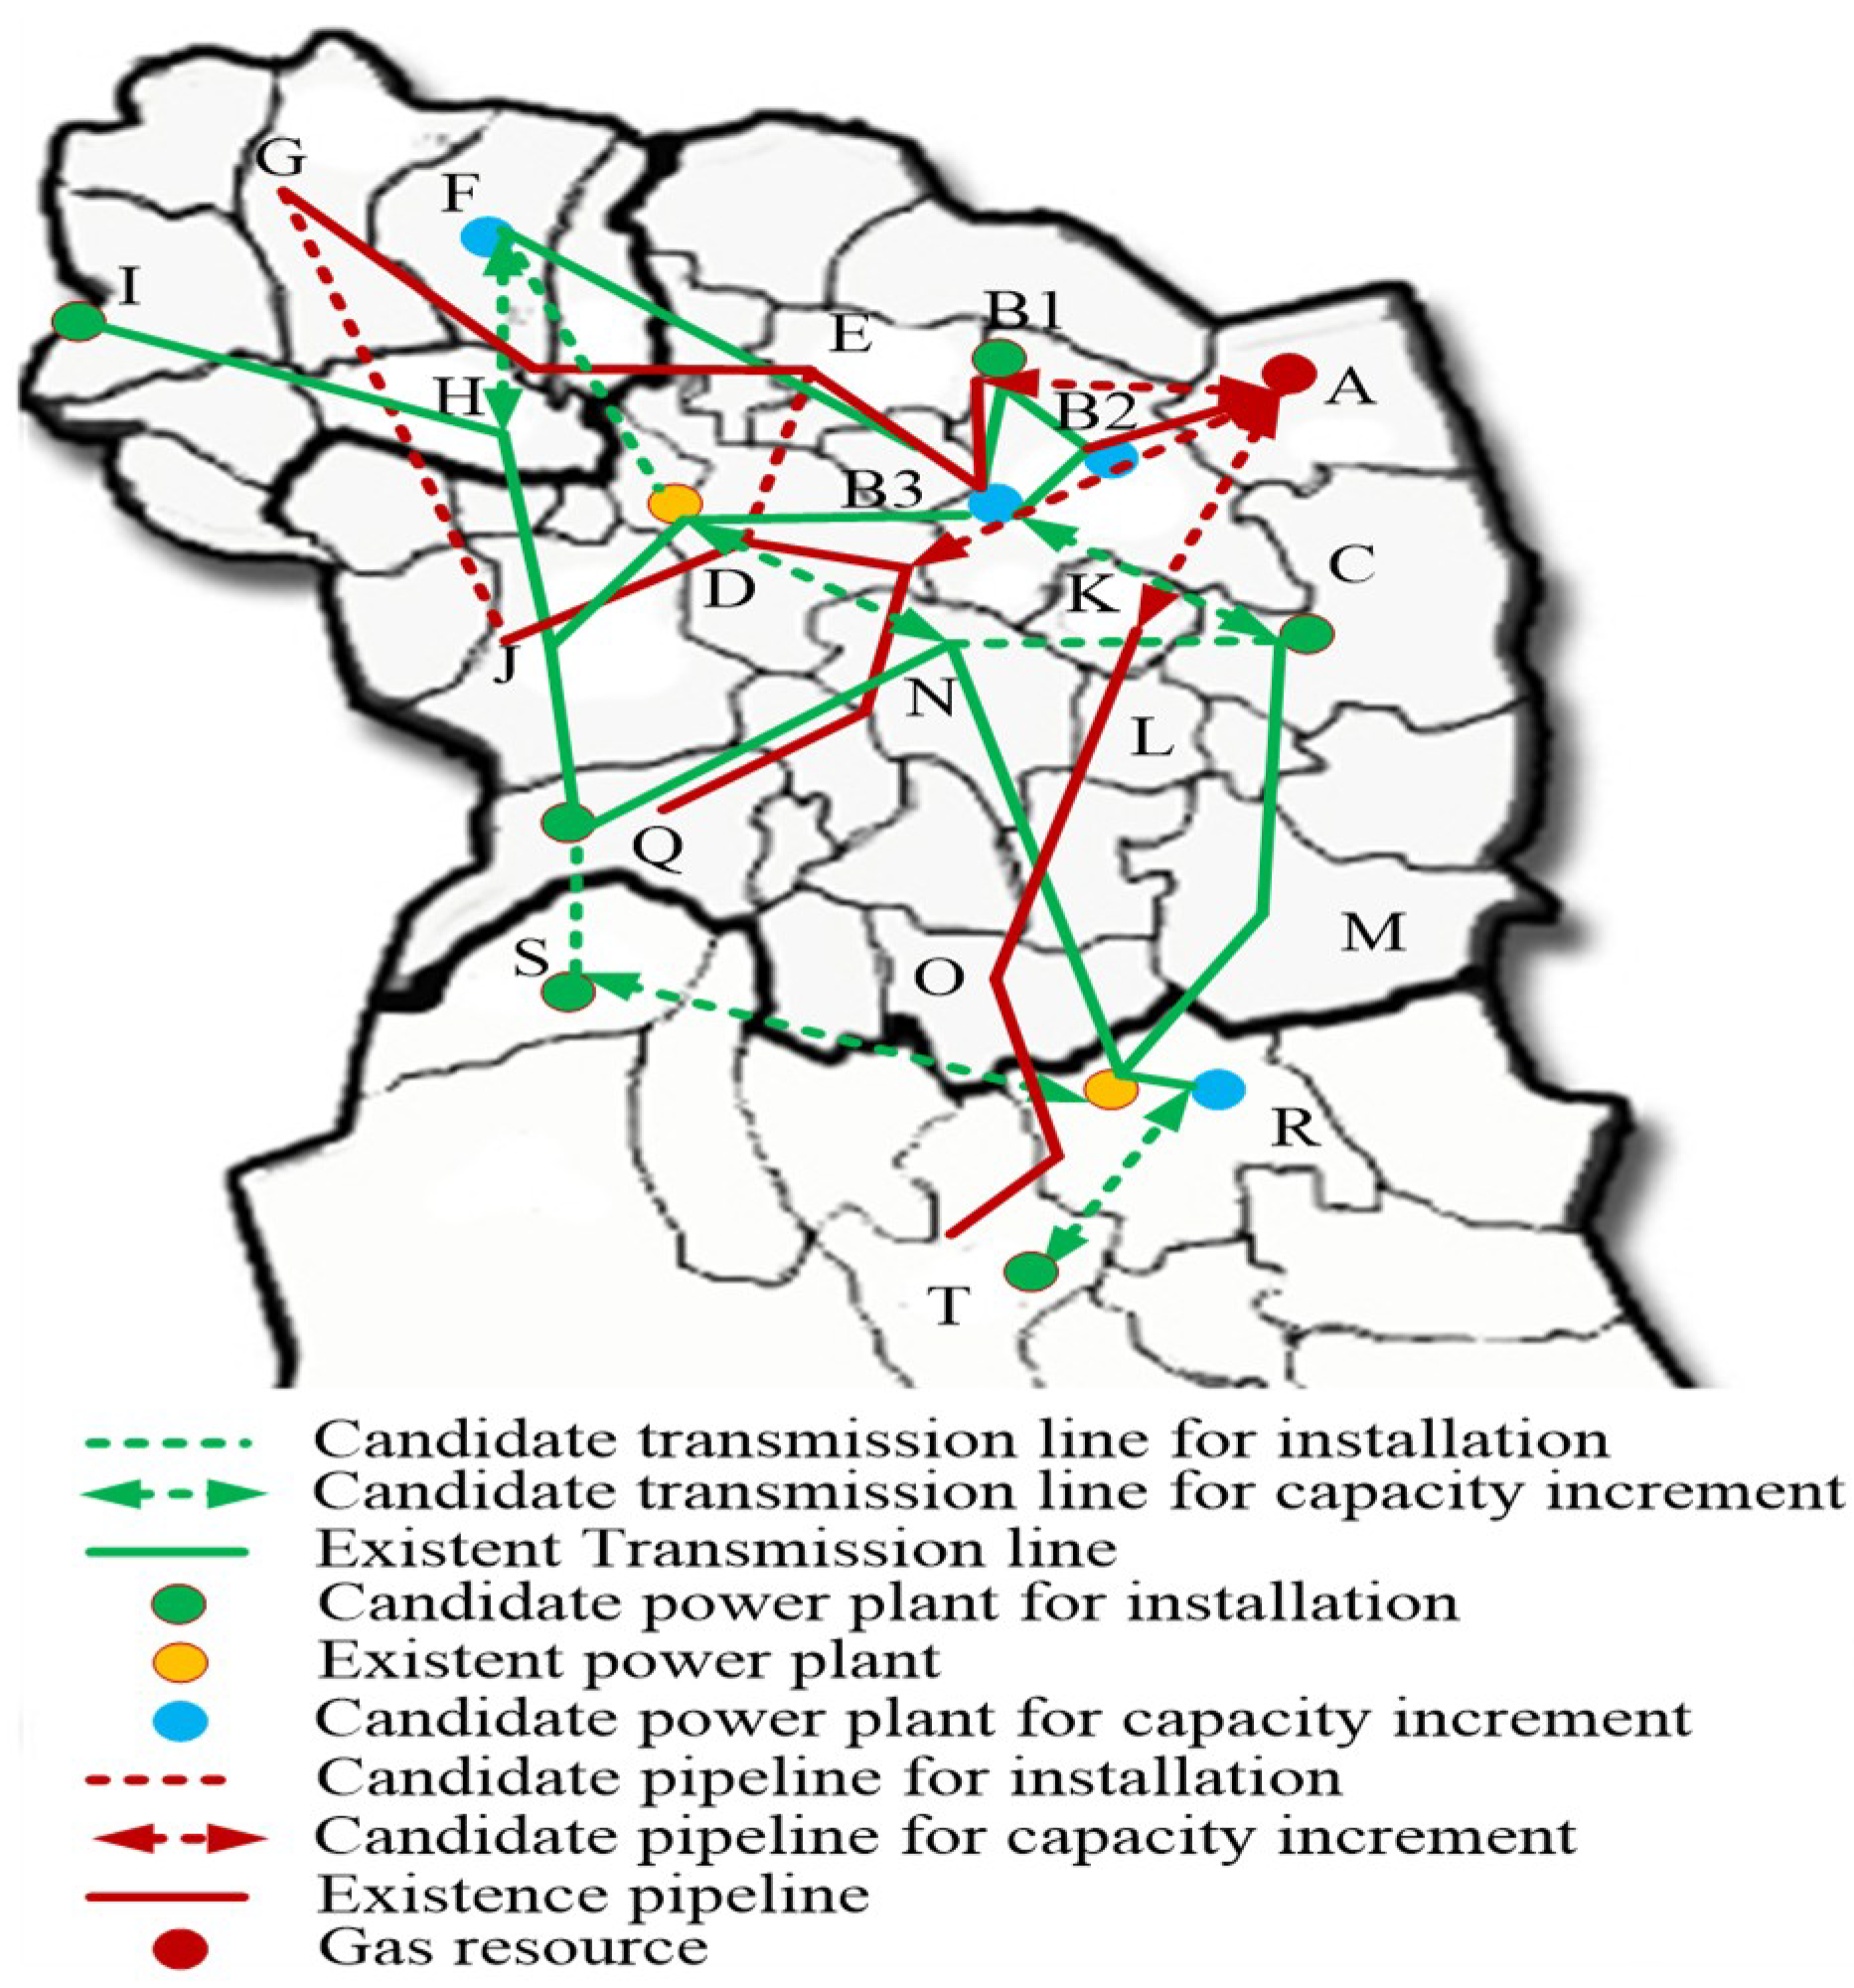
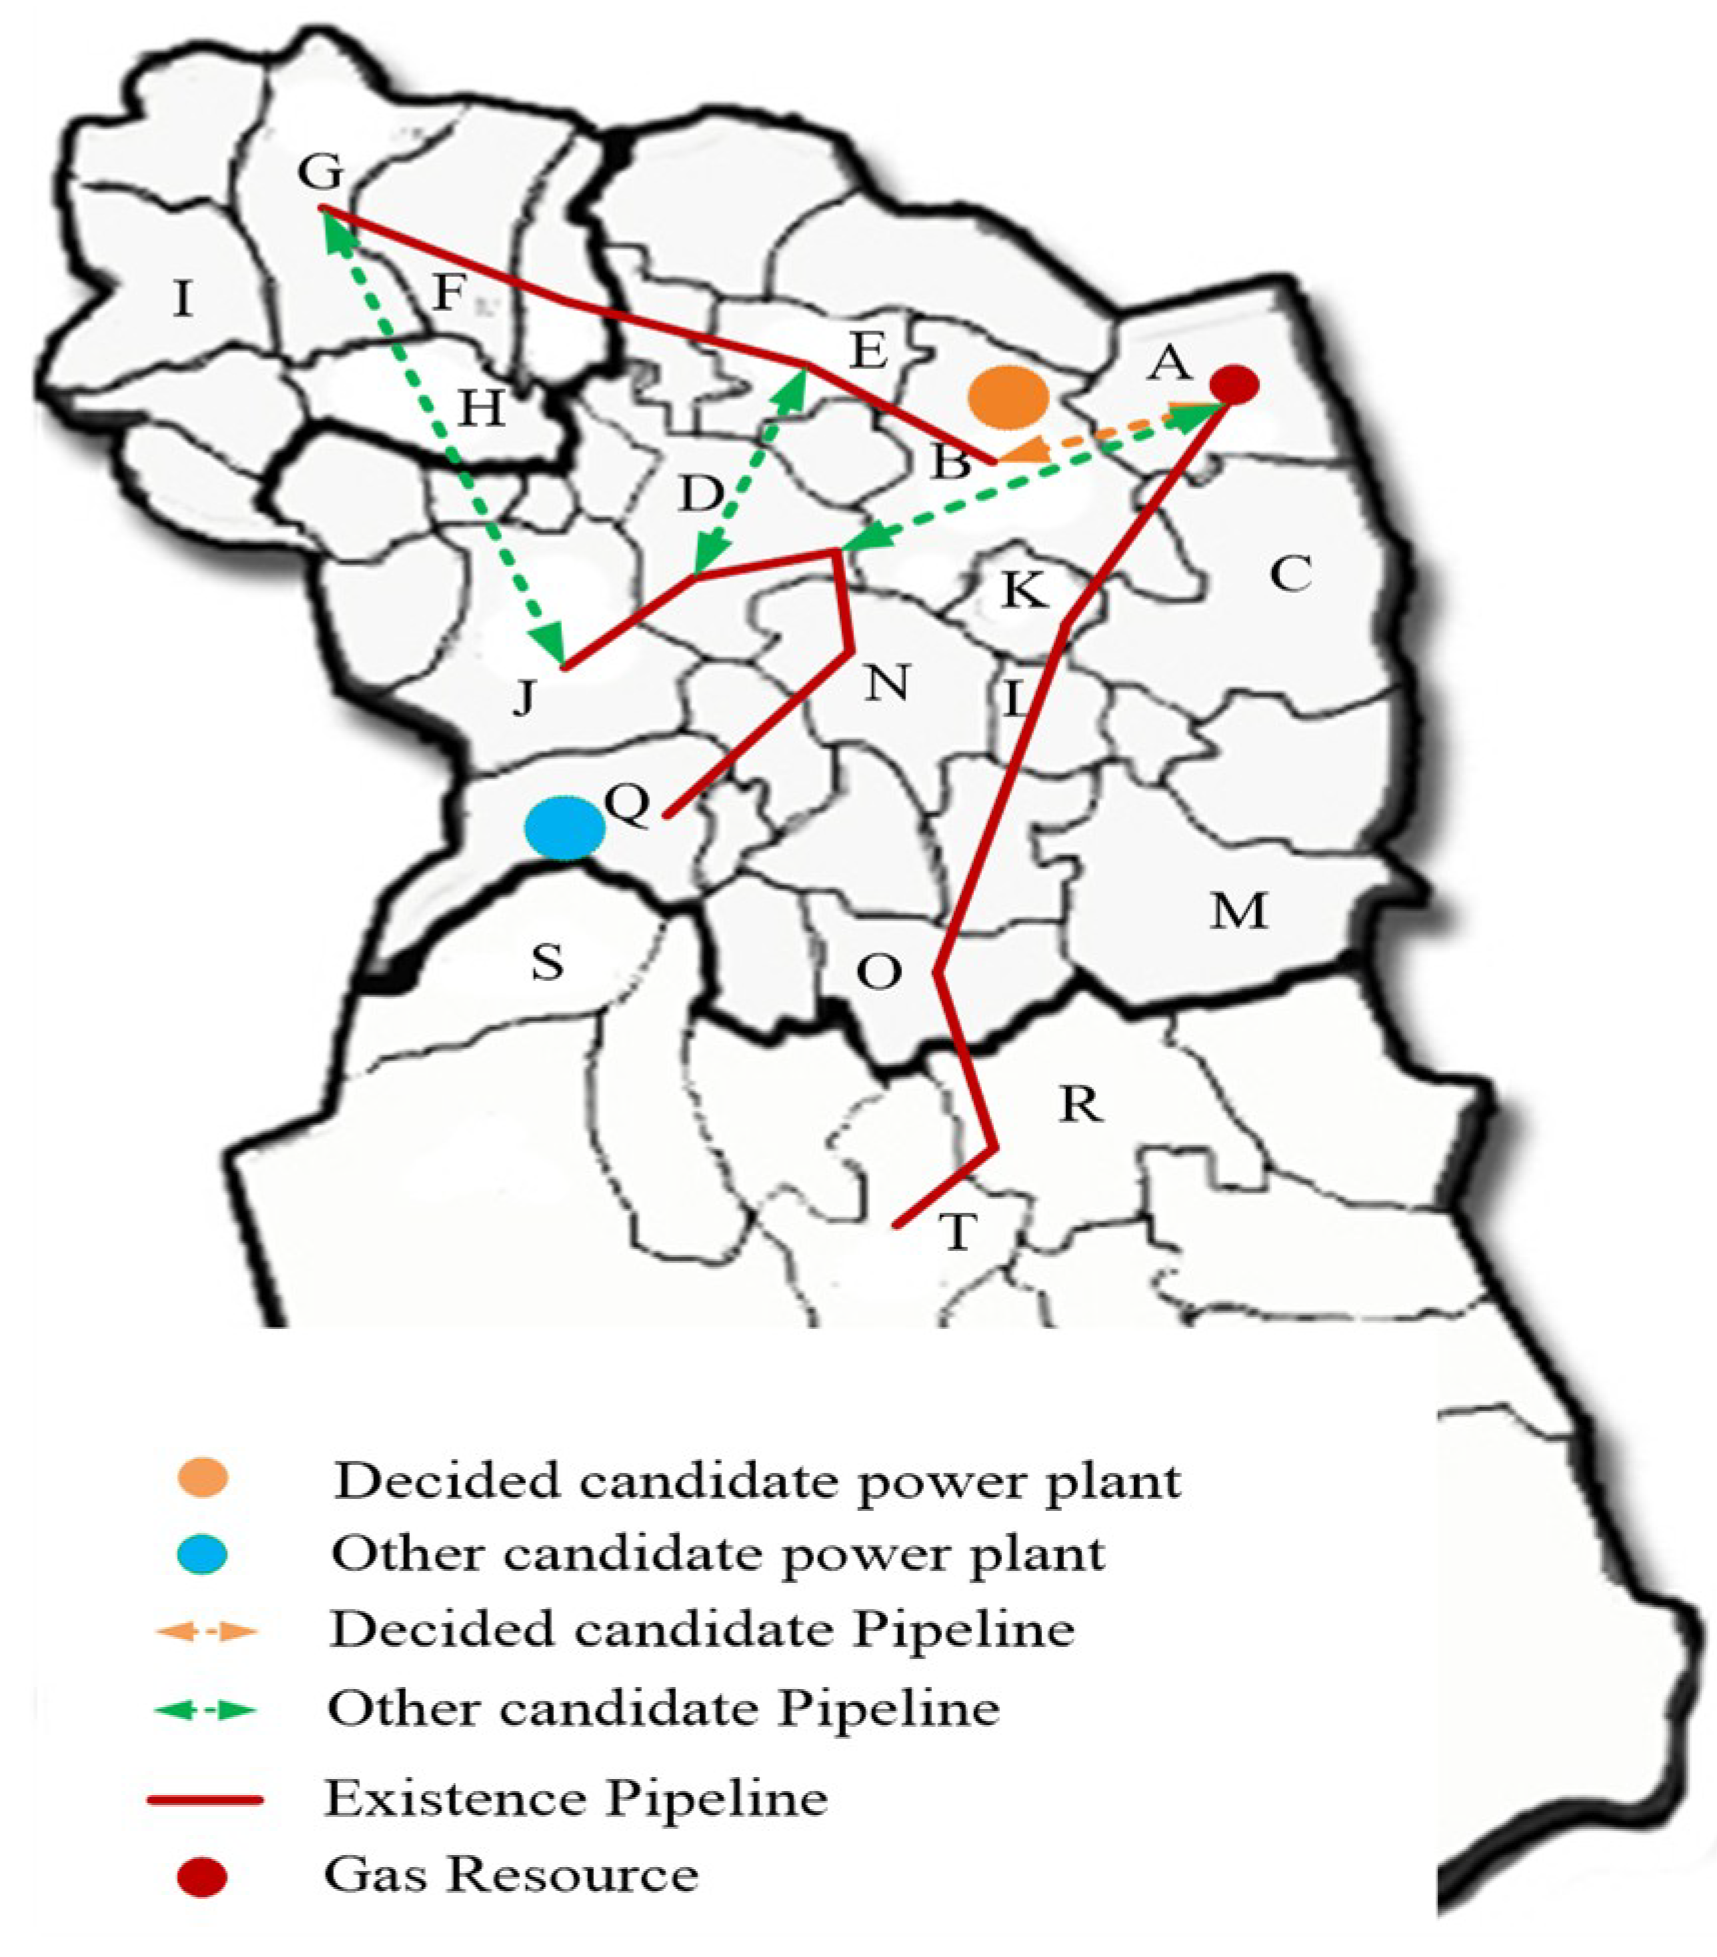
This province accounts for 17% of the total area in Iran while it covers 10% of total electricity consumption and generation mix capacity in Iran. The electricity system is consisted of 19 transmission lines and 17 buses in which 33 GCGUs are connected to 7 buses. Supplementary data of the test electricity system are given in [42]. In the gas system, there are 16 nodes connected through 15 pipelines. Supplementary data of proposed gas system are given in [14]. We suppose a planning period of 15 years. Electricity and gas loads grow 3% annually. The current demand in electricity system is 3129 MW while a maximum generation of 3880 MW is available. In gas system there is a consumption rate of 39.133 MSCMD demanded by other sectors than GCGUs such as residential part. A simplified overall view of proposed case study and expansion planning candidates is shown in Figure 3. Existing gas nodes and electricity buses are specified as regions with letters A to T. Existing pipelines, transmission lines, and generating units and their candidates for expansion are depicted in Figure 3. Investment cost of generation units, transmission lines and pipelines are given in Table 2.
All the possible plans for the expansion of gas and electricity systems are considered to have a comprehensive view of the future of integrated gas–electricity system. The proposed plans are listed in detail in Table 3 with no limitation on investment budget and in Table 4 with such limitation. The proposed plans in Table 4 consider 0.8 and 0.3 billion dollar investment budget for gas and electricity networks, respectively.
4.2. Numerical Results
To demonstrate the effectiveness of the proposed MADM method four cases are examined on the proposed real world case study as follows:
- Case 1: gas and electricity systems have the same priorities
- Case 2: electricity system has higher priority than gas system
- Case 3: gas system has higher priority than electricity system
- Case 4: MMR has higher priority than the other attributes
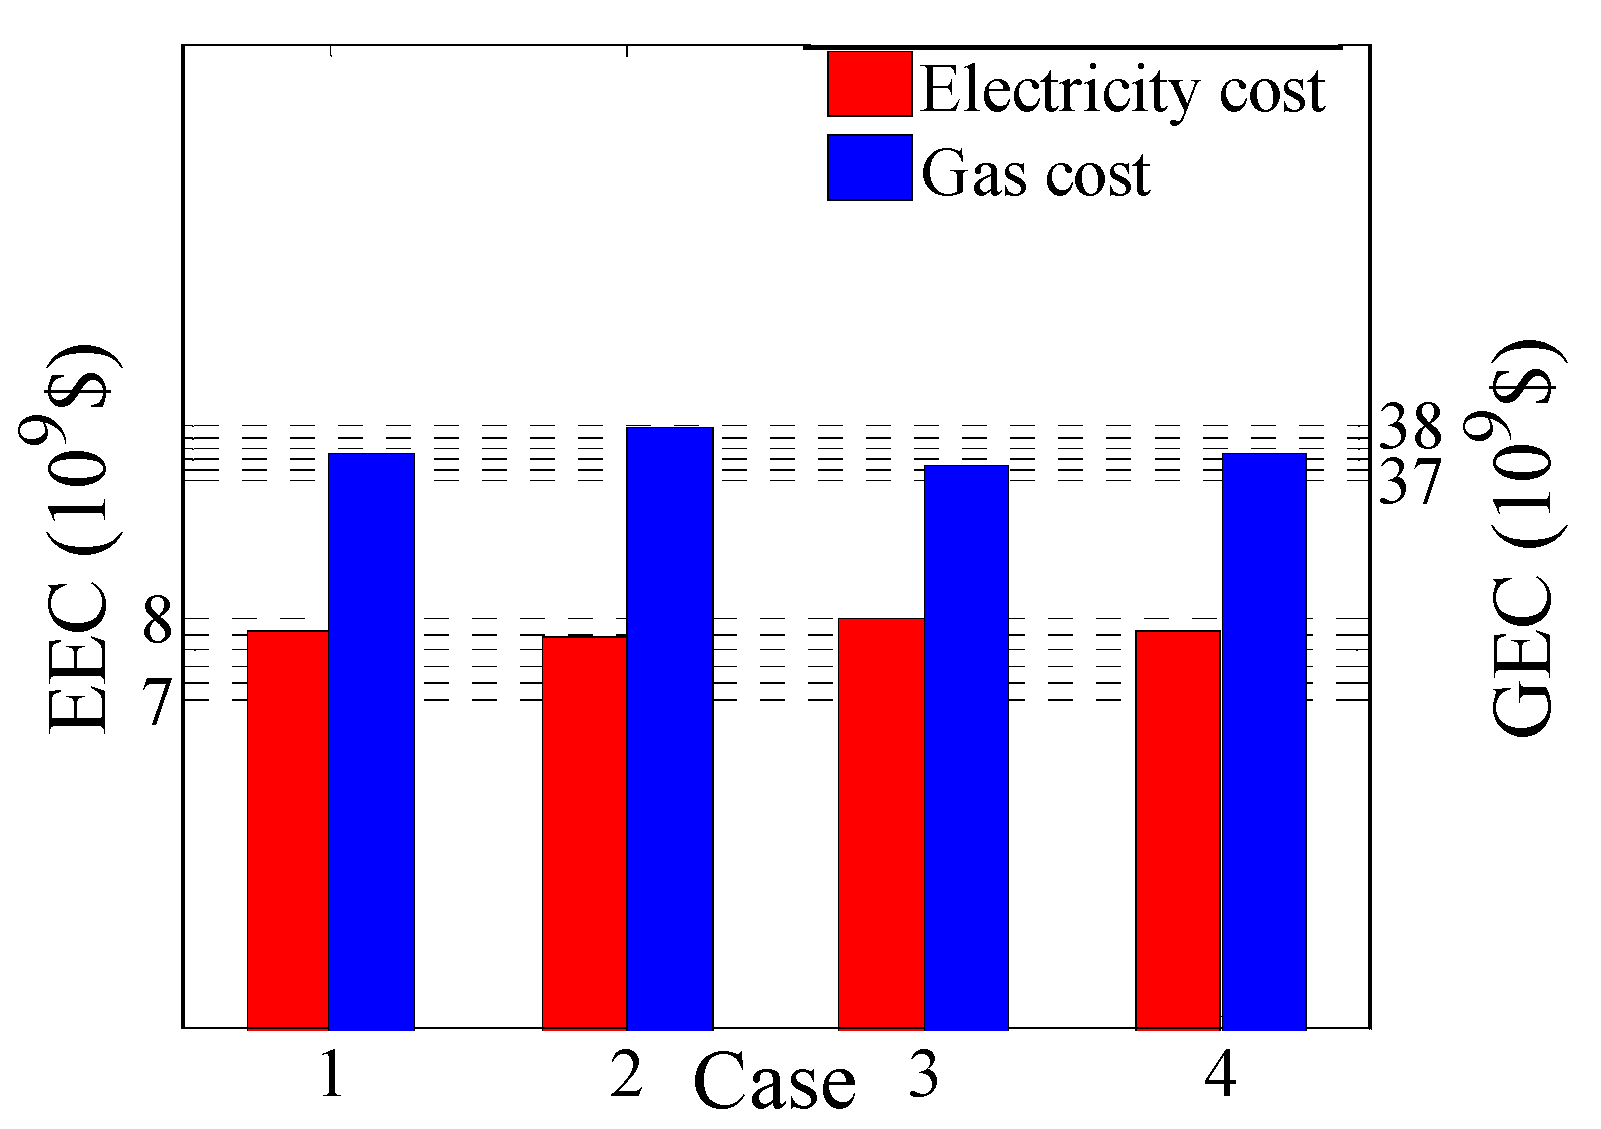
Obtained results show that in the case of considering investment budget in the proposed MADM method, plans 6 and 8 of Table 4 take the high scores in all the proposed cases. As it is shown in Table 4, the only feasible plan for a gas network is increasing the capacity of A-B1 pipeline. In this situation expansion plan alternatives of gas and electricity network are limited due to the budget restriction and as a result, plans that are preferred in different attributes are the same. In this regard impact of investment budget restriction on the proposed case study is further studied in Section 4.5. Without considering investment budget results are quite different. To better compare the impact of different cases on the expansion cost of gas and electricity networks, EEC and GEC in different cases are analyzed in Figure 4. As it is shown the lowest EEC takes place in case 2 which electricity network has higher priority, while this case has the highest GEC. On the other hand lowest GEC occurs in case 3 that gas network has higher priority in ME opinion.
In the AHP method ranking the alternatives is accomplished using an expert judgment. To compare the attribute priorities in different cases 1 to 4, expert opinion is given in Table 5. Numeric scales used in this table are based on the nine-point ratio scale that was shown in Table 1.
Ranking the plans in the proposed cases 1 to 4 is accomplished using the composite index (36) and it is shown in Table 6. Preferred plans in each case are highlighted in the same table. Results of different cases are illustrated in detail as follows.
Case 1: gas and electricity systems have the same priorities
In this case, Table 5 indicates the priorities of attributes with opinion of ME. As it is shown in Table 5, EEC and GEC have the same priorities and according to the ratio scale given in Table 1, opinion of expert is supposed to be 1. However the priority of EEC comparing to the MMR attribute is assigned to be 3. It shows that from the viewpoint of ME, the priority of EEC is a bit higher than MMR. According to the priorities given in Table 5, plans are ranked for different attributes and final score of each plan is shown in Table 6 using the composite index (36). This case indicates a trade-off between GEC and EEC. In this case, plan 2 takes the high score comparing to the other plans. Gas network avoid installing any new pipeline rather than A-B1 and on the other hand, electricity network prefers to have load curtailment instead of installing new generations in the other locations.
Case 2: electricity system has higher priority than gas system
Priority table of this case according to the opinion of ME is given in Table 5. In this regard plans are ranked by (36) in Table 6. As it is highlighted in Table 6, plans 3, 23 and 24 take the high scores of the proposed MADM method. With higher priority of EEC, the proposed MADM method chooses the plans with minimum EEC. ME gives higher priority to electricity network so that the chosen plans have minimum cost for an electricity network while these plans cause higher expansion cost for a gas network. Electricity network is in need of gas fuel supply in region Q to have a minimum expansion cost. In a gas network, Q is mainly supplied by A-D pipeline as shown in Figure 5. However installing new pipelines E-D or G-J is also considered as a choice. Obtained results show that in this case gas network have to install a new pipeline as either E-D or G-J or increase the capacity of A-D pipeline. Consequently, installing any new pipeline rather than A-B1, causes higher expansion cost for a gas network while maintaining lower expansion cost for an electricity network.
Case 3: gas system has higher priority than the electricity system
In this case, GEC has higher priority than the other attributes. Pairwise weighting of the attributes according to the ME opinion is given in Table 5. Ranks of the different plans are calculated by (36) as reported in Table 6. In this case, ME gives higher priority to the expansion cost of gas network compared to the electricity network. Plans highlighted in Table 6 have the lowest expansion cost for gas system while these plans cause higher expansion cost for an electricity network. In this case although electricity network requests for fuel in region Q to have a minimum expansion cost, but gas network decides just to install the A-B1 pipeline. Consequently, electricity network have to install new generations in other regions as shown in Table 3 so as to avoid load curtailment. As a result, electricity network has higher expansion cost compared to the previous case.
Case 4: MMR has higher priority than the other attributes
A priority table according to the ME opinion in this case is given in Table 5. Obtained scores according to the proposed MADM method are summarized in Table 6. In this case plan 2 is chosen by the ME. However, plan 2 was also chosen by ME in case 1. The reason is that in plan 2, MMR intends to minimize the maximum regret and according to the defined attributes, minimum regret takes place whenever there is a tradeoff among the expansion cost of gas and electricity networks. In this way, choosing a plan with higher priority of either gas or electricity network intends to higher value of regret for the other network operator.
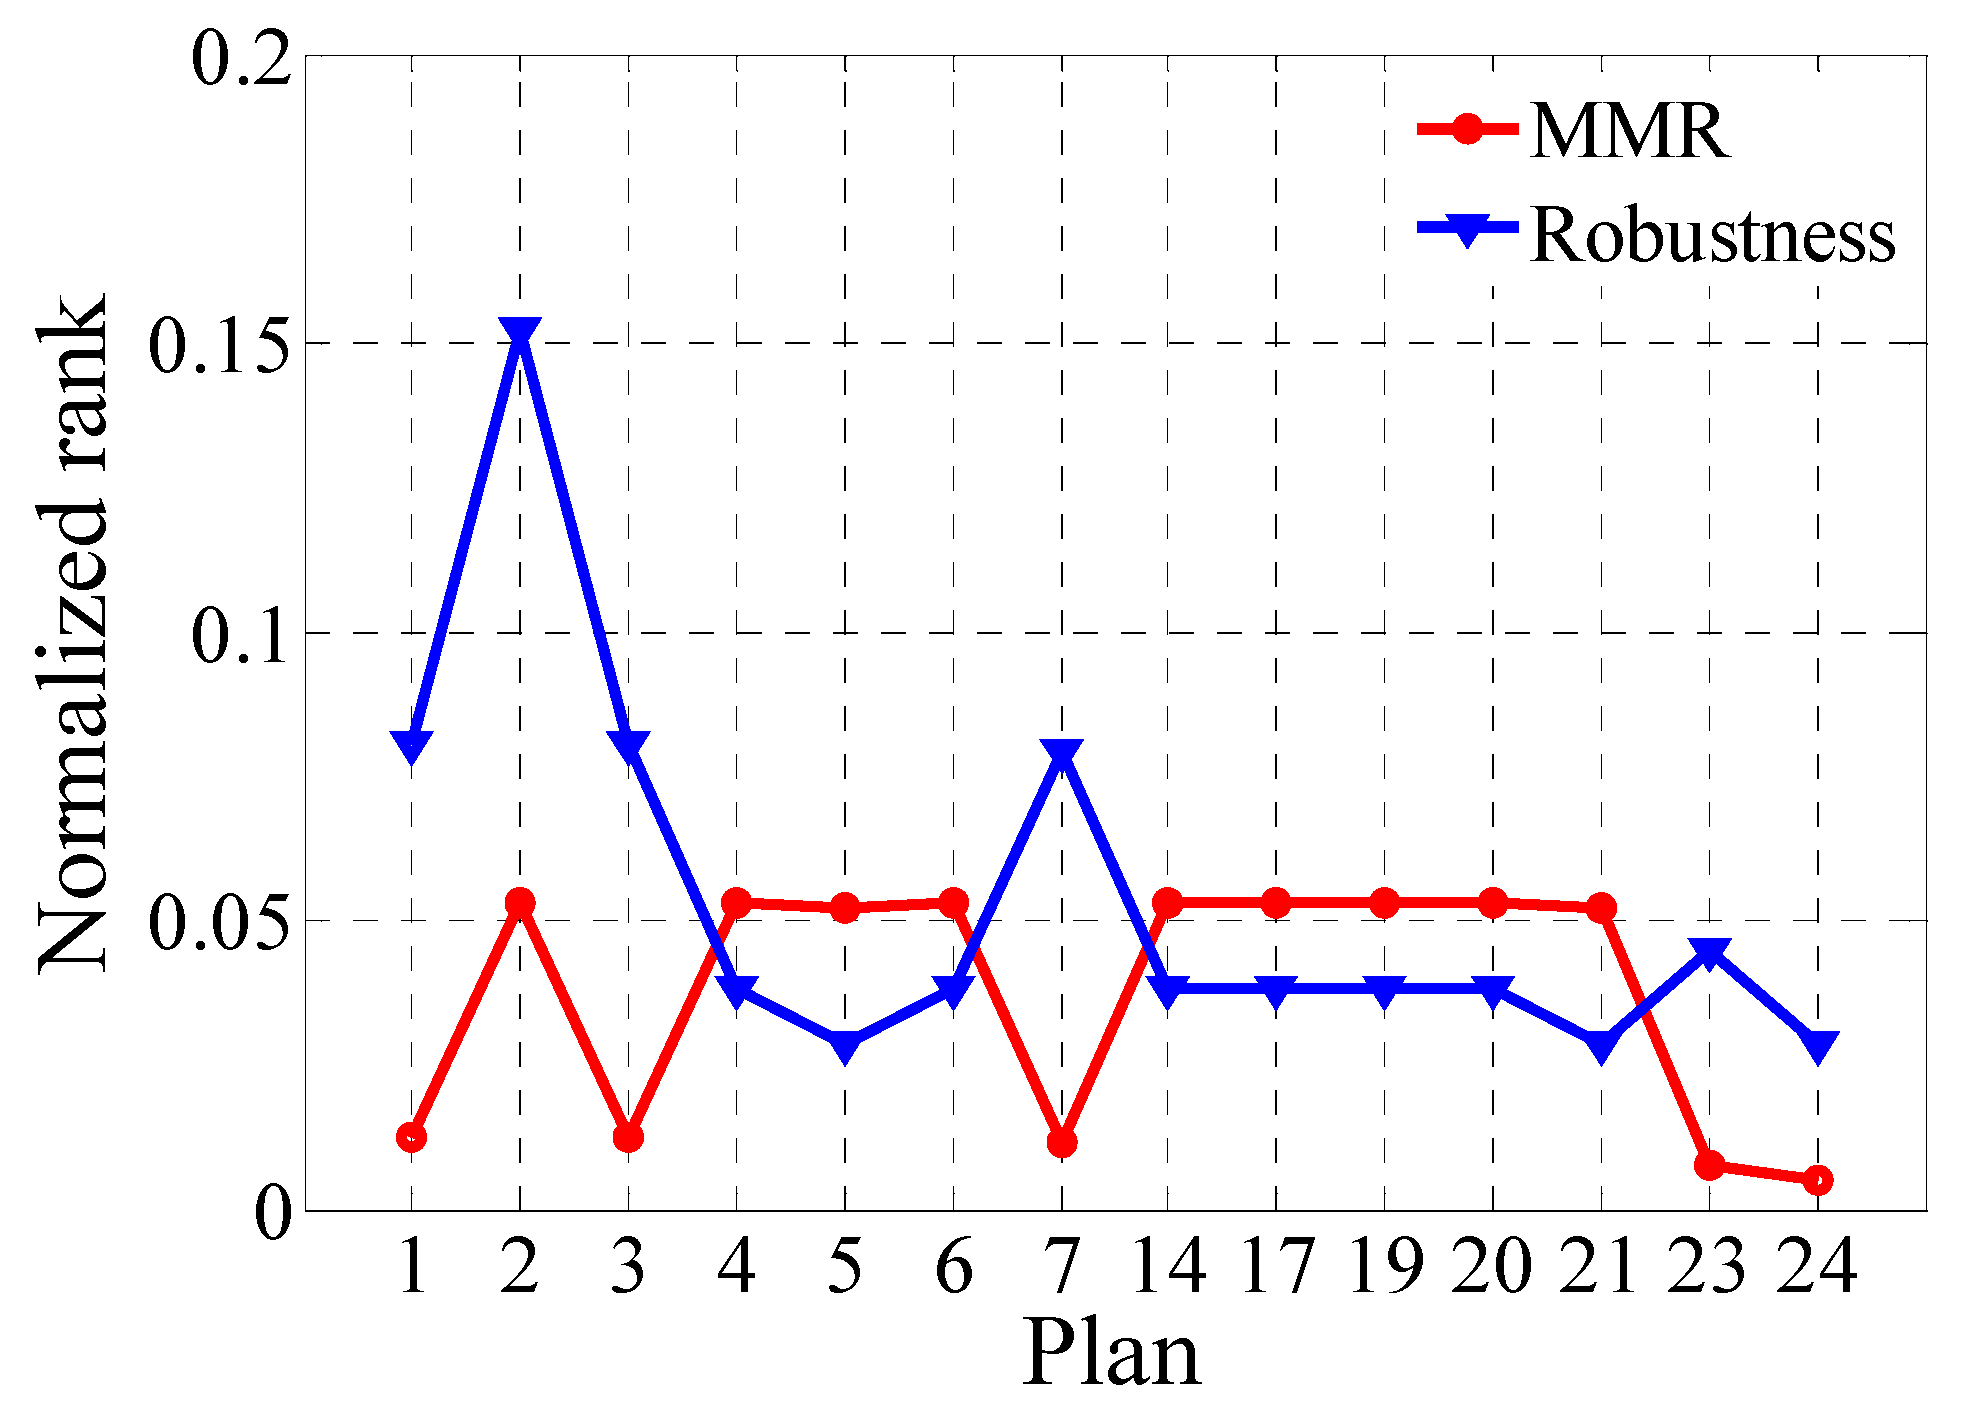
4.3. Risk Analysis
As it is shown in Table 6, cases 2 and 3 include several plans that may cause different risk levels for the proposed integrated energy system. Risk analysis of different plans is illustrated in Figure 6. In Figure 6 it is shown that plan 3 is more appropriate in case 2, as plan 3 has lower risk level in both MMR and β_R criteria. On the other hand, as it is shown in Figure 6, in case 3, plans 5 and 21 have lower risk levels among the other plans and consequently they are more appropriate comparing to the plans 4, 6, 14, 17, 19 and 20. Figure 6 also shows that plan 2 is a tradeoff among GEC and EEC and consequently has the highest rank in both MMR and β_R criteria.
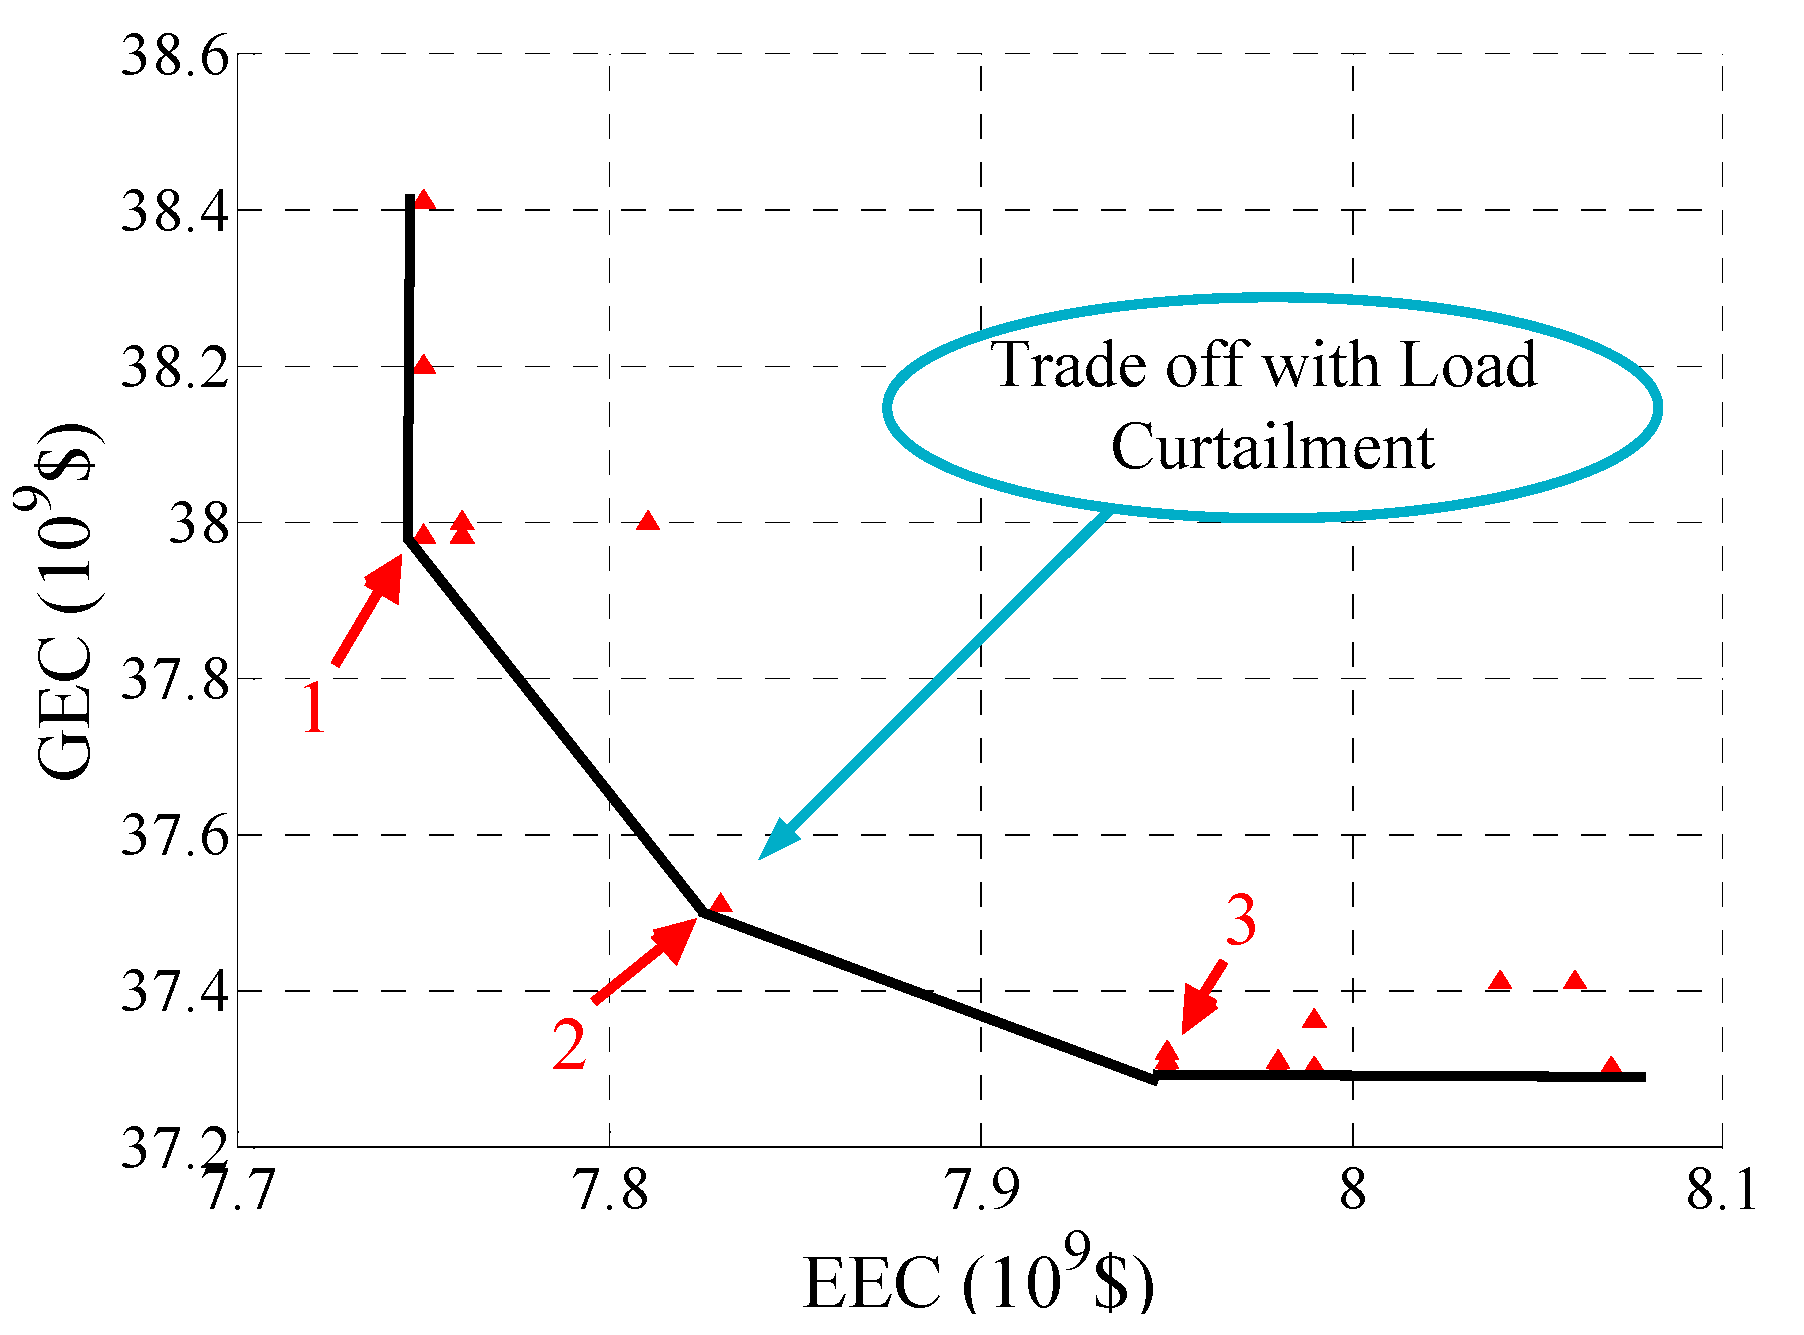
4.4. Comparing the Results with Pareto Optimal Method
In this section, the results of the proposed MADM method are compared with those of a Pareto optimal method. Pareto optimal results of the proposed case study according to the EEC and GEC attributes are shown in Figure 7. In this figure three points with letters 1 to 3 are specified to have a better comparison between the results of the proposed MADM method and Pareto optimal methods. In the Pareto optimal method, all the possible plans of the proposed case study are categorized in 3 points as shown in Table 7 and Figure 7.
In Figure 7, point 1 indicates the minimum EEC plans. Indeed in point 1, EEC has higher priority compared to the other attributes in plans that are located in point 1 as it was also illustrated in case 2 of the proposed MADM method.
Plans that are located in point 2 of Figure 7, exhibit a trade-off between EEC and GEC. In this situation both gas and electricity networks have the same priority in the ME decision-making process. ME chooses plans that minimize the expansion cost of both gas and electricity networks. In this condition, gas network avoids installing any new pipeline rather than A-B1 and as a result, electricity network has higher expansion cost (due to the load curtailment) in comparison with the one incurred in point 1 of Figure 7 and Table 7.
Plans that are located in point 3 of Figure 7 indicate higher priority of GEC. In this condition gas network avoids installing new pipelines but the A-B1. Electricity network has to choose a region for generation expansion that gas network can supply it without any new installation rather than A-B1 pipeline.
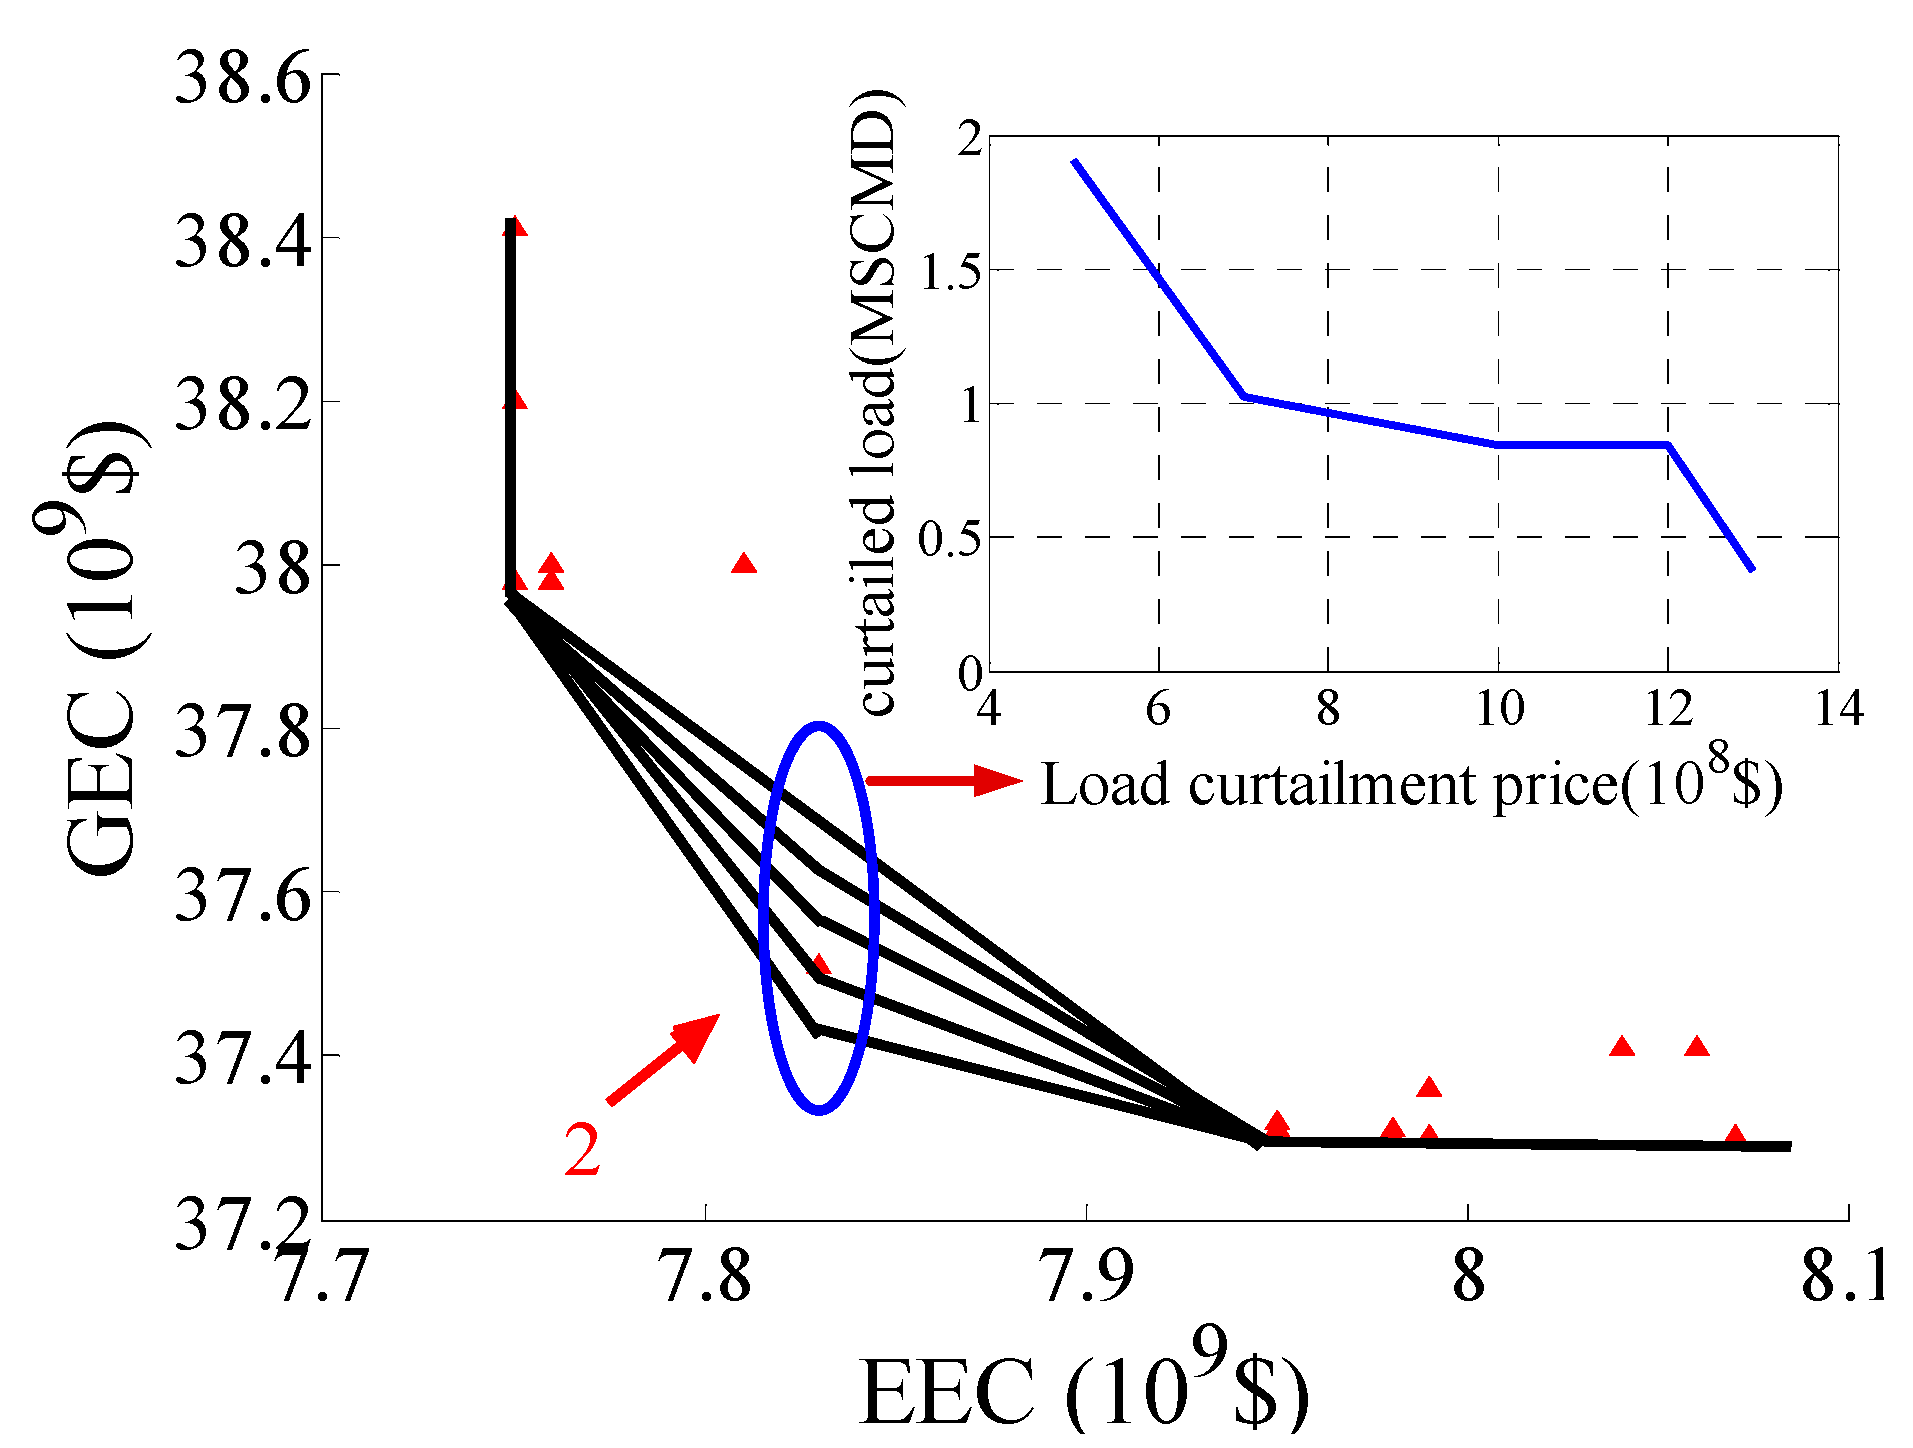
In the proposed case study trade-off occurs whenever there is a load curtailment. Effect of curtailment price on Pareto optimal points and gas load curtailment is shown in Figure 8. By increasing the curtailment price, curtailed load decreases and point 2 moves up, till a point that installing new pipeline A-D is a more efficient option as takes place in point 1 of Figure 8. In this regard as different alternatives were described in case 3 of the proposed MADM method, plans that gas system decides to install a new pipeline rather than A-B1 are not preferred for gas system.
4.5. Impact of Investment Budget Restriction
Investment budget can affect the Pareto front of optimal solutions in Figure 7. To elaborate on this matter, five scenarios with different investment budgets for gas and electricity networks are considered in the proposed MADM method as follows:
- Scenario 1: $0.8 billion investment budget for a gas network and no limit for an electricity network.
- Scenario 2: $19 million investment budget for a gas network and no limit for an electricity network.
- Scenario 3: $0.1 billion investment budget for an electricity network and no limit for a gas network.
- Scenario 4: $0.3 billion investment budget for an electricity network and no limit for a gas network.
- Scenario 5: $0.8 and $0.3 dollar investment budget for gas and electricity networks, respectively.
Pareto optimal results of the proposed scenarios according to the EEC and GEC attributes are shown in Figure 9.
Obtained results are compared with the results of base case in Figure 7 according to the proposed plans in Table 7. As it is shown in Figure 9, by considering investment budget of $0.8 billion for a gas network in scenario 1, gas network excludes the installation of any new pipeline but A-B1. In this condition, plans that are preferred by electricity networks (i.e., installing new generation in Q) lead to load curtailment in a gas network and as a result, lead to a higher expansion cost for a gas network, while the other plans that don’t need new pipeline installation rather than A-B1 i.e., points 2 and 3 of Table 7, are in the same condition as it was illustrated in Section 4.2.
Scenario 2 in Figure 9 indicates that lower investment budget for a gas network avoids installing any new pipeline for a gas network. In this scenario all the proposed plans for gas and electricity networks expansion planning which correspond to points 1 to 3 of Table 7, intend to load curtailment and higher GECs in a gas network.
In scenario 3, budget restrictions for an electricity network exclude generation installation in B2, which results in more load curtailment and higher EECs as compared to the base case.
In scenario 4, more budget for expansion of electricity network is available, thus a generation plant with higher capacity can be planned in Q. However, this budget limit still does not accommodate new generation installation in B2, which again results in load curtailment and increased EECs as compared to the base case.
In scenario 5, both gas and electricity networks have a limited investment budget. Obtained EECs and GECs attributes follow the same trends as those in scenario 4 and 1, respectively. The lowest value of EEC and GEC in scenario 5 is highlighted in Figure 9, which indicates the preferred plan by ME (i.e., plans 6 and 8 in Table 4).
5. Conclusions
In this paper, a multi-attribute decision making (MADM) method for the co-expansion planning of a gas–electricity system was introduced. While there were different attributes, the proposed MADM method selected the best plan based on the chosen attributes. Different attributes were considered to find the best plan with regard to the preferences of gas and electricity system operators. AHP was used to rank all the attributes objectively and find the relative importance of different alternatives. To consider the uncertainty in the case of choosing different plans, all the possible plans for the expansion of gas and electricity networks were examined, and a comprehensive view of the future of integrated gas–electricity system was found in the case of choosing each of the feasible plans. It was shown that the proposed MADM method has advantages as:
- ME as a decision maker has freedom to choose a plan in which the total expansion cost of both systems is minimized or one of the network has priority over the other one.
- Using the proposed MADM method privacy of gas and electricity networks was preserved, because the only shared information among gas and electricity system operators was gas consumption of GCGUs.
- Different attributes including expansion cost of gas and electricity network, β_Robustness and MMR of the proposed integrated energy system were considered in the decision-making process.
Also, results were compared with those of a Pareto optimal method and it was shown that both methods produce similar results. A real case study in the Khorasan province of Iran which has a high penetration level of gas consuming generation units was utilized to demonstrate the effectiveness of proposed method. While there was conflicting attributes, the proposed MADM method could facilitate the decision-making process. It was shown that in the proposed case study, installing a new pipeline rather than A-B1 pipeline intends to higher expansion cost for a gas network while it can reduce the expansion cost of electricity network. Also it was shown that considering a tradeoff between gas and electricity networks causes lower risk levels for the whole integrated energy system. Impact of investment budget restriction on the proposed case study was also illustrated in different scenarios and it was shown that limited investment budget could result in higher load curtailment in a number of expansion plans.
In the future, we intend to consider the power to gas and renewable facilities in the proposed method. Power to gas is a technology that converts electrical power to a gas fuel. When there is extra power from wind generation, power to gas can convert the surplus power to gas. So power to gas as well as gas-fired power plants can mitigate renewable uncertainties. Power to gas and gas-fired power plants are the joint point of gas and electricity networks that has increased the interdependency of gas and electricity networks.
Author Contributions
V.K. did the research work, wrote and revised the paper; M.O.B., A.A.-M. and J.M.G. revised the paper, edited language and supervised the research.
Funding
This research received no external funding.
Conflicts of Interest
The authors declare no conflict of interest.
Nomenclature
| Indices and Sets | |
| Indices of gas nodes | |
| Indices of electricity buses | |
| Index of load period (off, mid and high peak) | |
| Index of days | |
| Index of years | |
| Index of all/gas consuming generation units (GCGUs) | |
| Index of expansion plans | |
| C | Index of attributes |
| Set of nodes/buses of gas/electricity network | |
| Set of transmission lines | |
| Sets of all/active/passive pipelines | |
| Set of daily load periods | |
| Set of all generation units | |
| Y | Set of years |
| D | Set of days |
| K | Set of expansion plans |
| C | Set of decision making attributes |
| Variables | |
| Gas flow of pipeline ij in Million Standard Cubic Meters per Day (MSCMD) | |
| Gas injection at node i in MSCMD | |
| Gas demand of GCGUs at node i | |
| Gas loss at compressor of node i | |
| Curtailed gas demand at load of node i | |
| Gas pressure | |
| Operation cost of electricity system in period t | |
| Fuel consumption of unit gu of bus m | |
| Power flow of line mn | |
| Generation power of unit gu of bus m at period t | |
| Voltage angle of bus m at period t | |
| Curtailed power at load of bus m at time t | |
| Binary variable indicating existence of pipeline ij/transmission line mn/generating unit h of bus m | |
| Priority of plan k in attribute c | |
| Obtained amount for plan k in the case of attribute c | |
| Composite index of plan k | |
| Parameters | |
| Weymouth constant | |
| Pressure ratio in active pipelines | |
| Constant defining compressor gas consumption in active pipeline ij | |
| Gas price at node i in $/MSCM | |
| Gas curtailment price at node i ($/MSCM) | |
| Length of pipeline ij (km) | |
| Diameter of pipeline ij (inch) | |
| Gas demand of non-generation unit loads at node i | |
| Length of transmission line mn | |
| Rated power of unit gu of bus m | |
| Power demand at bus m | |
| Load curtailment price at bus m in $/MW | |
| Fuel price in unit gu of bus m in $/MSCMD | |
| Series admittance of line mn | |
| Base of power | |
| Gross heating value of fuel in unit h | |
| Investment cost of pipeline ij (k$/inch-km)/transmission line mn (k$/km)/generation unit gu of bus m (k$/MW) | |
| Planning period | |
| Investment budget of electricity network | |
| Investment budget of gas network | |
| Duration of period | |
| Interest rate | |
| Preferred amount of attribute c | |
| Non-preferred amount of attribute c |
References
- Jiang, Y.; Xu, J.; Sun, Y.; Wei, C.; Wang, J.; Liao, S.; Ke, D.; Li, X.; Yang, J.; Peng, X. Coordinated operation of gas-electricity integrated distribution system with multi-CCHP and distributed renewable energy sources. Appl. Energy 2018, 211, 237–248. [Google Scholar] [CrossRef]
- Devlin, J.; Li, K.; Higgins, P.; Foley, A. The importance of gas infrastructure in power systems with high wind power penetrations. Appl. Energy 2016, 167, 294–304. [Google Scholar] [CrossRef] [Green Version]
- Annual Energy Outlook. 2008. Available online: https://www.eia.gov/outlooks/aeo/ (accessed on 6 February 2018).
- Nastasi, B.; Basso, G.L. Power-to-gas integration in the transition towards future urban energy systems. Int. J. Hydrog. Energy 2017, 42, 23933–23951. [Google Scholar] [CrossRef]
- Diagoupis, T.D.; Andrianesis, P.E.; Dialynas, E.N. A planning approach for reducing the impact of natural gas network on electricity markets. Appl. Energy 2016, 175, 189–198. [Google Scholar] [CrossRef]
- Khaligh, V.; Buygi, M.O.; Moghaddam, A.A.; Guerrero, J.M. Leader-Follower Approach to Gas-Electricity Expansion Planning Problem. In Proceedings of the IEEE 18th International Conference on Environment and Electrical Engineering and 2nd Industrial and Commercial Power Systems Europe (EEEIC 2018), Palermo, Italy, 12–15 June 2018. [Google Scholar]
- Greening, L.A.; Bernow, S. Design of coordinated energy and environmental policies: Use of multi-criteria decision-making. Energy Policy 2004, 32, 721–735. [Google Scholar] [CrossRef]
- Wen, Y.; Qu, X.; Li, W.; Liu, X.; Ye, X. Synergistic operation of electricity and natural gas networks via admm. IEEE Trans. Smart Grid 2017. [Google Scholar] [CrossRef]
- Zhou, X.; Guo, C.; Wang, Y.; Li, W. Optimal expansion co-planning of reconfigurable electricity and natural gas distribution systems incorporating energy hubs. Energies 2017, 10, 124. [Google Scholar] [CrossRef]
- Unsihuay-Vila, C.; Marangon-Lima, J.W.; de Souza, A.Z.; Perez-Arriaga, I.J.; Balestrassi, P.P. A model to long-term, multiarea, multistage, and integrated expansion planning of electricity and natural gas systems. IEEE Trans. Power Syst. 2010, 25, 1154–1168. [Google Scholar] [CrossRef]
- Saldarriaga, C.A.; Hincapié, R.A.; Salazar, H. A holistic approach for planning natural gas and electricity distribution networks. IEEE Trans. Power Syst. 2013, 28, 4052–4063. [Google Scholar] [CrossRef]
- Chaudry, M.; Jenkins, N.; Qadrdan, M.; Wu, J. Combined gas and electricity network expansion planning. Appl. Energy 2014, 113, 1171–1187. [Google Scholar] [CrossRef]
- Qiu, J.; Dong, Z.Y.; Zhao, J.H.; Xu, Y.; Zheng, Y.; Li, C.; Wong, K.P. Multi-stage flexible expansion co-planning under uncertainties in a combined electricity and gas market. IEEE Trans. Power Syst. 2015, 30, 2119–2129. [Google Scholar] [CrossRef]
- Barati, F.; Seifi, H.; Sepasian, M.S.; Nateghi, A.; Shafie-khah, M.; Catalao, J.P.S. Multi-period integrated framework of generation, transmission, and natural gas grid expansion planning for large-scale systems. IEEE Trans. Power Syst. 2015, 30, 2527–2537. [Google Scholar] [CrossRef]
- Qiu, J.; Dong, Z.Y.; Zhao, J.H.; Meng, K.; Zheng, Y.; Hill, D.J. Low carbon oriented expansion planning of integrated gas and power systems. IEEE Trans. Power Syst. 2015, 30, 1035–1046. [Google Scholar] [CrossRef]
- Shao, C.; Shahidehpour, M.; Wang, X.; Wang, X.; Wang, B. Integrated planning of electricity and natural gas transportation systems for enhancing the power grid resilience. IEEE Trans. Power Syst. 2017, 32, 4418–4429. [Google Scholar] [CrossRef]
- Qiu, J.; Yang, H.; Dong, Z.Y.; Zhao, J.H.; Meng, K.; Luo, F.J.; Wong, K.P. A linear programming approach to expansion co-planning in gas and electricity markets. IEEE Trans. Power Syst. 2016, 31, 3594–3606. [Google Scholar] [CrossRef]
- Zhang, X.; Shahidehpour, M.; Alabdulwahab, A.S.; Abusorrah, A. Security-constrained co-optimization planning of electricity and natural gas transportation infrastructures. IEEE Trans. Power Syst. 2015, 30, 2984–2993. [Google Scholar] [CrossRef]
- Zhao, B.; Conejo, A.J.; Sioshansi, R. Coordinated Expansion Planning of Natural Gas and Electric Power Systems. IEEE Trans. Power Syst. 2017, 33, 3064–3075. [Google Scholar] [CrossRef]
- Ding, T.; Hu, Y.; Bie, Z. Multi-Stage Stochastic Programming with Nonanticipativity Constraints for Expansion of Combined Power and Natural Gas Systems. IEEE Trans. Power Syst. 2018, 33, 317–328. [Google Scholar] [CrossRef]
- Odetayo, B.; MacCormack, J.; Rosehart, W.D.; Zareipour, H. A sequential planning approach for Distributed generation and natural gas networks. Energy 2017, 127, 428–437. [Google Scholar] [CrossRef]
- Zeng, Q.; Zhang, B.; Fang, J.; Chen, Z. A bi-level programming for multistage co-expansion planning of the integrated gas and electricity system. Appl. Energy 2017, 200, 192–203. [Google Scholar] [CrossRef]
- He, C.; Wu, L.; Liu, T.; Bie, Z. Robust co-optimization planning of interdependent electricity and natural gas systems with a joint N-1 and probabilistic reliability criterion. IEEE Trans. Power Syst. 2018, 33, 2140–2154. [Google Scholar] [CrossRef]
- Nunes, J.B.; Mahmoudi, N.; Saha, T.K.; Chattopadhyay, D. A stochastic integrated planning of electricity and natural gas networks for Queensland, Australia considering high renewable penetration. Energy 2018, 153, 539–553. [Google Scholar] [CrossRef]
- Zhang, Y.; Hu, Y.; Ma, J.; Bie, Z. A Mixed-integer Linear Programming Approach to Security-constrained Co-optimization Expansion Planning of Natural Gas and Electricity Transmission Systems. IEEE Trans. Power Syst. 2018. [Google Scholar] [CrossRef]
- Zhang, X.; Che, L.; Shahidehpour, M.; Alabdulwahab, A.S.; Abusorrah, A. Reliability-based optimal planning of electricity and natural gas interconnections for multiple energy hubs. IEEE Trans. Smart Grid 2015, 1–10. [Google Scholar] [CrossRef]
- Bent, R.; Blumsack, S.; Van Hentenryck, P.R.; Sanchez, C.B.; Shahriari, M. Joint Electricity and Natural Gas Transmission Planning with Endogenous Market Feedbacks. IEEE Trans. Power Syst. 2018. [Google Scholar] [CrossRef]
- Odetayo, B.; Kazemi, M.; MacCormack, J.; Rosehart, W.; Zareipour, H.; Seifi, A.R. A Chance Constrained Programming Approach to the Integrated Planning of Electric Power Generation, Natural Gas Network and Storage. IEEE Trans. Power Syst. 2018. [Google Scholar] [CrossRef]
- Shaaban, M.; Scheffran, J.; Böhner, J.; Elsobki, M.S. Sustainability assessment of electricity generation technologies in Egypt using multi-criteria decision analysis. Energies 2018, 11, 1117. [Google Scholar] [CrossRef]
- Pambour, K.A.; Sopgwi, R.T.; Hodge, B.M.; Brancucci, C. The value of day-ahead coordination of power and natural gas network operations. Energies 2018, 11, 1628. [Google Scholar] [CrossRef]
- Wang, D.X.; Qiu, J.; Meng, K.; Gao, X.D.; Dong, Z.Y. Coordinated expansion co-planning of integrated gas and power systems. J. Mod. Power Syst. Clean Energy 2017, 5, 314–325. [Google Scholar] [CrossRef]
- Li, G.; Zhang, R.; Jiang, T.; Chen, H.; Bai, L.; Li, X. Security-constrained bi-level economic dispatch model for integrated natural gas and electricity systems considering wind power and power-to-gas process. Appl. Energy 2017, 194, 696–704. [Google Scholar] [CrossRef]
- Menon, E.S. Gas Pipeline Hydraulics; CRC Press: Boca Raton, FL, USA, 2005. [Google Scholar]
- Tabkhi, F.; Pibouleau, L.; Azzaro-Pantel, C.; Domenech, S. Total cost minimization of a high-pressure natural gas network. J. Energy Resour. Technol. 2009, 131, 043002. [Google Scholar] [CrossRef]
- Ojeda-Esteybar, D.M.; Rubio-Barros, R.G.; Añó, O. Vargas, Integration of electricity and natural gas systems-identification of coordinating parameters. In Proceedings of the 2014 IEEE PES Transmission & Distribution Conference and Exposition-Latin America (PES T&D-LA), Medellin, Colombia, 10–13 September 2014. [Google Scholar]
- Osiadacz, A. Simulation and Analysis of Gas Networks; Department of Energy Office of Scientific and Technical Information: Washington, DC, USA, 1987.
- Aissi, H.; Bazgan, C.; Vanderpooten, D. Min–max and min–max regret versions of combinatorial optimization problems: A survey. Eur. J. Oper. Res. 2009, 197, 427–438. [Google Scholar] [CrossRef] [Green Version]
- Saaty, T.L. A scaling method for priorities in hierarchical structures. J. Math. Psychol. 1977, 15, 234–281. [Google Scholar] [CrossRef]
- Saaty, R.W. The analytic hierarchy process—What it is and how it is used. Math. Model. 1987, 9, 161–176. [Google Scholar] [CrossRef]
- Rosenthal, R.E. GAMS—A User’s Guide; CRC Press: Boca Raton, FL, USA, 2004. [Google Scholar]
- Bonami, P.; Lee, J. BONMIN user’s manual. Numer. Math. 2007, 4, 1–32. [Google Scholar]
- Seyedi, H.; Sanaye-Pasand, M. New centralised adaptive load-shedding algorithms to mitigate power system blackouts. IET Gener. Transm. Distrib. 2009, 3, 99–114. [Google Scholar] [CrossRef]
Figure 1.
Hierarchy process according to the proposed attributes.

Figure 2.
Flowchart of the proposed multi-attribute decision-making (MADM) method.

Figure 3.
Khorasan gas–electricity system.

Figure 4.
EEC and GEC in different cases.

Figure 5.
Gas fuel requested by electricity network and the proposed pipeline candidates.

Figure 6.
Risk analysis of different plans.

Figure 7.
Pareto optimal chart.

Figure 8.
Effect of load curtailment price on point 2.

Figure 9.
Impact of different investment budget scenarios on Pareto optimal results.


Table 1.
Nine-point scale used in pairwise comparison [38].
Table 1.
Nine-point scale used in pairwise comparison [38].
| Scale | Degree of Priority |
|---|---|
| 1 | Equal importance |
| 3 | Weak |
| 5 | Strong |
| 7 | Very strong |
| 9 | Extreme importance |
| 2, 4, 6, 8 | Intermediate values |
Table 2.
Investment cost of expansion candidates.
| Pipelines | Cost (k$/inch-km) | Trans. Lines | Cost (k$/km) | Gen. | Cost (k$/MW) |
|---|---|---|---|---|---|
| A-B1 | 40 | S-Q | 240 | C | 900 |
| A-K | 40 | N-C | 240 | S | 900 |
| A-D | 60 | B-C | 360 | Q | 900 |
| E-D | 60 | N-D | 480 | F | 900 |
| G-J | 60 | F-H | 480 | I | 900 |
| R-T | 480 | T | 1170 | ||
| R-S | 480 | B | 1440 | ||
| F-D | 480 | R | 1080 | ||
Table 3.
Alternatives considered for expansion planning of gas and electricity networks.
| Plan | Transmission Candidates | Generation Candidates | Pipeline Candidates |
|---|---|---|---|
| 1 | B-C, N-D | I, B2 | A-B1, A-D |
| 2 | F-H | I, S | A-B1 |
| 3 | F-H, B-C | Q, B2 | A-B1, A-D |
| 4 | F-H | C, S, B2 | A-B1 |
| 5 | F-H, B-C | C, R, B2 | A-B1 |
| 6 | F-H, B-C | C, S, B2 | A-B1 |
| 7 | - | I, B1, S | A-B1, A-D |
| 8 | - | I, B1, Q, S | A-B1, A-D |
| 9 | F-H | F, B1, C, S | A-B1 |
| 10 | F-H | F, B1, R, S | A-B1 |
| 11 | F-H | F, B1, C, S | A-B1 |
| 12 | F-H | B1, B3, C, S | A-B1 |
| 13 | F-H | F, B1, S, T | A-B1 |
| 14 | F-H | S, B2 | A-B1 |
| 15 | F-H, B-C, S-Q | B3, S, B2 | A-B1 |
| 16 | F-H | F, B1, S | A-B1 |
| 17 | F-H | F, S, B2 | A-B1 |
| 18 | F-H | F, T, B2 | A-B1 |
| 19 | F-H, B-C | F, S, B2 | A-B1 |
| 20 | F-H, N-D | F, S, B2 | A-B1 |
| 21 | F-H, N-C | F, S, B2 | A-B1 |
| 22 | F-H, S-Q | C, S, B2 | A-B1 |
| 23 | F-H, B-C | Q, B2 | E-D, A-B1 |
| 24 | F-H, B-C | Q, B2 | G-J, A-B1 |
Table 4.
Alternatives considered for expansion planning of gas and electricity networks considering restriction in investment budget.
Table 4.
Alternatives considered for expansion planning of gas and electricity networks considering restriction in investment budget.
| Plan | Transmission Candidates | Generation Candidates | Pipeline Candidates |
|---|---|---|---|
| 1 | F-H | I, C, S | A-B1 |
| 2 | - | I, C | A-B1 |
| 3 | F-H | F, C | A-B1 |
| 4 | F-H | C, B1 | A-B1 |
| 5 | F-H | C, B3 | A-B1 |
| 6 | F-H | C, S | A-B1 |
| 7 | F-H, B-C, S-Q | F, S, Q | A-B1 |
| 8 | - | C, R | A-B1 |
| 9 | F-H | C, B2 | A-B1 |
| 10 | F-H | R | A-B1 |
| 11 | F-H | S, R, B2 | A-B1 |
Table 5.
ME opinion in different attributes.
| Attribute | EEC | GEC | MMR | β_R | ||||
|---|---|---|---|---|---|---|---|---|
| EEC | 1 I | 1 II | 1 | 9 | 3 | 9 | 3 | 9 |
| 1 III | 1 IV | 0.11 | 1 | 3 | 0.11 | 3 | 3 | |
| GEC | 1 | 0.11 | 1 | 1 | 3 | 3 | 3 | 3 |
| 9 | 1 | 1 | 1 | 9 | 0.11 | 9 | 3 | |
| MMR | 0.33 | 0.11 | 0.33 | 0.33 | 1 | 1 | 1 | 1 |
| 0.33 | 9 | 0.11 | 9 | 1 | 1 | 1 | 9 | |
| β_R | 0.33 | 0.11 | 0.33 | 0.33 | 1 | 1 | 1 | 1 |
| 0.33 | 0.33 | 0.11 | 0.33 | 1 | 0.11 | 1 | 1 | |
I: Case 1; II: Case 2; III: Case 3; IV: Case 4.
Table 6.
Ranking the plans based on the proposed cases.
| Plans | Case 1 | Case 2 | Case 3 | Case 4 |
|---|---|---|---|---|
| 1 | 0.054443 | 0.083611 | 0.027955 | 0.025225 |
| 2 | 0.064093 | 0.067421 | 0.047787 | 0.057411 |
| 3 | 0.058764 | 0.092075 | 0.029584 | 0.026467 |
| 4 | 0.039715 | 0.028995 | 0.048416 | 0.049109 |
| 5 | 0.038042 | 0.027150 | 0.048119 | 0.047833 |
| 6 | 0.039715 | 0.028995 | 0.048416 | 0.049109 |
| 7 | 0.054079 | 0.083444 | 0.027607 | 0.024561 |
| 8 | 0.045014 | 0.065687 | 0.024190 | 0.021956 |
| 9 | 0.035424 | 0.024940 | 0.045173 | 0.047016 |
| 10 | 0.031251 | 0.019238 | 0.043081 | 0.044623 |
| 11 | 0.035424 | 0.02494 | 0.045173 | 0.047016 |
| 12 | 0.030384 | 0.018038 | 0.042713 | 0.044343 |
| 13 | 0.031251 | 0.019238 | 0.043081 | 0.044623 |
| 14 | 0.039715 | 0.028995 | 0.048416 | 0.049109 |
| 15 | 0.031455 | 0.018063 | 0.045325 | 0.044642 |
| 16 | 0.037731 | 0.027033 | 0.047511 | 0.047744 |
| 17 | 0.040026 | 0.029112 | 0.049024 | 0.049198 |
| 18 | 0.036608 | 0.025387 | 0.047494 | 0.047356 |
| 19 | 0.040026 | 0.029112 | 0.049024 | 0.049198 |
| 20 | 0.040026 | 0.029112 | 0.049024 | 0.049198 |
| 21 | 0.038042 | 0.027150 | 0.048119 | 0.047833 |
| 22 | 0.036608 | 0.025387 | 0.047494 | 0.047356 |
| 23 | 0.052601 | 0.089148 | 0.024929 | 0.020871 |
| 24 | 0.049563 | 0.087728 | 0.022344 | 0.018201 |
Table 7.
Pareto optimal results.
| Point | Plan | Transmission Candidates | Generation Candidates | Pipeline Candidates |
|---|---|---|---|---|
| 1 | 3 | F-H, B-C | Q, B2 | A-B1, A-D |
| 23 | F-H, B-C | Q, B2 | E-D, A-B1 | |
| 24 | F-H, B-C | Q, B2 | G-J, A-B1 | |
| 2 | 2 | F-H | I, S | A-B1 |
| 3 | 4 | F-H | C, S, B2 | A-B1 |
| 5 | F-H, B-C | C, R, B2 | A-B1 | |
| 6 | F-H, B-C | C, S, B2 | A-B1 | |
| 14 | F-H | S, B2 | A-B1 | |
| 17 | F-H | F, S, B2 | A-B1 | |
| 19 | F-H, B-C | F, S, B2 | A-B1 | |
| 20 | F-H, N-D | F, S, B2 | A-B1 | |
| 21 | F-H, N-C | F, S, B2 | A-B1 |
© 2018 by the authors. Licensee MDPI, Basel, Switzerland. This article is an open access article distributed under the terms and conditions of the Creative Commons Attribution (CC BY) license (http://creativecommons.org/licenses/by/4.0/).
Share and Cite
MDPI and ACS Style
Khaligh, V.; Oloomi Buygi, M.; Anvari-Moghaddam, A.; M. Guerrero, J. A Multi-Attribute Expansion Planning Model for Integrated Gas–Electricity System. Energies 2018, 11, 2573. https://doi.org/10.3390/en11102573
AMA Style
Khaligh V, Oloomi Buygi M, Anvari-Moghaddam A, M. Guerrero J. A Multi-Attribute Expansion Planning Model for Integrated Gas–Electricity System. Energies. 2018; 11(10):2573. https://doi.org/10.3390/en11102573
Chicago/Turabian StyleKhaligh, Vahid, Majid Oloomi Buygi, Amjad Anvari-Moghaddam, and Josep M. Guerrero. 2018. "A Multi-Attribute Expansion Planning Model for Integrated Gas–Electricity System" Energies 11, no. 10: 2573. https://doi.org/10.3390/en11102573
Note that from the first issue of 2016, this journal uses article numbers instead of page numbers. See further details here.