A Novel Approach to Investigating Transport of Lost Circulation Materials in Rough Fracture


1
State Key Laboratory of Oil and Gas Reservoir Geology and Exploitation, Southwest Petroleum University, Chengdu 610500, China
2
Department of Petroleum Engineering, University of Louisiana at Lafayette, Lafayette, LA 70504, USA
*
Author to whom correspondence should be addressed.
Energies 2018, 11(10), 2572; https://doi.org/10.3390/en11102572
Submission received: 2 August 2018
/
Revised: 25 September 2018
/
Accepted: 25 September 2018
/
Published: 27 September 2018
(This article belongs to the Section L: Energy Sources)
Abstract
:The drilling fluid loss or lost circulation via fractures is one of the critical engineering problems in the development of deep oil and gas resources. The conventional treatment is to introduce granular lost circulation material (LCM) into the drilling fluid system to plug fractures. In this work, a method incorporating the fracture surface scanning technique and coupled Computational Fluid Dynamics-Discrete Element Method (CFD-DEM) numerical simulation is proposed for the first time to investigate how the LCM particles plug rough fractures. The rough fracture model is built utilizing a high resolution and high precision measurement system. The LCM particle transport and plugging process in rough fractures are captured in the CFD-DEM numerical simulations. The results show that the local fracture aperture has a significant influence on LCM particle transport and the distribution of the plugging zone. The drilling fluid loss rate will decrease, and the drilling fluid pressure will redistribute during the accumulation of LCM particles in the fracture. The fracture plugging efficiency of nonspherical LCM is improved as a result of formation of multi-particle bridges. This study provides a novel approach and important theoretical guidance to the investigation of LCM particle transport in rough fractures.
1. Introduction
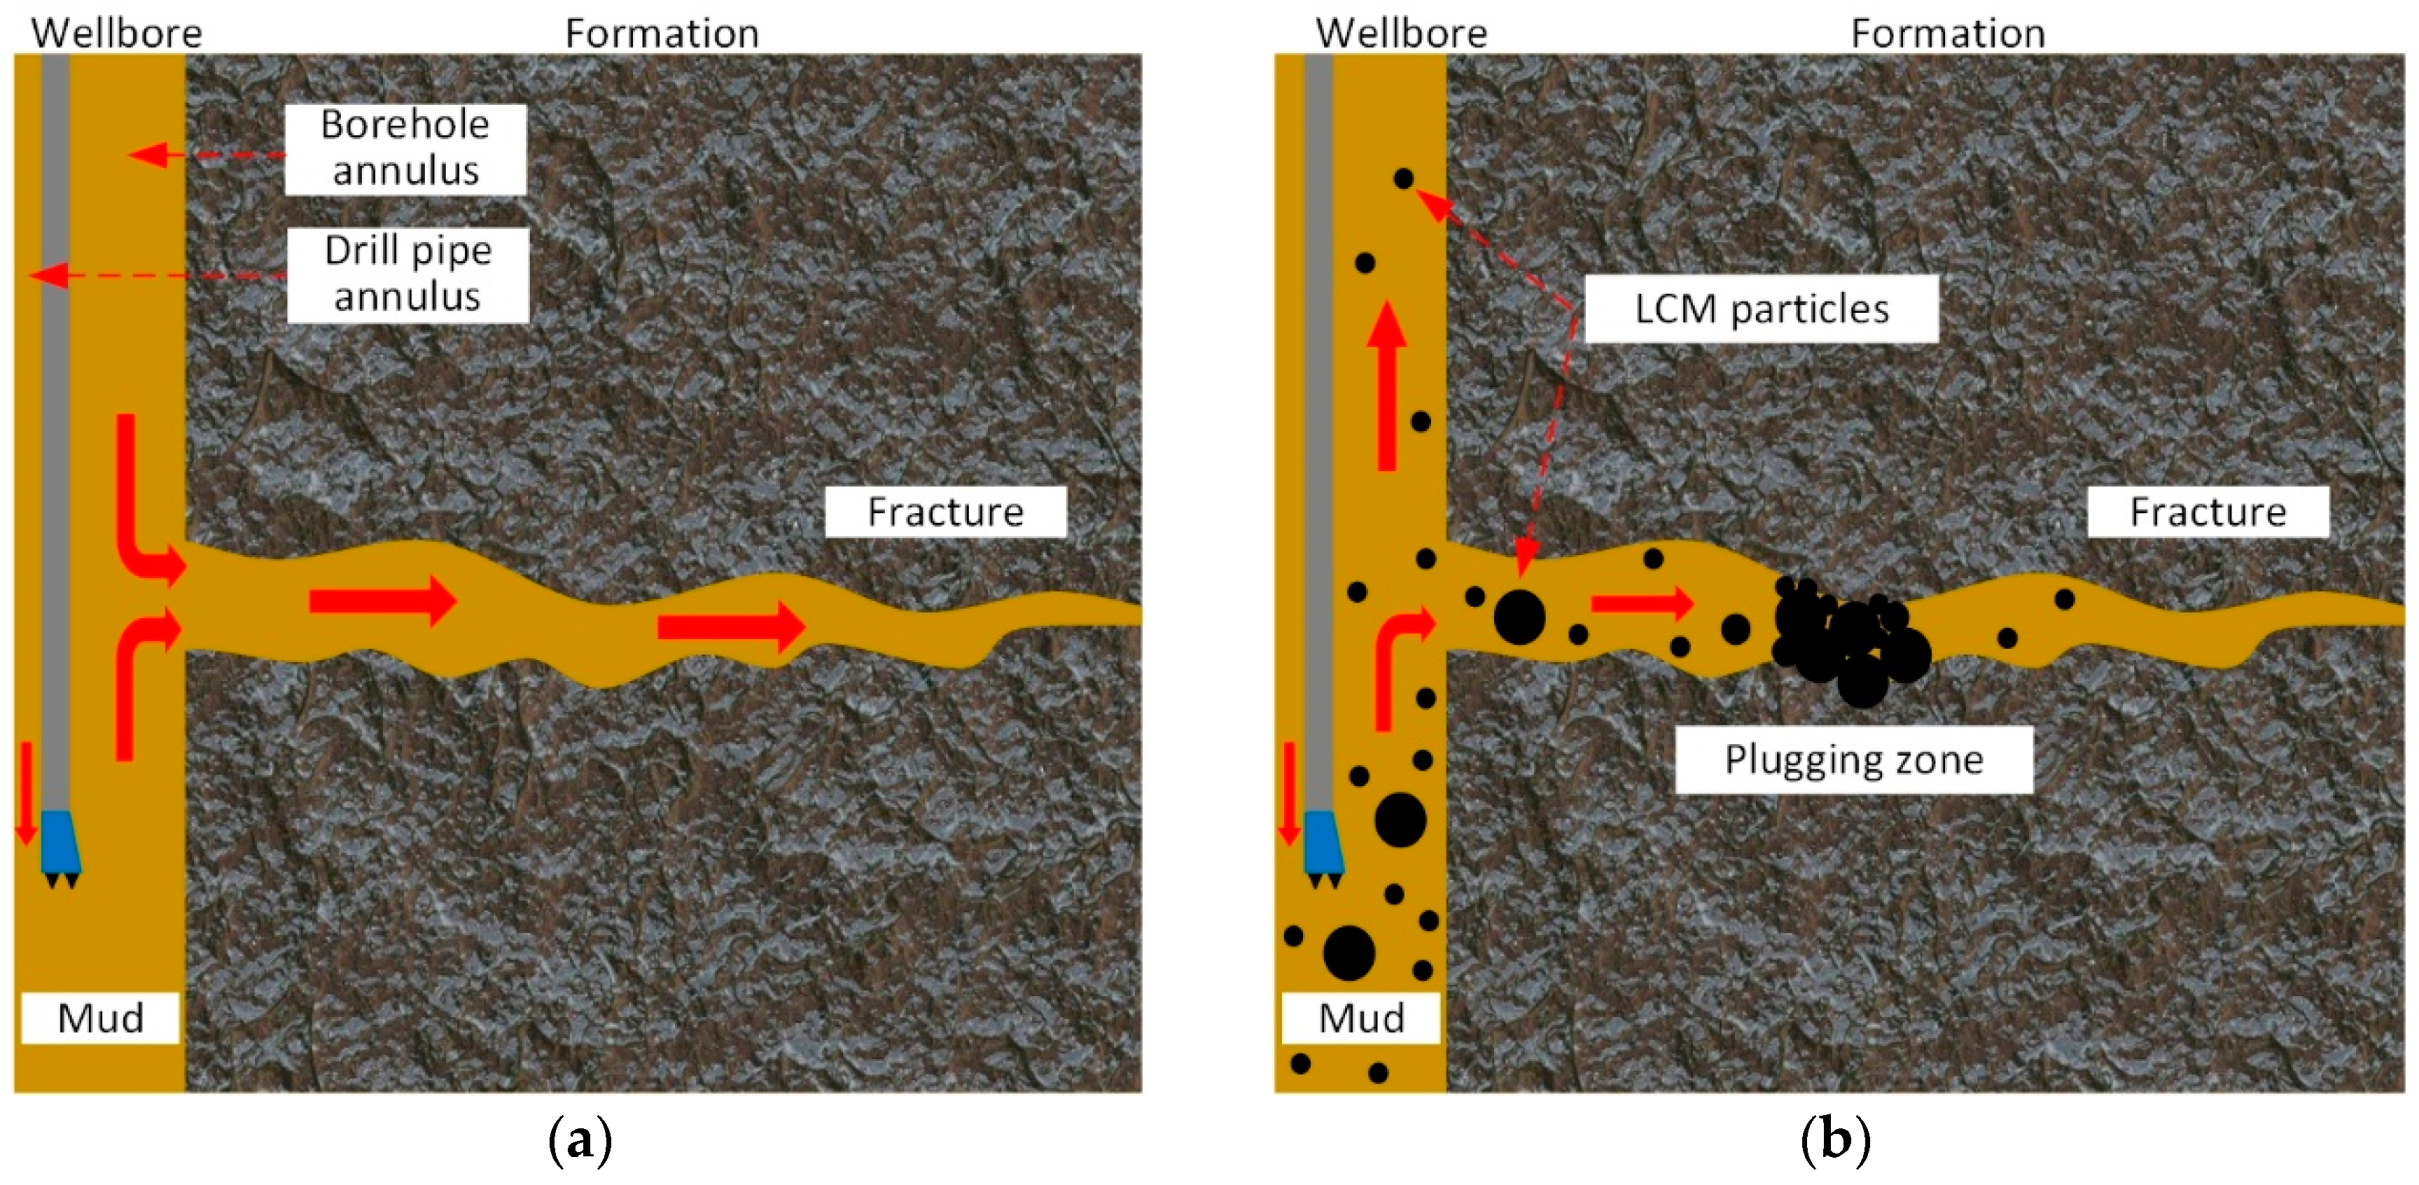
For the further exploitation of deep underground natural energy, such as geothermal energy and natural gas, massive drillings have been conducted. The drilling fluid is pumped into the well through the drill pipe and then returned to the ground through the borehole annulus. The drilling fluid balances the pressure between the borehole and the formation and cleans the borehole. Drilling fluid loss or lost circulation via fracture is a critical problem in drilling (Figure 1a), as it increases non-productive drilling time and risks, which leads to additional problems such as reservoir damage [1]. In the Gulf of Mexico, the lost circulation problem has given rise to an expenditure of an additional 1 billion dollars each year, and 10–20% of the total cost of drilling high-temperature and high-pressure wells has been expended on drilling fluid losses according to the U.S. Department of Energy [2]. The most common treatment for this problem is to introduce granular lost circulation material (LCM) into the drilling fluid system to plug fractures. The LCM carried by drilling fluid flows into fractures under the pressure difference, and subsequently plug the fracture and reduce the drilling fluid loss rate to an acceptable level (Figure 1b). Therefore, it is especially important to, based on an in-depth understanding of how the LCM plug the fracture, design and select an effective LCM formula to save drilling cost and improve drilling safety.
In the past, many theories and concepts have been proposed with respect to how LCM reduces the drilling fluid loss and fracture extension, including Stress Cage [3], Fracture Closure Stress [4], Fracture Propagation Resistance [5], and so on [6]. The theory of multi-particle bridging [7] and ideal packing theory [8] have also been utilized to design LCM formulas. The above theoretical models and the experiences gained from experiments provide some bases for plugging operations in the field. For instance, the average mechanical fracture aperture has already been widely adopted to determine the LCM particle size distribution (PSD). However, an understanding of LCM plugging behavior, especially the interaction between individual LCM particle and fracture walls, is still limited.
While it is difficult to research the LCM plugging process at the particle scale with existing experimental techniques [9], the numerical simulation of coupled computational fluid dynamics and discrete element method (CFD-DEM) provides an effective way to perform such a study. The CFD-DEM was first proposed by Tsuji et al. [10] for the simulation of a fluidized bed. This method can handle three different kinds of interactions, including fluid and particles, individual particles and other particles, particles and solid walls at the same time. It has been already applied to the research of proppant transport [11,12,13,14], hole cleaning [15], and the formation damage induced by the invading of solid particles [16,17,18]. Wang and Pu [9] have already used this method to mimic the transport of LCM particles in a simplified zigzag plane fracture, which may differ from the situation that LCM particle transport in the rough fracture. On the other hand, the high-resolution and high-precision optical scanning technique has been well developed [19] and frequently utilized in the modeling of rock fracture surface morphology [20,21]. The above two techniques provide the possibility of studying the transport and plugging process of LCM particles in rough fractures.
The motivation of the present work is to present a novel approach to investigate the transport and plugging process of LCM particles in rough fractures. This work is the first to propose the idea of combining the fracture surface scanning technique and CFD-DEM numerical simulation. The process of establishing a rough fracture numerical model is described in detail utilizing the structured light measurement system. The CFDEM® coupling (version 3.8.0) [22], an open source code, is adopted to run a series of numerical simulations, so that the effects of LCM particle size, volume concentration, and shape on fracture plugging performance can be studied. The research shows a further understanding of the LCM particle plugging process in rough fractures, enabling further the design and selection of effective LCM formulas. The potential of CFD-DEM numerical simulation in fracture plugging research is disclosed, and further improvement of the current method is also discussed.
2. Methodology
2.1. Modeling of Rock Fracture Flow Space
The flow capacity of the fracture is highly correlated with its mechanical aperture. Therefore, it is very important to obtain the actual fracture aperture distribution. Many measurement methods, including CT reconstitution [23], thermosetting resin [24], passive ultrasonic travel-time tomography [25], and the optical scanning technique [20,21], have been employed in early research to determine fracture aperture distribution.
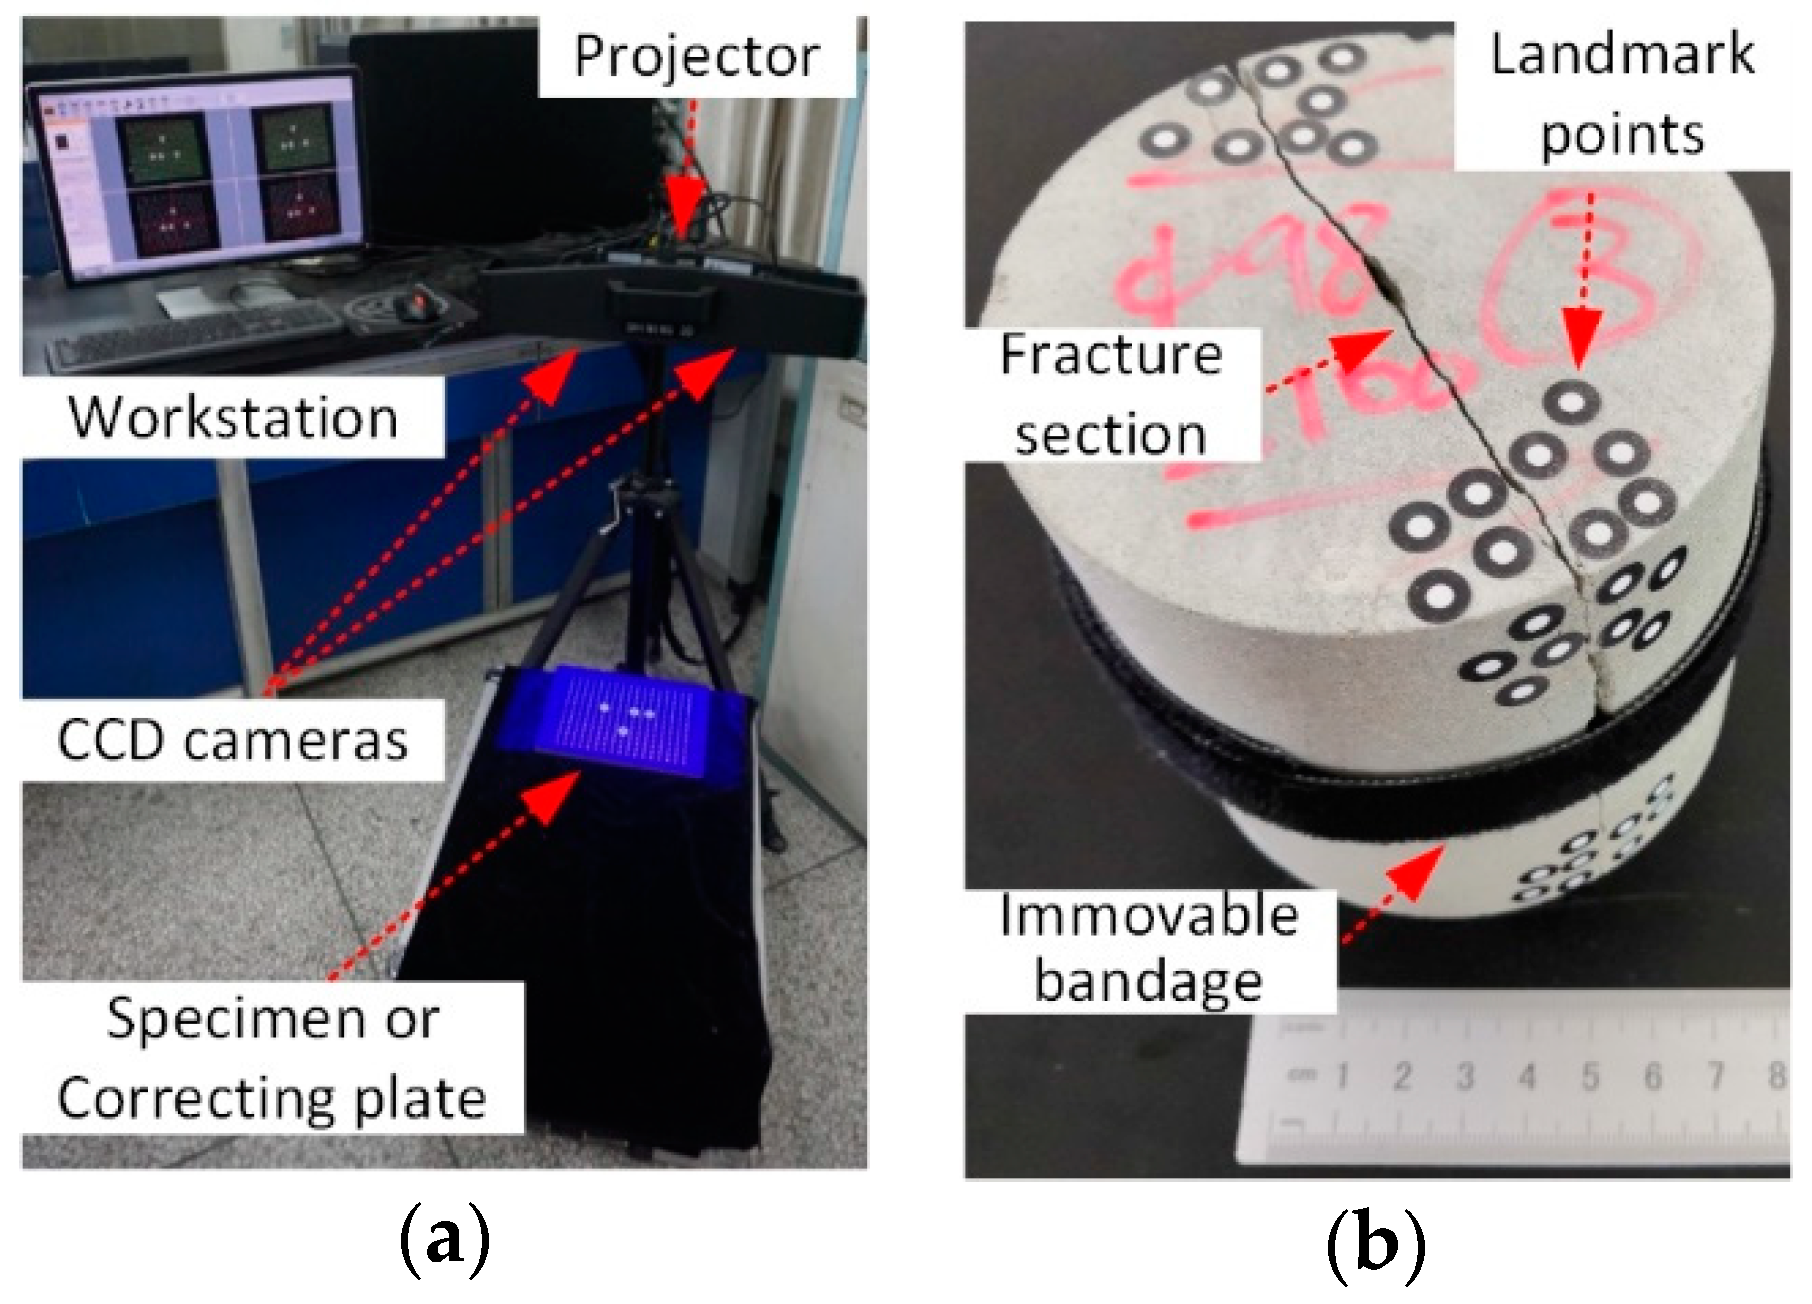
The 3D structured light measurement system, Eascan-D, was employed in this study. As shown in Figure 2a, the Eascan-D system, manufactured by SHINING 3D TECHNOLOGY, INC., mainly consists of a tripod and a sensor head containing a projector unit in the center and two charge-coupled device (CCD) cameras on the side. It also works with a high-performance workstation (dual 2.4 GHz Intel Xeon processors, 32 Gb ram) to pilot the system and process scanning data.
A cylinder rock core that is 100 mm in length and 98 mm in diameter was drilled from a tight sandstone outcrop collected from Sichuan, China. The tensile fracture was made by the Brazilian split experiment on the core, as shown in Figure 2b. Due to the rock plastic deformation and the fall-off of some rock pieces on the fracture surface during the Brazilian split experiment, the two fracture surfaces do not match perfectly. The gap between the two fracture surfaces is the fracture flow space through which the drilling fluid is lost.
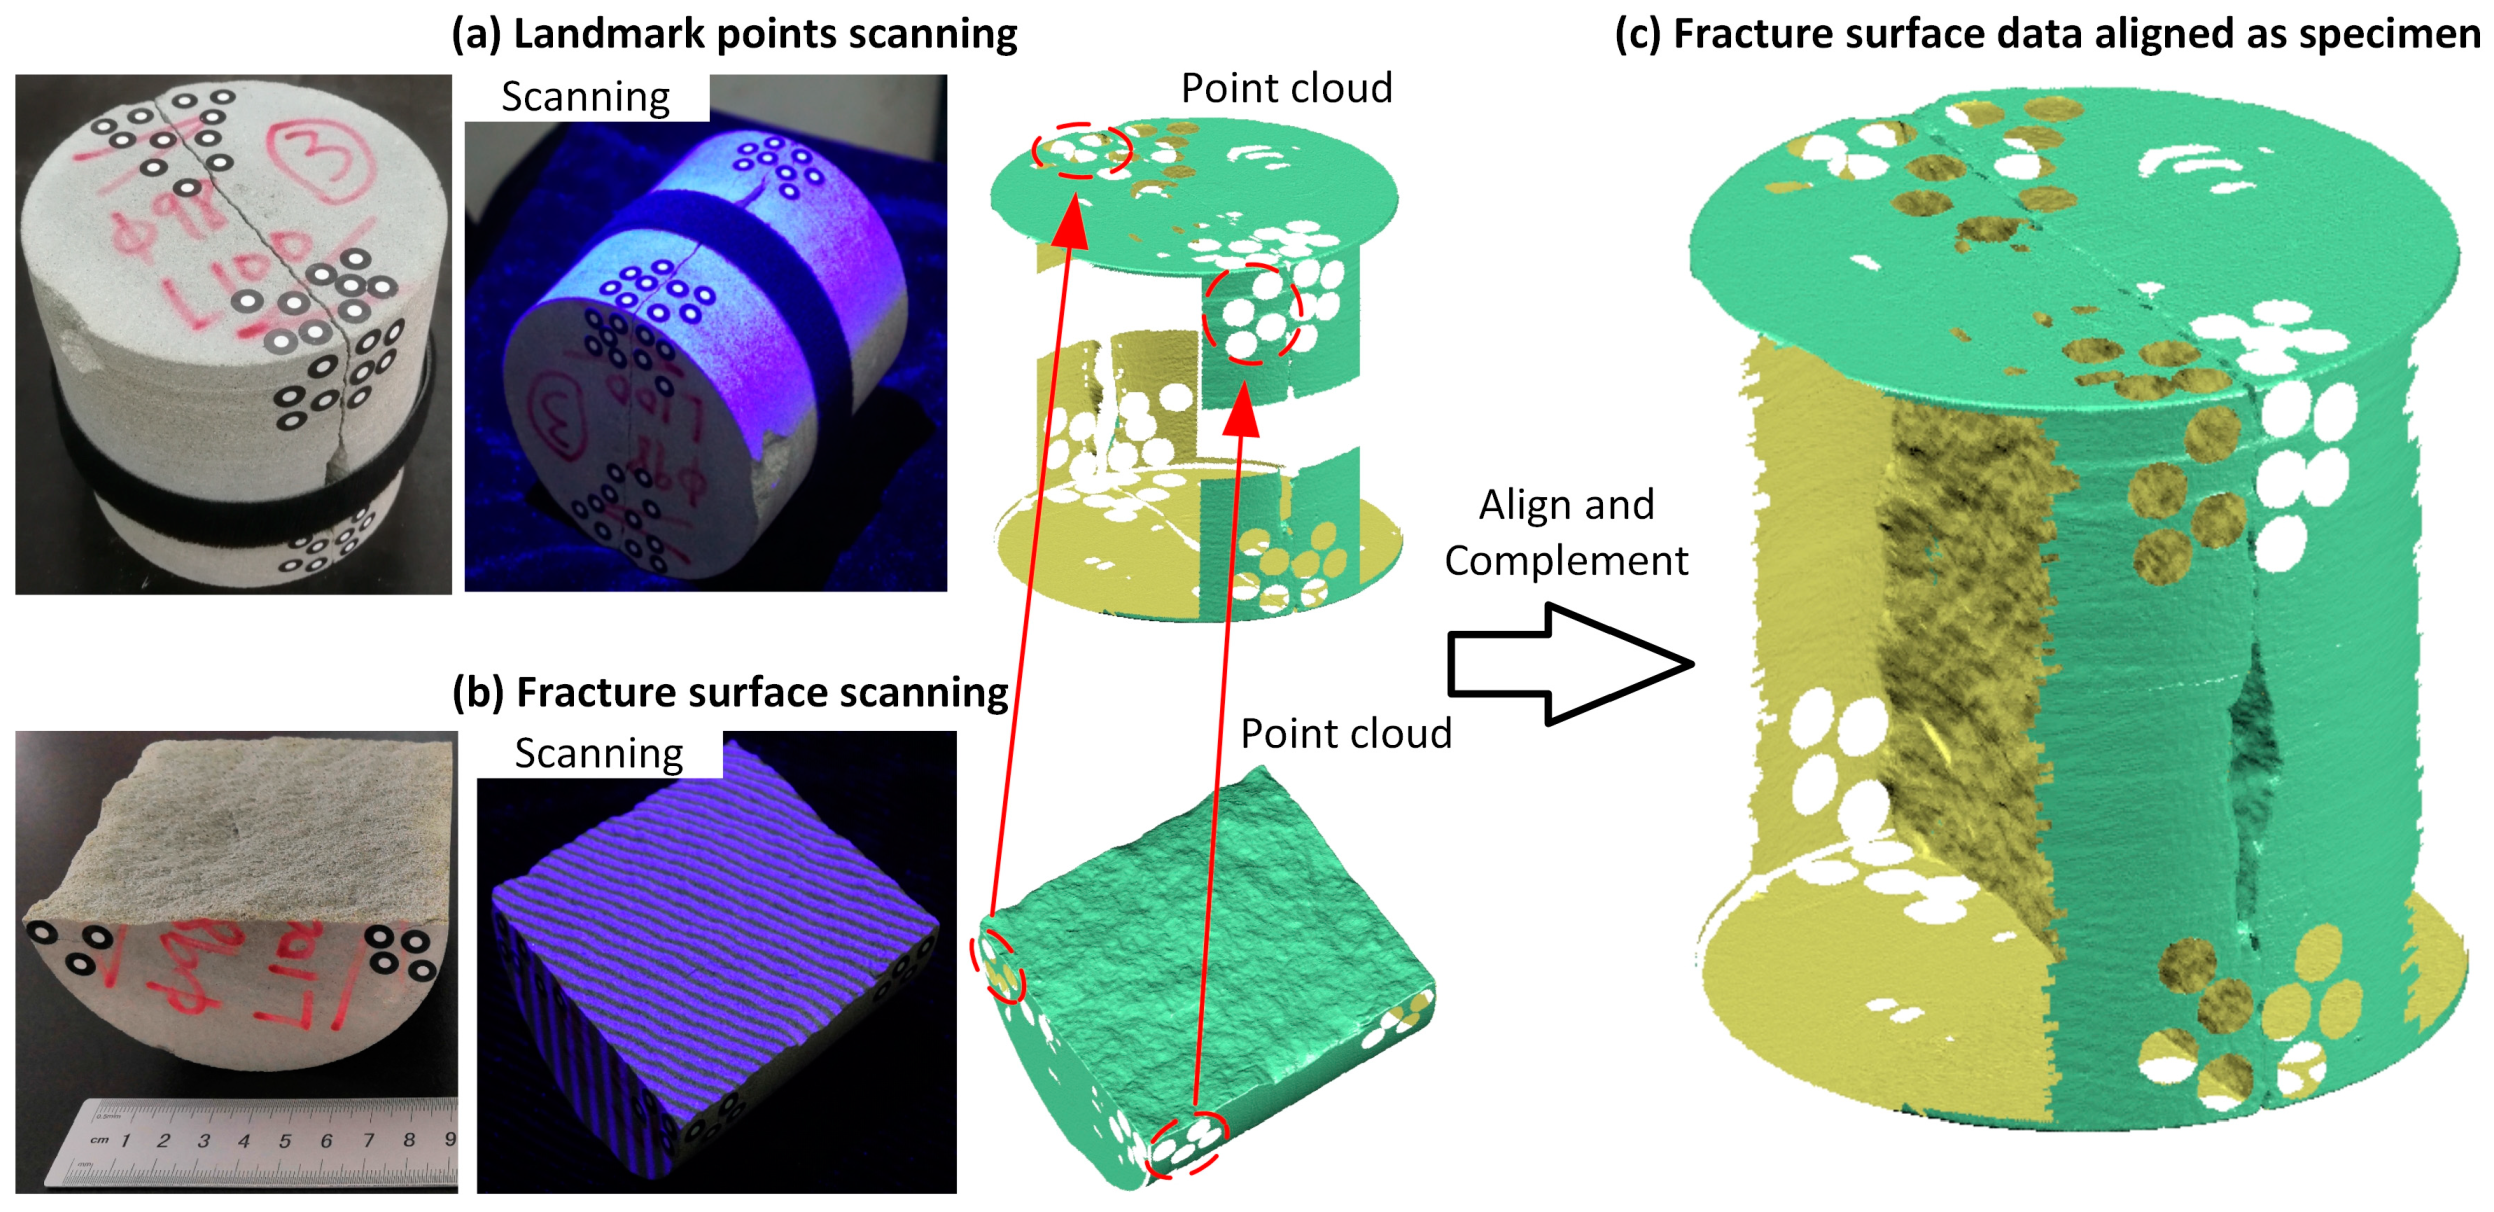
For digitizing the surface of the rock fracture, the measurement system projects a series of parallel blue-light fringe patterns onto the fracture surface (Figure 3b). Images of these blue-light fringe patterns will become distorted due to the irregularity of the fracture surface. At the same time, the width of each fringe will be changed continuously to transform the continuous surfaces to the discrete point cloud, which is the so-called light coding. These series of images are automatically captured by the two CCD cameras, and the software computes the 3D coordinates for each point based on the principle of triangulation. With a CCD camera resolution of 1280 × 1024 pixel, a point cloud of 1.3 million points can be obtained in a single measurement within 10 s.
Because each measurement is independent, the above procedures can only obtain the surface data of two sides of the fracture, respectively, as opposed to the rough fracture flow space. Artificial splicing of those surface data will cause a subjective error, which may diverge the situation. Another technique, landmark point location, was employed in this study to solve this problem.
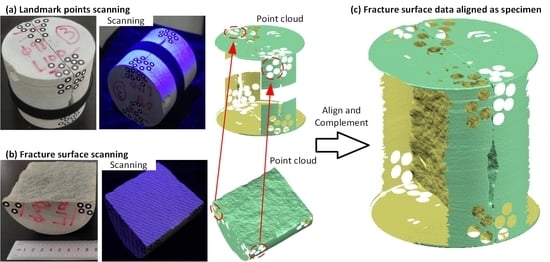
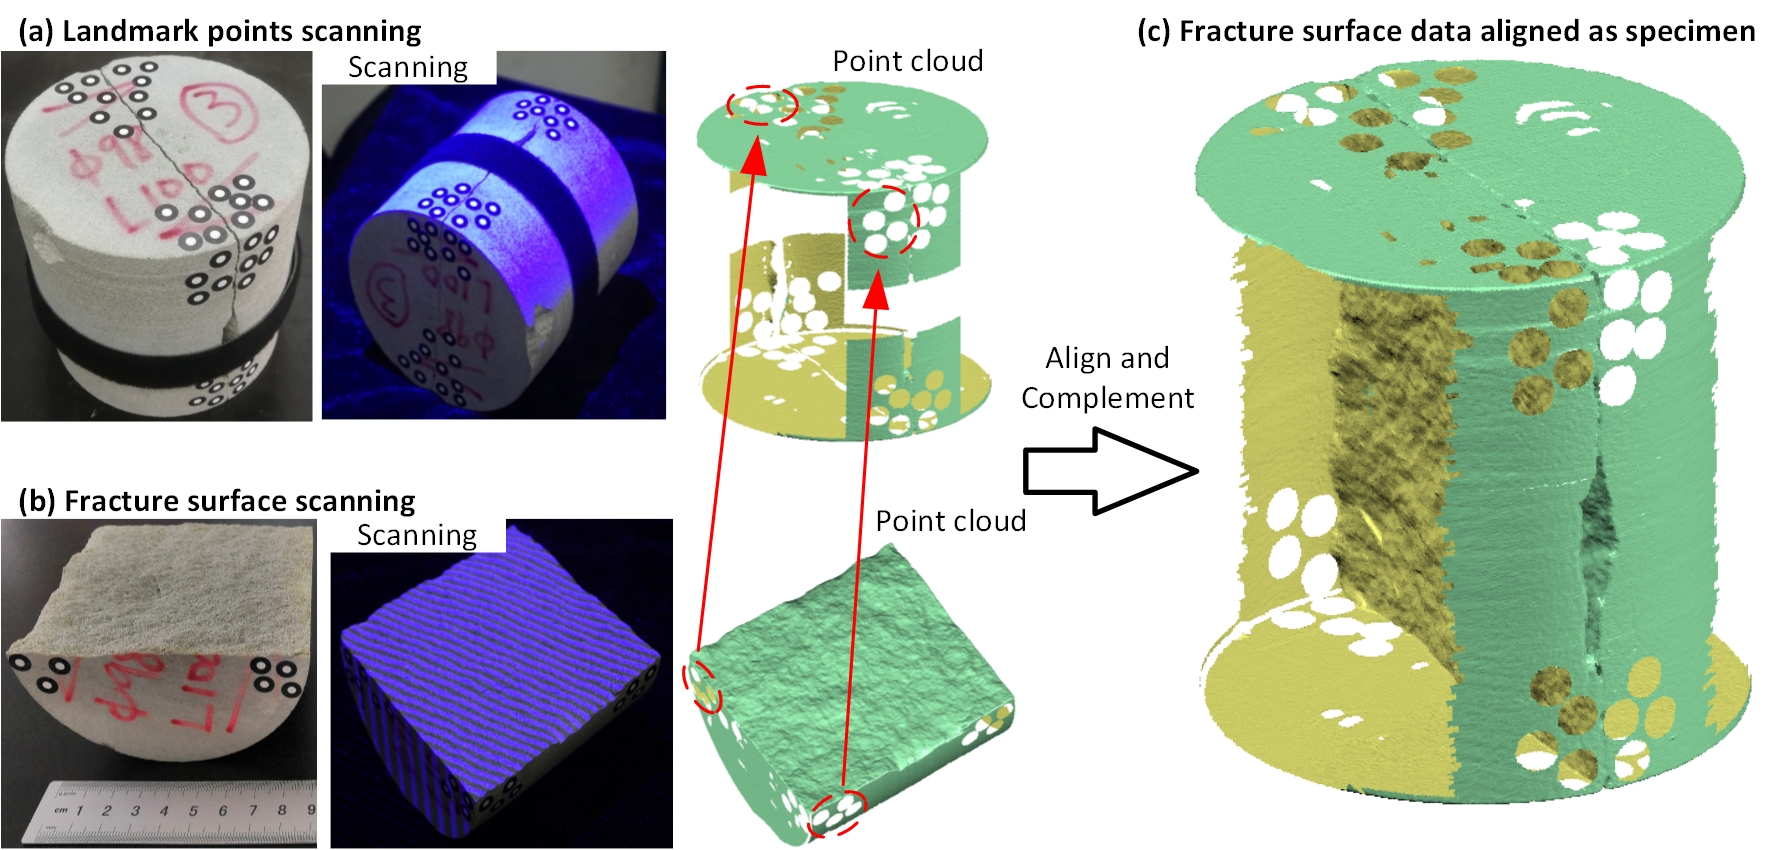
As shown in Figure 2b, the landmark points are placed around the fracture section. A pre-step of scanning the landmark points is carried out, and each landmark point is identified and numbered in the software (Figure 3a). This procedure builds a local coordinate system in the software, and the fracture surface is invisible during that time. In the following scanning of the fracture surface, the scanned landmark points are recognized, and the scanning data of fracture surface are not generated by the actual relative position between the measurement system and the scanning surface, but are redirected and aligned to pre-scanned landmark points. The scanning data of the fracture surface are completed after many scans at different perspectives of the specimen (Figure 3c). Even though the two sides of the fracture specimen are scanned separately, the usage of landmark points ensures that the relative location of the two sides of the fracture surfaces in the scanning data is consistent with the specimen at the pre-step of scanning the landmark points. Therefore, the fracture flow space in the scanning data is the same as that of the actual specimen.
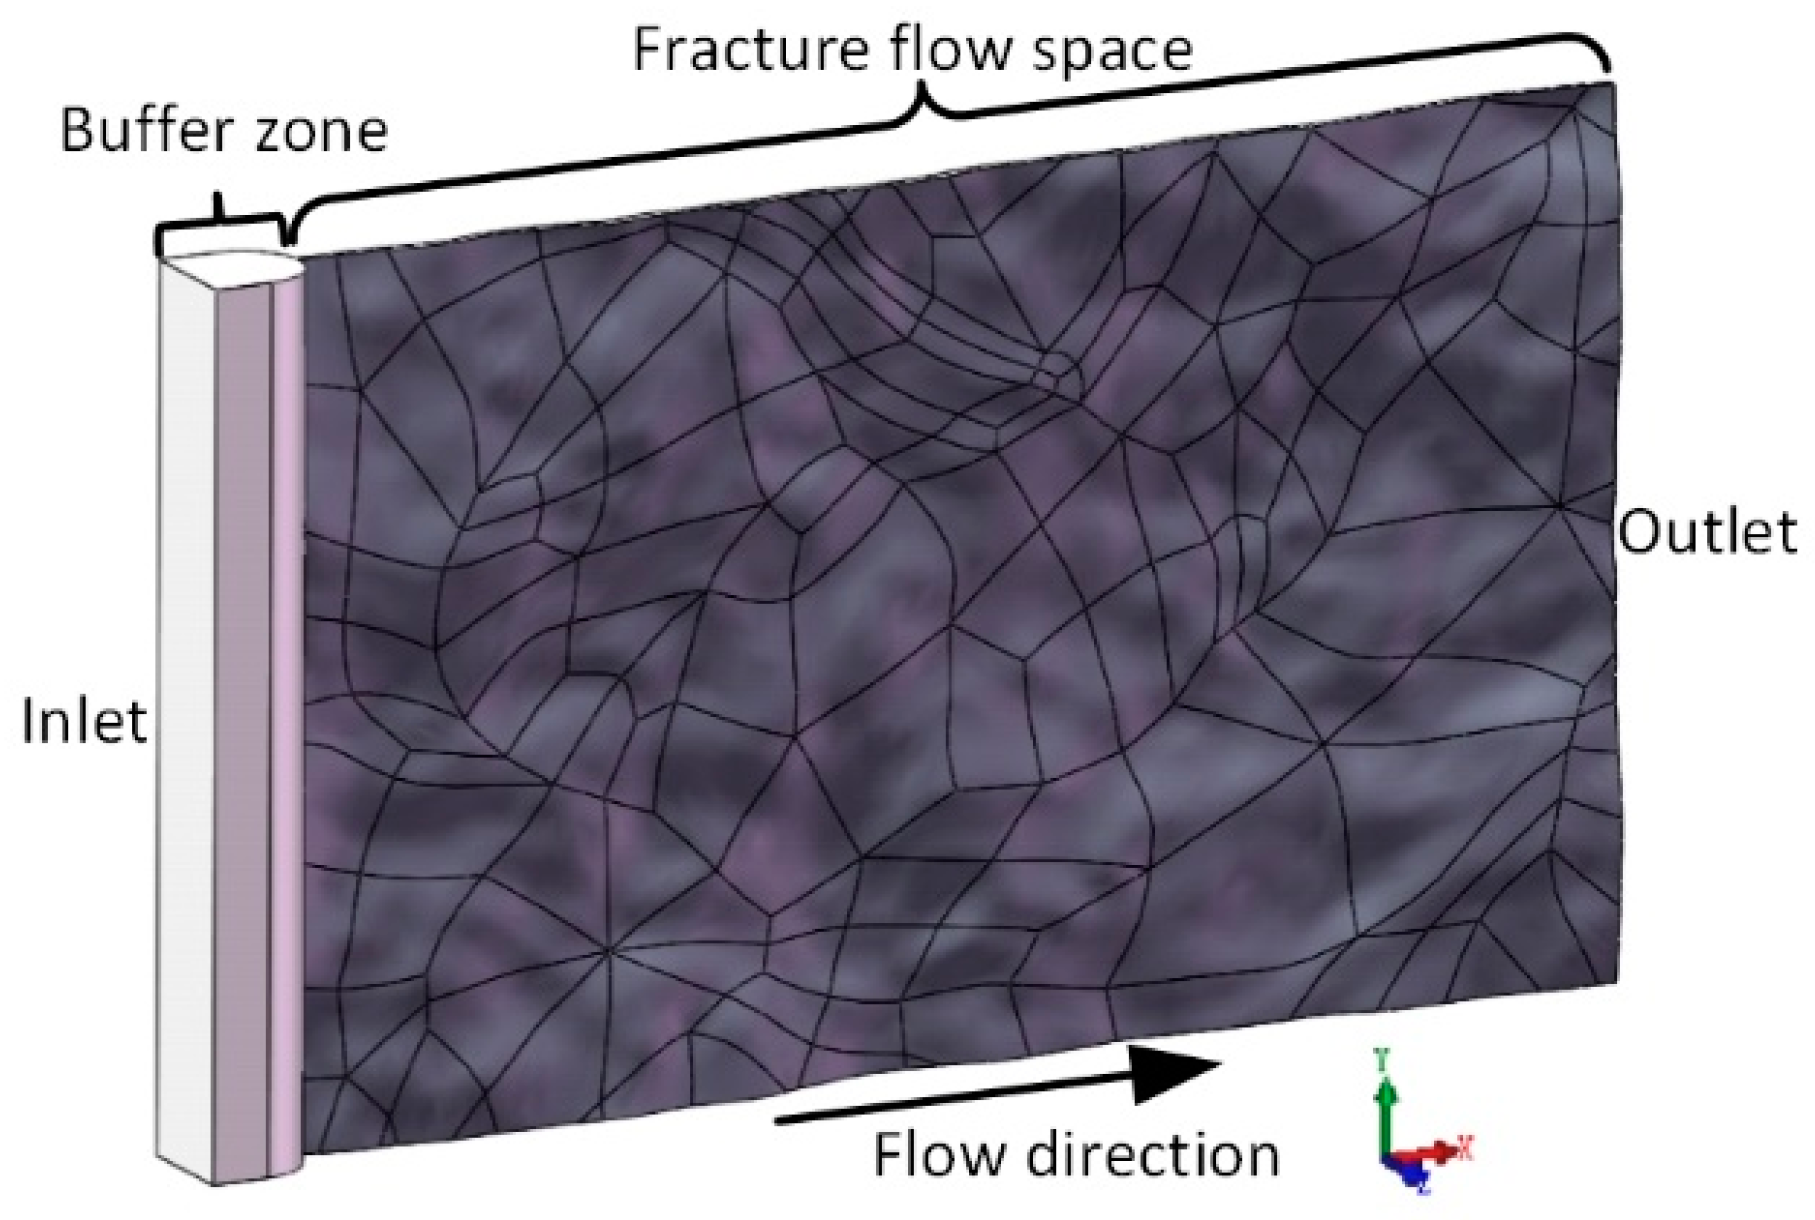
After the above scanning procedure, the point cloud of the fracture surface and some areas of the cylinder rock core are captured and stored as an ASCII file (format: x, y, z). By necessary data processing-by, for example, reducing the noise and cutting off data of the cylinder rock core surface and fracture edge, the fracture surface data is converted from a discrete point cloud to a continuous surface as non-uniform rational b-splines. After making up the rest of the four edge faces, the rock fracture flow space is established. For reducing the amount of computation, a sub-region of fracture that is 50 mm in height and 85 mm in length is extracted. To simulate the LCM transport from the wellbore into rock fracture, a buffer zone that is 5 mm in length, 50 mm in height, and 7 mm in width is assembled. The final geometric model is shown in Figure 4.
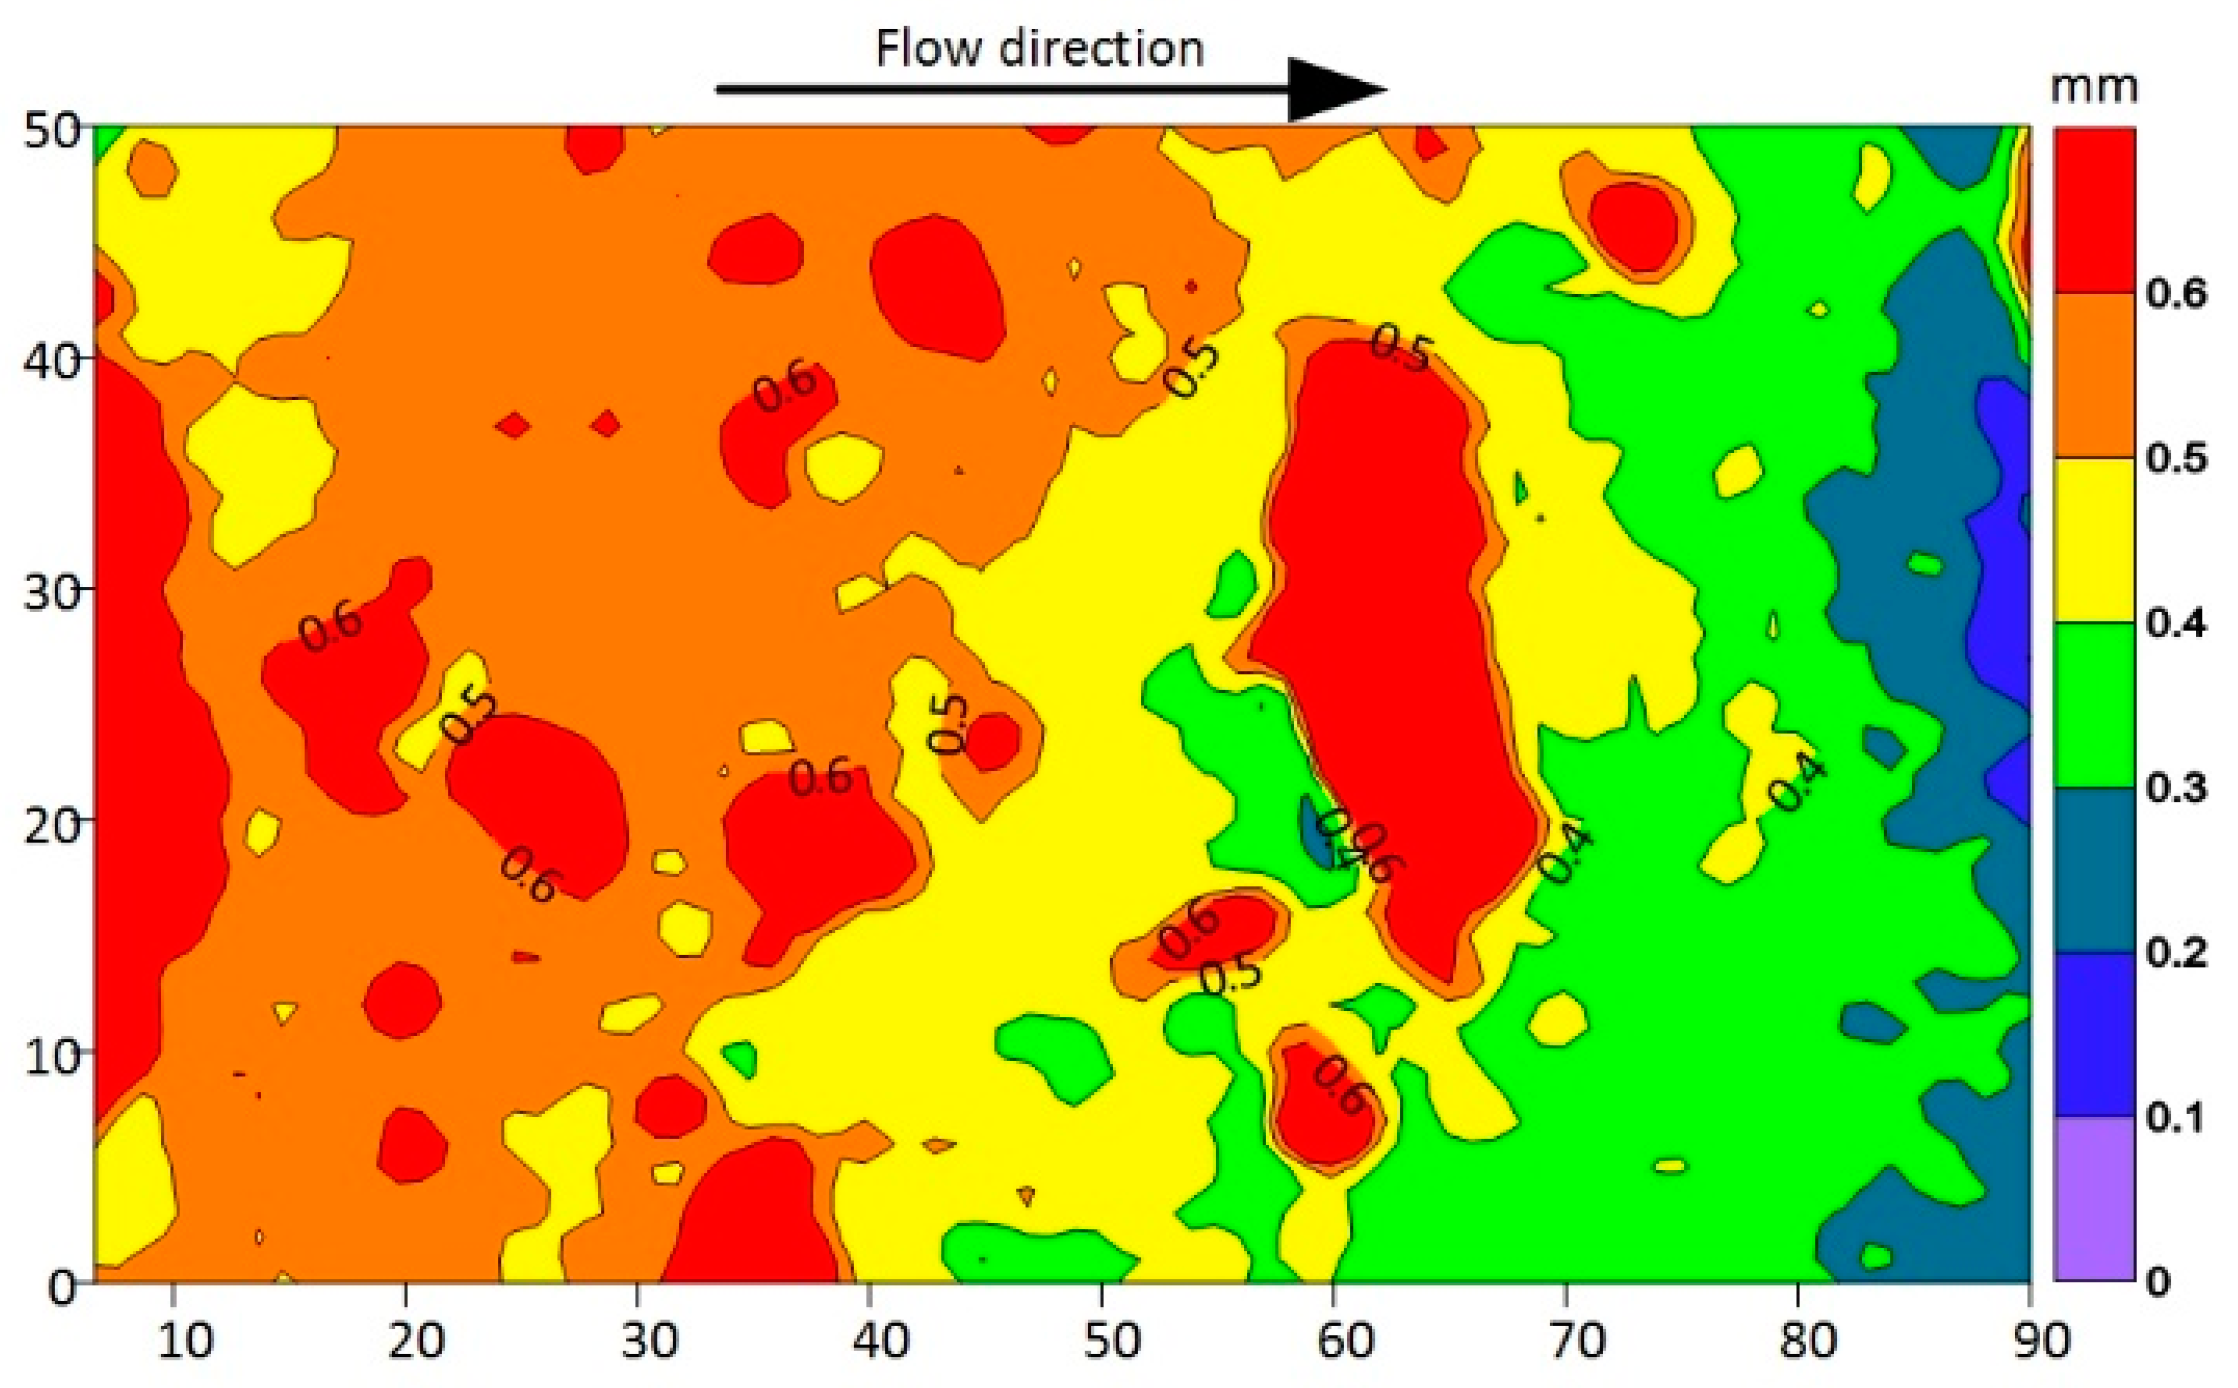
Numerical simulations are carried out in the following based on this geometric model, and its aperture distribution is shown in Figure 5. The average aperture of this fracture is 0.54 mm, counted by software.
The scanning precision of the scanning data and the spacing between these points are two of the most important performance parameters that represent the reliability and the richness of the detail in the measurement. Before the measurement, the system is properly calibrated through a set of standard procedures on the correcting plate. According to the calibration results, the scanning precision is 0.02 mm in this study, which is acceptable compared to the average 0.54 mm aperture of the rock fracture. Depending on the distance and angle between the measurement system and the scanning surface, the spacing between these points will vary in a small range. In this study, the typical spacing is 0.22 mm, which is appropriate considering the size of the fracture.
2.2. Basic Theory of CFD-DEM
The DEM was introduced by Cundall and Strack [26], which mathematically simplifies the rocks and soils into many individual rigid particles (discs in two dimensions and balls in three dimensions). All particles are tracked in a Lagrangian manner, and each particle’s trajectory is solved explicitly. Therefore, it has the inherent advantage in the study of LCM transport in the fracture, compared with the two-fluid model [27] in which the particle phase is regarded as another continuous fluid in a Euler manner, and the LCM plugging phenomenon cannot be well considered.
In DEM, the internal force and the deformation of particle shapes are ignored, allowing slight overlap while they are in contact. Generally, the motion of all particles will be deduced in the following steps: First, all particle contact pairs will be found, and the contact force can be calculated according to the overlap and relative motion of the pair of particles in contact, based on a contact theory such as the Hertz contact model. The translational and angular acceleration at that moment are then confirmed, considering that other forces also act on the particle by Newton’s second law. In a small time-step, such as 10−6 s, the forces acting on the particle will be treated as invariant, so the velocity, position, and trajectory of each particle after that time step can be figured out by integration. Repeating those above procedures, the system of particles will evolve continuously from one moment to the next step by step. Further details about the theory of DEM are available in the literature [28].
To be specific, the motion of each particle follows the force and torque balances as follows [29]:
where is the particle mass, is the particle velocity, is the time, is the particle moment of inertia, is the particle angular velocity, is the particle radius, is the particle normal contact force, is the particle tangential contact force, is the particle torque, is the drag force exerted from the fluid phase to the particles, and denote, respectively, the pressure and viscous force acting on the particles, and gravity and buoyancy are lumped into .
Other forces such as the Magnus force and virtual mass force are ignored in this study [30]. In this study, the Hertz contact model and constant directional torque (CDT) model [31] are adopted to represent the contact force and the small-scale nonsphericity of the LCM particles. The interaction between particles and walls is equivalent to the interaction between particles and an infinite radius particle. The formulas of particle torque, contact force, and other forces are available in the literature [26] and CFDEM® coupling online documentation.
For the modeling of the interaction between LCM particles and drilling fluid, a coupled CFD-DEM approach can be applied [10,28]. In this approach, the simulation domain is discretized into coarse fluid mesh cells to solve the motion of fluid phase whose length of mesh is several times larger than the particle diameter. Because the flow field around each particle cannot be described accurately, the drag force model has been introduced to approximately calculate the force exerted from the fluid phase to the particles, and the forces of the same magnitude but opposite direction are then added to the fluid equations as the momentum exchange, which is the so-called unresolved CFD-DEM [32]. The governing equation can be written as
where is the fluid density, is the volume fraction occupied by the fluid or porosity, is the fluid velocity, p is the fluid pressure, is the fluid viscosity, and is the average body force in one fluid mesh cell.
The Di Felice [33] drag force model is adopted in this study. This model has a large range of Reynolds numbers applicability and already been used in the modeling of fracture conductivity [34]. The drag force exerted from the fluid phase to the particles can be written as
where is the drag coefficient, is an empirical coefficient, and is the particle Reynolds number.
In this study, the open source package CFDEM® coupling (version 3.8.0) [22] is adopted in which the LIGGGHTS and OpenFOAM are integrated. In the CFDEM® coupling, the particle motion will be solved by LIGGGHTS. For solving the motion of the fluid, the “Pressure-Implicit Split-Operator” (PISO) solver in OpenFOAM is used. The CFDEM® coupling also provides other various drag models. Further details about the CFD-DEM coupling routine, the volume fraction calculation method, and the fluid–particle momentum exchange are available in the literature [29].
2.3. Numerical Model Overview
The drilling fluid will flow through the face of the buffer zone (inlet) to the end of the fracture (outlet). The fixed value condition of pressure is adopted. The inlet pressure is 82 KPa, and the outlet pressure is 0 Pa. Note that the fluid is considered incompressible. Therefore, the pressure at both ends of the fracture are not the actual value, and the pressure difference or pressure gradient is what we are concerned about because they determine the flow state. The magnitude of the pressure difference applied at both ends of the fracture is estimated based on a field drilling fluid loss data. The pressure gradient along the 85 mm length fracture would be 0.965 MPa/m.
In fact, drilling fluids usually contain many kinds of particles such as fine clay particles, drilling cuttings, weighting materials, and LCM. The size of those particles varies widely, and the LCM with a wide PSD is usually adopted in the drilling field to plug the fracture. The large LCM particles are used to form the bridge in the fracture, and smaller ones stack and accumulate around this bridge so that the fracture will be completely plugged.
However, the simulations in this study only adopted particles with one specified diameter in each case to mimic the transport and bridging of large LCM in the fracture. This is because the DEM calculation speed is directly related to the number and size of particles. The computational cost will increase rapidly to an unacceptable degree with the decrease in particle size and the increase in particle quantity. At the same time, most of the drag force models including the Di Felice [33] assume the particle system is monodisperse. It may reduce the accuracy of the simulation if particles of different diameters are introduced. This will be further discussed in the next section.
The LCM particles were injected into the inlet and blended with drilling fluid in the buffer zone at a specified constant volume concentration in each simulation case. They then, carried by the drilling fluid, flowed into the fracture. Some of them plugged the fracture, and others passed through the outlet.
Table 1 summarizes the property parameters of LCM particles and drilling fluid in the numerical simulations. The LCM particle diameter, volume concentration, and rolling friction coefficient are specified separately in each simulation case.
It is necessary to declare that the property parameters of LCM particles, including Young’s modulus, Poisson ratio, friction coefficient, and restitution coefficient, were not experimentally measured or calibrated with an actual LCM formula as Zhang et al. [34] did. The reason is that the motivation of this study is to disclose the potential of CFD-DEM numerical simulation in fracture plugging research, and, as literature has reported [10,12], there is no sufficient influence of those particle property parameters on particle transport in fluidized beds or fractures.
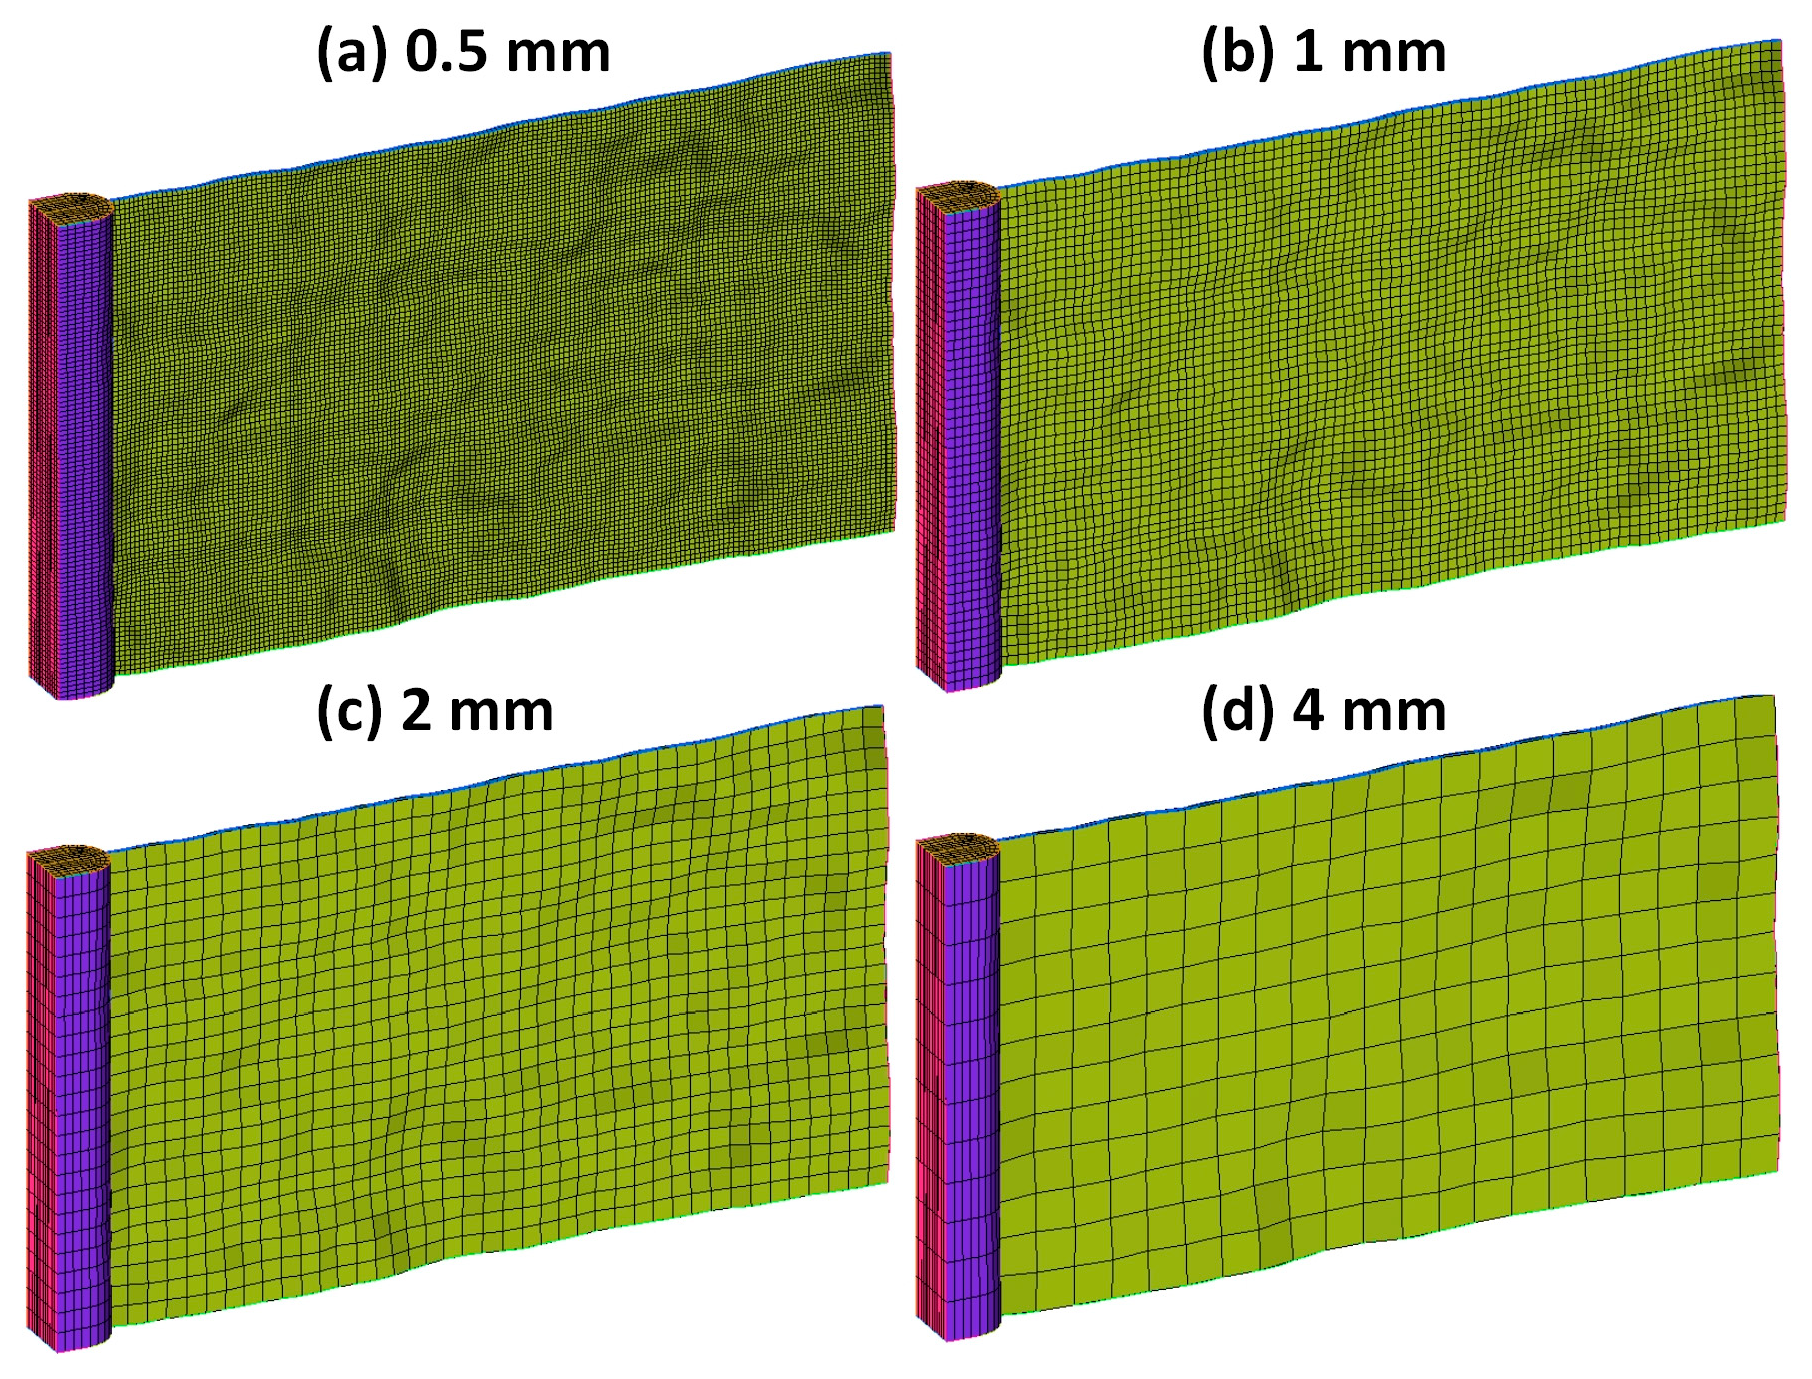
Before the formal numerical simulation research, a mesh resolution sensitivity check was completed. The porosity αf is the critical variable for solving both the fluid and particle motion, which is closely related to the relative size of fluid mesh cells and particle diameters.
Generally, the size of fluid mesh cells should be several times larger than the particle diameter to ensure the αf changes gently. However, oversized fluid mesh cells lose fracture surface and fluid field details (Figure 6). On the other hand, fluid mesh cells that are too small increase the amount of computation and cause αf to change rapidly into a small and incorrect value, which reduced the accuracy of the following calculations [34].
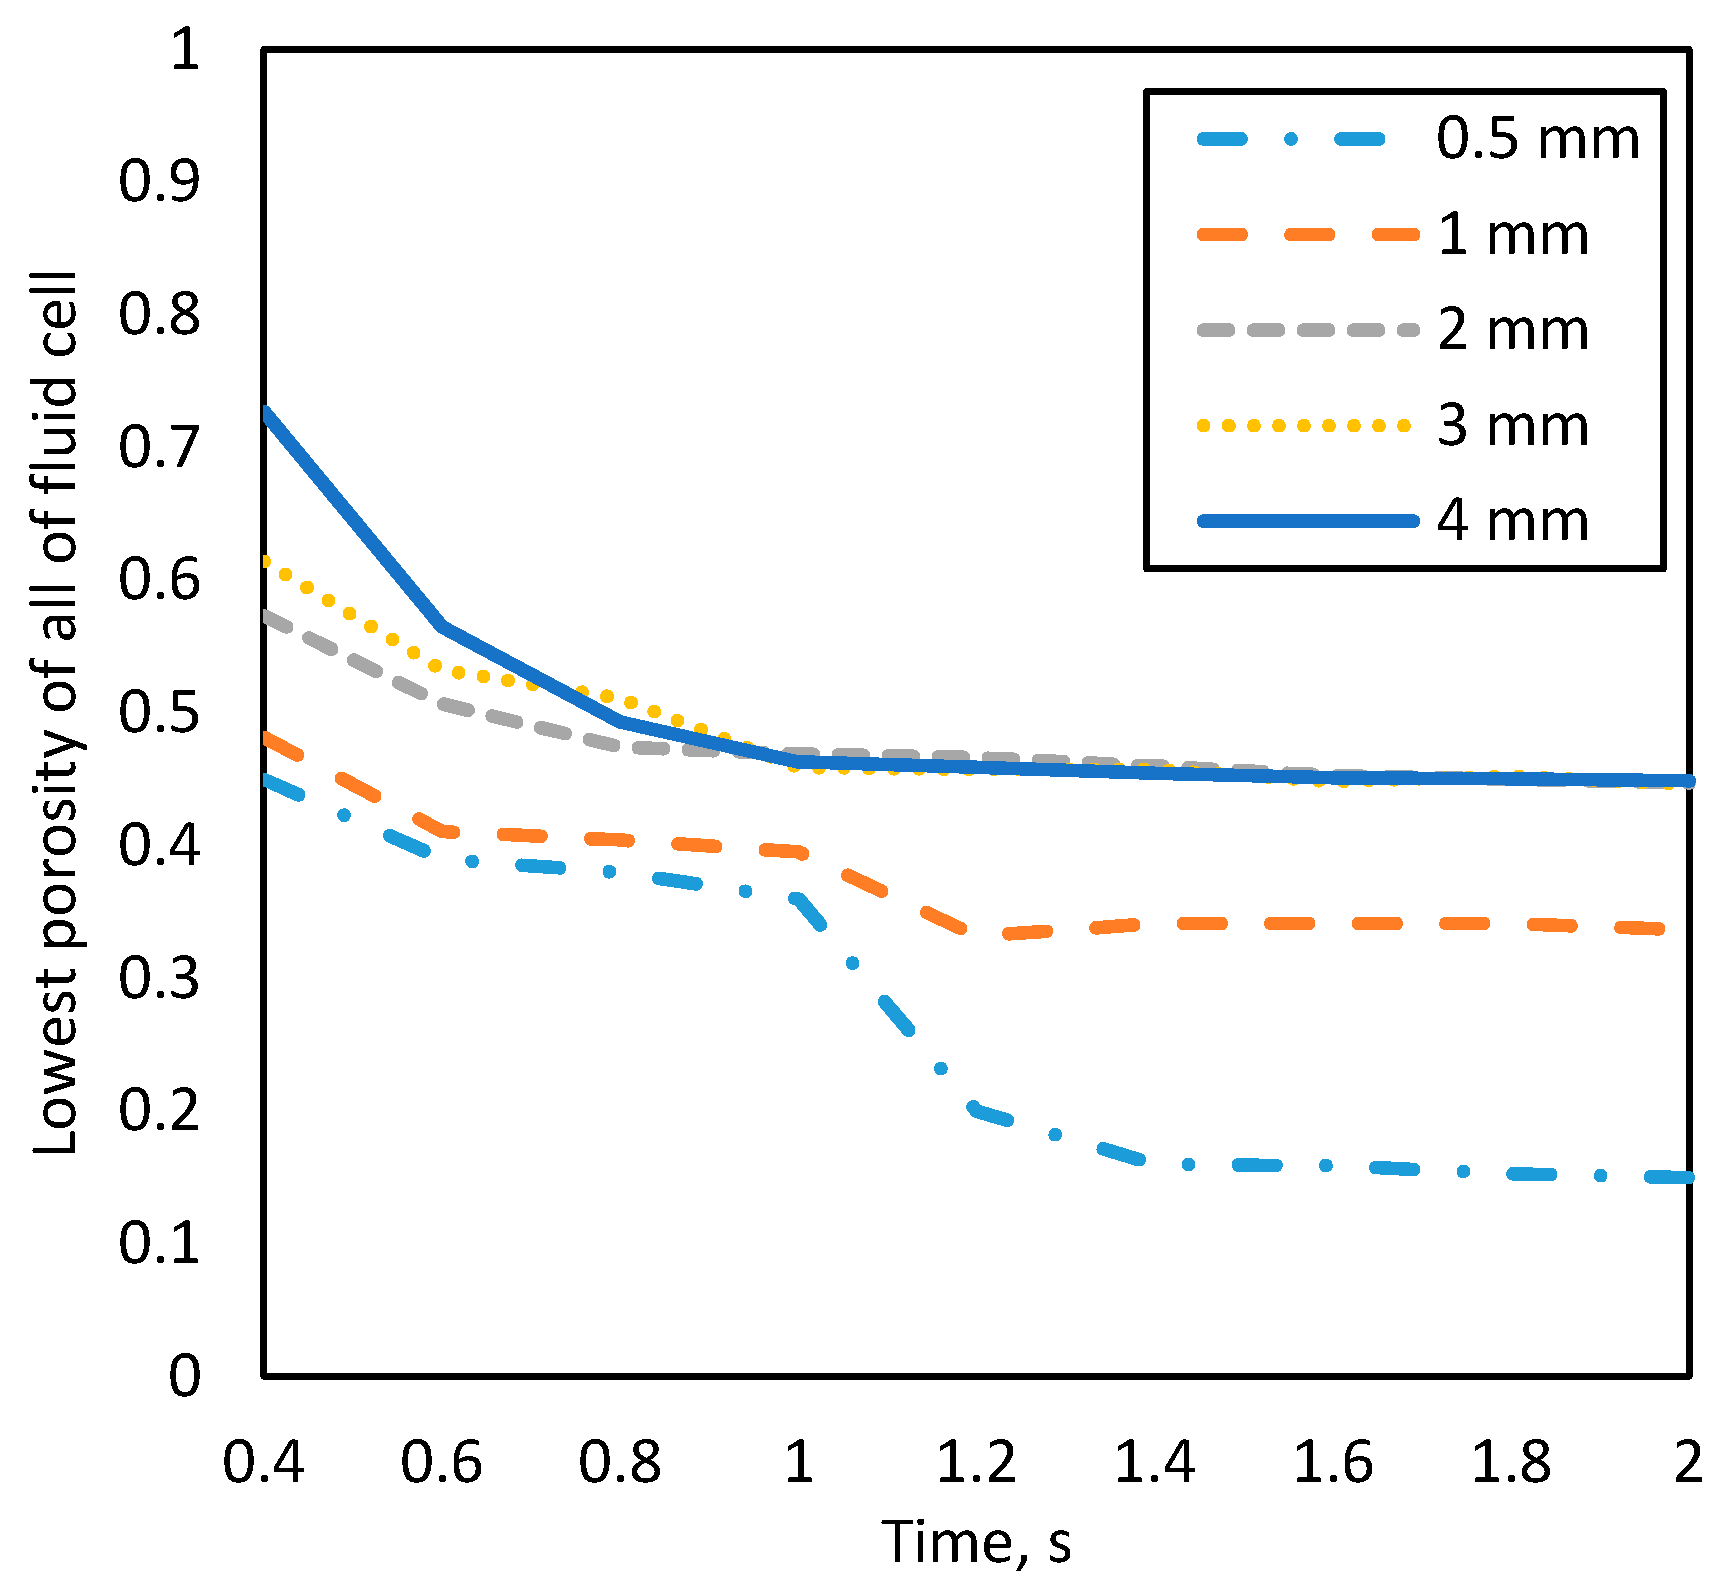
The maximum particle diameter used in the simulations of this study is 0.5 mm, so the mesh resolution sensitivity check was carried out with five different sizes of fluid mesh cells (0.5, 1, 2, 3, and 4 mm) with 0.5 mm diameter LCM particles at 5% volume concentration. The divided void fraction model was adopted to calculate the porosity, which divides each particle into 29 portions. This is more accurate than a general particle center void fraction model [22]. Each simulation ran for 2 s to investigate the porosity calculation.
The lowest porosity of all fluid mesh cells at different simulation moments is shown in Figure 7. It can be seen that the small incorrect value of porosity accrues at the 1 s point, when the size of fluid mesh cells drops down to 1 mm. Those values of porosity are even lower than the minimum packing porosity of the mono-sized sphere, which seems unreasonable, which means there is a lower limit of fluid mesh size. Therefore, the fluid mesh with the size of 2 mm was adopted in all of the following simulations, which best retains the details of the fracture surface without any computational error of porosity.
3. Results
For investigating the effect of LCM size, volume concentration, and shape, a series of simulations were carried out with four different LCM diameters (0.2, 0.3, 0.4, and 0.5 mm) and four different LCM volume concentrations (1%, 2%, 3%, and 4%).
In these simulations, only the standard Hertz contact model was adopted, ignoring the influence of particle shape. The time step of DEM calculation was set to 5 × 10⁻⁷ s according to the critical time step, and the time step of fluid motion calculation was set to 1 × 10⁻⁴ s to ensure that the maximum Courant number would not exceed 0.5. Therefore, the DEM solver and the PISO solver exchanged the data after every 200 DEM calculations such as porosity, velocity of fluid and each particles. All of the following simulation cases ran for 4 s of physical time of the LCM plugging process. The simulations were performed on the same workstation, and each simulation case took 2–3 days to finish.
3.1. LCM Particle Transport and Plugging Process in Rough Fractures
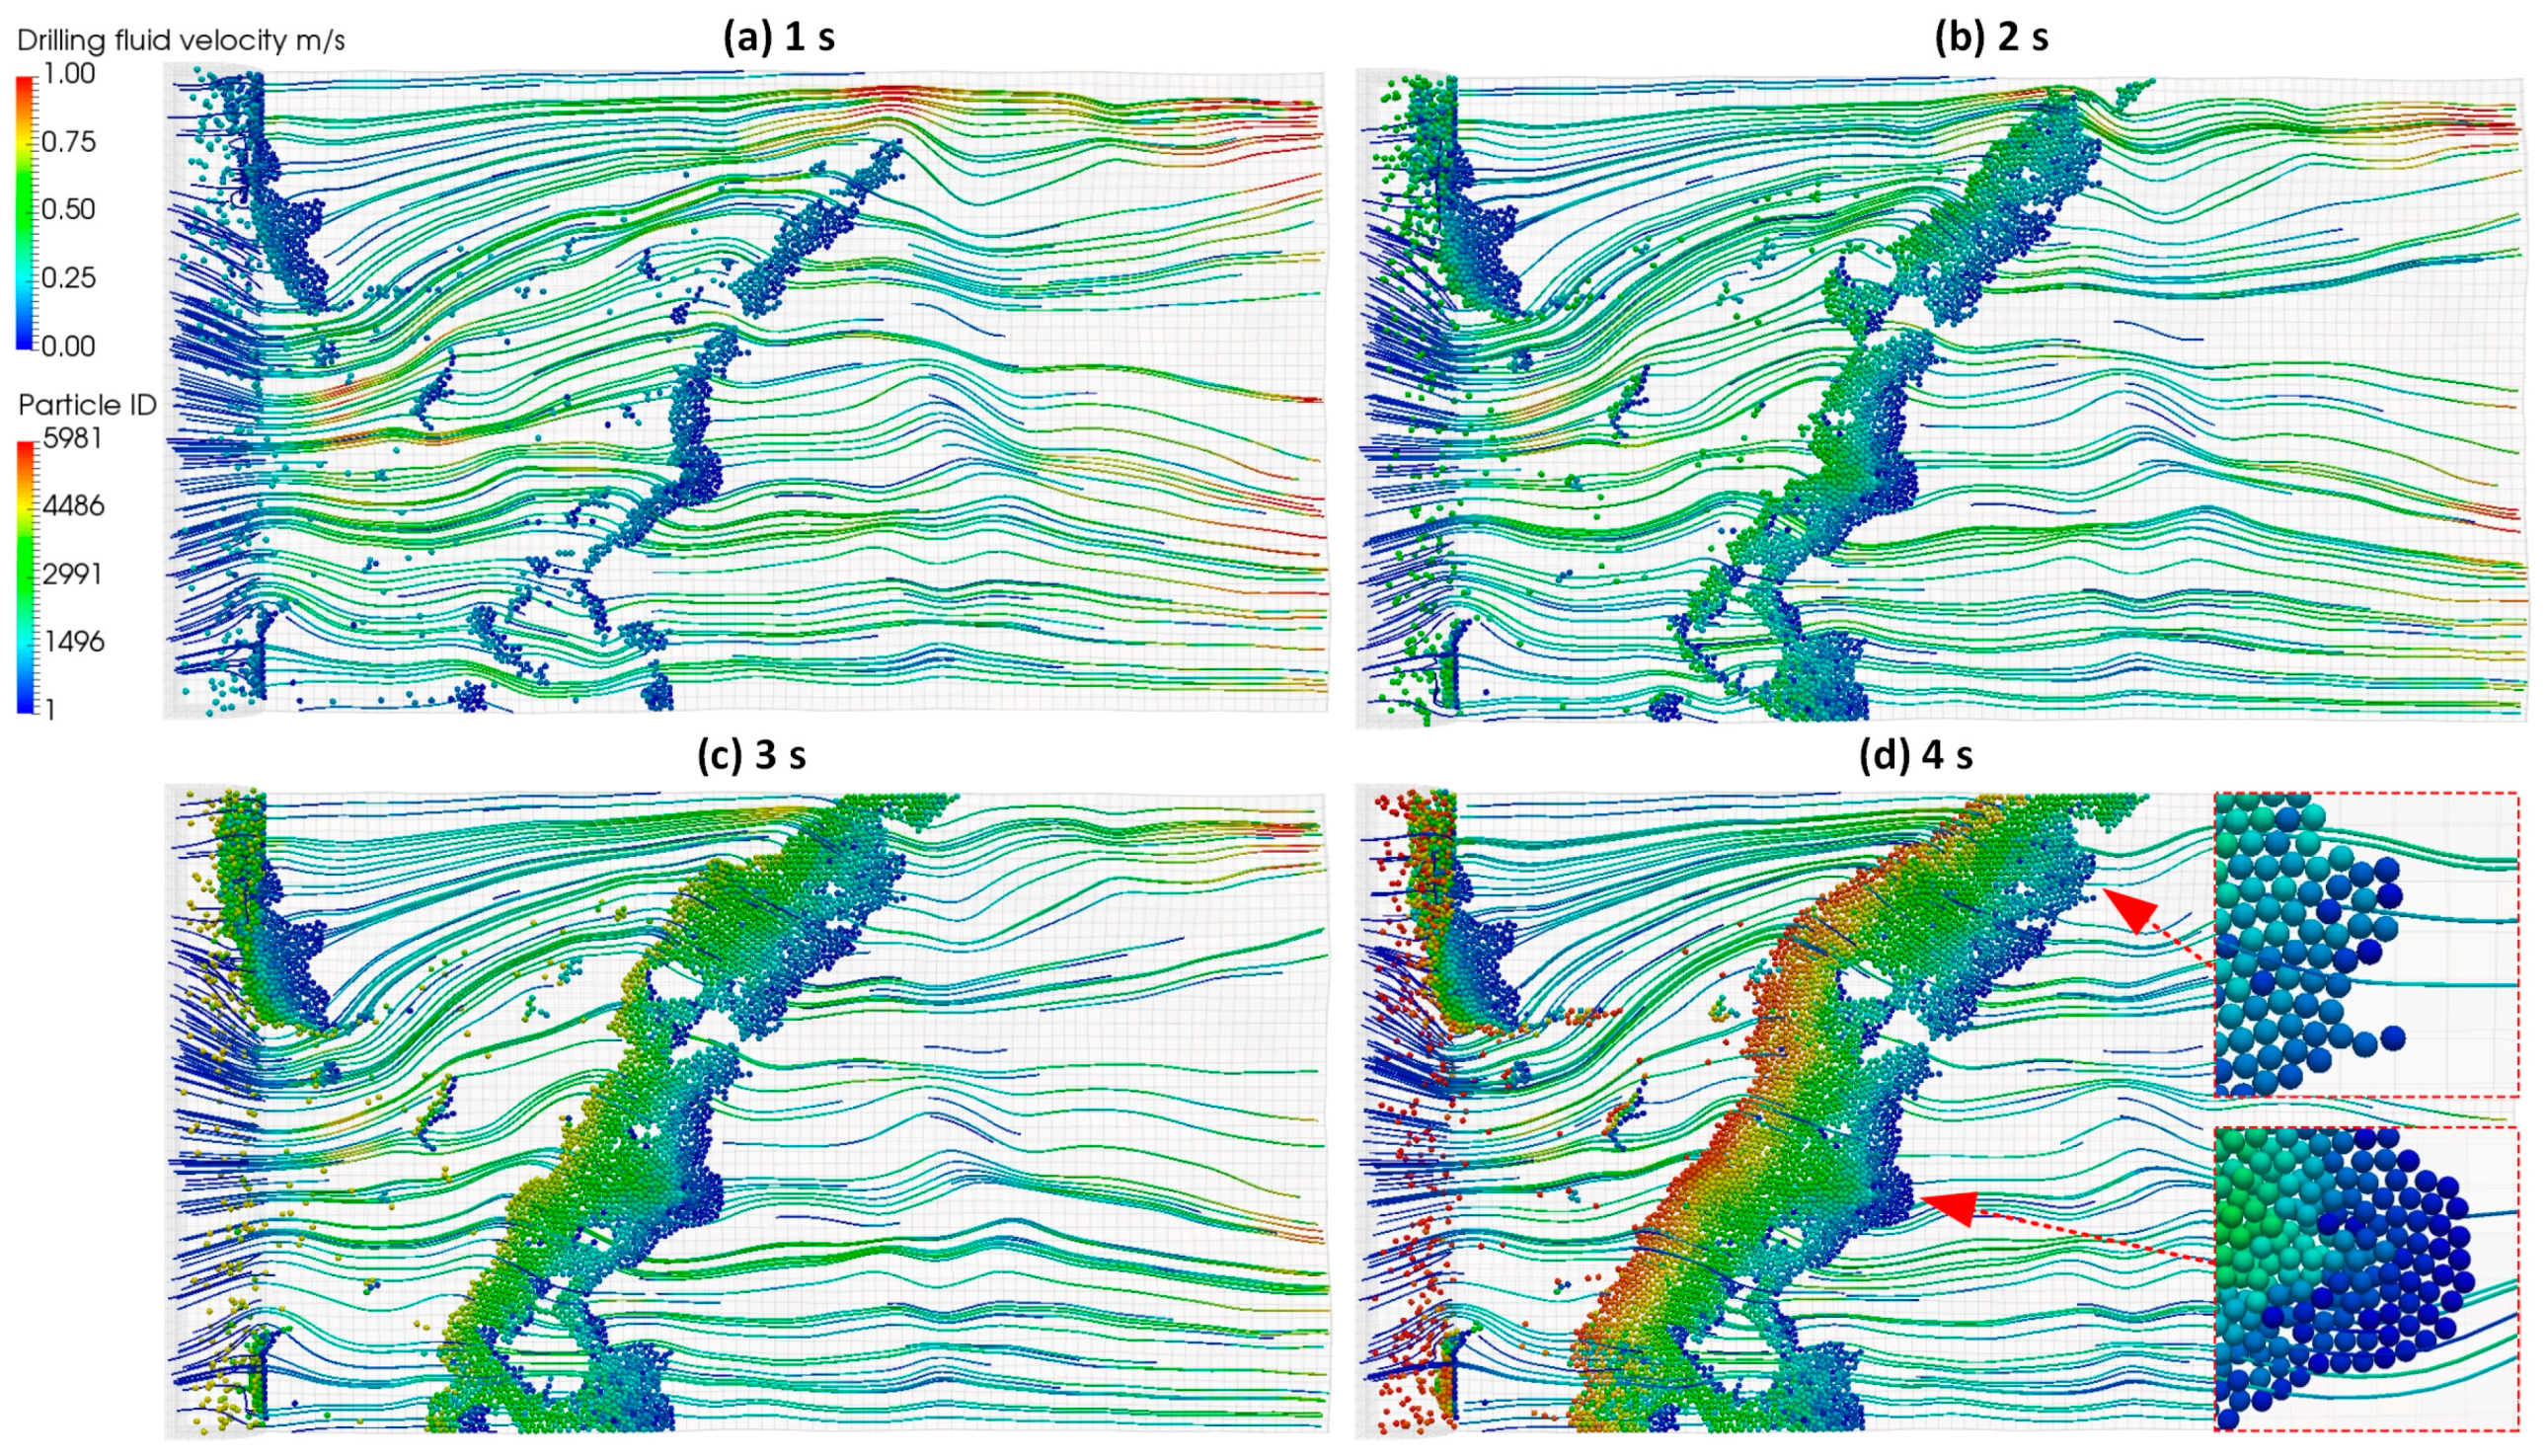
In this section, to illustrate the LCM particle transport and plugging process in rough fractures, the simulation results of a 0.5 mm particle diameter and 1% volume concentration are discussed.
Figure 8 shows the LCM particle transport and plugging process at different simulation moments. The streamlines represent the flow of the drilling fluid, and its color represents the velocity of the drilling fluid. The color of the particles represents the particle ID, which indicates the sequence of particle generation and injection into the fracture. It can be seen that the LCM particles carried by drilling fluid flow into the fracture, and some of the early LCM particles bridge somewhere in the fracture, which gives rise to the continuous accumulation of later LCM particles, which eventually form a plugging zone. It is worth noting that the LCM particle only forms the plugging area through a single particle bridging, as shown in Figure 8d.
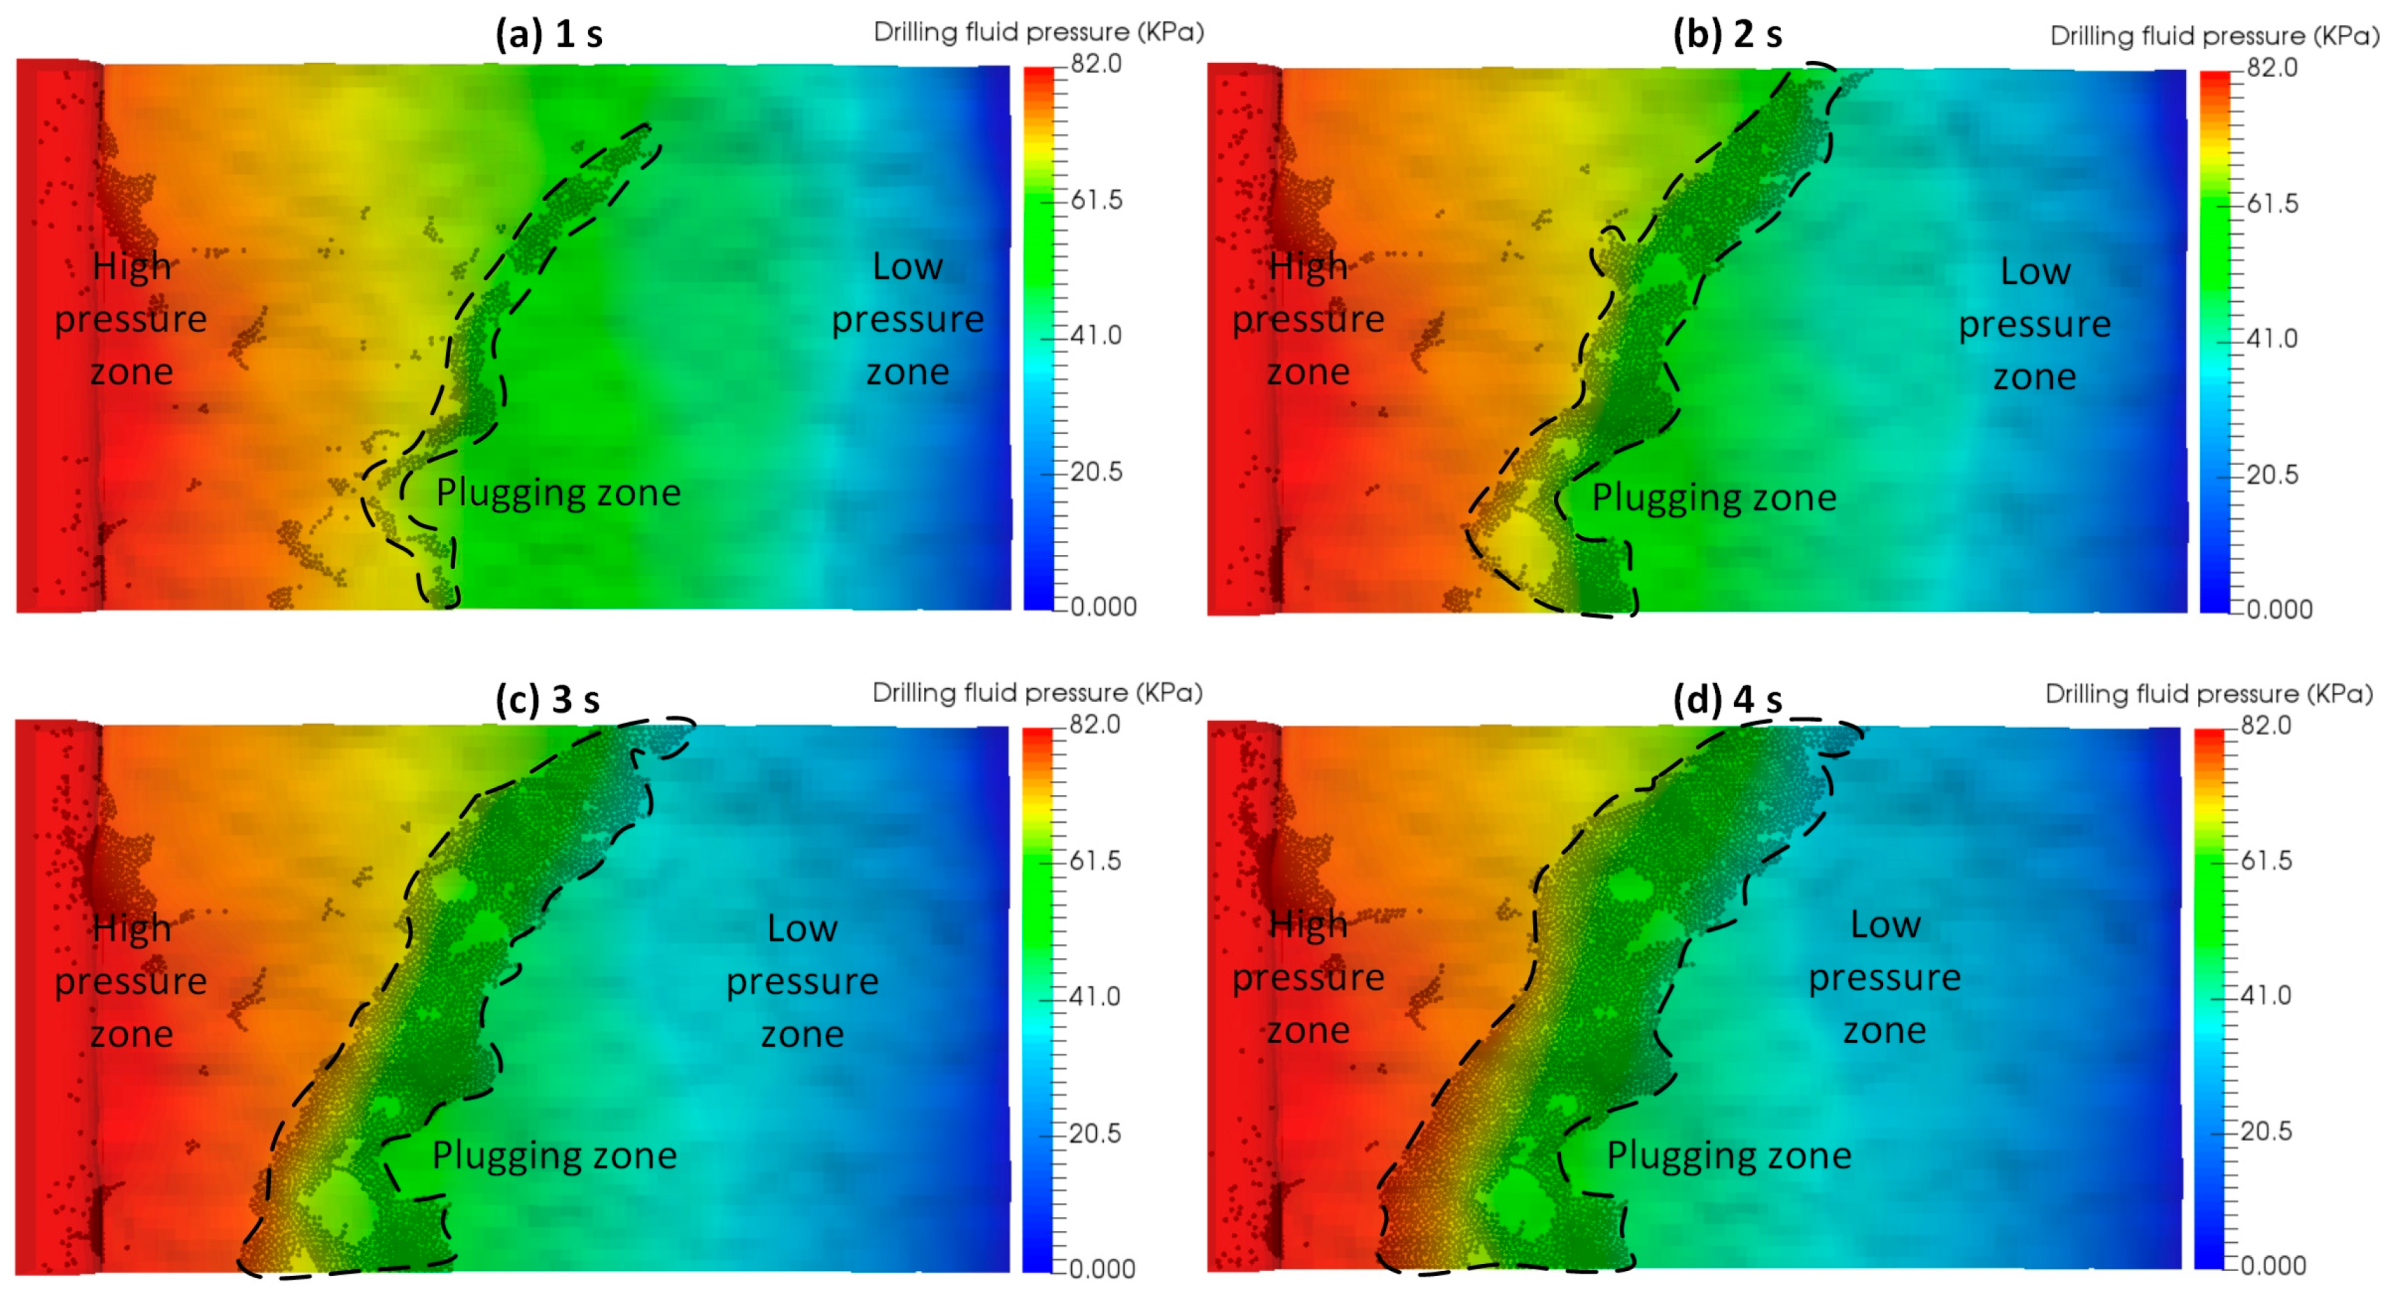
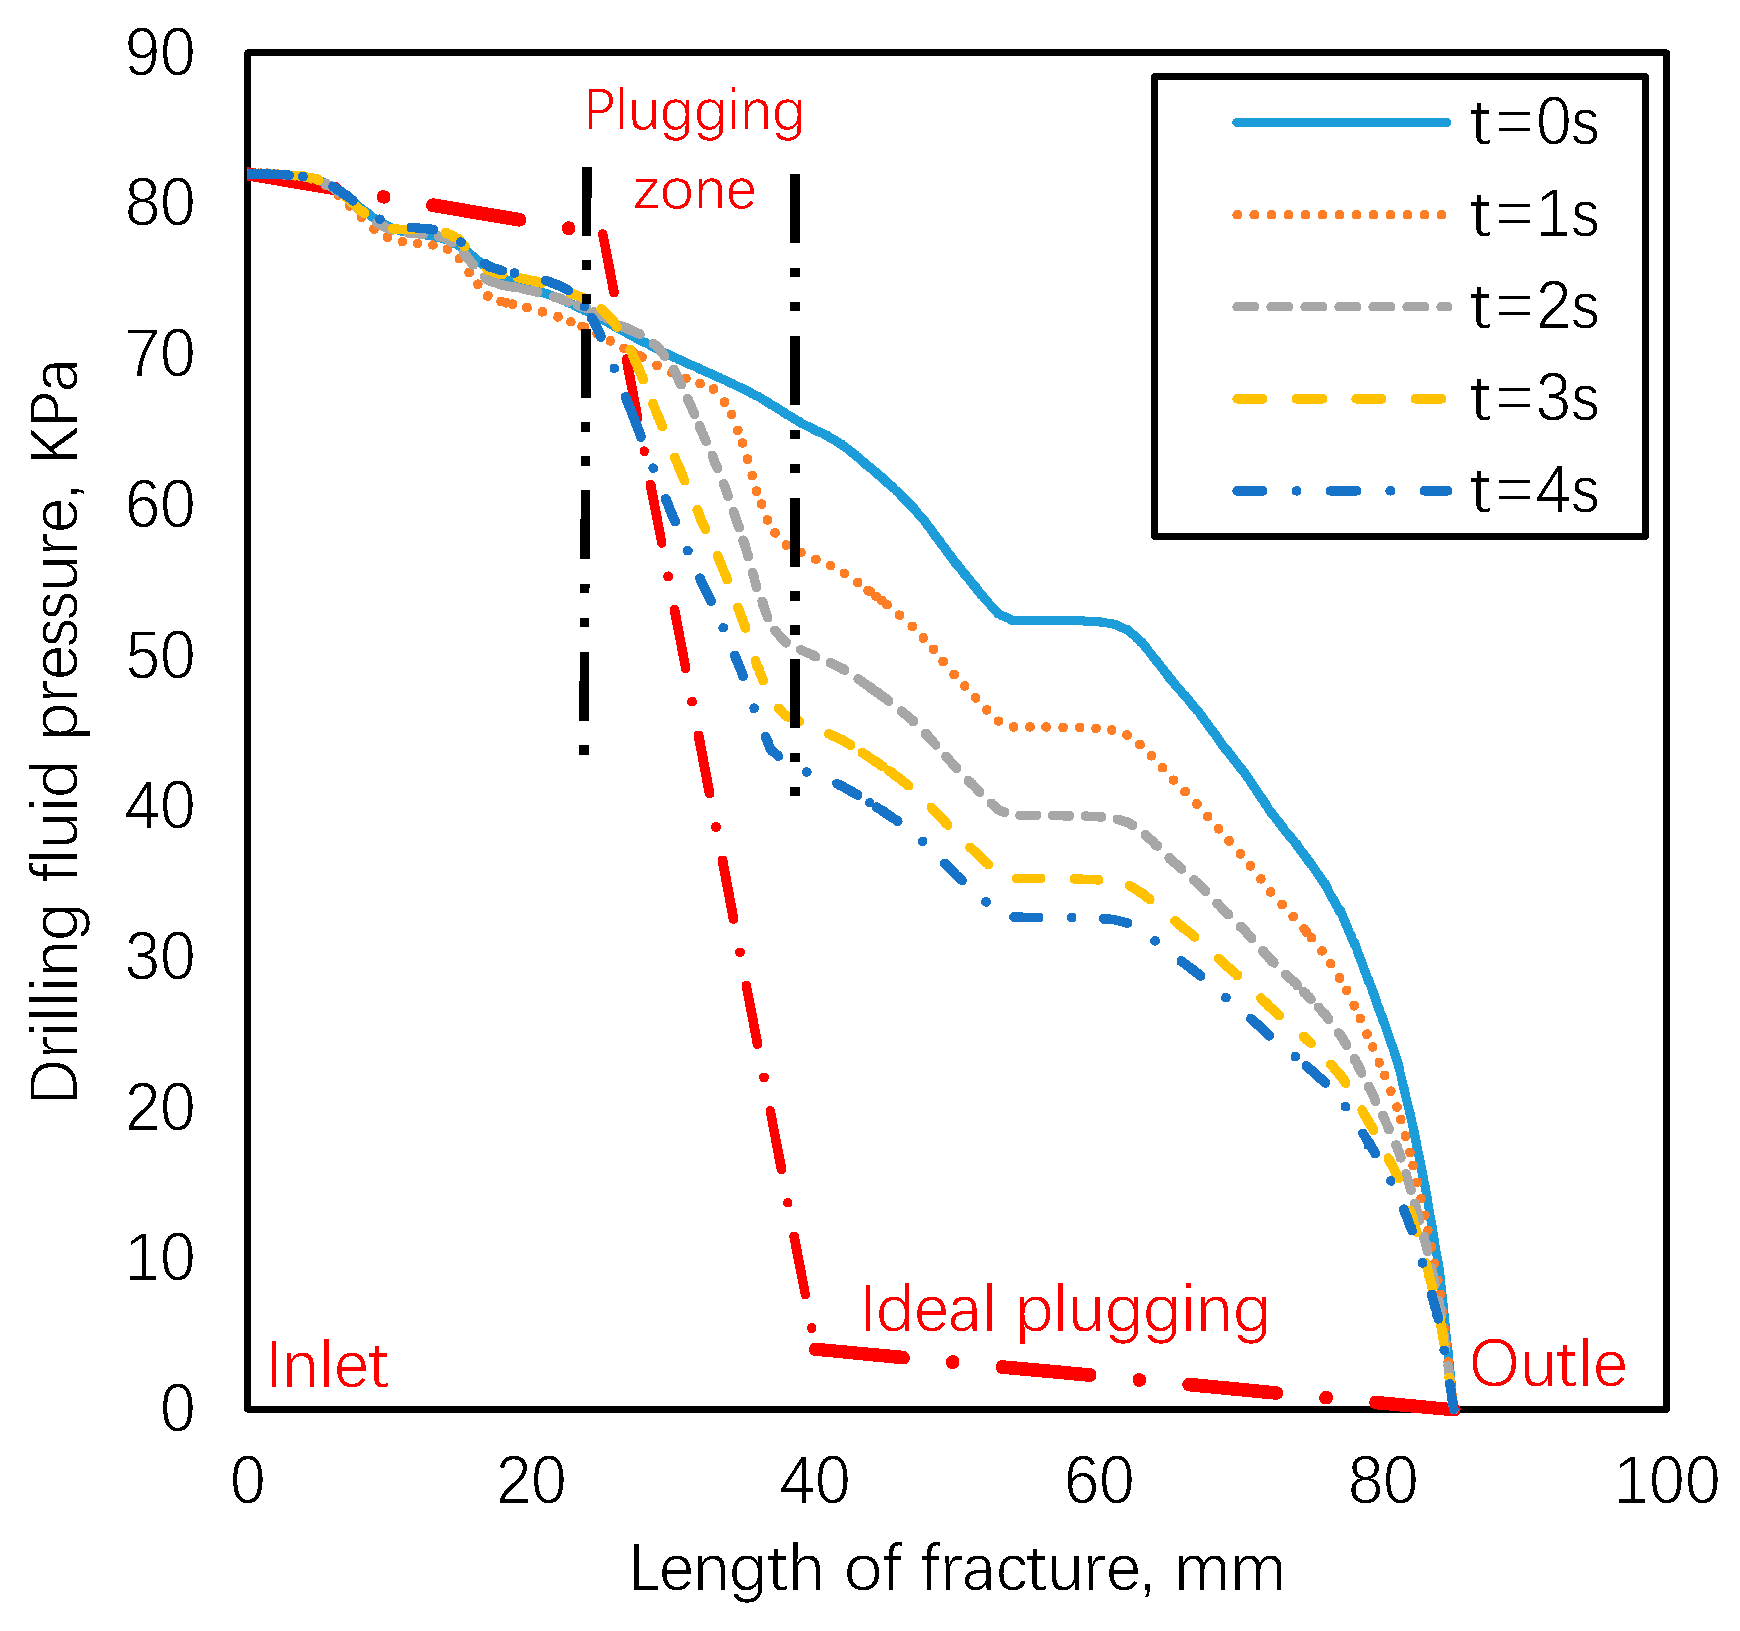
Figure 9 shows the drilling fluid pressure profiles at different simulation moments. The simulation domain has been gradually segmented into the high-pressure zone near the wellbore and the low-pressure zone near the formation by the plugging zone. The drilling fluid pressure data of the middle section of the fracture in terms of height were extracted and are shown in Figure 10. It can be seen that, with the continuous expansion of the plugging zone, the overall drilling fluid pressure in the fracture is decreasing. Especially in the plugging, a significant pressure drop of 31 KPa arose within the 15 mm length of the fracture where the plugging zone is exactly located. Therefore, the pressure gradient in the plugging zone at the 4 s is 2.06 MPa/m, which is much higher than the average pressure gradient of 0.965 MPa/m in the entire fracture. This is because the plugging zone imposes additional flow resistance to the drilling fluid flowing through it.
It is well known that the higher pressure of the drilling fluid compared to the formation pressure induces drilling fluid loss and fracture extension, which further intensifies drilling fluid loss [35]. After the large LCM particles bridge in the fracture, other smaller LCM particles accumulate around and fill the pore in bridging LCM particles. The usage of wide PSD LCM causes the plugging zone to become more low-porosity and impermeable, which better prevents drilling fluid loss and pressure propagation, as the “Ideal plugging” curve shows in Figure 10. The influence of LCM plugging on the drilling fluid loss rate will be discussed in the next section.
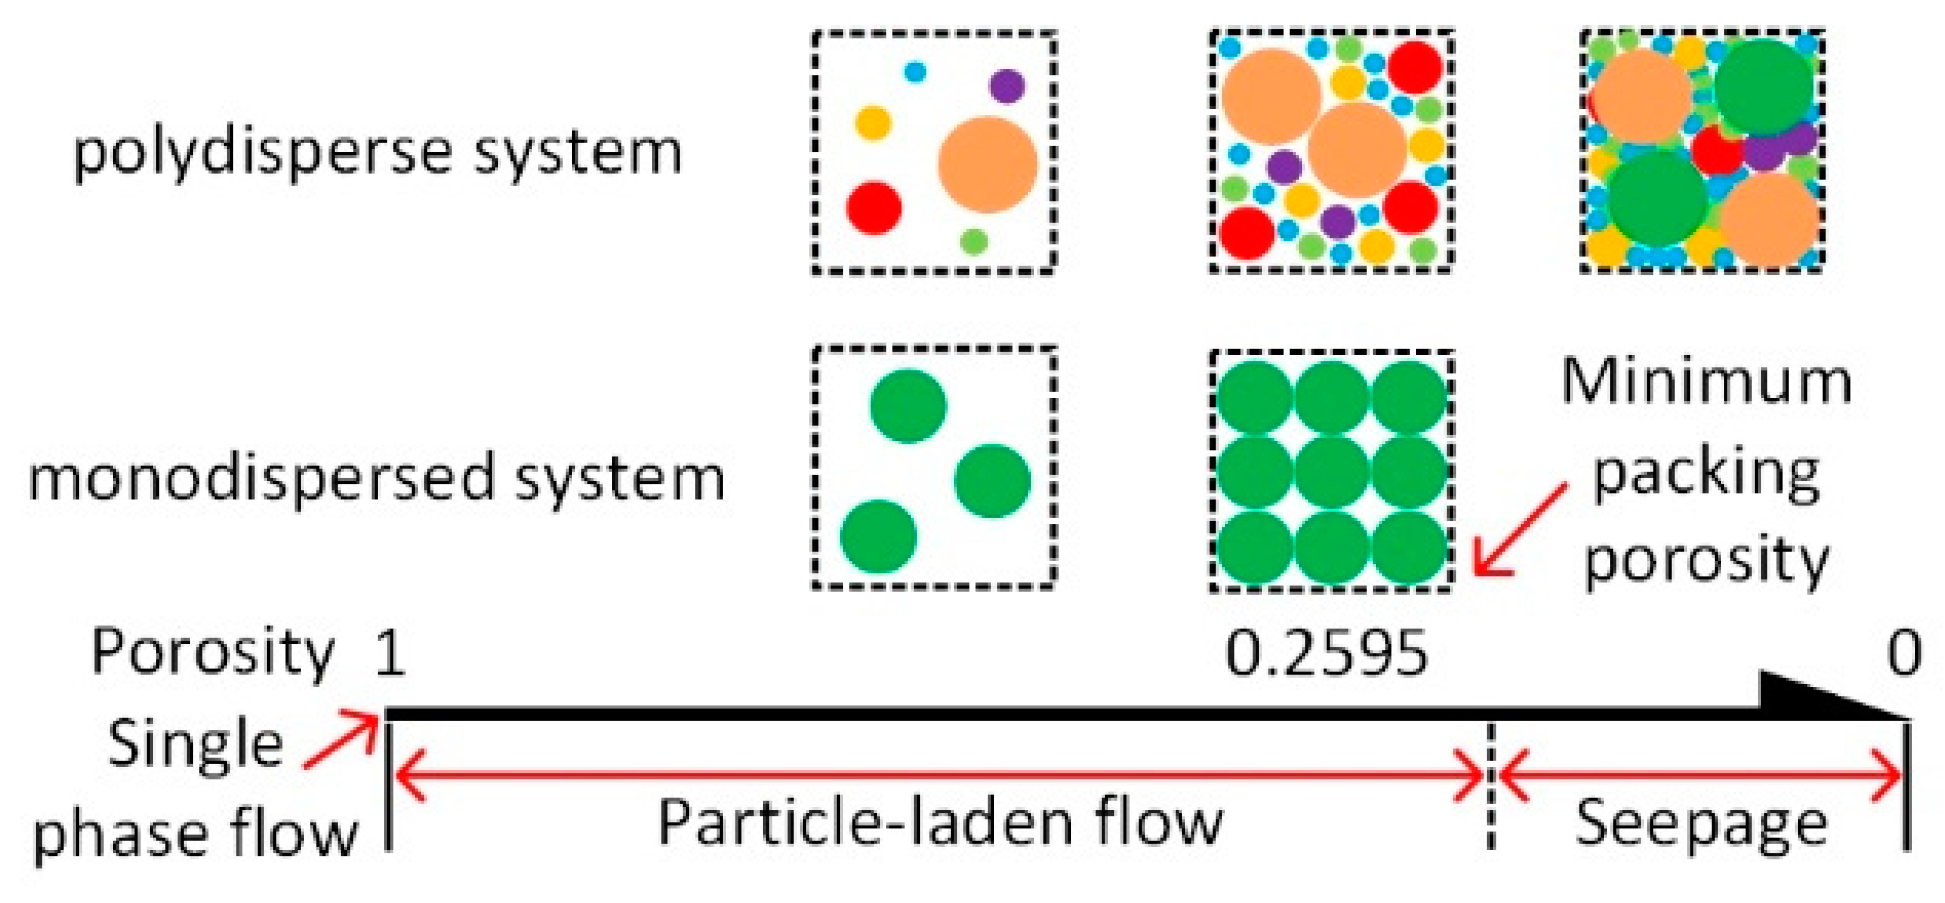
In this paper, the simulation system is monodisperse, while the wide PSD LCM formulas will be adopted in the drilling field, which is polydisperse. As shown in Figure 11, with the increase in the number and volume of particles in the fluid, the fluid flow resistance also increases. Meanwhile, the flow regime also changes from a single-phase flow to a particle-laden flow and seepage. However, for the monodisperse, the volume of particles in the fluid and porosity have upper and lower limits, respectively. The most compact structure of the monodisperse system is the face-centered cubic structure, in which there is one sphere at each of the eight corners and at the centers of all six faces. The porosity of such a structure is 0.2595, while the porosity of the polydisperse system might be lower because the pore can continue to be filled with smaller particles. This makes the plugging zone more compact and impermeable, preventing drilling fluid loss and fracture extension.
All LCM formulas used in the drilling field are the polydisperse system. The drag force plays a dominating role in capturing the characteristics of particle-laden flow, but it is also more complex and difficult to study for the polydisperse system. Currently, few drag force models of the bidisperse or polydisperse system have been proposed [36,37,38]. Such models are not currently embedded in the CFDEM® coupling (version 3.8.0) yet, which will be the focus of future work.
3.2. Effect of LCM Size
In this section, the simulation results of 0.2, 0.3, 0.4, and 0.5 mm particle diameters and 1% volume concentration are selected to illustrate the effect of LCM size on the LCM particle transport and plugging process in rough fractures.
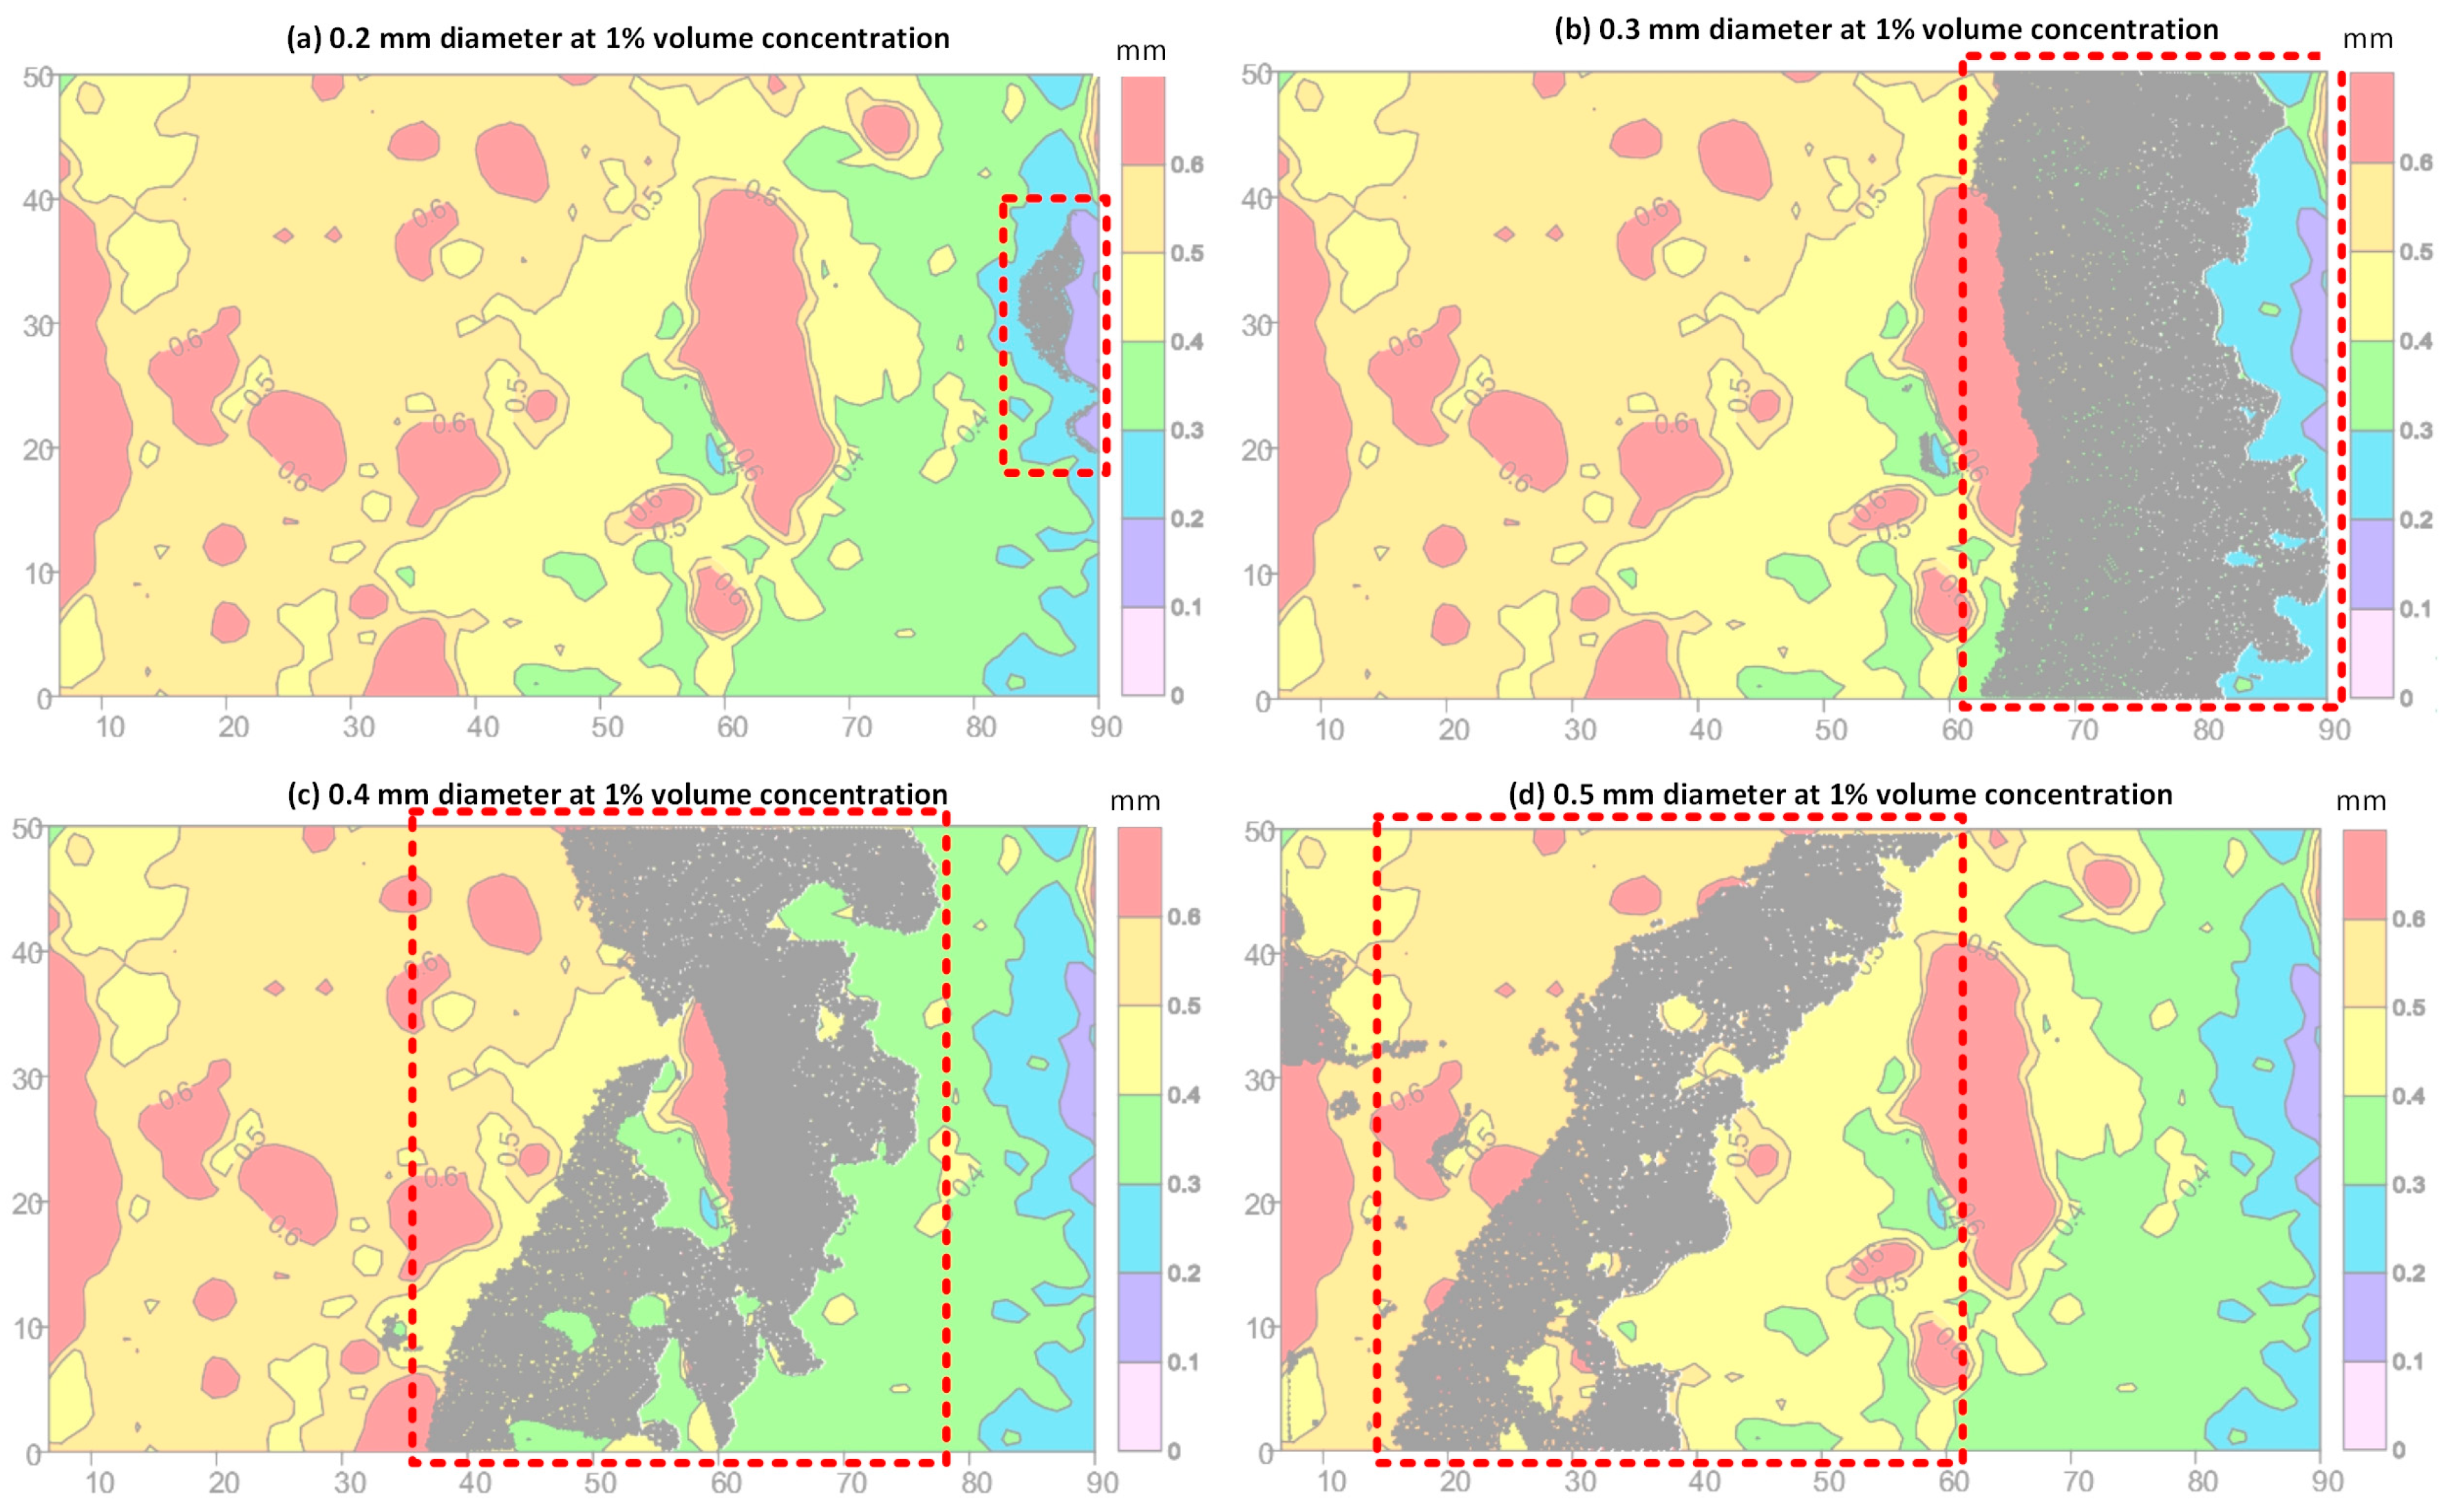
The distributions of different diameter LCM particles at the end of the simulation is plotted in Figure 12, along with the faded fracture aperture contour as background. It is worth noting that only those particles whose velocity is smaller than 0.01 m/s are shown, and the black color lump enclosed by a red dotted line is the plugging zone consisting of LCM particles.
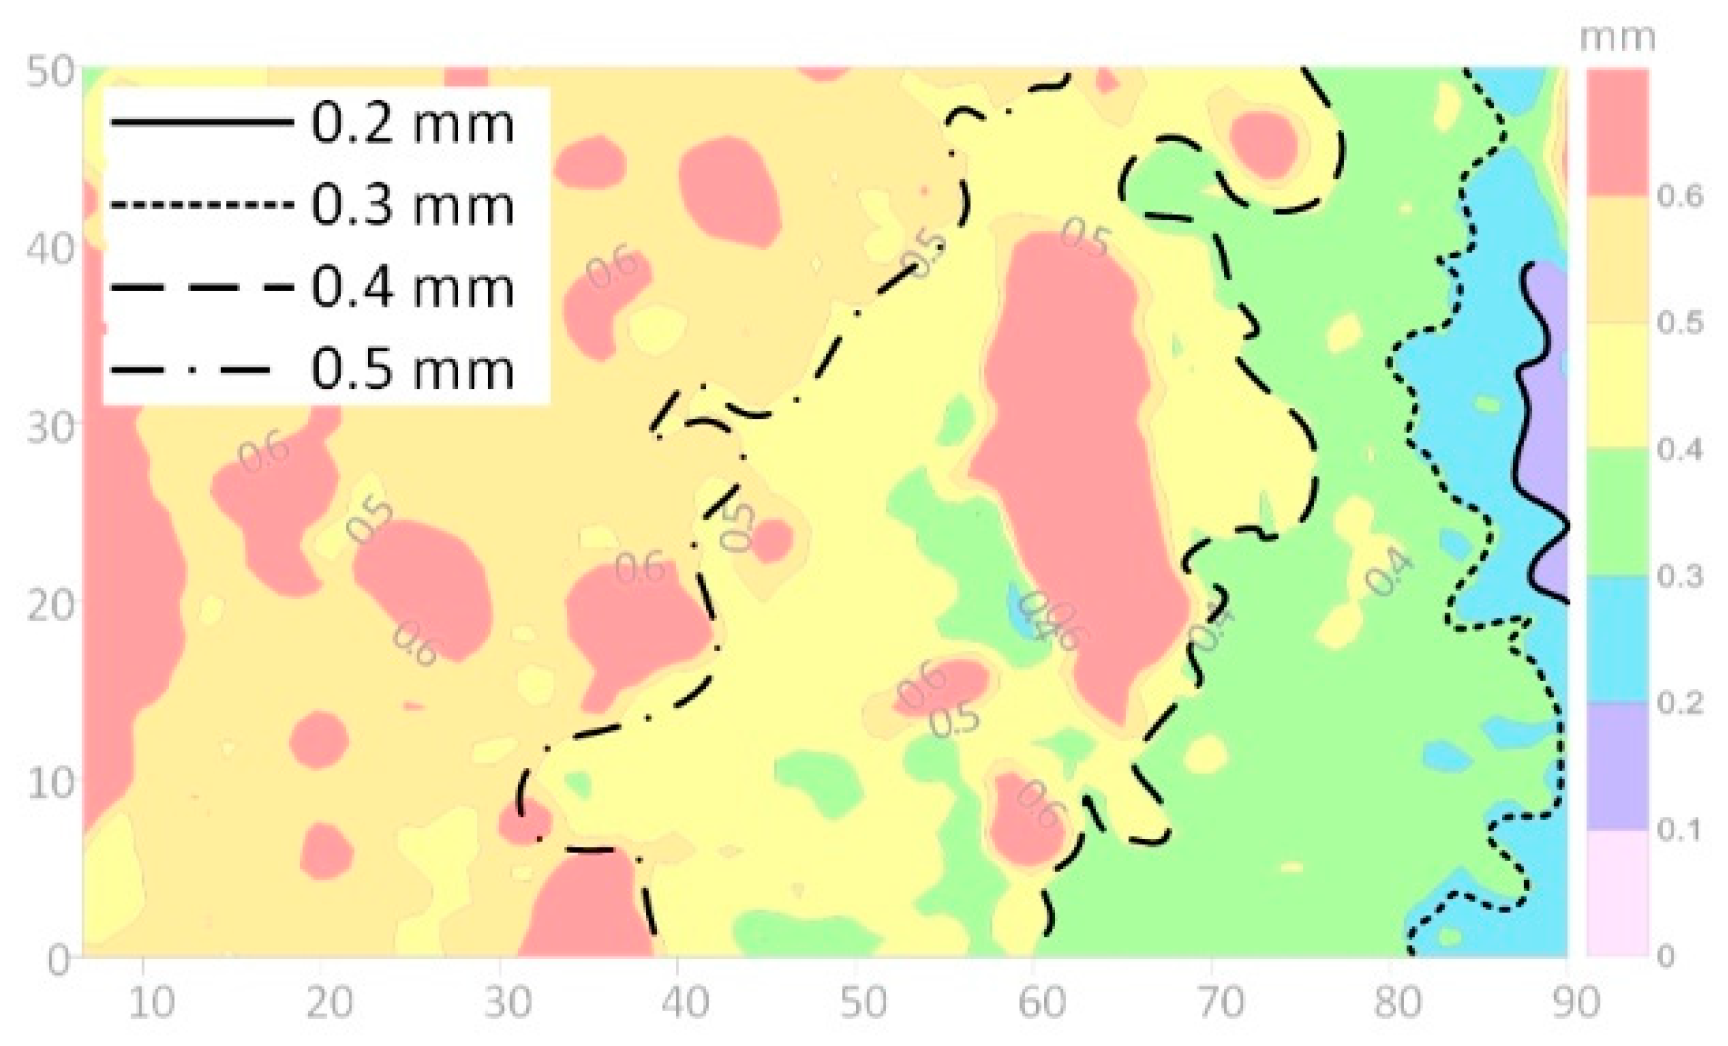
To better understand the distribution of LCM particles, the front edges of the plugging zone were extracted and are plotted on the faded fracture aperture contour in Figure 13. It is obvious that the front edge of the plugging zone forms at the fracture aperture isopleth, which has the same value of the diameter of the LCM particles.
It is also obvious from Figure 12a and Figure 13 that the 0.2 mm diameter LCM particles have not formed a plugging zone over all height directions of the fracture. After carefully observing the particle contact status, there is still only single particle bridging of 0.2 mm diameter LCM particles in the fracture, which means the LCM particles will only bridge and stack in the narrow portion of the fracture, where the local aperture is equal to or a bit smaller than the LCM particle diameter. Therefore, if there is no narrow portion in the fracture, the LCM particles cannot plug the fracture.
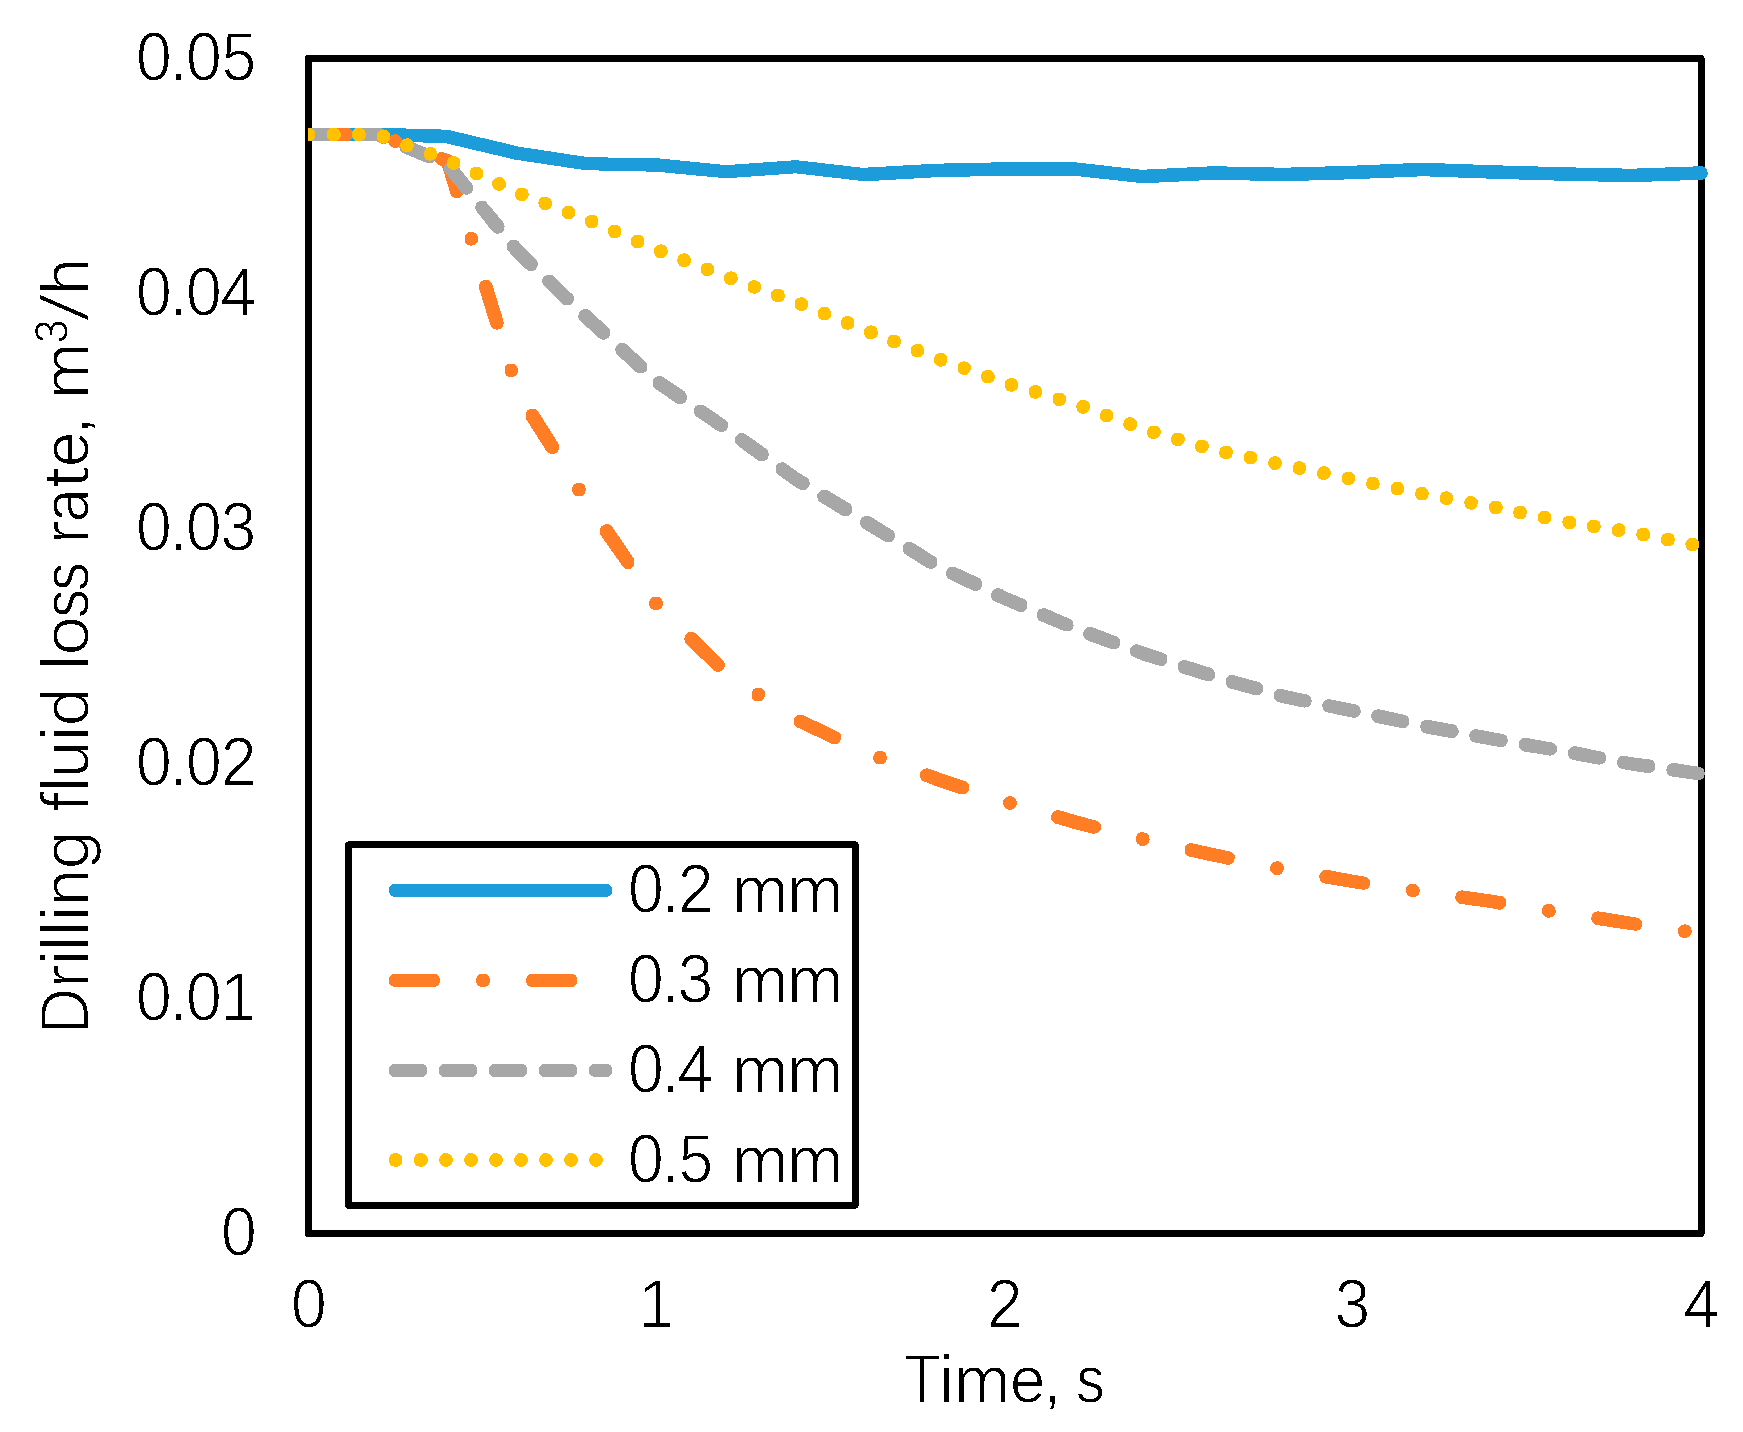
The flow rate at the outlet was extracted as the drilling fluid loss rate and is plotted in Figure 14. The magnitude of the drilling fluid loss rate looks quite small. This is because the fracture model in the simulation is only 50 mm in height. In the drilling field, the actual fracture in the formation may be several meters in height, and multiple parallel fractures or fracture networks may also occur according to the well logging information.
It can be seen that the drilling fluid loss rate dropped by 3.49%, 72.70%, 58.16%, and 37.43% for 0.2, 0.3, 0.4, and 0.5 mm in diameter LCM particles, respectively, with the formation of the plugging zone. The drilling fluid loss rate decreased very little in the case of the 0.2 mm diameter LCM particles because it failed to form a plugging zone over all height direction of the fracture. Meanwhile, the LCM particles with a smaller diameter gave rise to a greater drop in drilling fluid loss rate because the plugging zone was monolayer and the gap between the LCM particles and fracture wall decreased as the diameter of LCM particles decreased, which reduced the porosity of the plugging zone and made it more compact.
The above analysis results demonstrate that the local fracture aperture or fracture surface morphology has a significant influence on LCM particle transport and plugging zone distribution. In the case of single-particle bridging, the front edge of the plugging zone only forms in the narrow portion of the fracture, where the fracture aperture is equal to or a bit smaller than the size of the LCM particles.
3.3. Effect of LCM Volume Concentration
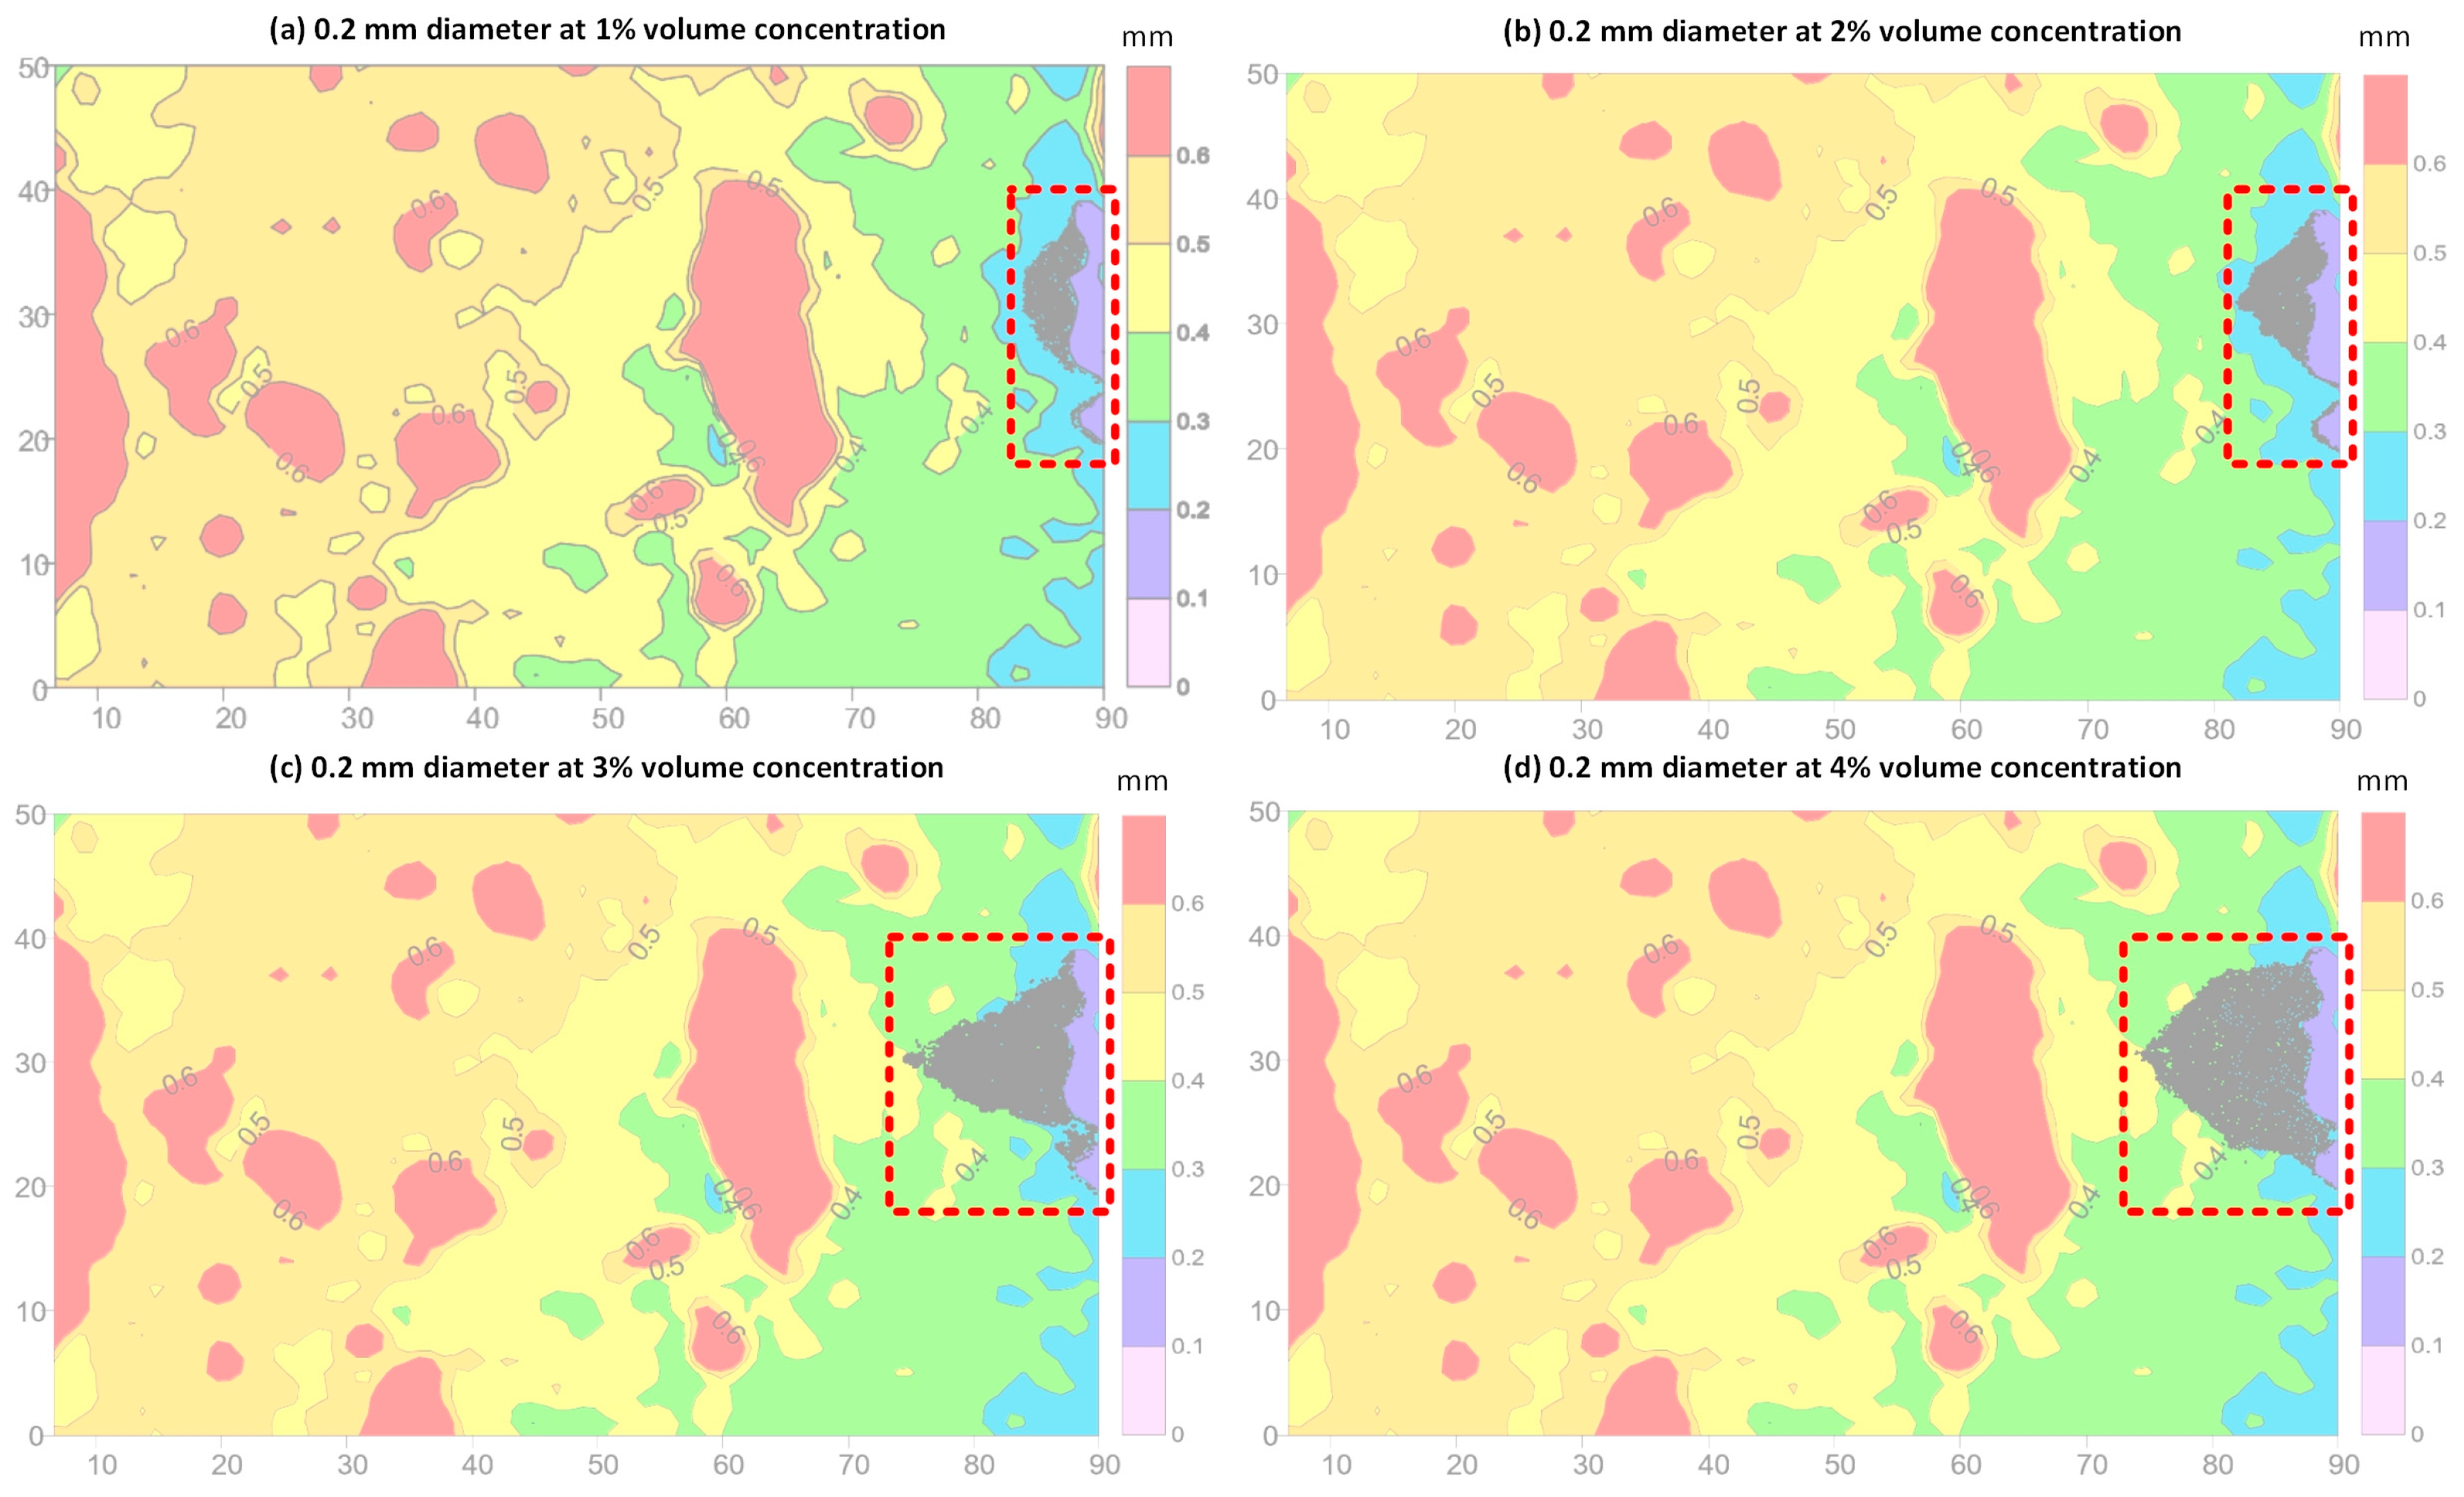
By increasing the LCM volume concentration from 1 to 4% step by step, the plugging zone forms faster than that at low volume concentration because of the extra injected LCM particles. It is worth mentioning that the LCM particles with a 0.2 mm diameter still cannot form a considerable plugging zone even though the volume concentration reaches 4%, as shown in Figure 15.
The possible reason for this may be that most of the fracture aperture was larger than 0.2 mm and there was still no multi-particle bridging. This means that the LCM particles with 0.2 mm diameter could only occupy a very small area at the end of the fracture, as shown in Figure 15. Due to paper length restrictions, the LCM distribution of other diameters at different volume concentrations will not be displayed or discussed further.
3.4. The Effect of LCM Shape
By introducing the CDT model, the influence of small-scale nonsphericity of the LCM particles can be represented by adding extra torque to the contact force calculation. In this section, the rolling friction coefficient was set to 0.2, which is a considerable value according to a preliminary study [26].
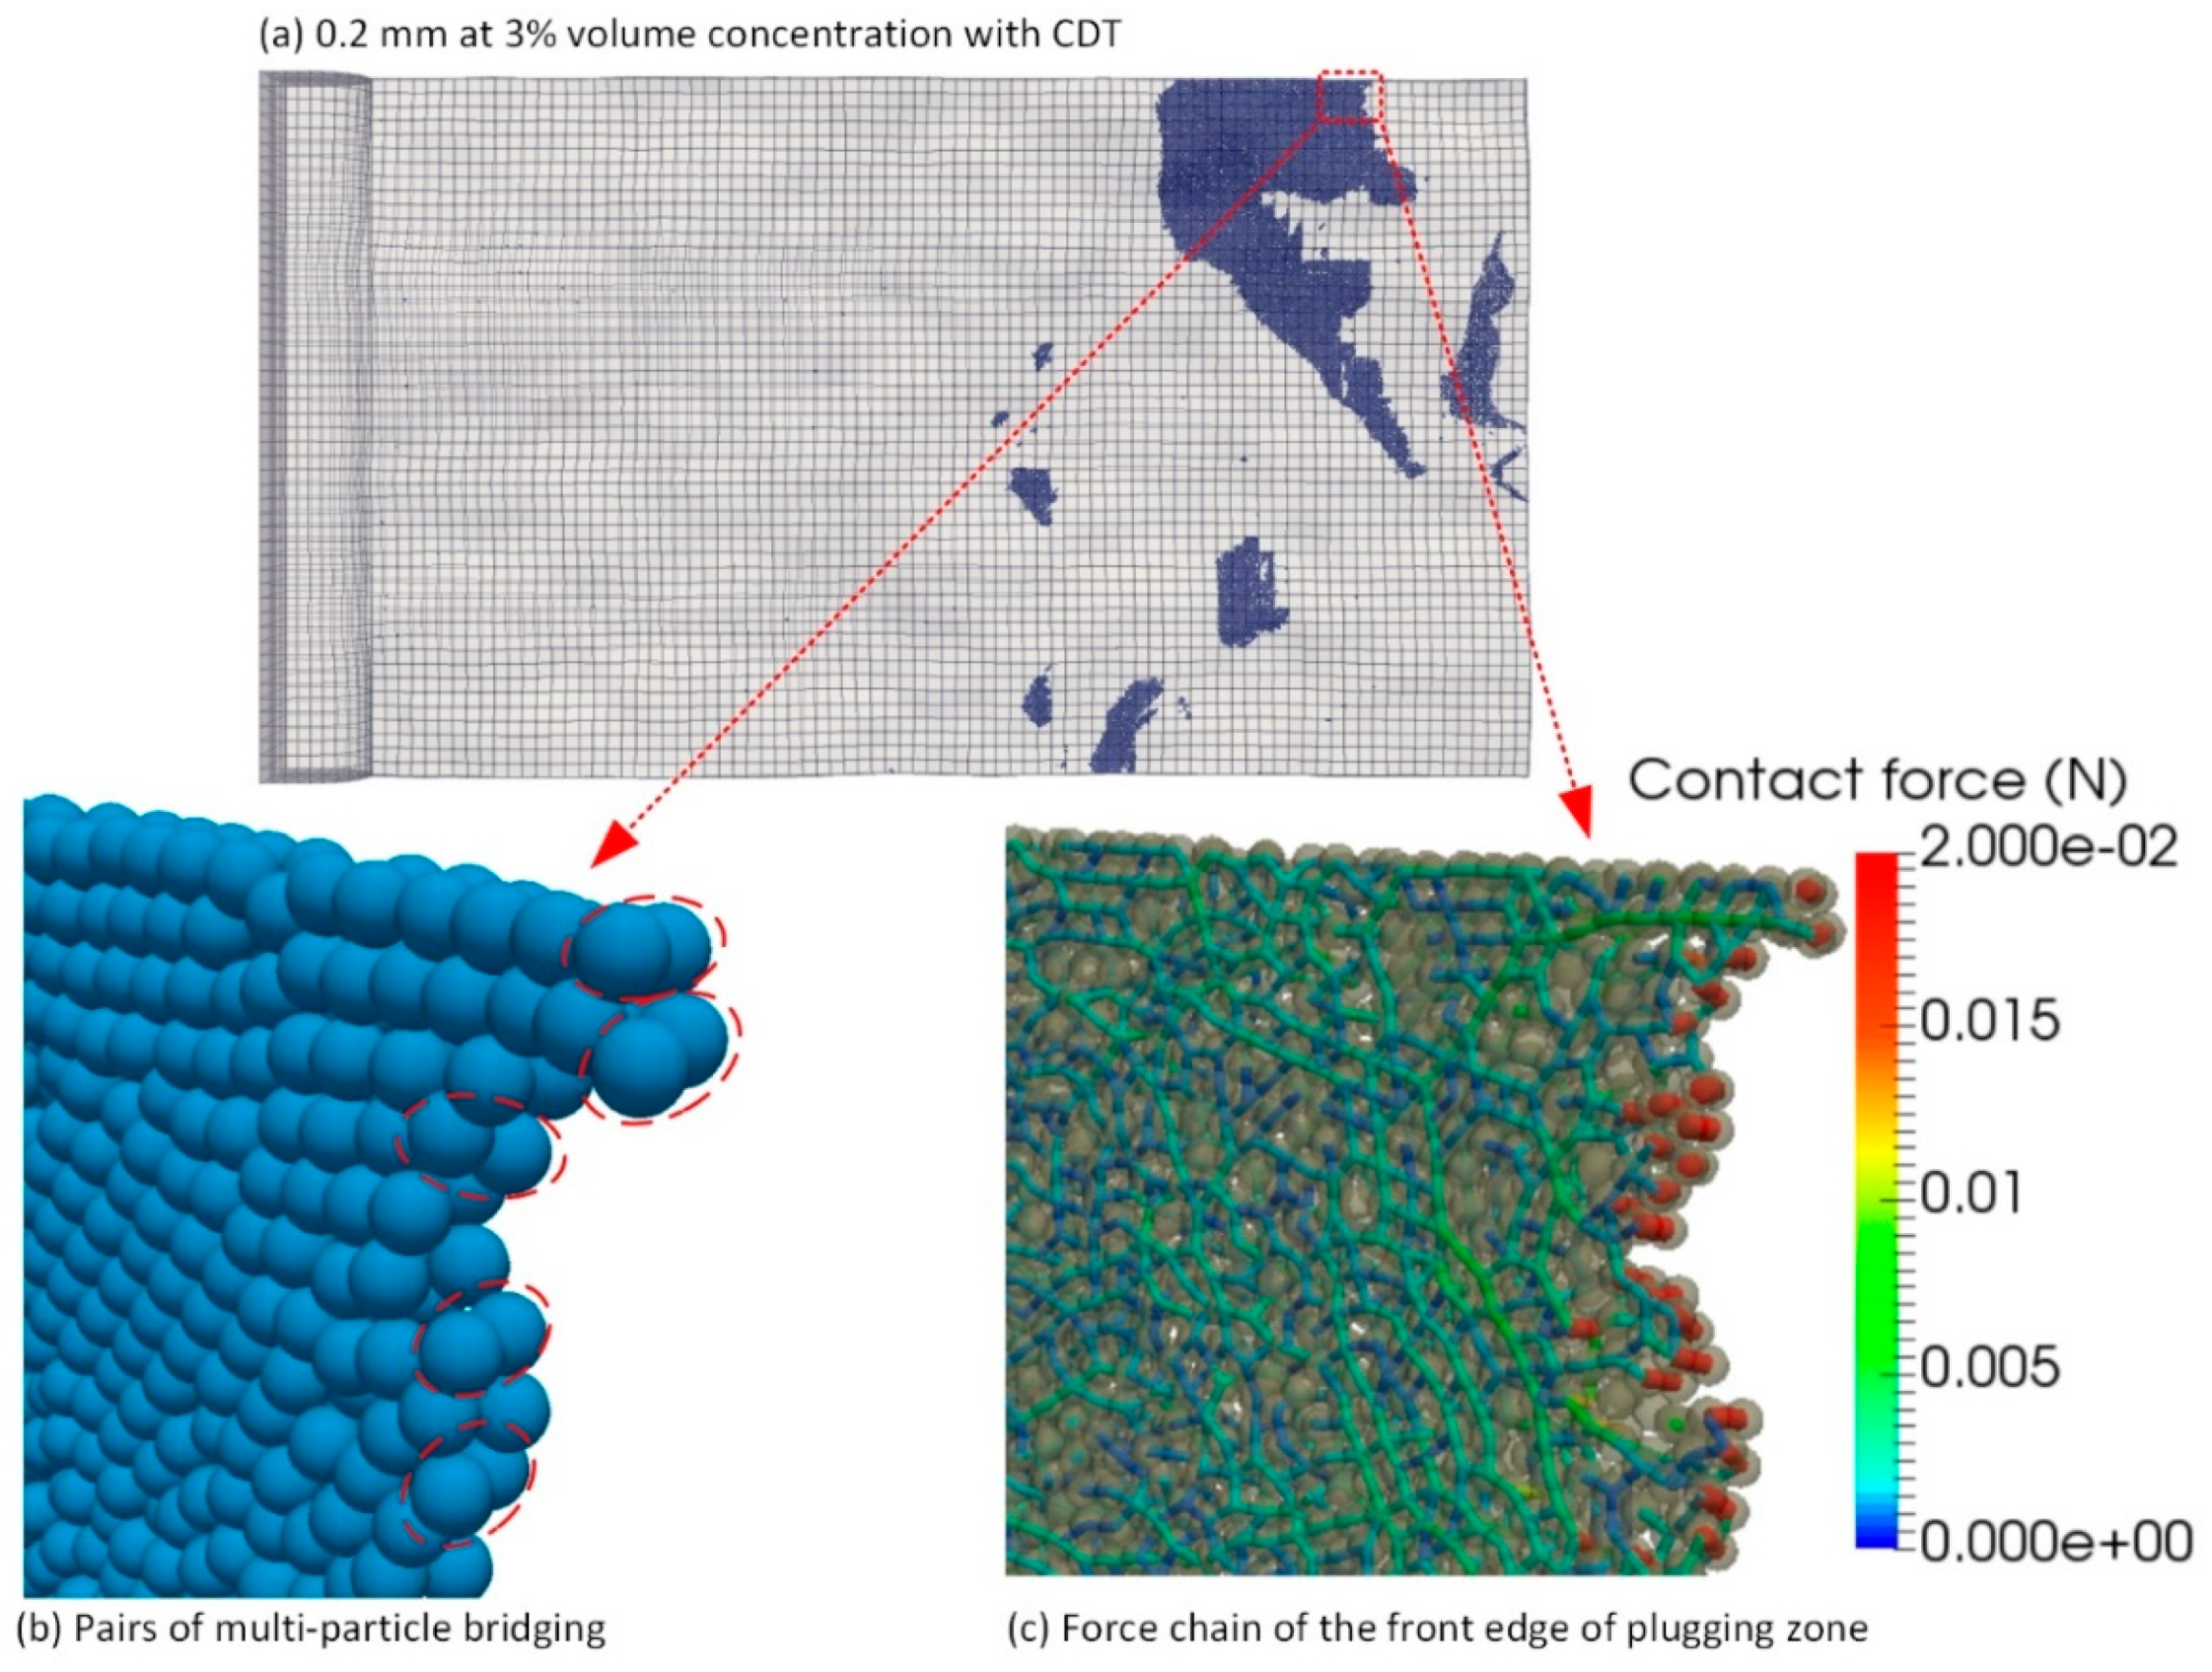
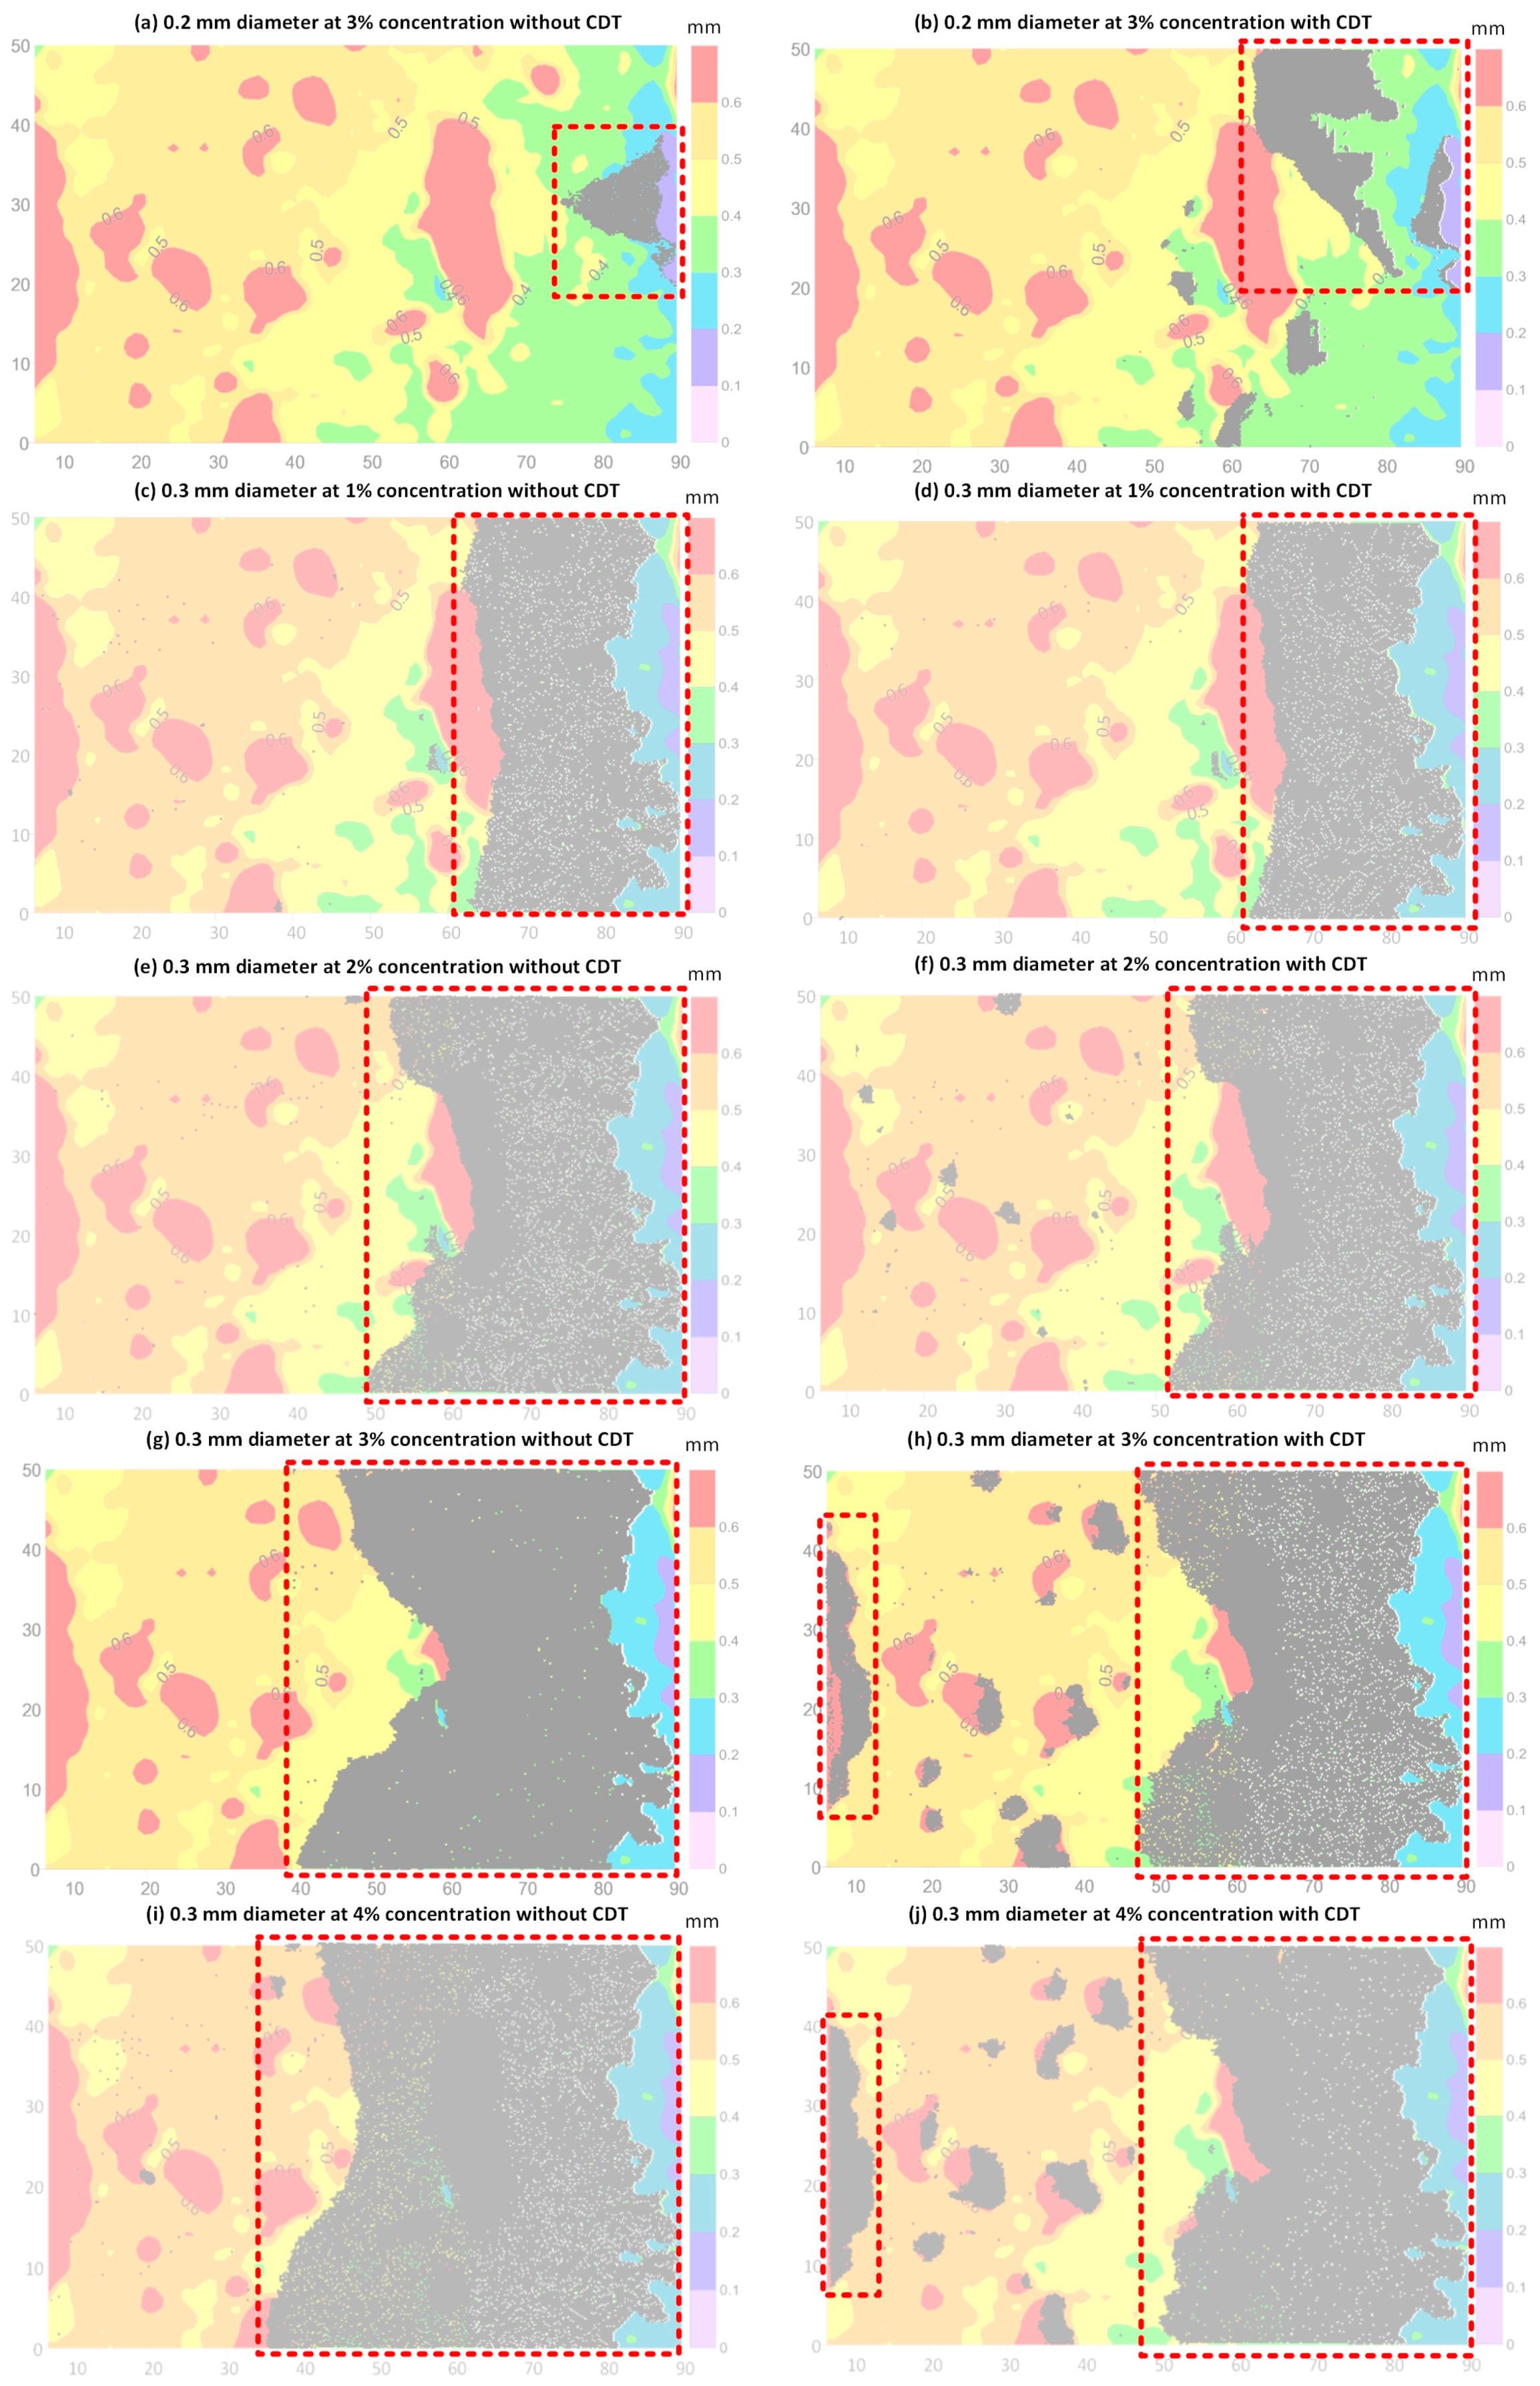
As shown in Figure 16, the nonsphericity of the LCM particles greatly increased the probability of bridging and the multi-particle bridging (Figure 17b), which appears for the first time in this study. The multi-particle bridging changed the distribution of the LCM plugging zone, which which brings some good or bad influence. On the one hand, multi-particle bridging can plug the fracture using LCM particles whose size is smaller than the fracture aperture, as shown in Figure 16a,b. This makes it possible for small LCM particles to plug large fractures, which helps to rapidly stop drilling fluid loss. On the other hand, multi-particle bridging may also occur in inappropriate places such as the inlet of the fracture, as shown in Figure 16h,j. With the increase in LCM concentration, LCM particles pile up at the fracture inlet and make it more difficult for LCM particles to enter the fracture inside. At the same time, the LCM particles piled up at the fracture inlet are easily rushed away by drilling fluid circulation, which exposes the fracture to wellbore again. These problems may increase the cost and difficulty of fracture plugging.
Force chain is a network consisting of the contact force within granular materials, which indicates the contact relationship between particles and the magnitude of contact force. Figure 17 shows the force chain in the case of 0.2 mm diameter LCM particles and 3% volume concentration. The contact relation and contact force transfer process of LCM particles are presented as shown in Figure 17c. It is worth noting that the magnitude of the contact force of the LCM particles in the front edge of the plugging zone is significantly larger than other LCM particles. This is because all of the LCM particles in the plugging zone gained the drag force exerted from the drilling fluid. The drag force causes each LCM particle to press the LCM particles forward; therefore, as the particles move closer to the front edge of the plugging zone, the magnitude of contact increases. If the magnitude of contact force exceeds the compressive strength of LCM particles, LCM particles may be crushed, which leads to the instability of the plugging zone and drilling fluid loss again. In other words, the microscopic mechanical properties of the LCM particles determine the strength of the force chain, affecting the pressure loading capability and stability of the macro plugging zone. Further understanding of the evolution of the force chain in the process of LCM fracture plugging may help in the design of a more efficient LCM formula and the reduction of drilling cost.
4. Discussion
Some phenomena and results were obtained by simulation, but there is a lack of experimental verification due to certain difficulties.
At present, the evaluation experiments of LCM are mostly carried out on a plugging apparatus with metal straight slots or tapered slots [39,40,41] as the fracture, applying a constant pressure and measuring the fluid loss. The surface shape of slot may be flat or groove, but different from the real rock fracture morphology. There are also differences in the mechanical properties of the friction between the metal slot and the rock surface.
Evaluation experiments are also carried out in fracture rock cores [42], but confining pressure is usually required to ensure that the fluid will only flow through the fracture, which leads to inhomogeneous changes in the fracture aperture.
These problems make it difficult to carry out experimental verification that is completely consistent with the simulation conditions. The purpose of this work is to disclose the potential of fracture surface scanning and CFD-DEM simulation to investigate the transport of LCM in rough fractures. To validate the proposed method in this paper, experimental results reported in other literature were compared with the simulation results of this study, and these results are shown in Table 2.
From the above comparison results, it can be seen that the transport law of LCM obtained by the proposed method in this paper is similar to that of existing literature.
LCM is essentially a granular material with such shapes as block, flake, and fiber. The DEM has inherent advantages in simulating particulate matter, and many methods have been proposed to simulate irregular particles, such as ellipses, super-quadrics, polygons, and multi-sphere [43]. Wang [8] first introduced the DEM into the study of LCM transport in simplified fractures. The novel approach proposed in the present paper further combines fracture morphology scanning with CFD-DEM to investigate the transport of LCM in real rough fractures, which is closer to actual situations and provides more detailed and a higher amount of simulation results. This method has great potential for further development and future applications.
5. Conclusions
The fracture surface scanning technique and CFD-DEM numerical simulation were combined to investigate LCM particle transport and plug the rock fracture flow space. The following conclusions can be drawn.
The CFD-DEM numerical simulation can capture the LCM particle transport and plugging process in a rough fracture. It demonstrates the change of drilling fluid loss rate and drilling fluid pressure redistribution in the fracture with the injection of LCM particles.
The simulation results show that the local fracture aperture or surface morphology has a significant influence on LCM particle transport and plugging zone distribution. In the case of single-particle bridging, the front edge of the plugging zone can only form in the narrow portion of fracture where the fracture aperture is equal or a bit smaller than the size of LCM particles. In addition, the LCM particles with nonsphericity may cause multi-particle bridging in the fracture, which will greatly raise the efficiency of fracture plugging.
This study provides a novel approach and important theoretical guidance to the investigation of fracture plugging and wellbore strengthening. However, the result of simulation needs to be further validated with experimental data. The drag force model for the polydisperse system needs improvement. The influence of the fracture local aperture or surface morphology on the LCM particle plugging effect requires further investigation.
Author Contributions
Conceptualization, G.L. and Y.M.; Methodology, Y.F.; Validation, Y.F.; Formal Analysis, Y.F.; Investigation, Y.F.; Writing-Original Draft Preparation, Y.F.; Writing-Review & Editing, B.G.; Visualization, Y.F.; Supervision, Y.M.; Project Administration, G.L.
Funding
This research was funded by the National Natural Science Foundation of China, Grant No. 51674217, and the National Key Research and Development Program of China, Grant No. 2016ZX05021-004.
Acknowledgments
An earlier version of this paper was presented on the 2018 IADC-SPE Asia Pacific Drilling Technology Conference and Exhibition at Bangkok, Thailand. The CFDEM® coupling (version 3.8.0), ParaView (version 4.4.0), and some other open source software were used to finish this study. Thanks are extended to the publishers and contributors of this open source software.
Conflicts of Interest
The authors declare no conflict of interest.
References
- Savari, S.; Kulkarni, S.D.; Whitfill, D.L.; Jamison, D.E. ‘Engineering’ Design of Lost Circulation Materials (LCMs) is More than Adding a Word. In Proceedings of the SPE/IADC Drilling Conference and Exhibition, London, UK, 17–19 March 2015. [Google Scholar]
- Growcock, F. How to Stabilize and Strengthen the Wellbore during Drilling Operation. Available online: http://www.spe.org/dl/docs/2010/FredGrowcock.pdf (accessed on 1 July 2018).
- Alberty, M.W.; McLean, M.R. A Physical Model for Stress Cages. In Proceedings of the SPE Annual Technical Conference and Exhibition, Houston, TX, USA, 26–29 September 2004. [Google Scholar]
- Dupriest, F.E. Fracture Closure Stress (FCS) and Lost Returns Practices. In Proceedings of the SPE/IADC Drilling Conference, Amsterdam, The Netherlands, 23–25 February 2005. [Google Scholar]
- Van Oort, E.; Friedheim, J.E.; Pierce, T.; Lee, J. Avoiding Losses in Depleted and Weak Zones by Constantly Strengthening Wellbores. SPE Drill. Complet. 2011, 26, 519–530. [Google Scholar] [CrossRef]
- Feng, Y.; Gray, K.E. Review of fundamental studies on lost circulation and wellbore strengthening. J. Petrol. Sci. Eng. 2017, 152, 511–522. [Google Scholar] [CrossRef]
- Salehi, S.; Hussmann, S.; Karimi, M.; Ezeakacha, C.P.; Tavanaei, A. Profiling Drilling Fluid’s Invasion Using Scanning Electron Microscopy: Implications for Bridging and Wellbore Strengthening Effects. In Proceedings of the SPE Deepwater Drilling and Completions Conference, Galveston, TX, USA, 10–11 September 2014. [Google Scholar]
- Hands, N.; Kowbel, K.; Maikranz, S.; Nouris, R. Drill-in fluid reduces formation damage, increases production rates. Oil Gas J. 1998, 96, 65–69. [Google Scholar]
- Tsuji, Y.; Kawaguchi, T.; Tanaka, T. Discrete particle simulation of two-dimensional fluidized bed. Powder Technol. 1993, 77, 79–87. [Google Scholar] [CrossRef]
- Mollanouri Shamsi, M.; Farhadi Nia, S.; Jessen, K. Conductivity of Proppant-Packs under Variable Stress Conditions: An Integrated 3D Discrete Element and Lattice Boltzman Method Approach. In Proceedings of the SPE Western Regional Meeting, Garden Grove, CA, USA, 27–30 April 2015. [Google Scholar]
- Blyton, C.A.J.; Gala, D.P.; Sharma, M.M. A Comprehensive Study of Proppant Transport in a Hydraulic Fracture. In Proceedings of the SPE Annual Technical Conference and Exhibition, Houston, TX, USA, 28–30 September 2015. [Google Scholar]
- Zeng, J.; Li, H.; Zhang, D. Numerical simulation of proppant transport in hydraulic fracture with the upscaling CFD-DEM method. J. Nat. Gas Sci. Eng. 2016, 33, 264–277. [Google Scholar] [CrossRef]
- Zhang, G.; Li, M.; Gutierrez, M. Numerical simulation of proppant distribution in hydraulic fractures in horizontal wells. J. Nat. Gas Sci. Eng. 2017, 48, 157–168. [Google Scholar] [CrossRef]
- Akhshik, S.; Rajabi, M. CFD-DEM modeling of cuttings transport in underbalanced drilling considering aerated mud effects and downhole conditions. J. Petrol. Sci. Eng. 2018, 160, 229–246. [Google Scholar] [CrossRef]
- Shi, X.; Prodanović, M.; Holder, J.; Gray, K.E.; DiCarlo, D. Coupled solid and fluid mechanics modeling of formation damage near wellbore. J. Petrol. Sci. Eng. 2013, 112, 88–96. [Google Scholar] [CrossRef]
- Mirabolghasemi, M.; Prodanović, M.; DiCarlo, D.; Ji, H. Prediction of empirical properties using direct pore-scale simulation of straining through 3D microtomography images of porous media. J. Hydrol. 2015, 529, 768–778. [Google Scholar] [CrossRef]
- Khan, H.J.; Mirabolghasemi, M.S.; Yang, H.; Prodanović, M.; DiCarlo, D.A.; Balhoff, M.T. Study of formation damage caused by retention of bi-dispersed particles using combined pore-scale simulations and particle flooding experiments. J. Petrol. Sci. Eng. 2017, 158, 293–308. [Google Scholar] [CrossRef]
- Wang, G.; Pu, X. Discrete element simulation of granular lost circulation material plugging a fracture. Particul. Sci. Technol. 2014, 32, 112–117. [Google Scholar] [CrossRef]
- Tatone, B.S.; Grasselli, G. Quantitative measurements of fracture aperture and directional roughness from rock cores. Rock Mech. Rock Eng. 2012, 45, 619–629. [Google Scholar] [CrossRef]
- Tatone, B.S.; Grasselli, G. An investigation of discontinuity roughness scale dependency using high-resolution surface measurements. Rock Mech. Rock Eng. 2013, 46, 657–681. [Google Scholar] [CrossRef]
- Hong, E.S.; Kwon, T.H.; Song, K.I.; Cho, G.C. Observation of the degradation characteristics and scale of unevenness on three-dimensional artificial rock joint surfaces subjected to shear. Rock Mech. Rock Eng. 2016, 49, 3–17. [Google Scholar] [CrossRef]
- Kloss, C.; Goniva, C.; Hager, A.; Amberger, S.; Pirker, S. Models, algorithms and validation for opensource DEM and CFD-DEM. Prog. Comput. Fluid Dyn. 2012, 12, 140–152. [Google Scholar] [CrossRef]
- Yang, Y.; Liu, Z.; Sun, Z.; An, S.; Zhang, W.; Liu, P.; Yao, J.; Ma, J. Research on Stress Sensitivity of Fractured Carbonate Reservoirs Based on CT Technology. Energies 2017, 10, 1833. [Google Scholar] [CrossRef]
- Chen, Y.; Naoi, M.; Tomonaga, Y.; Akai, T.; Tanaka, H.; Takagi, S.; Ishida, T. Method for Visualizing Fractures Induced by Laboratory-Based Hydraulic Fracturing and Its Application to Shale Samples. Energies 2018, 11, 1976. [Google Scholar] [CrossRef]
- Zhu, W.; Chang, X.; Wang, Y.; Zhai, H.; Yao, Z. Reconstruction of Hydraulic Fractures Using Passive Ultrasonic Travel-Time Tomography. Energies 2018, 11, 1321. [Google Scholar] [CrossRef]
- Cundall, P.A.; Strack, O.D. A discrete numerical model for granular assemblies. Geotechnique 1979, 29, 47–65. [Google Scholar] [CrossRef]
- Basu, D.; Das, K.; Smart, K.; Ofoegbu, G. Comparison of Eulerian-Granular and discrete element models for simulation of proppant flows in fractured reservoirs. In Proceedings of the ASME 2015 International Mechanical Engineering Congress and Exposition, Houston, TX, USA, 13–19 November 2015. [Google Scholar]
- Zhu, H.P.; Zhou, Z.Y.; Yang, R.Y.; Yu, A.B. Discrete particle simulation of particulate systems: Theoretical developments. Chem. Eng. Sci. 2007, 62, 3378–3396. [Google Scholar] [CrossRef]
- Goniva, C.; Kloss, C.; Deen, N.G.; Kuipers, J.A.; Pirker, S. Influence of rolling friction on single spout fluidized bed simulation. Particuology 2012, 10, 582–591. [Google Scholar] [CrossRef]
- Jakub, P.; Bancewicz, M.; Koza, Z. Is Magnus effect relevant for proppant settling in narrow fractures? Energy Procedia 2017, 125, 443–449. [Google Scholar]
- Ai, J.; Chen, J.F.; Rotter, J.M.; Ooi, J.Y. Assessment of rolling resistance models in discrete element simulations. Powder Technol. 2011, 206, 269–282. [Google Scholar] [CrossRef]
- van der Hoef, M.A.; van Sint Annaland, M.; Deen, N.G.; Kuipers, J.A.M. Numerical simulation of dense gas-solid fluidized beds: A multiscale modeling strategy. Annu. Rev. Fluid Mech. 2008, 40, 47–70. [Google Scholar] [CrossRef]
- Di Felice, R. The voidage function for fluid-particle interaction systems. Int. J. Multiph. Flow 1994, 20, 153–159. [Google Scholar] [CrossRef]
- Zhang, F.; Zhu, H.; Zhou, H. Discrete-Element-Method/Computational-Fluid-Dynamics Coupling Simulation of Proppant Embedment and Fracture Conductivity After Hydraulic Fracturing. SPE J. 2017, 22, 632–644. [Google Scholar] [CrossRef]
- Xu, C.; Kang, Y.; Chen, F.; You, Z. Fracture plugging optimization for drill-in fluid loss control and formation damage prevention in fractured tight reservoir. J. Nat. Gas Sci. Eng. 2016, 35, 1216–1227. [Google Scholar] [CrossRef]
- Bokkers, G.A.; Annaland, M.V.S.; Kuipers, J.A.M. Mixing and segregation in a bidisperse gas–solid fluidised bed: A numerical and experimental study. Powder Technol. 2004, 140, 176–186. [Google Scholar]
- van der Hoef, M.A.; Beetstra, R.; Kuipers, J.A.M. Lattice-boltzmann simulations of low-reynolds-number flow past mono- and bidisperse arrays of spheres: Results for the permeability and drag force. J. Fluid Mech. 2005, 528, 233–254. [Google Scholar] [CrossRef]
- Beetstra, R.; van der Hoef, M.A.; Kuipers, J.A.M. Drag force of intermediate Reynolds number flow past mono- and bidisperse arrays of spheres. AIChE J. 2007, 53, 489–501. [Google Scholar] [CrossRef]
- Wang, G.; Cao, C.; Pu, X.; Zhao, Z. Experimental investigation on plugging behavior of granular lost circulation materials in fractured thief zone. Particul. Sci. Technol. 2016, 34, 392–396. [Google Scholar] [CrossRef]
- Al-Saba, M.T.; Nygaard, R.; Saasen, A.; Nes, O.M. Lost Circulation Materials Capability of Sealing Wide Fractures. In Proceedings of the SPE Deepwater Drilling and Completions Conference, Galveston, TX, USA, 10–11 September 2014. [Google Scholar]
- Al-Saba, M.T.; Nygaard, R.; Saasen, A.; Nes, O.M. Laboratory Evaluation of Sealing Wide Fractures Using Conventional Lost Circulation Materials. In Proceedings of the SPE Annual Technical Conference and Exhibition, Amsterdam, The Netherlands, 27–29 October 2014. [Google Scholar]
- Razavi, O.; Vajargah, A.K.; Oort, E.V. Optimum particle size distribution design for lost circulation control and wellbore strengthening. J. Nat. Gas Sci. Eng. 2016, 35, 836–850. [Google Scholar] [CrossRef]
- Lu, G.; Third, J.R.; Müller, C.R. Discrete element models for non-spherical particle systems: From theoretical developments to applications. Chem. Eng. Sci. 2015, 127, 425–465. [Google Scholar] [CrossRef]
Figure 1.
The schemes of (a) drilling fluid loss and (b) lost circulation control while drilling.
Figure 2.
The (a) measurement system and (b) specimen.
Figure 3.
Fracture surface scanning and aligning process.

Figure 4.
Geometric model of numerical simulation.
Figure 5.
Fracture aperture contour.
Figure 6.
Numerical model at different mesh size.
Figure 7.
The lowest porosity of all of the fluid mesh cells at different simulation moment.
Figure 8.
The LCM particle transport and plugging process.
Figure 9.
LCM particles formed the plugging zone preventing pressure propagation.

Figure 10.
Drilling fluid pressure distribution of the fracture’s middle section along the length of the fracture.
Figure 10.
Drilling fluid pressure distribution of the fracture’s middle section along the length of the fracture.

Figure 11.
The differences between the monodisperse system and the polydisperse system.

Figure 12.
The distributions of different diameter LCM particles at the end of the simulation.
Figure 13.
The front edges of the plugging zone with different particle sizes.
Figure 14.
The drilling fluid loss rate at different simulation moments.
Figure 15.
The distributions of plugging zone with 0.2 mm diameter LCM particles at different volume concentrations.
Figure 15.
The distributions of plugging zone with 0.2 mm diameter LCM particles at different volume concentrations.
Figure 16.
The effect of LCM shape on plugging.
Figure 17.
The multi-particle bridging and force chain of LCM particles.

Table 1.
Property parameters in the numerical simulation.
| Drilling Fluid Density (Kg/m3) | Drilling Fluid Viscosity (mPa·s) | LCM Density (Kg/m3) | LCM Young’s Modulus (MPa) | LCM Poisson Ratio | LCM Friction Coefficient | LCM Restitution Coefficient | Gravity (m/s2) |
|---|---|---|---|---|---|---|---|
| 1640 | 30 | 2200 | 1000 | 0.25 | 0.3 | 0.5 | 9.8 |
Table 2.
Simulation results of this study and those of other literature.
| Literature | Experiment Description | Experiment Results | Simulation Results |
|---|---|---|---|
| Wang [39] | Tapered slots size: 2.3 mm at inlet and 1.1 mm at outlet; LCM size: 0.45–1.4 mm. | The plugging depth depends on the values of D50 and D90; the large D50 and D90 values result in a shallow plugging depth in the fracture. | As shown in Figure 13, the front edge of the plugging zone forms at the fracture aperture isopleth, which has the same value as the LCM particles’ diameter. |
| Al-Saba [40] | Tapered slots size: 2.5–5 mm at inlet and 1–2 mm at outlet; LCM size (D50): 0.005–2.3 mm. | Irregular LCM such as nut shells are capable of sealing wide fractures. | As shown in Figure 16a,b, the irregularity of LCM particles result in LCM multi-particle bridging, where the fracture aperture is larger than the size of the LCM. |
| Al-Saba [41] | A high concentration of larger particles resulted in a screening out at the fracture. | As shown in Figure 16c–j, with the increase in LCM concentration, LCM piles up at the fracture inlet and makes it more difficult for LCM to enter the fracture. |
© 2018 by the authors. Licensee MDPI, Basel, Switzerland. This article is an open access article distributed under the terms and conditions of the Creative Commons Attribution (CC BY) license (http://creativecommons.org/licenses/by/4.0/).
Share and Cite
MDPI and ACS Style
Feng, Y.; Li, G.; Meng, Y.; Guo, B. A Novel Approach to Investigating Transport of Lost Circulation Materials in Rough Fracture. Energies 2018, 11, 2572. https://doi.org/10.3390/en11102572
AMA Style
Feng Y, Li G, Meng Y, Guo B. A Novel Approach to Investigating Transport of Lost Circulation Materials in Rough Fracture. Energies. 2018; 11(10):2572. https://doi.org/10.3390/en11102572
Chicago/Turabian StyleFeng, Yi, Gao Li, Yingfeng Meng, and Boyun Guo. 2018. "A Novel Approach to Investigating Transport of Lost Circulation Materials in Rough Fracture" Energies 11, no. 10: 2572. https://doi.org/10.3390/en11102572
Note that from the first issue of 2016, this journal uses article numbers instead of page numbers. See further details here.