Article

Design Considerations for the Electrical Power Supply of Future Civil Aircraft with Active High-Lift Systems

1
Institute for Drive Systems and Power Electronics, Leibniz Universität Hannover, 30167 Hannover, Germany
2
Institute of Electric Power Systems, Leibniz Universität Hannover, 30167 Hannover, Germany
3
Institute of Turbomachinery and Fluid Dynamics, Leibniz Universität Hannover, 30167 Hannover, Germany
4
Institute of Energy and Systems Engineering, TU Braunschweig, 38106 Braunschweig, Germany
*
Authors to whom correspondence should be addressed.
These authors contributed equally to this work.
Energies 2018, 11(1), 179; https://doi.org/10.3390/en11010179
Submission received: 15 December 2017 / Revised: 8 January 2018 / Accepted: 9 January 2018 / Published: 11 January 2018
(This article belongs to the Special Issue Towards a Transformation to Sustainable Aviation Systems)

Abstract

:
Active high-lift systems of future civil aircraft allow noise reduction and the use of shorter runways. Powering high-lift systems electrically have a strong impact on the design requirements for the electrical power supply of the aircraft. The active high-lift system of the reference aircraft design considered in this paper consists of a flexible leading-edge device together with a combination of boundary-layer suction and Coanda-jet blowing. Electrically driven compressors distributed along the aircraft wings provide the required mass flow of pressurized air. Their additional loads significantly increase the electric power demand during take-off and landing, which is commonly provided by electric generators attached to the aircraft engines. The focus of the present study is a feasibility assessment of alternative electric power supply concepts to unburden or eliminate the generator coupled to the aircraft engine. For this purpose, two different concepts using either fuel cells or batteries are outlined and evaluated in terms of weight, efficiency, and technology availability. The most promising, but least developed alternative to the engine-powered electric generator is the usage of fuel cells. The advantages are high power density and short refueling time, compared to the battery storage concept.

1. Introduction

Future civil air traffic concepts need to address the conflict of rising passenger numbers and emission targets [1]. Small regional airports offer additional capacities and could be used by short take-off and landing aircraft. In order to increase the number of flights of an airport, the acceptance among residents is important. This requires an overall reduction of flight noise in the vicinity of the airport [2]. As the bulk of aerodynamic noise emerges during take-off and landing, aircraft with steeper climb and landing trajectories are capable of reducing the perceived noise levels on the ground. In this context, the performance of the high-lift system is crucial. For this purpose, a reference aircraft was designed, applying various advanced technologies [3]. The present investigation focuses on the electric power supply design for the turboprop version of the reference aircraft, which is illustrated in Figure 1 with the performance and mission data given in Table 1 [4].
An essential feature of the reference aircraft is its active high-lift system, which comprises a flexible wing leading-edge device (‘droop nose’) [5], and a combination of boundary layer suction on the airfoil and Coanda jet blowing at the flap [6]. The required mass flow of pressurized air is provided by six electrically driven compressors, which are distributed along each wing of the aircraft [7,8]. This concept of a wing-integrated electrically powered high-lift system (EPHLS) is shown in Figure 2 [9]. As the required air mass flow varies, depending on the position of the flap along the span, an individual design is necessary for each compressor. In order to provide a time-efficient design procedure for alternating boundary conditions, an automatic design procedure utilizing multi-disciplinary optimization is used to design the compressor stages [10]. To achieve a compact and efficient design of the EPHLS, a high-speed permanent magnet synchronous machine is developed to directly drive the compressor [11]. A compact voltage source inverter (VSI) based on highly-efficient unipolar silicon carbide metal oxide semiconductor field-effect transistors (SiC-MOSFETs) is designed as well (see Section 2.1.1).
The EPHLS is used only during take-off, approach, and landing for a maximum time of 300 s (including the scenario of a touch-and-go maneuver). For this reason, using only the compressor inflow air as a coolant for the electrical machine and the power electronics is sufficient [9]. The power consumption of the EPHLS is estimated at 956 kW for both wings. Adding an additional consumption of about 110 kW due to ancillary loads leads to the total direct current (DC) power demand of the power supply system. If the electric power is provided by generators, one generator per turboprop is required for the event of an engine failure, which corresponds to a safety margin of 100%. Considering also the efficiency of the rectifier, the installed power of this state-of-the-art concept is 2.18 MW. Each of the two turboprop engines of the reference aircraft has a weight of 1513 kg and a shaft power of 12.8 MW [4], which means that the electric generator requires nearly 9% of the engine power. Due to the negligible operation time of the EPHLS compared to the engine operation time, both the generator and the engine are highly oversized. Reducing the required shaft power for the generator would increase the available power for thrust generation during take-off, or could allow for the use of a smaller engine. Furthermore, a distributed energy supply, independent from the aircraft engines, would allow a reduction of the safety margin to 50%, yielding a required power supply of 1.63 MW.
For this reason, the potential of using alternative power supply concepts is evaluated in the present study. The concepts use batteries or fuel cells for the energy supply in order to either replace the electric generator completely or to reduce the required generator power significantly.

2. Methodology

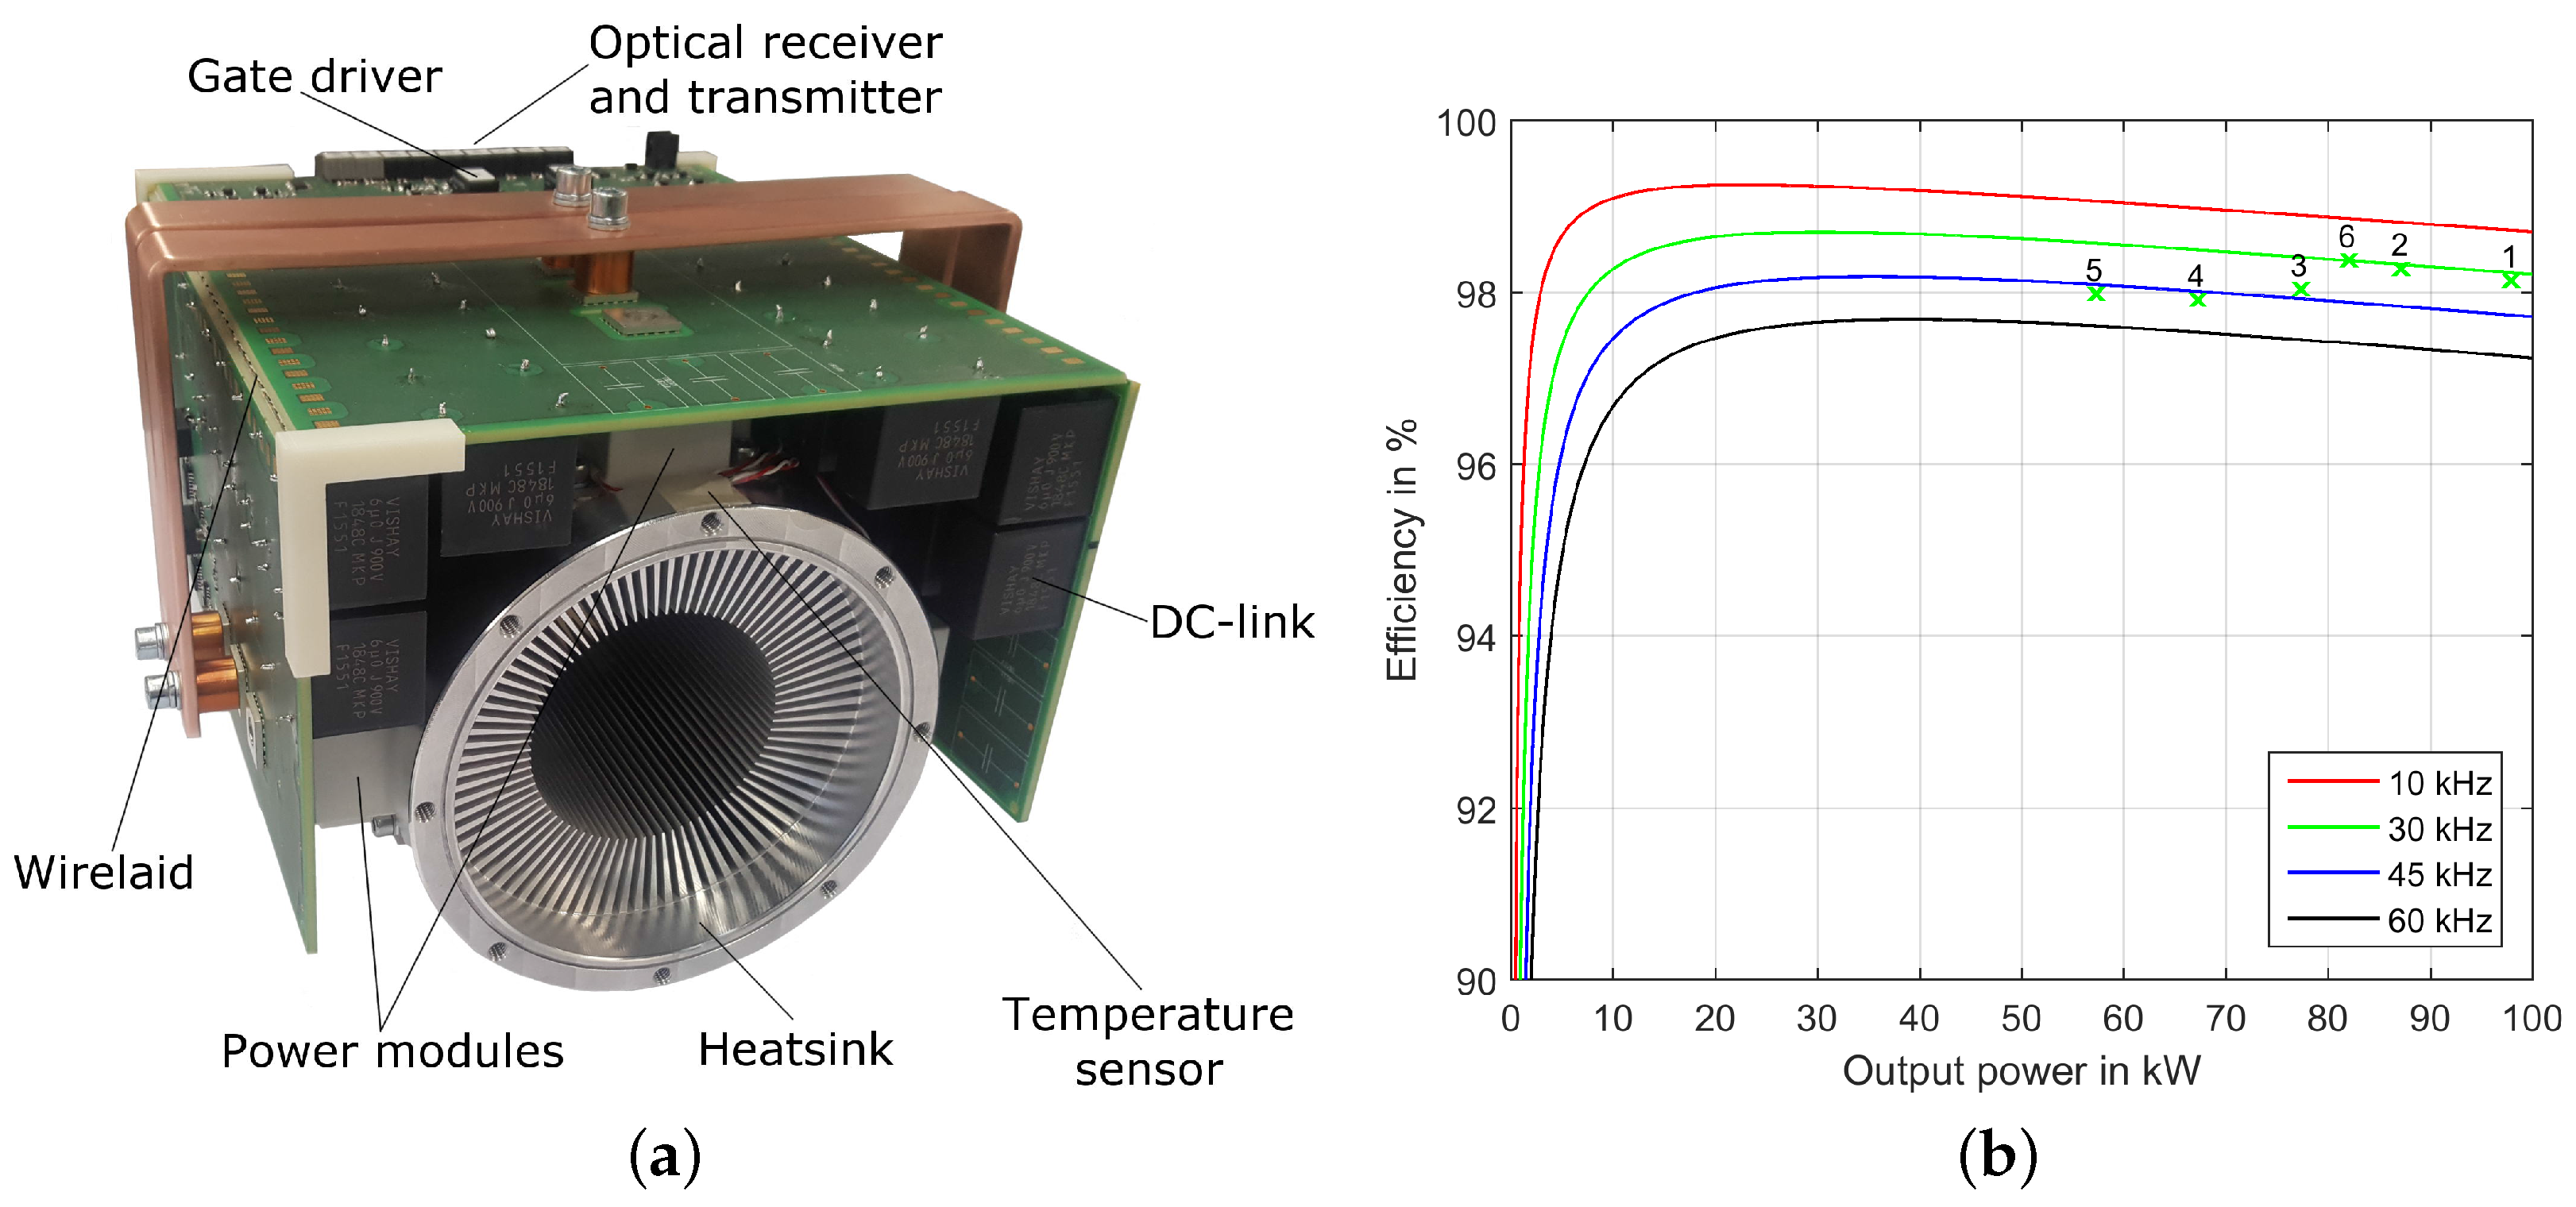
For the first step of the concept evaluation of different power supplies, the components are designed in order to assess their key parameters. Taking into account the required power for the compressor-unit of the EPHLS and the efficiency of electrical machine and inverter, the DC power demand is calculated, which is the basis for the comparison.

2.1. Power Electronics and Cable Design

2.1.1. Electric Power Demand of EPHLS

The reference data and design of the power electronics required for flap 6 of the advanced high-lift system is taken from [12]. This system was chosen for the prototype, as it offers the most demanding operating point regarding the compressors mass flow rate, rotational speed and power demand. Nevertheless, the EPHLS for flap 1 offers the highest electric power demand. Here, the 100 kW air-cooled inverter design is presented with the final setup shown in Figure 3a. The three-phase two-level voltage source inverter topology is based on SiC-MOSFET power modules in half bridge configuration mounted on an circular heat sink. By using the innovative power module arrangement and DC link design, a power density of 10.8 kW/L is achieved.
The power electronics efficiency is calculated taking into account conduction and switching losses of the MOSFET. The switching energies are derived by double pulse switching tests and an analytical model is obtained to describe the dependencies of DC link voltage, conducted current, and ambient temperature. The calculated inverter efficiency for flap 6 (fixed power factor cos φ = 0.8024 and efficiency of the electrical machine η E M = 97.5 % ) is shown in Figure 3b for a variation of output power as a solid line to demonstrate the trend. In the part-load area, a decrease of efficiency can be recognized, which is due to the switching losses being present even at lower switched currents. At full-load, the impact of the conduction losses increases due to the ohmic on-state characteristic of the MOSFET. With increasing switching frequency, the share of the switching losses on the total losses also rises, leading to a reduced inverter efficiency. Nevertheless, a high switching frequency is beneficial regarding the passive component design as e.g., the required DC link capacitance decreases, resulting in a reduction of component volume and costs. On the other hand, a minimum switching frequency can be derived by taking into account the rotational speed and pole pairs of the electrical machine, leading to the required inverter output frequency. As a trade-off between the contrary trends and impacts of the switching frequency on the system design, a value of f s = 30 kHz is chosen for the following calculations.
Figure 3b also shows the inverter efficiencies calculated according to Table 2 for different power demands, power factors, and efficiencies of the electrical machines of flap 1...6. EPHLS 6 reaches the highest efficiency of 98.4%, whereas the lowest value of 97.9% can be observed for flap 4. In general, the decreased power factor of machine 4 increases the current stress of the power electronics and thus also increases the losses. As a first assumption, this inverter is used for all 12 high-lift systems, as it is also suitable to satisfy the highest power demand of compressor 1. The resulting mean junction temperature T j , m in Table 2 of the MOSFET is calculated with the thermal resistance of the heatsink R t h , c a = 0.86 K/W from [12], the datasheet value for R t h , j c , the presented power losses, and a fluid inlet temperature of T f = 50 C . The maximum permissible junction temperature of T j , m a x = 150 C is not reached for any compressor unit.

2.1.2. DC–DC Converter Design

DC–DC converters are needed to connect the electric power sources, i.e., batteries or fuel cells, to the electric grid of the aircraft. The previous electric system design from [7] was based on a DC link voltage of 600 V as a power distribution grid. This voltage level leads to an acceptable utilization of the 1.2 kV semiconductors and is in accordance with the cable voltage rating presented in Section 2.1.4. Furthermore, it was concluded that a high voltage level of the system reduces the conductor weight of the cable, as DC power transfer is advantageous. In addition, the motor design can be optimized, especially at higher motor speeds and output frequencies, as used for the EPHLS because of a possible increase of turns in the motor windings. The battery voltages are usually lower than that, for example, around 300 V in electric vehicles [13], and the voltages also depend on the state of charge (SoC) (see Section 2.2). Therefore, a DC–DC boost converter has to be placed between the battery and the DC link distribution grid. By using the same fluid cooling circuit for the boost converter as well as for the battery storage and the fuel cell, a high power density is achieved. As reference, the 200 kW boost converter design from [14] is used with an efficiency of about η D C D C = 98 % . This approach is scaled linearly in terms of mass with output power using a valid parallelization of the converters. The mass m D C D C of the DC–DC converter can be calculated with the transferred power P D C D C to
m D C D C = 0.016 kg kW P D C D C .

2.1.3. Rectifier Design

In case of the electric power being provided by generators, rectifiers are needed as shown in Figure 4 to feed the power into the DC distribution grid. As reference data for the present study, the power density from the converter presented in [13] is used in accordance with Equation (2) for a fluid cooling approach, which can be also used by the electric generator. The efficiency of the rectifier is assumed to be η r e c = 98 % .
m r e c = 0.017 kg kW P r e c

2.1.4. Cable Design

The cable dimensions for the distribution grid are generally taken from [7] for the reference configuration with two large generators and are adapted to the new distribution system layout presented in Section 3.2 and Section 3.3. This is necessary, as the cable length l c a b as well as the power throughput P c a b changes between the concepts, leading to different conductor cross sections A c a b and thus cable masses m c a b on the DC and alternating current (AC) site. A nickel-plated aluminum aircraft cable from [15] with a 600 V isolation rating and up to 2 kHz frequency rating was taken, offering a high thermal capacitance and comparably low losses. In the present investigation, a worst-case transient design is performed taking into account self-heating of the cable for the short-time operation.
Table 3 shows all cables used in the power distribution grid with two large generators. The overall cable mass for the distribution grid summarizes to 81.8 kg with 67.6 kg DC and 14.2 kg AC transmission lines. A maximum power loss of 16.6 kW at 125 C has been calculated. The overall mass also includes the connections to the power modules and DC link terminals.
For the power distribution grid with batteries or fuel cells, the cables are redesigned and the resulting cable mass is summarized in Table 4. Here, two different concepts are compared: Concept a is a central, redundant system shown in Figure 5 with two fuel cells or batteries and two DC–DC converters. In this case, the cable mass summarizes to 38.9 kg with 34.5 kg DC and 4.4 kg AC transmission lines. Concept b is modularized into eight fuel cells/batteries of 204 kW (typical module size for busses) and eight DC–DC converters. This shrinks the cable cross section area required for every conductor, but increases the number of cables. For this approach, a total cable mass of 39.2 kg results with 34.8 kg DC and 4.4 kg AC transmission lines, which is comparable to Concept a. Since the cable masses of both concepts are comparable, a further detailed modelling of the distributed energy supply from the cable perspective is therefore not required in this paper.

2.2. Design of the Battery System

Different battery technologies have been applied for aircraft applications, e.g., Ni-Cd, lead-acid, and Li-ion (e.g., [16]). Thereof, Li-ion batteries provide the highest gravimetric energy as well as power density of these technologies. For this reason, it is currently the most promising energy storage technology with regard to electrification of aircraft. In the present article, two different battery systems are analyzed. At first, a state-of-the-art Lithium-Polymer cell (Li-Po) is considered as an example for current Li-ion batteries. As a perspective for future systems, Lithium-Sulfur cells (Li-S) are taken into account. They are currently under development and are a promising option for future applications. In general, the energy capacity and the available power of a specific battery cannot be designed separately. Therefore, a good match between the ratio of maximal needed energy divided by the required maximal power and the corresponding performance of a specific battery technology is important.
The dimensioning of the current technology is performed based on measurements of a specific battery cell. It is a pouch cell, which is designed for automotive applications. The specifications are given in Table 5. In order to determine the losses in high-power applications, constant power experiments were carried out. The methodology is described in detail in [17].
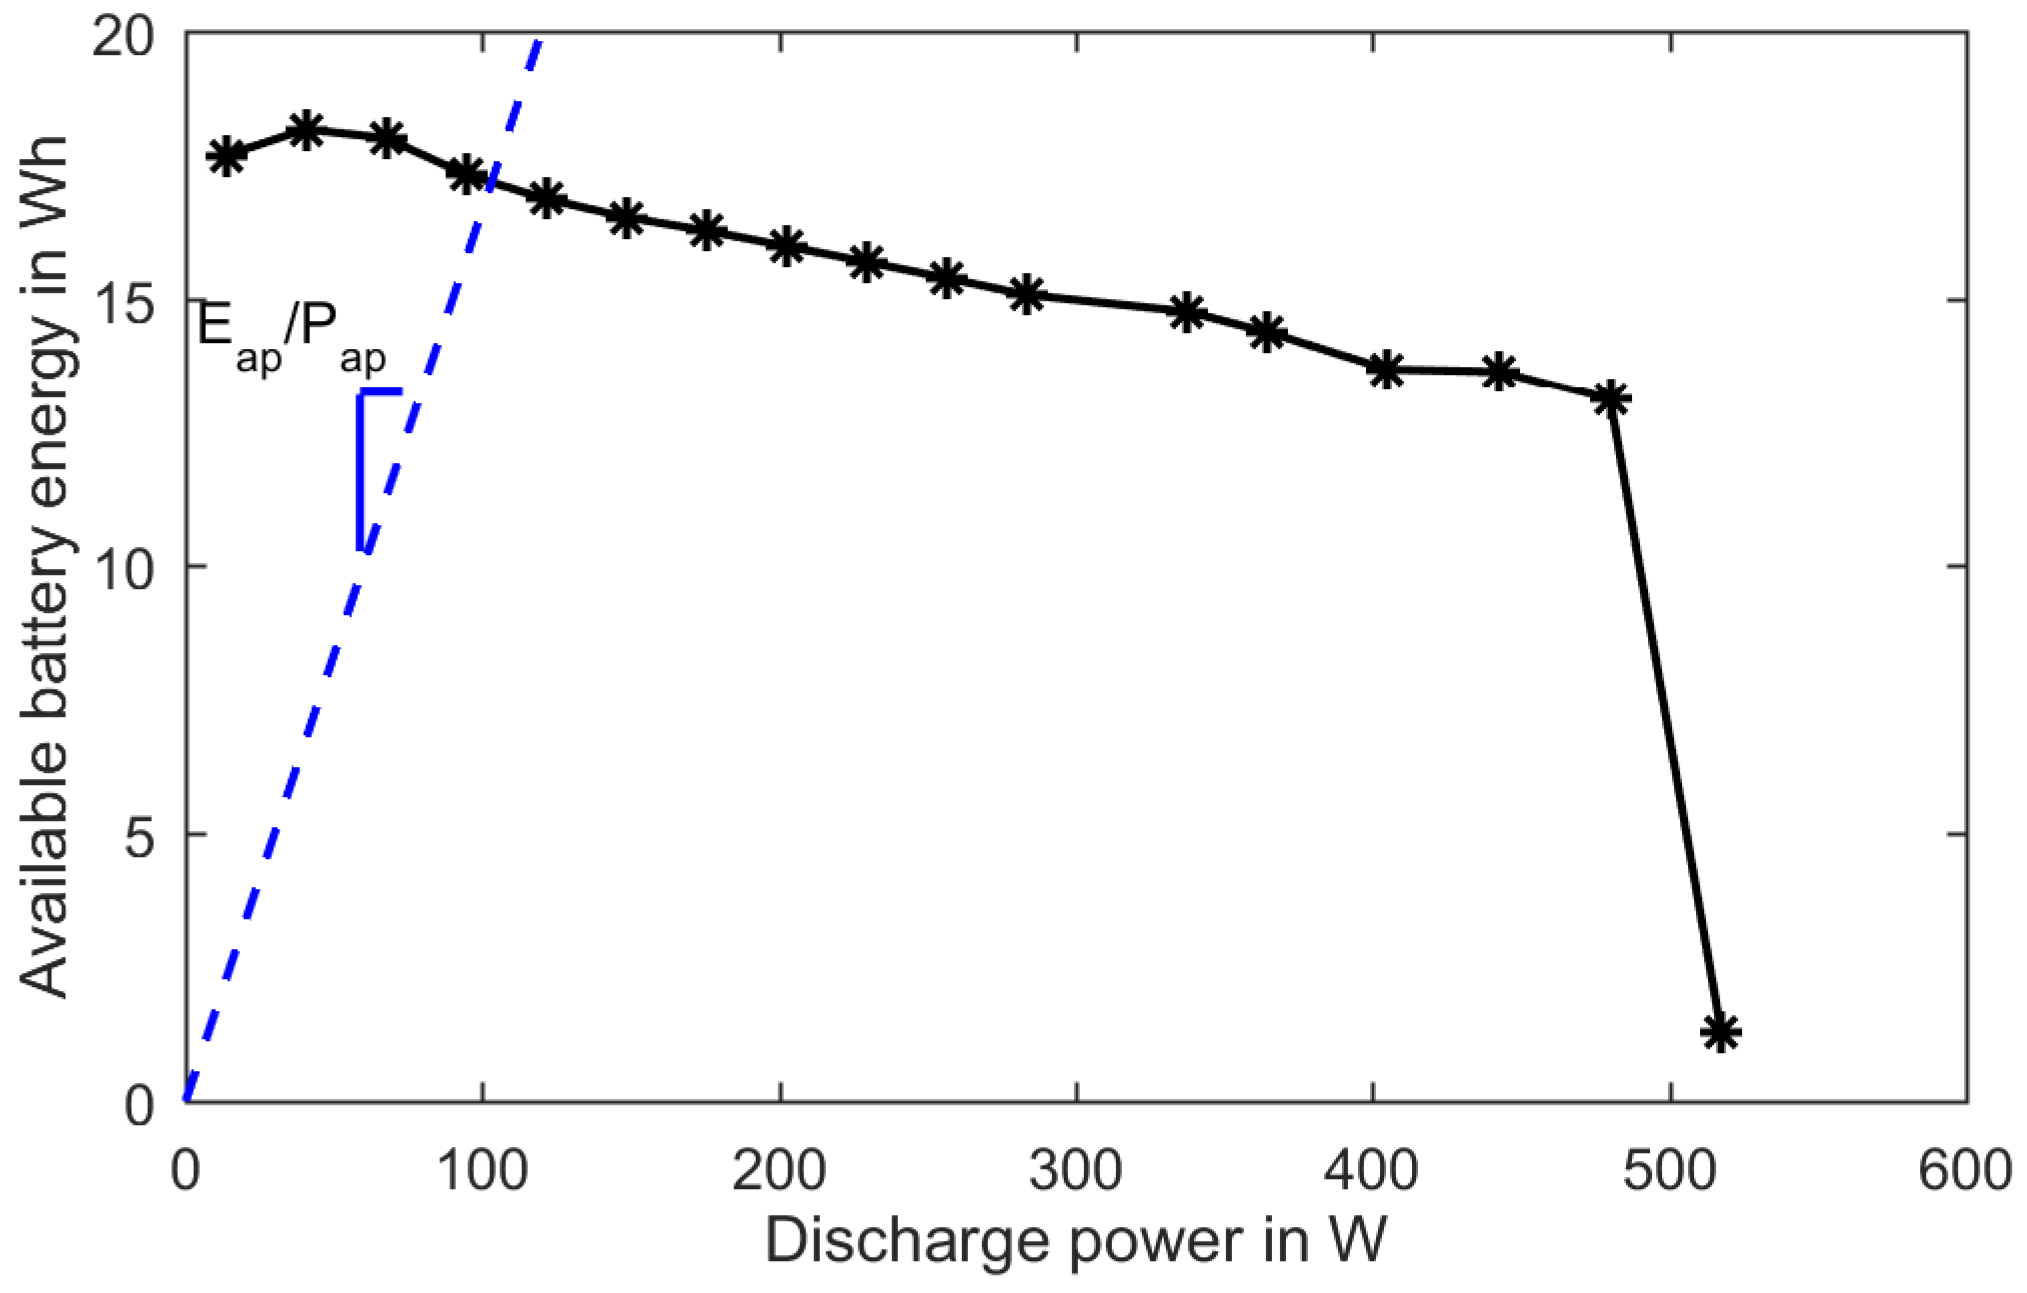
Figure 6 shows the available discharged energy in dependency of the load power, holding all operating parameters, such as minimal voltage and maximum current (see Table 5). In this diagram, the application requirements can be represented via a line with the slope of the needed energy divided by the required power ( E a p / P a p in h). The most useful design point of the energy storage is its intersection with the measured data, resulting in the corresponding available energy of a single cell E a v at a certain power. The necessary number of cells is determined via
n m i n = E a p + P b a t p e r i · t a p E a v .
Therein, E a p is the necessary energy of the application and P b a t p e r i are the losses due to peripheral components, such as pumps for the cooling system. Furthermore, t a p describes the time the application has to be served. The concrete architecture can be computed as follows: the number of cells in series connection x results from the necessary nominal voltage of the DC–DC converter U D C D C n and the maximal battery voltage U c e l l m a x :
x = U D C D C n / U c e l l m a x .
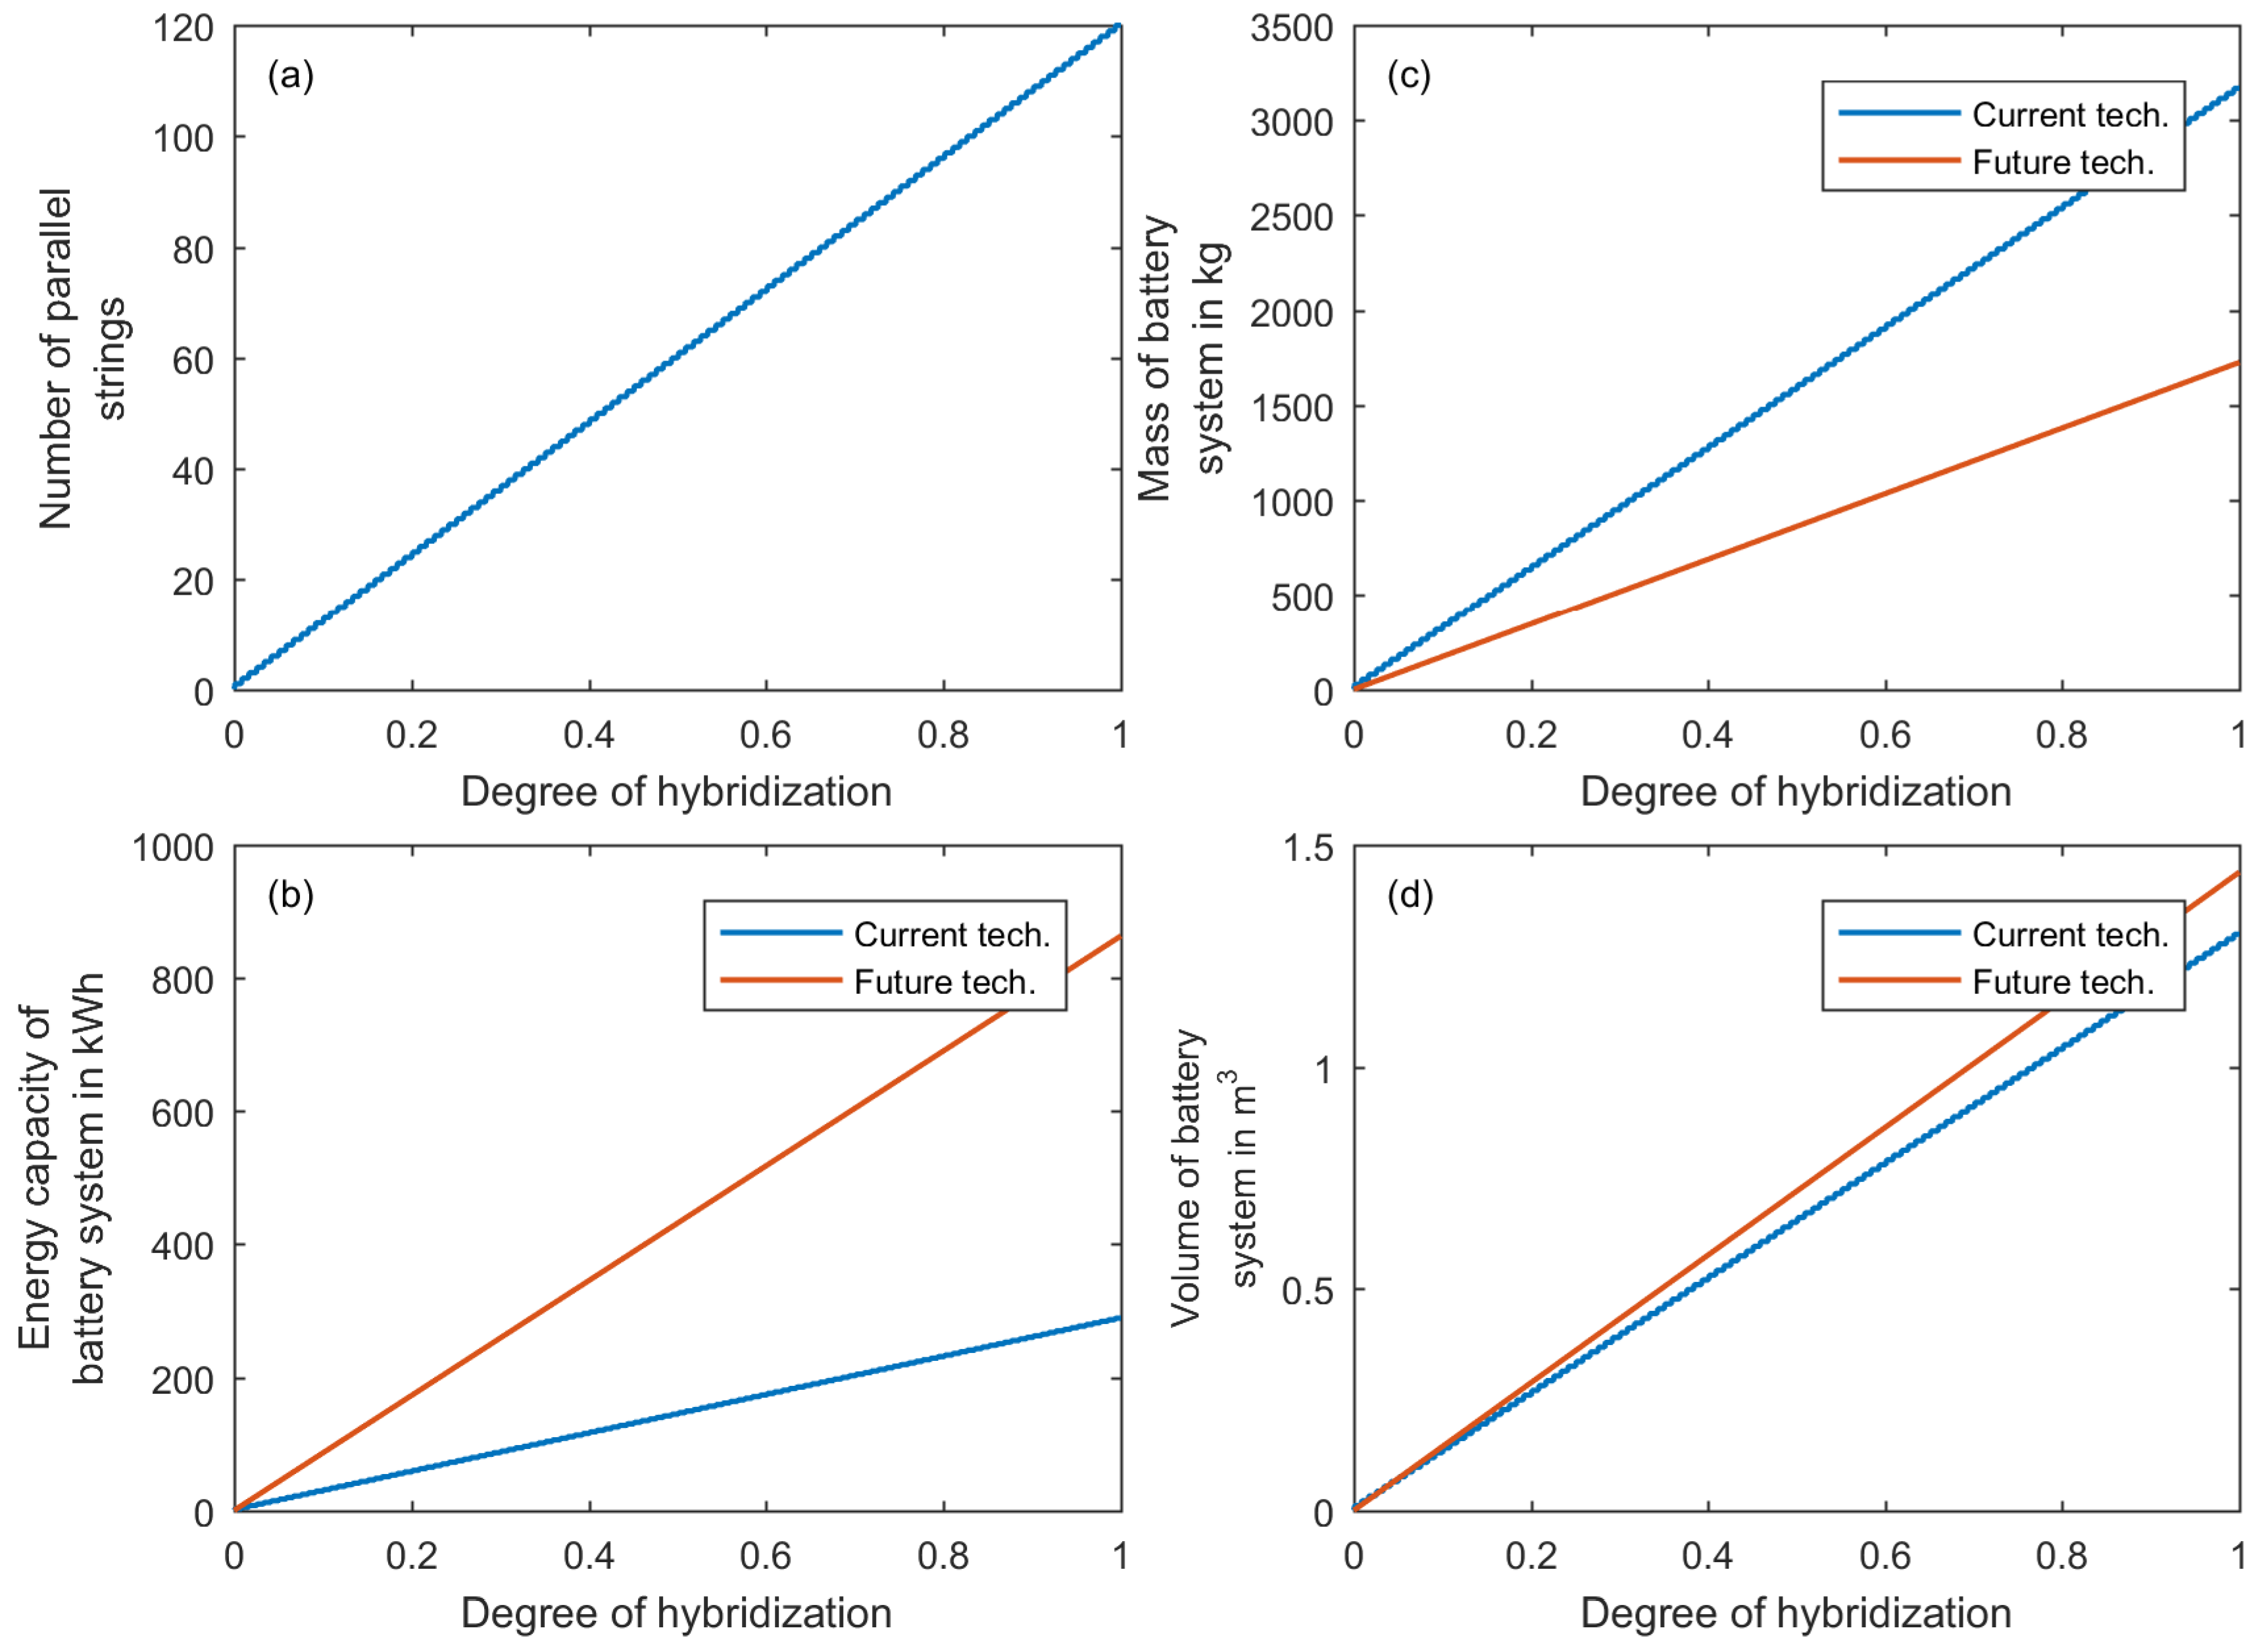
The number of parallel strings y is
y = n m i n / y .
The resulting number of cells is n = x · y .
In addition to the cells, the battery system consists of the battery management system and other electronic components, such as fuses, the housing and connectors of the single cells as well as a cooling/heating system to regulate the operating temperature. The thermal management is an important factor, since the ambient temperature varies extremely in dependency of the location of the aircraft and the weather. For the battery, an operating temperature between −20 and 55 C is necessary for the discharging process. However, the temperature influences the available energy of the battery. For the measurement shown, the ambient temperature is regulated to 20 C (results in Figure 6). For the charging process, the temperature window is often even narrower.
The power demand for these peripheral components P b a t p e r i is assumed to sum up to 8% of the application power [18], which results in an efficiency of η b a t p e r i = 92.6 % . This includes the losses in the DC–DC converter discussed in Section 2.1.2. In common automotive applications, the considered peripheral components increase the system weight by up to 43% of the cell weight [19]. Therein, a cooling system with water as well as electronic components as connectors, etc. are included. It is well known that an aircraft application has higher safety requirements. For this reason, the peripheral components could account for a much larger weight portion. Tariq et al. [16] estimated the weight of the peripheral systems by over 100% of the cell weight, for a small battery system for aircraft applications. This weight ratio is assumed to be smaller for large systems. For this reason, the value for automotive systems is used for the present analysis. The weight of the battery system can be calculated from the single cell accordingly:
m b a t , s y s = n · m c e l l · 1.43 .
In the same way, the volume of the battery system is computed as follows with the factor from [20]:
V b a t , s y s = n · V c e l l · 1.3 .
For the future technology Li-S, no commercial product can be measured, and thus the characteristics gathered from literature have to be taken into account. These are given for complete battery systems including cooling, electronics and housing. The characteristics of a system for the year 2035 are summarized in Table 6.
As described before, the needed energy capacity is either determined by the maximal power or by the energy that has to be supplied to the application:
E b a t = max E a p + P b a t p e r i · t a p , P a p ( P / E ) b a t m a x .
Mass and volume are determined from the specific parameters given in Table 6:
m b a t = e m · E b a t ,
V b a t = e v · E b a t .

2.3. Design of the Fuel Cell System

The fuel cell design process employs a polymer electrolyte fuel cell model that is as simple as possible while still covering all relevant processes in physically meaningful, macroscopic parameters. Kulikovsky was able to obtain an approximate but accurate analytical solution [24] to a well known model based on pioneering works of Perry, Newman and Cairns [25] as well as Eikerling and Kornyshev [26]. Using this analytical polarization curve has two main advantages: (1) the functional relationship between parameters and variables of interest is directly revealed; (2) the model has no computational limitations and can be included in larger model hierarchies, e.g., for aircraft design, aircraft fleet models or future aviation scenario modeling as well as the presented design process of the EPHLS.
In the model, the main losses of the fuel cell stem from the cathode catalyst layer. Ohmic losses are combined into one ohmic resistance, R Ω , which covers membrane, electric, and contact resistances. The anode losses are considered to be negligible. The model is parameterized with typical parameters outlined [
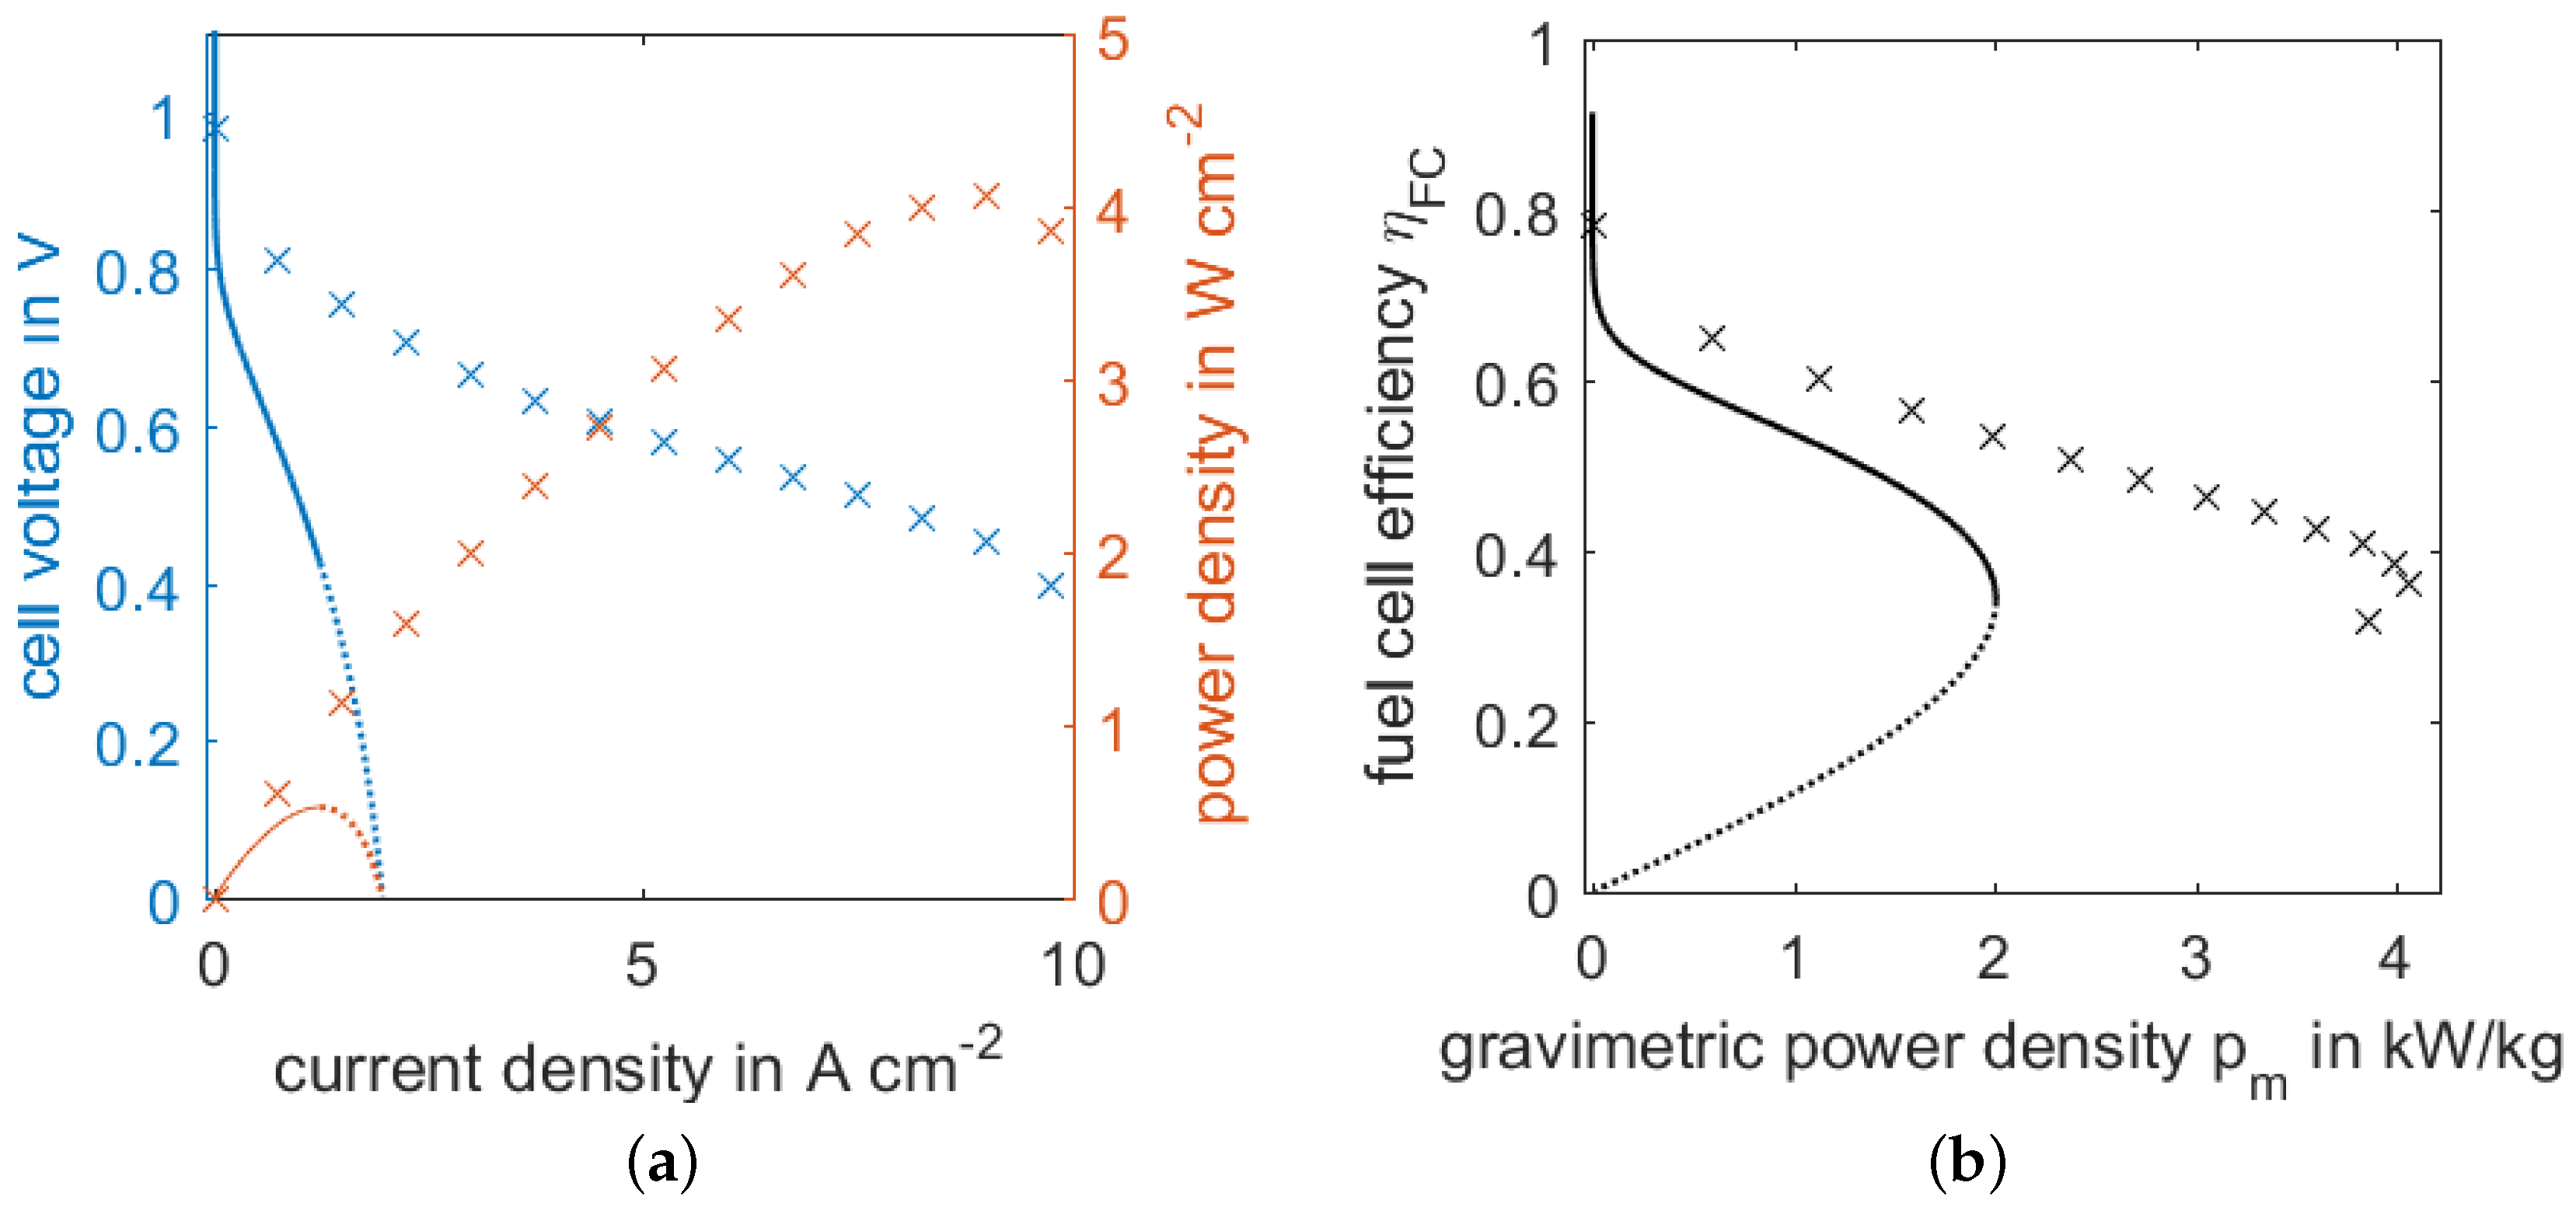
24] to simulate the current state-of-the-art fuel cell technology. For the gravimetric power density, the value of p m = 2 kW/kg achieved by current commercial Toyota Mirai fuel cell (FC) stacks is used [27]. In order to estimate the future technology, experimental polarization curves of the currently best-performing fuel cells on the lab-scale are used [28], achieving approximately p m = 4 kW/kg. Similar to the battery section, it is assumed that this technology might be available in 2035. The resulting characteristic curves used for the design process are shown in Figure 7. For a detailed discussion and derivation of these design curves, the reader is referred to [29]. The fuel cell is sized so that its maximum power equals the maximum required power, which includes converter and cable efficiencies and a safety factor of 50%. This safety factor puts the normal operating point of the fuel cell at 2/3 of the maximum power.
As outlined in [29], the fuel cell model is combined with a simplified compressor model and a detailed model for liquid hydrogen tanks. The mass of the hydrogen tank, m t a n k , is optimized for aviation application; model equations and a detailed discussion can be found in [30]. The compressor is designed for an operation at cruising altitude (10,000 m) and for temperature-controlled operation, i.e., to compress the air until it reaches operating temperature of the fuel cell, 80 C. This has the advantage that no heat exchanger is necessary for air-conditioning, but has the disadvantage of flexible input pressure. However, under aviation conditions, pressures suitable for fuel cell operation are reached [29]. The electric power required for this compressor is added to the required power, which in turn increases the size of the fuel cell. In this iterative way, the sizes of fuel cell and compressor are calculated. The compressor mass is calculated according to [7] as
m c m p = 34 kg + 0.058 kg kW · P m e c ,
where P m e c is the mechanical power the compressor exerts to provide the fuel cell with the required air mass flow with a stoichiometry of λ = 2 and an isentropic efficiency of 0.8.
The mass of the fuel cell is
m F C = p m · P a p + P c m p ,
where P c m p is the electric power required by the compressor. The mass of hydrogen can be calculated according to
m H 2 = ( P a p + P c m p ) t ˙ a p e m H 2 η F C ,
where e m H 2 = 120 MJ/kg is the energy density of hydrogen and η F C is the efficiency of the fuel cell at the working point according to Figure 7.

3. Results and Discussion

Based on the discussed methodology, the results of the concept evaluation are presented in the following sections. The results are evaluated in terms of weight, rated power, durability and operating concept.

3.1. Reference Concept: Turboprop Engine Integrated Generator

As a reference, the concept of two engine-integrated generators is proposed (see Figure 4). Teichel et. al. [7] showed the design of a permanent magnet synchronous generator (PMSG) used for the power supply of the EPHLS.
A concentrated winding is chosen instead of a distributed winding to lower the mass because of a smaller end-winding. Further reduction of the mass is achieved due to the direct coupling of generator and jet engine, i.e., the absence of a gear-box. The machine design has 24 slots and eight pole pairs. The rotational speed is rather low, so that the high torque requires a large bore diameter and high current density. This can be achieved through an innovative fluid cooling concept to realize current densities up to 25 A m m 2 . Figure 8 shows the cross-section of the machine with concentrated winding.
The power density of the PMSG outlined in [7] is
m P M S G = 0.072 kg kW P g e n + 35.3 kg
and is used as a reference case for the present study. The reference concept requires two generators with an electrical active output power of P g e n = 1.09 MW each as presented in the introduction. A further analysis of the power demand is summarized in Table 3, Section 2.1.4. Please note that the value for P c a b , A C c o s φ g e n is necessary for the cable dimensioning, as it also takes into account the power factor of the electrical generator cos φ g e n . Next, the mass of one PMSG can be calculated to 113.6 kg resulting in an overall mass of both generators of 227.2 kg. The rectifier design yields a weight of 2 × 18.5 kg according to Equation (2) and the distribution grid contributes 81.8 kg. The overall mass results in
m g e n 1 , s y s = m P M S G + m r e c + m c a b = 346 kg ,
excluding the components of the EPHLS, as they are contributing in every design case. Additionally, the efficiency of the different system designs is compared. The efficiencies of the single components are multiplied as follows, in order to determine the efficiency of the generation system:
η g e n 1 , s y s = η P M S G · η r e c · η c a b .
The efficiency of the PMSG results directly from the turbine efficiency, since the generator is placed directly on the same shaft. This in turn depends on the actual flight conditions, such as height, and varies from 0.24% to 0.36% [4]. For the following considerations, an average efficiency of 0.3 is assumed. Therefrom, the overall efficiency of the generation system results in 29%.

3.2. Small Generator and Battery Storage Energy Supply Concept

The second case is sketched in Figure 9. It is similar to the reference case (Figure 4) but contains additionally a battery system (BS) with a DC–DC converter. The PMSG is supposed to be designed smaller to supply only the residual load. Thus, the concept is a hybrid system. The overall target is a reduction of fuel consumption and therefore has less interference with the conventional aircraft turbine for propulsion.

3.2.1. Operational Strategy

For the design case, the full power needs to be provided for 300 s for take-off as well as for landing. The resulting load demand profile is shown in Figure 10.
For the cogeneration, this power profile needs to be divided between the PMSG and the battery storage. To reduce the mass of the generator, the power cut is chosen as shown in Figure 10 (grey line). Therein, P P M S G u s e d is the power needed from the generator and P b a t u s e d the one received from the battery. In the following, the degree of hybridization d h is used, which is defined as
d h = P b a t u s e d P P M S G u s e d + P b a t u s e d .
As described before, additional safety factors are assumed for both components, so that
P P M S G = P P M S G u s e d · 2
and
P b a t = P b a t u s e d · 1.5
holds. The required energy from the battery E a p results from the application time and safety margins, such that, in total, 900 s of P b a t u s e d has to be provided. These are the input values of the design procedure described in Section 2.2.

3.2.2. Battery System Design

For each possible degree of hybridization d h , the battery design is performed as described in Section 2.2. For the current technology, a single cell can provide 103 W and 17.2 Wh at the design point displayed at Figure 6. The cells will be connected, such that the input voltage of the DC–DC converter is as near as possible to the DC link voltage, which is designed with 600 V. Therefore, U D C D C n is 600 V, as well. For the current technology, there are 142 cells connected in series due to the nominal voltage of the DC–DC converter of 600 V (Equation (4)). The cells are combined in units called modules. For the design of the battery management system and other peripheral components, the single modules should be equal. Therefore, the number of serial cells is reduced to 140, such that, in each module, 10 cells are connected in series and then 14 modules are combined in one battery rack. Overall, this results in a maximal battery voltage of 588 V, a minimal voltage of 378 V and a nominal voltage of 518 V. The number of parallel cells depends on the degree of hybridization and is shown in Figure 11a (blue line). According to Equation (5), for a pure battery system ( d h = 1 ), 120 cells in parallel are necessary to provide the required energy. This results in an energy capacity of nearly 290 kWh (Figure 11b). The design is clearly limited by the power density and not by the energy density of the cells.
The future technology has a lower maximal voltage of 2.5 V, such that in total 240 cells have to be connected in series. In the same way, modules of 10 cells should be combined to racks of 24 modules. The number of parallel cells cannot be evaluated at this point because, in this analysis, no specific cell is defined. The energy capacity that has to be installed for the future technology is much larger (Figure 11b), since the maximal power per capacity of this technology is lower; 2 kW/kWh for future technology compared to 6 kW/kWh at the design point of the current technology. It results in an energy capacity of 863 kWh for the complete battery system.
From these results, mass and volume of the battery systems are evaluated and shown in Figure 11c,d. For the current technology, the overall mass for the battery system is 3168 kg with a volume of 1.3 m 3 for a system without generator. The future technology benefits from the better gravimetric energy density. The total mass of the battery system without a generator is 1727 kg, while the volume is slightly larger than that of the current technology due to the lower power density (Figure 11b).
Overall, the battery system can gain from future developments regarding the analyzed future technology of Li-S batteries. Nevertheless, for this application, the maximal power per energy capacity ( P / E ) b a t m a x is a limiting factor, such that the results are not as promising as expected. Instead, in such systems, additional energy capacity of 575 kWh can be provided. In times that the EPHLS is not needed, auxiliary service can be provided for the aircraft. Assuming a flight of 2.8 h, this results in an available average power of 200 kW that could eliminate additional auxiliary power generation.
Regarding the application of a battery in aircraft applications, the battery life time is a further important aspect because, in every flight, the battery is discharged and needs to be charged again. This means that one flight equals one cycle. Conventional Li-Ion batteries are able to perform on the order of 3000 cycles [31]. If the aircraft is used frequently, this is not sufficient, e.g., for three flights a day, the battery lasts 2.7 years. This aspect is the focus of current research. Furthermore, for the analyzed future technology, it is even worse, since Li-S cells currently have a problem with the cycling stability. Best results up today showed a cycling lifetime of 1500 cycles [32]. It is expected that this will be increased in the future, so that the technology becomes a viable alternative. In both cases, it should be considered that the batteries have less capacity after reaching the cycling limit. However, they can be further used afterwards in other on-ground applications, where the energy density is less important.

3.2.3. Influence of Hybridization

As discussed before, the motivation for including the battery is a reduction of fuel consumption and therefore a decrease of emissions. Efficiency for the hybrid generation system η g e n 2 , s y s results from the single efficiencies including the degree of hybridization as follows:
η g e n 2 , s y s = 1 d h η P M S G · η r e c + d h · η b a t · η b a t p e r i · η D C D C · η c a b .
The single values are given in Section 2. Additionally, the discharge efficiency of the battery η b a t can be computed from the shown measurements [17]. At the design point shown in Figure 6, it becomes η b a t = 95 % . The resulting system efficiency in dependence of the degree of hybridization is shown in Figure 12a. With increasing battery capacity, less energy has to be provided via the turboprop engine and thus the efficiency of the system increases.
However, this increase of efficiency has to be paid by additional mass and volume for the battery system (cf. Figure 11). For a uniform evaluation, the overall mass of the generation system is determined by
m g e n 2 , s y s = m P M S G + m r e c + m b a t , s y s + m D C D C + m c a b .
The single components are calculated with Equations (1), (2), (14) and (6) resp. (9). The total mass of the cables m c a b is taken as shown in Section 2.1.4. For the reference case, the cable mass was determined to 81.8 kg and, for a DC based system, 39 kg are found. Therefore, the influence on the overall system mass is low and hence it was not calculated explicitly for the different degrees of hybridization. The resulting system mass is shown in Figure 12b. The reduction of the generator power and replacement with batteries leads to an increase of the system mass. This is caused by the lower power density of the battery systems in comparison to the generators.
For the analyzed aircraft design, the maximum payload is 12,000 kg. Subtracting the passenger and baggage mass, the freight mass is 2200 kg [4]. This could be taken as a theoretical limit for the mass of the additional generation system, although a re-design of the aircraft could determine this limit more precisely. For the case that the complete freight mass of the reference aircraft is used for the battery, a maximal degree of hybridization of 0.6 is possible (see Figure 12b), whereas no additional freight can be transported. This means that, with current battery technology, it would not be possible to completely power the EPHLS. In the case of future technology, a degree of hybridization of 1 is possible. In this case, 300 kg are left for freight.
For a complete analysis, the influence of the additional mass on the fuel consumption of the turboprop engine during the flight needs to be evaluated as well as the influence of the smaller PMSG on the fuel efficiency of the turboprop engine or the mass reduction if the engine power is reduced. Nevertheless, as a first step, it is assumed that the additional mass substitutes freight mass and these aspects are not further analyzed in the present article.
Another limiting factor could be the available volume in the aircraft. The battery system could either be placed centrally as sketched in Figure 9 or be decentralized in the wings next to the compressors. Since, in the decentralized case, additional effort is necessary regarding the cooling system and the benefits from less cables are assumed to be low, this option is not further analyzed. According to the analyzed design, the fuselage has more than 10 m 3 unused freight space [4]. From the discussed generation system, only the battery system is placed in the fuselage. It takes in a maximum 1.3 m 3 resp. 1.4 m 3 of the free space. Due to the available volume, the battery system could be placed in the fuselage as well. No limitation results from this aspect.

3.3. Fuel Cell Energy Supply Concept

As a third concept, a fuel cell powered EPHLS as shown in Figure 5 is considered, in which the generator and AC/DC converter is replaced by two or eight fuel cells with corresponding DC/DC converters. For the fuel cell concept, no hybrid option is considered because replacing power from the fuel cell with power from the battery would increase the mass in any case, due to the lower power density of the battery.
The resulting design and performance figures of the fuel cell system powering the EPHLS are summarized in Table 7. Consistent with the previous sections, the total mass of the sytem is calculated using the component masses from Section 2.3 as
m g e n 3 , s y s = m F C + m H 2 + m t a n k + m c m p + m D C D C + m c a b .
The total mass of the fuel cell system including tank, fuel, compressor, rectifier, DC–DC-converter and cables is 1120.2 kg. With a future lightweight fuel cell, the total mass reduces to 650.8 kg. As the operating time of the EPHLS is short but high-powered, the energy storage, i.e., the hydrogen tank system, is small compared to the energy converter, i.e., the fuel cell. Hence, the overall mass of the system is dominated by the mass of the fuel cell. The power density of the fuel cell becomes the key performance indicator of the whole system. Hence, future research and development efforts should focus on designing lightweight, high power fuel cell stacks.
A further component is the compressor, which does not contribute significantly to weight but increases the power demand of the system significantly, thus in turn increasing the fuel cell weight. This negative feedback loop increases the power demand and thus the size of the fuel cell by about 15%, or in other words reduces the systems efficiency by η F C p e r i = 0.869 . The overall system efficiency,
η g e n 3 , s y s = η F C · η F C p e r i · η D C D C · η c a b ,
is 41.7% during high-lift operation. The efficiency of the fuel cell itself is ~50%, due to its operation at 2/3 maximum power.
When analyzing the tank system, it can be seen that the operating profile, shown in Figure 10, requires an unfavorable tank operation. After the start phase, no hydrogen is required during the flight for up to 2.8 h. During flight, the heat flow into the tank needs to be compensated by “venting” hydrogen. This vented hydrogen amounts to nearly 20% of the stored hydrogen. However, since the fuel cell would be similarly idle during that time, the vented hydrogen instead could be converted into electricity to power the on-board demand. This way, the fuel cell would deliver 41.8 kW during flight, nearly half the on-board demand. Of course, this amount can be increased by carrying more hydrogen; to deliver the full 110 kW over the 2.8 h, an additional 9.1 kg hydrogen would be necessary. Note that these calculations account for the varying efficiency of the fuel cell under different loads.
A further advantage of using the fuel cell also during flight is that this reduces degradation. Idling a fuel cell leads to a high cathode potential, which increases the rates of degradation mechanisms like Pt dissolution [33]. Operating the fuel cell under small load lowers the cathode potential, thus reducing degradation significantly, while at the same time converting hydrogen into electricity with a very high efficiency of 54% for delivering 110 kW with a conservatively performing fuel cell.

4. Conclusions

In this paper, three different concepts of electrical power supply systems for aircraft with EPHLS are evaluated. The reference configuration consists of two large generators, which are attached to the turboprop engines. The mass of the complete generation system is 346 kg with an efficiency of about 30%. By using batteries or fuel cells for the electric power supply, this efficiency can be increased significantly.
Using batteries for the power supply, the efficiency of the system can be increased to more than 80%. As the power density of batteries is inferior, the necessary mass for a battery-only supply system increases to 3350 kg, or 1900 kg for future Li-S technology in the year 2035. This exceeds the fright mass of the actual aircraft design. Thus, a hybrid solution would be preferable. Taking the maximum freight mass of the reference aircraft into account, a degree of hybridization of up to 0.6 is possible with currently available technology, or 1 with future technology. This would allow system efficiencies of about 60% or 80%, respectively. However, no or much less freight capacity would be left for additional cargo. The Li-S technology has a higher energy to power ratio. Since it is dimensioned to provide the full power required for the EPHLS, it could supply auxiliary loads while the EPHLS is not operating.
An alternative option is the application of fuel cells. A power generation system comprising a fuel cell and hydrogen tanks as well as further peripheral components could be realized with a total mass of 1120 kg for current and 651 kg for a future fuel cell (FC) technology in the year 2035, respectively. This is less than the complete battery system but more than the reference value. Using a fuel cell, the efficiency would be 41.7% during the high-lift phase. This efficiency could be increased further by oversizing the fuel cell. During the flight, i.e., when the high-lift system is not operated, it is beneficial to use the fuel cell to produce the on-board electricity. This has two advantages: first, the hydrogen that needs to be vented from the tank would be used, increasing overall efficiency. Second, fuel cell durability would be enhanced dramatically.
In conclusion, the efficiency of the power generation system can be increased by using batteries or fuel cells. Fuel cell systems are more promising in the long term due to their higher gravimetric power density, while batteries are easier to implement in the short term. An advantage of both alternative options is the potential to use energy from renewable sources. Using a conventional aircraft engine, the integration of renewable energy is only possible if synthetic fuels are used, which need to be produced with high effort. The additional mass of the battery or fuel cell systems compared to the generator system could be compensated by a downsizing of the aircraft engines and reduced fuel consumption due to a more efficient power supply. For a full comparison of the proposed energy systems, a re-design of the aircraft with the battery and fuel cell power supply options would be necessary. The present energy system designs are the first step; the next step would be to include these energy system designs into the aircraft design process. With this, it would be possible to compare vital characteristics like take-off mass, payload, fuel burn, direct operating costs and others.

Acknowledgments

The authors would like to thank the German Research Foundation (DFG) for supporting this research as part of the Collaborative Research Centre 880 (CRC 880). Furthermore, the authors would like to acknowledge the support of the Ministry for Science and Culture of Lower Saxony (Grant No. VWZN3177) for funding the research project “Energy System Transformation in Aviation” in the initiative “Niedersächsisches Vorab”.

Author Contributions

Jan-Kaspar Mueller and Gerrit Narjes performed the analysis of the electric power demand of the EPHLS and designed the converter, the cable distribution grid and the electrical machine. Astrid Bensmann and Boris Bensmann were responsible for the battery storage design. Thomas Kadyk was in charge of the fuel cell concept. Tore Fischer and Felix Kauth wrote the introduction. Bernd Ponick, Jörg R. Seume, Ulrike Krewer, Richard Hanke-Rauschenbach and Axel Mertens revised the paper.

Conflicts of Interest

The authors declare no conflict of interest.

Abbreviations

The following abbreviations and symbols are used in this manuscript:
BSBattery storage
EPHLSElectrically powered active high-lift system
FCFuel cell
MOSFETMetal oxide semiconductor field-effect transistor
PMSGPermanent magnet synchronous generator
SiCSilicon carbide
SoCState of charge
VSIVoltage source inverter

List of Symbols

A c a b Cable conductor cross section area
EEnergy
E a v , c e l l Available energy from single battery cell
e m Gravimetric energy density of battery storage
e v Volumetric energy denisty of battery storage
f s Switching frequency
I R M S Current root-mean-square value
l c a b Cable length
mMass
nNumber of battery cells
PPower
p m Gravimetric power density of fuel cell
( P / E ) b a t m a x Maximum power to energy ratio of battery technology
R Ω Ohmic resistance
R t h , j c Thermal resistance from junction to case
R t h , c a Heat sink thermal resistance from case to ambient
tTime duration
T f Fluid inlet temperature
T j Junction temperature
U c e l l m a x Maximal voltage of battery cell
U D C D C n Nominal voltage of DC–DC converter
xNumber of battery cells connected in serial
yNumber of battery cells connected in parallel
cos φ Power factor
η Efficiency

Subscripts and Superscripts

A C Alternating current
a p Application
b a t Battery storage (without peripheral components)
b a t , s y s Battery storage system (including peripheral components)
c e l l Battery single cell value
c a b Cable related value
c m p Compressor related value
D C Direct current
E M Electric motor related value
D C D C DC–DC converter related value
g e n Generator related value
i n v Inverter related value
m Mass specific
m a x Maximum
m e c Mechanical
m i n Minimum
p e r i Peripheral components
t a n k Tank related value
r e c Rectifier related value
v Volume specific

References

  1. European Commission. Flightpath 2050: Europe’s Vision for Aviation; Publications Office of the European Union: Luxembourg, 2011. [Google Scholar] [CrossRef]
  2. Henke, R.; Lammering, T.; Anton, E. Impact of an Innovative Quiet Regional Aircraft on the Air Transportation System. J. Aircr. 2010, 47, 875–886. [Google Scholar] [CrossRef]
  3. Radespiel, R.; Heinze, W. SFB 880: Fundamentals of High Lift for Future Commercial Aircraft. CEAS Aeronaut. J. 2014, 5, 239–251. [Google Scholar] [CrossRef]
  4. Radespiel, R.; Heinze, W.; Bertsch, L. High-Lift Research For Future Transport Aircraft; Deutscher Luft- und Raumfahrtkongress: Munich, Germany, 2017. [Google Scholar]
  5. Burnazzi, M.; Radespiel, R. Design and Analysis of a Droop Nose for Coanda Flap Applications. J. Aircr. 2014, 51, 1567–1579. [Google Scholar] [CrossRef]
  6. Burnazzi, M.; Radespiel, R. Synergies between Suction and Blowing for Active High-Lift Flaps. CEAS Aeronaut. J. 2015, 6, 305–318. [Google Scholar] [CrossRef]
  7. Teichel, S.H.; Dörbaum, M.; Misir, O.; Merkert, A.; Mertens, A.; Seume, J.R.; Ponick, B. Design Considerations for the Components of Electrically Powered Active High-Lift Systems in Civil Aircraft. CEAS Aeronaut. J. 2015, 6, 49–67. [Google Scholar] [CrossRef]
  8. Kauth, F.; Narjes, G.; Müller, J.; Seume, J.R.; Vasista, S.; Müller, T.; Francois, D.G.; El Sayed M., Y.; Semaan, R.; Behr, C.; et al. Progress in Efficient Active High-Lift. In Proceedings of the 35th AIAA Applied Aerodynamics Conference, Denver, CO, USA, 5–9 June 2017. [Google Scholar] [CrossRef]
  9. Kauth, F.; Narjes, G.; Müller, J.; Ponick, B.; Mertens, A.; Seume, J.R. Compact Electrical Compressors for Active Flow Control in Autonomous High-Lift Systems. In SFB 880—Fundamentals of High-Lift for Future Civil Aircraft: Biennial Report; Radespiel, R., Semaan, R., Eds.; TU Braunschweig—Campus Forschungsflughafen: Braunschweig, Germany, 2017; pp. 105–116. [Google Scholar]
  10. Teichel, S.H.; Verstraete, T.; Seume, J.R. Optimized Multidisciplinary Design of a Small Transonic Compressor for Active High-Lift Systems. JGPP 2017, 9. [Google Scholar]
  11. Narjes, G.; Müller, J.; Kauth, F.; Seume, J.; Mertens, A.; Ponick, B. Design Considerations for an Electrical Machine Propelling a Direct Driven Turbo Compressor for Use in Active High-Lift Systems. In Proceedings of the International Conference on Electrical Systems for Aircraft, Railway, Ship Propulsion and Road Vehicles & International Transportation Electrification Conference, Toulouse, France, 2–4 November 2016. [Google Scholar]
  12. Mueller, J.-K.; Mertens, A. Power Electronics Design for a direct-driven Turbo Compressor Used as Advanced High-Lift System in Future Aircraft aircraft. In Proceedings of the IEEE Industrial Electronics Society IECON17, Peking, China, 29 October–1 November 2017. [Google Scholar]
  13. Merkert, A.; Mueller, J.-K.; Mertens, A. Component Design and Implementation of a 60 kW Full SiC Traction Inverter with Boost Converter. In Proceedings of the 2016 IEEE Energy Conversion Congress and Exposition (ECCE), Milwaukee, WI, USA, 18–22 September 2016. [Google Scholar] [CrossRef]
  14. Kreutzer, O.; März, M.; Nakata, H. Full SiC DCDC-converter with a Power Density of more than 100 kW/dm3. In Proceedings of the European Conference on Silicon Carbide and Related Materials, Grenoble, France, 21–25 September 2014. [Google Scholar] [CrossRef]
  15. Nexans. Complete, Reliable Cables Range for Aircraft, Nexans AG, no. 8. 2011. Available online: http://www.nexans.fr/France/2011/BD_NEXANS_catal_aircraft_EN.pdf (accessed on 14 November 2017).
  16. Tariq, M.; Maswood, A.I.; Gajanayake, C.J.; Gupta, A.K. Aircraft batteries: Current trend towards more electric aircraft. ET Electr. Syst. Transp. 2017, 7, 93–103. [Google Scholar] [CrossRef]
  17. Sarpal, I.; Bensmann, A.; Hanke-Rauschenbach, R. Characterisation of Batteries with E–P–curves: Quantifying the Impact of Operating Conditions on Battery Performance. Int. J. Electr. Power Energy Syst. 2017. submitted. [Google Scholar]
  18. Vratny, P.C.; Kuhn, H.; Hornung, M. Influences of voltage variations on electric power architectures for hybrid electric aircraft. CEAS Aeronaut. J. 2017, 8, 31–43. [Google Scholar] [CrossRef]
  19. Birke, P.; Keller, M.; Schiemann, M. Electric battery actual and future battery Technology Trends. Electric Motion Prague. 2010. Available online: http://www.futureage.eu/files/dd33e86df1_prezentace_Birke.pdf (accessed on 14 November 2017).
  20. U.S. Department of Energy Advanced Battery Development. FY 2013 Annual Progress Report. 2013. Available online: https://energy.gov/sites/prod/files/2014/05/f15/APR13_Energy_Storage_d_III_Adv_Battery_ Dev_0.pdf (accessed on 14 November 2017).
  21. Nagata, H.; Chikusa, Y. All-Solid-State Lithium-Sulfur Battery with High Energy and Power Densities at the Cell Level. Energy Technol. 2016, 4, 484–489. [Google Scholar] [CrossRef]
  22. Hagen, M.; Hanselmann, D.; Ahlbrecht, K.; Maca, R.; Gerber, D.; Tubke, J. Lithium-Sulfur Cells: The Gap between the State-of-the-Art and the Requirements for High Energy Battery Cells. Adv. Energy Mater. 2015, 5. [Google Scholar] [CrossRef]
  23. Bruce, P.G.; Freunberger, S.A.; Hardwick, L.J.; Tarascon, J.-M. Li-O2 and Li-S batteries with high energy storage. Nat. Mater. 2012, 11, 19–29. [Google Scholar] [CrossRef] [PubMed]
  24. Kulikovsky, A.A. A Physically–Based Analytical Polarization Curve of a PEM Fuel Cell. J. Electrochem. Soc. 2014, 161, F263–F270. [Google Scholar] [CrossRef]
  25. Perry, M.L.; Newman, J.; Cairns, E.J. Mass Transport in Gas-Diffusion Electrodes: A Diagnostic Tool for Fuel-Cell Cathodes. J. Electrochem. Soc. 1998, 145, 5–15. [Google Scholar] [CrossRef]
  26. Eikerling, M.; Kornyshev, A.A. Modelling the Performance of the Cathode Catalyst Layer of Polymer Electrolyte Fuel Cells. J. Electroanal. Chem. 1998, 453, 89–106. [Google Scholar] [CrossRef]
  27. Yoshida, T.; Kojima, K. Toyota MIRAI Fuel Cell Vehicle and Progress toward a Future Hydrogen Society. Electrochem. Soc. Interface 2015, 24, 45–49. [Google Scholar] [CrossRef]
  28. Klingele, M.; Breitwieser, M.; Zengerle, R.; Thiele, S. Direct Deposition of Proton Exchange Membranes Enabling High Performance Hydrogen Fuel Cells. Catalyst Degradation in Fuel Cell Electrodes: Accellerated Stress Tests and Model-based Analysis. J. Mater. Chem. A 2015, 3, 11239–11245. [Google Scholar] [CrossRef]
  29. Kadyk, T.; Winnefeld, C.; Hanke-Rauschenbach, R.; Krewer, U. Analysis and Design of Fuel Cell Systems for Aviation. Energies 2017. submitted. [Google Scholar]
  30. Winnefeld, C.; Kadyk, T.; Krewer, U.; Hanke-Rauschenbach, R. Modelling and Designing Cryogenic Hydrogen Tanks for Future Aircraft Applications. Energies 2018, 11, 105. [Google Scholar] [CrossRef]
  31. Ren, G.; Ma, G.; Cong, N. Review of electrical energy storage system for vehicular applications. Renew. Sustain. Energy Rev. 2015, 41, 225–236. [Google Scholar] [CrossRef]
  32. Song, M.-K.; Zhang, Y.; Cairns, E.J. A long-life, high-rate lithium/sulfur cell: A multifaceted approach to enhancing cell performance. Nano Lett. 2013, 13, 5891–5899. [Google Scholar] [CrossRef] [PubMed]
  33. Urchaga, P.; Kadyk, T.; Rinaldo, S.G.; Pistono, A.O.; Hu, J.; Lee, W.; Richards, C.; Eikerling, M.H.; Rice, C.A. Catalyst Degradation in Fuel Cell Electrodes: Accellerated Stress Tests and Model-based Analysis. Electrochim. Acta 2015, 176, 1500–1510. [Google Scholar] [CrossRef]
Figure 1. Turboprop reference aircraft REF2. Adapted from [4].
Energies 11 00179 g001
Figure 2. Concept of the electrically powered high-lift system (EPHLS) integrated into the wing. Figure from [9].
Energies 11 00179 g002
Figure 3. Inverter design for EPHLS and efficiency calculation. (a) reference inverter design with 100 kW [8]; (b) inverter efficiency for the six advanced high-lift systems and different switching frequencies from 10 up to 60 kHz.
Energies 11 00179 g003
Figure 4. Basic concept: jet engine with electric generator (G l , G r ). Figure from [7].
Energies 11 00179 g004
Figure 5. Concept: central fuel cell.
Energies 11 00179 g005
Figure 6. Available battery energy depending on load power for analyzed cell (current technology) at 20 C; measurement were performed according to method in [17].
Energies 11 00179 g006
Figure 7. Characteristic curves used for the fuel cell design employing current and future fuel cell technology. Lines are simulations of the experimentally-fitted model of Kulikovsky [24] (current technology); dashed lines mark the region after the maximum power point, which is not recommended for operation due to reduced efficiency. Crosses are experimental values of [28] (future technology of 2035). (a) polarization and power curves of the present (solid) and future (crosses) fuel cells; (b) efficiency-power density curves of the present (solid) and future (crosses) fuel cells.
Energies 11 00179 g007
Figure 8. Cross-section of permanent magnet synchronous generator (PMSG) with concentrated winding.
Energies 11 00179 g008
Figure 9. Concept: jet engine with mounted generator (G l , G r ) and central battery storage (BS).
Energies 11 00179 g009
Figure 10. Required load profile for EPHLS and ancillary loads for take-off and landing with flight duration t f (blue) and hybridization between battery and PMSG.
Energies 11 00179 g010
Figure 11. Influence of degree of hybridization for current (blue) and future technology in 2035 (red) on (a) number of parallel strings for current technology; (b) energy capacity of battery systems; (c) mass of battery systems; (d) volume of battery system.
Energies 11 00179 g011
Figure 12. Influence of degree of hybridization on (a) efficiency (b) mass in kg for additional power generation system.
Energies 11 00179 g012
Table 1. Performance and mission data of the turboprop reference aircraft. Data from [4].
Passenger number100
Range2000 km
Required runway length844 m
Cruising Mach number0.74
Max. take-off mass42,178 kg
Table 2. Inverter design parameters.
Location P mech η EM cos φ I RMS η inv T j , m
kW%A% C
Flap 19597.00.77518198.1126.4
Flap 28597.50.78615998.3112.9
Flap 37597.00.69216098.0113.6
Flap 46596.60.63515297.9108.7
Flap 55596.00.62013298.098.3
Flap 68097.50.80214798.4105.8
Table 3. Cable properties for large generator.
DC TransmissionAC Transmission
Connection to or from P cab , DC l cab , DC A cab , DC m cab , DC P cab , AC cos φ l cab , AC A cab , AC m cab , AC
kWmmm 2 kgkVAmmm 2 kg
Nacelle1066.04.8465.84 × 6.91532.01.05566 × 1.62
Body956.07.2417.72 × 9.29----
Fuselage99.82.043.64 × 0.29126.41.045.16 × 0.14
Flap 288.74.638.84 × 0.58111.01.039.66 × 0.12
Flap 378.97.034.54 × 0.79111.81.039.96 × 0.13
Flap 468.79.530.04 × 0.95105.91.037.86 × 0.12
Flap 558.512.025.54 × 1.0392.41.033.06 × 0.10
Aileron83.414.436.44 × 1.73102.31.036.56 × 0.12
Table 4. Cable properties for fuel cell concept.
DC TransmissionAC Transmission
ConceptConnection to or from P cab , DC l cab , DC A cab , DC m cab , DC P cab , AC cos φ l cab , AC A cab , AC m cab , AC
kWmmm 2 kgkVAmmm 2 kg
a2 · FC → DC–DC815.81.0356.54 × 1.1----
Body799.52.0349.34 × 2.16----
b8 · FC → DC–DC204.01.089.116 × 0.27----
Body199.92.087.316 × 0.56----
Fuselage99.82.043.64 × 0.29126.41.045.16 × 0.14
Flap 288.74.638.84 × 0.58111.01.039.66 × 0.12
Flap 378.97.034.54 × 0.79111.81.039.96 × 0.13
Flap 468.79.530.04 × 0.95105.91.037.86 × 0.12
Flap 558.512.025.54 × 1.0392.41.033.06 × 0.10
Aileron83.414.436.44 × 1.73102.31.036.56 × 0.12
Table 5. Current technology: specifications of measured Li-Po cell.
Rated capacity C n 5 AhUpper voltage limit U c e l l m a x 4.2 V
Nominal voltage U c e l l n 3.7 VLower voltage limit U c e l l m i n 2.7 V
Mass m c e l l 0.132 kgMax. charge current I c e l l c h , m a x 10 A
Volume V c e l l 0.06 lMax. discharge current U c e l l d i s , m a x 150 A
Table 6. Future technology: parameters for Li-S cells for 2035.
Maximal power per energy capacity ( P / E ) b a t m a x 2 kW/kWh[21]
Gravimetric energy density (system) e m 0.5 kWh/kg[21]
Volumetric energy density (system) e v 0.6 kWh/L[22]
Maximal cell voltage U c e l l m a x 2.5 V[23]
Table 7. Operating figures of the designed fuel cell system.
ParameterSymbolValue
hydrogen mass for EPHLS 19.1 kg
hydrogen mass vented 5.2 kg
hydrogen mass, total, m H 2 24.3 kg
mass tank m t a n k 39.8 kg
mass compressor m c m p 48.3 kg
mass FC m F C 938.8 kg
(future FC: 469.4 kg)
max. power output FC incl. 50% safety P m a x 1887.6 kW
operating power fuel cell P a p + P c m p 1251.8 kW

