Article

Energy Consumption Optimization and User Comfort Management in Residential Buildings Using a Bat Algorithm and Fuzzy Logic

Department of Computer Engineering, Jeju National University, Jeju City 63243, Korea
*
Author to whom correspondence should be addressed.
Energies 2018, 11(1), 161; https://doi.org/10.3390/en11010161
Submission received: 21 November 2017 / Revised: 28 December 2017 / Accepted: 6 January 2018 / Published: 9 January 2018

Abstract

:
Energy management in residential buildings has grabbed the attention of many scientists for the last few years due to the fact that the residential sector consumes the highest amount of total energy produced by different energy resources. To manage the energy in residential buildings effectively, an efficient energy control system is required, capable of decreasing the total energy consumption without compromising the user-preferred environment inside the building. In the literature, many approaches have been proposed to achieve the goals of minimizing the energy consumption and maximizing the user preferred comfort by keeping different parameters under consideration, but all these methods face some problems in resolving the issue properly. The bat algorithm is one of the most recently introduced optimization approaches that has drawn the attention of researchers to apply it for solving different types of optimization problems. In this paper, the bat algorithm is applied for energy optimization in residential buildings, which is one of the most focused optimization problems in recent years. Three environmental parameters, namely temperature, illumination and air quality are bat algorithm inputs and optimized values of these parameters are the outputs. The error difference between the environmental parameters and optimized parameters are inputs of the fuzzy controllers which give energy as output which in turn change the status of the concerned actuators. It is proven from the experimental results that the proposed approach has been effectively successful in managing the whole energy consumption management system.

1. Introduction

Energy is the most precious resource among all resources and the demand for energy is rapidly growing with the passage of time. There could be two possible ways to tackle the problem of growing energy demand: (1) production of additional energy and exploration of alternate resources to produce energy and (2) more efficient utilization of existing resources. The first approach is highly expensive, time consuming, and costly, and the second approach is inexpensive, more proficient and highly recommended as the efficient utilization of energy avoids the need to produce new energy. Technologies have been improved and several methods are proposed for energy consumption optimization. Energy efficiency has become one of the major concerns nowadays, impacting almost all human activities, from industrial and commercial to leisure and vacation [1,2].
In residential buildings, the energy consumption is increasing rapidly, hence efficient utilization of energy in the residential sector is an issue of high concern. Many researchers are trying to solve this problem and many attempts have been carried out for this purpose in the last decade. Three basic parameters, namely thermal comfort, air quality comfort and visual comfort should be taken into account while determining user comfort [3]. The thermal comfort represents the temperature inside the building. For temperature control in the comfortable area of a building a cooling and/or a heating system is needed. For the visual comfort, the user’s illumination is considered [4]. For visual comfort measurement, electrical lighting is used and for air quality measurement in the comfort zone, the CO2 concentration is measured. The ventilation system keeps the concentration of CO2, as low as possible [5]. For user comfort maintenance, the above three parameters are normally considered. These three factors have also been considered in the proposed work. To increase user satisfaction levels and save energy is a hard problem because the handling of both simultaneously is very hard.
In previous studies, different tactics based on conventional control systems are employed to solve the problem of energy management [6,7]. Some of the control systems based on the conventional method are adaptive controllers, optimal controllers and Proportional Integral Derivative (PID) controllers. Designers use PID control systems to control the abrupt increase in the temperature. Methods utilizing conventional approaches can solve the problem to some extent; however, they have some inherent disadvantages associated with it like the control parameters used in these models are not friendly enough to be monitored easily. Some of the proposed methods need a model of the building to work effectively. Difficulties caused by nonlinear features in the monitoring of control parameters are also one of the weaknesses of conventional control systems. In [8] the authors utilized optimized fuzzy controllers which control the environmental parameters. With the help of sensors and Programmable Logic Controllers (PLCs), users’ favorite settings are observed through a smart card. Genetic algorithm optimization is used to provide the energy required to meet user preferences while minimizing energy consumption. Predictive control systems use weather prediction for control of heating, ventilation, and air-conditioning [9,10]. The authors in [11] used a multi-agent control system in which information fusion has been used for indoor energy and control management. In addition to the factors discussed above that affect user comfort, there are some other factors like social, personal and building parameters that have the strong influence on user comfort. The authors of [12] proposed a model which describes the complex relationship between these factors. The inclusion of the outdoor parameters that might affect the user comfort index along with the already discussed indoor parameters is included in the work done by the authors in [13].
The bat algorithm is a meta-heuristic optimization algorithm that has been widely used to solve optimization problems due to its simplicity and efficiency. The bat algorithm can be used to achieve fast optimal solutions in various fields like scheduling, energy systems, mathematical problems, etc. Energy optimization, which is usually a non-linear optimization problem, can be solved by researchers by applying a bat algorithm to achieve optimization [14].
The basic objective of this paper is to propose an optimization method to decrease energy consumption in residential buildings and increase user comfort. In this study, we proposed an optimization methodology that employs a bio-inspired bat algorithm (BA) for maximizing user comfort and minimizing energy consumption. In this approach, the user comfort and energy management are addressed simultaneously, with the aim to bridge both with the fitness function of the BA to achieve the increase in user comfort while decreasing energy consumption. Temperature, illumination and air quality are used as basic input parameters from the environment and user set preferences are optimized using a bat-inspired algorithm according to the user set preference. After the optimization of the values by the BA, the error difference between the optimized and actual (environmental) values is calculated. The calculated error differences then become input to fuzzy controllers which produce the minimum amount of energy required. The coordinator agent gets the output of fuzzy controllers and activates the actuators by adjusting the power according to the available power. The desired power is the minimum power required to change the status of the actuators while the optimized values of the basic comfort parameters are already calculated according to the user set preference.
The paper is organized as follows: Section 2 presents the related work, and the proposed methodology is given in Section 3. Experimental results and discussion are presented in Section 4, the comparative analysis of the proposed algorithm with other counterpart is explained in Section 5, and in Section 6, our conclusions are presented.

2. Related Work

Nowadays energy management in the residential building sector has grabbed the attention of researchers and many are trying to solve it in an efficient way. Residential buildings must operate day-by-day and its facilities are associated with energy. In other words, as the facilities in a building increase, energy consumption also increases. Numerous methods have been developed to design an efficient energy conservation system for residential buildings. In [15] environmental control systems for museums, art galleries and other special buildings have been discussed in detail. Energy management in the building is an optimization problem and has multiple dimensions.
In the last decade, advancements have been reported in optimization methods for solving nonlinear optimization problems [3]. A direct search has been adopted, that may lead to accurate results [16]. In recent studies, researchers are trying to improve building environment. The central focus point for this improvement is to minimize user energy consumption and maximize user comfort, because people mostly spend their time in buildings, hence the user satisfaction determines the environmental conditions in the building. In order to achieve user satisfaction, an intelligent optimization technique for smart homes has been proposed for optimal energy management [4]. In [17], an improved optimization function has been used to maximize user comfort and minimize energy consumption in the building environment. To remove the noise from sensor readings, the Kalman filter algorithm has been used. The Kalman filter predicts the actual parameter values. The genetic algorithm and particle swarm optimization (PSO) have also been used for optimization. The results indicate that their proposed optimization function performs better as compared to PSO and GA alone.
The genetic algorithm (GA) has also been deployed to manage energy in buildings to address heating, air conditioning and controlling ventilation problems [18]. This approach has also been applied for controlling fuel cells, thermal storage and heat pumps [19]. In [7] the genetic algorithm has been deployed to solve multi-objective problems for optimal payoff characteristics optimization. The genetic algorithm was used for mixed integer and nonlinear programming problems in an energy plant in Beijing [20].
A method of inspection and forecasting to efficiently utilize the energy inspection and forecasting in smart buildings has been discussed in detail in [21]. In this paper, a method based on a feed forward neural network trained with GA has been proposed. The performance of this method was good, while the mean computation time for one forecasting behavior was 9.0572 s, the mean computation time for the same predicting behavior of the backward propagation (BP) network and RDF network were 0.0961 and 0.0494, respectively. In [22] a genetic-based programming technique has been suggested and the prediction accuracy of this proposed method was 80–83% on testing data in five different offices. The deployment of this method can be carried out to estimate the energy requirement in residential buildings. In [23] an optimized multi-layer perceptron (MLP) method has been proposed for short-term energy consumption in Korean residential buildings. In this approach, the authors developed 20 different models of MLP having different architecture to predict energy use. In [24] another method for energy prediction in residential buildings has been proposed. The proposed methodology is comprised of three stages, namely data retrieval, feature extraction, and prediction. In data retrieval, the daily basis energy consumption data is acquired from the database. In feature extraction phase, the first three statistical moments, namely mean, variance, and skewness have been calculated from the acquired data. In the last stage, prediction methods, namely MLP and random forest have been used to forecast the demand for energy in the residential building. The results show that the performance of multi-layer perceptron is better as compared to random forest algorithm.
In [25] a simulation optimization method has been proposed for efficient energy management of heating, ventilation and air conditioning (HVAC) systems. The complex interconnection of the whole HVAC system normally includes airside systems and waterside systems, the proposed optimum setting for diverse processes in response to the dynamic cooling loads and varying climate situations during a year. In [26] a GA that controls parameter optimization in parallel Hybrid Electric Vehicles (HEVs) has been used. The formulation of the optimization problem has been carried out for an electric assist control strategy (EACS) to reduce the consumption of fuel and emissions while maximizing vehicle performance. The optimization of different objective functions has been done in [27] and different algorithms are also proposed for electricity forecasting consumption based on genetic algorithm, simulated-based genetic algorithm, time series and design of experiment (DOE), analysis of variance (ANOVA) and Duncan multiple range test (DMRT). The experimental data used in this method were 131 months of real energy consumption data collected from 1994 to 2005. In [28] an evolutionary-based algorithm named robust evolutionary algorithm (REA) for tackling a heating, ventilation, and air conditioning (HVAC) simulation model has been proposed. In this paper a strategy has been developed to optimally control the inconstant air volume and air-conditioning system. The control method contains a primary control scheme of a static temperature point and two advanced methods for ensuring comfort and indoor air quality (IAQ). A method for building environment based on grid security is suggested in [29] which considers user comfort with favorable power consumption as a key factor.
In this study a methodology using a bat algorithm and fuzzy logic for optimizing user comfort index and energy savings for the building environment has been proposed. Both energy efficiency and user comfort levels have been addressed in this paper and the focus of this work is to simultaneously increase residential comfort level and decrease energy consumption by providing an optimal user comfort index and minimizing energy consumption in the building environment.

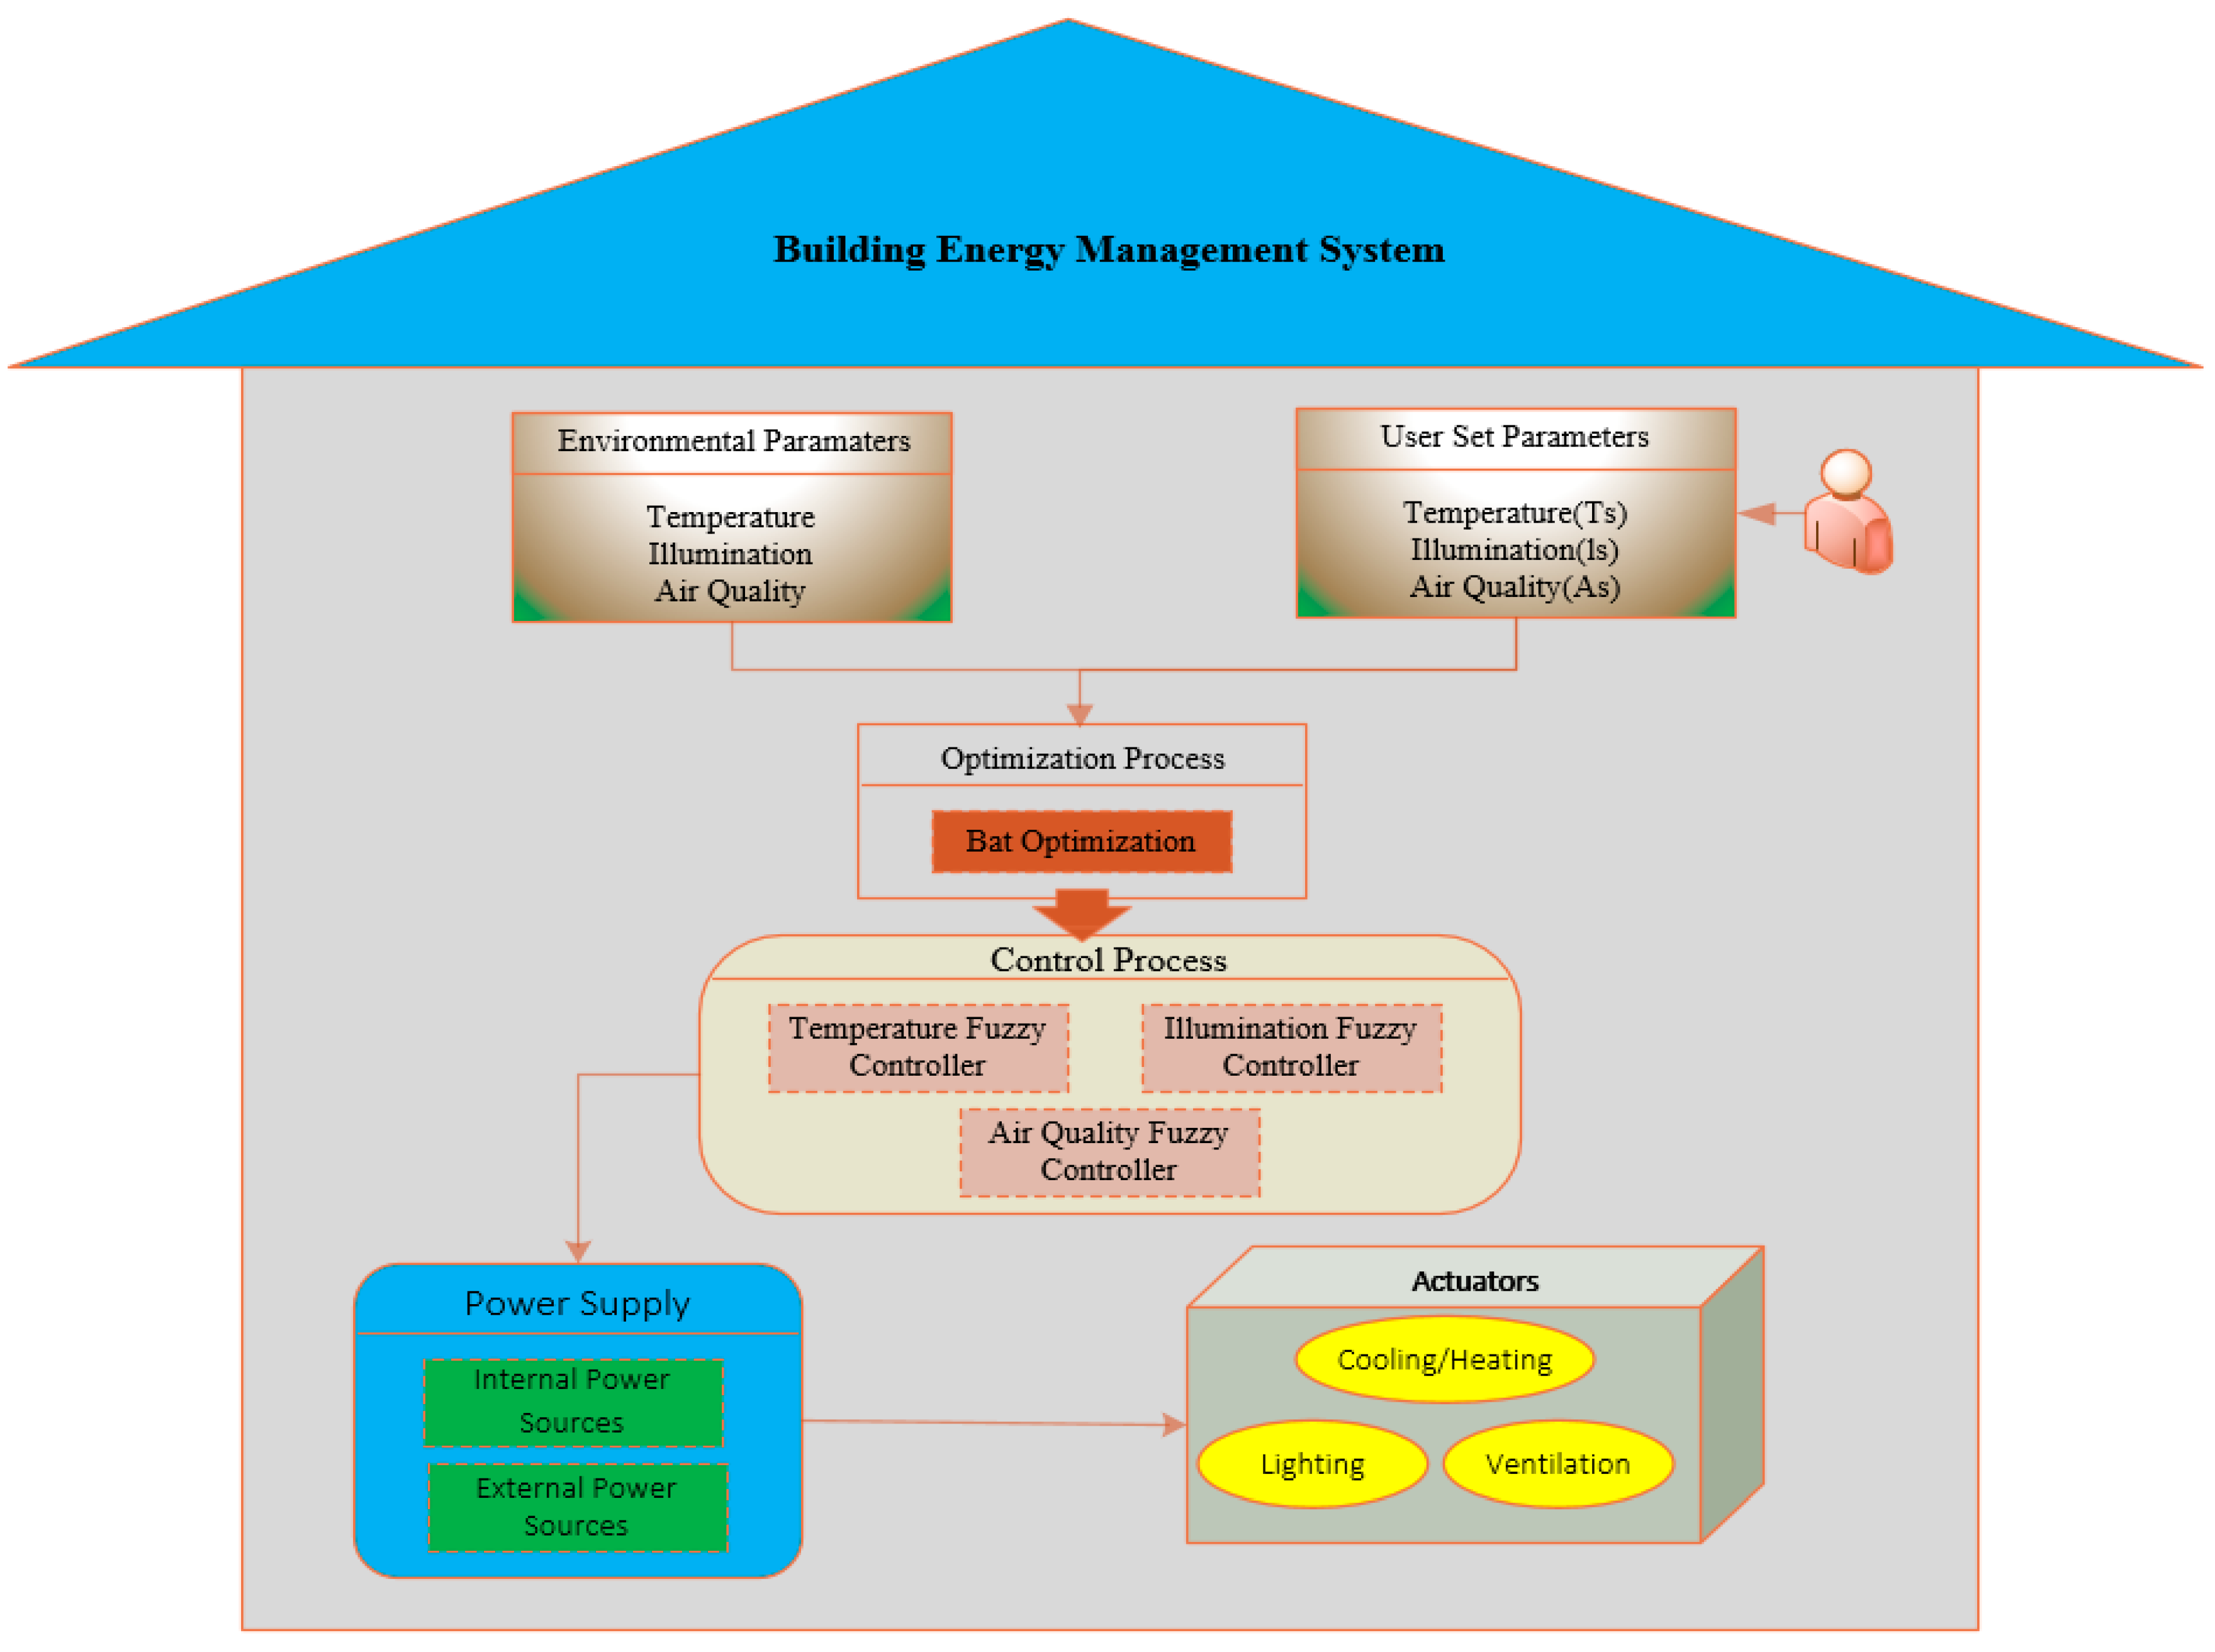
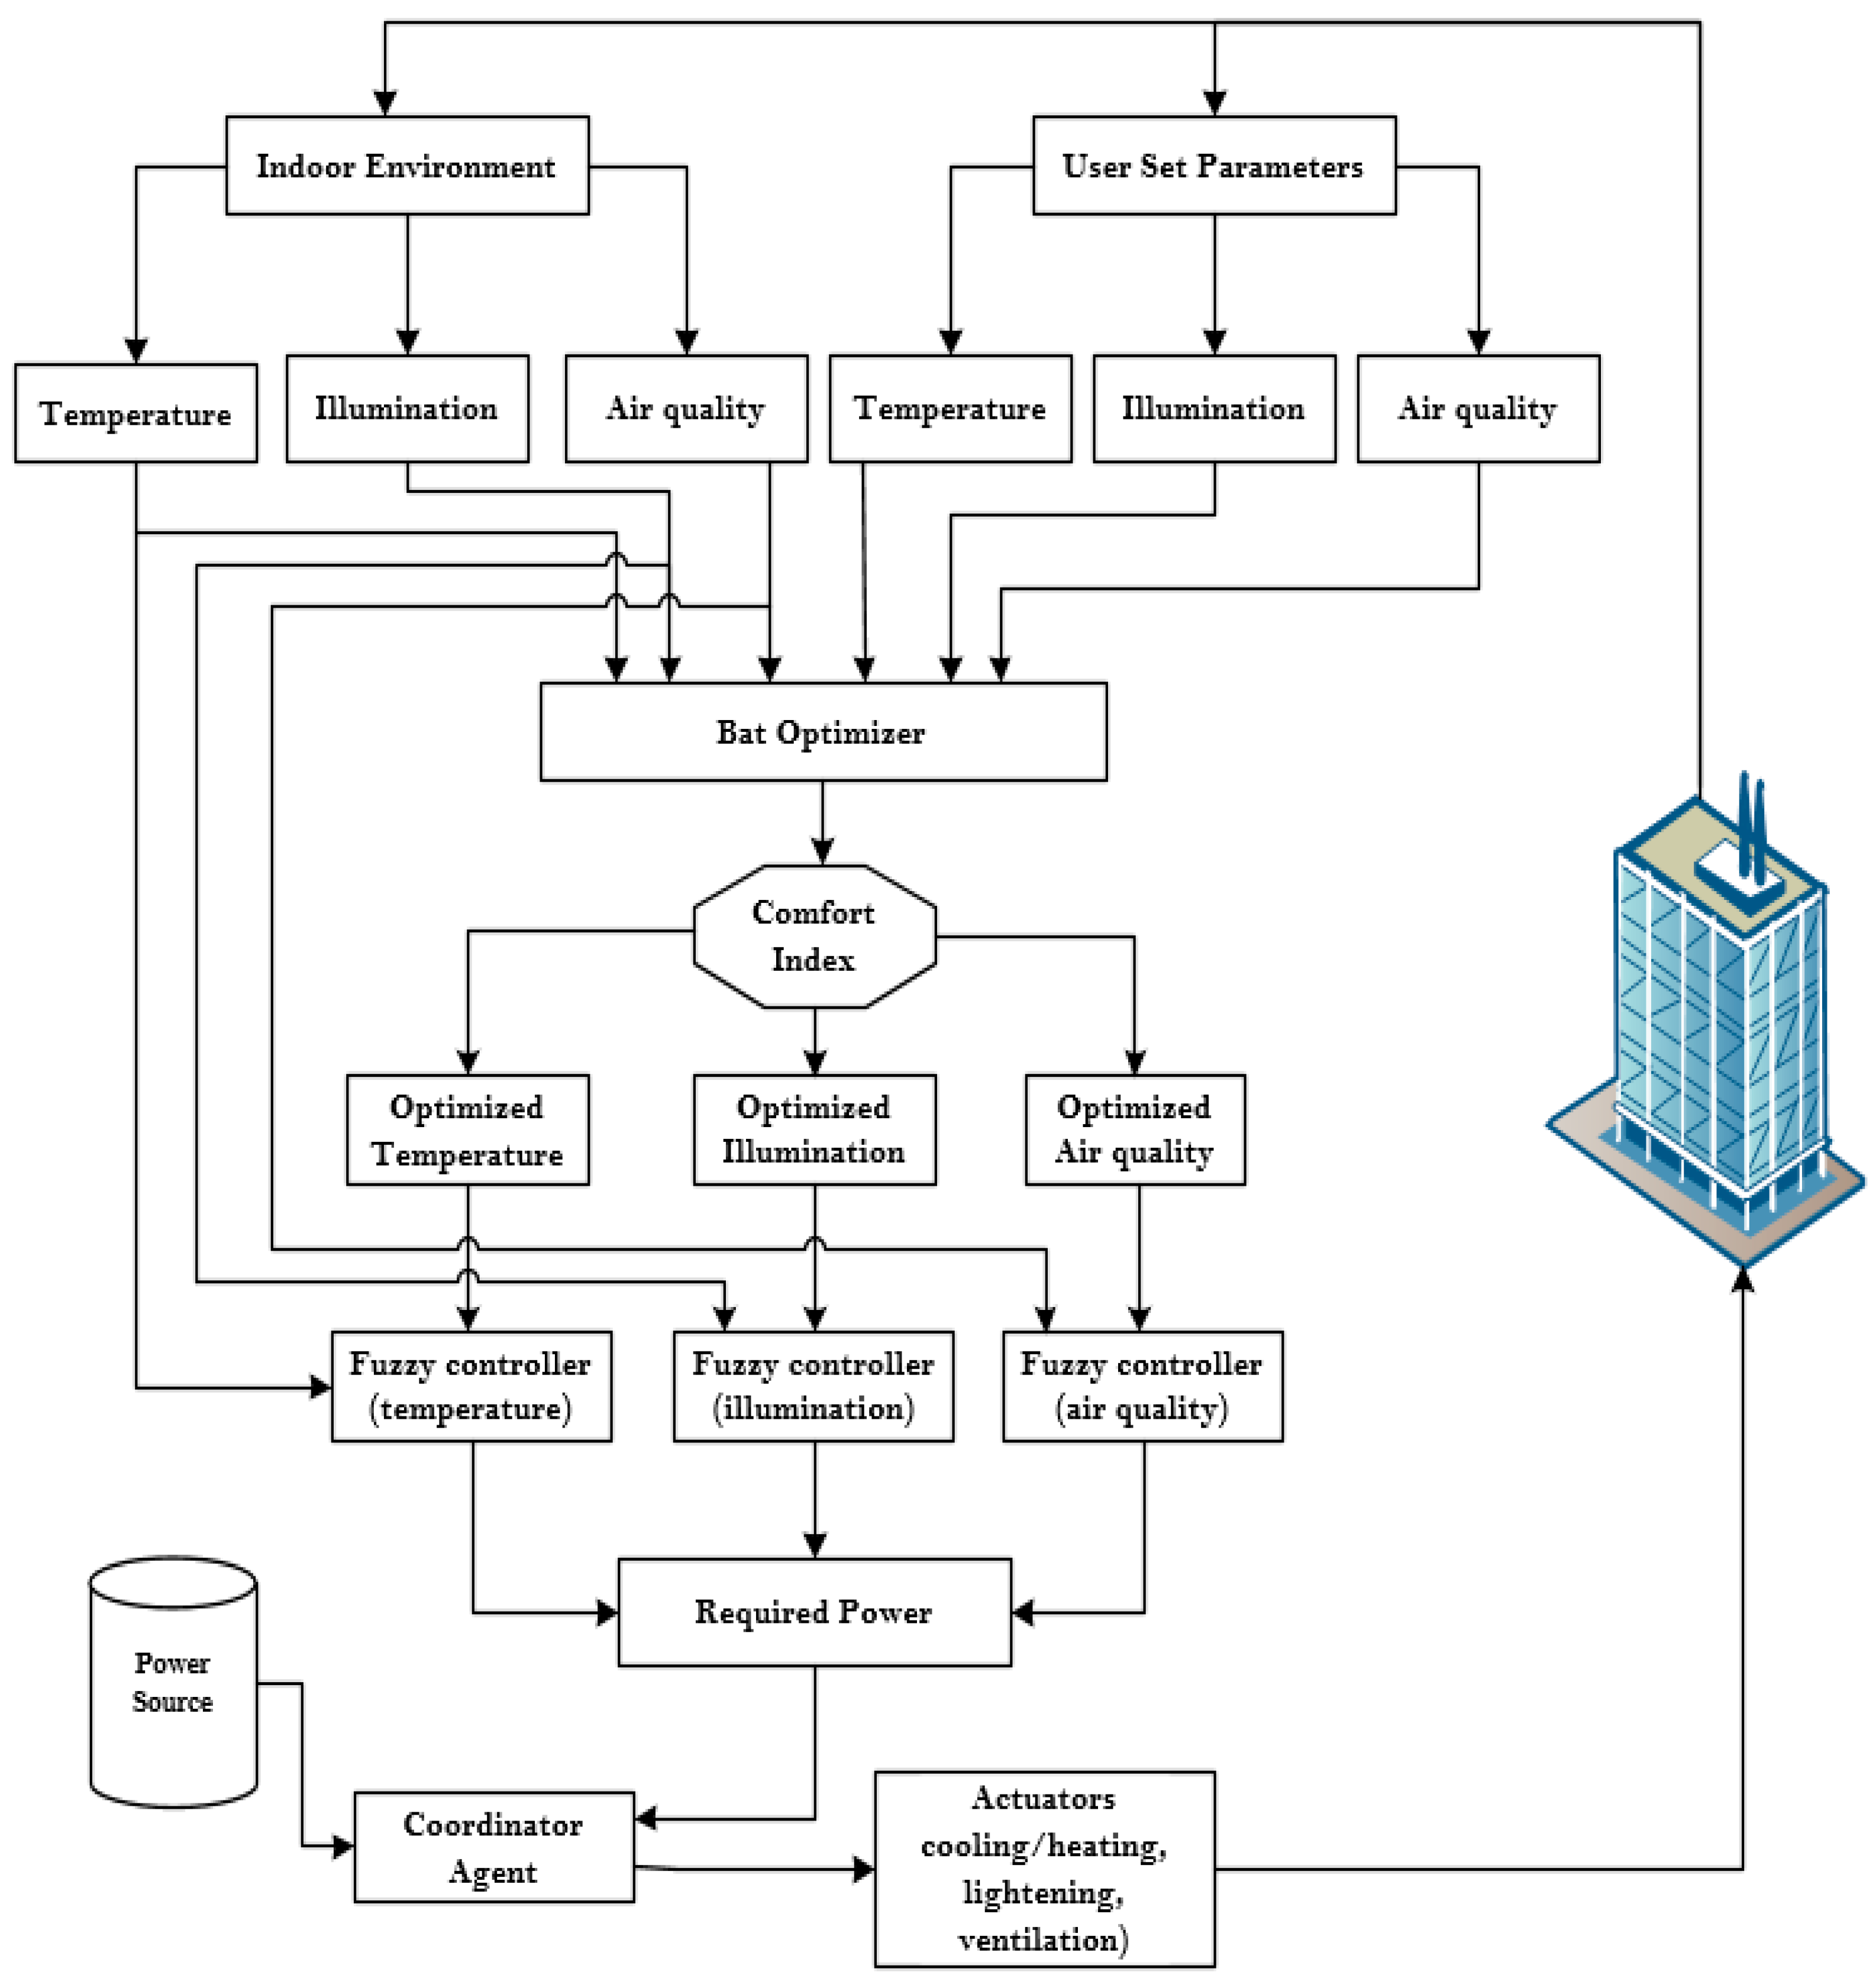
3. Proposed Methodology

In the proposed architecture, the parameters, namely temperature, illumination and the air quality from the environment as well as from the user are entered into the BA optimizer. The main aim of the BA optimizer is to reduce the gap between the user-set parameters and the actual environmental parameters. This gap is represented by the error differences between the user-set and environmental parameters and this error difference has a direct impact on power consumption, i.e., as the error difference decreases, the power consumption is expected to decrease and vice versa. After computing the error differences, the next stage is to calculate the comfort index. The overall user comfort inside the building is the combination of three comforts, namely thermal comfort, visual comfort and air comfort. These three comforts are calculated by taking into consideration the error differences computed by the BA optimizer. The comfort index has an inverse relationship with error difference. As previously stated, the error difference is correlated with power consumption. With a decrease in error difference, the comfort index increases, which as a result makes this problem a multi-objective optimization problem in which the power consumption is minimized and comfort index is maximized. After calculation of the comfort index, the next stage is to control the status of different actuators. The fuzzy controllers (the temperature fuzzy controller, illumination fuzzy controller and the air quality fuzzy controller) get the error difference between environmental perimeters and the parameters that have been optimized. The fuzzy controller’s output is the desired power for controlling the actuator status, such as cooling/heating, lighting, and ventilation. The required power is be entered to the coordinator as input, afterward; the coordinator checks the power availability from power sources and provides the power to all actuators according to the fuzzy controller status. Fuzzy controllers take both the BA optimized values and environmental perimeters (temperature, illumination, and air quality). The fuzzy controllers’ output values depend on the error difference between environmental perimeters (temperature, illumination and air quality) and the BA optimized (temperature, illumination and air quality) values. The basic purpose of BA optimization is the minimization of error differences between values of environmental parameters and actual parameters. Without applying the BA optimization procedure, the error differences are high, which eventually generates higher output values causing higher energy consumption. The optimization process decreases the error difference which ultimately decreases power consumption. The block diagram for proposed building energy management system is shown in Figure 1.

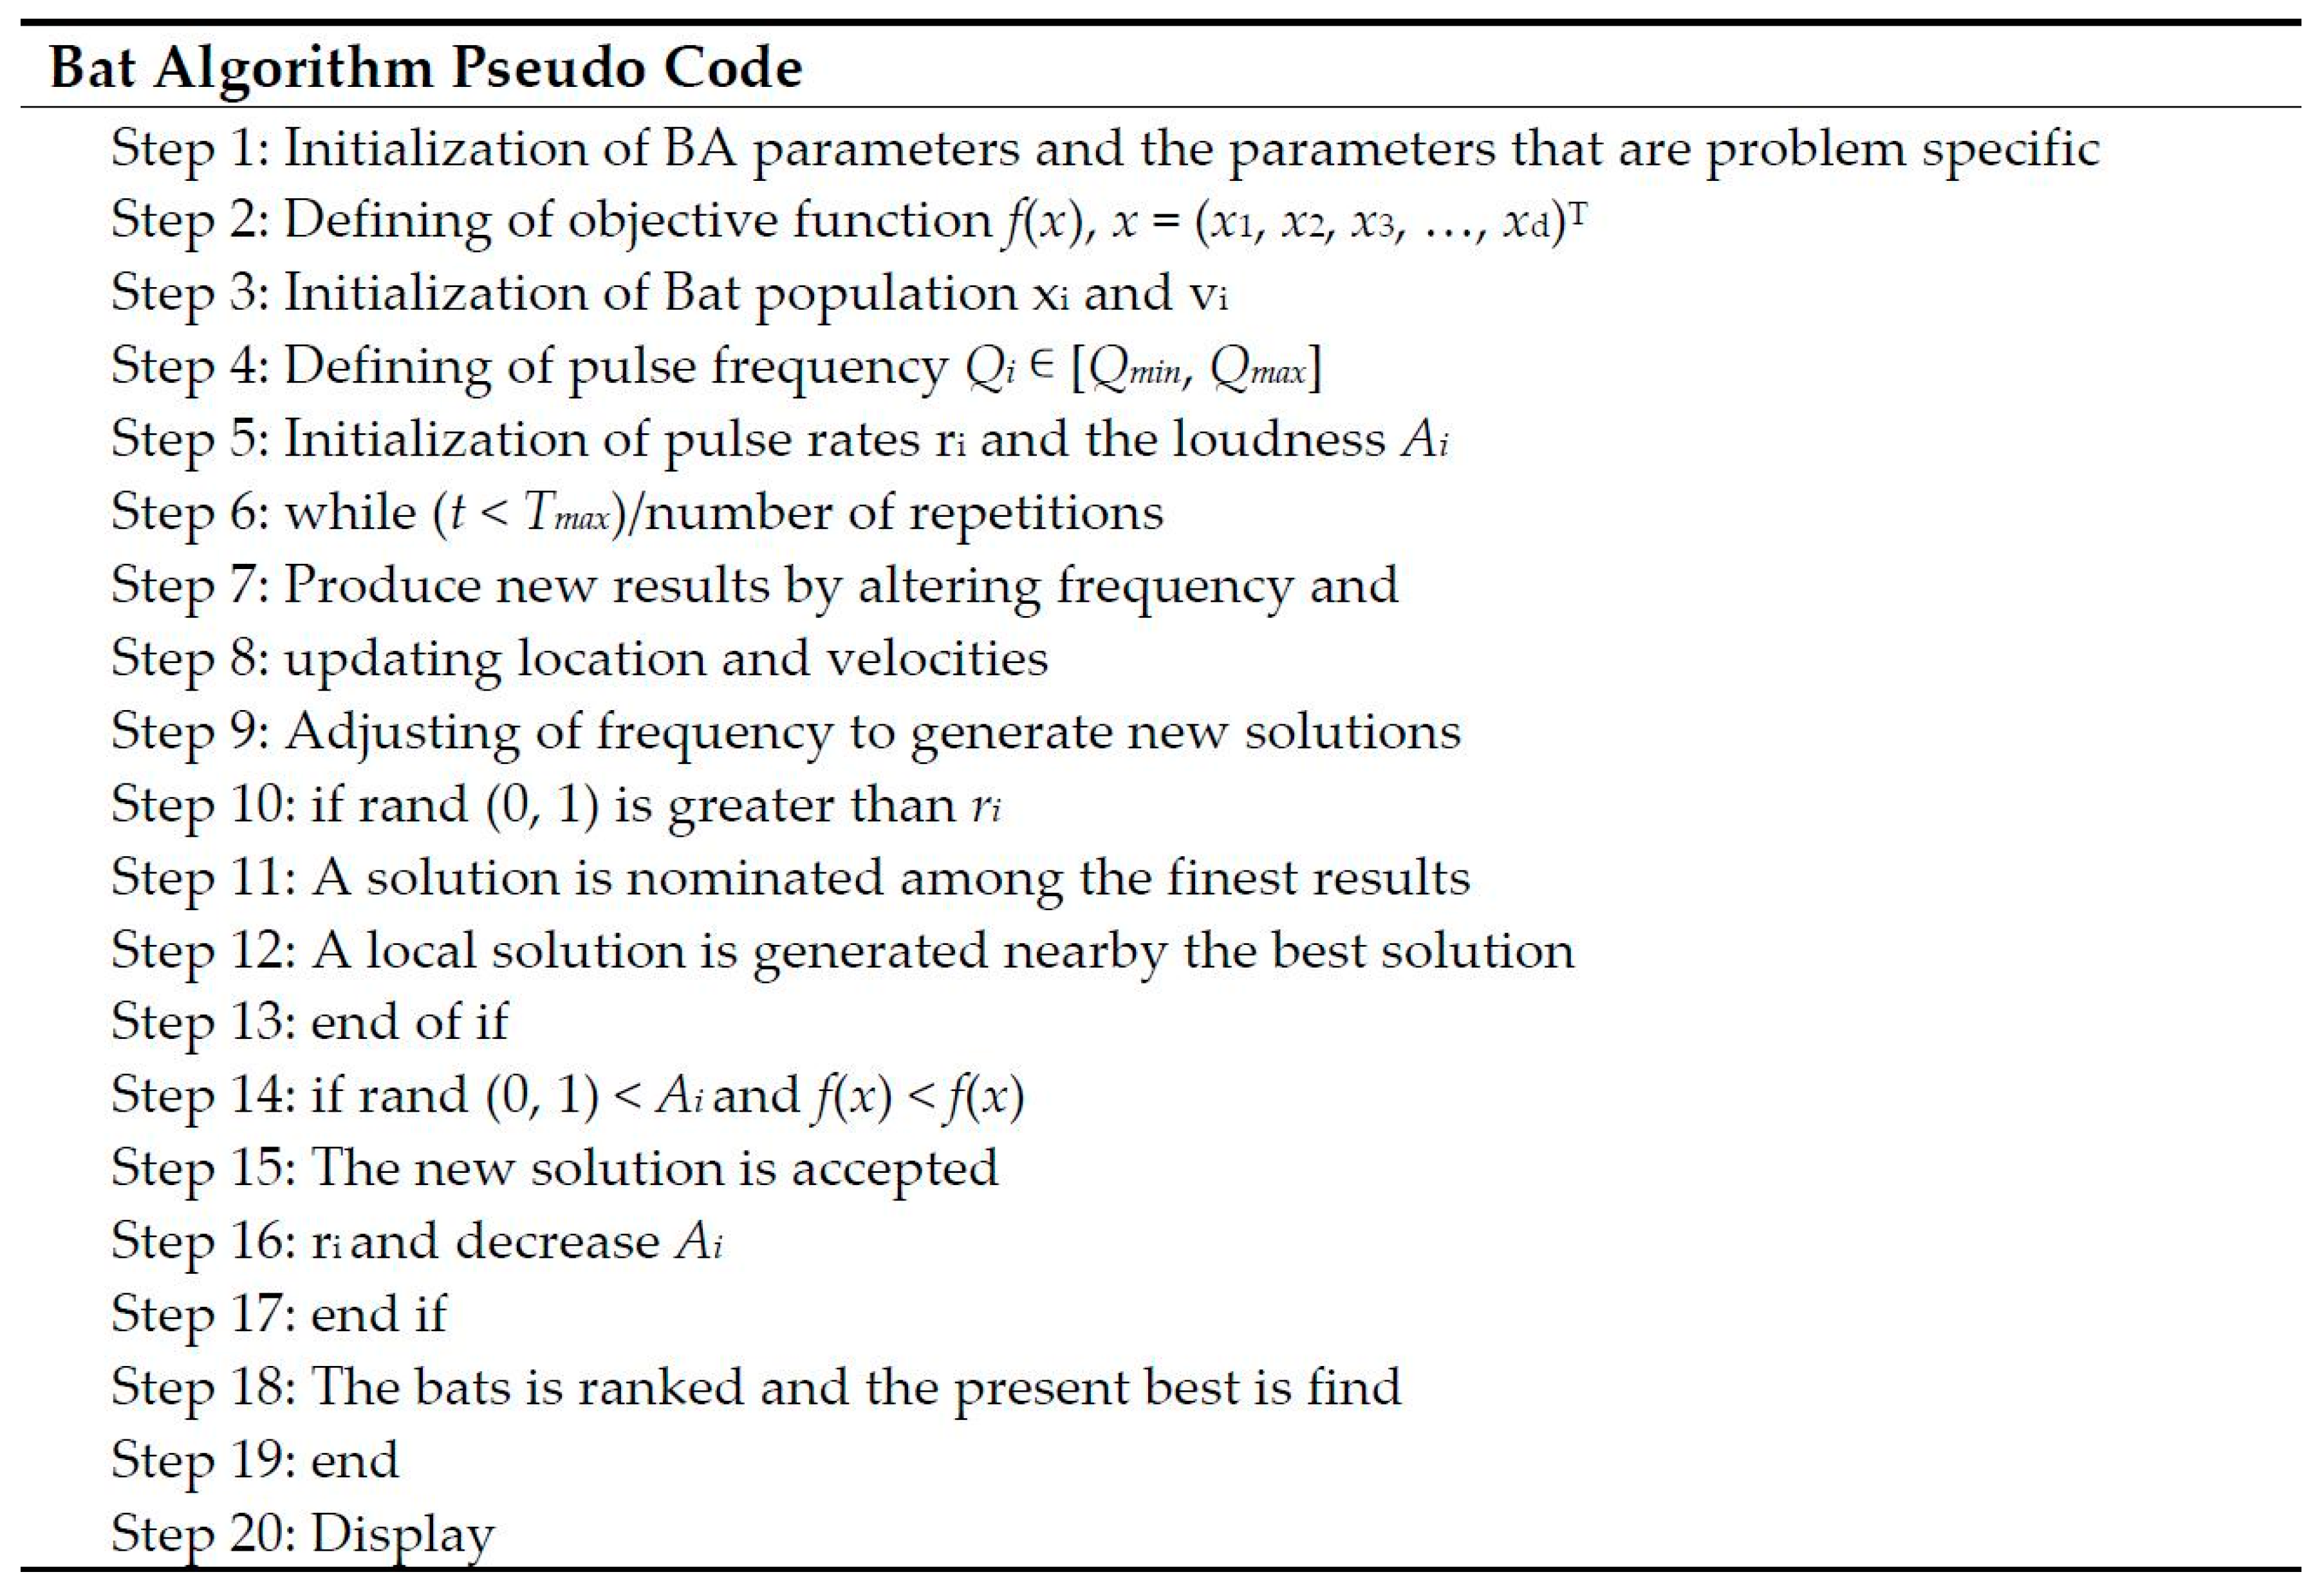
3.1. Optimization Using Bat Algorithm

The bat algorithm (BA), suggested by Yang in 2010, is a meta-heuristic algorithm based on the echolocation properties of bats. Echolocation helps bats in their flying and hunting behavior. This property makes bats able to move and helps them to distinguish different types of insects even in complete darkness. The following three generalized rules were used by Yang [30] when implementing the bat algorithm:
(1)
For the distance sensing all bats use echolocation and they have also the potential to distinguish the difference between background barriers and food/prey in some dreamlike way.
(2)
Bats fly in a random manner with velocity v i at position x i with a fixed frequency f varying wavelength ʎ and loudness A 0 to search for prey. They have the ability to regulate the wavelength of their emitted pulses automatically and adjust the rate of pulse emission r in the range [0, 1], depending on the proximity of their target.
(3)
While the loudness can vary in numerous ways, we undertake that the loudness ranges from a huge A 0 to a smallest constant value A m i n .
The pseudo code of the bat algorithm is given in Figure 2.
The bat algorithm is advantaged over other optimization algorithms due to the reasons given below:
  • BA implementation is simple and required less programming efforts.
  • BA is flexible and has the ability to provide the solution for almost all optimization problems [31].
  • The deployment of the BA algorithm has been done in numerous areas of optimization, such as classification, feature selection, scheduling, data mining, etc. [31].
The major steps of bat algorithm for the energy consumption optimization problem in the smart home are described in the following section:
Step 1:
(1)
Number of parameters (D): This indicates the size of the parameters that need to be optimized. Here in this study we have three parameters to be optimized which are temperature (T), illumination (L) and air quality (A).
(2)
Upper bound (UBi): UBi indicates the upper bounds of parameters i, where i = 1, 2, D and D indicates the total size of parameters of desired optimization. The upper bound for temperature (Tmax), illumination (Lmax) and air quality (Amax) are 78, 880 and 880 respectively.
(3)
Lower bound (LBi): LBi indicates the lower bounds of parameters i, where i = 1, 2, D and D indicates the total size of parameters that need to be optimized. Here the lower bound for temperature (Tmin), illumination (Lmin) and air quality ( A m i n ) is 68, 720 and 700, respectively.
(4)
Population size: It represents the total number of solutions in search space. The population size lies from 10 to 40.
(5)
Number of generations: It represents the number iteration circles in the bat algorithm. The algorithm has been tried for the different number of generation to discover the ideal generation size to find the preeminent performance result.
(6)
Loudness (A0) and Pulse rate (r0) initialization: Both loudness and pulse rate are initially set to 0.5, where the pulse emission is represented loudness A0 is used to search for prey.
Step 2: new solution generations:
(1)
Adjusting the frequency: the frequency is adjusted by using the Equation (1):
f t =   f m i n + ( f m a x f m i n ) × β
where β ∊ (0, 1) represents the uniform distribution. In implementation, the f m i n is set 0 and f m a x to 1, hence initially the frequency is assigned randomly by each bat with uniform distribution in [ f m i n , f m a x ].
(2)
Updating the velocity: the velocity is updated by using the Equation (2):
v i t = v i t 1 + ( v i t 1 × x )   f i .
where v i t represents the new velocity of bat i at the time step t, and x signifies the existing global top solution. The frequency f i of ith is used for adjusting the velocity v i t for movement of bats to x i t position.
(3)
Updating the locations/solutions: The location updating carried out by using Equation (3):
x i t = x i t 1 + v i t
where x i t is the new position of the bat, x i t 1 is the current position of the bat. The new solution is generated by updating the velocity, and adjusting the frequency.
Step 3: (Local search solution):
(1)
Best solution selection: the best solution is chosen among all current best solutions.
(2)
Generation of the local solution around the best solution: The selection of the best solution is carried out around the best solution using Equation (4):
x n e w = x o l d + ε A t
where ε is an arbitrary lie between [1, −1] and A t represent the average loudness of entire bats in iteration t.
Step 4. Loudness and the pulse emission rate: As the bat tends closer to the target/prey the loudness and pulse rate emission r updated accordingly. Loudness A is decreased while pulse emission rate r is increased by using (5) and (6):
x i t + 1 = α A t
r i t + 1 = r i 0 ( 1 e γ t )
Step 5. Optimal Solution. In the proposed approach we must maximize the value of comfort index formulated in Equation (7). The best fitness value is updated as global best.

3.2. Comfort Index

The mathematical formula for comfort index is given in Equation (7) [4,11]:
C T = α 1 [ 1 ( e T T s ) 2 ] + α 2 [ 1 ( e L L s ) 2 ] + α 3 [ 1 ( e A A s ) 2 ]
where comfort is the total user comfort and it lies between [0, 1]. The user defined factors are α 1 , α 2 and α 3 that are used to solve any possible clash between three comfort features namely, temperature, illumination, and air quality. The value of these factors falls in the range between [0, 1], and the sum of these values must be always equal to 1 ( α 1 + α 2 + α 3 = 1 ) . In Equation (7), e T , e L and e A represent the error difference between the optimized temperature and the environmental temperature, error difference between the optimized illumination and the environmental illumination and the error difference between optimized air quality and environmental air quality respectively. In the proposed work the user comfort is based on three parameters namely thermal comfort, air quality, and illumination. Ts, Ls and As represent the user set temperature, user set illumination and user set air quality, respectively. We compute user comfort by integrating these three comfort parameters using Equation (7). The above formula for user comfort is based on our previous work [1,2,17]. Further user comfort formula can be generalized for any number of parameters as given in Equation (8) below:
C T = α 1 [ 1 ( e P 1 P 1 ) 2 ] + α 2 [ 1 ( e P 2 P 2 ) 2 ] + α 3 [ 1 ( e P 3 P 3 ) 2 ] + + α n [ 1 ( e P n P n ) 2 ]
where α i represents user preferences for P i parameters. A user has to specify his/her preference level for each parameter in terms of a min and max acceptable range. Our optimization formula tries to achieve optimal values for each parameter within the user desired range while minimizing overall energy consumption. In this paper, experiments are performed by setting the alpha values as: α 1 = 0.3 , α 2 = 0.3 , and α 3 = 0.4 . The α 1 , α 2 , and α 3 relationship indicate the relative importance of each parameter temperature, air quality and illumination. For instance, assigning α 1 = α 2 = α 3 = 0.333 would mean that for users, all indoor parameters are of same importance. However, if the user specifies some different combination e.g., α 1 = 0.6, α 2 = 0.2, α 3 = 0.2 then this means that indoor temperature settings are three times more important for the user as compared to air quality and illumination. We believe that this approach makes the model flexible and gives freedom to the user to specify any desired combination. The structure diagram for proposed building energy management model is illustrated in Figure 3.
This formula has the ability to adopt new parameters if increased. The decision of consideration of parameters is important keeping in view the flexibility of system we have left the selection of parameters up to the user. As this work is based on our previous work hence once again three parameters including temperature, illumination, and air quality have been considered. In future studies, we will increase the number of parameters in order to test the variations and success of the bat algorithm. The next step is the selection of upper and lower bounds to select the desired user comfort range. The selection of bounds can be manually adjusted; in this study, we have selected upper bound for temperature (Tmax) as 78, for illumination (Lmax) 880 and for air quality (Amax) 880. The selection of lower bound is also as important as the selection of upper bound because a certain range can ease the bat algorithm for the exact optimization of parameters. The lower bound for temperature (Tmin) has been selected as 68, for illumination (Lmin) as 720 and for the air quality ( A m i n ) as 700. These ranges can be selected as per user choice. The population size has been selected as 40 for this study. The readings have been carried out with 100 iterations to find the optimal values.

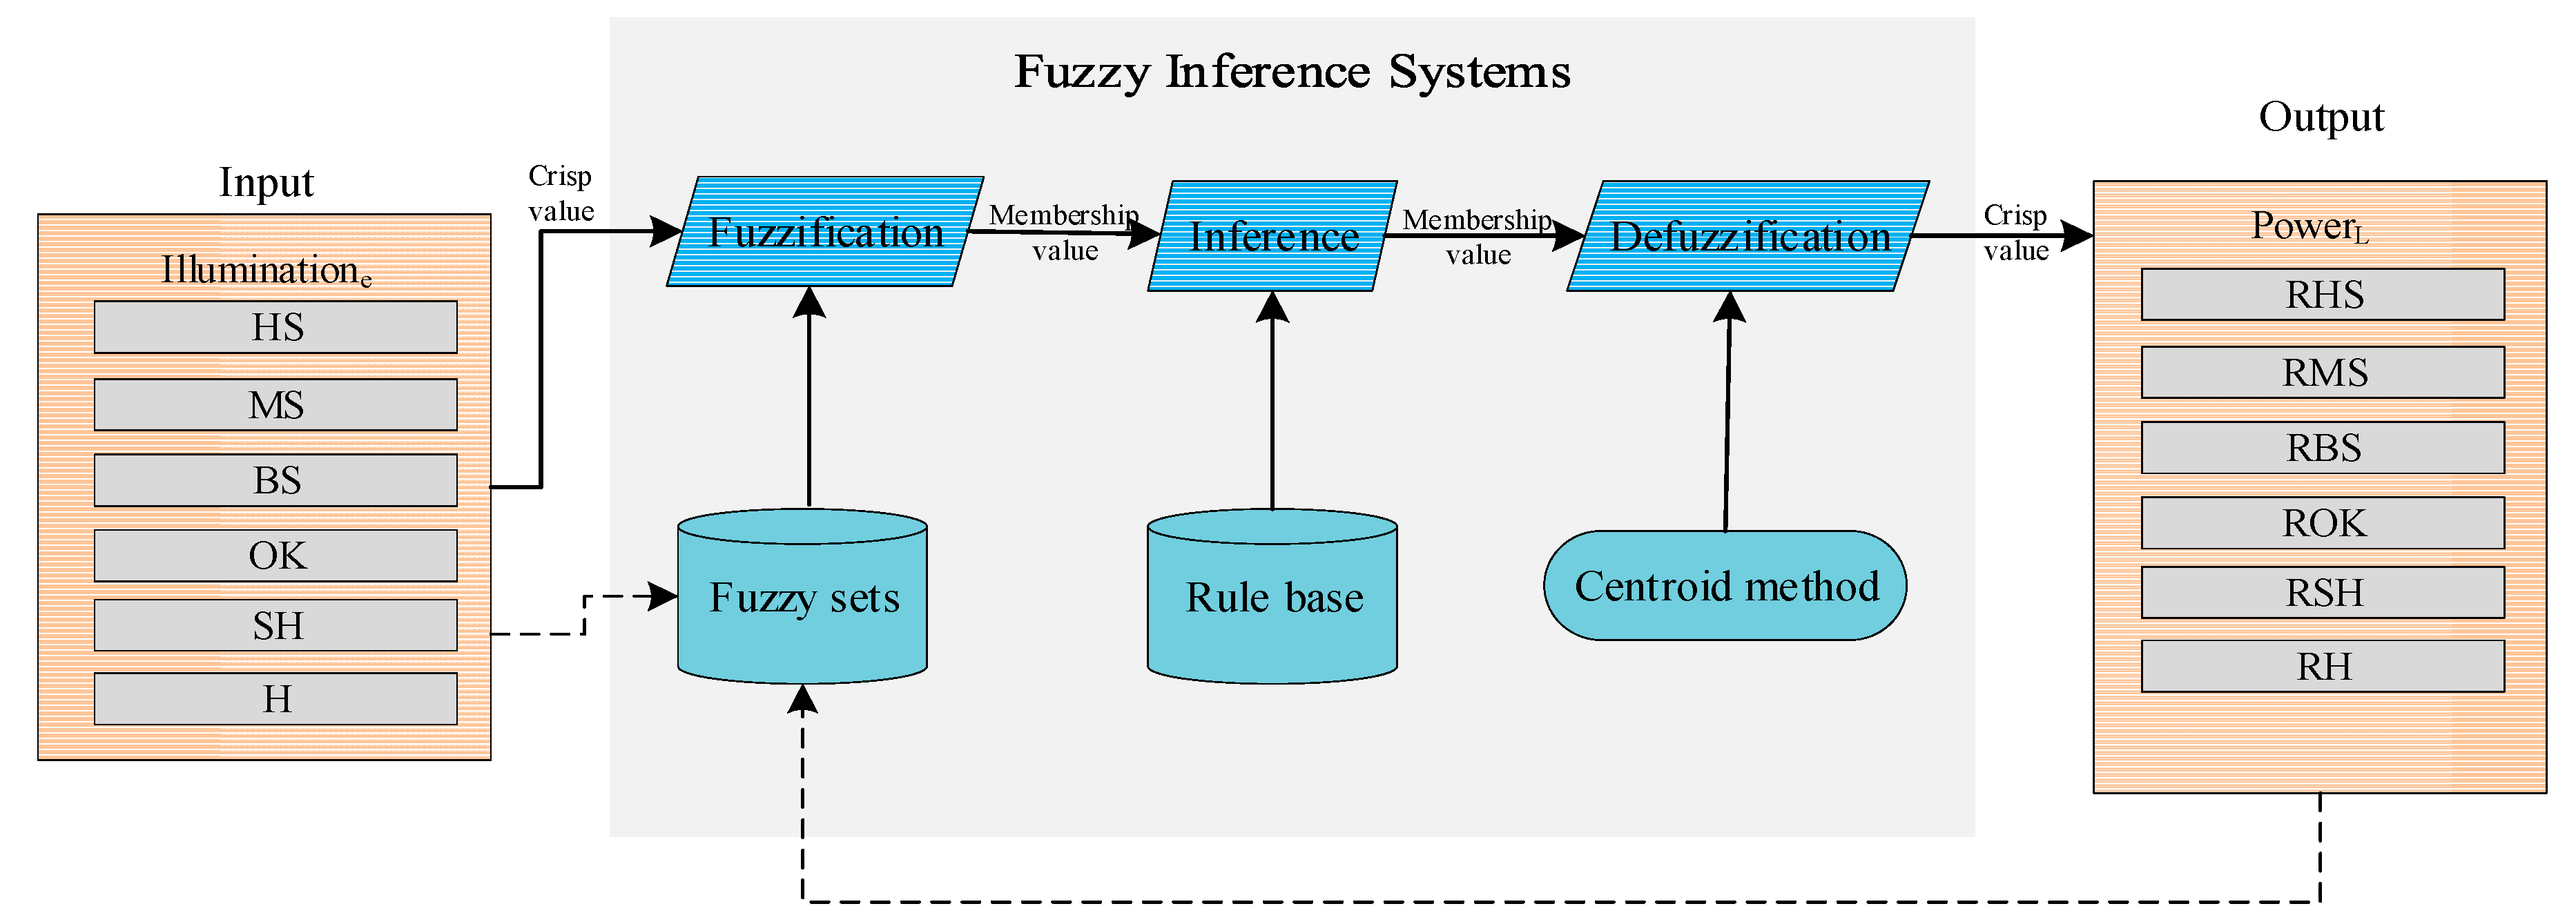
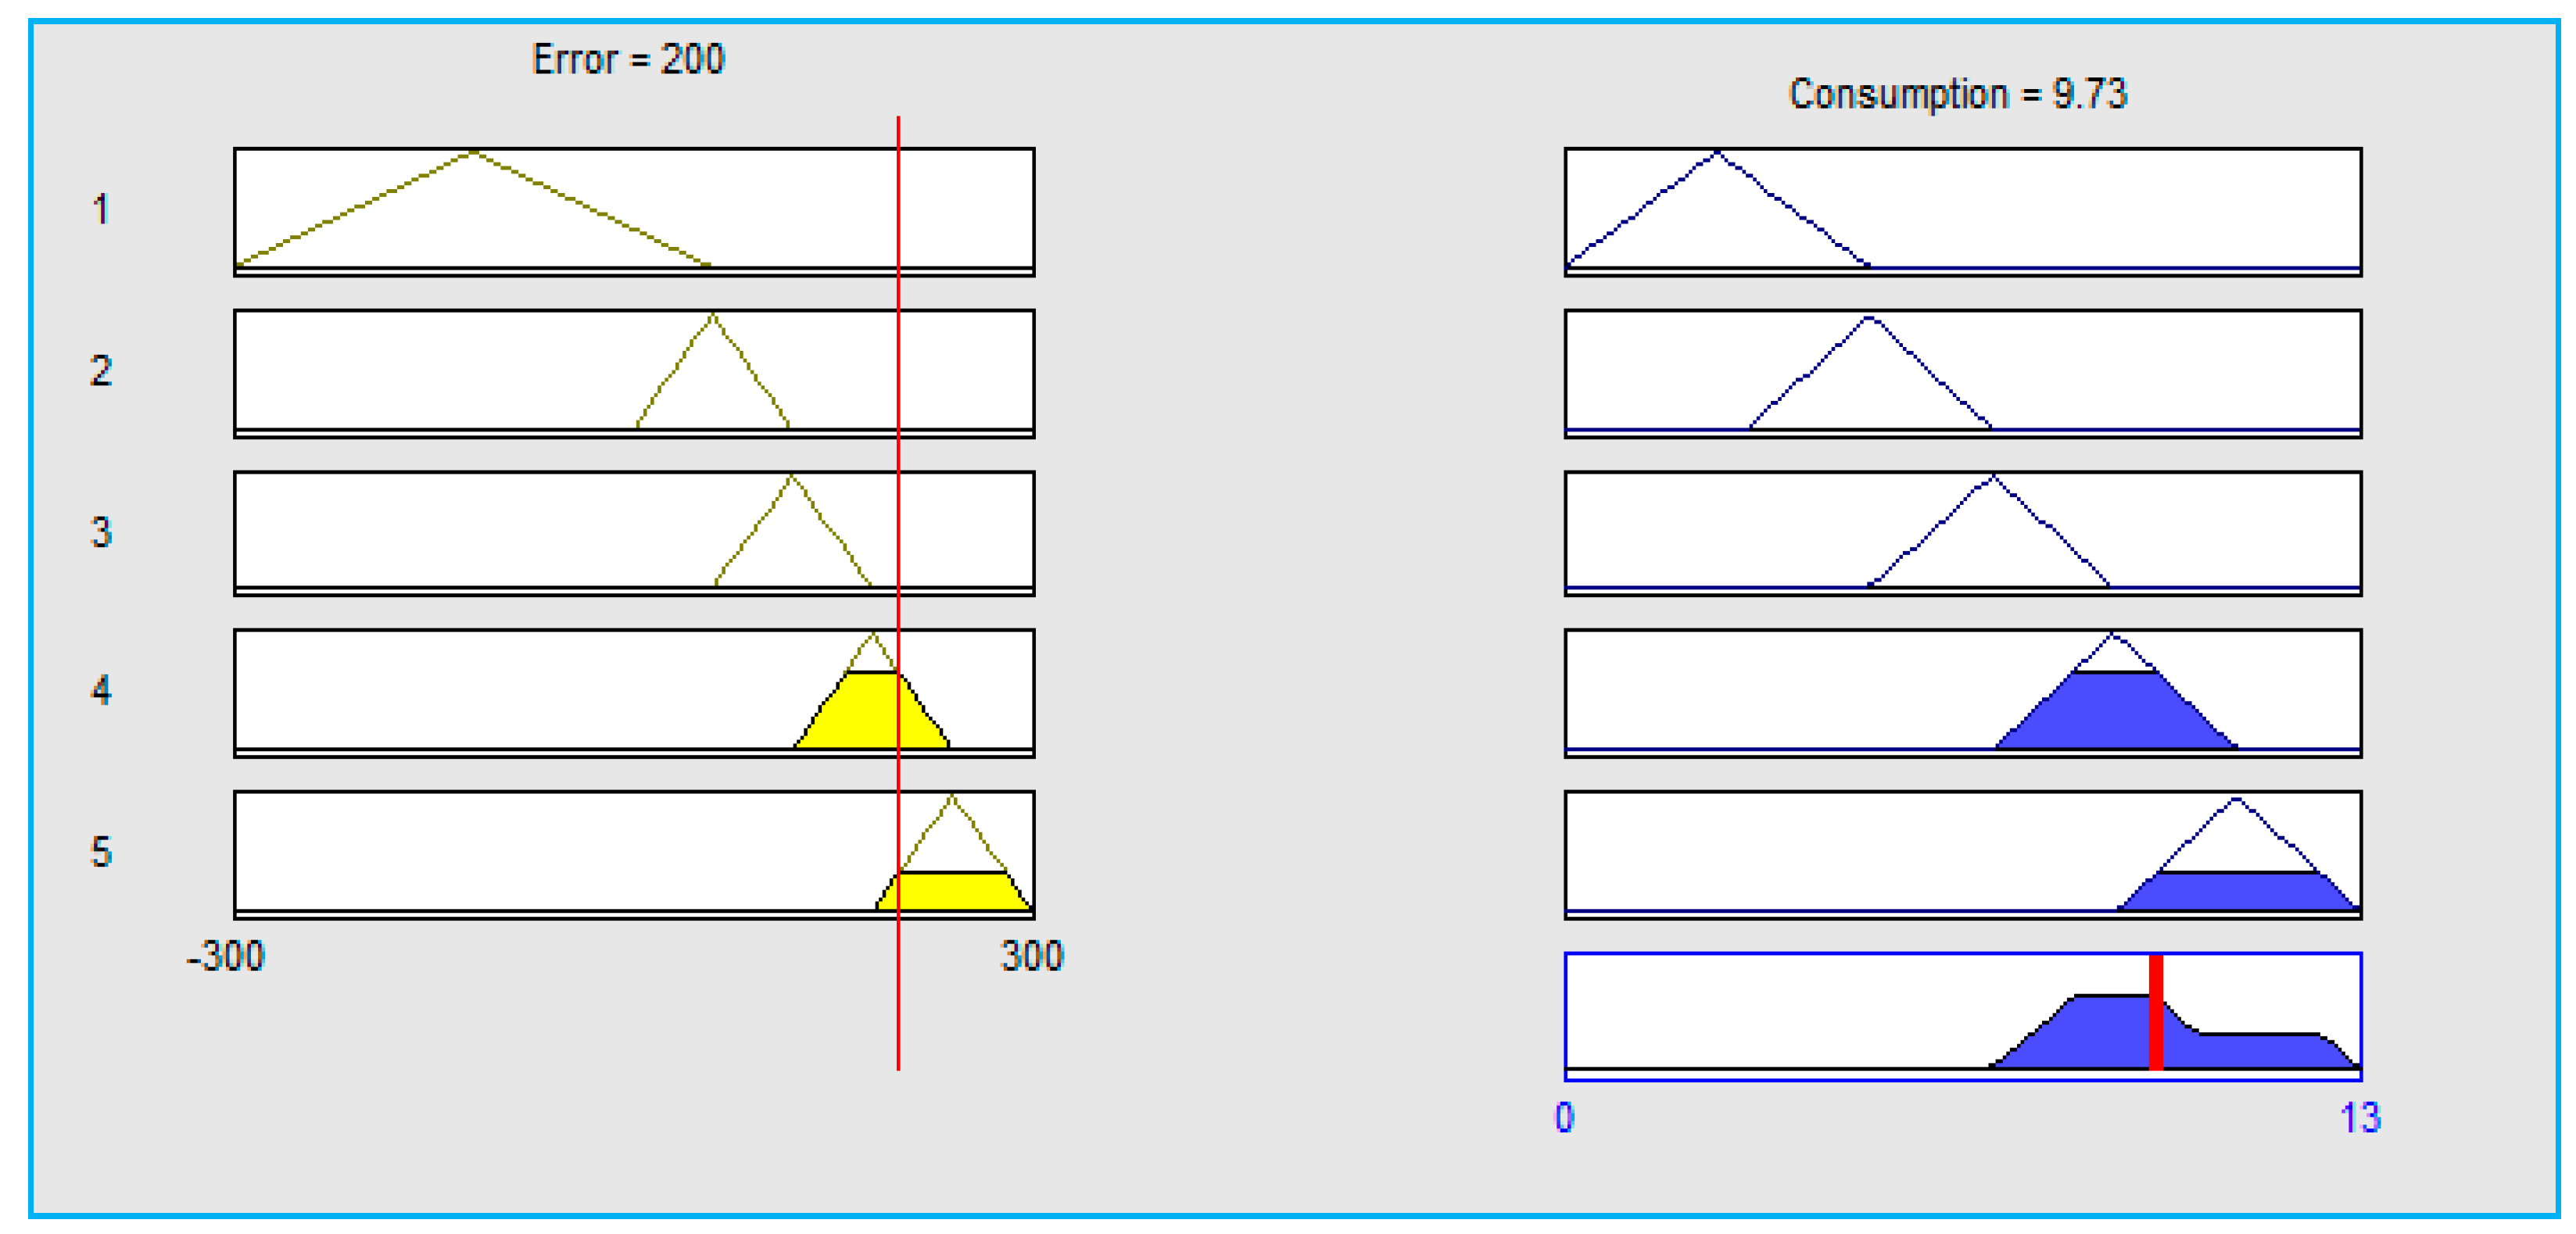
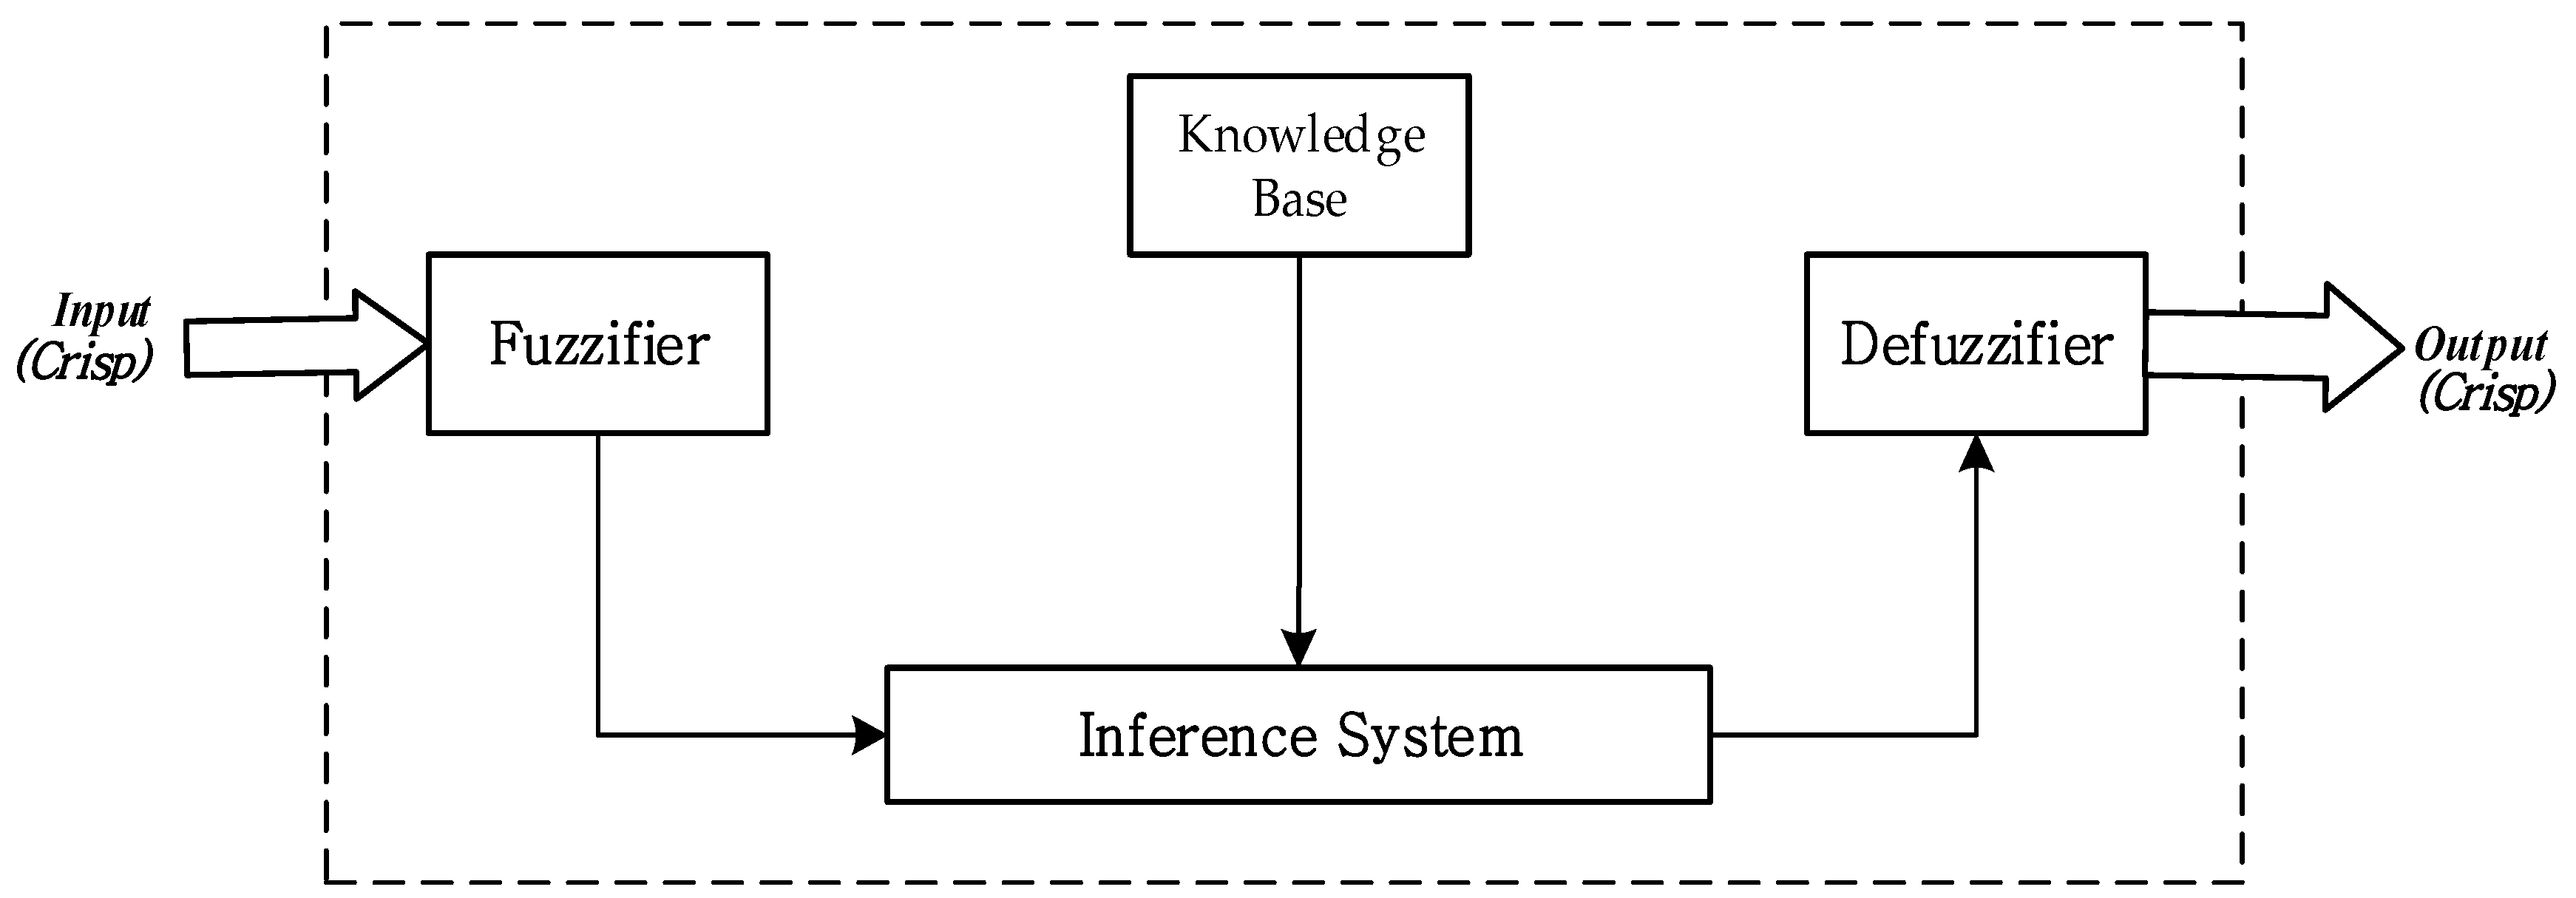
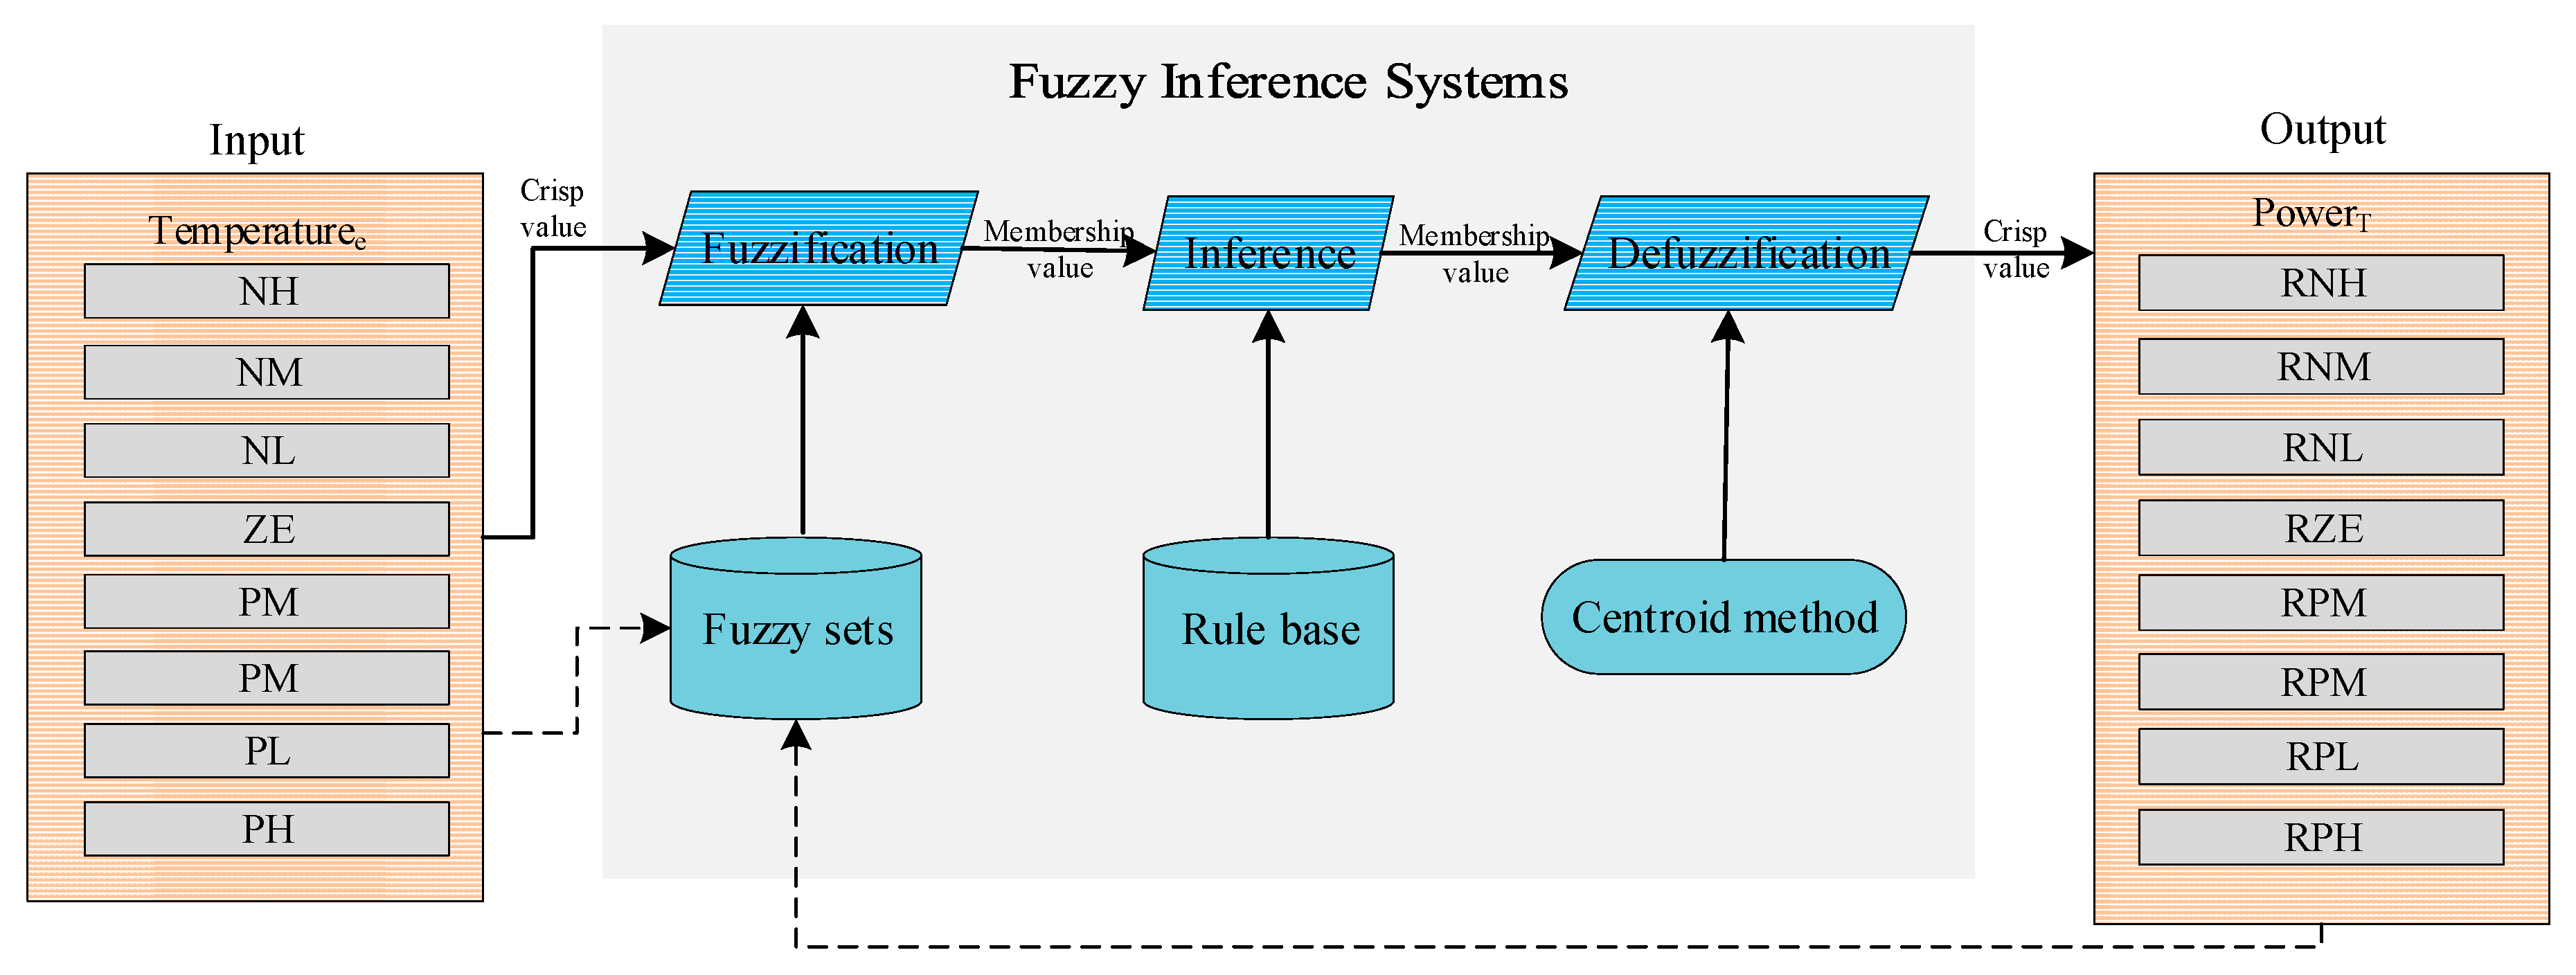
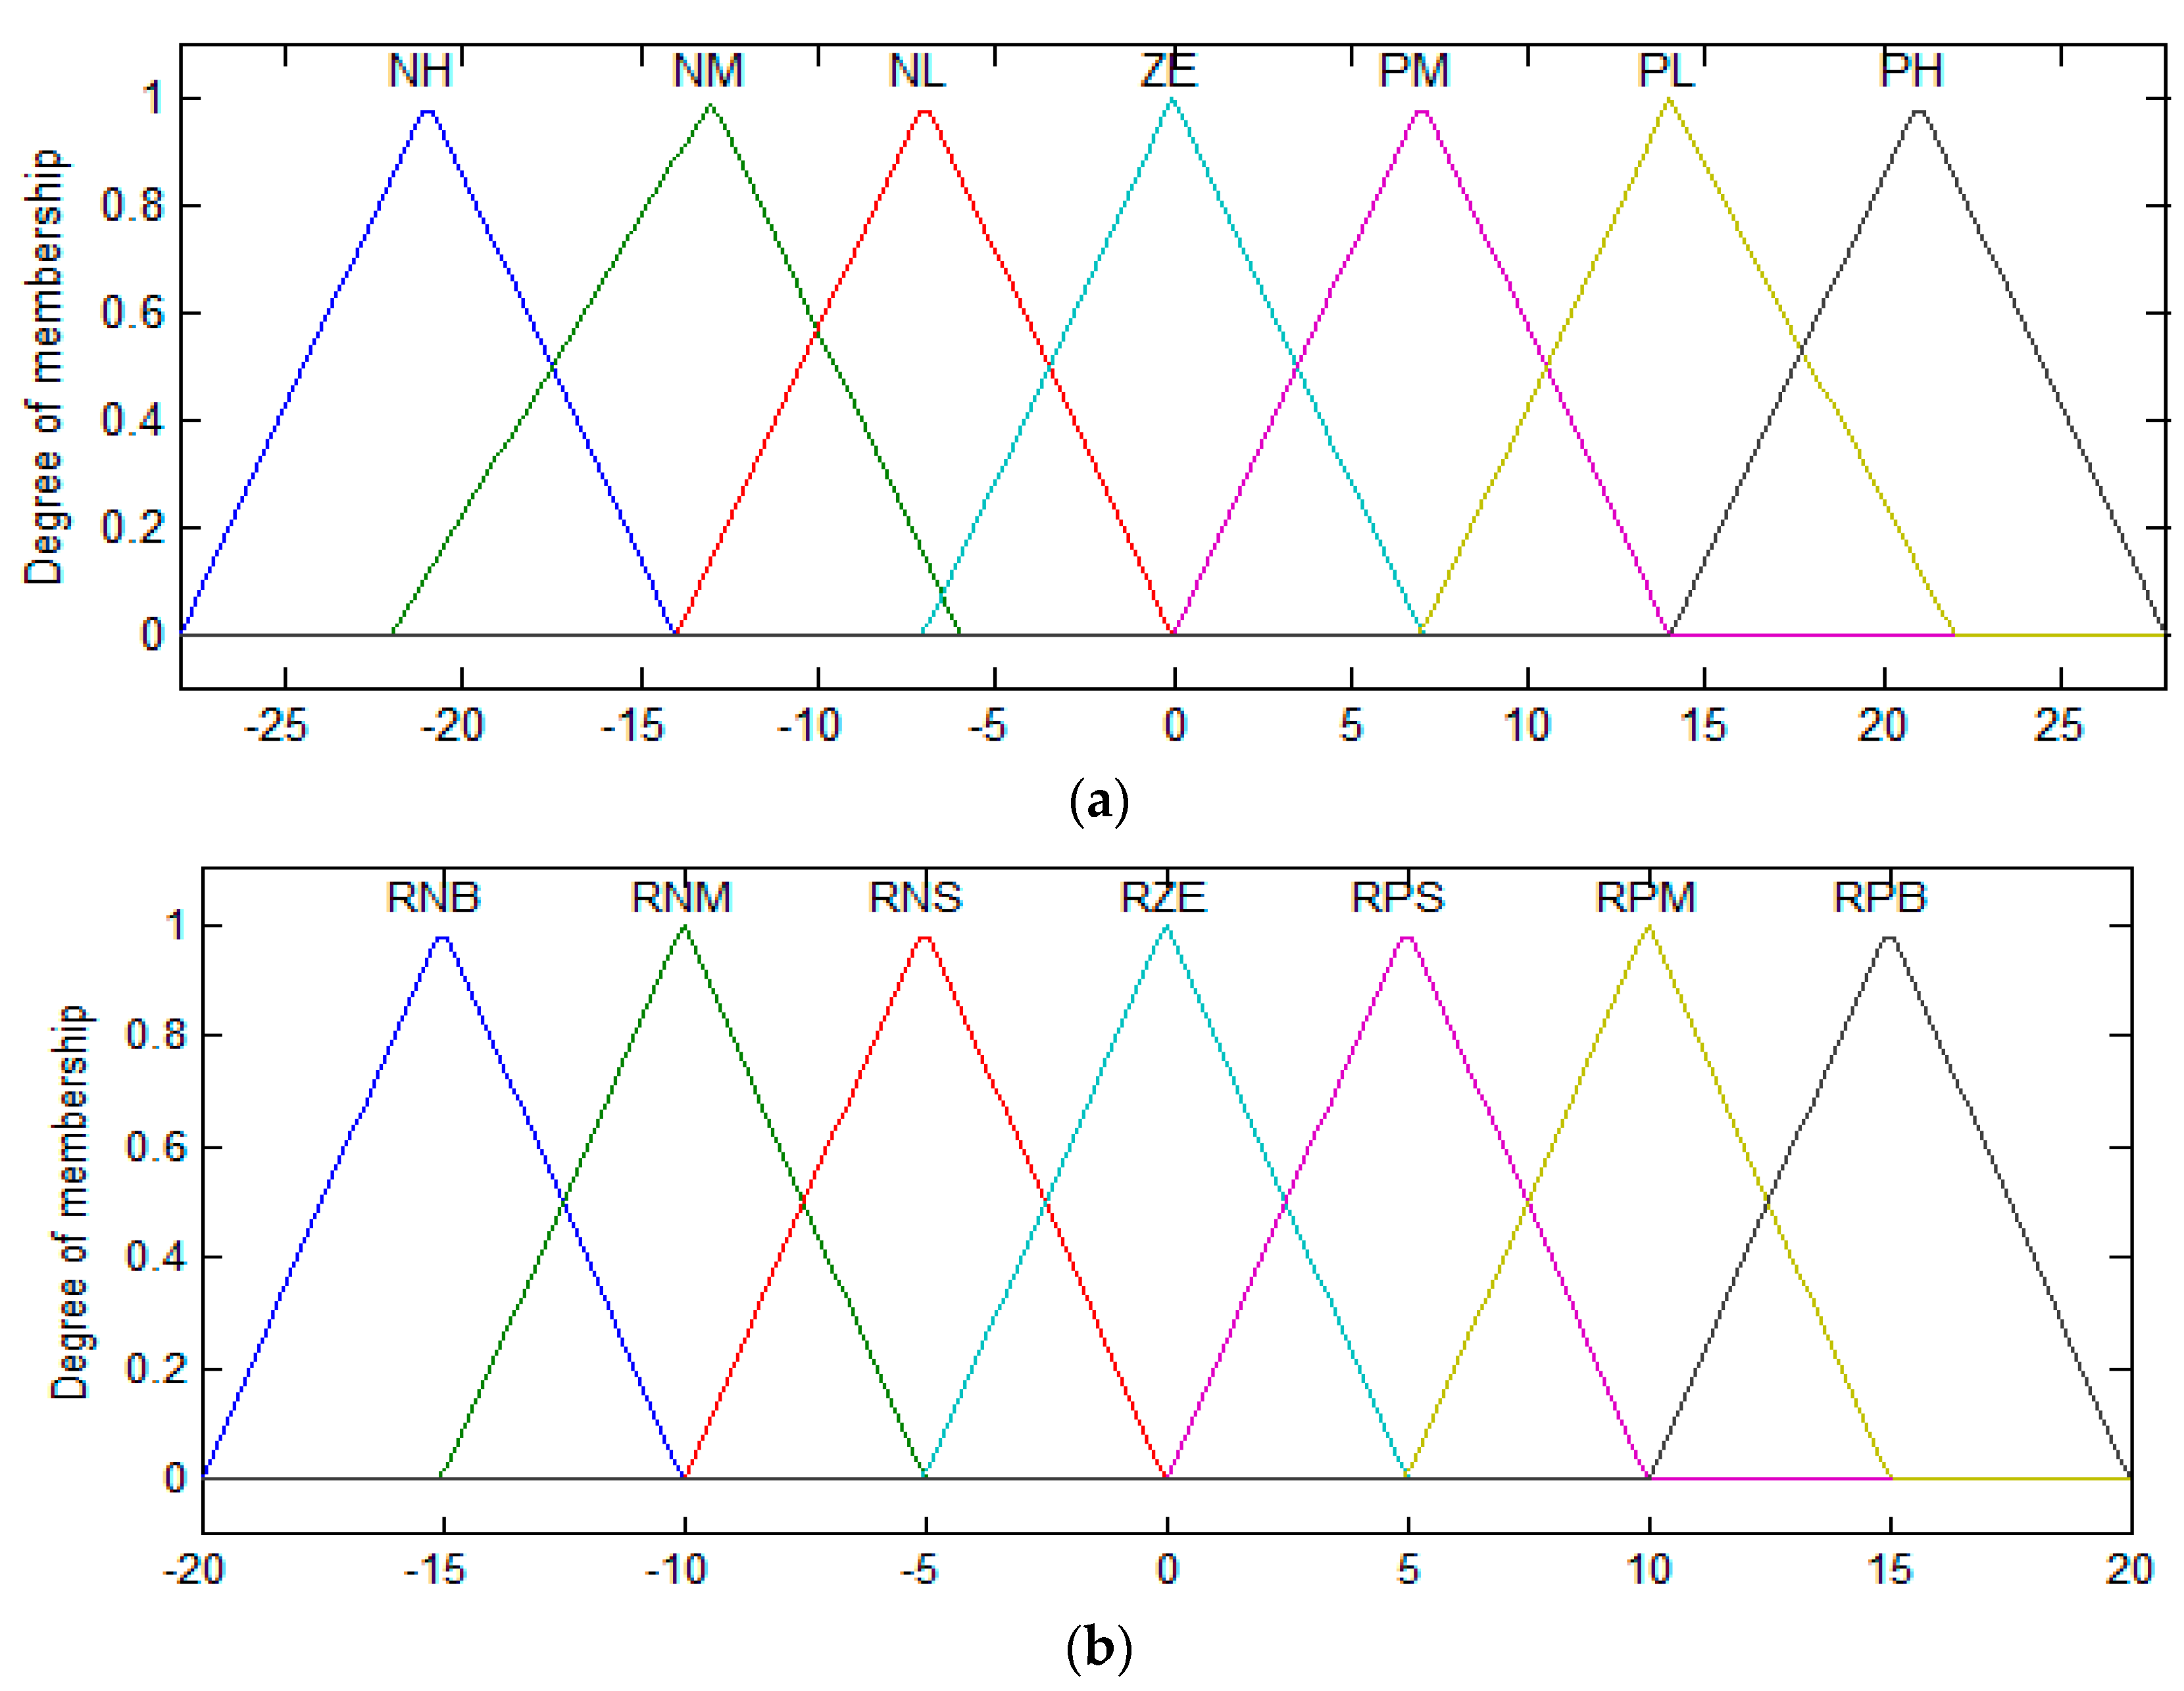
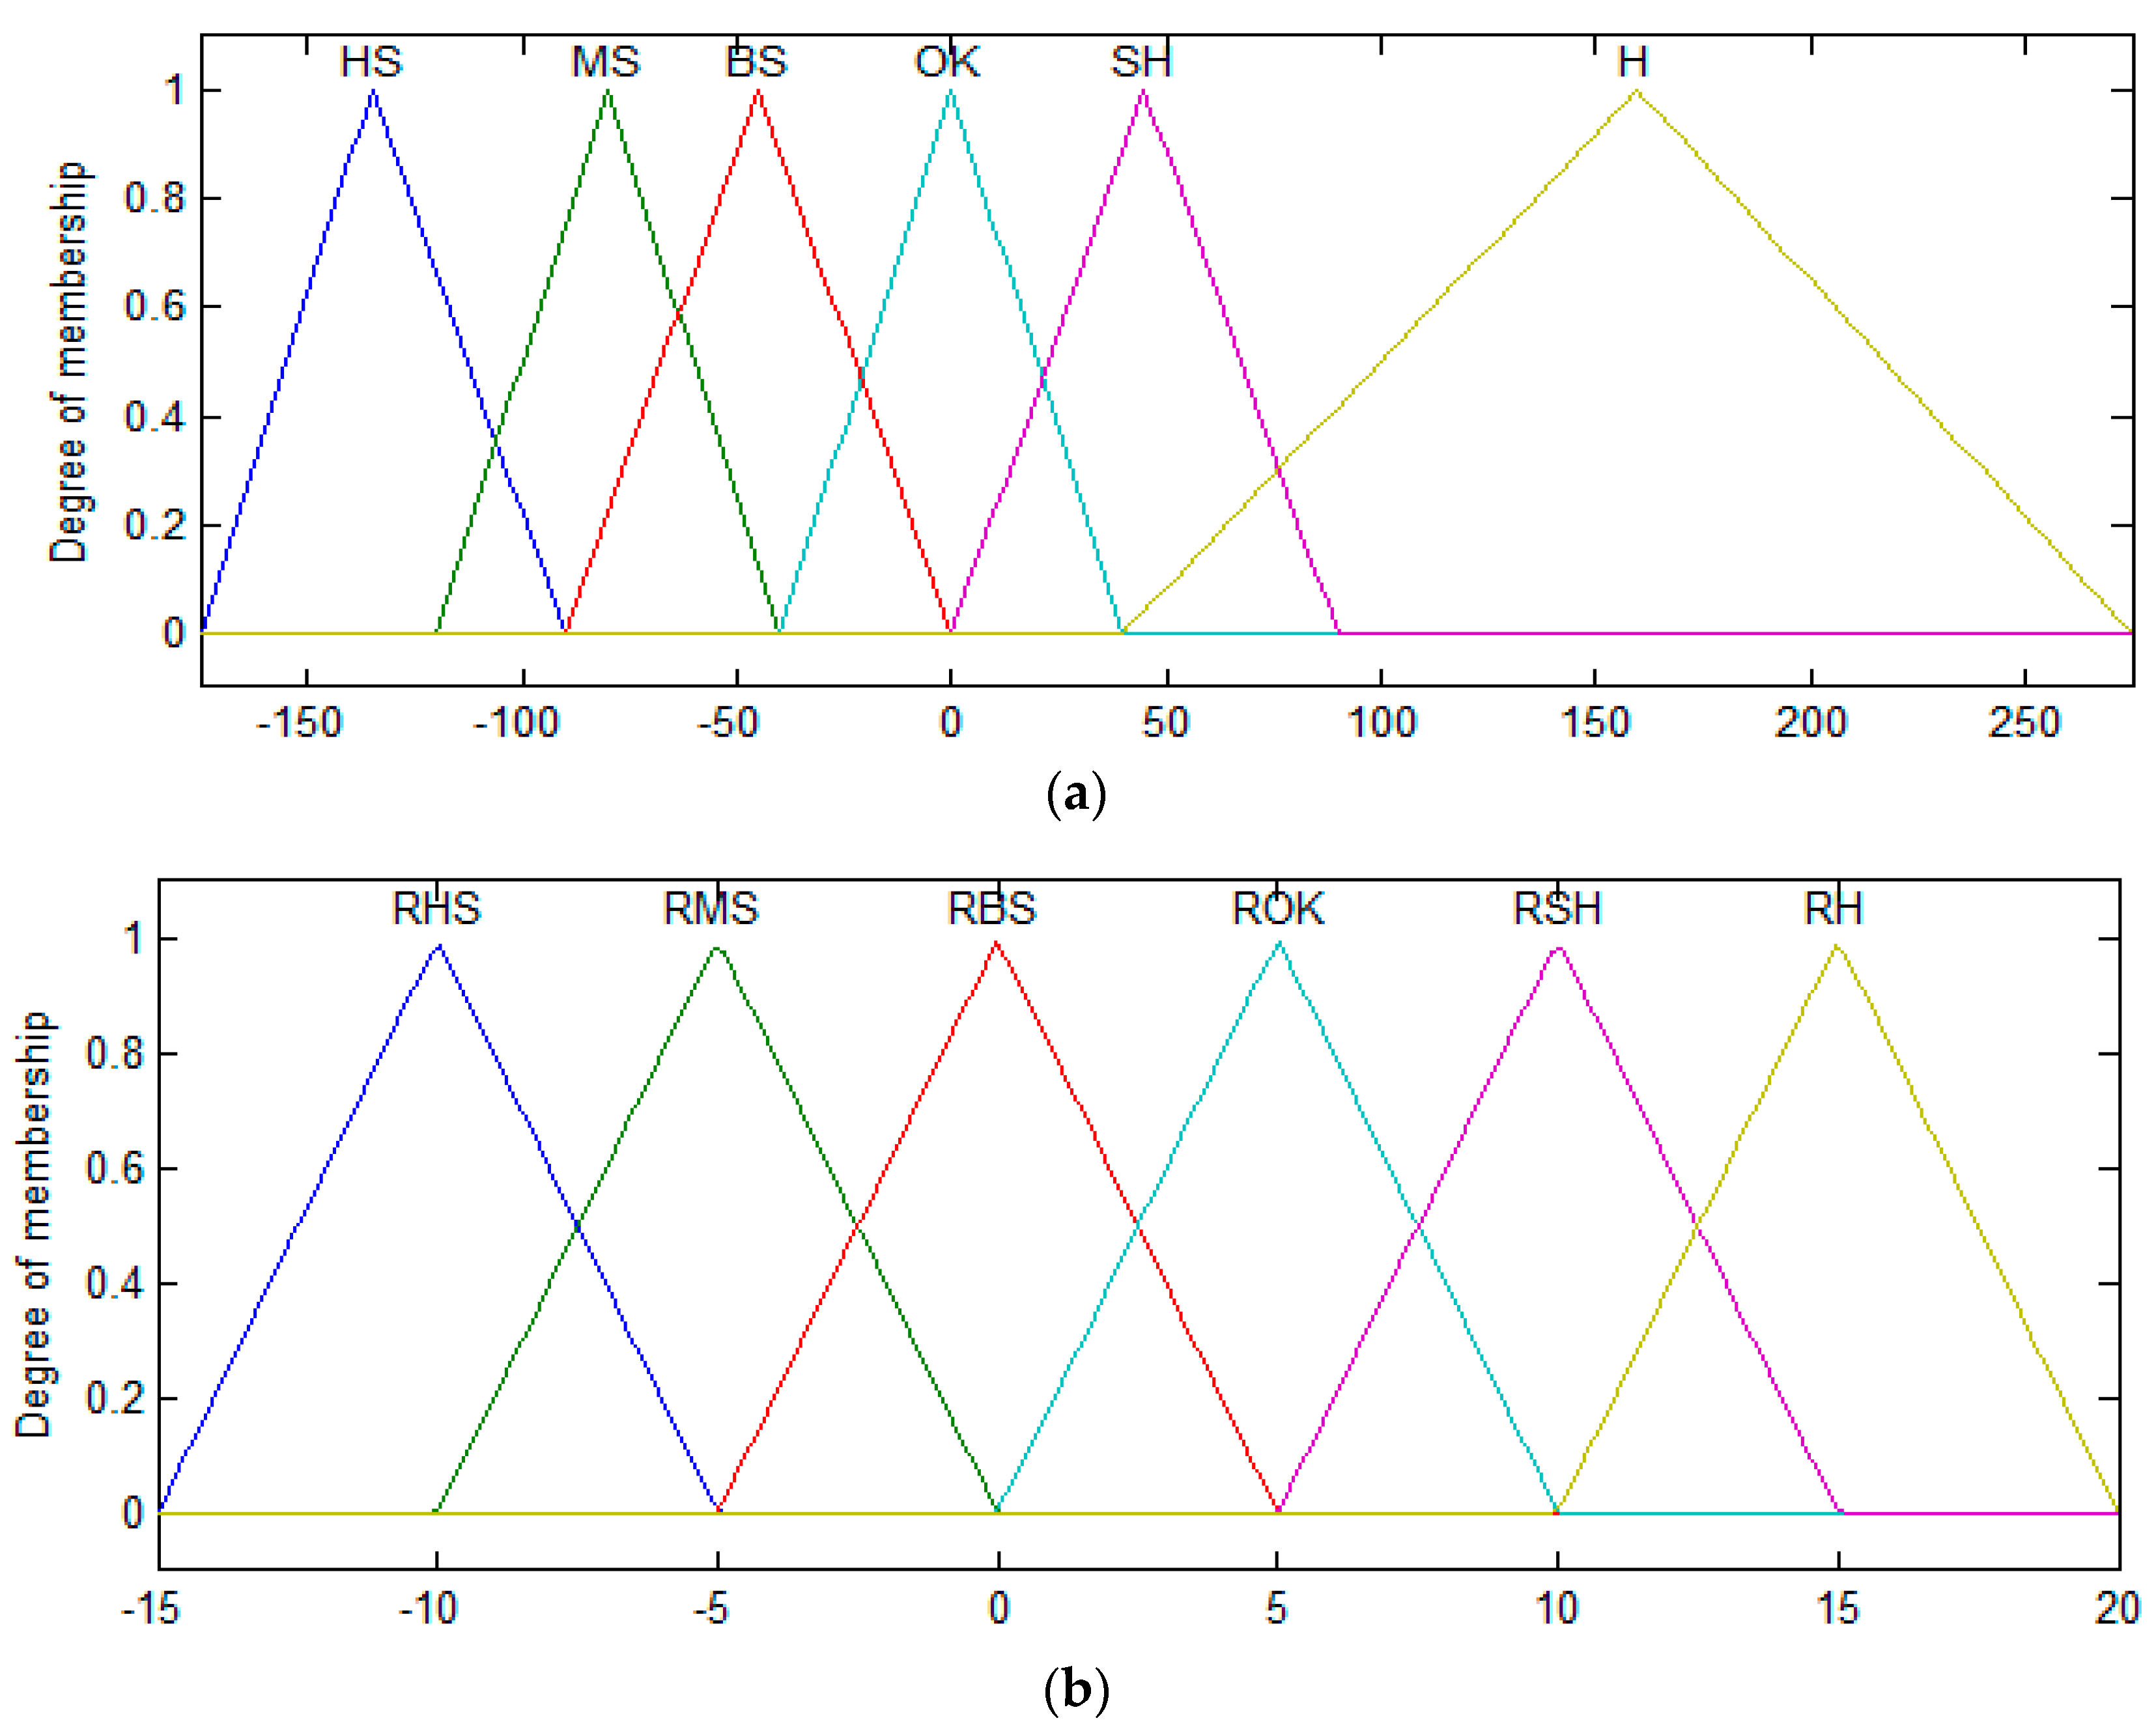
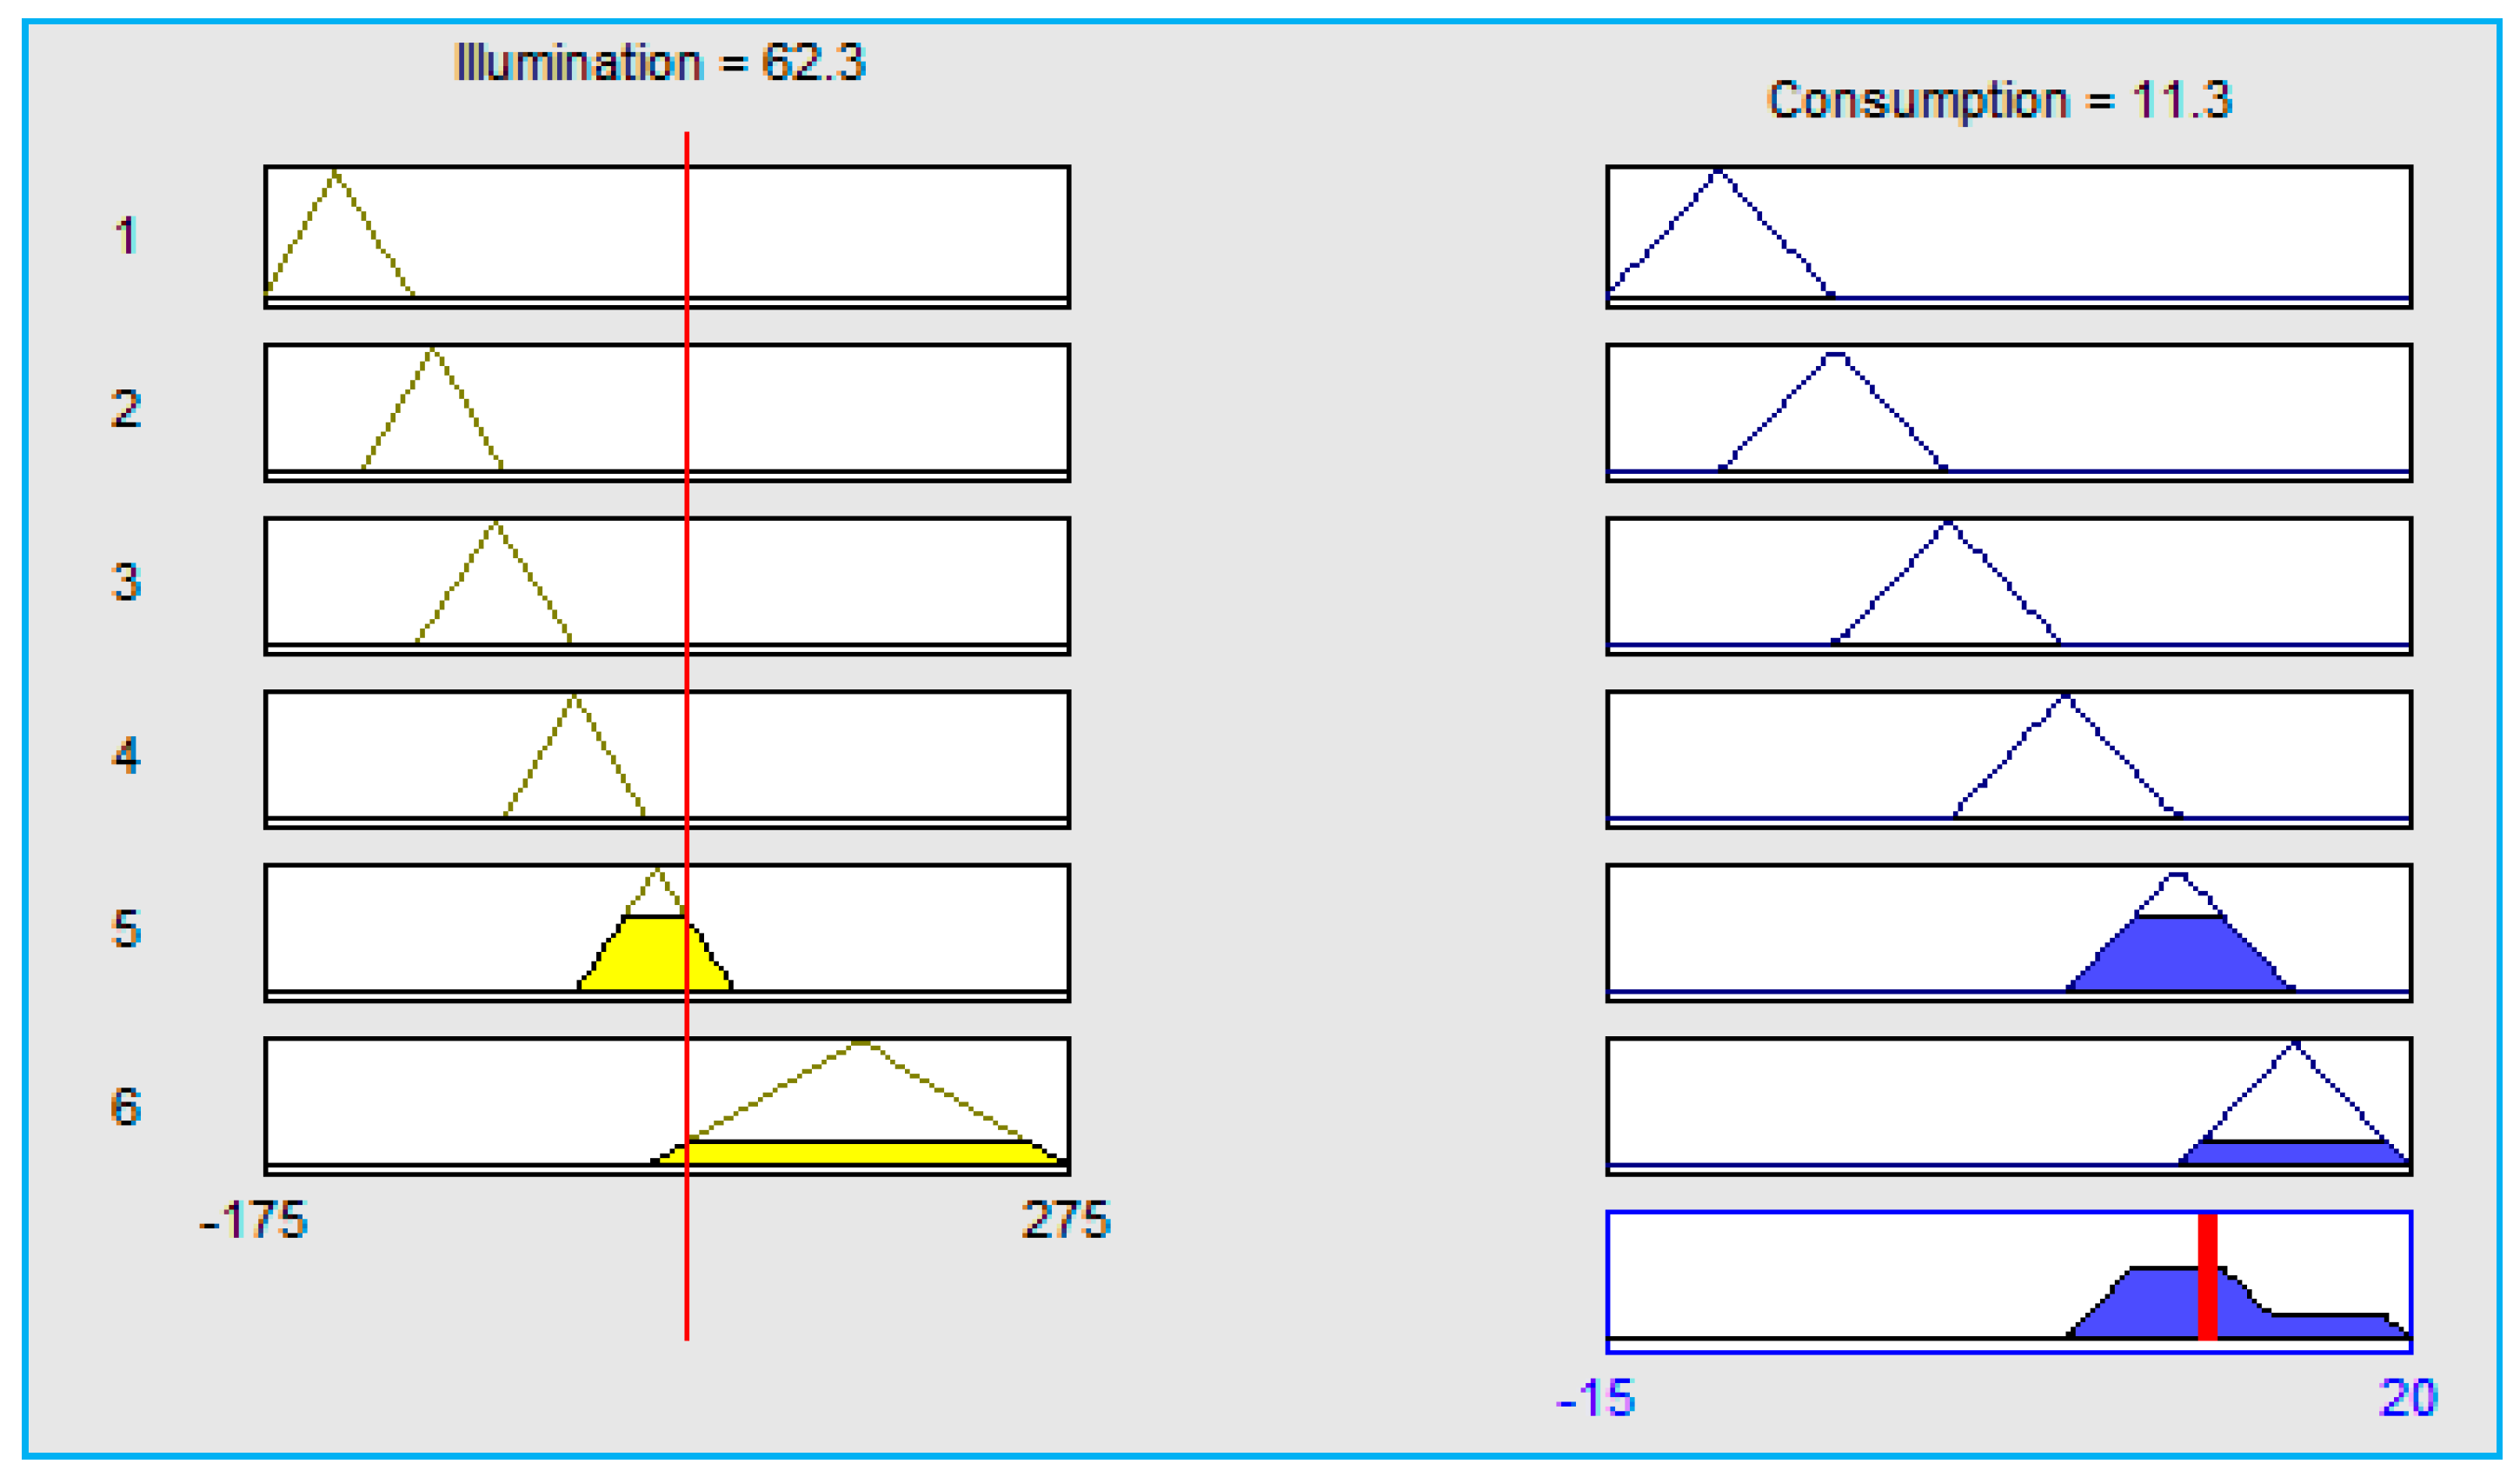
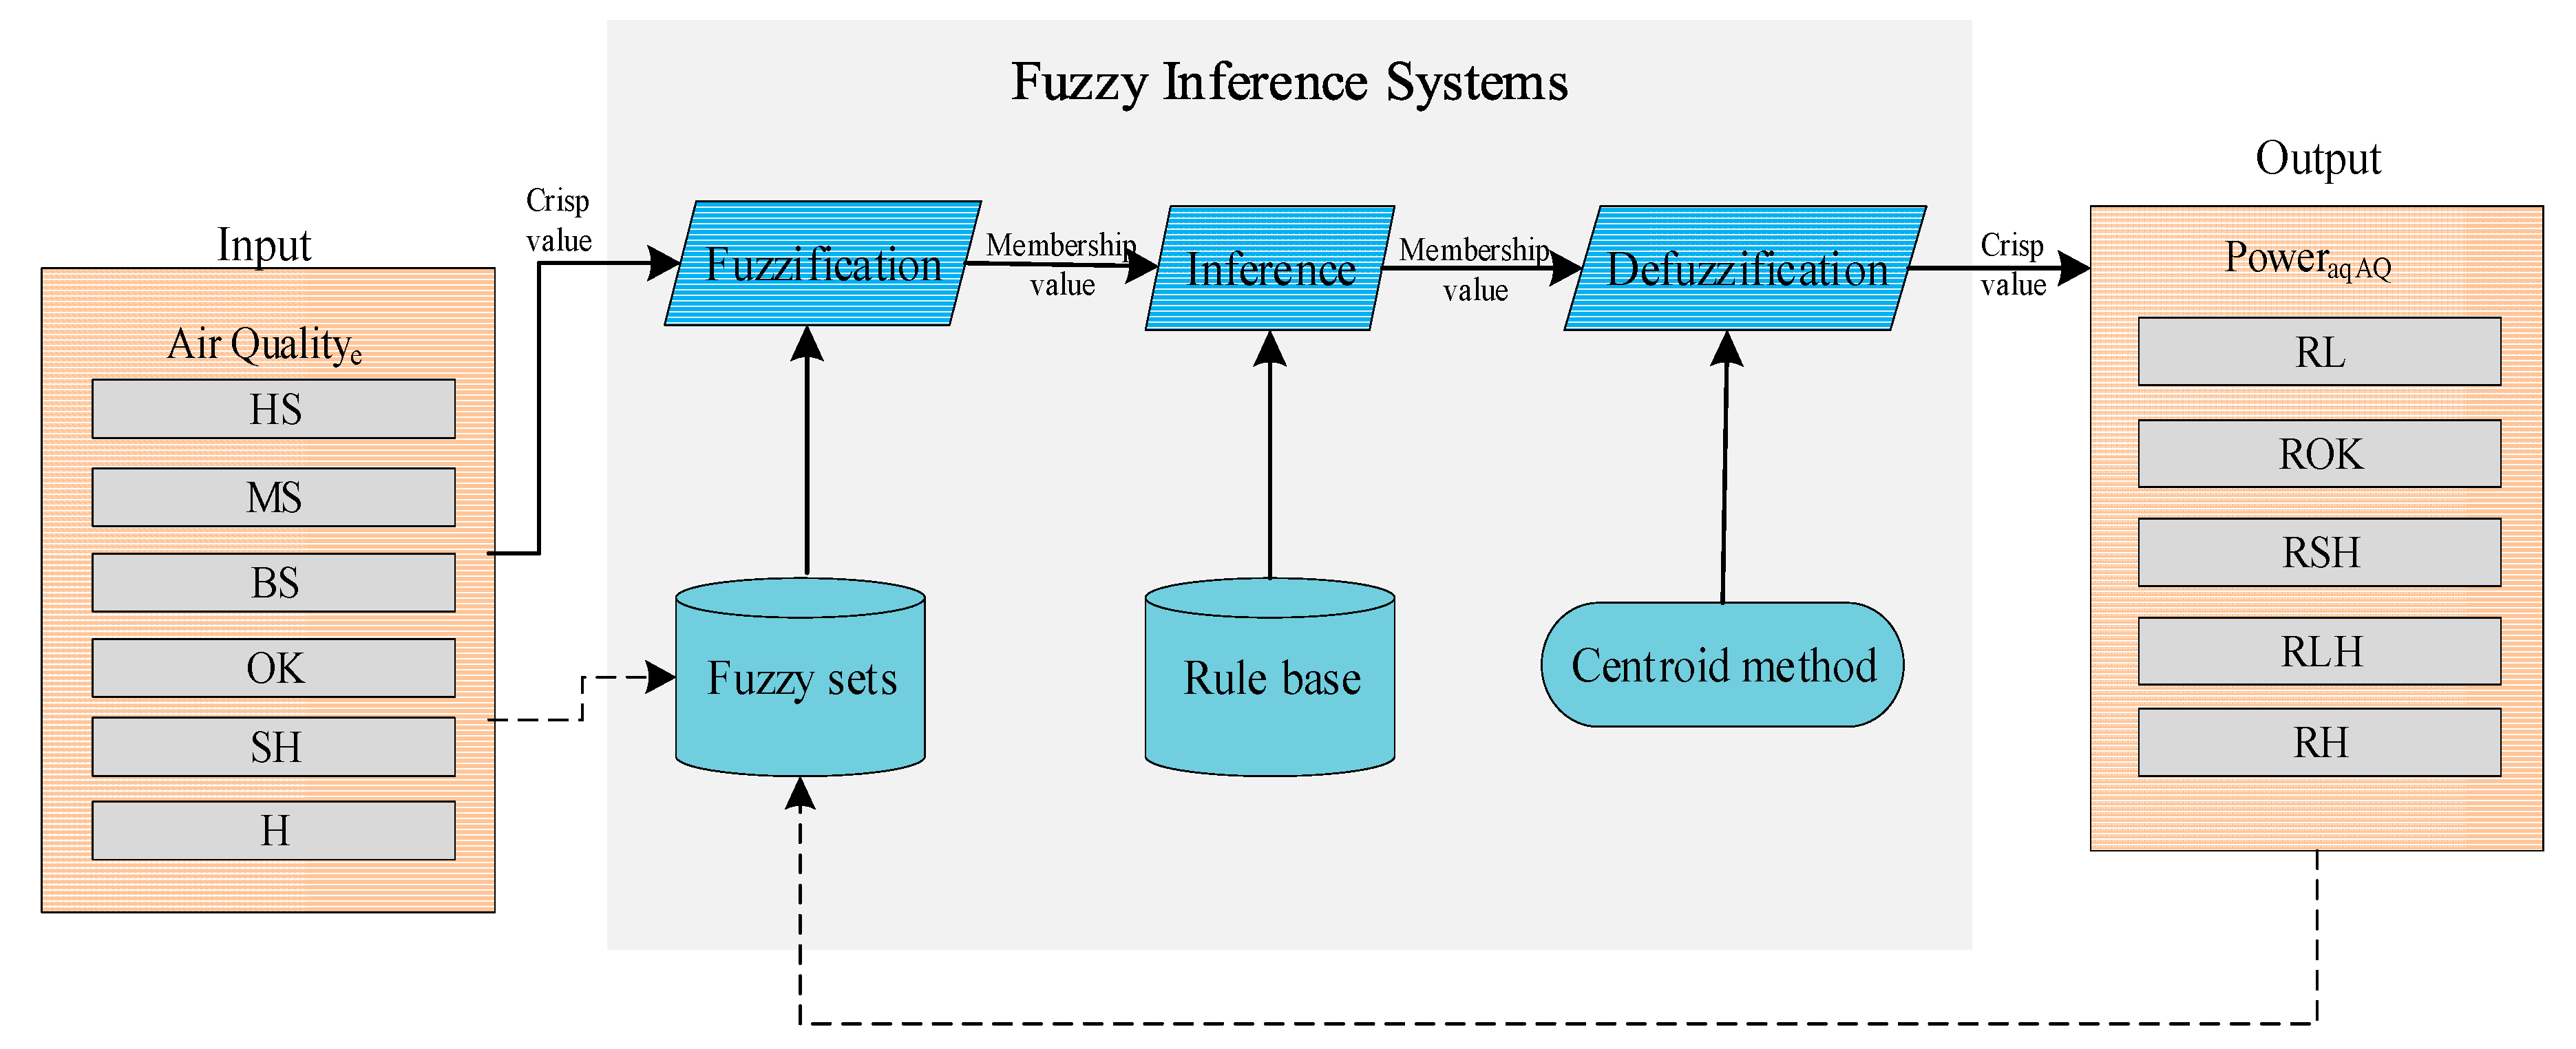
3.3. Fuzzy Controllers

First, the term fuzzy logic introduced in 1965 by Zadeh [32], it is a procedure of several valued logic. Fuzzy logic is a form of many-valued logic in which the truth values of variables may be any real number between 0 and 1. In Boolean logic, the variable truth values may be either 0 or 1, these values are called crisp values. Fuzzy logic is used to tackle the notion of incomplete truth, where the truth value lies between totally true and totally false [33]. The complete structure of fuzzy logic is shown in Figure 4, and consists of fuzzifier, knowledge base, inference engine, and defuzzifier modules. Inputs to the fuzzifier are numerical values and it produces the fuzzy values by applying Membership Functions (MFs). The evaluation of all rules in the knowledge base is carried out, and then the aggregate of each MF value is calculated using a maximum operation. The defuzzification method has been carried out by conversion of fuzzy values to non-fuzzy values using the centroid method. In the proposed methodology we have used three fuzzy controllers, namely temperature fuzzy controller, illumination fuzzy controller and air quality fuzzy controller. The input to the temperature fuzzy controller is the error difference between actual temperature and optimized temperature, illumination fuzzy controller inputs is the error difference between actual illumination and optimized illumination and similarly input to the air quality fuzzy controller is the error difference between actual air quality and optimized air quality. The output of temperature fuzzy controller, illumination fuzzy controller, and air quality fuzzy controller is the required power for cooling/heating (temperature fuzzy controller), lighting (illumination fuzzy controller), and CO2 concentration.

3.4. Coordinator Agent

The input to the coordinator agent is the desired power from fuzzy controllers for the cooling/heating, lighting, and ventilation. The coordinator agent provides the power available from power sources. Equation (9) is used to compute the total required power:
TRP = RPT + RPL + RPV
where TRP is the total required power, RPT is the required power for cooling/heating, RPL is required power for the lightening system and RPV is required power for ventilation.

3.5. Building Actuators

Building actuators are electronic devices used inside the building that consume energy, i.e., AC (for cooling), heater (for heating), and freezer/refrigerator (cooling). The status of these actuators changes according to the error difference between environmental parameters and the BA-optimized parameters.

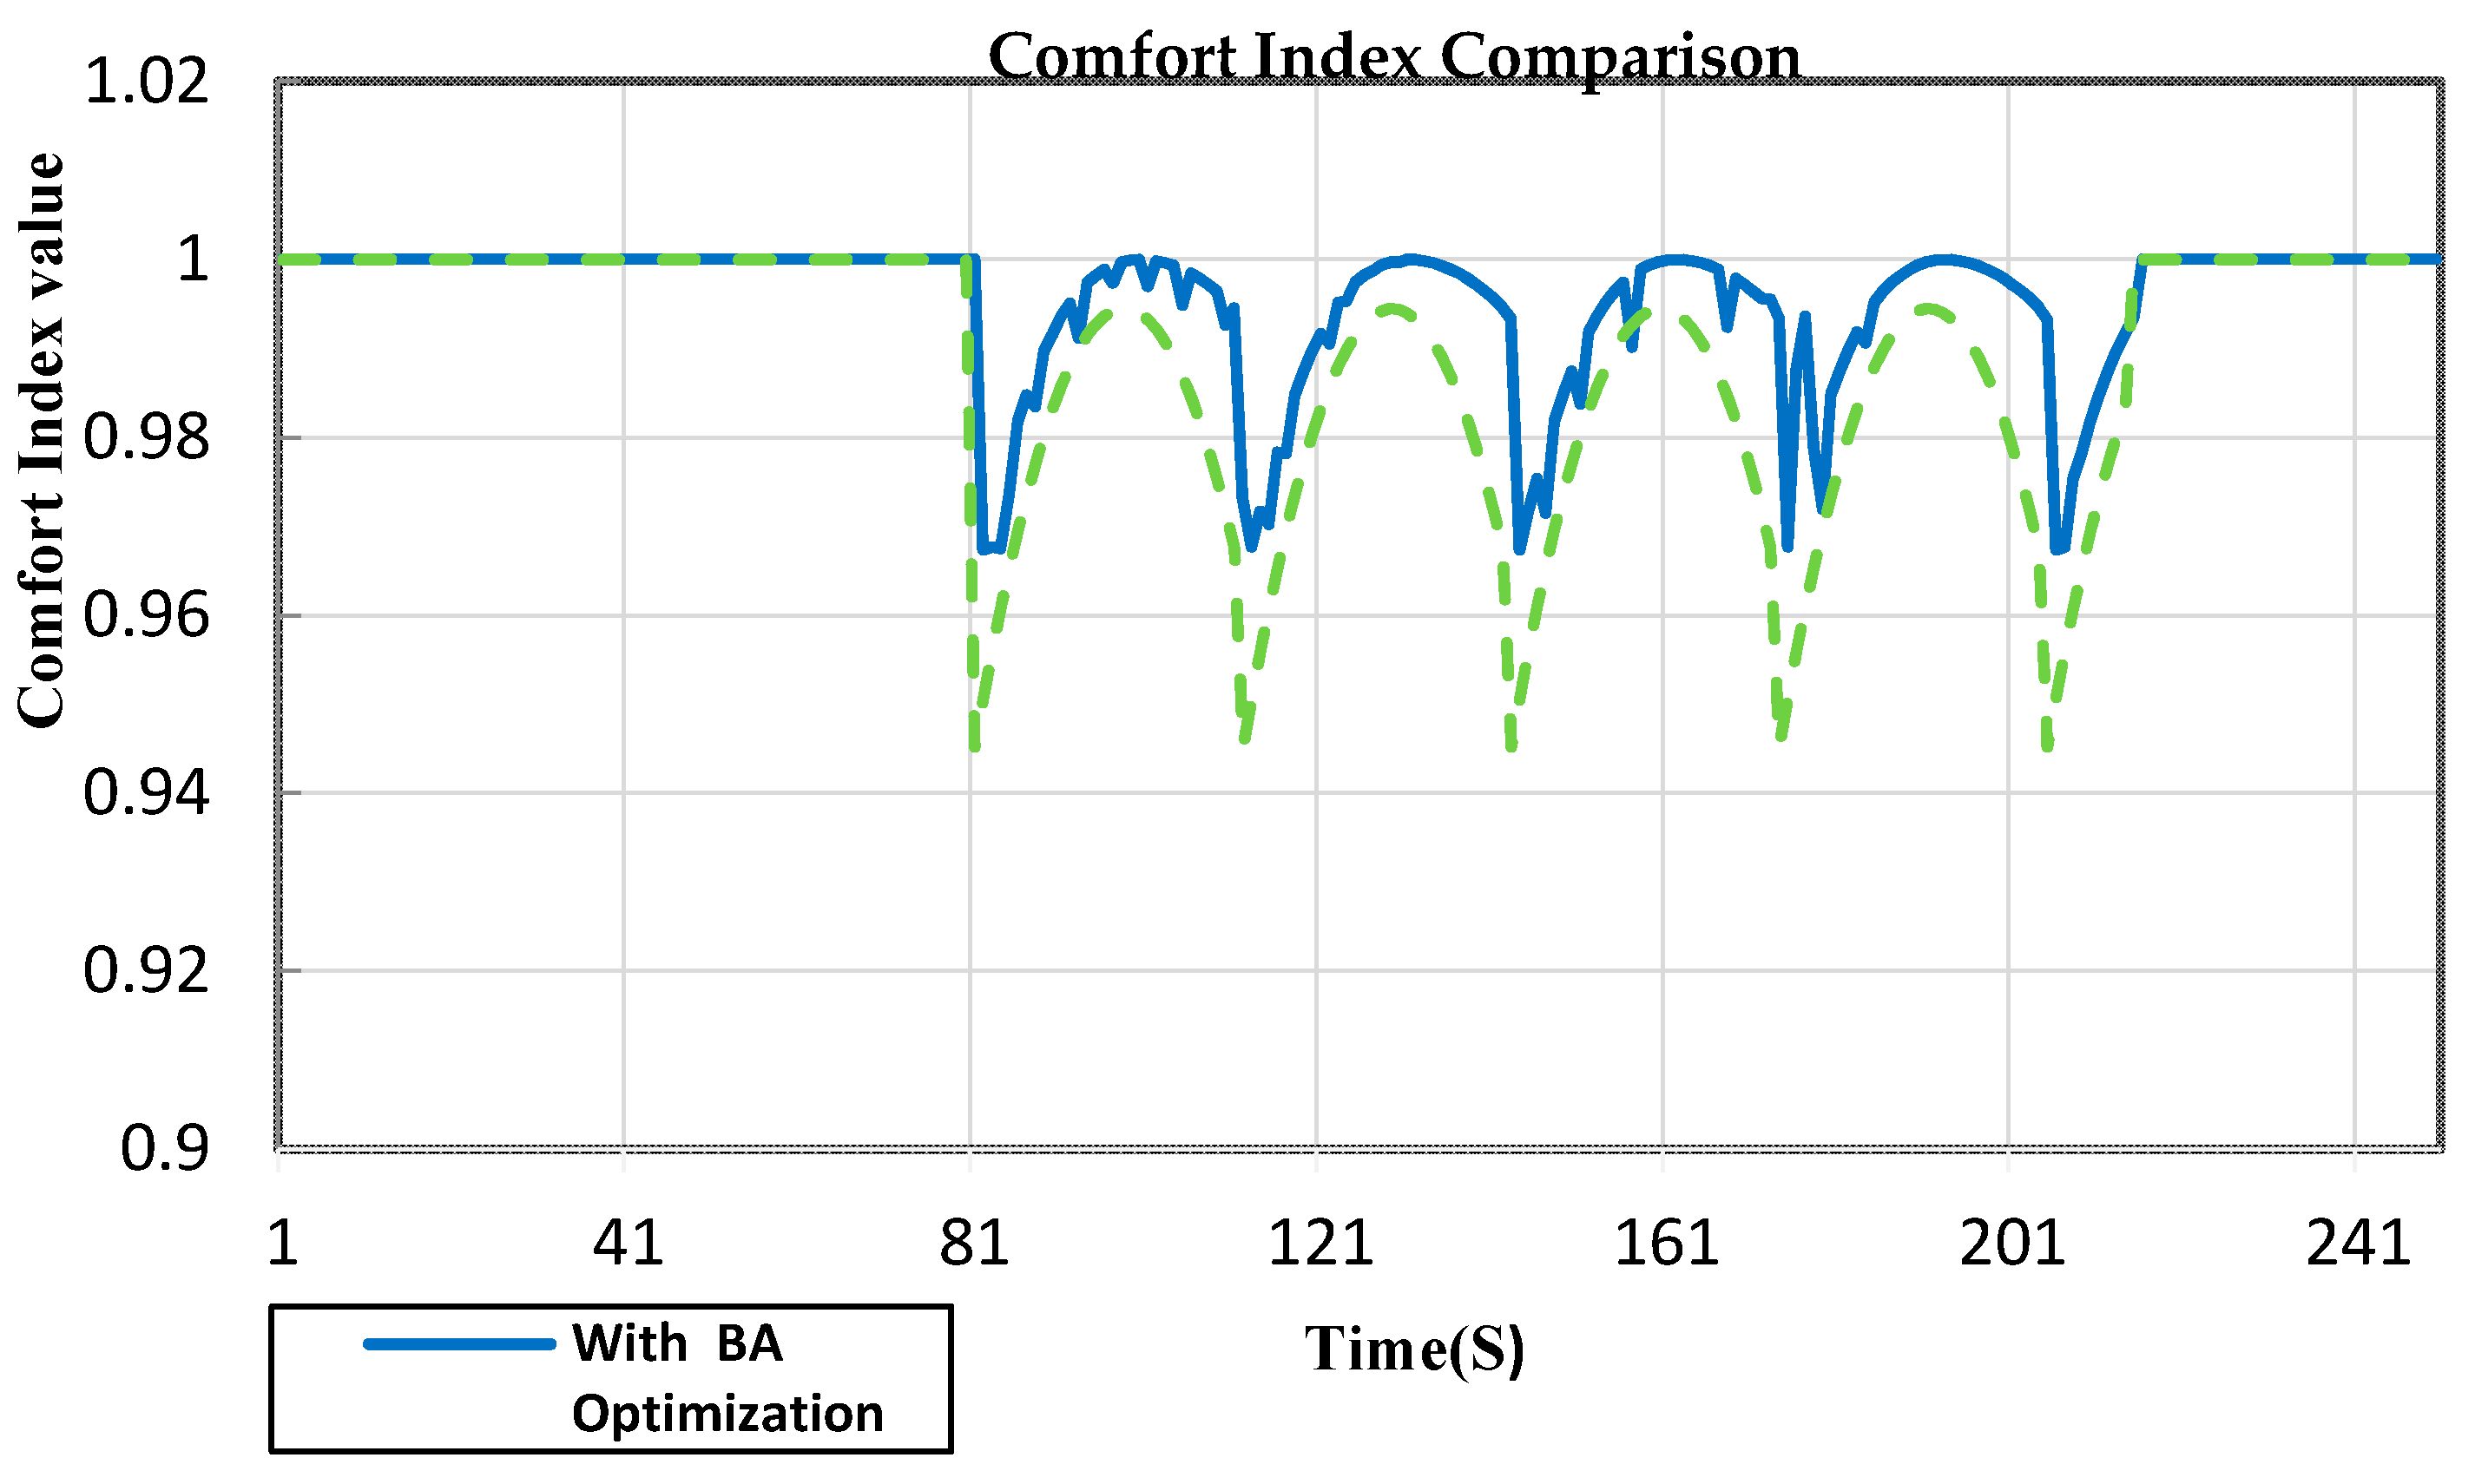
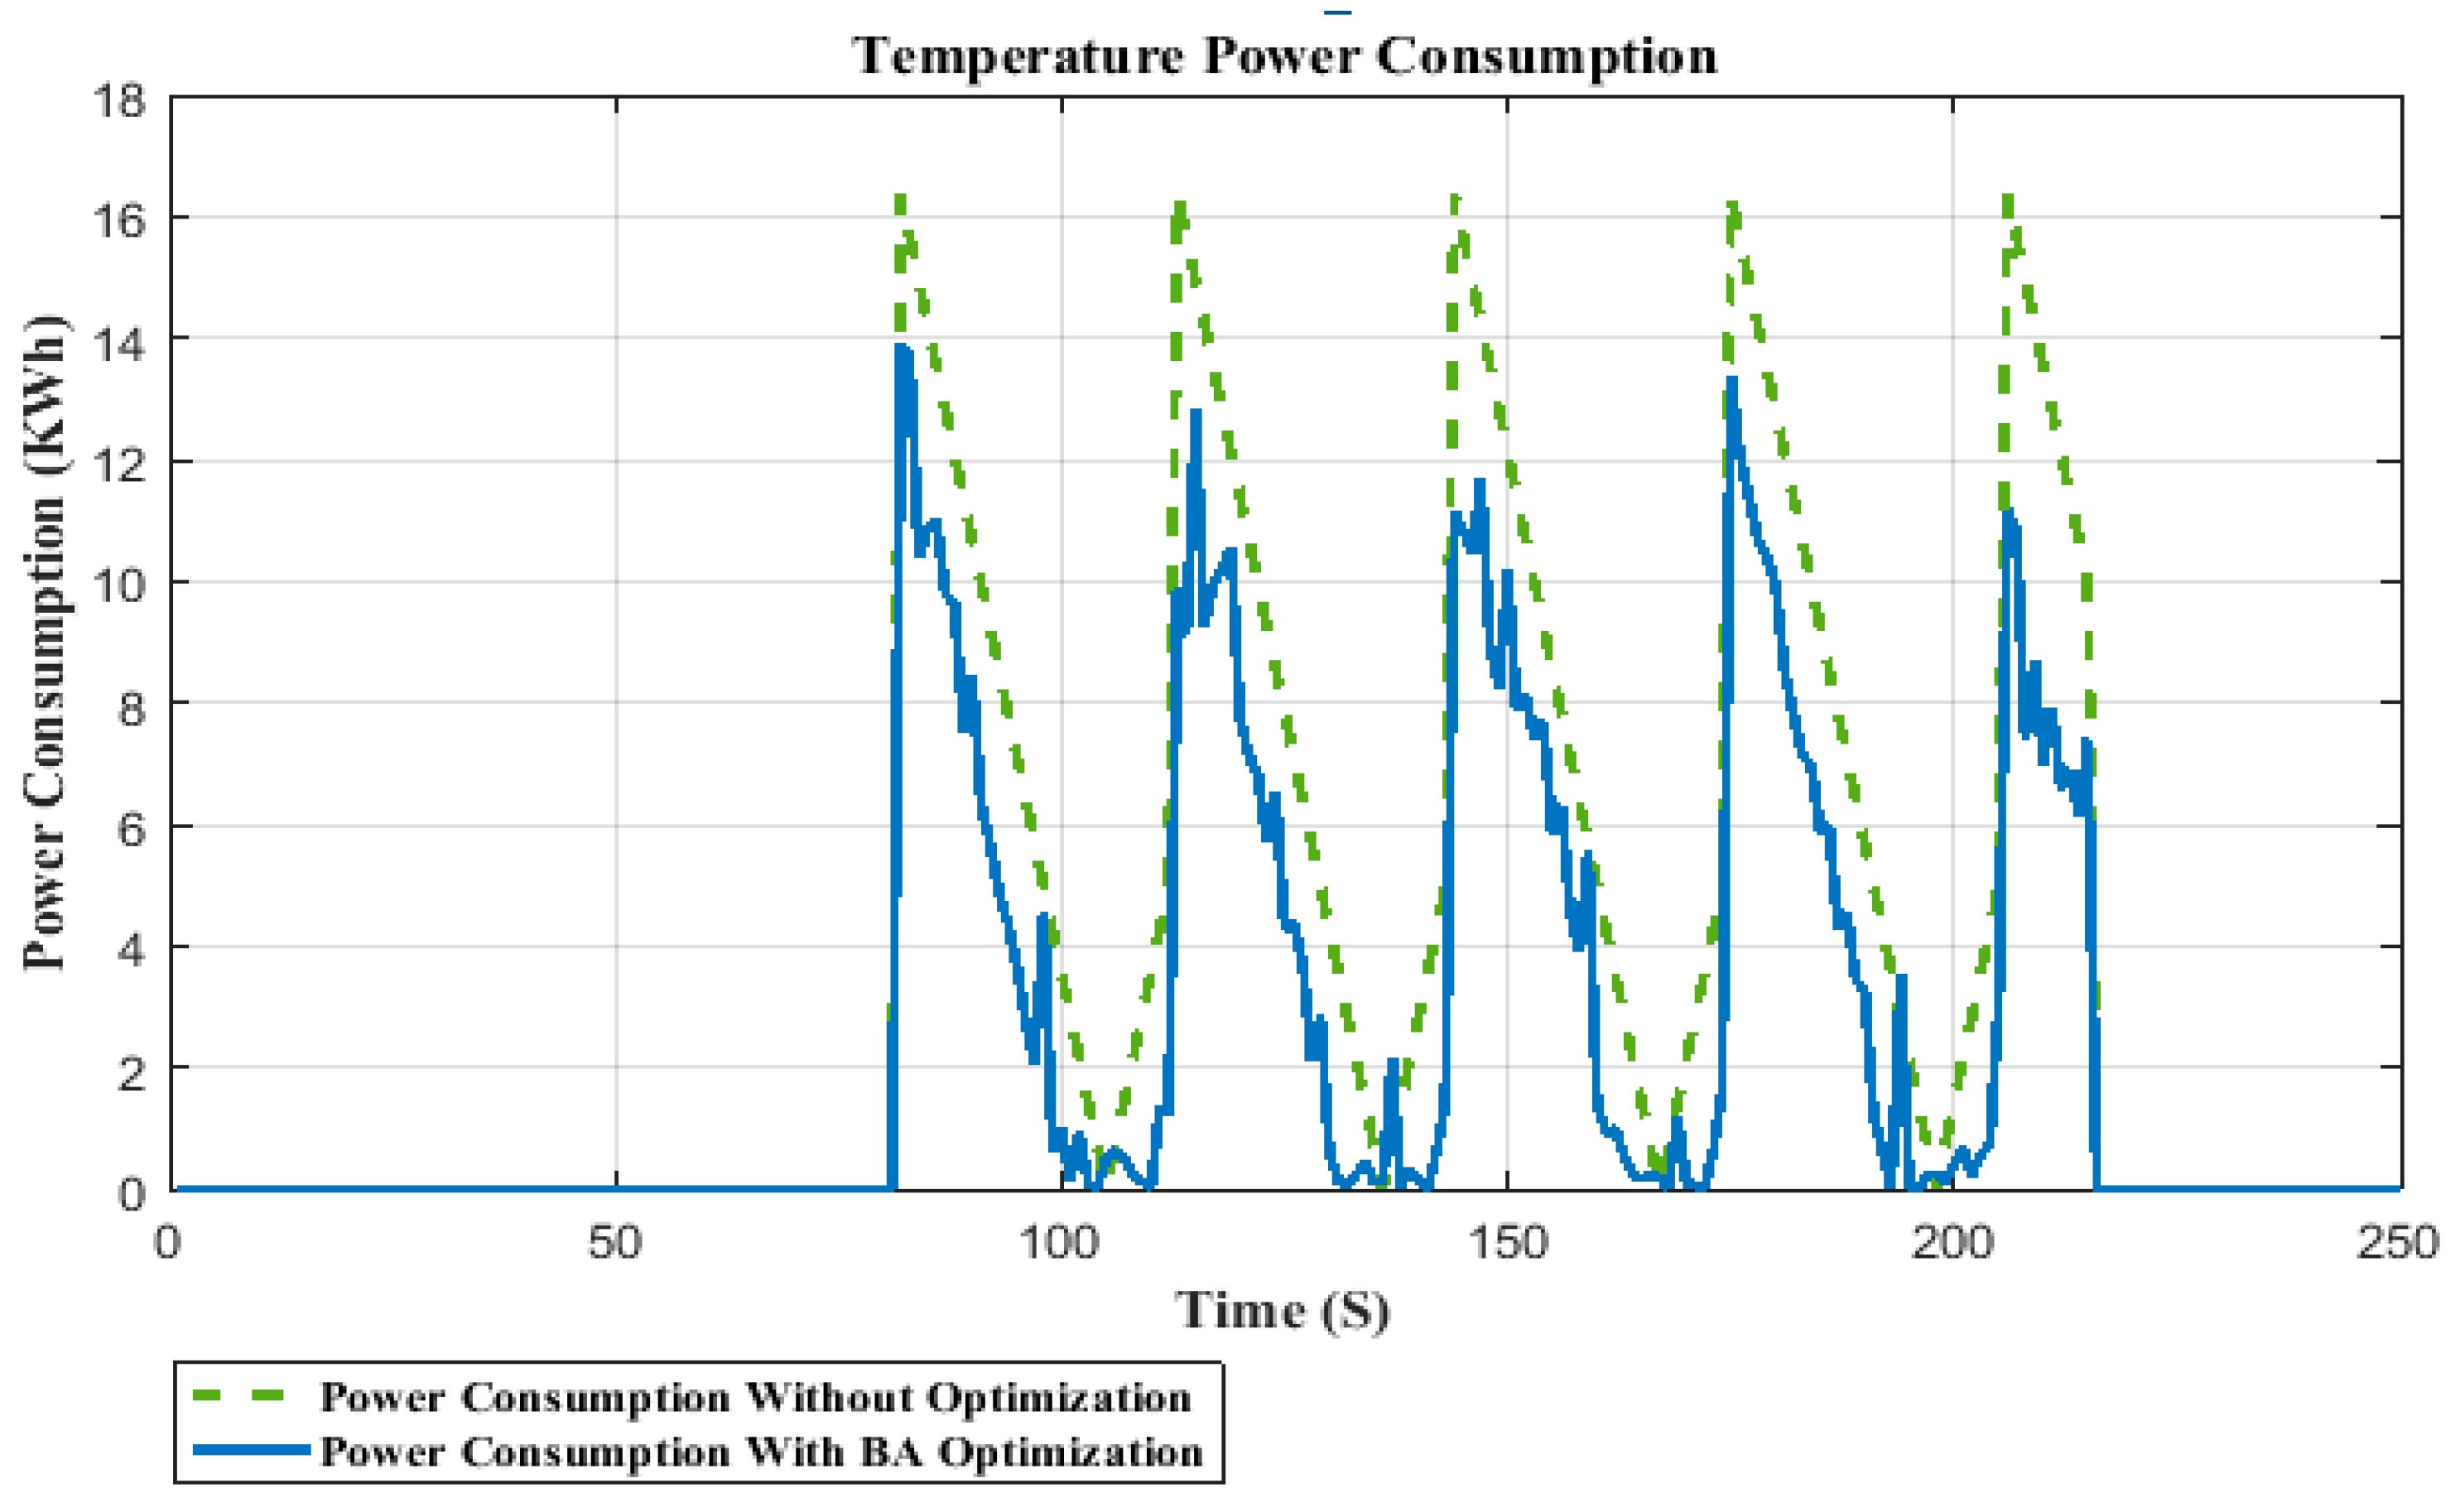
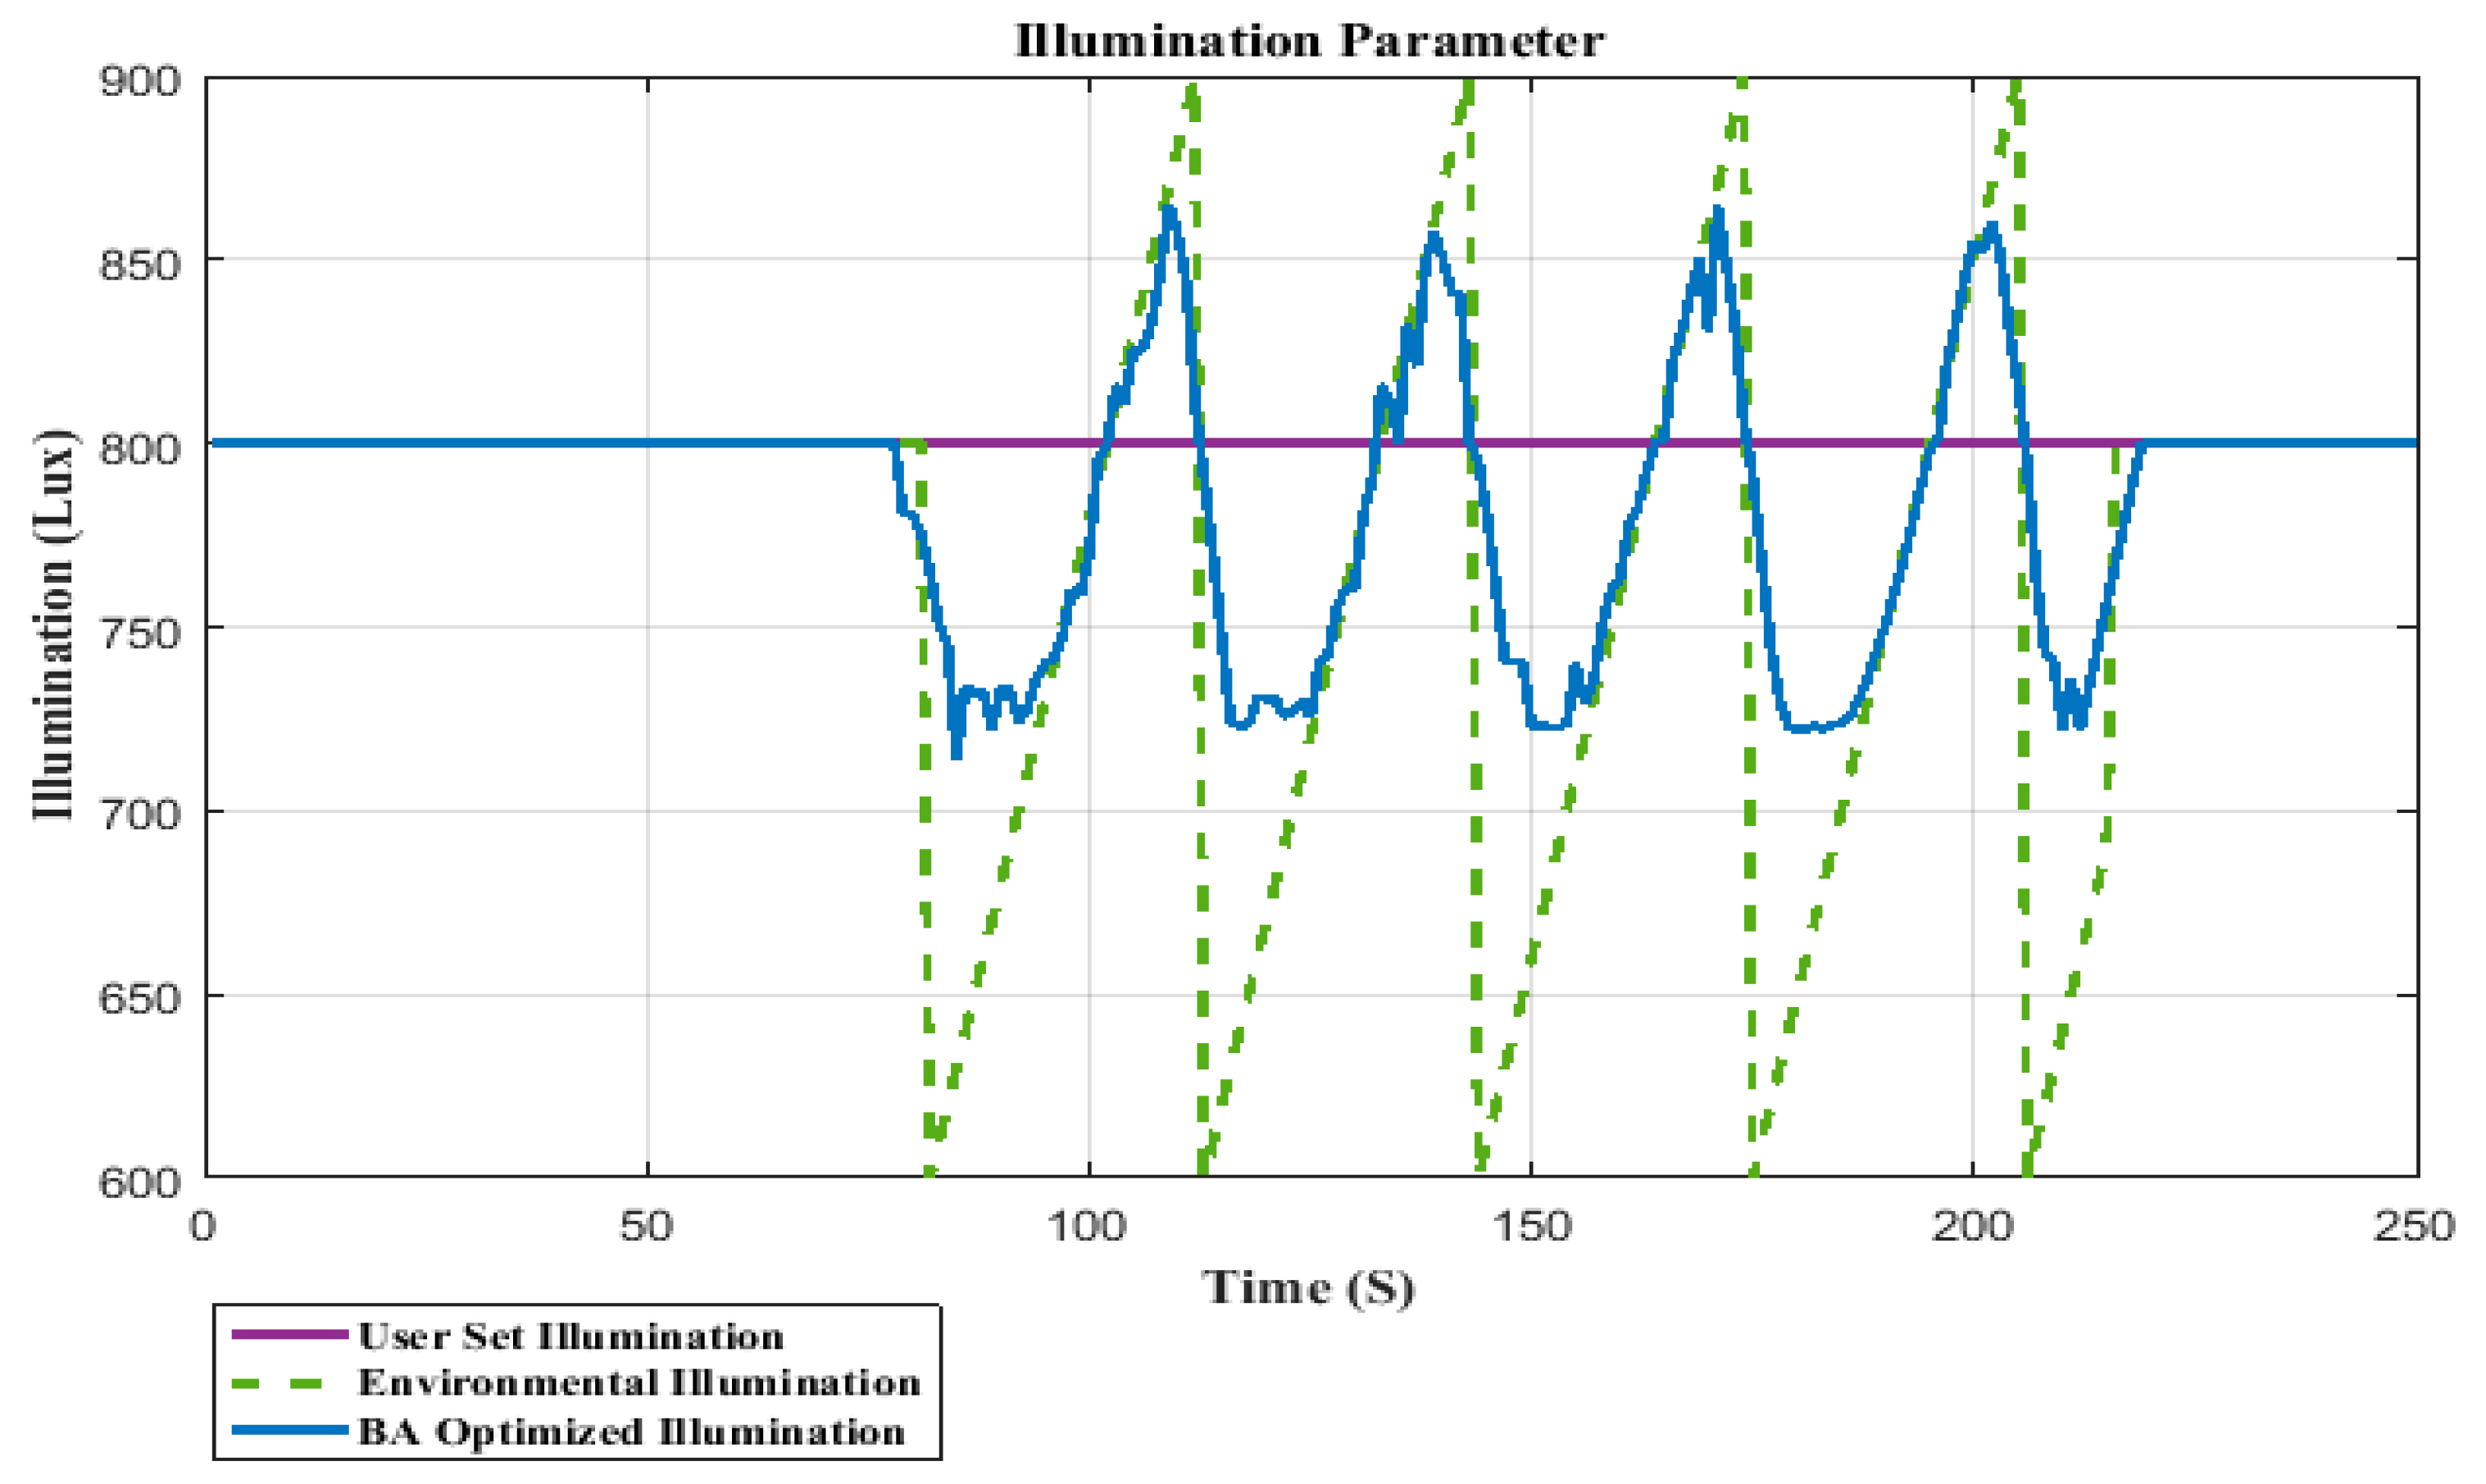
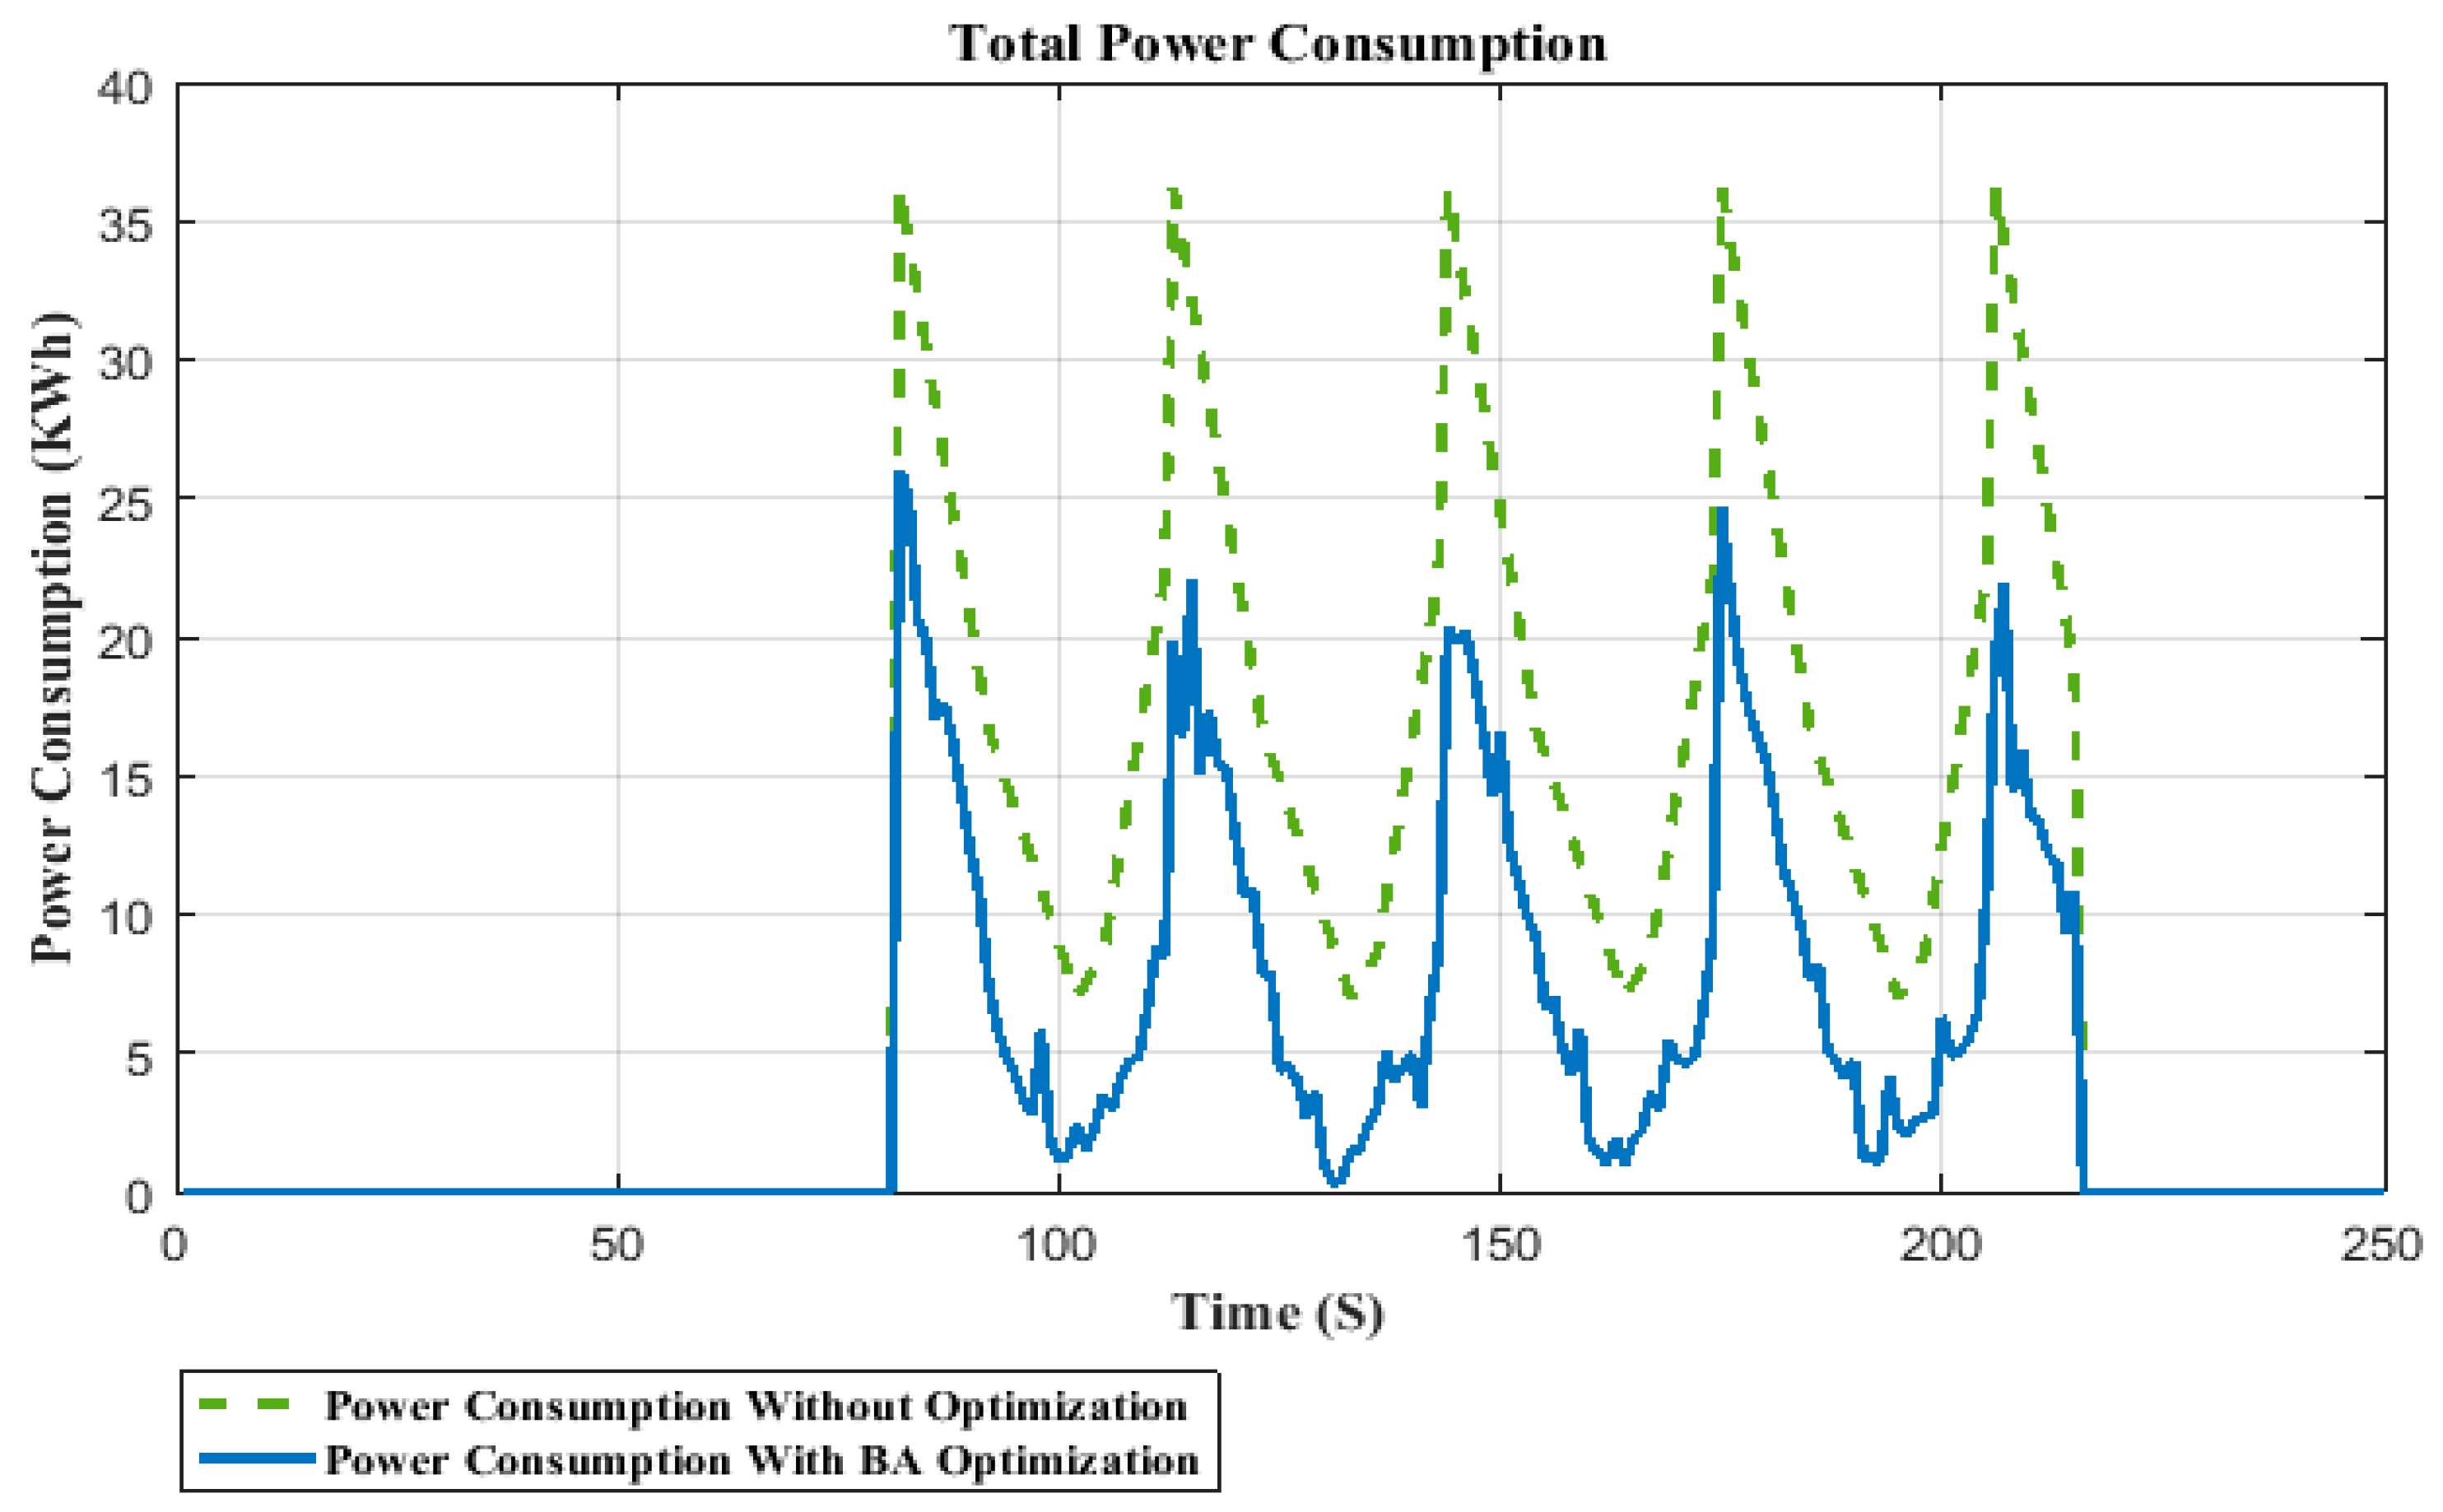
4. Experimental Results and Discussion

All the implementation and experimental work of this study were carried out on an Intel(R) Core(TM) i5-3570 CPU @ 3.40 GHz with Matlab 2010a installed on it. The implementation of fuzzy logic is done using the fuzzy logic toolbox.
We have performed different numbers of experiments to find the optimal parameters for the BA. With the following parameters, we get the best results, which are reported in this paper. The bats population size in a single generation was set to 40 with α = 0.7, γ = 0.7, initial rate of pulse emission r 0 ( i ) was set to 0.5 and initial loudness A 0 ( i ) was also set to 0.5. We have used f m i n = 0 , and f m a x = 1 . Maximum number of generations was set to 100.
The purpose of this study is twofold (a) to increase user comfort and (b) to minimize energy consumption. First for each of the three parameters, if the value of the parameter is in the range of user comfort, BA does not make any change to the values of the parameter, but when the values of the parameters are outside the comfort zone of the user, BA optimizes the values to bring them to the user comfort zone. The values of the parameters within the comfort zone for temperature, illumination, and air quality have been already discussed. The second objective of the BA optimization algorithm is the minimization of power consumption which has been obtained by minimizing the error difference between user set parameters and the environmental parameters.
The error difference between the user set temperature and BA optimization temperature is fed to the temperature fuzzy controller which provides the required power for temperature as output. The status of cooling/heating is changed according to the error difference. Illumination fuzzy controller takes the error difference between user illumination and the BA optimized illumination as input and the minimum required power for illumination is the output of the illumination fuzzy controller. The status of lighting actuator is changed according to the error difference. Similarly, the air quality fuzzy controller takes the error difference between user air set air quality and the BA optimized air quality as inputs and the output is the required minimum power for ventilation. The status of air quality is changed according to this error difference.

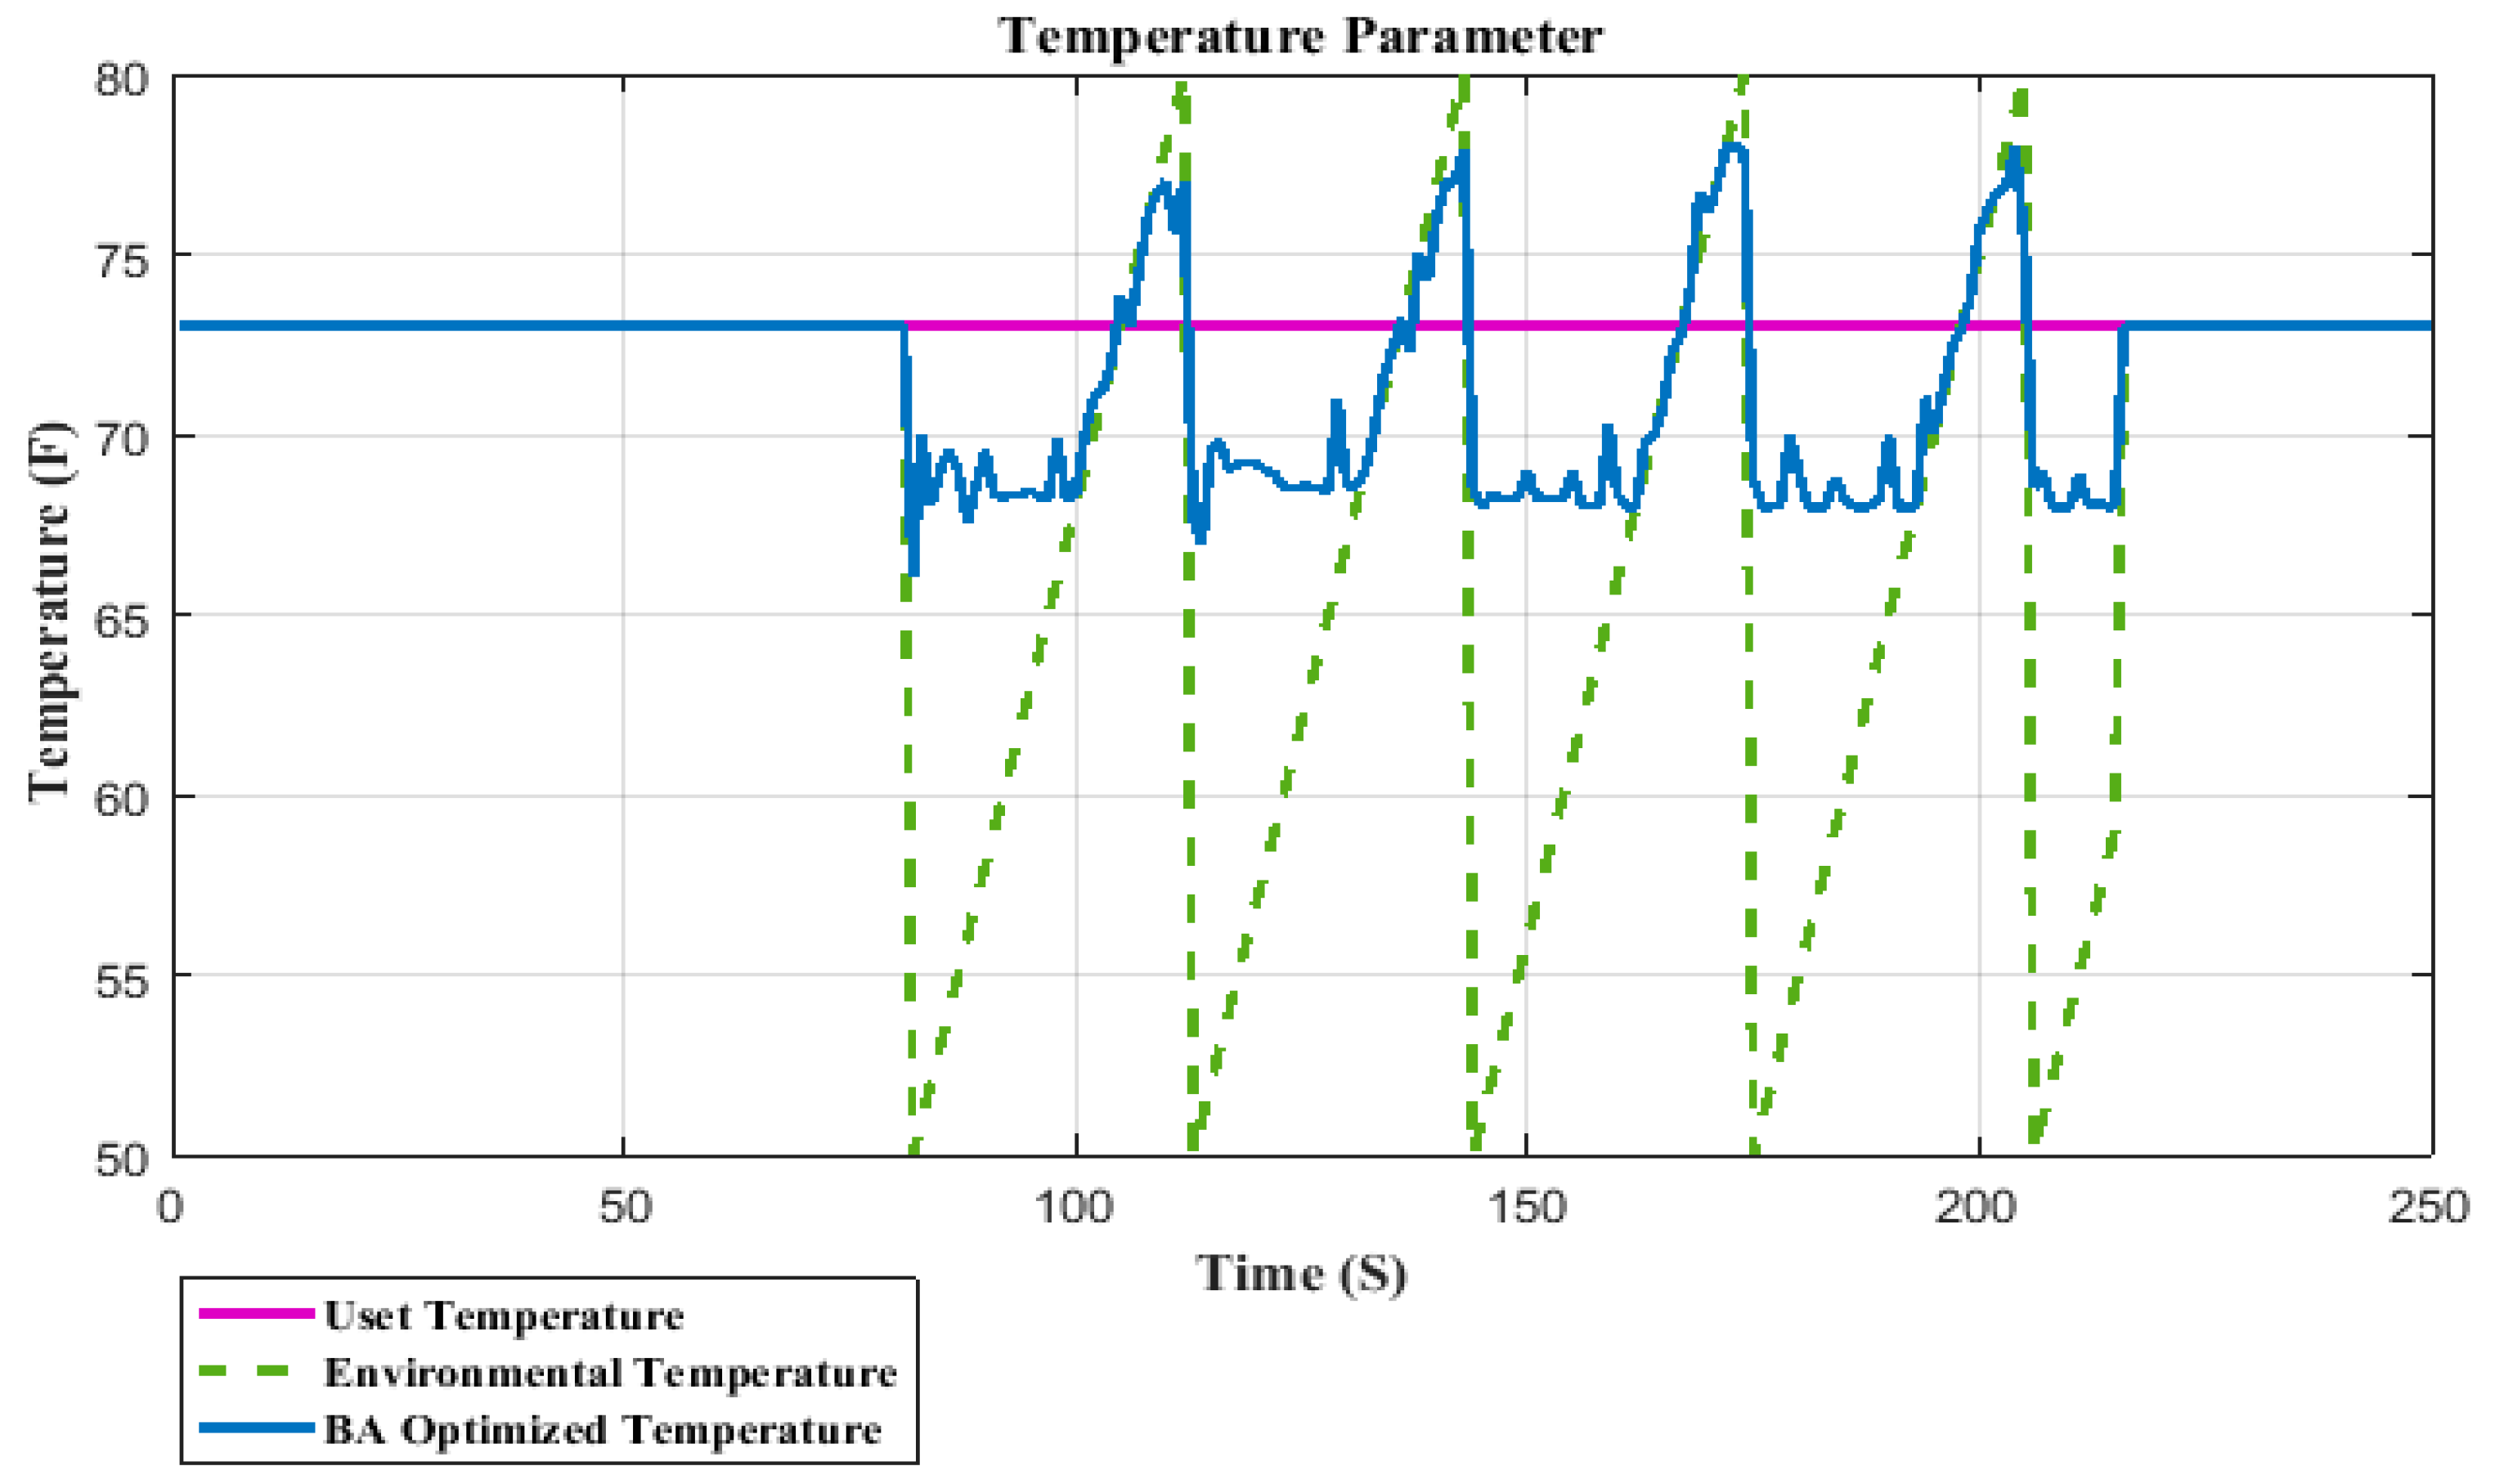
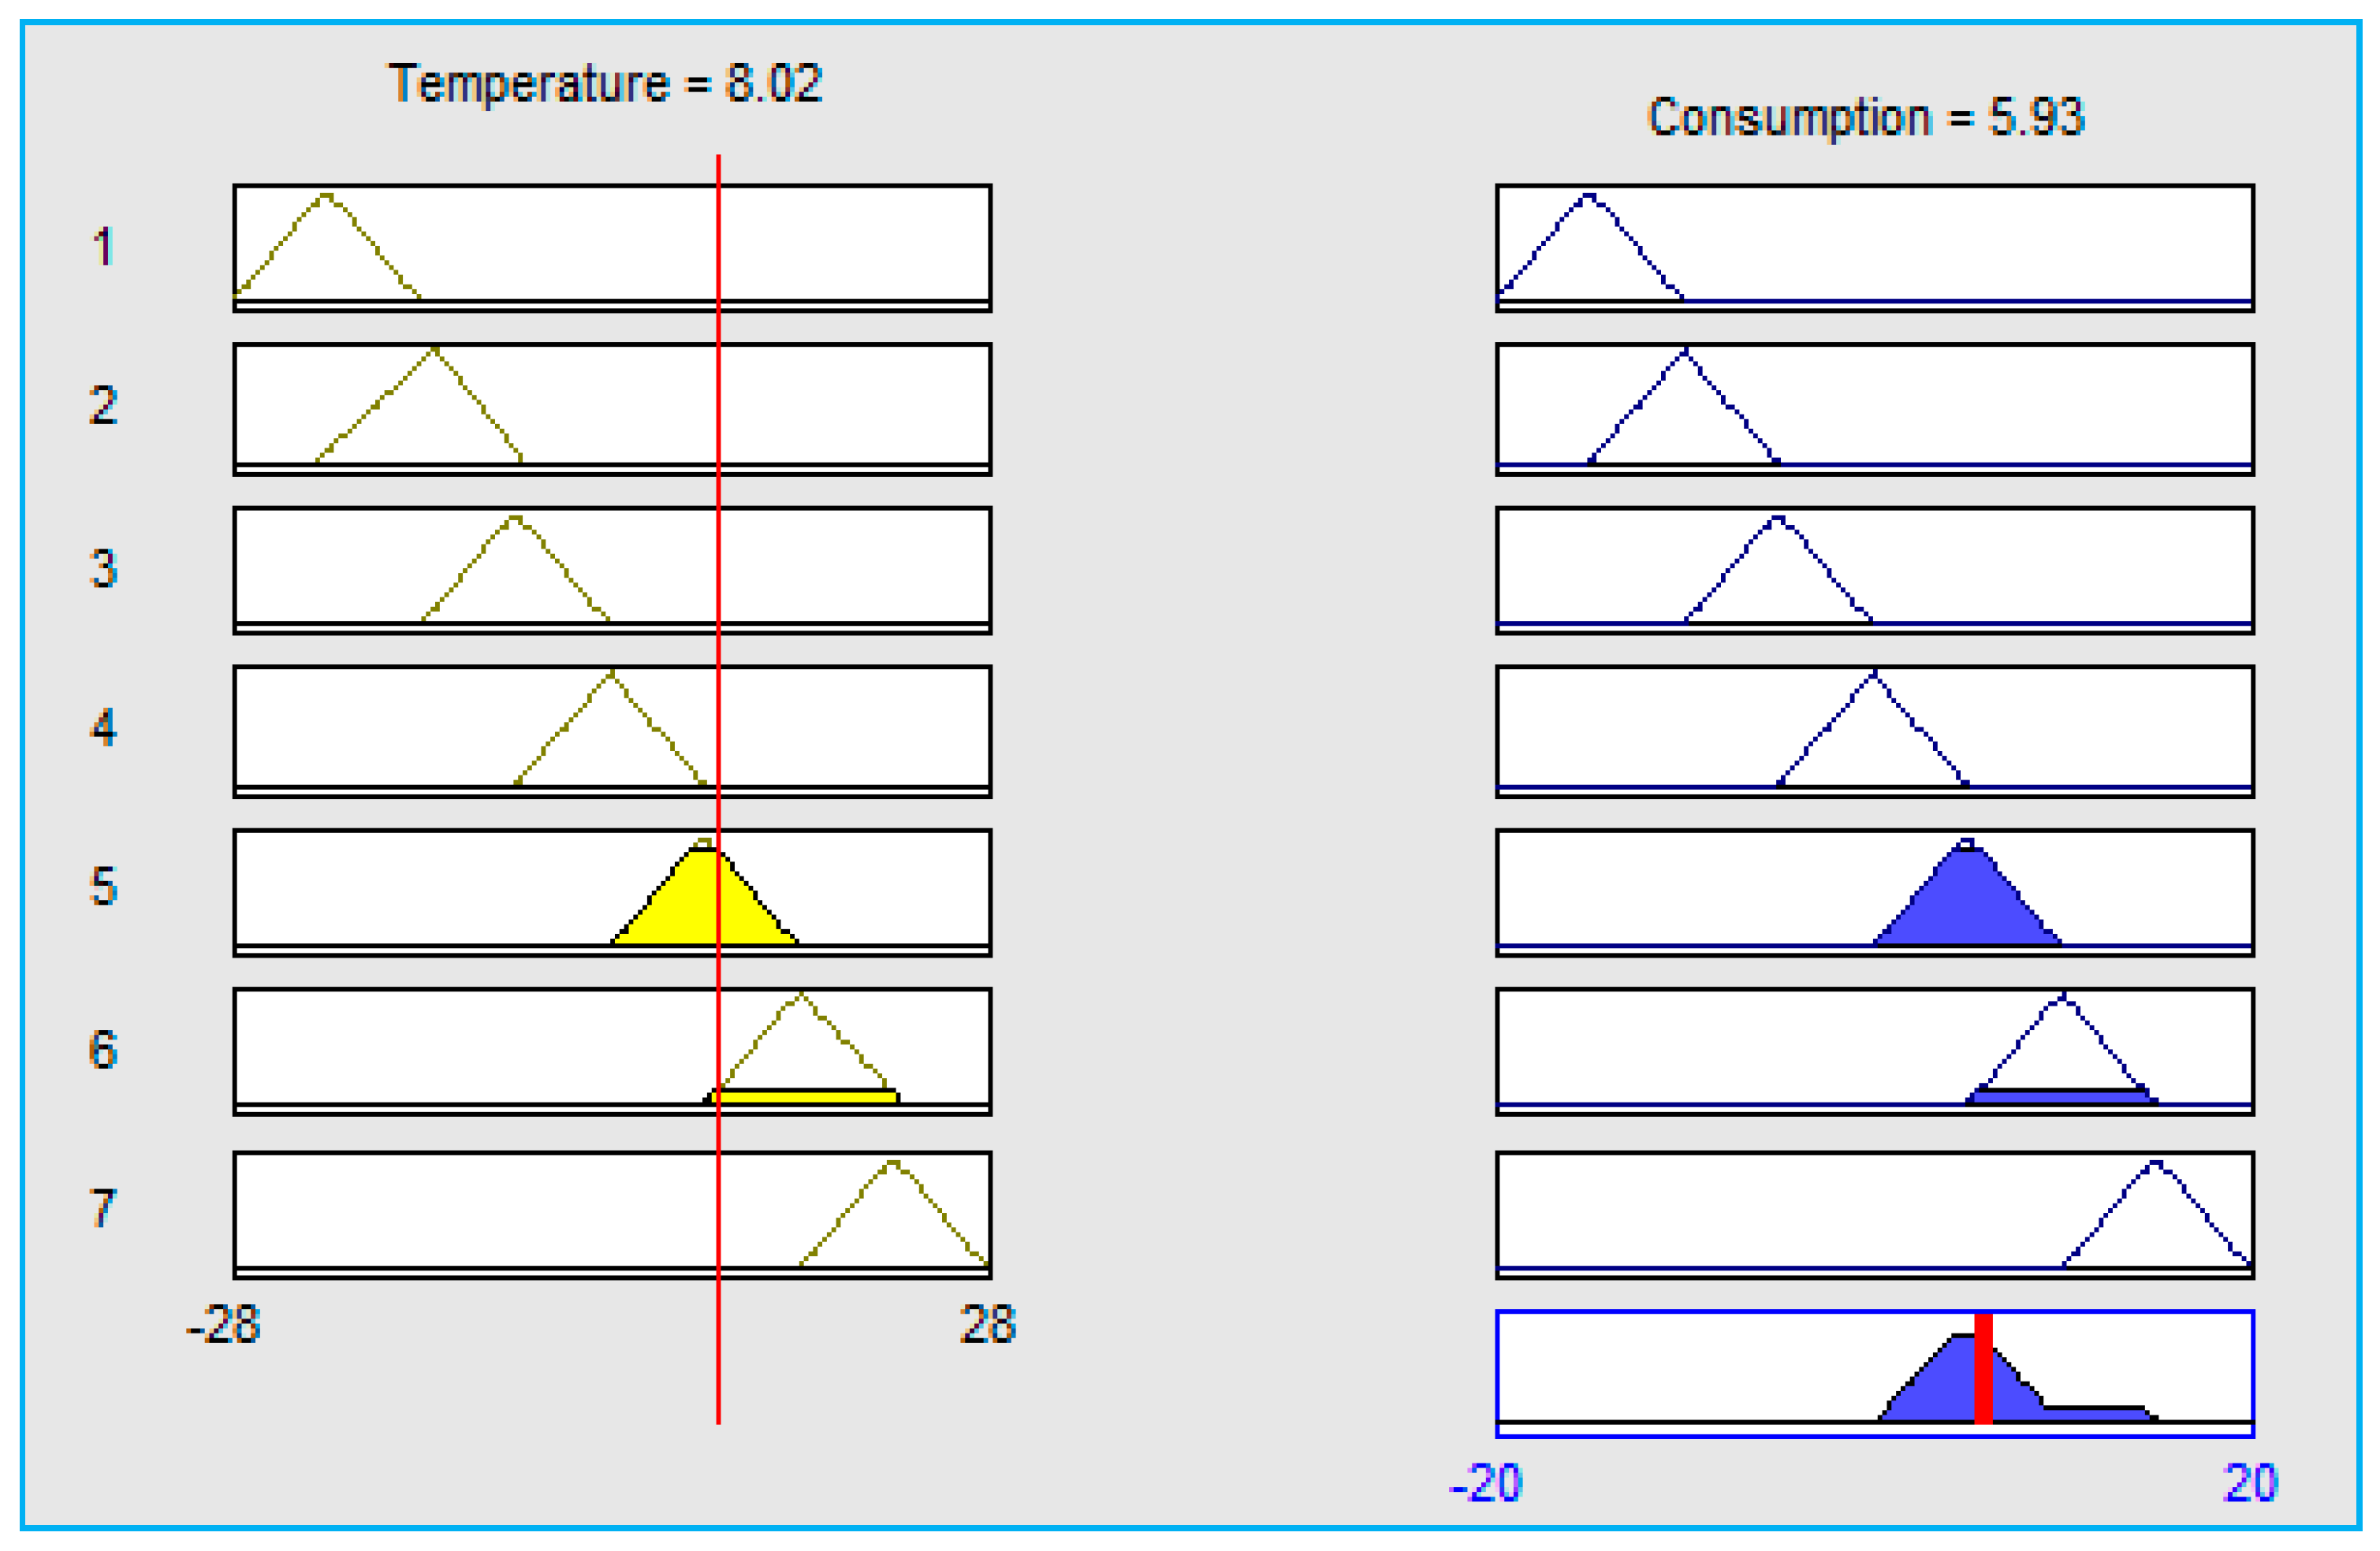
4.1. Temperature Control Process

The temperature control process consists of few major components to manage user preferred temperature inside the building. The optimization algorithm (BA) performs the process of optimization of temperature parameter. If the temperature value is not in the preferred range, BA brings that value inside the range. Figure 5 shows the user set temperature, the environmental temperature and BA optimized temperature parameter values.
After optimization, the error difference between the environmental temperature and the BA optimized temperature is calculated, which is entered as input to the temperature fuzzy controller. The required power for the cooling/heating system is the output of the temperature fuzzy controller. The status of the cooling/heating actuators is changed according to error differences between the real environmental temperature values and BA optimized temperature values. The required power for actuator status is the output of the temperature fuzzy controller. Figure 6 shows the structure diagram for the temperature fuzzy controller.
The input/output membership functions are represented in Figure 7. In the figure, the term e T represents the error difference between environmental temperature and the BA optimized temperature and the RPT represents required power for heating/cooling.
The rules for temperature fuzzy controller are as follows and these are graphically represented in Figure 8:
  • If ( e T = = NB) then RPT = RNB
  • If ( e T = = NM) then RPT = RNM
  • If ( e T = = NS) then RPT = RNS
  • If ( e T = = ZE) then RPT = RZE
  • If ( e T = = PS) then RPT = RPS
  • If ( e T = = PM) then RPT = RPM
  • If ( e T = = PB) then RPT = RPB
In these rules, e T denotes the error difference between environmental temperature and the BA optimized temperature. Seven membership functions are defined in e T (input variable for the temperature fuzzy controller). The output variable RPT for the temperature fuzzy controller represents the output energy generated by temperature fuzzy controller for cooling/heating temperature. Input variable ( e T ) has seven membership functions, these membership functions are labeled as NB, NM, NS, ZE, PS, PM, PB that are abbreviated for negative big, negative medium, negative small, zero error, positive error, positive small, positive big respectively. The output variable has also seven membership functions that are labeled as RNB, RNM, RNS, RZE, RPS, RPM, RPB that are acronyms for required negative big, required negative medium, required negative small, required zero error, required positive small, required positive medium, and required positive big. According to the rule defined above for fuzzy controller temperature if the input error is negative big (NB), the required power would be negative big (NB), and if the error difference is positive big (PB) the output required power would be positive big (PB). Accordingly, the NB denoted minimum required power for heating and cooling and RPB represents the maximum heating/cooling power.
After applying the fuzzy rules shown in Figure 8, the required power for controlling the status of the cooling/heating system is the fuzzy controller output. The essential power for the temperature control system is calculated by considering the temperature parameters optimization and the fuzzy rules. The calculated power for temperature control based on these parameters is shown in Figure 9 for the temperature control process.

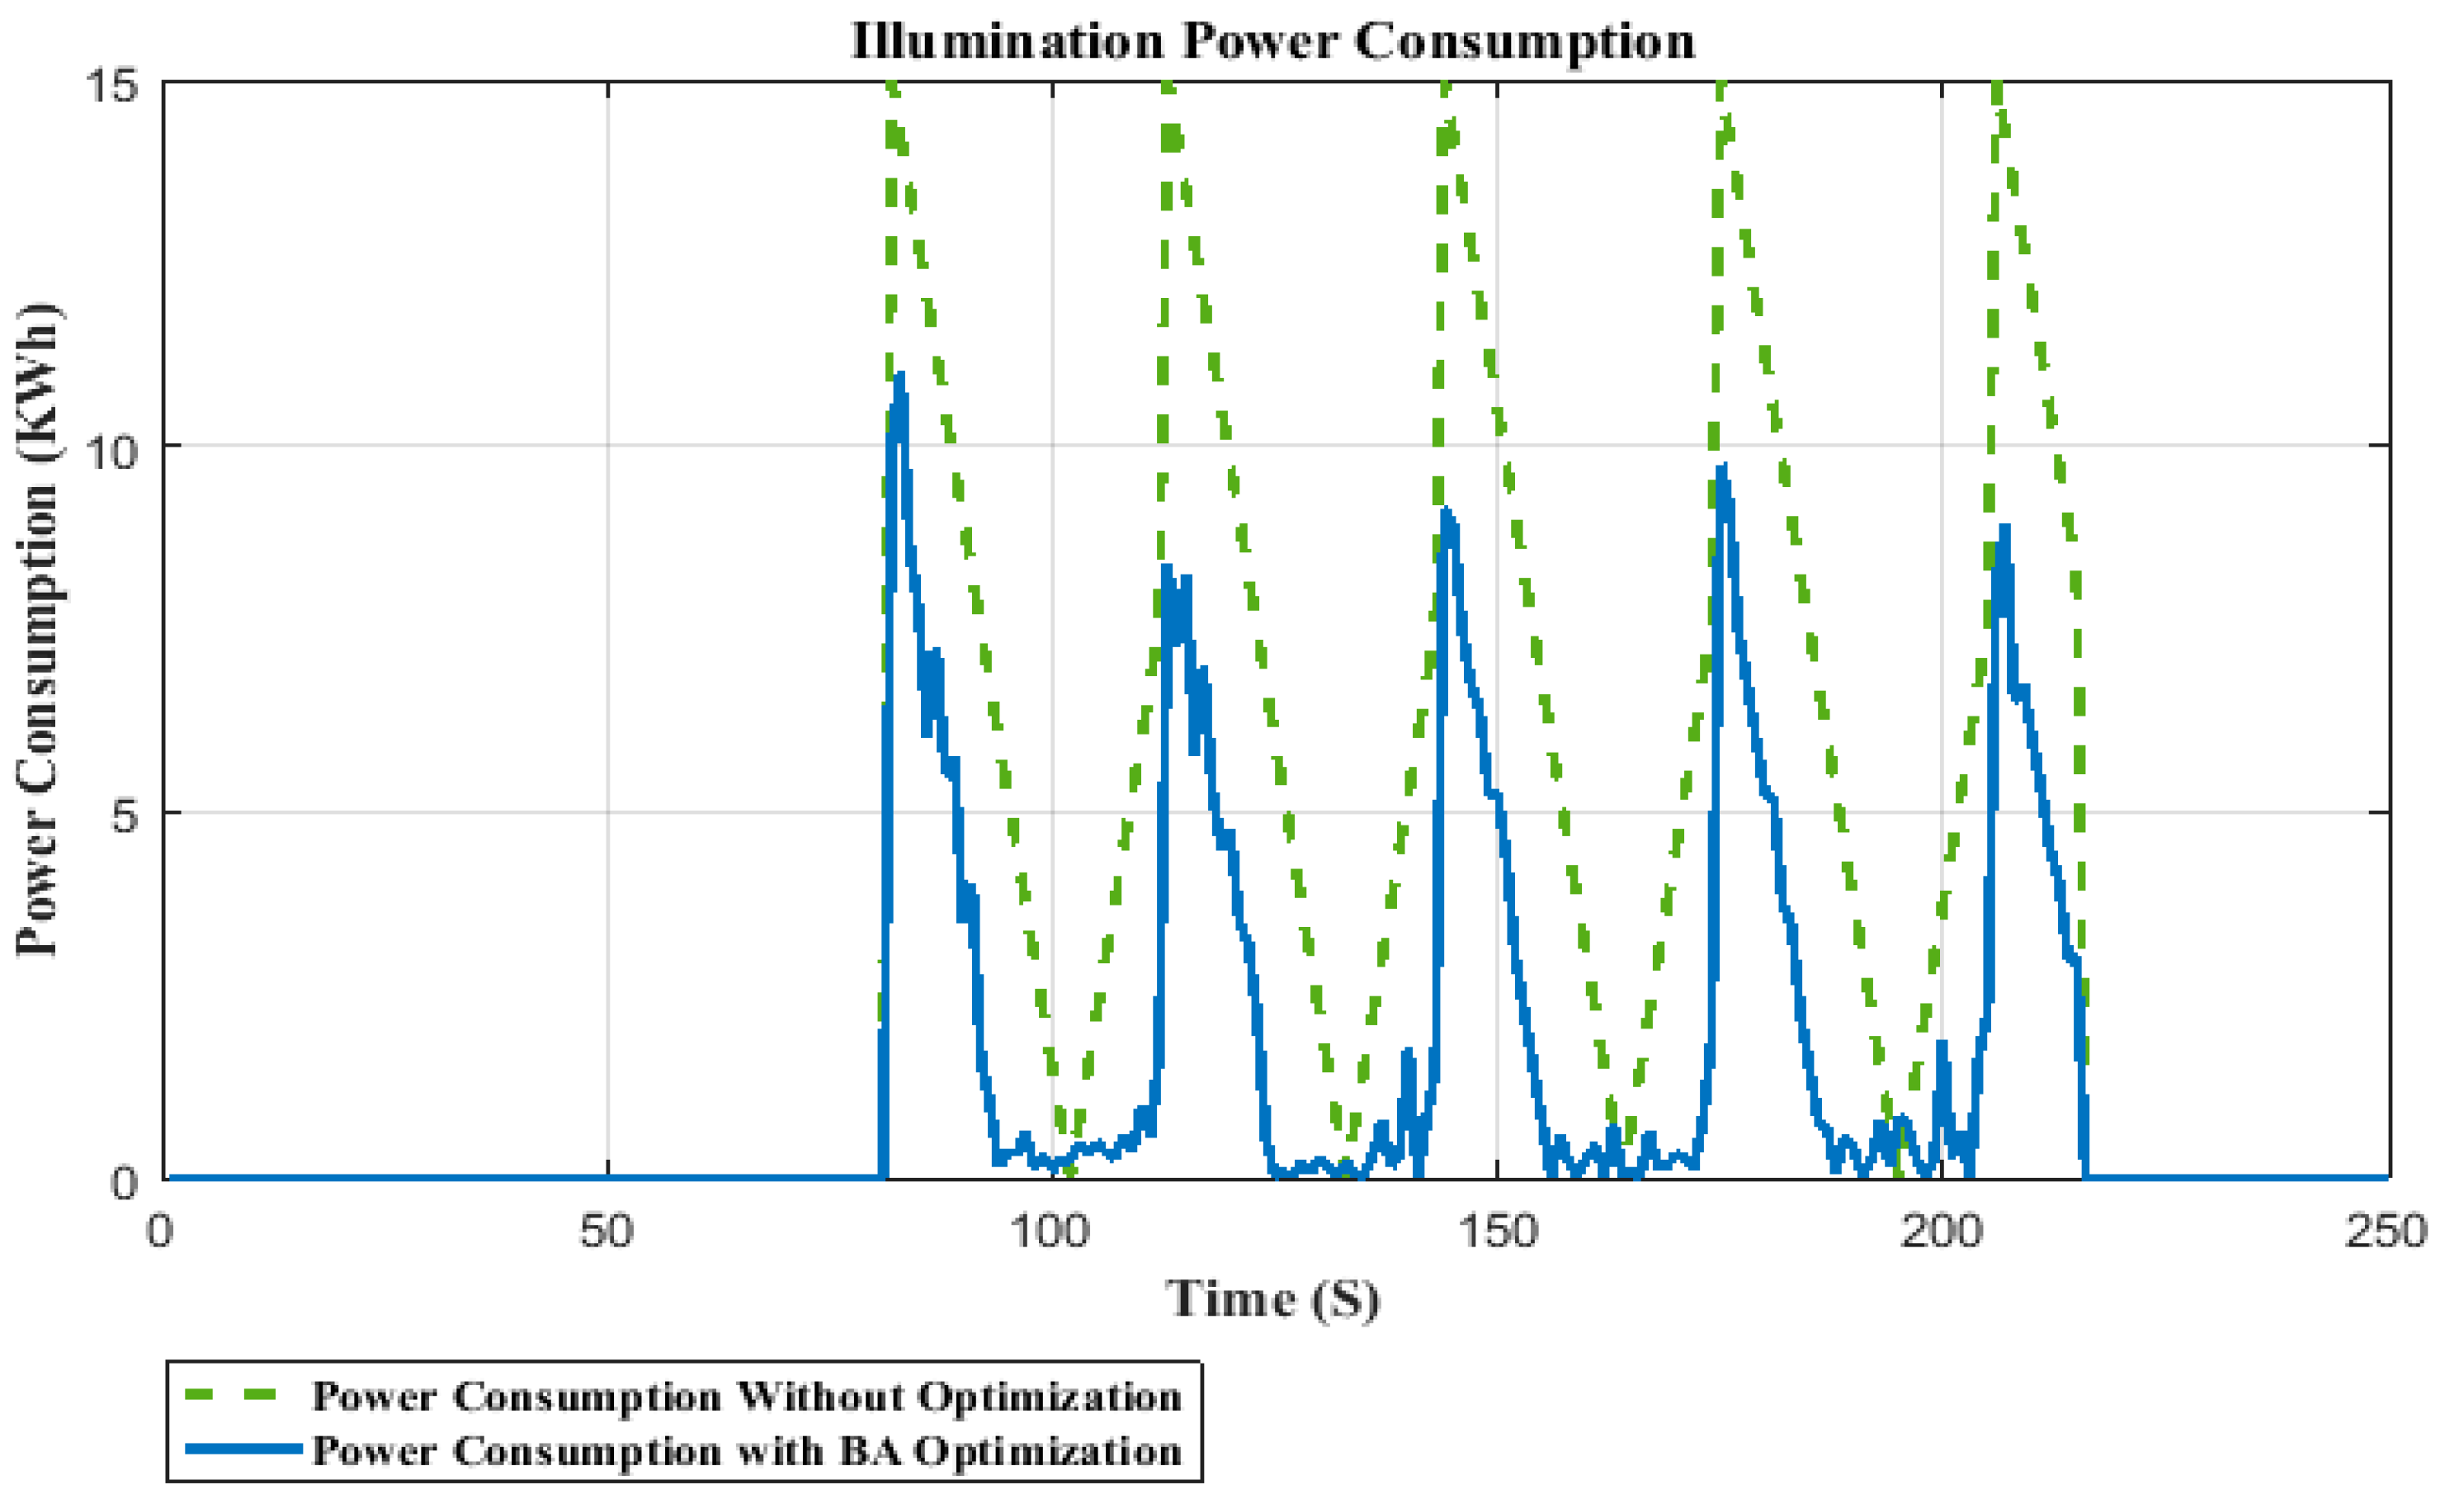
4.2. Illumination Control Process

The illumination control process consists of few major components for managing user’s preferred lighting system inside the building. The optimization algorithm (BA) performs the process of optimization of illumination parameter. If the illumination value is outside the preferred range, the BA brings that value inside the range. Figure 10 shows the user set illumination, the environmental illumination, and BA optimized parameter values.
After optimization, the error difference between the environmental illumination and the BA optimized illumination is calculated which is entered as input to the illumination fuzzy controller. The required power for the lighting system is the output of the fuzzy controller. The lighting actuator status is changed according to the error differences between the actual environmental parameters and the BA optimized parameters. The structure diagram for illumination fuzzy controller is illustrated in Figure 11.
The input/output MFs are illustrated in Figure 12. In the figure, the e L represents the error difference between environmental illumination and BA optimized illumination and RPL represent required power for lighting.
The rules for illumination fuzzy controller are as follows and these are represented in Figure 13:
  • If ( e L = = HS) then RPL = RNB
  • If ( e L = = MS) then RPL = RNM
  • If ( e L = = BS) then RPL = RNS
  • If ( e L = = OK) then RPL = RZE
  • If ( e L = = SH) then RPL = RPS
  • If ( e L = = H) then RPL = RPM
In these rules, the error difference between the environmental illumination and the BA optimized illumination is input to the illumination fuzzy controller. The illumination fuzzy controller on based on these inputs generates the energy as output. The input and output variables are represented by e L and RPL correspondingly. The e L input variable of illumination fuzzy controller has five membership functions that are labeled as high small (HS), medium small (MS), big small (BS), OK, small high (SH) and high (H), so as we go from HS towards H, the error difference increases, and vice versa. The required power for lighting (RPL) output variable has also five membership functions that are labeled as RHS, RMS, RBS, ROK, RSH, and RH. According to the first rule in above rules for illumination fuzzy controller, if the error difference is low then minimum power would be required for the lighting system. Similarly, according to the last rule, if the error difference is high then maximum power would be required for the lighting system.
After applying the fuzzy rules shown in the Figure 13, the required power for controlling the status of the lighting system is the output of the illumination fuzzy controller. The necessary power for illumination control system is calculated by considering the illumination parameters’ optimization and the fuzzy rules explained earlier. The calculated power for lighting system control based on these parameters is shown in Figure 14 for illumination control process.

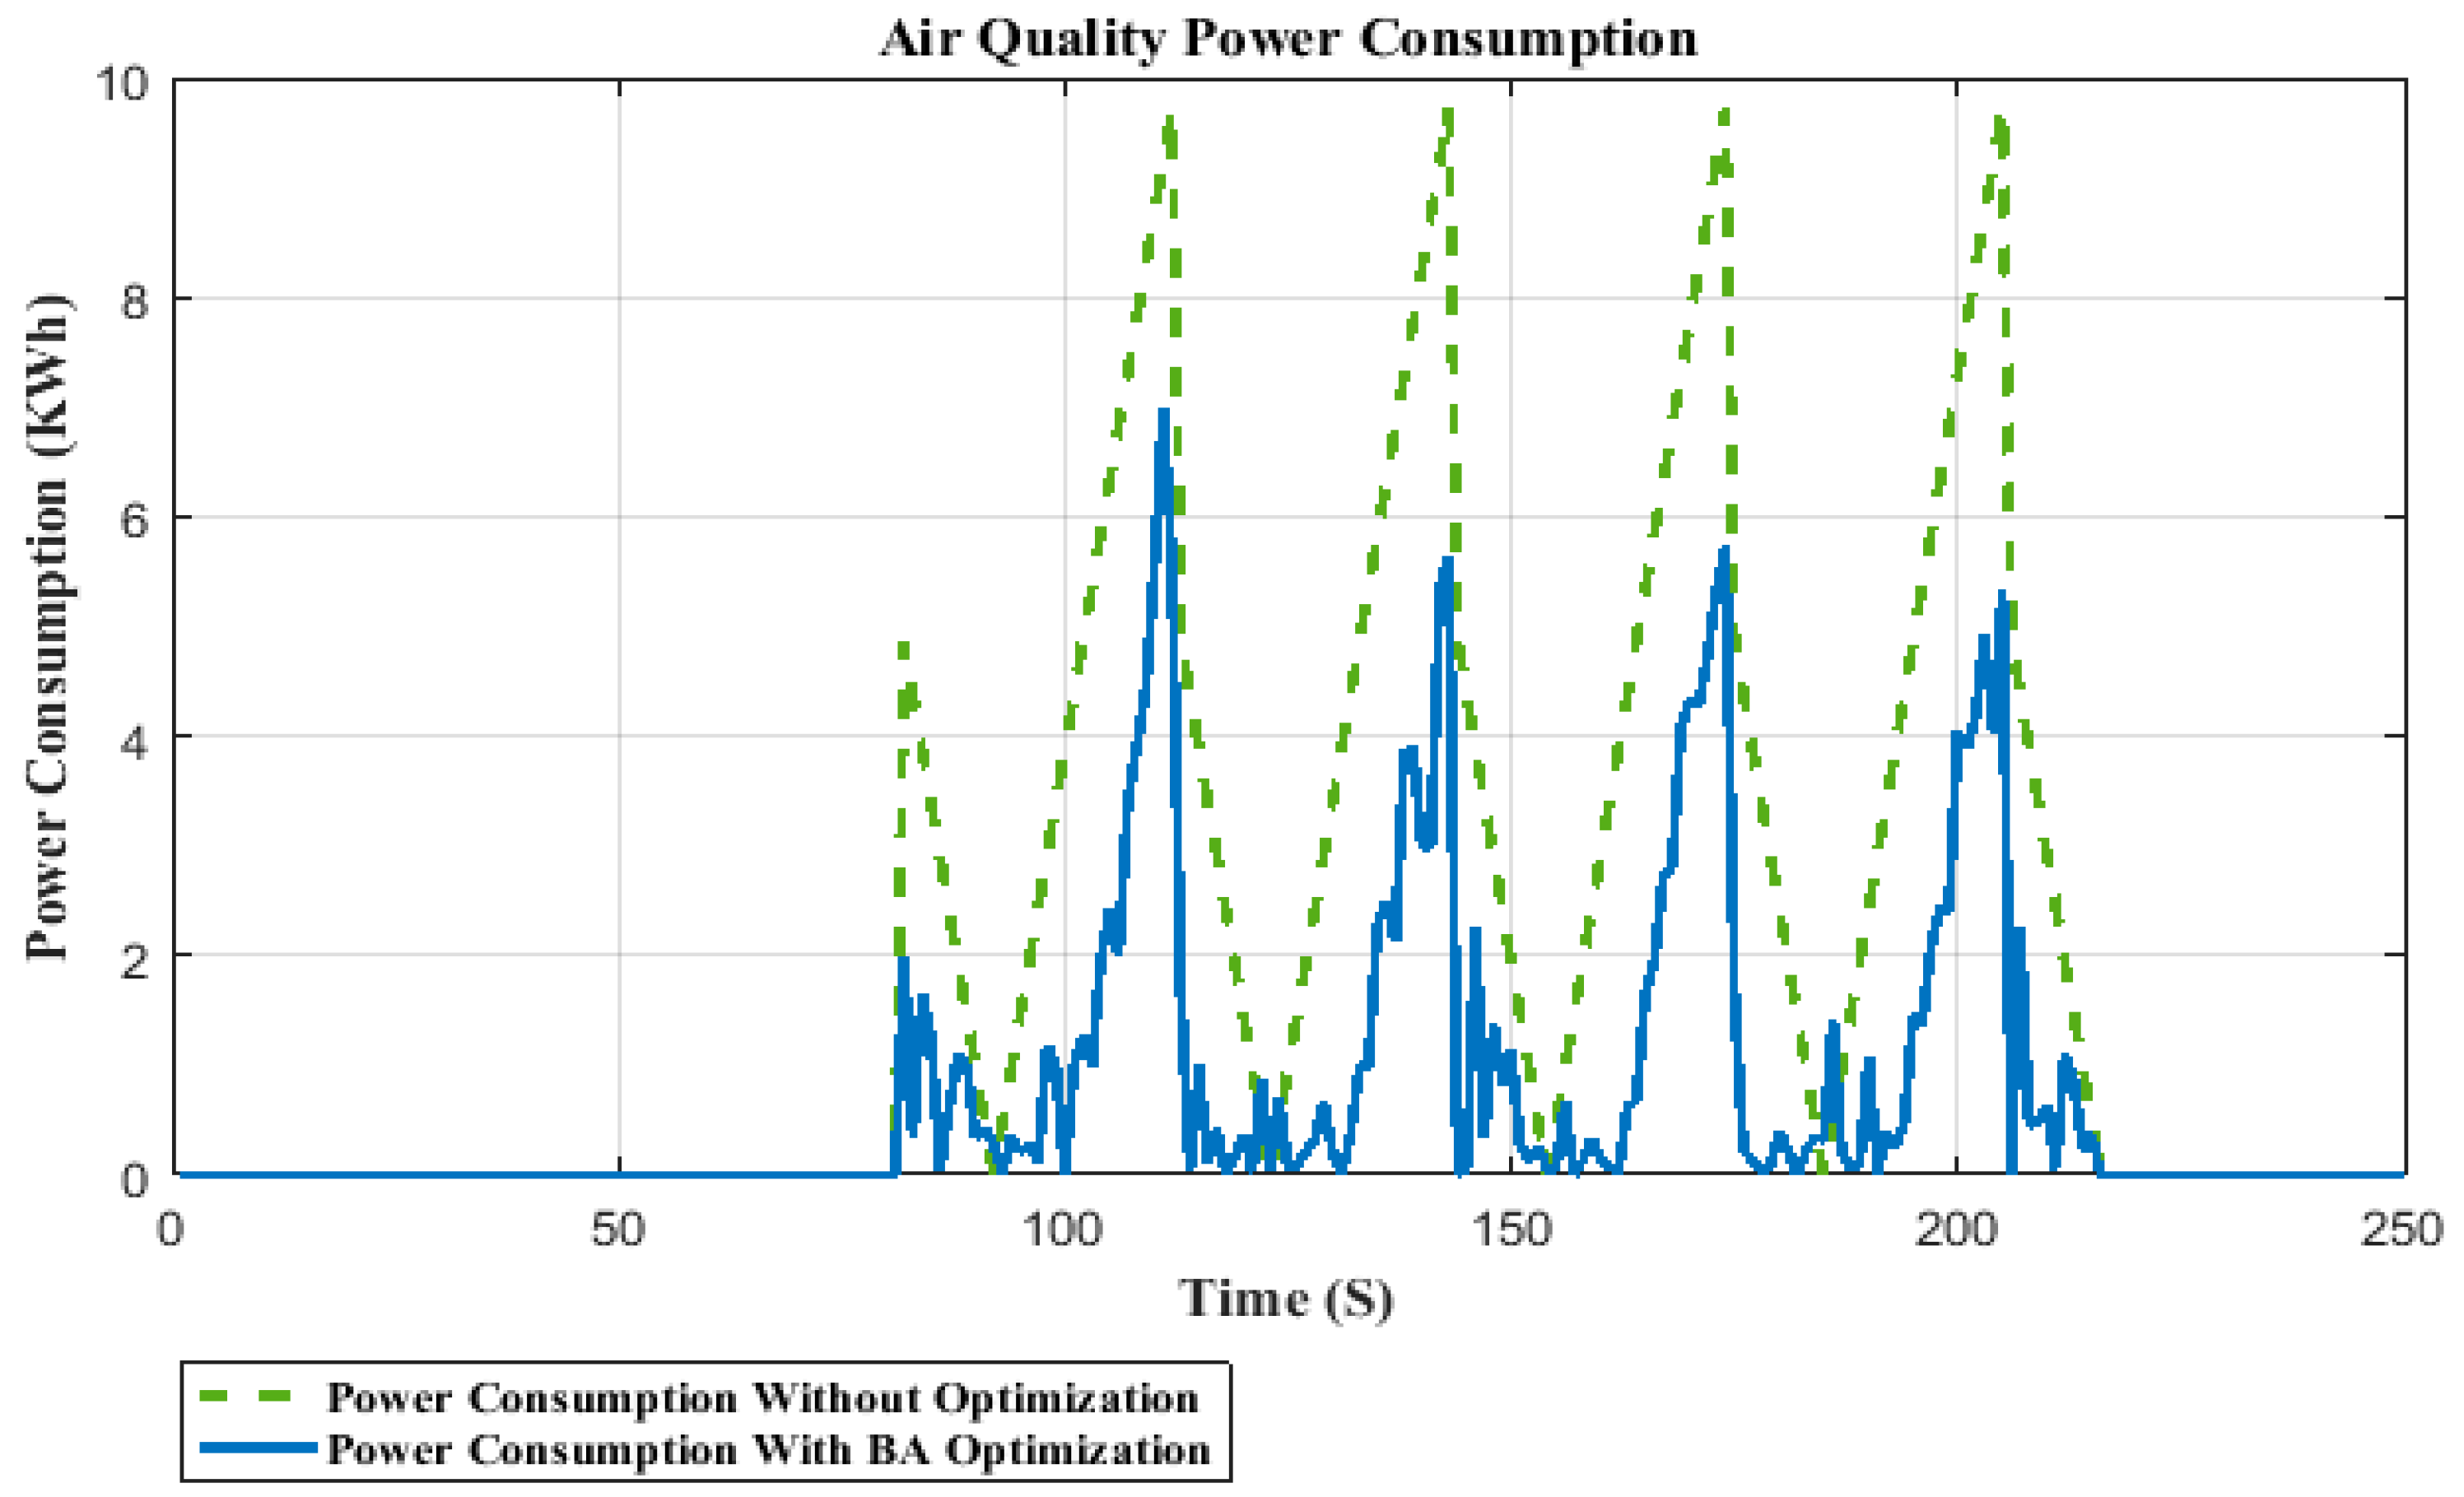
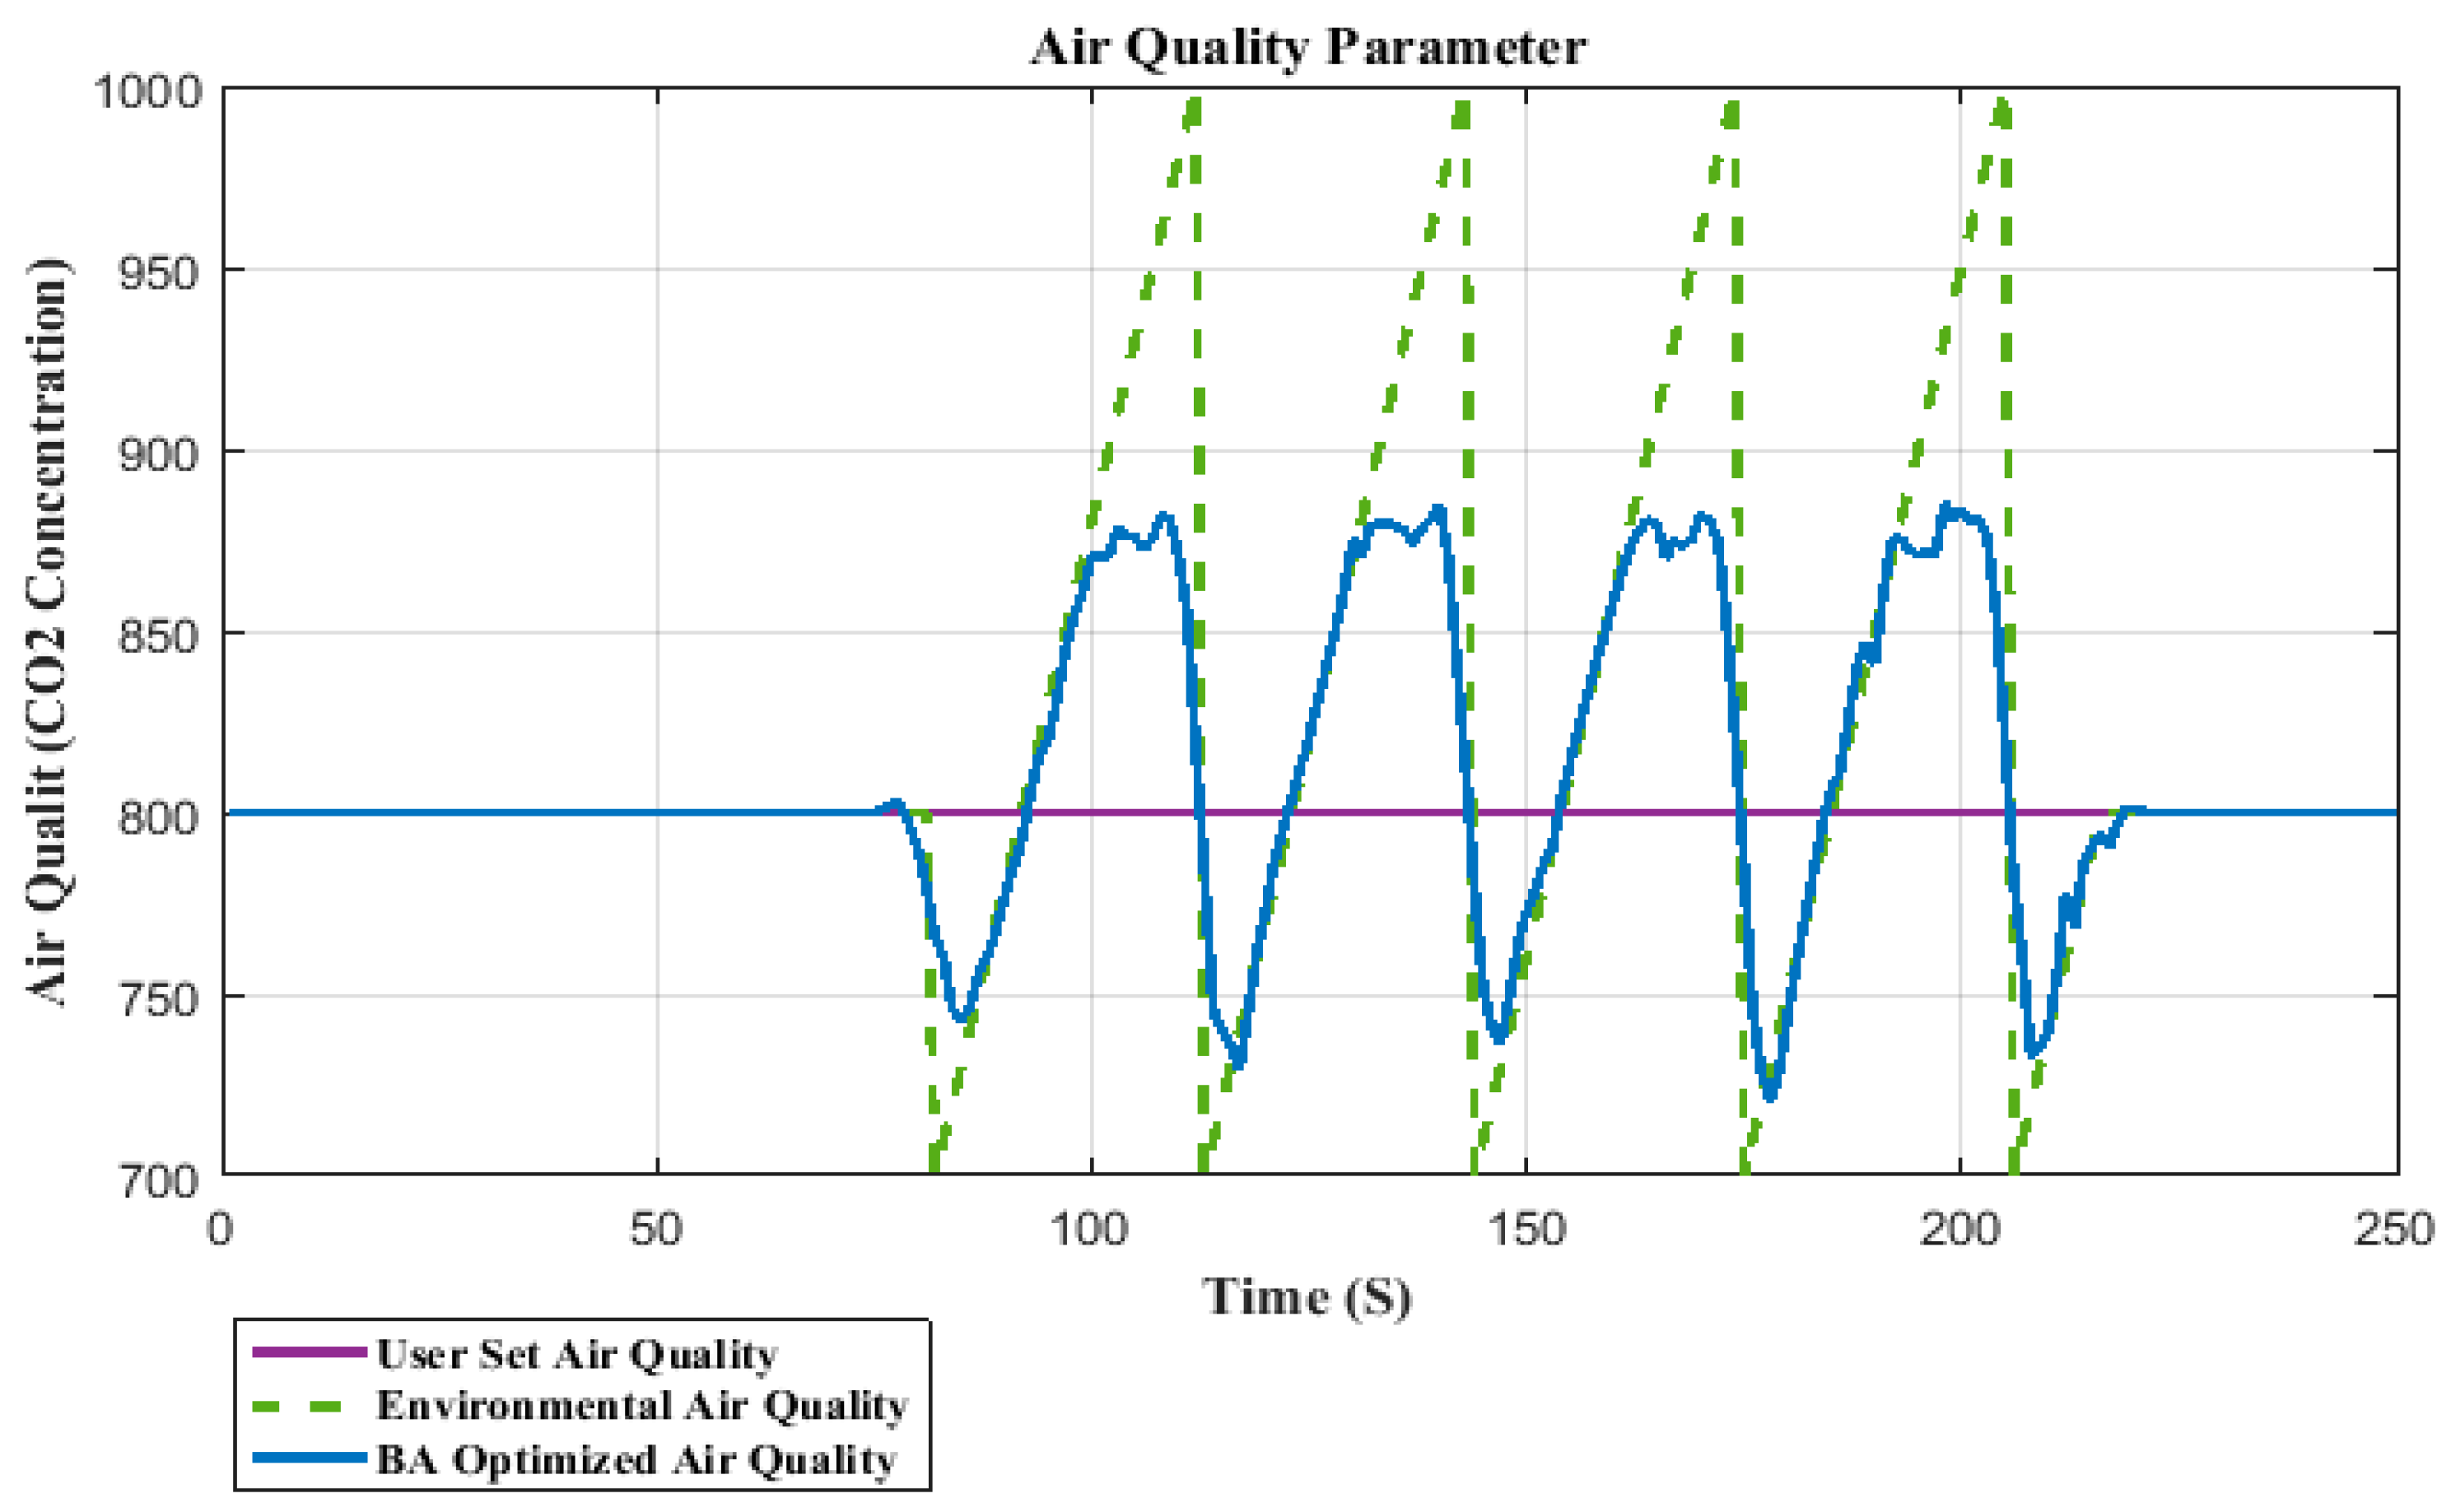
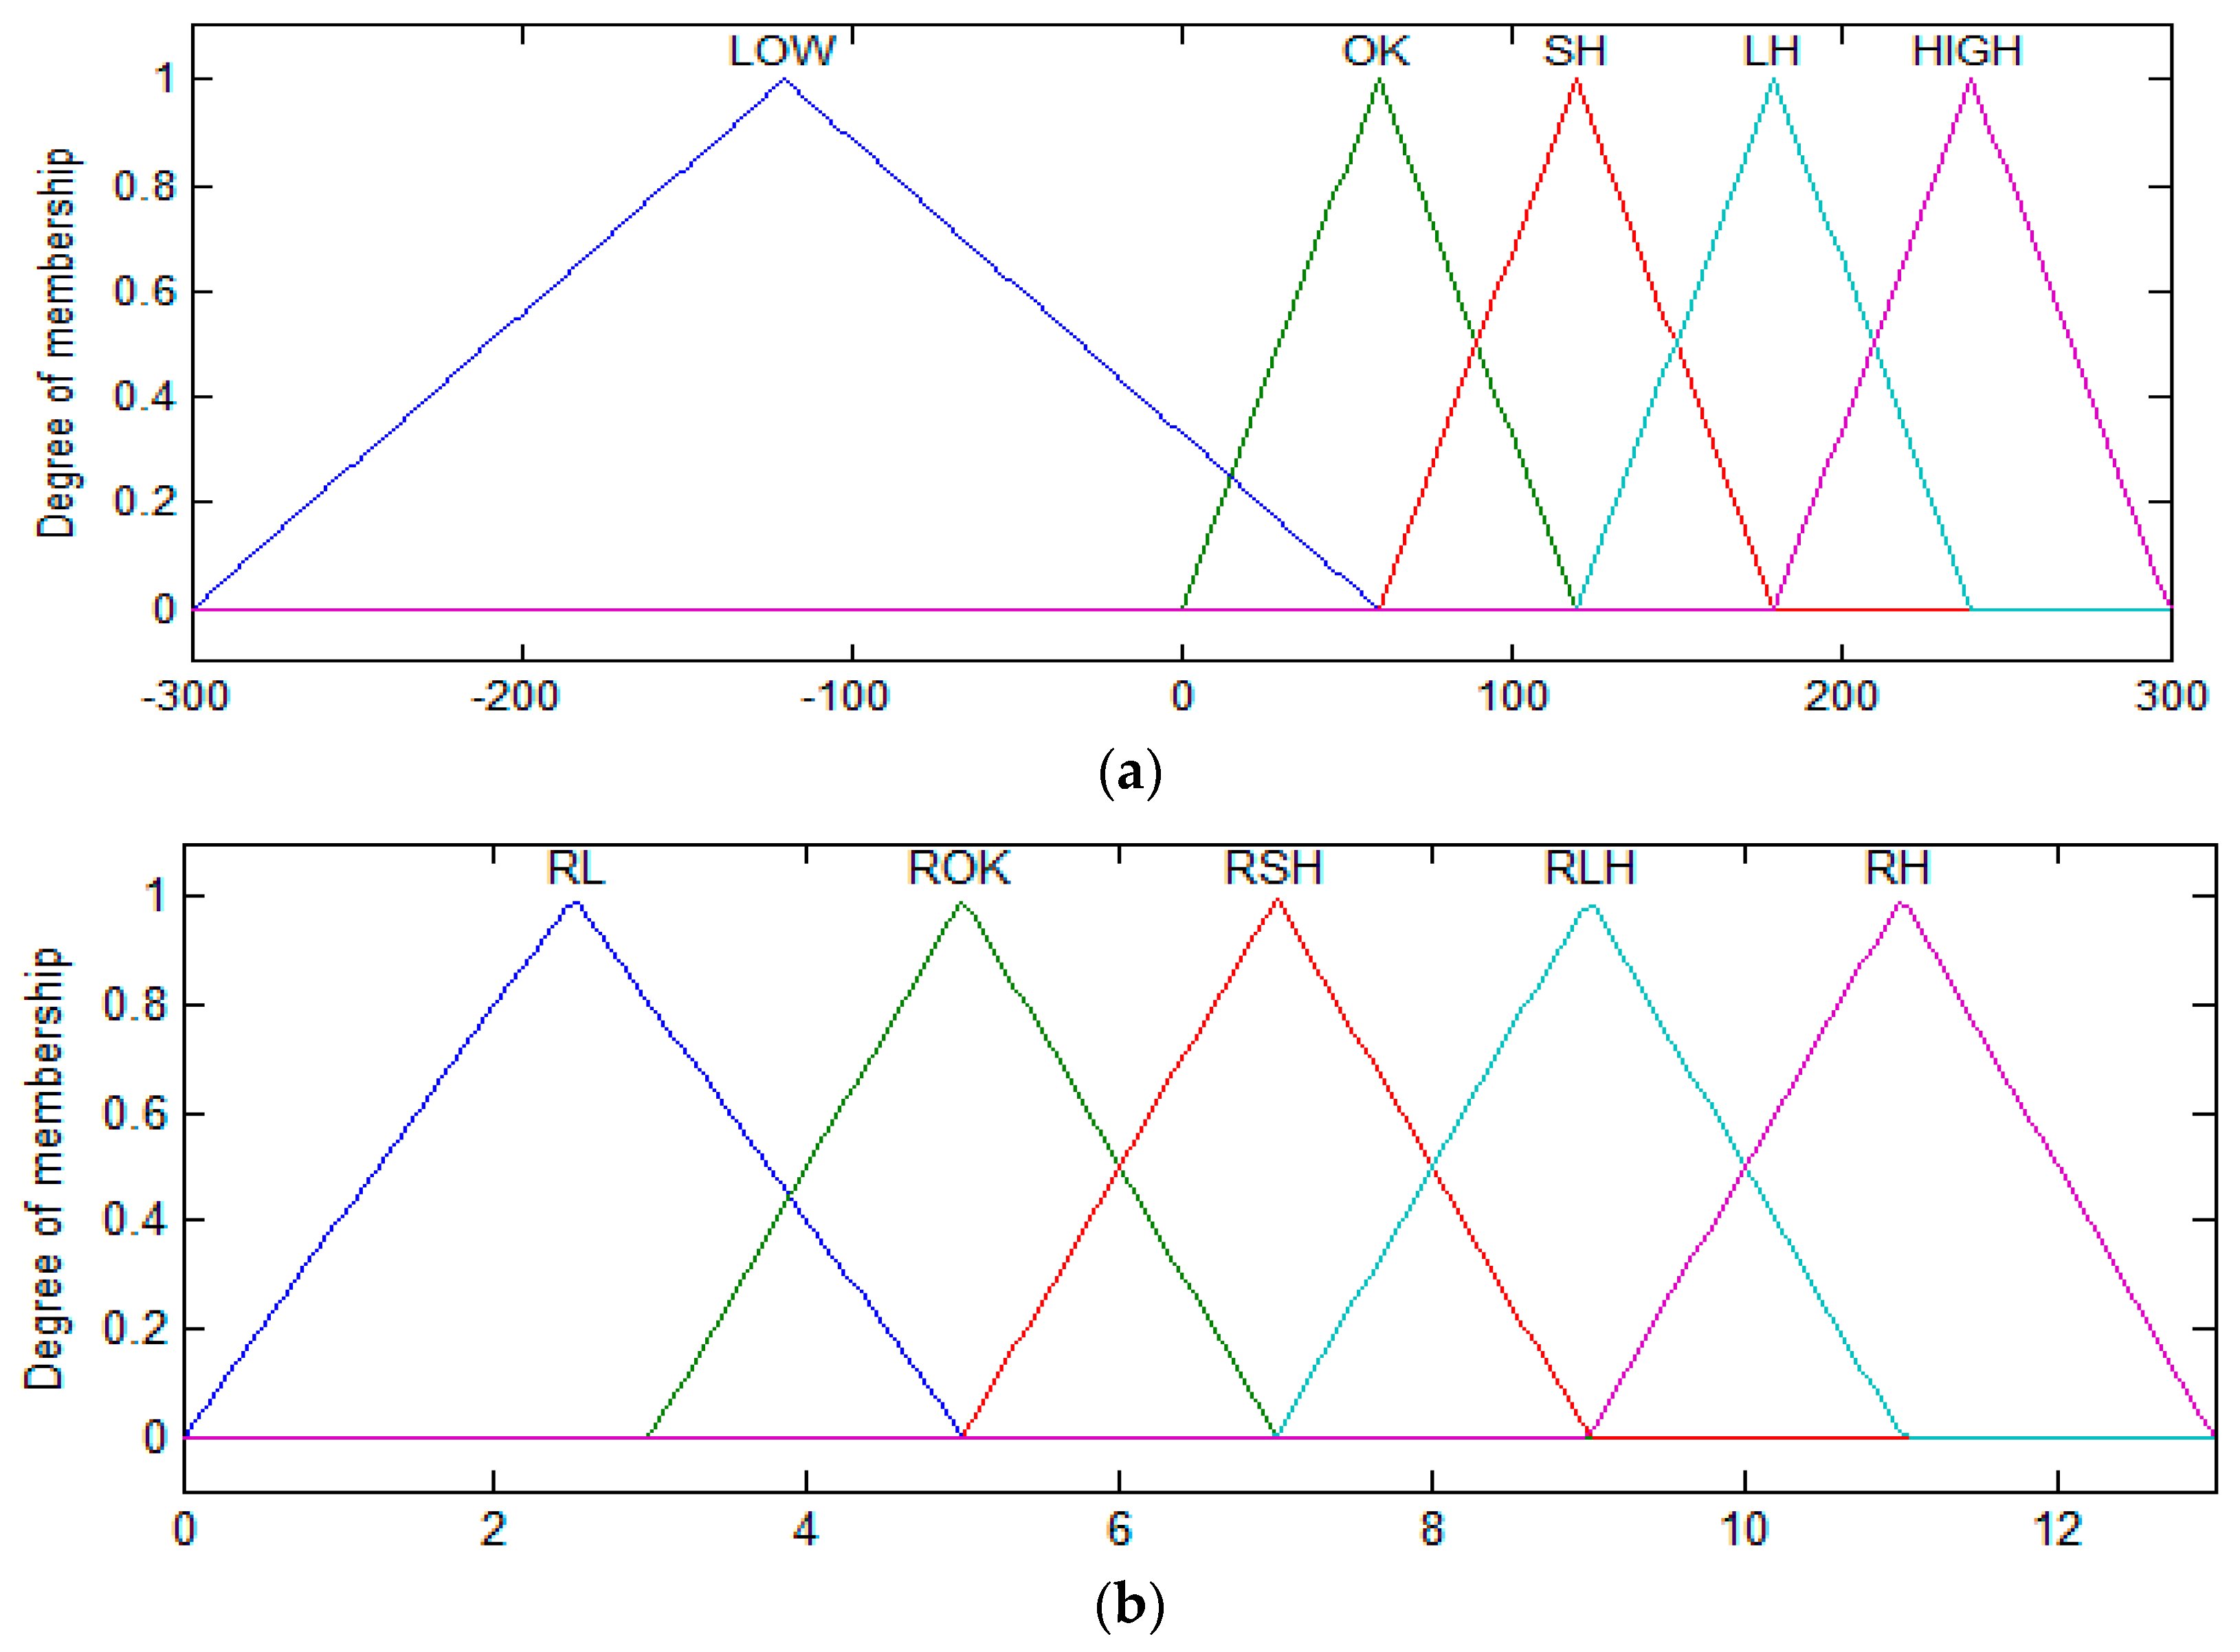
4.3. Air Quality Control Process

The air quality control process consists of few major components for managing user’s preferred ventilation system inside the building. The optimization algorithm (BA) performs the process of optimization of air quality parameter. If the parameter’s value is outside the preferred range, the BA brings that value inside the range. Figure 15 indicates the user set air quality, the environmental air quality, and the BA optimized air quality values.
After optimization, the error difference between the environmental illumination and the BA optimized illumination is calculated which is entered as input to the illumination fuzzy controller. The required power for the ventilation system is the output of air quality control system. As the input values, the air quality fuzzy controller is changed its output is also changed and ventilation actuator status is changed accordingly. The structure diagram for the air quality fuzzy controller is shown in Figure 16.
The input/output MFs are illustrated in Figure 17, where the e A represents the error difference between environmental air quality and BA optimized air quality and the RPV represent require power for ventilation.
The rules for illumination fuzzy controller are as follows and these are represented in Figure 18:
  • If ( e A = = LOW) then RPV = RL
  • If ( e A = = OK) then RPV = ROK
  • If ( e A = = SH) then RPV = RSH
  • If ( e A = = LH) then RPV = RLH
  • If ( e A = = HIGH) then RPV = RH
In the above rules, e A denotes the error difference between environmental air quality and the air quality optimized by BA. The e A is the input variable to air quality fuzzy controller. The air quality controller generates the energy as output based on these inputs. The outcome of the air quality fuzzy controller is denoted by RPA. The input variable for air quality is comprised of five membership functions the labeling for these membership function is carried out as LOW, OK, small high (SH), low high (LH) and HIGH.
The LOW denotes the minimum error difference between environmental air quality and BA optimized air quality, so as we go from LOW towards HIGH, the error difference increases and vice versa. According to the first rule in air quality fuzzy control rules if the input air quality is minimum the desired output power would also be minimum, so LOW denotes the minimum difference between environmental air quality and the optimized air quality. After applying the fuzzy rules shown in Figure 18, the required power for controlling the status of the ventilation system is the output of the air quality fuzzy controller. The required power for ventilation control system is calculated by considering the air quality parameters’ optimization and the fuzzy rules explained earlier. The calculated power for ventilation system control based on these parameters is shown in Figure 19 for the ventilation control process.
The total power consumed by temperature, illumination and air quality for BA optimization and without applying the optimization algorithm is shown in Figure 20.
The comfort index values obtained by using BA optimization and without optimization are shown in Figure 21. The figure illustrates that the BA-optimized values are higher than without optimization which indicates that the BA offers a better comfort index to the occupant. The figure also indicates fluctuations in BA algorithm which is higher than that of without optimization.

5. Comparative Analysis of Optimization Results Bat Algorithm with Genetic Algorithm and Particle Swarm Optimization

Ali et al. in [2] deployed particle swarm optimization and genetic algorithm for energy consumption minimization and maximization of user comfort using the same data set used in this study. In the proposed work the power consumption comparison (for temperature control, illumination control, and humidity) of the BA algorithm with genetic algorithm and particle swarm optimization algorithm has been carried out. Here in this section, a comparison of the power consumption for temperature control, illumination control and air quality control have been carried out. The power consumption for temperature control by the BA algorithm is high as compared to the power consumption by the genetic algorithm and particle swarm optimization. The power consumption for both the illumination control and the air quality control by BA is less as compared to both the genetic algorithm and particle swarm optimization. The power consumed in total by BA is less than the power consumption of genetic algorithm (GA) and particle swarm optimization, as given in Table 1.
It is evident from the facts and figures given by the authors of [2] and our proposed model that BA algorithm consumes less power as compared to the genetic algorithm and particle swarm optimization. The reason behind this lower consumption of power is that the BA provides more optimal parameters as compared to GA and PSO. The authors of [2] described that the results provide by using PSO algorithm are smooth, but the GA algorithm results show more fluctuations. As the objective of this study is twofold, that is to minimize the user comfort and maximize user comfort, the proposed work for energy consumption performs well as proved. The minimum value for comfort index by using the BA algorithm is more compared to the minimum value provided by using both PSO and GA. As a result, it can be concluded that the BA algorithm is more effective to maximize user comfort as compared to GA and PSO.

6. Conclusions

This paper addressed the issue of maximizing user comfort and minimizing power consumption in residential buildings using a bat optimization algorithm and fuzzy controllers. The proposed system architecture comprises different components, such as environmental parameters (temperature, illumination, and air quality), BA optimizer, fuzzy controller, comfort index, fuzzy controller and various kinds of actuators. Inputs to the BA optimizer are environmental parameters (temperature, illumination, and air quality) and user-set parameters (temperature, illumination, and air quality). The optimizer parameters (temperature, illumination, and air quality) are the outputs of the BA optimizer. Inputs to the fuzzy controllers are environmental parameters and the BA optimizer parameters and the required power for actuators are its output. The calculation of total power required is carried out by coordinator agent which checks whether the required power send fuzzy controller is available or not. The statuses of the actuators are changed according to this power sent by the fuzzy controllers. The user comfort index has been increased and the power consumption has been decreased.

Acknowledgment

This research was supported by the 2017 scientific promotion program funded by Jeju National University, Any correspondence related to this paper should be addressed to DoHyeun Kim.

Author Contributions

Muhammad Fayaz designed the proposed scheme for efficient energy management in smart home in order to maximize user comfort and minimize energy consumption, implemented the system, did experimental work and paper writing. DoHyeun Kim conceived the overall idea for energy optimization in residential buildings and did supervision of the overall work.

Conflicts of Interest

The authors declare no conflict of interest.

References

  1. Ali, S.; Kim, D.-H. Effective and comfortable power control model using kalman filter for building energy management. Wirel. Pers. Commun. 2013, 73, 1439–1453. [Google Scholar] [CrossRef]
  2. Ali, S.; Kim, D.-H. Optimized power control methodology using genetic algorithm. Wirel. Pers. Commun. 2015, 83, 493–505. [Google Scholar] [CrossRef]
  3. Dounis, A.I.; Caraiscos, C. Advanced control systems engineering for energy and comfort management in a building environment—A review. Renew. Sustain. Energy Rev. 2009, 13, 1246–1261. [Google Scholar] [CrossRef]
  4. Wang, Z.; Yang, R.; Wang, L. Multi-agent intelligent controller design for smart and sustainable buildings. In Proceedings of the 2010 4th Annual IEEE Systems Conference, San Diego, CA, USA, 5–8 April 2010; pp. 277–282. [Google Scholar]
  5. Emmerich, S.J.; Persily, A.K. State-of-The-Art Review of CO2 Demand Controlled Ventilation Technology and Application; Diane Publishing: Collingdale, PA, USA, 2003. [Google Scholar]
  6. Levermore, G.J. Building Energy Management Systems: An Application to Heating and Control; E & FN Spon: London, UK, 1992. [Google Scholar]
  7. Benard, C.; Guerrier, B.; Rosset-Louerat, M. Optimal building energy management. Part 2; Control. J. Sol. Energy Eng. 1992, 114. [Google Scholar] [CrossRef]
  8. Kolokotsa, D.; Stavrakakis, G.; Kalaitzakis, K.; Agoris, D. Genetic algorithms optimized fuzzy controller for the indoor environmental management in buildings implemented using plc and local operating networks. Eng. Appl. Artif. Intell. 2002, 15, 417–428. [Google Scholar] [CrossRef]
  9. Kusiak, A.; Li, M.; Zhang, Z. A data-driven approach for steam load prediction in buildings. Appl. Energy 2010, 87, 925–933. [Google Scholar] [CrossRef]
  10. Široký, J.; Oldewurtel, F.; Cigler, J.; Prívara, S. Experimental analysis of model predictive control for an energy efficient building heating system. Appl. Energy 2011, 88, 3079–3087. [Google Scholar] [CrossRef]
  11. Wang, Z.; Wang, L.; Dounis, A.I.; Yang, R. Multi-agent control system with information fusion based comfort model for smart buildings. Appl. Energy 2012, 99, 247–254. [Google Scholar] [CrossRef]
  12. Bluyssen, P.M.; Aries, M.; van Dommelen, P. Comfort of workers in office buildings: The European hope project. Build. Environ. 2011, 46, 280–288. [Google Scholar] [CrossRef]
  13. Marino, C.; Nucara, A.; Pietrafesa, M. Proposal of comfort classification indexes suitable for both single environments and whole buildings. Build. Environ. 2012, 57, 58–67. [Google Scholar] [CrossRef]
  14. Mohan, N.; Sivaraj, R.; Priya, R.D. A comprehensive review of bat algorithm and its applications to various optimization problems. Asian J. Res. Soc. Sci. Humanit. 2016, 6, 676–690. [Google Scholar] [CrossRef]
  15. Handbook, A. Fundamentals; IP Edition; American Society of Heating, Refrigeration, and Air Conditioning Engineers, Inc.: Atlanta, GA, USA, 1989. [Google Scholar]
  16. Wright, J.A.; Hanby, V.I. The Formulation, Characteristics and Solution of Hvac System Optimized Design Problems; Loughborough University Institutional Repository: Stratford, UK, 1987. [Google Scholar]
  17. Ullah, I.; Kim, D. An improved optimization function for maximizing user comfort with minimum energy consumption in smart homes. Energies 2017, 10, 1818. [Google Scholar] [CrossRef]
  18. Huang, W.; Lam, H. Using genetic algorithms to optimize controller parameters for hvac systems. Energy Build. 1997, 26, 277–282. [Google Scholar] [CrossRef]
  19. Obara, S.; Kudo, K. Multiple-purpose operational planning of fuel cell and heat pump compound system using genetic algorithm. Trans.-Soc. Heat. Air Cond. Sanit. Eng. Jpn. 2003, 91, 65–76. [Google Scholar]
  20. Li, H.; Nalim, R.; Haldi, P.-A. Thermal-economic optimization of a distributed multi-generation energy system—A case study of beijing. Appl. Therm. Eng. 2006, 26, 709–719. [Google Scholar] [CrossRef]
  21. Zhen-Ya, Z.; Hong-Mei, C.; Shu-Guang, Z. An approach to the identification of temperature in intelligent building based on feed forward neural network and genetic algorithm. In Proceedings of the 2010 3rd International Conference on Computer Science and Information Technology, Chengdu, China, 9–11 July 2010; pp. 286–290. [Google Scholar]
  22. Yu, T. In Modeling occupancy behavior for energy efficiency and occupants comfort management in intelligent buildings. In Proceedings of the 2010 Ninth International Conference on Machine Learning and Applications, Washington, DC, USA, 12–14 December 2010; pp. 726–731. [Google Scholar]
  23. Wahid, F.; Kim, D.H. Short-term energy consumption prediction in korean residential buildings using optimized multi-layer perceptron. Kuwait J. Sci. 2017, 44, 67–77. [Google Scholar]
  24. Wahid, F.; Ghazali, R.; Shah, A.S.; Fayaz, M. Prediction of energy consumption in the buildings using multi-layer perceptron and random forest. IJAST 2017, 101, 13–22. [Google Scholar] [CrossRef]
  25. Mossolly, M.; Ghali, K.; Ghaddar, N. Optimal control strategy for a multi-zone air conditioning system using a genetic algorithm. Energy 2009, 34, 58–66. [Google Scholar] [CrossRef]
  26. Montazeri-Gh, M.; Poursamad, A.; Ghalichi, B. Application of genetic algorithm for optimization of control strategy in parallel hybrid electric vehicles. J. Frankl. Inst. 2006, 343, 420–435. [Google Scholar] [CrossRef]
  27. Azadeh, A.; Tarverdian, S. Integration of genetic algorithm, computer simulation and design of experiments for forecasting electrical energy consumption. Energy Policy 2007, 35, 5229–5241. [Google Scholar] [CrossRef]
  28. Fong, K.F.; Hanby, V.I.; Chow, T.-T. System optimization for hvac energy management using the robust evolutionary algorithm. Appl. Therm. Eng. 2009, 29, 2327–2334. [Google Scholar] [CrossRef]
  29. Ling, A.P.A.; Masao, M. Selection of model in developing information security criteria on smart grid security system. In Proceedings of the 2011 IEEE Ninth International Symposium on Parallel and Distributed Processing with Applications Workshops, Busan, Korea, 26–28 May 2011; pp. 91–98. [Google Scholar]
  30. Yang, X.-S. A new metaheuristic bat-inspired algorithm. Nat. Inspir. Cooper. Strateg. Optim. 2010, 284, 65–74. [Google Scholar]
  31. Yang, X.-S.; He, X. Bat algorithm: Literature review and applications. Int. J. Bio-Inspir. Comput. 2013, 5, 141–149. [Google Scholar] [CrossRef]
  32. Zadeh, L.A. Fuzzy Sets, Fuzzy Sets, Fuzzy Logic, and Fuzzy Systems: Selected Papers by Lotfi A. Zadeh; World Scientific Publishing Co., Inc.: River Edge, NJ, USA, 1996; pp. 394–432. [Google Scholar]
  33. Mamdani, E.H.; Assilian, S. An experiment in linguistic synthesis with a fuzzy logic controller. Int. J. Man-Mach. Stud. 1975, 7, 1–13. [Google Scholar] [CrossRef]
Figure 1. Proposed building energy management model.
Energies 11 00161 g001
Figure 2. Pseudo code of bat algorithm (BA).
Energies 11 00161 g002
Figure 3. Energy Consumption Optimization and Managing User Comfort in Residential Building Using Bat Algorithm and Fuzzy Logic.
Energies 11 00161 g003
Figure 4. Structure of fuzzy controllers.
Energies 11 00161 g004
Figure 5. User set parameter, environmental parameter and BA optimize temperature values.
Energies 11 00161 g005
Figure 6. Structure diagram for temperature fuzzy controller.
Energies 11 00161 g006
Figure 7. Membership functions for temperature fuzzy controller. (a) Input e T , (b) output RPT.
Energies 11 00161 g007
Figure 8. Example of fuzzy rule used in temperature fuzzy logic.
Energies 11 00161 g008
Figure 9. Power consumption for temperature with BA optimization and without BA optimization.
Energies 11 00161 g009
Figure 10. User set parameter, environmental parameter and BA optimize Illumination values.
Energies 11 00161 g010
Figure 11. Structure diagram for illumination fuzzy controller.
Energies 11 00161 g011
Figure 12. Membership functions for illumination. (a) Input e L , (b) output RPL.
Energies 11 00161 g012
Figure 13. Example of fuzzy rule used in illumination fuzzy logic.
Energies 11 00161 g013
Figure 14. Power consumption for illumination with BA optimization and without BA optimization.
Energies 11 00161 g014
Figure 15. User set parameter; environmental parameter and BA optimize air quality values.
Energies 11 00161 g015
Figure 16. Structure diagram for air quality fuzzy controller.
Energies 11 00161 g016
Figure 17. Membership functions for air quality. (a) Input e A , (b) output RPV.
Energies 11 00161 g017
Figure 18. Example of fuzzy rule used in air quality fuzzy logic.
Energies 11 00161 g018
Figure 19. Power consumption for air quality with BA optimization and without BA optimization.
Energies 11 00161 g019
Figure 20. The total power consumption using BA and without using BA.
Energies 11 00161 g020
Figure 21. User comfort index values with and without BA optimization.
Energies 11 00161 g021
Table 1. Power consumption comparison of BA with GA and PSO.
AlgorithmTemperature Power ConsumptionIllumination Power ConsumptionAir Quality Power ConsumptionTotal Power Consumption
GA4391475.16651.782566.14
PSO521.731531.01694.542747.29
BA (proposed approach)1020.23939.78536.972496.98

