Cost Optimization of Mooring Solutions for Large Floating Wave Energy Converters


1
Department of Civil Engineering, Aalborg University, Thomas Manns Vej 23, 9220 Aalborg ∅st , Denmark
2
Tension Technology International Ltd., 69 Parkway, Eastbourne, East Sussex BN20 9DZ, UK
*
Author to whom correspondence should be addressed.
Energies 2018, 11(1), 159; https://doi.org/10.3390/en11010159
Submission received: 11 November 2017
/
Revised: 8 December 2017
/
Accepted: 3 January 2018
/
Published: 9 January 2018
(This article belongs to the Special Issue Wave Energy Potential, Behavior and Extraction)
Abstract
:The increasing desire for using renewable energy sources throughout the world has resulted in a considerable amount of research into and development of concepts for wave energy converters. By now, many different concepts exist, but still, the wave energy sector is not at a stage that is considered commercial yet, primarily due to the relatively high cost of energy. A considerable amount of the wave energy converters are floating structures, which consequently need mooring systems in order to ensure station keeping. Despite being a well-known concept, mooring in wave energy application has proven to be expensive and has a high rate of failure. Therefore, there is a need for further improvement, investigation into new concepts and sophistication of design procedures. This study uses four Danish wave energy converters, all considered as large floating structures, to investigate a methodology in order to find an inexpensive and reliable mooring solution for each device. The study uses a surrogate-based optimization routine in order to find a feasible solution in only a limited number of evaluations and a constructed cost database for determination of the mooring cost. Based on the outcome, the mooring parameters influencing the cost are identified and the optimum solution determined.
1. Introduction
The rising demand for sustainable and renewable energy in the world has led to increasing research into and development of alternative energy resources. By now, energy from, e.g., wind and solar is well developed and an active part of the energy mix in industrialised countries worldwide. Despite a comparatively large energy potential, one resource that still is not a part of the energy mix is wave energy. During the last few decades, the amount of research in wave energy absorption has been significant, resulting in a considerable amount of concepts for new wave energy converter (WECs), with varying levels of development. Despite the effort, the wave energy sector is not yet at a commercial stage, and further improvement must take place before wave energy can contribute to the energy mix.
The work in [1,2,3] list the levelized cost of energy (LCOE) for a range of energy resources, indicating the high price of wave energy compared to oil and gas (O&G) and even other renewable resources. As a result, there is an urgent demand to decrease the cost in order for wave energy to evolve from the current pre-commercial stage. According to [4,5], several parameters can be improved and take a considerable part in the cost reduction of wave energy. Despite different evaluations of the importance, station keeping moorings are listed as a driver towards lower cost, as they are estimated by [6,7] to compose 20–30% of the total structural cost of a WEC. In [8], the mooring is estimated to take up 8% of the CAPEX cost.
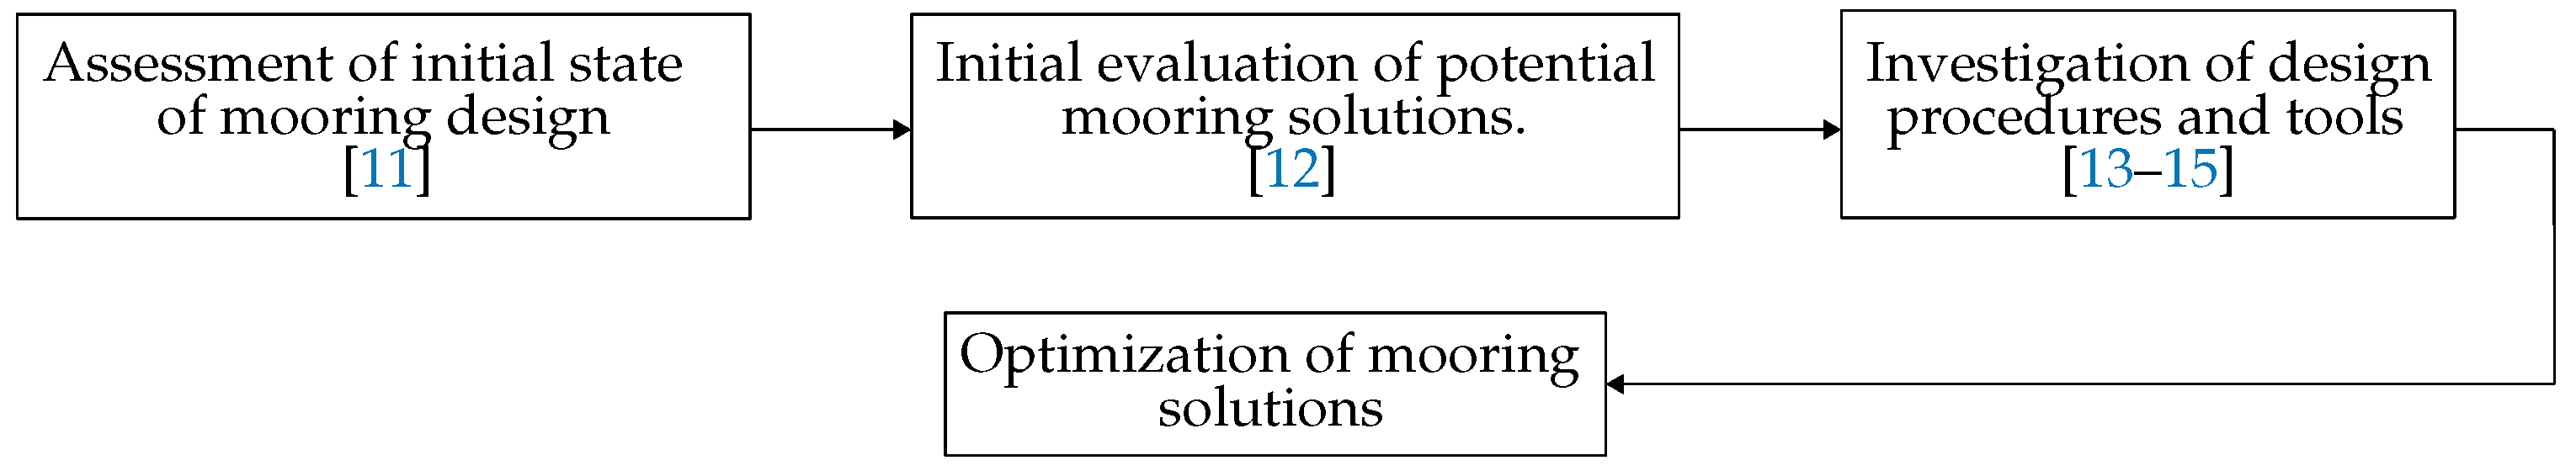
In addition to the cost, by now, mooring has also taken part in the failure of several WECs due to insufficient durability of the mooring system [7,9,10]. Consequently, a Danish research project entitled “Mooring Solutions for Large Wave Energy Converters” (MSLWEC) was initiated in 2014, which aimed at reducing the cost of the system, improving the applied design procedure and increasing the durability of the systems. Figure 1 illustrates a diagram of the project work and presents how the previous tasks have provided the basis and experience for this paper.
The project took its point of departure in the Danish wave energy sector and four WECs, all considered to be large floating structures with passive moorings, meaning that the mooring does not take an active part in the energy conversion. The four WECs are the Floating Power Plant [16], KNSwing [17,18], LEANCON Wave Energy [19] and Wave Dragon [20], cf. Figure 2. In the early research works, the initial layout and design procedures were investigated (cf. [11]), and they highlighted a significant need for a more thorough and detailed design and investigation of the applied mooring systems. This conclusion was based on the fact that all environmental conditions were not fully included, and in most cases, a quasi-static approach was used. Finally, the project also concluded that there was a common tendency of applying traditions from the O&G sector in, e.g., using heavy mooring chains for the system. The following task [12] evaluated the initially-applied systems, identified the use of mooring chains as an inefficient solution and instead highlighted compliant, synthetic ropes as a potentially inexpensive and useful solution and, furthermore, identified a single anchor leg mooring (SALM) system as a strong potential for WEC mooring. Other studied like, e.g., Ref. [21,22] similarly identified synthetic ropes as an appealing solution.
The following study [13] produced a large database of experimental data, used it to validate the initially-considered quasi-static design approach, and it identified a clear underestimation of mooring loads in extreme seas. Consequently, there was a need for a full dynamic analysis, as well as for further optimization of the initial mooring solutions since there was a clear possibility that these would not be capable of surviving in design storm conditions with extreme wind, wave and current.
Many different software packages are available for mooring analysis and have the capability to analyse the motion response and tensions under environmental load exposure according to limit states defined in design standards as in [23,24,25,26]. A number of tools was investigated in the project (cf. [14]) and has also been listed in other publications like [27]. A selected software package was validated against the experimental data in order to gain knowledge about the applicability of the tools on initial design, and the software proved its ability to model line tensions with acceptable overestimation of the tension without major tuning of the numerical model.
As presented in [13,27,28], the mooring characteristics are highly dependent on the site specification, mooring layout, materials, etc., and the response is, therefore, highly affected by the choices. The mooring design procedure is iterative, and it can be extremely time consuming to cover the full design space in order to find a solution that fulfils all defined requirements and, at the same time, provides a low cost. Based on the gained experience from the previous work on selecting tools, building hydrodynamic models and designing mooring, an optimization procedure must be utilized in order to find a cost-optimized solution, which introduces more reliable and fully-designed solutions compared to the initial layout.
In several studies like, e.g., [29,30,31], the energy absorption has been the objective of optimization with additional investigation of mooring line loads. The studies vary in the level of detail, the number of investigations of mooring configurations and the applied methodology, but they generally focus on operational conditions and the aim of improving the energy absorption as much as possible. This type of mooring is consequently reactive or active, and the actual cost of the moorings is not the objective of the studies. Naturally, optimizing mooring loads might reduce the needed strength of, e.g., lines and thereby reduce cost, but no actual cost investigation was done. Other optimization studies like, e.g., Ref. [32] treat the WEC farm layout in order to achieve the most feasible layouts for energy harvesting.
A passive mooring does not take an active part in the power take-off (PTO), and the cost is mostly determined by the extreme sea states during which survivability must be ensured. The present study focusses on the large floating WECs with passive moorings and uses an optimization procedure to reduce the mooring cost while securing that a reliable solution is found. The study continues the already presented work in the project “Mooring Solutions for Large Wave Energy Converters” and uses the four Danish WECs in Figure 2 as case studies.
2. Method
This section presents the methodology used for the optimization study and describes the four cases by means of environmental conditions, design limits and choice of optimization parameters.
2.1. Mooring Cases
The presented WECs are planned for deployment at different locations and have differences in their design requirement. Because of this, four cases are defined, one for each WEC and its mooring system, which is designed and optimized for the relevant deployment site. In previous publications like [12], the potential of different mooring solutions was assessed, and based on this, three different mooring solutions are considered for the four WECs. These are illustrated in Figure 3 and cover: (a) a single anchor leg mooring (SALM) system with submerged buoys, a deformable tether and a nylon hawser; (b) a taut turret system with nylon lines; and (c) a single point mooring (SPM) system with nylon lines and hawser.
All lines are composed of a chain part at the seabed connection, a synthetic line and a chain part at the fairlead. This is necessary for re-tensioning, to account for creep and to account for installation tolerances. A 2 m-long piece of chain is located at the seabed, while a chain length corresponding to 6% of the total line length is located at the WEC connection. Table 1 lists the system applied to each WEC.
2.1.1. Environmental Conditions
Each WEC is planned for deployment at a specific site either at the DanWEC test facility in Denmark, the Danish part of the North Sea or at the Belgian coast. Prior to the optimization, the environmental conditions for each site were assessed, and the 100-year extreme conditions were specified and can be read from Table 1. It is assumed that all waves are long-crested (2D), irregular and distributed in a JONSWAP spectrum with a peak enhancement factor .
The current is assumed steady over time, while the wind is modelled as a steady component and a time-varying gust component. The latter is described by an NPD wind spectrum according to [33]. Both wind and current are assumed to be varying in the vertical direction and are modelled with a power law profile.
The wind speed defined in Table 1 corresponds to the 1-hour mean value at a height of 10 m, while the current velocity is at the still water level (SWL). All environmental loads are assumed to be aligned; hence, a full 2D problem is analysed.
2.1.2. Design Criteria
Different design standards are available and can be used in the design of mooring systems, e.g., [23,24,25,26]. These standards define the necessary requirements and ensure survivability in operational and extreme conditions by considering design in the ultimate, fatigue and accidental limit state (ULS, FLS and ALS). For a passive mooring system, the mooring should not affect the PTO, and [34] shows that ULS has the most dominant influence on the cost. The present study, therefore, only considers the ULS, which is the reason why the 100-year extremes are listed in Table 1. In several publications like, e.g., [35,36], the safety levels defined by the design standards have been discussed. A relaxation of safety levels for WECs compared to O&G structures has been suggested, due to the lower consequence if a failure occurs. In [35], the safety levels for API-RP-2SK and DNV-OS-E301 are compared, and it is found that the API standard provides higher safety than the DNV. ISO and IEC provide similar safety factors as API. In other works like [37,38,39,40], the topic of reliability assessment of WECs is treated with detailed work on calibration of safety factors, estimation of extreme values and reliability assessment approaches.
In order to follow the suggestion from [35] of using relaxed safety, the DNV-OS-E301 standard and the most relaxed consequence class (CC1) are used in the present analysis.
The standard focuses primarily on ensuring sufficient strength of the mooring lines and anchors to withstand the induced tensions. According to DNV-OS-E301, the design tension is defined by Equation (1):
where is the characteristic strength corresponding to 95% of the minimum breaking strength and and are the safety factors for respectively the mean and dynamic part of the line tension. is the mean tension, while is the dynamic part of the tension and is defined by Equation (2):
where is the most probable maximum with a 63% probability of exceedance when the extreme peaks tend to follow a Gumbel distribution. By applying the safety factors for the given consequence class, a target annual probability of failure of is obtained.
According to DNV [41], the anchor should be designed for the same design tension as the lines, while the characteristic anchor resistance provided by the manufacturer is reduced by a safety factor .
DNV-OS-E301 only considers survivability in ULS, and hence, the excursion is not specified in the standard as a design criterion. However, the WECs are equipped with umbilicals, which puts a limit on the allowable excursion, because tensions in these must be prohibited [27]. The design of the umbilical is, therefore, often a part of the mooring design and a compromise between the cost of umbilical and mooring. In the present study, the excursion limit in Case 3 was defined by the developer, while it was approximated for the remaining cases by assuming a lazy-S layout for the umbilical; cf. Figure 4. By accounting for the minimum bending radius of a suitable cable, clearance between seabed and sea surface and for water level variations (high water level (HWL) and low water level (LWL)), it is possible to calculate a cable length and an allowable excursion. This limit is defined in Table 1 and illustrated in Figure 4. Naturally, this is only a pragmatic approach to obtain an estimation of the excursion limit, but in the final design, a more detailed investigation and design of the interaction of the umbilical on the WEC must be included in the mooring design.
The WEC in Case 1 is equipped with a wind turbine, which puts additional restraints on the motions. In operational conditions, the power production of the turbine must be considered, while it is merely vital to secure stability in the ULS. For the given turbine, a pitch limit of was defined by the developer; cf. Table 1.
2.1.3. Optimization Parameters
Considering the layout of the mooring solutions in Figure 3, several parameters can be varied for each solution and will change the characteristics of the system. Table 2 lists the optimization parameters for each case together with the maximum and minimum values considered for each parameter. As seen, the mooring and type of optimization parameters for Cases 1 and 2 are identical, while they vary for Cases 3 and 4.
For all cases, the Bridon Superline Nylon [42] is considered with the range of diameters listed in the table. The lines are modelled with a non-linear stiffness curve and structural parameters according to [42].
The definition of the footprint radius (FPR) is illustrated in Figure 3 and varies significantly for each case. In Cases 1 and 4, the maximum FPR is chosen in order to ensure that there is no interaction between the WEC and the lines; cf. Figure 5. For Case 2, this problem is not present, and the upper value is chosen based on the length of the device. For Case 3, it is based on the umbilical.
The unstretched mooring line length is not considered as a direct optimization parameter, even though it is varied for each configuration. For the WECs in Cases 1, 2 and 4, a vertical pretension is specified and fixed for all simulations, and therefore, the line length is varied dependent on the FPR and line stiffness in order to achieve this pretension. In Case 4, the vertical pretension is calculated to ensure vertical equilibrium between line tension and buoyancy of the surface buoy in calm seas. In Case 3, the line length is varied directly because of the FPR. In this case, the steel rods are not a part of the optimization, but are dimensioned based on the obtained design tension in the rods. The maximum dimensions of the buoys are decided based on the length of the tether. In Case 4, the value is based on the investigation of the available buoys from commercial manufacturers.
In Case 4, the hawser length is not varied since the zero-position of the buoy is fixed, and there is no pretension in the line. In early stages of the work, it was intended to use a nylon hawser, but a suitable solution was not found, so a rigid bar is used instead.
The anchor type is determined prior to the optimization as drag embedded anchors with vertical strength for Cases 1, 2 and 4, while a gravity-based anchor is used for Case 3. The anchors are designed based on the achieved tensions in the lines at the anchor point, and hence, the necessary anchor size is determined after each simulation is completed and is not an optimization parameter.
As seen from Table 2, the optimization considers between 4 and 10 lines in the layouts. In some applications (cf., e.g., [11]), configurations with three lines are considered. In this study, however, this number is considered insufficient in order to increase durability and redundancy, which is considered a vital parameter for a mooring system [27]. This is mainly a problem in the ALS, but must be taken into account early in the process. Figure 6 presents the influence from the number of mooring lines on the static behaviour of a mooring. Considering the first graph, it is indicated that the horizontal mooring stiffness, as expected, increases with the number of lines. By having only three lines, it is possible to achieve around 40% of the stiffness with 10 lines. Considering the second graph, the advantage of having more than three lines is clear. The figure presents the relationship between intact stiffness and the stiffness when one line is broken. With only three lines, almost all stiffness is lost, and even though two lines are remaining, the durability of the system can be expected to be much less. With 4–10 lines, 60–80% of the stiffness remains after one line fails. By also considering the third graph, it is seen that the static position of the device at failure of a line is significantly worse when only having three lines. The displacement is approximately 55% larger than with 10 lines with one broken, while it decreases to 12% with 4 lines. The displacement is illustrated in Figure 6 with examples for 3 and 6 lines, where the displacement in the latter is almost negligible and hardly visible.
A traditional SALM system does not provide the same amount of redundancy as only one line connects the buoy to the seabed. For the given system, the hawser is composed of four lines, meaning that there is some redundancy if one nylon line breaks. However, in general, the system is much more vulnerable to failure. As a result, DNV-OS-E301 requires an additional safety factor of 1.2 in tension.
In a final design, it is necessary to ensure survivability in both ALS and ULS. As previously stated, this paper focusses on the ULS, but the above considerations and the fact that a solution with three lines has been discarded account for a simple and coarse evaluation of the ALS.
2.2. Mooring Analysis Procedure
There are different methods available for the evaluation of the wave-WEC interaction, generally divided into experimental and numerical methods. Experiments provide highly reliable solutions, but are time consuming and often expensive, and it is difficult to include all environmental loads without introducing significant sources of errors, especially in small-scale tests. Sophisticated non-linear numerical models can be established through, e.g., computational fluid dynamics (CFD) or smoothed particle hydrodynamics (SPH), but the computational demands for such calculations are immense, which is why the methods are not suitable for initial mooring design where many iterations are needed and the simulation time is long. Often, the boundary element method (BEM) is used, which assumes inviscid, irrotational fluids and uses linear potential flow theory with its assumption of small steepness waves and small amplitude structure motion. In the ULS, this theory is stressed significantly, due to the extreme wave condition and compliant mooring, which allows large motions, but this work builds on the experience gained in previous work [15] where the applicability was validated for initial design and analysis.
In this study, the open-source BEM code NEMOH [43] is used, which provides the frequency-dependent added mass, radiation damping, wave excitation and Kochin coefficients. As explained in [44], the latter can be used for the calculation of the mean wave drift coefficients using the far-field formulation.
The output of NEMOH is coupled to the commercial time domain mooring solver OrcaFlex [45], which utilizes the Cummins equation to determine the coupled response of the WEC and mooring lines, by including all first and second order wave load contributions together with the wind and current loads. The output of the software package is a time series of line tension and WEC motions. The construction of the numerical model follows the procedure presented in [15].
Using linear theory on Case 4 is not without problems, as the device is an overtopping WEC where a safety system increases the draught in extreme seas to increase overtopping and decrease the loads. The BEM cannot directly account for overtopping, and by increasing the structure volume below the SWL, the loads are actually increased. In later research, this problem will be addressed and an improved model will be used. At present, the model is used with this inaccuracy, which especially is causing a significant problem with second order drift. Consequently, this first optimization of Case 4 has only been for 1st order wave loading, while both 1st and 2nd order effects are considered for the remaining cases.
2.3. Cost Database
For the calculation of the cost of each mooring system configuration, a database was constructed where the cost was calculated based on specification of the mooring components. The database included a high level of detail and considered the cost of both CAPEX and OPEX for a lifetime of 20 years. The database was based on the authors’ experience and knowledge from other marine projects, manufacturers and providers.
The following subsection provides some of the assumptions behind the numbers, but it is not possible to list costs directly in this paper.
2.3.1. CAPEX
Planning, design, survey and engineering comprise a significant part of the mooring cost and were included as a fixed price based on the type of mooring system. The cost included assumption of the entire design process from determination of environmental conditions, site and seabed surveys (including vessel and labour), analysis and detailed engineering, together with estimation of the cost for review and certification and planning of the installation. All cost was found based on the assumption of the duration of each task and the expected day-rates. Final inspection and project management were also included.
The manufacturing and procurement cost is primarily based on prices provided by manufacturers of the given components. For the nylon line, the cost is dependent on the minimum breaking strength (MBS) and includes the protective jackets, a chain part at the connection point between line and WEC and the cost of connections. The anchor cost is based on the type of anchor and necessary weight to ensure survivability and includes the chain at the anchor point.
The cost of buoys and stainless steel rods is based on a fixed cost per unit weight and with the estimation of the cost for the universal joint, top-swivels and connection hardware. The cost of fairleads with tensioners was included and dependent on the number of lines.
Estimating the cost of a turret system is highly complicated and is a significant part of the overall cost. For the given cases where turrets are included, the cost is a fixed price based on experience from comparable applications.
All component cost includes certification and delivery to a North European port.
The installation and hook-up cost is mostly dependent on the cost of the needed vessels and the amount of labour needed. For each type of mooring system, the types of vessels, cranes, etc., were decided, and the current day-rates for these were collected. Generally, it was assumed that one line could be installed per day and a total of two days were needed for tensioning of all lines. For each vessel day, four person-days were needed. The installation cost included cost for preparation in the port and estimation of waiting time for a suitable weather window.
The decommissioning cost was based on a dismantling cost corresponding to 110% of the installation and hook-up, while material disposal was estimated to be 1 % of the CAPEX. A fixed value for seabed clean-up was found and dependent on the type of mooring system, as some systems have more seabed interaction than others.
The CAPEX is based on existing experience and current cost of vessels and labour. Naturally, this introduces some uncertainties in the calculations, particularly because presently, the cost rates are at the lowest level in a number of years due to the decline in the oil industry. Similarly, installation cost, etc., has been made with the assumption of waiting time, which is highly dependent on the site and season. For final cost evaluations, more specific input can be given to the cost database to decrease uncertainties, but presently, it provides generic and realistic estimations on the cost.
2.3.2. OPEX
The OPEX cost is based on a lifetime of 20 years and includes insurance, inspection and maintenance. The insurance is estimated as 1%/year of the total CAPEX, while 4 vessel days and 16 person-days are assumed for inspection and maintenance. This corresponds to checking and adjustment of tension after one month and after 1, 5 and 10 years. Replacements throughout the lifetime are assumed to correspond to 1.5% of the CAPEX based on experience.
Similar to the CAPEX, the OPEX cost introduces some uncertainties mainly resulting from the fact that some level of novelty is seen in the concepts. This means that no historical evidence is available to support the reliability for a 20-year deployment. Additionally, the risk of external damage to the system is difficult to take into account in the cost evaluation. Finally, the insurance cost takes up a considerable part of the OPEX, but in most industries, there is an increasing trend in this cost. Any type of failures due to mooring will expectedly lead to a significant increase in the insurance cost, and at present, several years of deployment are needed to build a reliability record in the industry and more knowledge about OPEX cost.
2.4. Optimization Procedure
According to the problem defined in Section 1, the objective of the current work is to minimize the cost of the applied mooring system while securing that the found system satisfies the ULS. This results in the optimization problem in Equation (3):
where is the variable vector, is the objective function and is the design space; cf. Table 2. Since the cost and response are directly related to the combination of variables in the design space, a full simulation is required for each mooring configuration. The objective function, therefore, evaluates the cost of the mooring based on a dynamic simulation of the complete system under extreme conditions. As the complete design space has a significant size, it is not feasible to evaluate the complete space to find the minimum solution, and instead, a methodology should be applied aiding in the search for minimums with only a limited number of function evaluations. For the objective function used in this study, no derivative information is available for identifying the minimum as no analytical description of the response surface can be constructed. Therefore, a derivative-free surrogate-based (also denoted meta-model) optimization algorithm is used, which has the clear advantage of only requiring a relatively limited number of function evaluations compared to, e.g., evolutionary algorithms [32]. In the surrogate-based optimization, the response surface is described by a surrogate model, constructed from the results of a limited number of function evaluations and used to identify the minimums. Several variations of derivative-free algorithms have been developed and presented in, e.g., [46,47], and this paper utilizes the surrogate-based algorithm in the MATLAB Surrogate Model Toolbox (MATSuMoTo) [48]; the model will be further explained in later sections. Figure 7 illustrates the steps in the algorithm as defined in [29,48].
As illustrated in Figure 7, the procedure is initiated by evaluating the objective function in a number of tests (Steps 1–2) used to construct a surrogate model (Step 3). A new number of points are selected (Step 4), and the objective function is evaluated at these points (Step 5) and used to update the model (back to Step 2). This procedure is continued until a chosen termination criterion is met. The following sections will provide an explanation of each step in the procedure.
2.4.1. Initial Design of Experiments
In order to make the surrogate model, it is essential to have initial knowledge of the design surface by conducting a number of simulations. In order to ensure that sufficient data are obtained and an efficient surrogate model can be constructed, the sampling points must be chosen to provide as much information on the response surface as possible. A design of experiments (DoE) strategy is initiated, which covers several different concepts [49,50]:
- Latin hypercube
- Corner
- Latin square
- Full factorial
- Fractional factorial
It is not possible to determine prior to the evaluation which strategy is the best choice, but according to [49], Latin hypercube is often suitable. The present study utilizes this method. A sufficient number of evaluations in the DoE must be chosen, and in the given study, the numbers were based on the following Equation (4):
where is the number of samples in the DoE and d is the number of optimization parameters [50].
2.4.2. Surrogate Model
In general terms, the surrogate model can be expressed by Equation (5):
where is the output of the objective function at point , is the output from the surrogate model and is the difference between them [48]. Many different types of surrogate models are available and presented in [46,51] and are generally either interpolating (radial basis functions (RBF) and kriging) or non-interpolating (polynomial regression models and multivariate adaptive regression splines (MARS)) [51].
Different surrogate models suit different problems, and it is not possible to determine beforehand which model to choose without testing each of them. Considering that the purpose of the optimization is to find the optimum in a short time, testing each surrogate model to find the best is not feasible. In order to limit the influence of a bad surrogate model choice, model ensembles (or mixture models) can be used, which utilize weighted combinations of two or more models and emphasize the models that perform well (low error and high correlation coefficients) and restrict the influence from the poor models (large error and low correlation coefficients). The mixture models are represented as Equations (6) and (7) [51]:
where is the output of the mixture model at point , N is the number of surrogate models in the mix, is the output of the r-th model and is the weight of it. MATSuMoTo uses the Dempster–Shafer theory to combine the models and takes advantage of correlation coefficients, maximum absolute error, median absolute deviation and root mean square error to calculate the weight for each model, based on the performed objective function evaluations in the procedure [52].
Naturally, the number of surrogate models in the mix results in a larger number of models that need to be updated in each loop in the procedure and puts higher demands to the computational effort. On the other hand, the chance of selecting a poor model is minimized, and a much better description of the response surface is obtained [51].
Several studies like [46,51] have compared and investigated which models and model ensembles perform best, and [51] found that the use of RBF, either alone or in combination with other models, generally provided a reliable solution. Consequently, this study uses a model ensemble of a cubic RBF and a MARS model.
2.4.3. Sampling Technique
Different methods can be considered for choosing the sampling points in each loop. In general, either a randomized sampling technique or the constructed response surface can be used. In this study, the randomized method is used.
Within the randomized method, two different strategies can be used. A local search can be considered where the current optimum points are perturbed. This method is most suitable for problems where only a single minimum is present in the response surface, as the solver will tend to search towards one minimum and will not necessarily find more. The other strategy is a global search where the solver still perturbs the best points so far, but also selects a number of uniformly-distributed points in the whole design space. As the optimization progresses, the perturbation is decreased in order to find the best solution. When MATSuMoTo is no longer improving the output over a consecutive number of trials, the algorithm will restart with a new DoE and construct a new model based on the new evaluations in order to aim the search toward other areas of the design space [50].
When selecting the best candidate points, two criteria are used: the distance and response surface criteria. The distance criterion is based on the distance to already evaluated points, while the response surface criterion is based on the value predicted by the surrogate model. A score is assigned to each point as a weighted sum of these two. In order to select a point close to the expected minimum, a large weight is put on the response surface criterion, while a large weight must be put on the distance criterion to select points in unexplored areas.
The optimization can either be considered as an integer or mixed-integer problem dependent on the variables. The different problems affect the sampling strategy as presented in [48,53,54], and for the mooring cost optimization, the definition of parameters are listed in Table 3. Most parameters are considered integer, such as line number, line diameters and footprint radius. Considering the installation process and allowable tolerances during installation, it is not relevant to consider the footprint radius as a continuous parameter. The buoys can be produced in custom sizes and are, therefore, continuous parameters in the optimization procedure.
2.4.4. Penalty Function
Naturally, the least expensive mooring solution will be the one consisting of the least amount of materials, because cost for components, installation, etc., will be small, but this solution might not fulfil the design requirements defined in Section 2.1.2. In order to ensure that the solver accounts for this and to search for the least expensive solution that also fulfils the requirements, a cost penalty is applied to the inadequate solutions.
Different types of penalty functions can be applied when the criteria are exceeded, e.g., letting the cost be a fixed and high value or adding a fixed value to the actual cost. The first solution is not applicable as the result will provide a plateau on the response surface, and it will be more difficult for the solver to detect which solutions perform the best. The latter function will not provide a plateau, but will not be dependent on the performance of the system; hence, if the least expensive solution results in the largest exceedance of the requirements, it will still appear less expensive than a more expensive solution, which performs better and is closer to satisfying the requirements. Consequently, the following penalty function is applied through the following Equations (8) and (9):
where is the penalty associated with the violation of one design criterion, N is the number of design criteria, is the simulated motion or tension and is the associated design criterion. The -factor is defined as a fixed value in € and ensures that the mooring solutions that perform worst have the largest prizes, so that MATSuMoTo will diverge from them. The -factor is defined as a fixed penalty in €, which is used to ensure that none of the insufficient solutions are less expensive than the most expensive and adequate solution. The - and -factors must be determined beforehand by assessing the extreme cost difference between the possible solutions.
2.4.5. Termination Criterion
The optimization is finished when the solutions are converged; hence, the minimum mooring cost is found. As stated in [48,51], MATSuMoTo is asymptotically complete, indicating that if an indefinite number of calculations is performed, the global minimum will be found with a probability of one. However, the termination criterion is listed as a maximum number of evaluations, after which the minimum cost is identified.
OrcaFlex is generally computationally effective and can run more simulations simultaneously. It is possible to run a potentially large number of simulations, and 300 evaluations were selected.
Considering Figure 8, the progress of the optimization for each of the cases is plotted. It is clearly observed how the optimization procedures manage to identify less expensive solutions until reaching a value where the solution converges. In the analysis of each case, the routine had one restart as mentioned previously, which means that the optimization is not based on one model constructed from 300 evaluations, but two models with less evaluations. Often, an approach is used where the routine is not restarted in order to check the convergence with a higher number of evaluations, but this has not been done in this research, and it is not expected to affect the result. From the figure, it is concluded that even less evaluations would have been sufficient for identifying an optimum. For Case 4, it is seen how the solutions in the DoE already provided a solution close to the optimum, but still manages to make further improvement.
3. Results
This section presents the outcome of the optimization routine when using the method as described in the previous section. Each case is presented separately and followed by a common discussion in the next section.
3.1. Case 1
The mooring solution in Case 1 consists of a synthetic turret system, and based on the optimization, the optimal layout has parameters as listed in Table 4. The mooring cost has been normalized according to the total CAPEX and OPEX of the WEC.
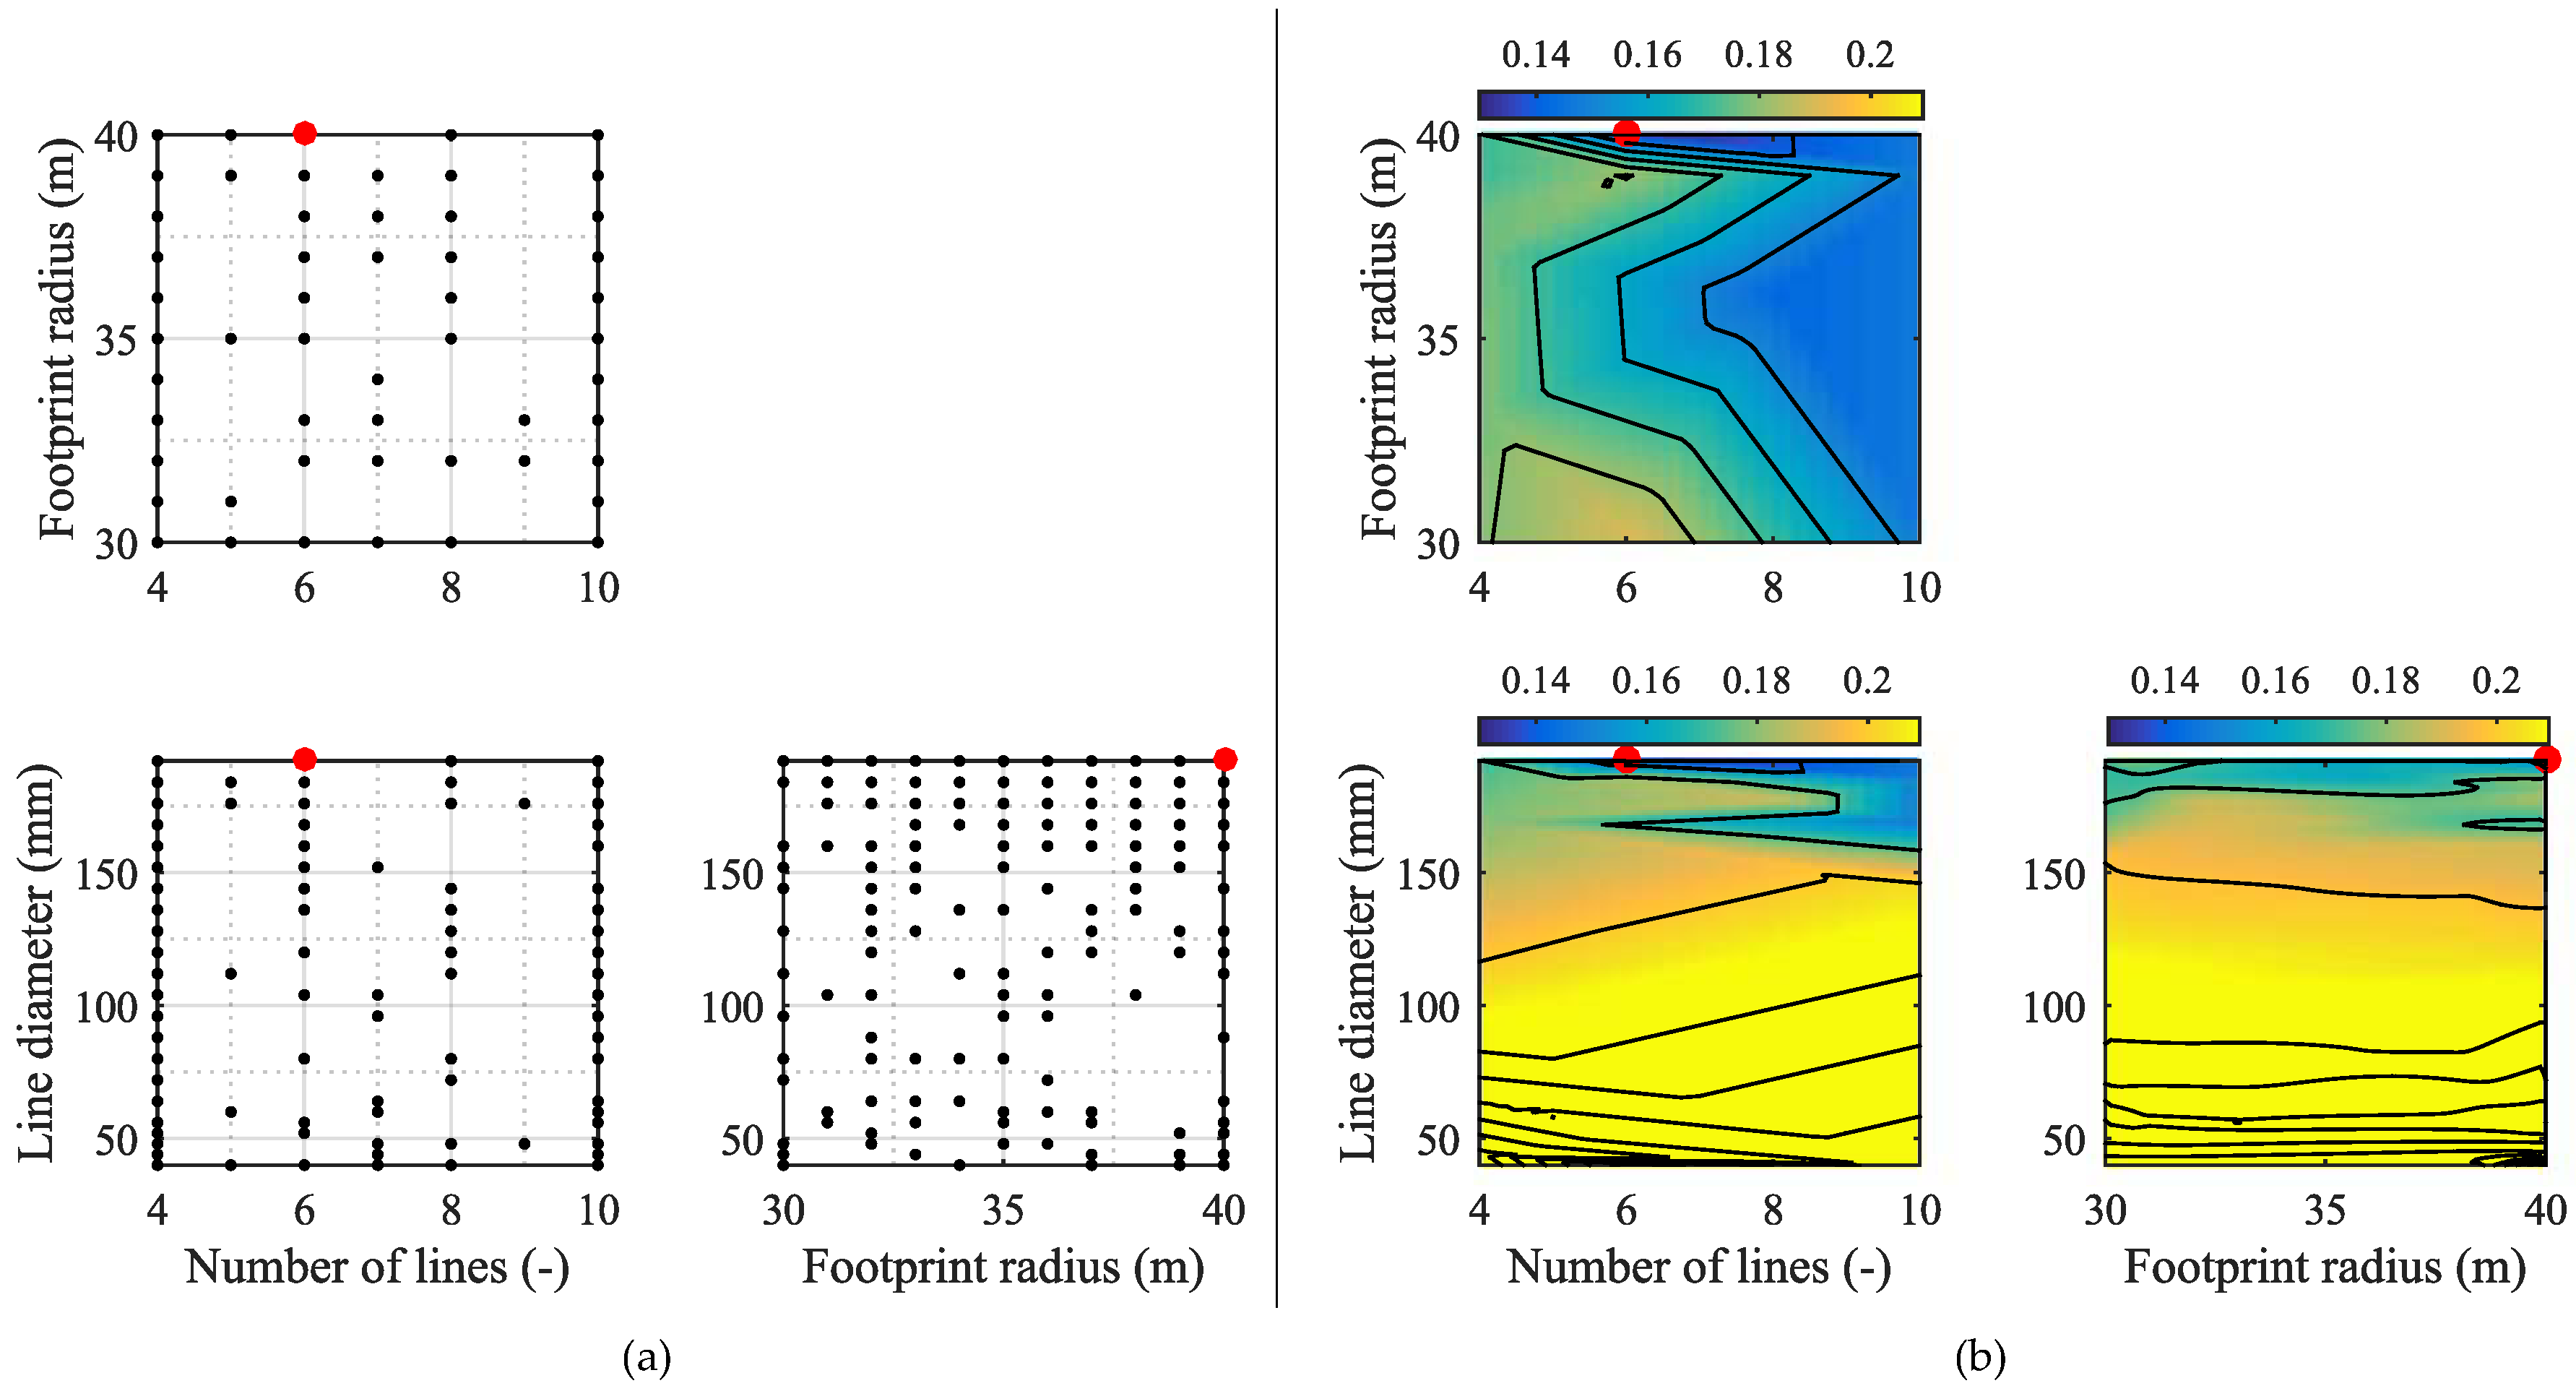
Figure 9a illustrates the evaluated points, with the optimum as a red marker. Figure 9b presents a contour plot for the cost of the mooring when normalized according to the total WEC cost. The figure presents systems with and without cost penalty, but the satisfying solutions are found in the normalized cost range 0.13–0.15. In this plot, it is possible to detect the influence of each parameter. In the top right plot, the footprint radius is plotted against the number of lines. The line diameter is kept constant in this plot and corresponds to the optimum. It is clearly seen that the footprint radius only provides a small influence on the cost, while an approximately 15% cost reduction can be achieved by varying the number of lines. Naturally, a large number of lines increases the cost due to installation, the amount of anchors and line materials, etc., but it also highly influences the mooring stiffness, corresponding motions and line tensions. Decreasing the line number from six to four decreases the mooring stiffness by 32% and results in larger excursions. Fewer lines also need to each take up a larger part of the load, and the tension with four lines is 10% larger than with six lines, resulting in insufficient strength. Increasing the line number to 10 lines increases the stiffness by 63%, but the larger number of lines means that each line only takes 75% of the tension experienced in the system with six lines. This means that the anchor size can be decreased. The installation cost is primarily dependent on the number of lines and is, therefore, largest for the system with 10 lines (80% larger than the cost for four lines); but since the motion limit is exceeded with four lines, the cost penalty has been applied to the system, and the difference appears smaller in Figure 9. Clearly, the optimum value is found as a balance between finding the lowest number of lines, where low installation cost is present, and finding a high enough number of lines to ensure small tensions in the lines with a corresponding need for smaller anchors and certainty on the line strength.
Considering the number of lines against the line diameter, it is clear that the most dominating parameter is the diameter. Having a small line results in a very compliant system, which in many cases causes a violation of the surge limit, while the line also provides less and insufficient strength. It is necessary to use some of the largest considered diameters in order to find a suitable solution, and the least expensive is found by using the strongest lines and reducing the line number.
In the final plot, this tendency is also observed as the footprint radius only provides minor importance while the line diameter is paramount to optimize. Considering all the graphs by Figure 9, it is noticeable that a large part of the evaluation provides insufficient solutions, and it would merely have been necessary to consider a few of the largest line diameters.
3.2. Case 2
As presented in Table 2, Case 2 considers an overall mooring design similar to the system in Case 1. However, this structure is located at a greater water depth and has less restriction on surge and none on pitch; cf. Table 1. By also considering Table 2, it is observed that this case allows for a larger footprint radius, which provides a larger range to find an optimum solution. Table 5 presents the results from the optimization.
Figure 10a presents the sample points. It is clearly indicated that the solver identified the need for large line diameters and aimed the search at these diameters. Similarly, it is indicated that smaller footprint radii were sufficient.
Figure 10b presents the cost contour for the problem where the working solutions are found in the normalized cost range 0.15–0.19. Similar to the previous case, one parameter (the optimum) is kept constant in each diagram, and the influence from the remaining can be identified.
When considering the footprint radius against the number of lines, a similar tendency as in Case 1 is observed. Variation in the number of lines provides a cost difference of approximately 20%. This difference is primarily caused by the influence on anchor and line loads. A large number of anchors might cause a high cost, but having too few lines causes large loads and insufficient strength. The cost is less independent of the footprint radius.
In the plot of line diameter against the number of lines, the influence from the former is seen to be crucial for the cost. Decreasing the line diameter leads to a paramount cost increase, because of the penalty function, as the line strength tends to become insufficient or the compliance so large that the excursion limit is exceeded. The number of lines plays a less important role, but it is seen how too few lines cause a higher cost.
In the final plot, the footprint radius and line diameter are presented with the number of lines kept constant. Similar conclusions can be made from this, which indicates that the main parameter is the line diameter. The footprint radius has a minor influence, but by decreasing it, the line material is decreased and results in some minor cost reduction.
3.3. Case 3
Case 3 consists of a larger number of optimization parameters compared to the first two cases. Table 6 presents the result of the optimization.
When considering Figure 11a, it is obvious that the code identified the minimum and concentrated the evaluation around this point. In Figure 11b, where the working range of the normalized cost is 0.48–0.52, it is apparent that a significant parameter for the cost is the line diameter. Similar to Cases 1 and 2, only the largest line diameters provide sufficient strength, but in this system, a larger range of diameters is adequate. Considering the very low stiffness presented in Table 6, it will be expected to obtain smaller loads. In the top graph, the influence from the two buoys can be identified. Buoy 1, which is the bottom buoy, provides the lowest influence on the cost, while the top buoy provides the most influence in the system and hence determines the cost. The best solution is found by having a large buoy at the top, while the other can be relatively small. The footprint radius (and thereby, the hawser line length) also provides an important influence on the system, as it highly determines the overall stiffness. Having a large radius provides large compliance and mainly causes problems with exceedance of the surge restraint. A small radius still ensures satisfaction of all requirements, but results in larger loads, hence the need for a larger anchor. Compared to Cases 1 and 2, the mooring cost of this system is taking up a larger part of the total cost. This is partly because the device itself is less expensive, but also because the gravity type anchor in this system is expensive and other types should be investigated.
3.4. Case 4
As described in Section 2.2, the hydrodynamic model of the WEC in Case 4 provides a significant inaccuracy, which also affects the optimization procedure. Table 7 presents the result for this case.
Due to the implications of using linear theory on an overtopping device, very large loads are seen and cause difficulty in finding an adequate solution. Consequently, the strongest line is chosen and with the highest number of lines. Figure 12 clearly identifies the problem of finding a solution since a significant part of the design space gives a high cost due to the penalty function. The normalized cost of the working systems is in the range 0.22–0.24. The number of lines provides an influence as it helps distribute the loads into more lines and thereby secures sufficient strength in each and also lighter anchors. Similar, the footprint radius can be used for modifying the cost through its effect on the stiffness and load on anchors. Clearly, a large radius is desired as the longer lines introduce more compliance.
The buoy size also plays an import part in the system response and cost. By having a large buoy with high buoyancy, the stiffness of the system is primarily an effect of the line stiffness, while also a large pretension in obtained. A smaller buoy results in more vertical compliance and reduces the line tensions. The optimizer identifies a small buoy as the most feasible solution and instead requires strong lines and a larger footprint radius.
4. Discussion and Conclusions
This paper used a surrogate-based optimization model to find the most suitable mooring configuration for four large floating WECs, considering design in the ULS and aiming to find the least costly solutions. Based on the presented environmental conditions and design constraints for each device, numerical models were constructed in the BEM code NEMOH and time domain model OrcaFlex. In this connection, a database of costs was constructed and used to calculate the total lifetime cost for each solution.
Based on the optimization routine, four working solutions were found. Even though it is not possible to detect from the normalized values in Figure 9, Figure 10, Figure 11 and Figure 12, it was found that the cost for Cases 1, 2 and 3 approached comparable values despite some differences in the mooring layouts as Case 3 is equipped with a buoy and hawser, while Case 1 and 2 are turret systems. The cost for these two become high due to the turret system, while Case 4 becomes expensive due to larger loads and more anchors. Case 3 provides a clear low value when compared to the other cases and can both be explained by the fact that the mooring layout is much different, but also by the fact that the WEC is extremely light compared to the other devices and with a much smaller draught, which induces smaller loads on the WEC. As the devices are different in layout, it is not possible to directly compare the cost between the cases. In [8], the cost of mooring for a single point absorber buoy is listed to take up 8% of the total CAPEX, which for the current four cases is in the range 8–25%. The larger structures, hence, result in relatively more expensive moorings due to increased loads.
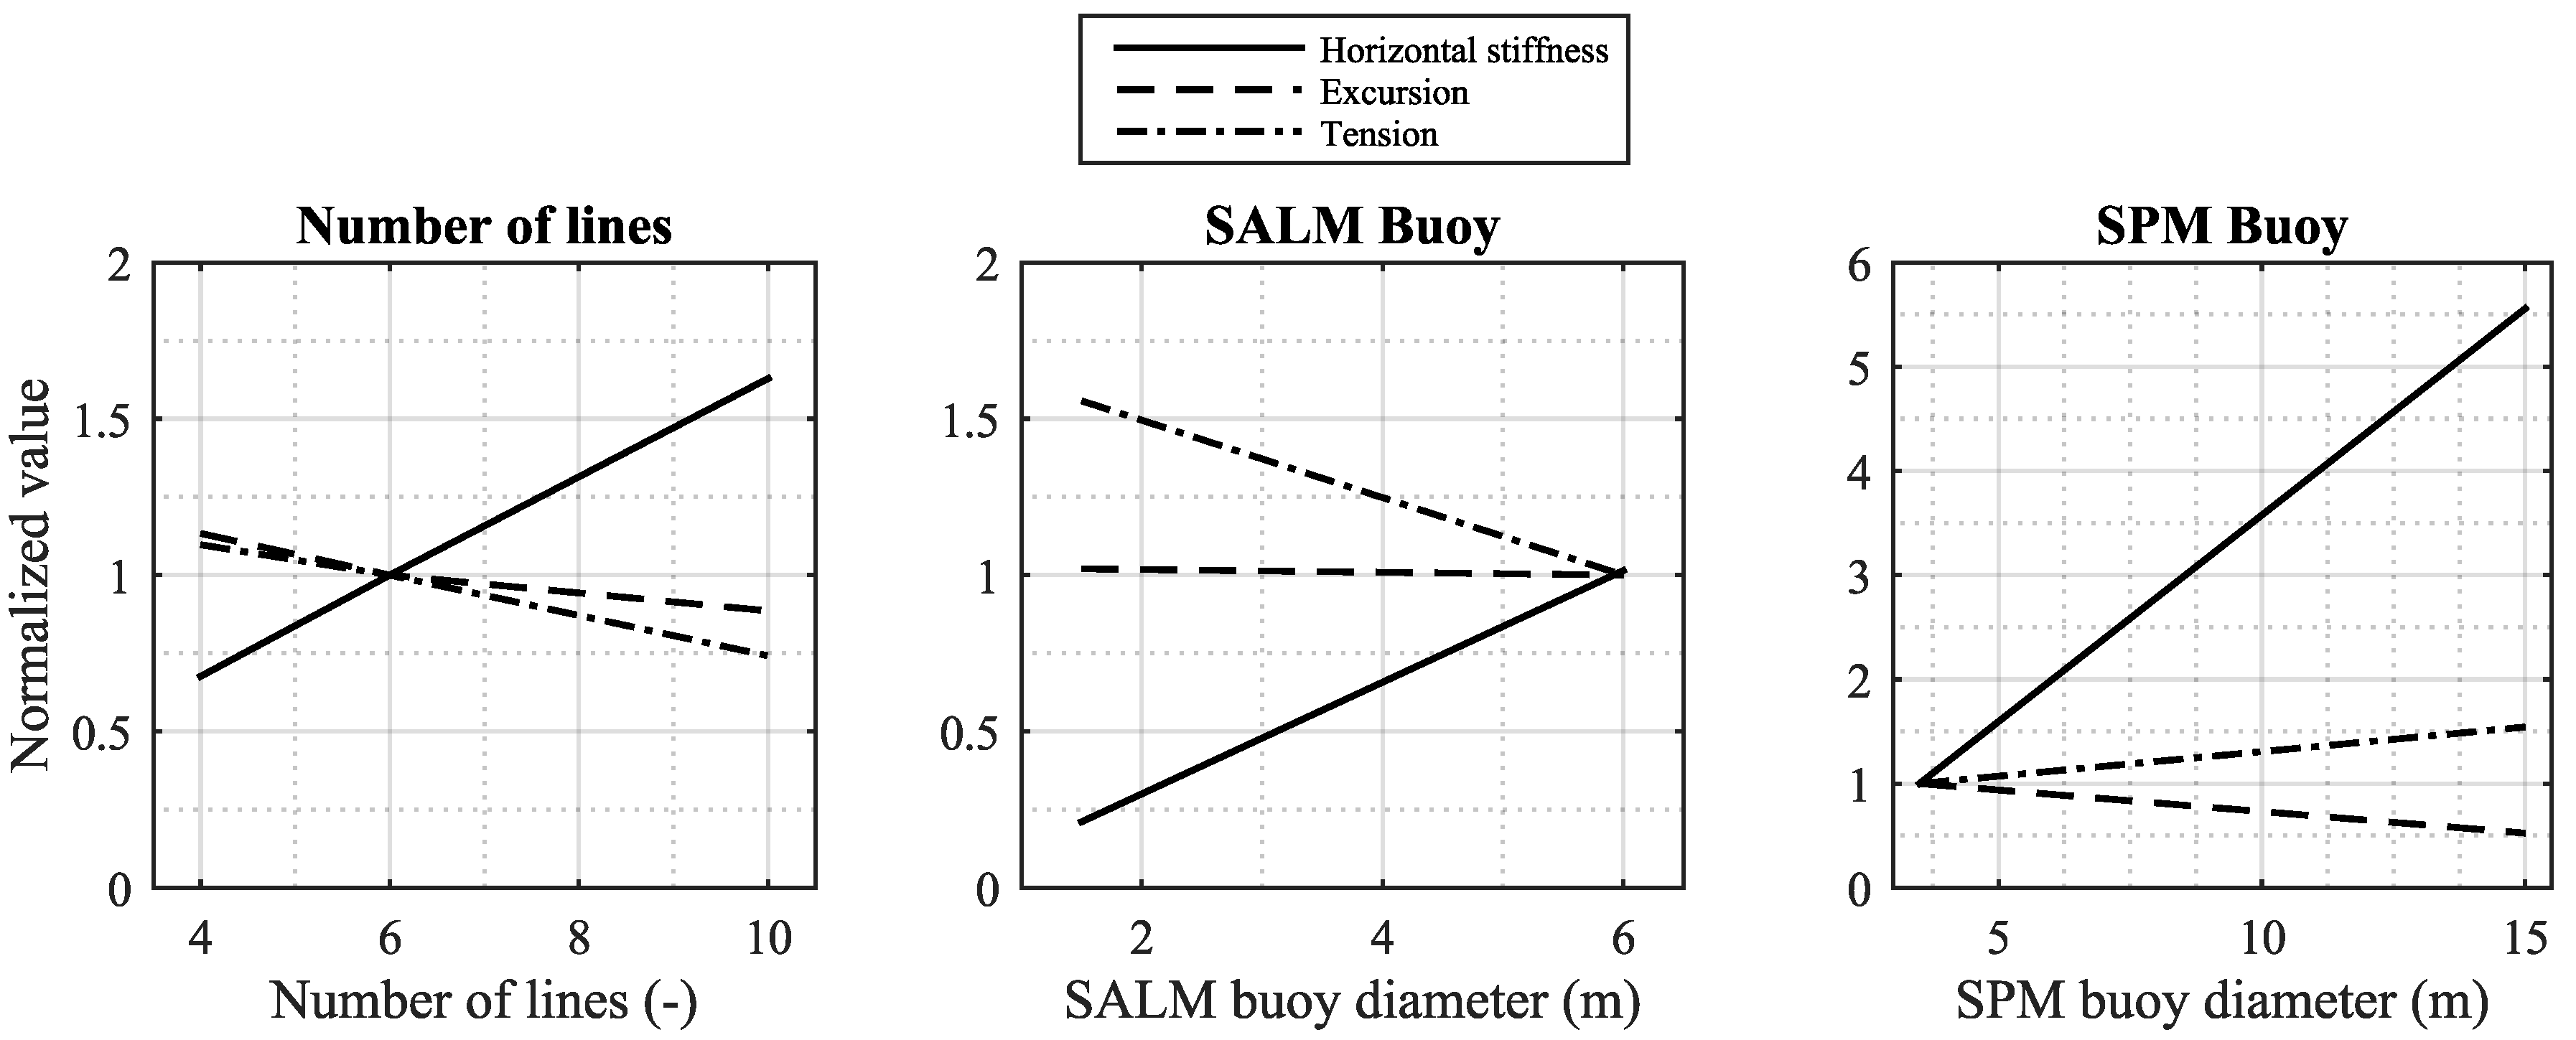
For all cases, the line diameter provided the largest impact on the cost of the mooring, as a relatively large line diameter was needed in the layouts in order to ensure sufficient strength to avoid line failure and to provide enough stiffness to avoid undesirably large motions. In the SALM system, some cost was saved by adjusting primarily the size of the top buoy as it highly influences the stiffness; cf. Figure 13. When having a small buoy, the stiffness is low for small motions, but the risk increases of fully stretching the system where the stiffness curve becomes steep and large tensions can occur (also seen in Figure 13). Similarly, the footprint radius was important to restrain in order to avoid large motions. In addition to the line diameter, the SPM system was influenced by most parameters. In this case, very high loads were obtained due to the problems of using linear theory on the device, but it was shown how the number of lines and footprint radius could affect the stiffness and thereby loads and cost; cf. Figure 13. The surface buoy provided a great impact on the cost as it is a paramount influencer on the stiffness. Having a large buoy provides a much stiffer system and thereby introduces large line loads, also because much more pretension is in the lines due to higher buoyancy. The study showed that decreasing the size as much as possible provided the least expensive solution. Similar to the SALM system, the use of a small buoy in this solution increases the risk of fully stretching the system, with risk of high loads. In this case, however, it was still found more feasible to use a small buoy; cf. Figure 13. For this particular case, there might be more cost savings, possibly by first improving the model to account for the energy dissipation by overtopping. Afterwards, it is highly relevant to consider a synthetic hawser, as well. This will introduce additional compliance to the system, but needs to be balanced with the stiffness from the buoy. Having a large buoy implies that much tension will be put on the hawser, and in this case, a small buoy is expected.
When considering Figure 9, Figure 10, Figure 11 and Figure 12, it is clear that some of the optimum solutions are found in minimums on the response surface where the gradient is large. Even minor changes to the system layout in these areas can result in significant changes of the cost, meaning that the solution is very sensitive to input parameters and their uncertainties. In some applications, it would be reasonable to search for areas where also the gradient is low in order to find solutions where the cost estimate is more reliable. In addition, the study also showed that some parameters had a minor effect on the mooring cost. From a safety point of view, it would be beneficial, e.g., to use more lines if the effect on cost is only minor in order to apply more redundancy and safety. These considerations are not included in the optimization routine, but a very strong benefit of the surrogate-based model is that information of the entire response surface is achieved and allows for additional and manual evaluation of the surface and potential use of other solutions than the global minimum.
The paper showed that it was possible to use a surrogate-based optimization routine to determine an optimum mooring solution with only a limited number of evaluations. The total computational time for each case was in the range of 25–30 h, which is reasonably low for a design process. For each case, a solution fulfilling all specified design criteria and ensuring survivability was found, and the parameters affecting the mooring cost for each layout were identified. In future studies, it would be natural to improve the hydrodynamic models further and investigate their further potential cost reduction. This study only considered a surrogate-based optimization procedure with a limited number of models, while many others exist, both surrogate models and other types of optimization routines. The advantage of the present method is considerable where only a limited number of function evaluations is needed and can be used for this type of problem.
Acknowledgments
The work in this study has been funded by the Energy Technology Development and Demonstration Program (EUDP) through the project “Mooring Solutions for Large Wave Energy Converters” (Grant Number 64014-0139). The authors wish to acknowledge all project partners, particularly Floating Power Plant, KNSwing, LEANCON Wave Energy and Wave Dragon, for input to the project, data on the WECs and review of this paper.
Author Contributions
Jonas Bjerg Thomsen, Francesco Ferri and Jens Peter Kofoed defined the overall outline of the study. Jonas Bjerg Thomsen produced the numerical models and implemented the optimization routine. Kevin Black collected cost data and produced the cost database, with input from Jonas Bjerg Thomsen, Francesco Ferri and Jens Peter Kofoed. Jonas Bjerg Thomsen ran the routine, analysed the data and made the outline and first draft of the paper. Francesco Ferri, Jens Peter Kofoed and Kevin Black provided the review and input to the finalization of the paper.
Conflicts of Interest
The authors declare no conflicts of interest.
References
- World Energy Council. Bloomberg new energy finance. In World Energy Perspective—Cost of Energy Technologies; World Energy Council: London, UK, 2013. [Google Scholar]
- Ocean Energy Systems (OES); International Energy Agency (IEA). International Levelized Cost of Energy for Ocean Energy Technologies; OES: Portland, OR, USA, 2017. [Google Scholar]
- International Renewable Energy Agency (IRENA). REthinking Energy 2017: Accelerating the Global Energy Transformation; International Renewale Energy Agency: Abu Dhabi, UAE, 2017. [Google Scholar]
- Carbon Trust. Accelerating Marine Energy: The Potential for Cost Reduction—Insights from the Carbon Trust Marine Energy Accelerator; Carbon Trust: London, UK, 2011. [Google Scholar]
- Low Carbon Innovation Coordination Group. Technology Innovation Needs Assessment (TINA), Marine Energy Summary Report. Available online: https://www.carbontrust.com/media/168547/tina-marine-energy-summary-report.pdf (accessed on 5 November 2017).
- Fitzgerald, J. Position Mooring of Wave Energy Converters. Ph.D. Thesis, Chalmers Univerisity of Technology, Goteborg, Sweden, 2009. [Google Scholar]
- Martinelli, L.; Ruol, P.; Cortellazzo, G. On mooring design of wave energy converters: The Seabreath application. Coast. Eng. Proc. 2012, 1. [Google Scholar] [CrossRef]
- Neary, V.S.; Lawson, M.; Previsic, M.; Copping, A.; Hallett, K.C.; LaBonte, A.; Rieks, J.; Murray, D. Methodology for Design and Economic Analysis of Marine Energy Conversion (MEC) Technologies; Sandia National Laboratories: Albuquerque, NM, USA, 2014. [Google Scholar]
- Christensen, L.; Friis-Madsen, E.; Kofoed, J. The Wave Energy Challenge: The Wave Dragon case. In Proceedings of the POWER-GEN 2005 Europe Conference, Milan, Italy, 28–30 June 2005. [Google Scholar]
- Holmberg, P.; Andersson, M.; Bolund, B.; Strandanger, K. Wave power - Surveillance study of the development. Elforsk Rapp. 2011, 11, 47. [Google Scholar]
- Thomsen, J.B.; Ferri, F.; Kofoed, J.P. Assessment of Current State of Mooring Design in the Danish Wave Energy Sector. In Proceedings of the 11th European Wave and Tidal Energy Conference, Nantes, France, 6–11 September 2015. [Google Scholar]
- Thomsen, J.; Kofoed, J.; Delaney, M.; Banfield, S. Initial Assessment of Mooring Solutions for Floating Wave Energy Converters. In Proceedings of the Twenty-Sixth (2016) International Ocean and Polar Engineering Conference, Rhodes, Greece, 26 June–2 July 2016; Chung, J., Muskulus, M., Kokkinis, T., Wang, A., Eds.; International Society of Offshore & Polar Engineers: Cupertino, CA, USA, 2016; Volume 1, pp. 590–596. [Google Scholar]
- Thomsen, J.; Ferri, F.; Kofoed, J. Experimental testing of moorings for large floating wave energy converters. In Progress in Renewable Energies Offshore; Soares, C., Ed.; CRC Press LLC: Boca Raton, FL, USA, 2016; pp. 703–710. [Google Scholar]
- Thomsen, J.B.; Ferri, F.; Kofoed, J.P. Screening of available tools for dynamic mooring analysis of wave energy converters. Energies 2017, 10, 853. [Google Scholar] [CrossRef]
- Thomsen, J.; Ferri, F.; Kofoed, J. Validation of a tool for the initial dynamic design of Mooring systems for large floating wave energy converters. J. Mar. Sci. Eng. 2017, 5, 45. [Google Scholar] [CrossRef]
- Floating Power Plant. Available online: http://www.floatingpowerplant.com/ (accessed on 5 November 2017).
- Bingham, H.B.; Ducasse, D.; Nielsen, K.; Read, R. Hydrodynamic analysis of oscillating water column wave energy devices. J. Ocean Eng. Mar. Energy 2015, 1, 405–419. [Google Scholar] [CrossRef] [Green Version]
- Nielsen, K.; Bingham, H. MARINET experiment KNSWING testing an I-Beam OWC attenuator. Int. J. Mar. Energy 2015, 12, 21–34. [Google Scholar] [CrossRef] [Green Version]
- LEANCON Wave Energy. Available online: http://www.leancon.com/ (accessed on 5 November 2017).
- Wave Dragon. Available online: http://www.wavedragon.net/ (accessed on 5 November 2017).
- Ridge, I.; Banfield, S.; Mackay, J. Nylon fibre rope moorings for wave energy converters. In Proceedings of the IEEE OCEANS, Seattle, WA, USA, 20–23 September 2010; pp. 1–10. [Google Scholar]
- Fitzgerald, J.; Bergdahl, L. Considering mooring cables for offshore wave energy converters. In Proceedings of the European Wave and Tidal Energy Conference, Porto, Portugal, 11–14 September 2007. [Google Scholar]
- DNV. DNV Offshore Standard DNV-OS-E301: Position Mooring; DNV: Oslo, Norway, 2010. [Google Scholar]
- American Petroleum Institute (API). API-RP-2SK: Design and Analysis of Stationkeeping Systems for Floating Structures; American Petroleum Institute: Washington, DC, USA, 2005. [Google Scholar]
- International Organization for Standardization (ISO). ISO 19901-7 2005: Stationkeeping Systems for Floating Offshore Structures and Mobile Offshore Units; ISO: Geneva, Switzerland, 2013. [Google Scholar]
- International Electrotechnical Commission (IEC). IEC 62600-10: Assessment of Mooring System for Marine Energy Converters (MECs); IEC: Geneva, Switzerland, 2014. [Google Scholar]
- Davidson, J.; Ringwood, J.V. Mathematical modelling of mooring systems for wave Energy converters—A review. Energies 2017, 10, 666. [Google Scholar] [CrossRef]
- Pecher, A.F.S.; Kofoed, J.P. Handbook of Ocean Wave; Springer: Basel, Switzerland, 2017; Volume 7. [Google Scholar]
- Ortiz, J.P.; Bailey, H.; Buckham, B.; Crawford, C. Surrogate based design of a mooring system for a self-reacting point absorber. In Proceedings of the The Twenty-fifth International Ocean and Polar Engineering Conference, Kona, HI, USA, 21–26 June 2015. [Google Scholar]
- Fitzgerald, J.; Bergdahl, L. Including moorings in the assessment of a generic offshore wave energy converter: A frequency domain approach. Mar. Struct. 2008, 21, 23–46. [Google Scholar] [CrossRef]
- Vicente, P.C.; Falcão, A.D.O.; Justino, P.A. Optimization of mooring configuration parameters of floating wave energy converts. In Proceedings of the 30th International Conference on Ocean, Offshore and Artctic Engineering-OMAE2011, Rotterdam, The Netherlands, 19–24 June 2011. [Google Scholar]
- Ferri, F. Computationally efficient optimisation algorithms for WECs arrays. In Proceedings of the 12th European Wave and Tidal Energy Conference, Cork, Ireland, 27 August–1 September 2017. [Google Scholar]
- DNV. DNV-RP-C205 Environmental Conditions and Environmental Loads; DNV: Oslo, Norway, 2014. [Google Scholar]
- Zanuttigh, B.; Martinelli, L.; Castagnetti, M. Screening of Suitable Mooring Systems; Aalborg University: Aalborg, Denmark, 2012; Volume 2. [Google Scholar]
- Paredes, G.M.; Bergdahl, L.; Palm, J.; Eskilsson, C.; Pinto, F.T. Station keeping design for floating wave energy devices compared to floating offshore oil and gas platforms. In Proceedings of the 10th European Wave and Tidal Energy Conference, Aalborg, Denmark, 2–5 September 2013; Volume 10. [Google Scholar]
- Johanning, L.; Smith, G.; Wolfram, J. Towards design standards for WEC moorings. In Proceedings of the 6th European Wave and Tidal Energy Conference, Glasgow, UK, 29 August–2 September 2005; Volume 29, pp. 223–229. [Google Scholar]
- Ambühl, S.; Kramer, M.; Sørensen, J. Different reliability assessment approaches for wave energy converters. In Proceedings of the 11th European Wave and Tidal Energy Conference, Nantes, France, 6–11 September 2015. [Google Scholar]
- Ambühl, S.; Kramer, M.; Sørensen, J. Reliability-based Calibration of Partial Safety Factors for Wave Energy Converters. In Proceedings of the 12th International Conference on Applications of Statistics and Probability in Civil Engineering, Vancouver, BC, Canada, 12–15 July 2015. [Google Scholar]
- Ambühl, S.; Kramer, M.; Kofoed, J.; Sørensen, J.; Ferreira, C. Reliability assessment of wave Energy devices. In Safety, Reliability, Risk and Life-Cycle Performance of Structures and Infrastructures; Deodatis, G., Ellingwood, B., Frangopol, D., Eds.; CRC Press LLC: Boca Raton, FL, USA, 2014; pp. 5195–5202. [Google Scholar]
- Ambühl, S.; Kofoed, J.; Sørensen, J. Stochastic modeling of long-term and extreme value estimation of wind and sea conditions for probabilistic reliability assessments of wave energy devices. Ocean Eng. 2014, 89, 243–255. [Google Scholar] [CrossRef]
- DNV. DNV Offshore Standard DNV-RP-E301: Design and Installation of Fluke Anchors; DNV: Oslo, Norway, 2012. [Google Scholar]
- Bridon. Wire and Fibre Rope Solutions. 2016. Available online: http://www.bridon.com/uk/ (accessed on 5 November 2017).
- Babarit, A.; Delhommeau, G. Theoretical and numerical aspects of the open source BEM solver NEMOH. In Proceedings of the 11th European Wave and Tidal Energy Conference (EWTEC2015), Nantes, France, 6–11 September 2015. [Google Scholar]
- Newman, J.T. The drift force and moment on ships in waves. J. Ship Res. 1967, 11, 51–60. [Google Scholar]
- Orcina Ltd. Orcaflex User Manual; Orcina Ltd.: Ulverston, UK, 2013. [Google Scholar]
- Rios, L.M.; Sahinidis, N.V. Derivative-free optimization: A review of algorithms and comparison of software implementations. J. Glob. Optim. 2013, 56, 1247–1293. [Google Scholar] [CrossRef]
- Conn, A.R.; Scheinberg, K.; Vicente, L.N. Introduction to Derivative-Free Optimization; SIAM: Philadelphia, PA, USA, 2009. [Google Scholar]
- Müller, J. Matsumoto: The Matlab Surrogate Model Toolbox for Computationally Expensive Black-Box Global Optimization Problems; Cornell University: New York, NY, USA, 2014. [Google Scholar]
- Cavazzuti, M. Optimization Methods: From Theory to Design Scientific and Technological Aspects in Mechanics; Springer Science & Business Media: Dordrecht, The Netherlands, 2012. [Google Scholar]
- Müller, J. MATSuMoTo Code Documentation. 2014. Available online: https://ccse.lbl.gov/people/julianem/ManualMATSuMoTomatlab.pdf (accessed on 5 November 2017).
- Müller, J.; Shoemaker, C.A. Influence of ensemble surrogate models and sampling strategy on the solution quality of algorithms for computationally expensive black-box global optimization problems. J. Glob. Optim. 2014, 60, 123–144. [Google Scholar] [CrossRef]
- Müller, J.; Piché, R. Mixture surrogate models based on Dempster-Shafer theory for global optimization problems. J. Glob. Optim. 2011, 51, 79–104. [Google Scholar] [CrossRef]
- Müller, J.; Shoemaker, C.A.; Piché, R. SO-MI: A surrogate model algorithm for computationally expensive nonlinear mixed-integer black-box global optimization problems. Comput. Oper. Res. 2013, 40, 1383–1400. [Google Scholar] [CrossRef]
- Müller, J.; Shoemaker, C.A.; Piché, R. SO-I: A surrogate model algorithm for expensive nonlinear integer programming problems including global optimization applications. J. Glob. Optim. 2014, 59, 865–889. [Google Scholar] [CrossRef]
Figure 1.
Flow diagram of the previous and related work [11,12,13,14,15] in the Mooring Solutions for Large Wave Energy Converters (MSLWEC) project.

Figure 2.
The four WECs considered in the mooring optimization assessment. From left to right: Floating Power Plant, KNSwing , LEANCONWave Energy and Wave Dragon.
Figure 2.
The four WECs considered in the mooring optimization assessment. From left to right: Floating Power Plant, KNSwing , LEANCONWave Energy and Wave Dragon.

Figure 3.
General illustration of the mooring layouts considered in this study. (a) A single anchor leg mooring (SALM) system with the illustration of the displaced layout; (b) a taut turret system; (c) a synthetic and taut single point mooring (SPM) system. The figure defines the footprint radius (FPR) for each layout.

Figure 4.
The considered umbilical configuration and definition of the allowable excursion. HWL, high water level; SWL, still water level; LWL, low water level.
Figure 4.
The considered umbilical configuration and definition of the allowable excursion. HWL, high water level; SWL, still water level; LWL, low water level.

Figure 5.
Illustration of the WEC in Case 1 and the necessary limit on footprint radius (FPR) in order to avoid interaction between the line and structure.
Figure 5.
Illustration of the WEC in Case 1 and the necessary limit on footprint radius (FPR) in order to avoid interaction between the line and structure.
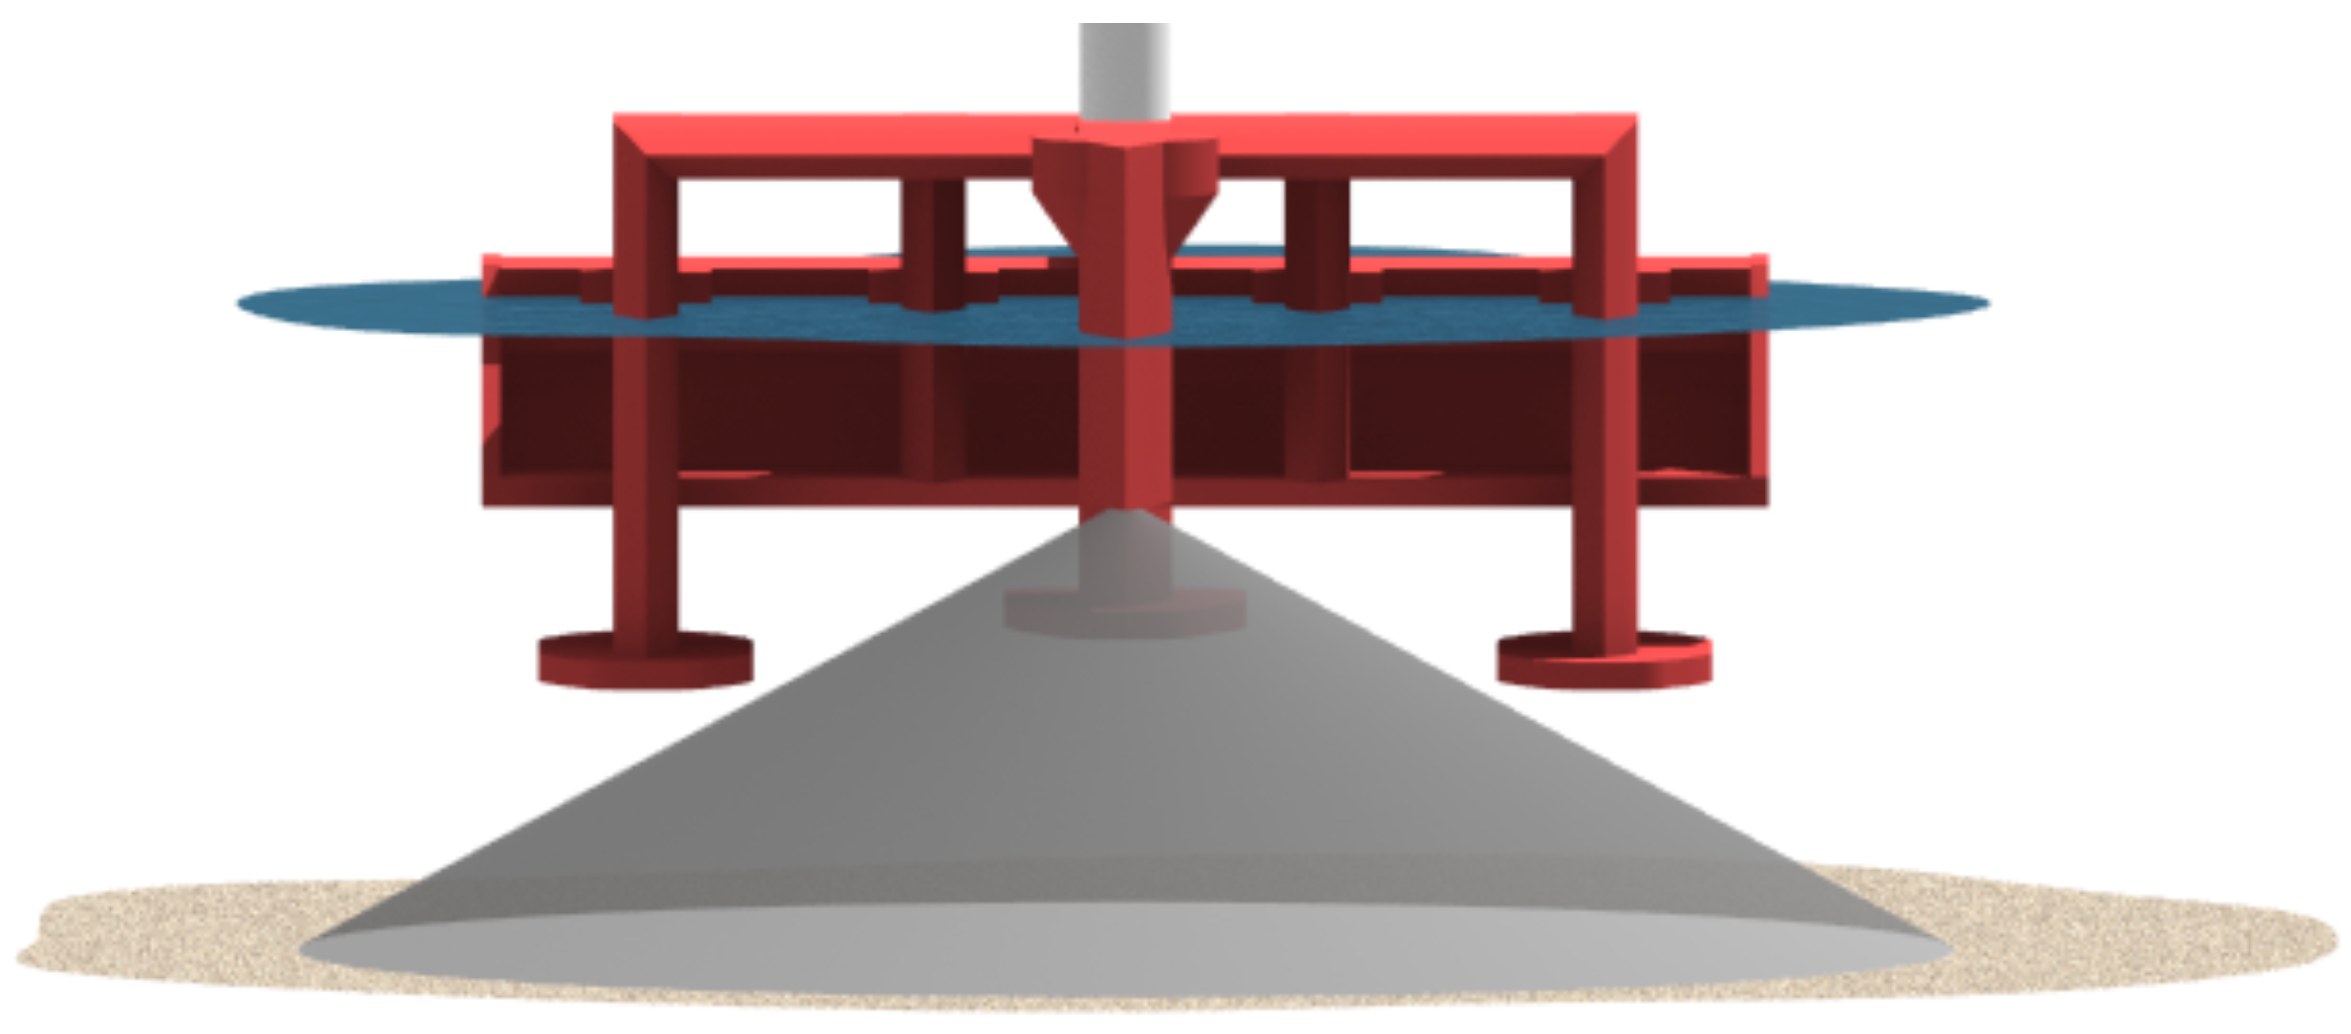
Figure 6.
Influence of mooring line number on intact horizontal stiffness, stiffness after failure of one line and the static position of the WEC after failure. The figure also illustrates two examples of the WEC position after a line failure. The red line indicates the broken line.
Figure 6.
Influence of mooring line number on intact horizontal stiffness, stiffness after failure of one line and the static position of the WEC after failure. The figure also illustrates two examples of the WEC position after a line failure. The red line indicates the broken line.

Figure 7.
Flowchart of the applied optimization procedure. BEM, boundary element method.
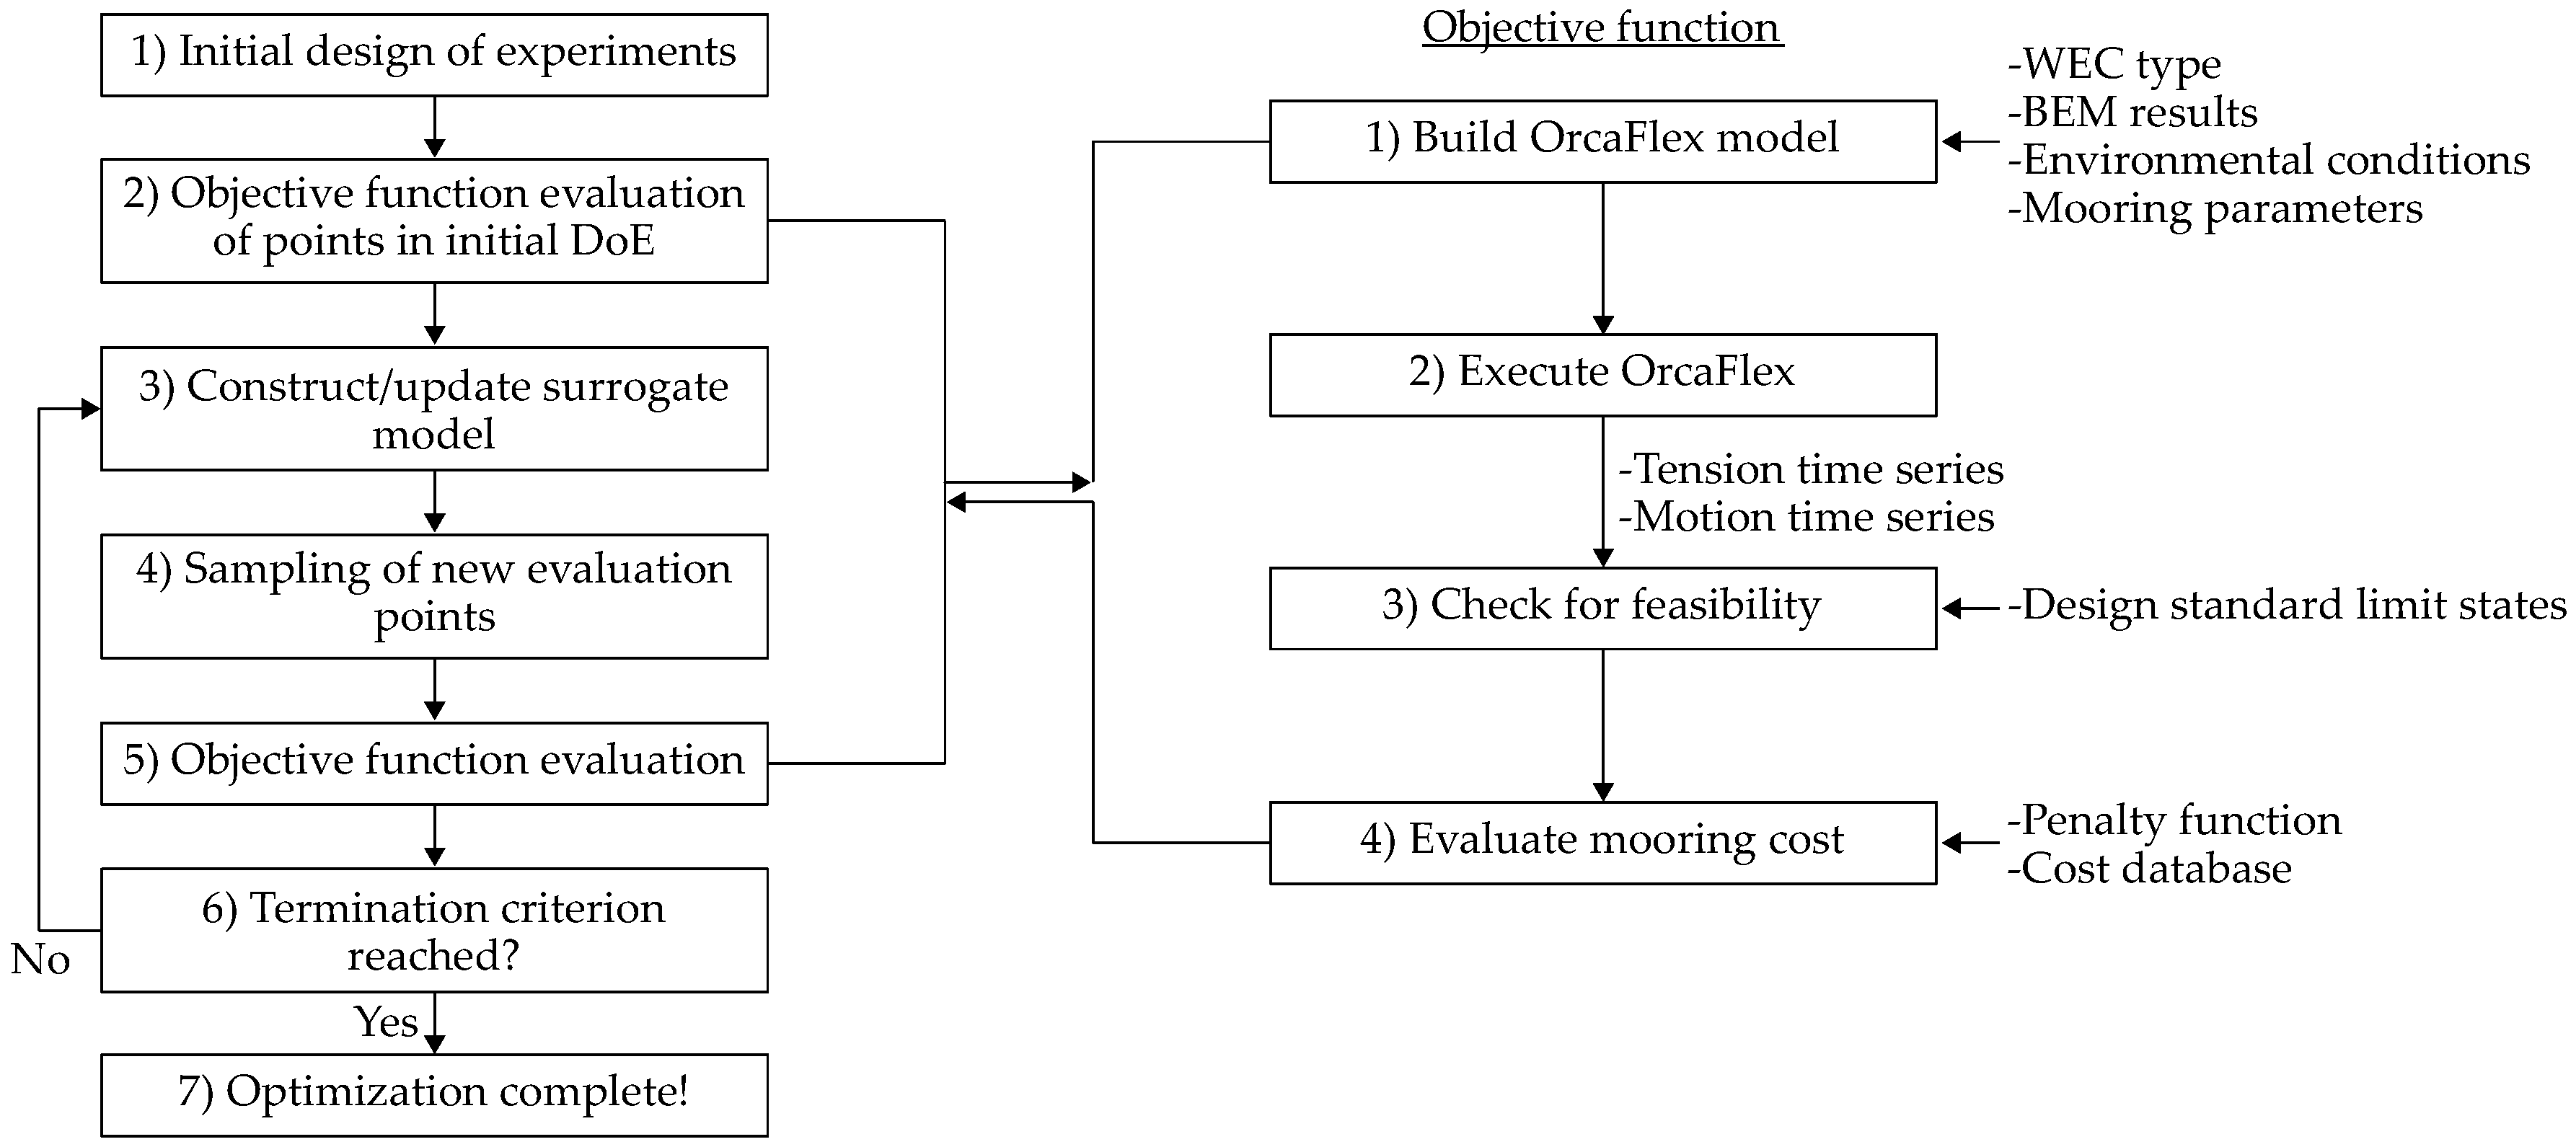
Figure 8.
Progress of the found objective function values for the four optimization cases. The function values have been normalized according to the optimum value .
Figure 8.
Progress of the found objective function values for the four optimization cases. The function values have been normalized according to the optimum value .
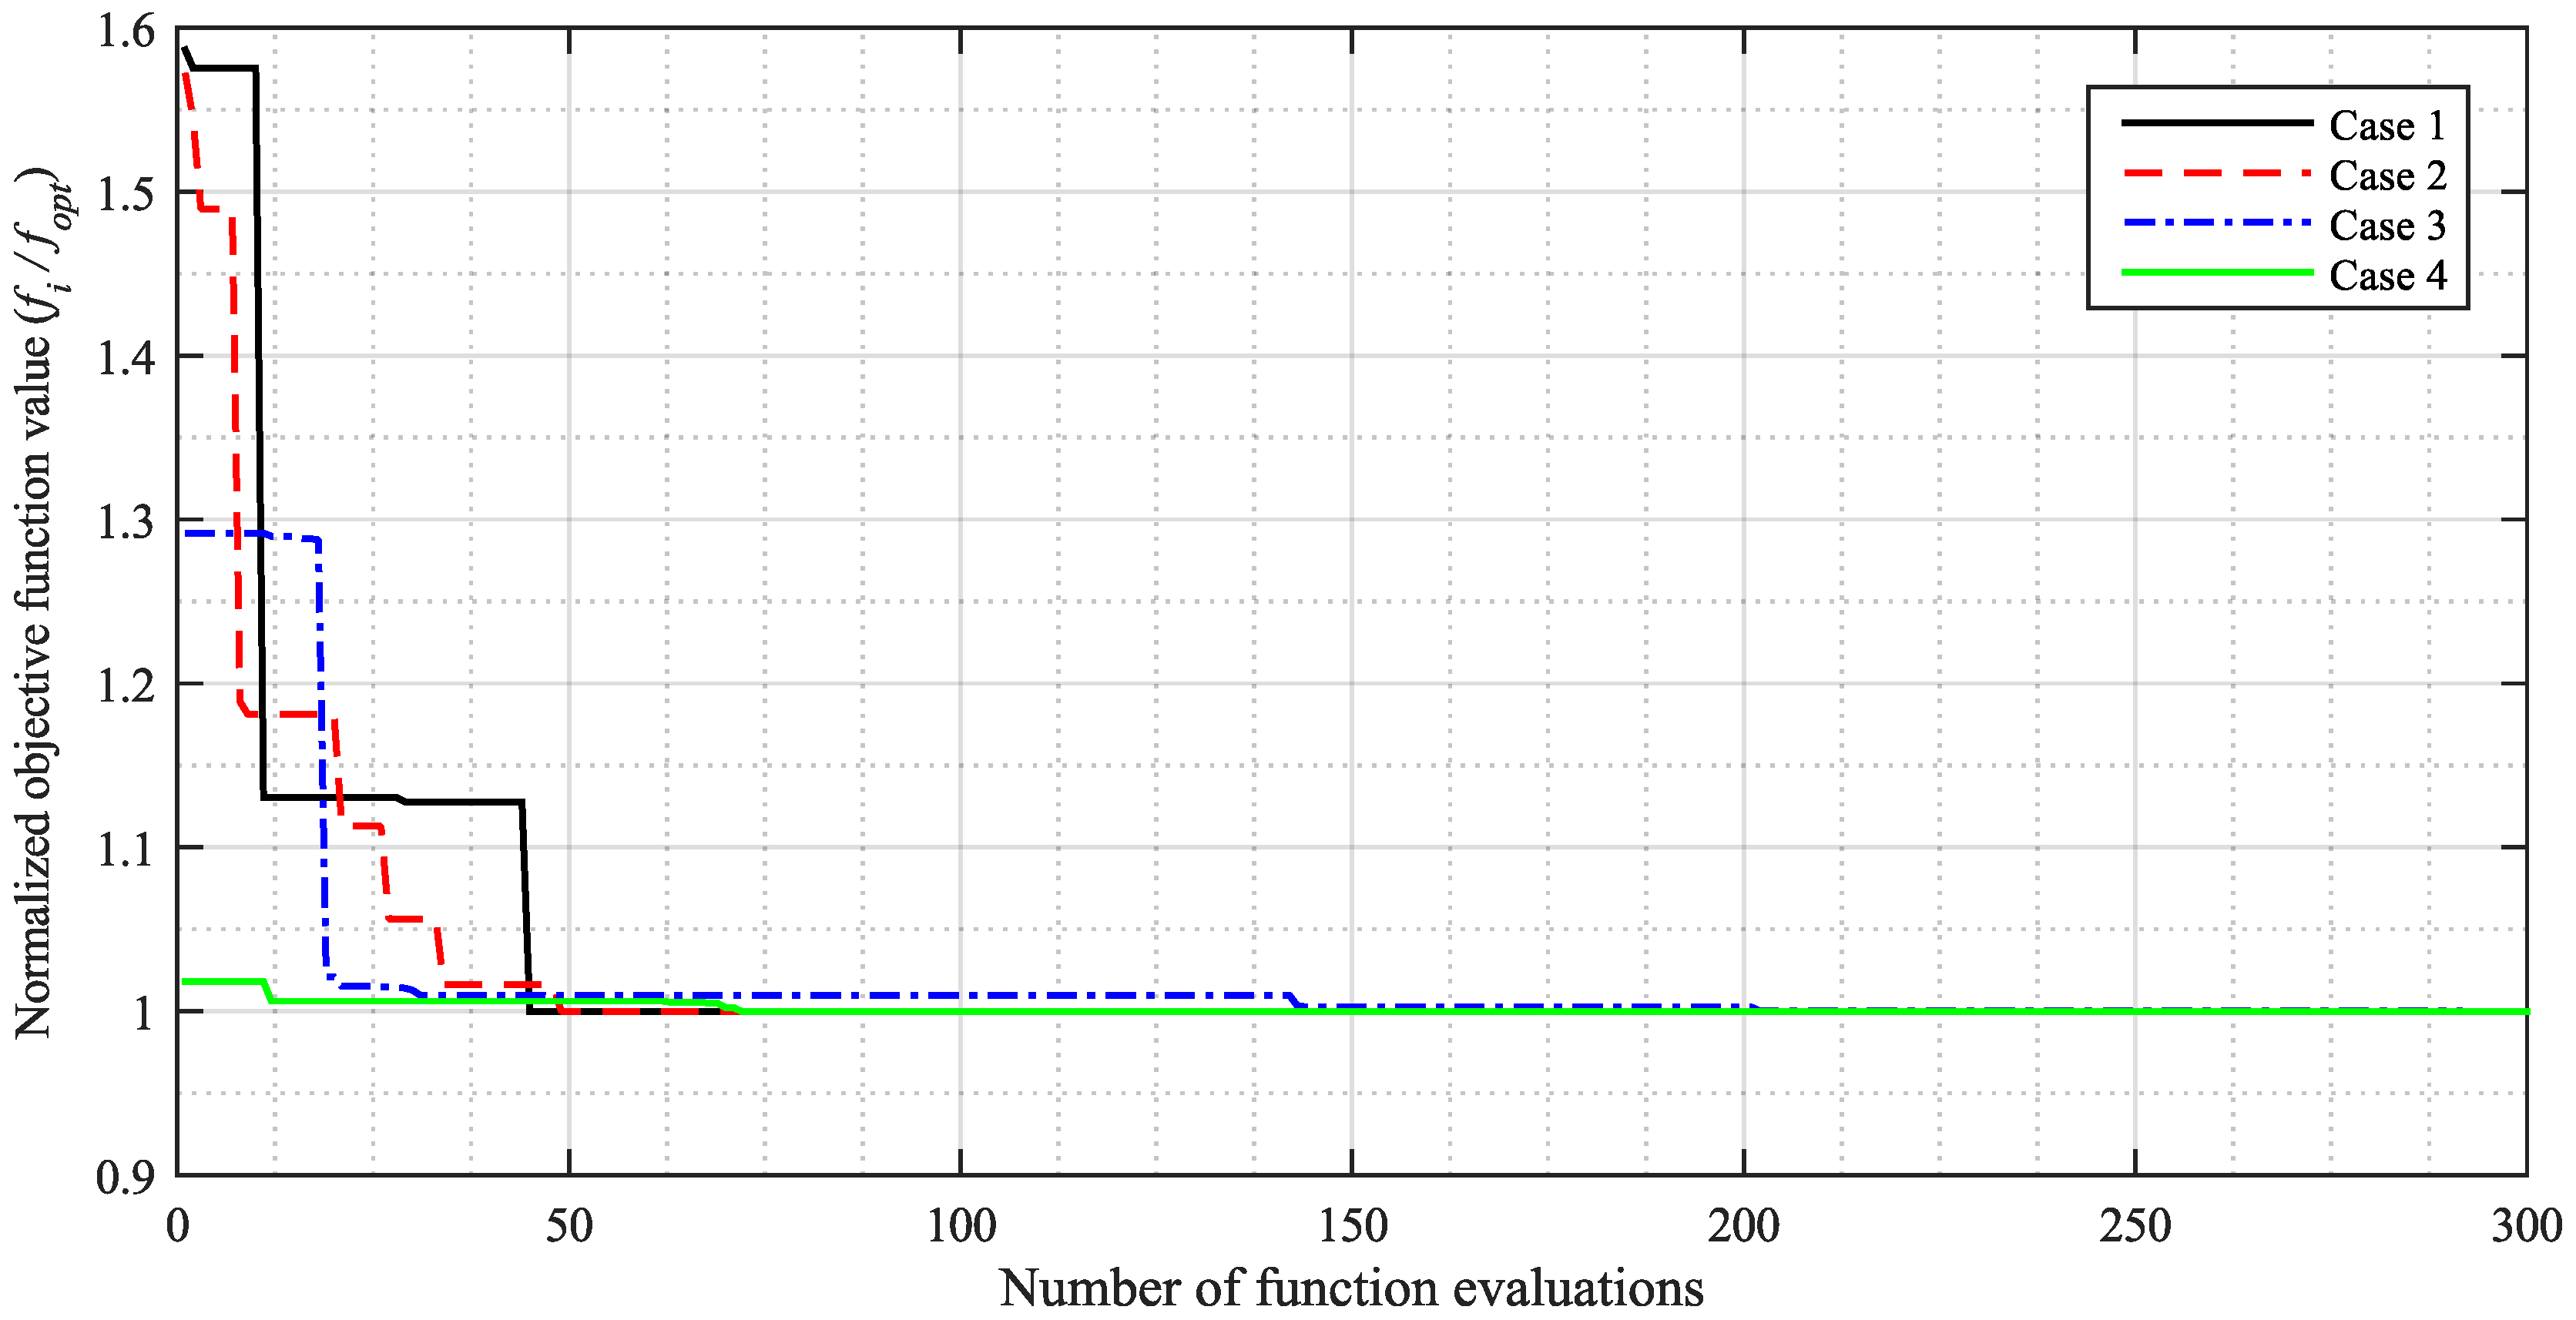
Figure 9.
(a) Sample point from the optimization of Case 1; (b) cost contour plot of the optimization of Case 1. The mooring cost has been normalized according to the total WEC cost.
Figure 9.
(a) Sample point from the optimization of Case 1; (b) cost contour plot of the optimization of Case 1. The mooring cost has been normalized according to the total WEC cost.

Figure 10.
(a) Sample point from the optimization of Case 2; (b) cost contour plot of the optimization of Case 2. The mooring cost has been normalized according to the total WEC cost.
Figure 10.
(a) Sample point from the optimization of Case 2; (b) cost contour plot of the optimization of Case 2. The mooring cost has been normalized according to the total WEC cost.
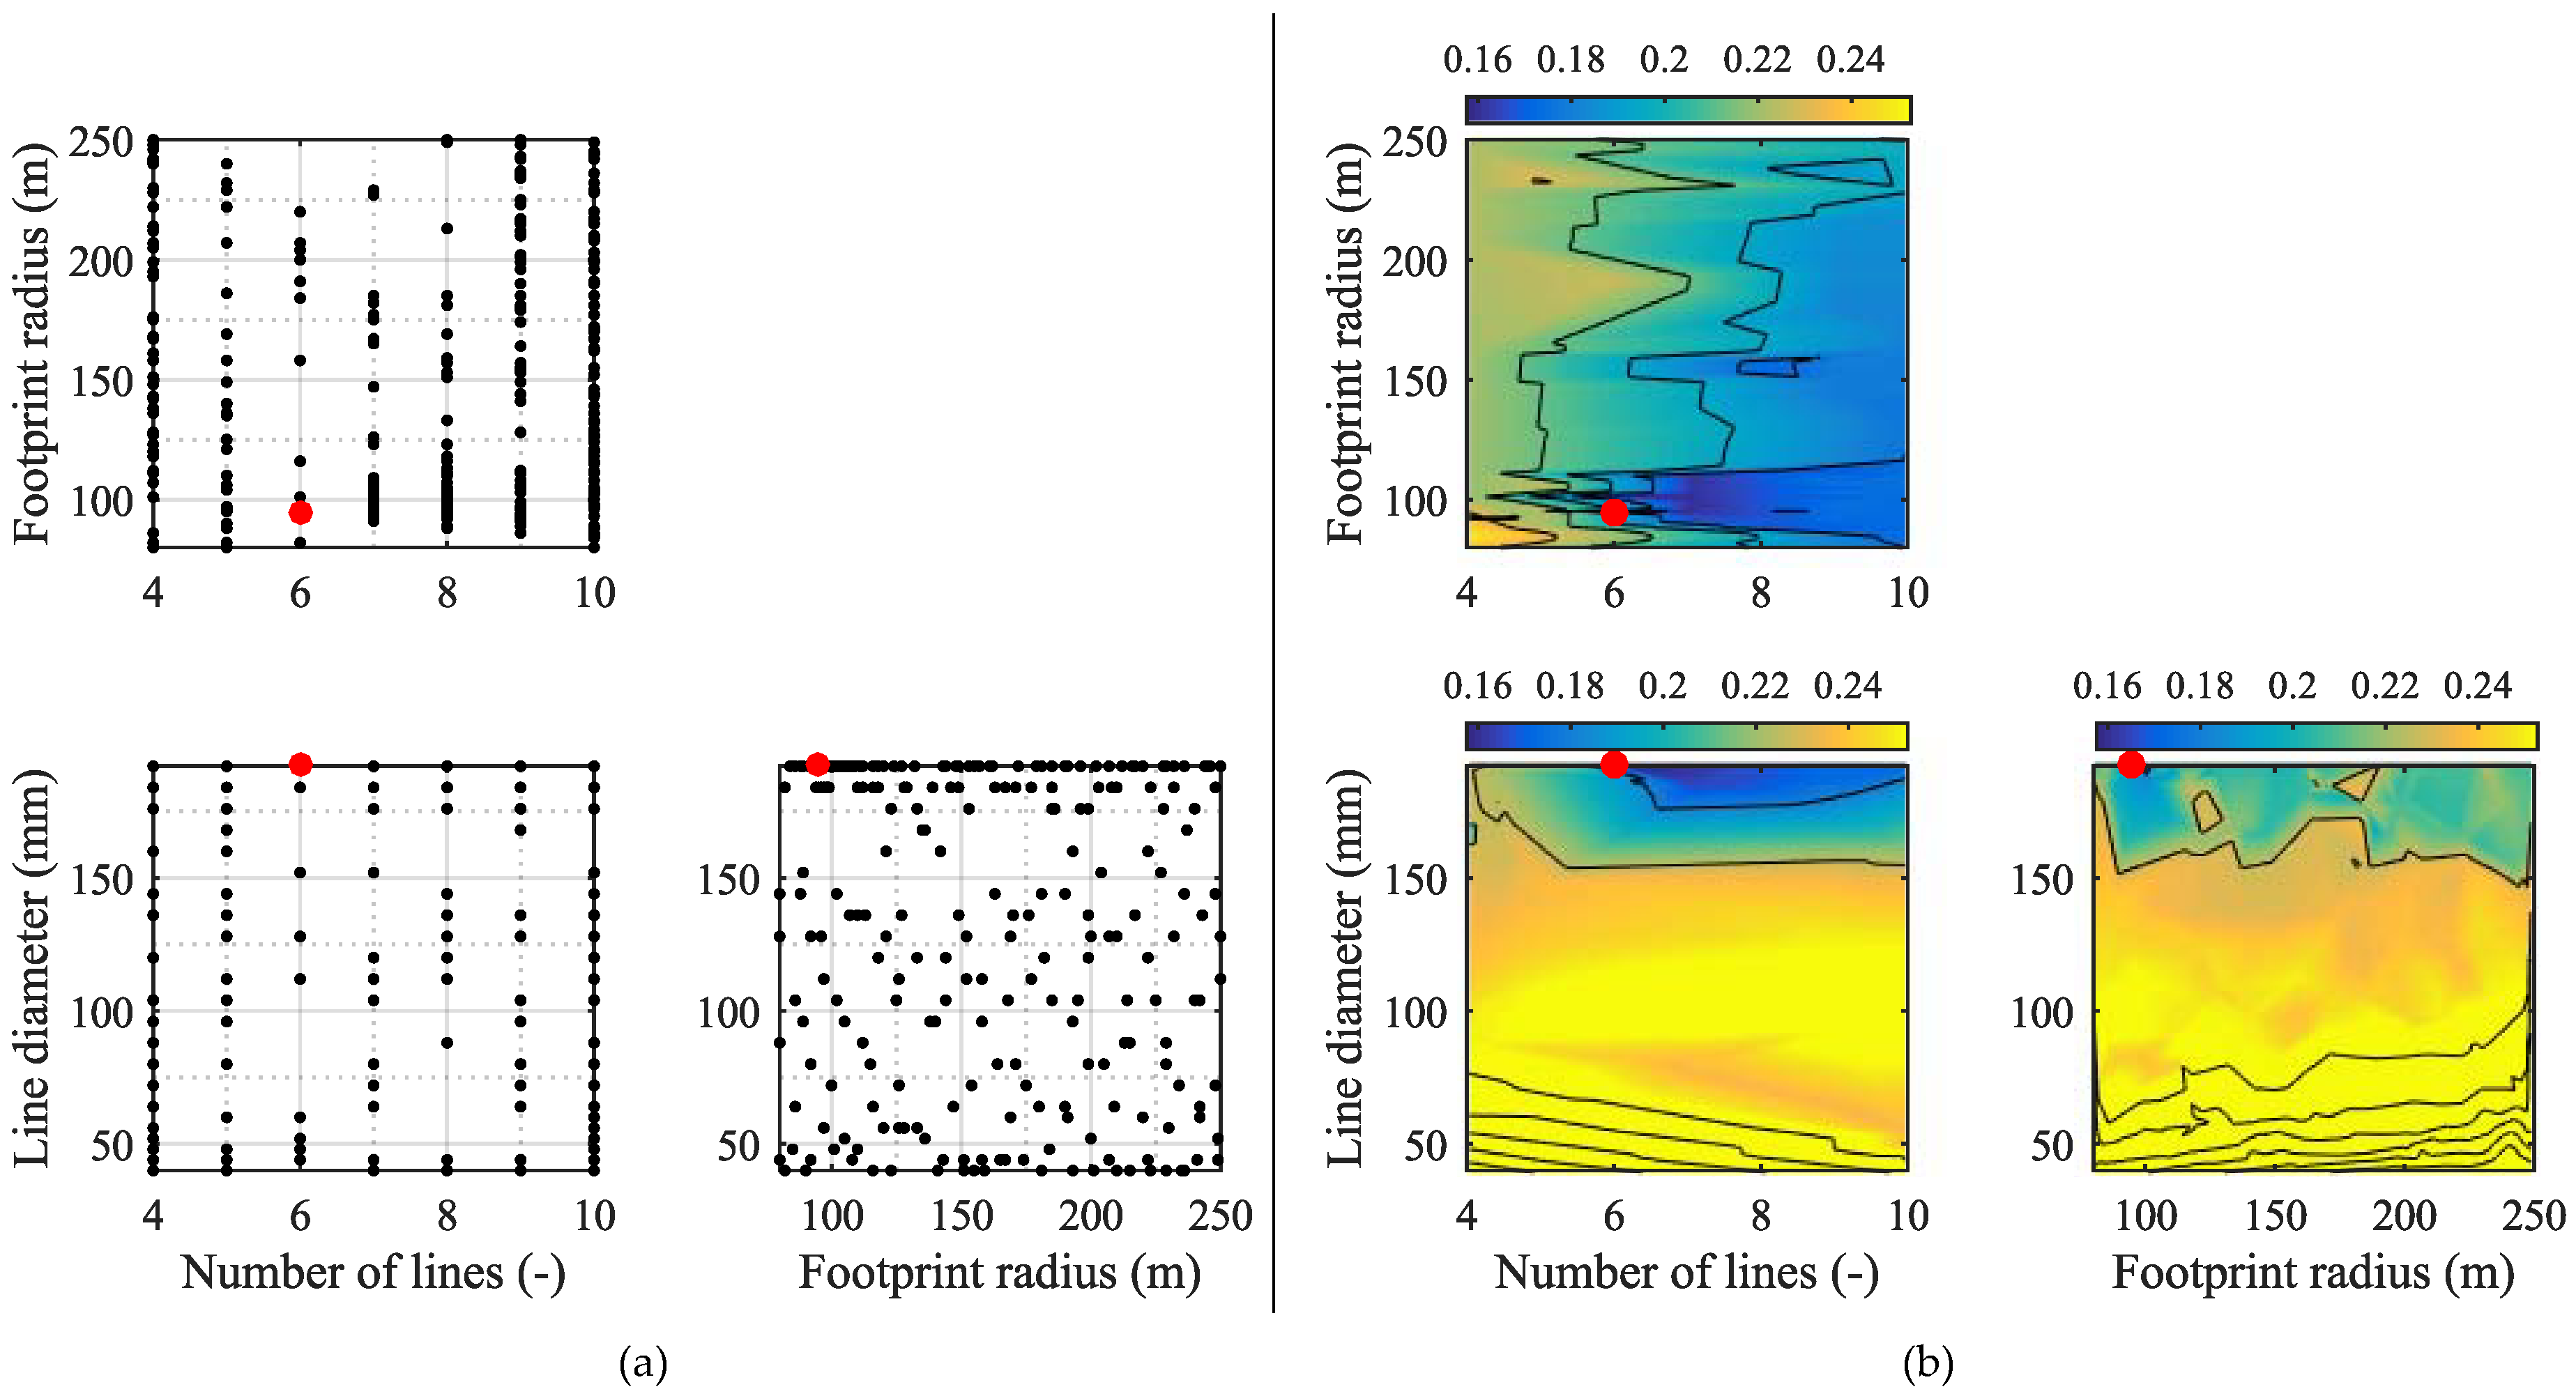
Figure 11.
(a) Sample point from the optimization of Case 3; (b) cost contour plot of the optimization of Case 3.
Figure 11.
(a) Sample point from the optimization of Case 3; (b) cost contour plot of the optimization of Case 3.
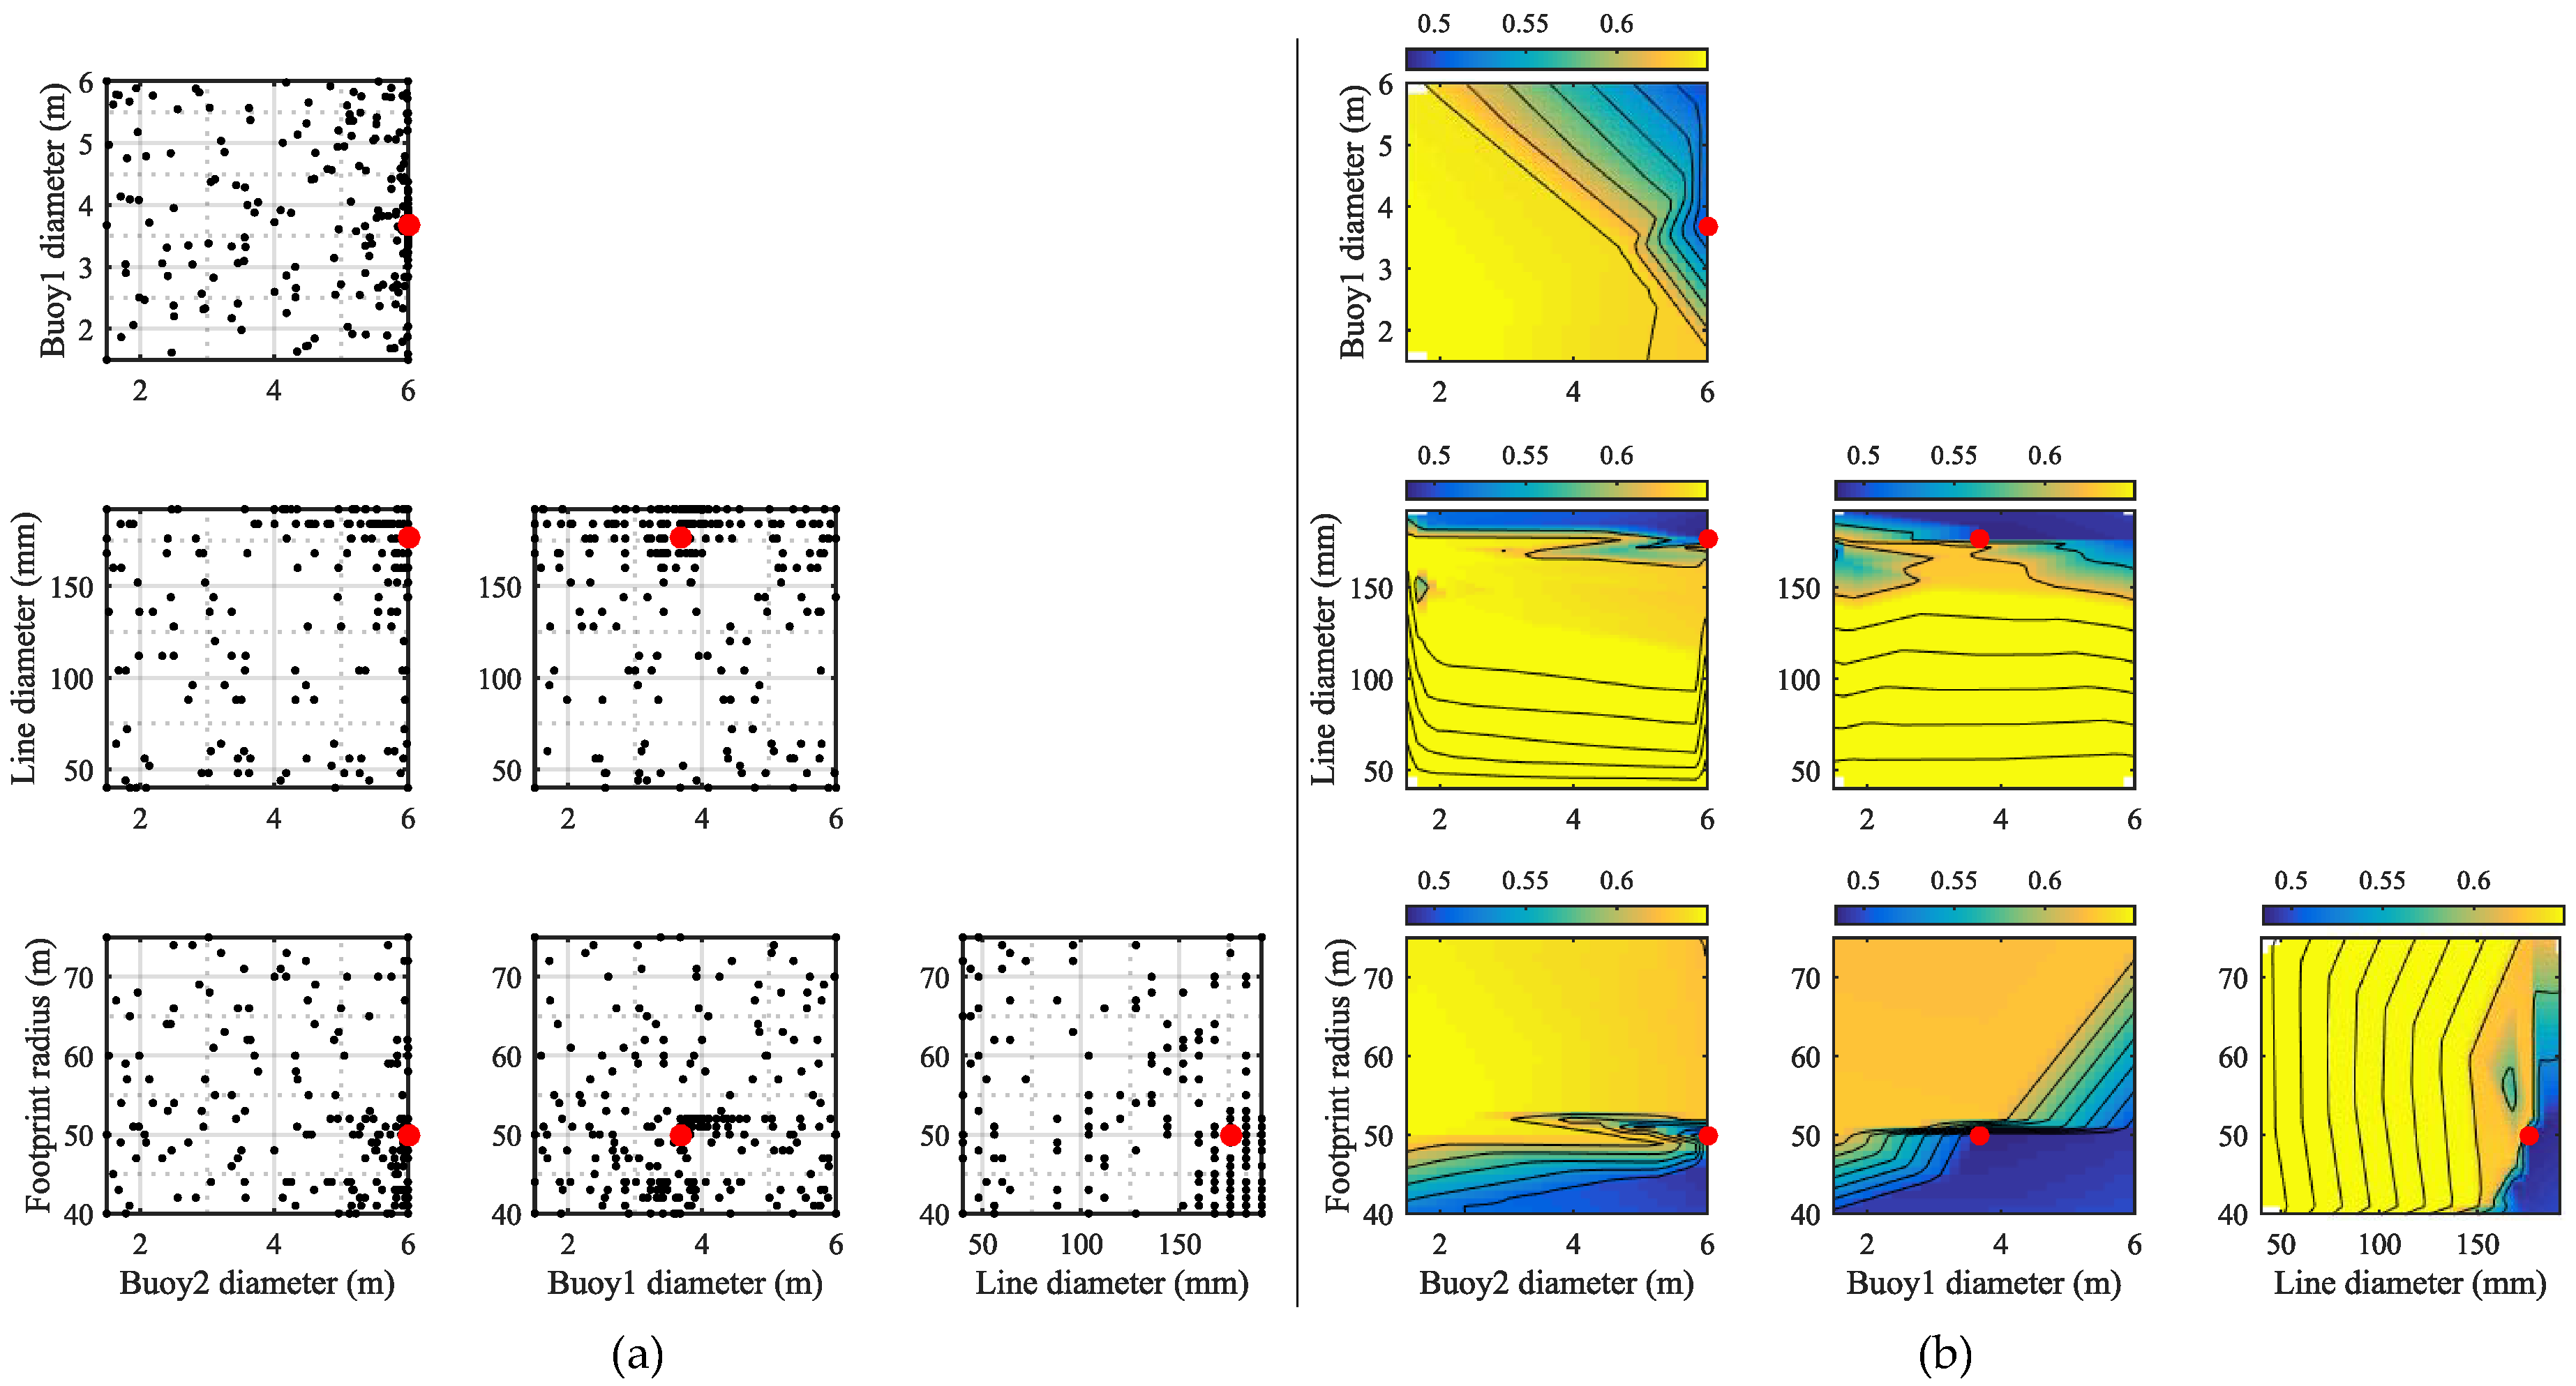
Figure 12.
(a) Sample point from the optimization of Case 4; (b) cost contour plot of the optimization of Case 4.
Figure 12.
(a) Sample point from the optimization of Case 4; (b) cost contour plot of the optimization of Case 4.
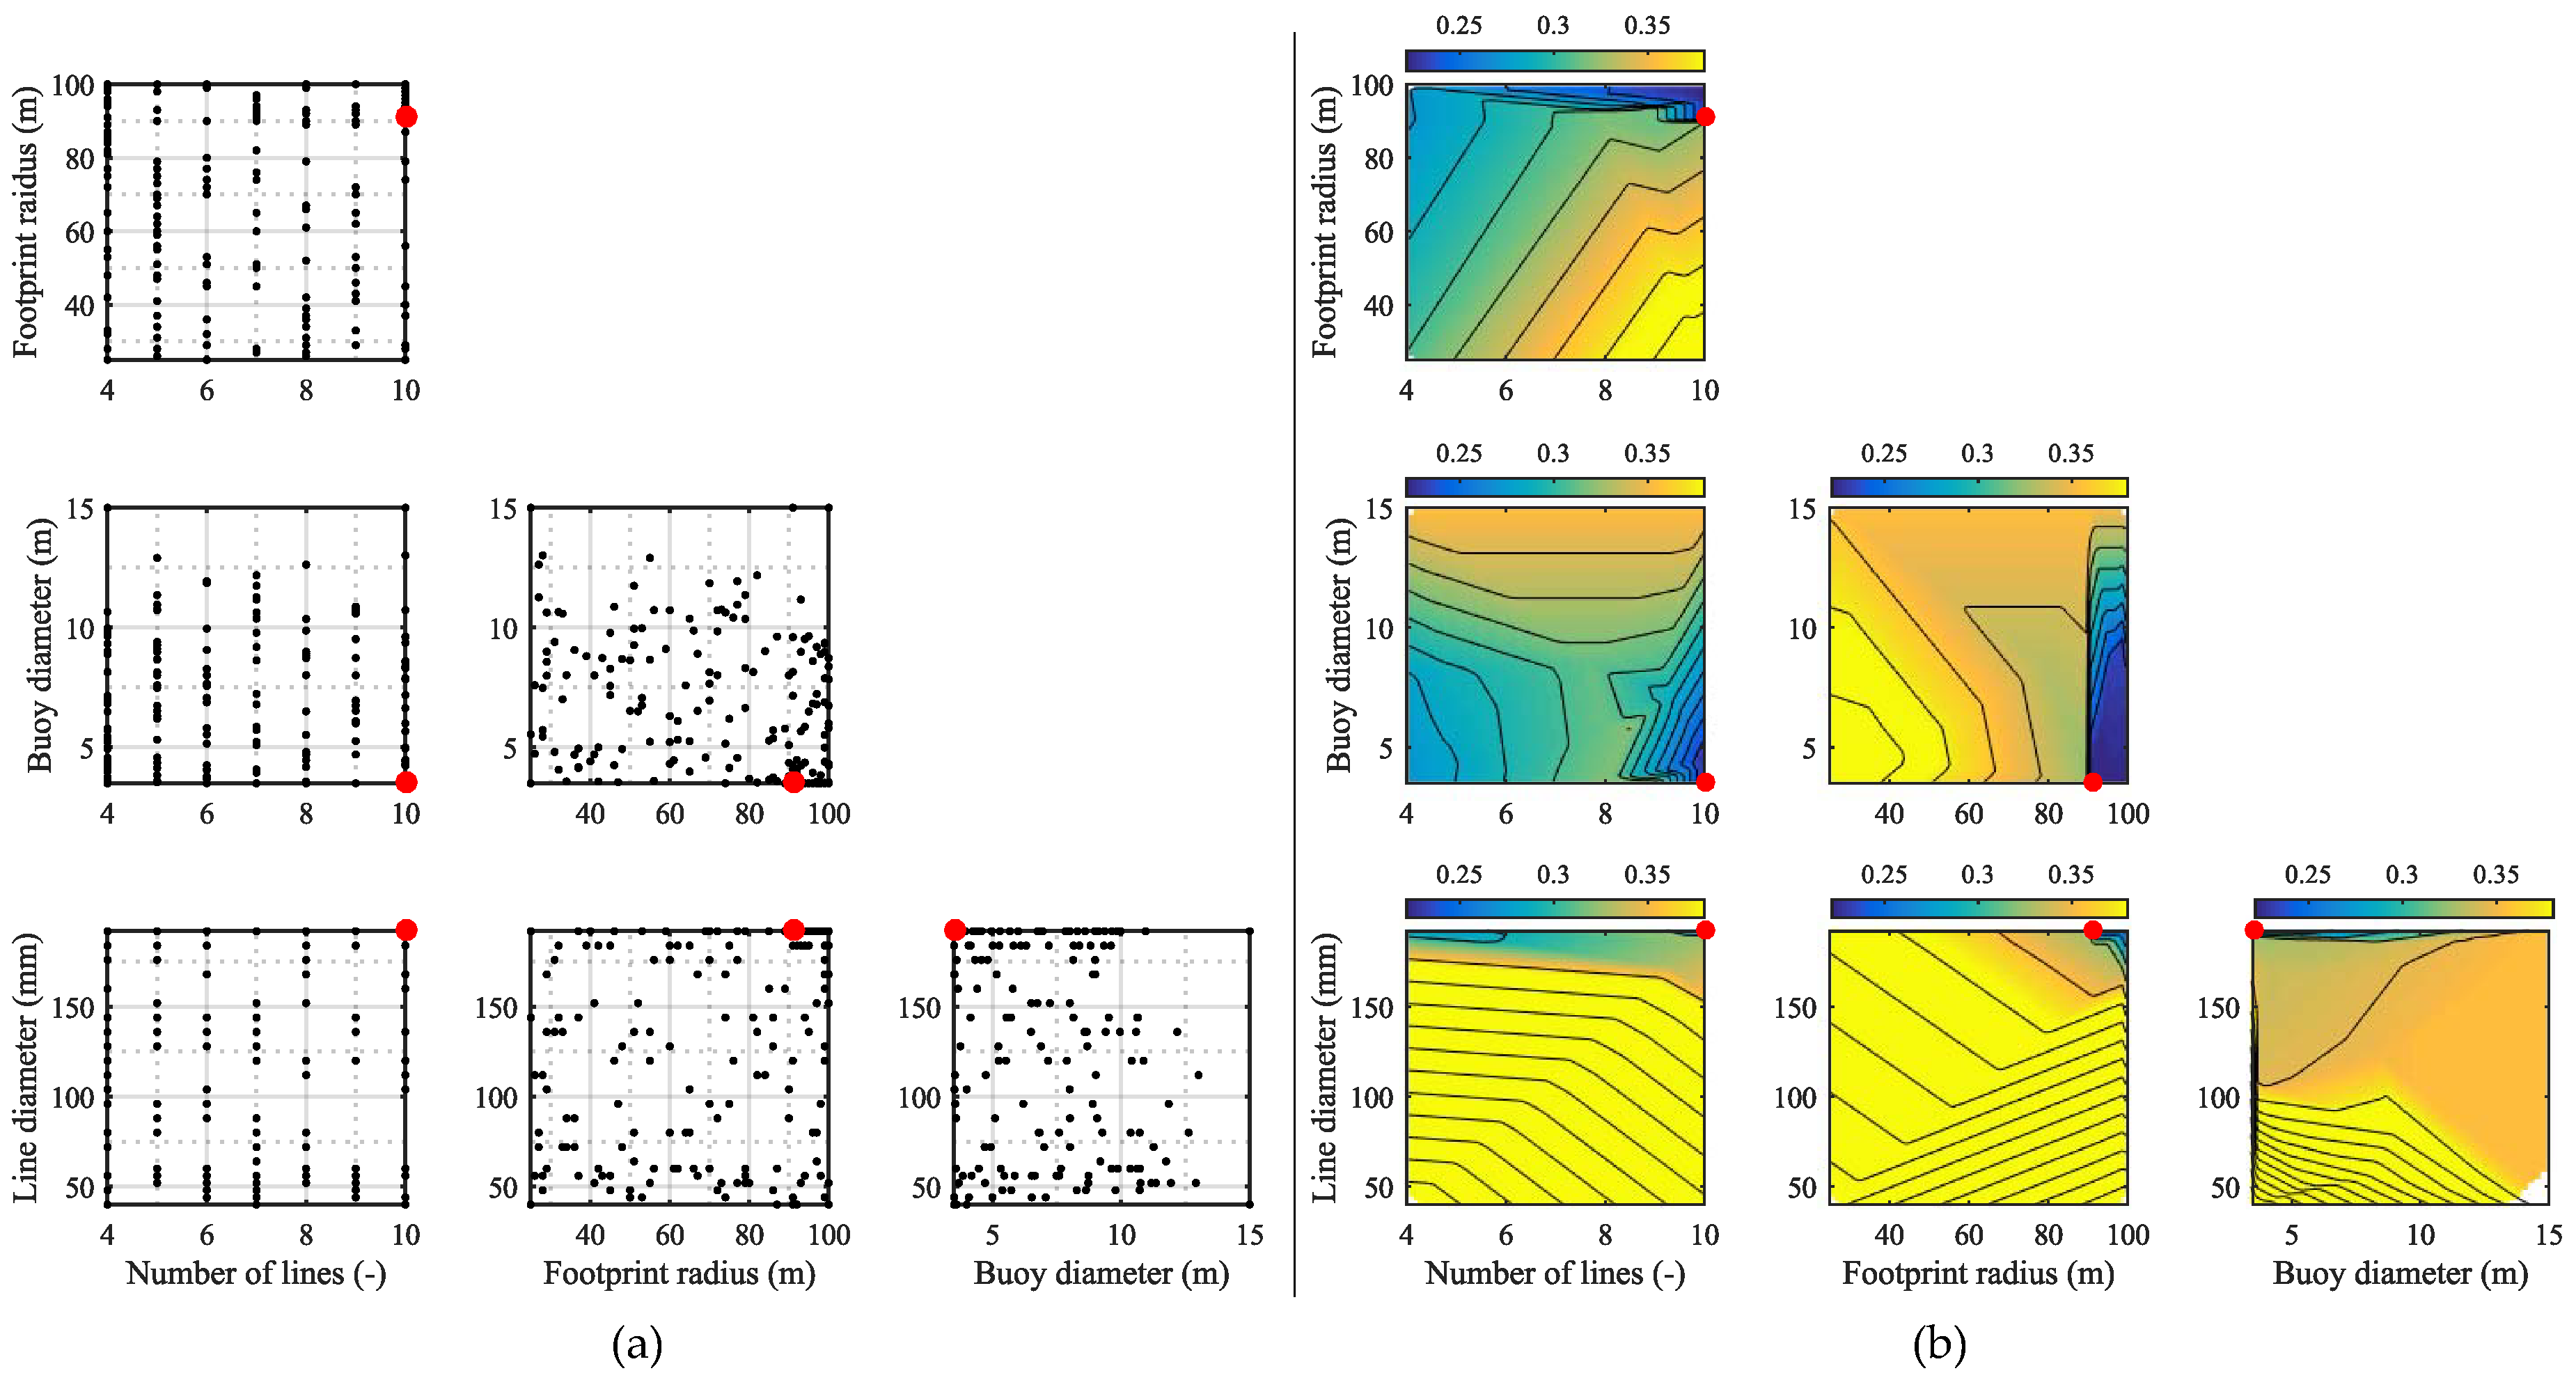
Figure 13.
The influence of number of lines and buoy sizes on the mooring stiffness, tension and excursion.
Figure 13.
The influence of number of lines and buoy sizes on the mooring stiffness, tension and excursion.

Table 1.
Definition of design cases for each of the WECs in Figure 2. The table list all considered environmental conditions together with the defined restraints on surge and pitch. ✘ denotes no limit.
Table 1.
Definition of design cases for each of the WECs in Figure 2. The table list all considered environmental conditions together with the defined restraints on surge and pitch. ✘ denotes no limit.
| WEC | Case 1 | Case 2 | Case 3 | Case 4 |
|---|---|---|---|---|
| Floating Power Plant | KNSwing | LEANCON | Wave Dragon | |
| Mooring solutions | Taut turret | Taut turret | SALM | Taut SPM |
| Figure 3b | Figure 3b | Figure 3a | Figure 3c | |
| Water depth, h | 30 m | 40 m | 25 m | 25 m |
| Significant wave height, | 6.6 m | 9.9 m | 8.3 m | 8.3 m |
| Peak wave period, | 9.3 s | 11.4 s | 10.5 s | 10.5 s |
| Relative depth, | 0.14 | 0.12 | 0.1 | 0.1 |
| Current velocity, | 1.3 m/s | 1.0 m/s | 1.5 m/s | 1.5 m/s |
| Wind velocity, | 33.0 m/s | 39.9 m/s | 34.0 m/s | 34.0 m/s |
| Surge design limit | ±29 m | ±44 m | ±30 m | ±27 m |
| Pitch design limit | ±15 | ✘ | ✘ | ✘ |
Table 2.
Definition of the considered optimization parameters for each case and the applied value ranges. ✘ denotes that the parameter is not considered.
Table 2.
Definition of the considered optimization parameters for each case and the applied value ranges. ✘ denotes that the parameter is not considered.
| Parameter | Case 1 | Case 2 | Case 3 | Case 4 | ||||
|---|---|---|---|---|---|---|---|---|
| Min. | Max. | Min. | Max. | Min. | Max. | Min. | Max. | |
| Mooring line diameter (mm) | 40 | 192 | 40 | 192 | ✘ | ✘ | 40 | 192 |
| No. of mooring lines (-) | 4 | 10 | 4 | 10 | ✘ | ✘ | 4 | 10 |
| Hawser line diameter (mm) | ✘ | ✘ | ✘ | ✘ | 40 | 192 | ✘ | ✘ |
| Footprint radius (m) | 30 | 40 | 80 | 250 | 40 | 75 | 25 | 100 |
| Buoy 1 diameter | ✘ | ✘ | ✘ | ✘ | 1.5 | 6.0 | 3.5 | 15.0 |
| Buoy 2 diameter | ✘ | ✘ | ✘ | ✘ | 1.5 | 6.0 | ✘ | ✘ |
| No. of optimization parameters | 3 | 3 | 4 | 4 | ||||
Table 3.
Definition of integer or continuous parameters.
| Parameter | Integer | Continuous |
|---|---|---|
| Mooring line diameter (mm) | ✔ | ✘ |
| No. of mooring lines (-) | ✔ | ✘ |
| Hawser line diameter (mm) | ✔ | ✘ |
| Footprint radius (FPR) (m) | ✔ | ✘ |
| Buoy 1 volume | ✘ | ✔ |
| Buoy 2 volume | ✘ | ✔ |
Table 4.
Results of the optimization of the mooring system for Case 1.
| Parameter | Optimum Value |
|---|---|
| No. of mooring lines (-) | 6 |
| Mooring line diameter (mm) | 192 |
| Footprint radius (m) | 40 |
| Horizontal stiffness (kN/m) | 954 |
| Normalized mooring system cost | 0.13 |
Table 5.
Results of the optimization of the mooring system for Case 2.
| Parameter | Optimum Value |
|---|---|
| No. of mooring lines (-) | 6 |
| Mooring line diameter (mm) | 192 |
| Footprint radius (m) | 100 |
| Horizontal stiffness (kN/m) | 548 |
| Normalized mooring system cost | 0.17 |
Table 6.
Results of the optimization of the mooring system for Case 3.
| Parameter | Optimum Value |
|---|---|
| Hawser line diameter (mm) | 176 |
| Footprint radius (m) | 50 |
| Buoy 1 diameter | 3.7 |
| Buoy 2 diameter | 6 |
| Horizontal stiffness (kN/m) | 46 |
| Normalized mooring system cost | 0.48 |
Table 7.
Results of the optimization of the mooring system for Case 4.
| Parameter | Optimum Value |
|---|---|
| No. of mooring lines (-) | 10 |
| Mooring line diameter (mm) | 192 |
| Footprint radius (m) | 91 |
| Buoy diameter | 3.5 |
| Horizontal stiffness (kN/m) | 373 |
| Normalized mooring system cost | 0.22 |
© 2018 by the authors. Licensee MDPI, Basel, Switzerland. This article is an open access article distributed under the terms and conditions of the Creative Commons Attribution (CC BY) license (http://creativecommons.org/licenses/by/4.0/).
Share and Cite
MDPI and ACS Style
Thomsen, J.B.; Ferri, F.; Kofoed, J.P.; Black, K. Cost Optimization of Mooring Solutions for Large Floating Wave Energy Converters. Energies 2018, 11, 159. https://doi.org/10.3390/en11010159
AMA Style
Thomsen JB, Ferri F, Kofoed JP, Black K. Cost Optimization of Mooring Solutions for Large Floating Wave Energy Converters. Energies. 2018; 11(1):159. https://doi.org/10.3390/en11010159
Chicago/Turabian StyleThomsen, Jonas Bjerg, Francesco Ferri, Jens Peter Kofoed, and Kevin Black. 2018. "Cost Optimization of Mooring Solutions for Large Floating Wave Energy Converters" Energies 11, no. 1: 159. https://doi.org/10.3390/en11010159
Note that from the first issue of 2016, this journal uses article numbers instead of page numbers. See further details here.