Optimization Model of an Efficient Collaborative Power Dispatching System for Carbon Emissions Trading in China

1
School of Economics and Management, North China Electric Power University, Beijing 102206, China
2
Research Center for Beijing Energy Development, Beijing 102206, China
3
Environmental Research Institute, Suzhou Research Institute, North China Electric Power University, Beijing 102206, China
*
Author to whom correspondence should be addressed.
Energies 2017, 10(9), 1405; https://doi.org/10.3390/en10091405
Submission received: 30 July 2017
/
Revised: 22 August 2017
/
Accepted: 13 September 2017
/
Published: 14 September 2017
Abstract
:In this paper, a collaborative power dispatching system (CPDS) was developed to maximize the profit of a regional biomass power system consisting of an independent power grid. A power generating, dispatching and carbon emissions trading system (CETS) could be engaged in joint strategic planning and operational execution. The principal of CPDS is interactive planning of generating units in power generation and carbon emissions trading. An efficient carbon emissions trading plan for a CPDS would lead to optimized power generation levels under available power production capacities and carbon emissions. In a case study, four generator policies are proposed by considering basic CETSs to comparatively analyze the function of each generator in the CPDS. Results of four scenarios are compared, showing that biomass energy could replace thermal units to a certain extent, the carbon emissions and coal consumption of the CPDS would lie at a lower level, and a pumped storage unit could adjust the load fluctuations. The results of a carbon trading analysis show that the CETS has no significant impact on the CPDS, but along with the increase in trading price or the decrease in the free quota, the economic interests of power plants will be reduced accordingly. This may lead to carrying out low-carbon projects and reducing carbon emissions. Therefore, it is imperative to reduce carbon emissions by replacing power units with high energy consumption, and improve the consumption capacity of renewable energy.
1. Introduction
The main purpose of developing renewable energy in China is to reduce the proportion of coal consumption and carbon emissions. However, coal remains the largest contributor to China’s energy structure. The total coal consumption of China in 2016 reached 3.9 billion tons, of which about 50% was consumed in the power industry. The combustion of fossil fuels produces much carbon emissions, which could lead to a series of environmental problems. Global warming has become the world’s most urgent issue that needs to be solved. The impact on the air has also become a factor in power generation planning [1]. Thus, it is desirable to build an environmental-friendly electricity dispatching system with low carbon emissions, and explore a scientific method which can increase the proportion of renewable energy power generation. In order to utilize energy resources sustainably and reduce carbon emissions, the proportion of coal energy consumption should be decreased, and at the same time, the share of renewable energy needs to be greatly increased [2]. According to the National Energy Development Plan’s design—which was proposed by the Chinese government—by 2020, the proportion of domestic non-fossil energy and natural gas consumption will increase to 15% and 10%, respectively, while the proportion of coal consumption is expected to fall to 58%. Carbon emissions have a negative effect on the environment and human health. An effective CETS could encourage the greatest use of low-carbon energy generation and the resulting decrease in carbon emissions per unit power generation.
The CETS has been carried out at seven pilot cities in China, and the national carbon trading market will be officially launched in 2017. According to the plan, the first batch of industries in the national carbon trading market will include five traditional manufacturing industries (steel, nonferrous metals, cement, chemical and electricity) and the transportation industry [3,4]. This policy has been validated by foreign countries, and the influence of similar policies on reducing carbon emissions has been analyzed [5,6]. On the specific implementation of the trading system, there are many researchers focusing on the different quota allocation mechanisms, discussing the setting of carbon price and the free quota. At the same time, the government will also introduce some detailed measures [7,8,9]. CETS is important for power generation dispatching; it may affect the sequence and efficiency of power generation, and subsequently have an impact on the strategic choice of power plants.
Recently, the majority of studies have focused on renewable power generation dispatching. Li et al. proposed an optimization scheduling model for wind power and thermal power with an energy storage system [10]. Bekele et al. studied the feasibility of a small renewable hybrid power system for off-grid rural electrification in Ethiopia [11]. Wang et al. designed a hydro/photovoltaic hybrid power system in a microgrid [12]. In order to better solve the problem of renewable power consumption, Campana et al. built a dynamic model of a photovoltaic pumping system, and proposed a new approach to optimize this system [13,14]. Ma et al. studied the feasibility of a stand-alone hybrid solar–wind–battery system [15]. Ma et al. also proposed a techno-economic optimization model of a pumped storage and photovoltaic power system [16]. Ou et al. studied the dynamic operation and control of hybrid power systems [17,18,19]. As for the effect of a renewable power generation system, Olsson et al. considered the environment effect of photovoltaic water pumping [20]. Beluco et al. evaluated the effects of a hybrid hydro–PV system, and indicated that most dispatching systems use a renewable resource backed up by a fossil fuel-based generator [21]. Zhang et al. studied the use of thermal power to assist wind power in maximizing the realization of wind power consumption [22]. There are also some studies that address the strategy of a microgrid-scheduling optimization system [23,24,25].
Biomass resourcing also has the effect of carbon reduction, and biomass power units could operate continuously, unlike PV and wind power. The utilization rate of biomass energy in China is low; most of the rural areas in China usually deal with biomass energy by direct combustion, and it not only causes environmental pollution, but also wastes the economic value of the biomass resources. The development of biomass power generation has some positive significance in increasing farmers’ income and reducing air pollution [26,27,28]. According to the Thirteenth Five Year Plan for Electric Power Development promulgated by Chinese government departments, it is encouraged to carry out combined coal-fired and biomass energy power-generation projects. Most of the existing multi-energy scheduling studies focus on wind and photovoltaic power [10,11,12,13,14,15,16]. This paper incorporates biomass power generation into a CPDS to study the importance of such units, as biomass power generation is more stable than that derived from wind or photovoltaic sources. In the traditional CPDS, the common practice is modeled on minimized cost, which does not take the CETS cost into consideration [29,30]. Therefore, it is desired that the CPDS should be optimized through the analysis of an operation plan of generators, where CETS cost is indispensable.
Generally, the CPDS has attracted the interest of researchers, but these studies tend to focus on small scale, off-grid power systems in remote areas. In these cases, conventional units assist renewable units to connect the grid in a passive state, ignoring the economic efficiency of conventional units. Moreover, biomass power units are seldom involved in CPDS, and the traditional CPDS model rarely considers national carbon trading systems—which will be implemented in China—systematically. Developing a multi-objective-optimized CPDS model, considering economic benefit and environmental cost, is desired.
Hence, the objective of this study is to develop an optimized model of a CPDS which consists of biomass, thermal and pumped storage units under a carbon emissions trading system in China. Taking the output of units and carbon emissions trading as decision variables, the proposed model is applied to an independent power grid to verify its validity. Different generator policies are used to explore the function of various types of units in the CPDS. It is useful to emphasize the importance of a carbon emissions trading system. The results of the CPDS under four carbon trading scenarios are calculated to figure out the policy effect, which is helpful to reasonably develop power generation planning. Finally, we discuss whether the optimization model proposed can achieve a stable operation of the power generation system, and at the same time cut down coal consumption and carbon emissions.
2. Development of the Collaborative Power Dispatching System
2.1. Complexity of the System
A power system involves a large number of processes, which can be categorized into power generation, transmission and distribution. The power generation system is the focus of this study. The principle of a CPDS is the overall planning; its complexity is reflected in the diversification of generators, and each power generation process is closely linked. Furthermore, the proposed CPDS combines CETS to analyze the impact of carbon trading on power generation. The power industry is one of the main sources of carbon emissions, and it is necessary to analyze the impact of the domestic power industry under the implementation of China’s carbon trading system. According to the trading system, each generator has a free quota. If a generator’s quota is not sufficient to meet its need, it can purchase another generator’s residual quota on the carbon emissions trading market.
In traditional power generation, thermal power—with its reliable operation, stable output, low cost and other merits—occupies a large share of power generation. At present, China’s renewable energy power generation installed capacity is increasing steadily, and the vast majority of the regional power grid dispatching system is composed of thermal power and renewable energy power generation. Wind and photovoltaic power are two of the fastest-growing, clean and renewable sources of power in China, especially in the past five years. Photovoltaic power generation converts solar radiation into electricity directly, without fuel consumption, it does not cause environmental pollution; likewise, wind power does not produce carbon emissions. However, both wind and photovoltaic power use natural resources as energy, which will inevitably be subject to natural conditions and result in the randomness and interruption of power output [31]. These situations will doubtlessly bring challenges to a power generation dispatching system. In order to reduce the impact of natural factors on the consumption of renewable energy, biomass power is added to the proposed CPDS. Furthermore, the coexistence of electricity generation and the consumption of the pumped storage units also increases the complexity of the system.
The present work proposes the optimization of a power generation dispatching system (Figure 1). Three kinds of existing electricity facilities (coal-fired thermal power, biomass power and pumped storage power facilities with different capacities) are available to meet the load demand in a competitive way. Thermal power operates stably with low operational costs, but produces a large amount of carbon emissions. Biomass power has a better carbon reduction effect, but its installed capacity is limited by the fuel supply. Pumped storage units are conducive to a smooth load curve, but its operation cost is too high, and the existing price system may not guarantee its economic benefits. In the case of fixed load demand, the purpose of dispatching is to achieve the optimized rational allocation of these three resources.
2.2. Model Development
To improve the stability of power generation and decrease carbon emissions, an optimization model is built in this paper, in which biomass power and pumped storage power are used in combination with thermal power. Because the operating cost of generating renewable energy units is higher than that of thermal power, the dispatching model with the minimum total cost may use less renewable energy than thermal power. Therefore, the model is not conducive to increasing the proportion of renewable energy. Considering that electric tariffs may stimulate the increase in the proportion of renewable energy generation, the objective function should include economic benefits and environmental costs.
2.2.1. Objective Function
The objective function is maximizing the profit of thermal, biomass and pumped storage power units in the proposed CPDS:
The profit of thermal power:
The fuel cost also includes the startup and shutdown cost of thermal power units, as follows:
where in is the price of standard coal; is function of standard coal consumption of thermal power unit with real-time output ; is a 0–1 variable, which stands for operation or stop status of thermal power unit i at time t, when = 0, it means this unit stop and doesn’t have coal consumption, when = 1, it means this unit start-up. And , , are parameters of the coal consumption function, and all are exogenous variables, depending on the characteristics of the unit. is start-up cost of thermal power unit i at time t, if and only if = 1 and = 0, this formula has got to work, doesn’t equal 0; similarly is shutdown cost of thermal power unit i at time t, if and only if = 0 and = 1, this formula has got to work, doesn’t equal 0.
The carbon emissions cost is equal to the carbon emissions trading price multiplied by the purchase quota of carbon emissions, and the purchase quota of carbon emissions is equal to the total carbon emissions of thermal units minus the free quota as follows:
where is carbon emissions function of thermal power unit; is free quota of carbon emissions; , , are parameters of the carbon emissions function, and all are exogenous variables, depending on the characteristics of the unit.
The Profit of Biomass Power:
The biomass power fuel cost is equal to the fuel price multiplied by the fuel consumption, as follows:
where is the given exogenous parameter of the coal consumption function and depends on the characteristics of the unit. Strictly speaking, this function should be a quadratic function (just like function of the standard coal consumption of thermal power unit , but the data obtained in the survey is insufficient.
is an additional benefit for biomass power-generation enterprises due to the carbon emissions trading system. It is equal to the carbon emissions trading price multiplied by the reduction of carbon emissions. We assume that the entire reduction in the carbon emissions of biomass power units could be traded, and this benefit can be calculated by:
where is the given exogenous parameter of this function. Actually, there are many ways to calculate reduction of carbon emissions [32,33], and the emphasis is on the different benchmarks. In order to facilitate computation, we simplify it into a linear function according to the survey data in this paper.
The profit of pumped storage power:
The pumped storage unit adjusts its status according to load change. While pumping, the unit uses electricity, and therefore the carbon reduction effect is not significant. Although there are still some controversies about the carbon reduction of this unit in the academic field [34], we chose to ignore the reduction effect in this paper. The output of the pumped storage unit can be calculated by:
where is water flow of power station generate electricity at time t; is water flow of power station use electricity at time t. are exogenous variables, depending on the characteristics of the unit.
2.2.2. Constraints
The constraints are mainly divided into two aspects. The first aspect is the load demand side, and the second is the characteristics of the power units as they relate to thermal, biomass and pumped storage power.
Load Demand Side Constraints
(1) Equilibrium constraint of power system
This formula implies that power supply and demand at time t must always be in balance, and the transmission line losses are not taken into account.
(2) Spinning reserve constraints
Due to the uncertainty of load demand, power generation needs to be adjusted in real time to meet the power balance. Thermal power units usually work as backup units to adjust the output by adding and reducing fuel with flexibility. The adjustments should meet some constraints, which depend on the characteristics of the thermal power units:
Power Units Constraints
(1) Output constraint of thermal power unit
The installed capacity and minimum power output of the thermal power unit determines the upper and lower limits as follows:
(2) Output climbing speed constraint of thermal power unit
The output change of thermal power in a unit period has been limited by the unit’s characteristics. This kind of real-time output change should meet:
(3) The thermal unit startup and shutdown time constraints
The status change of units will influence the power generation cost, and it is detrimental to the performance of the units to startup and shutdown frequently. Accordingly, the continuous startup and shutdown time should be constrained as follows:
(4) Output constraint of biomass power unit
The same as thermal power; biomass power units should also have output limited as follows:
(5) Output climbing speed constraint of biomass power units
In general, the biomass power unit’s operation is stable, but also needs to meet the output climbing speed constraint as follows:
(6) Output constraint of pumped storage power unit:
(7) Pumping and generating flow constraints
The real-time output of the pumped storage unit depends on the water flow. Therefore, this unit should meet water flow constraints as follows:
(8) The dynamic balance constraints of storage capacity
The pumped storage power unit adjusts its output by charging or discharging water, and therefore it needs to ensure that storage capacity is sufficient to keep dynamic balance all the time, as is shown in the following equation:
(9) Storage capacity constraint
Storage capacity is limited by its design capacity as follows:
(10) Pumping and generating power-complementary constraints
Pumped storage units cannot pump and generate electricity at the same time. So they should meet:
3. Model Application
3.1. Case Study
This CPDS comprises of six thermal units, three biomass units and a pumped storage power plant with 300 MW installed capacity (Table 1). In order to compare the results of different units in the dispatching system, the main types of thermal power units are included. To ensure biomass power could operate stably, there is a sustained supply chain of biomass fuel. Due to the long response time of pumped storage units, this study simplifies the dispatching process and takes one hour as a dispatch period. It is assumed that the entire CPDS could operate independently. The flow diagram of the optimization model can be seen in Figure 2, and the corresponding power generation dispatching model can be formulated as follows:
This is subject to the equilibrium constraint of the power system:
and other power unit constraints like Equations (16)–(26).
3.2. Data Collection
Data were collected by field survey and data mining research [35,36]. The relevant price data for units are shown in Table 1. The load data in the power system of a typical day are shown in Table 2, and all detailed power units’ operating parameters are shown in Table 3. It is worth noting that China’s carbon emissions trading market is not well developed, and the carbon trading volumes and prices of pilot cities are low. In order to better achieve the national emissions reduction targets, it is assumed the ratio of free quota is 90% and trading price is about $14.5/t, which is a feasible basic carbon emissions trading system that the early market may accept [37].
4. Results Analysis
In this paper, the CPDS is optimized for biomass, thermal and pumped storage power under carbon emissions trading in China. The framework of the results analysis is listed in Table 4. Seven scenarios, considering different generator policies and carbon trading conditions, are analyzed.
4.1. Generator Policy Analysis under Basic Trading System
To study the function of each unit in the proposed CPDS, scenario analysis is used to discuss the results of different generator policies under a basic carbon trading system.
4.1.1. Dispatching Basic Power Units
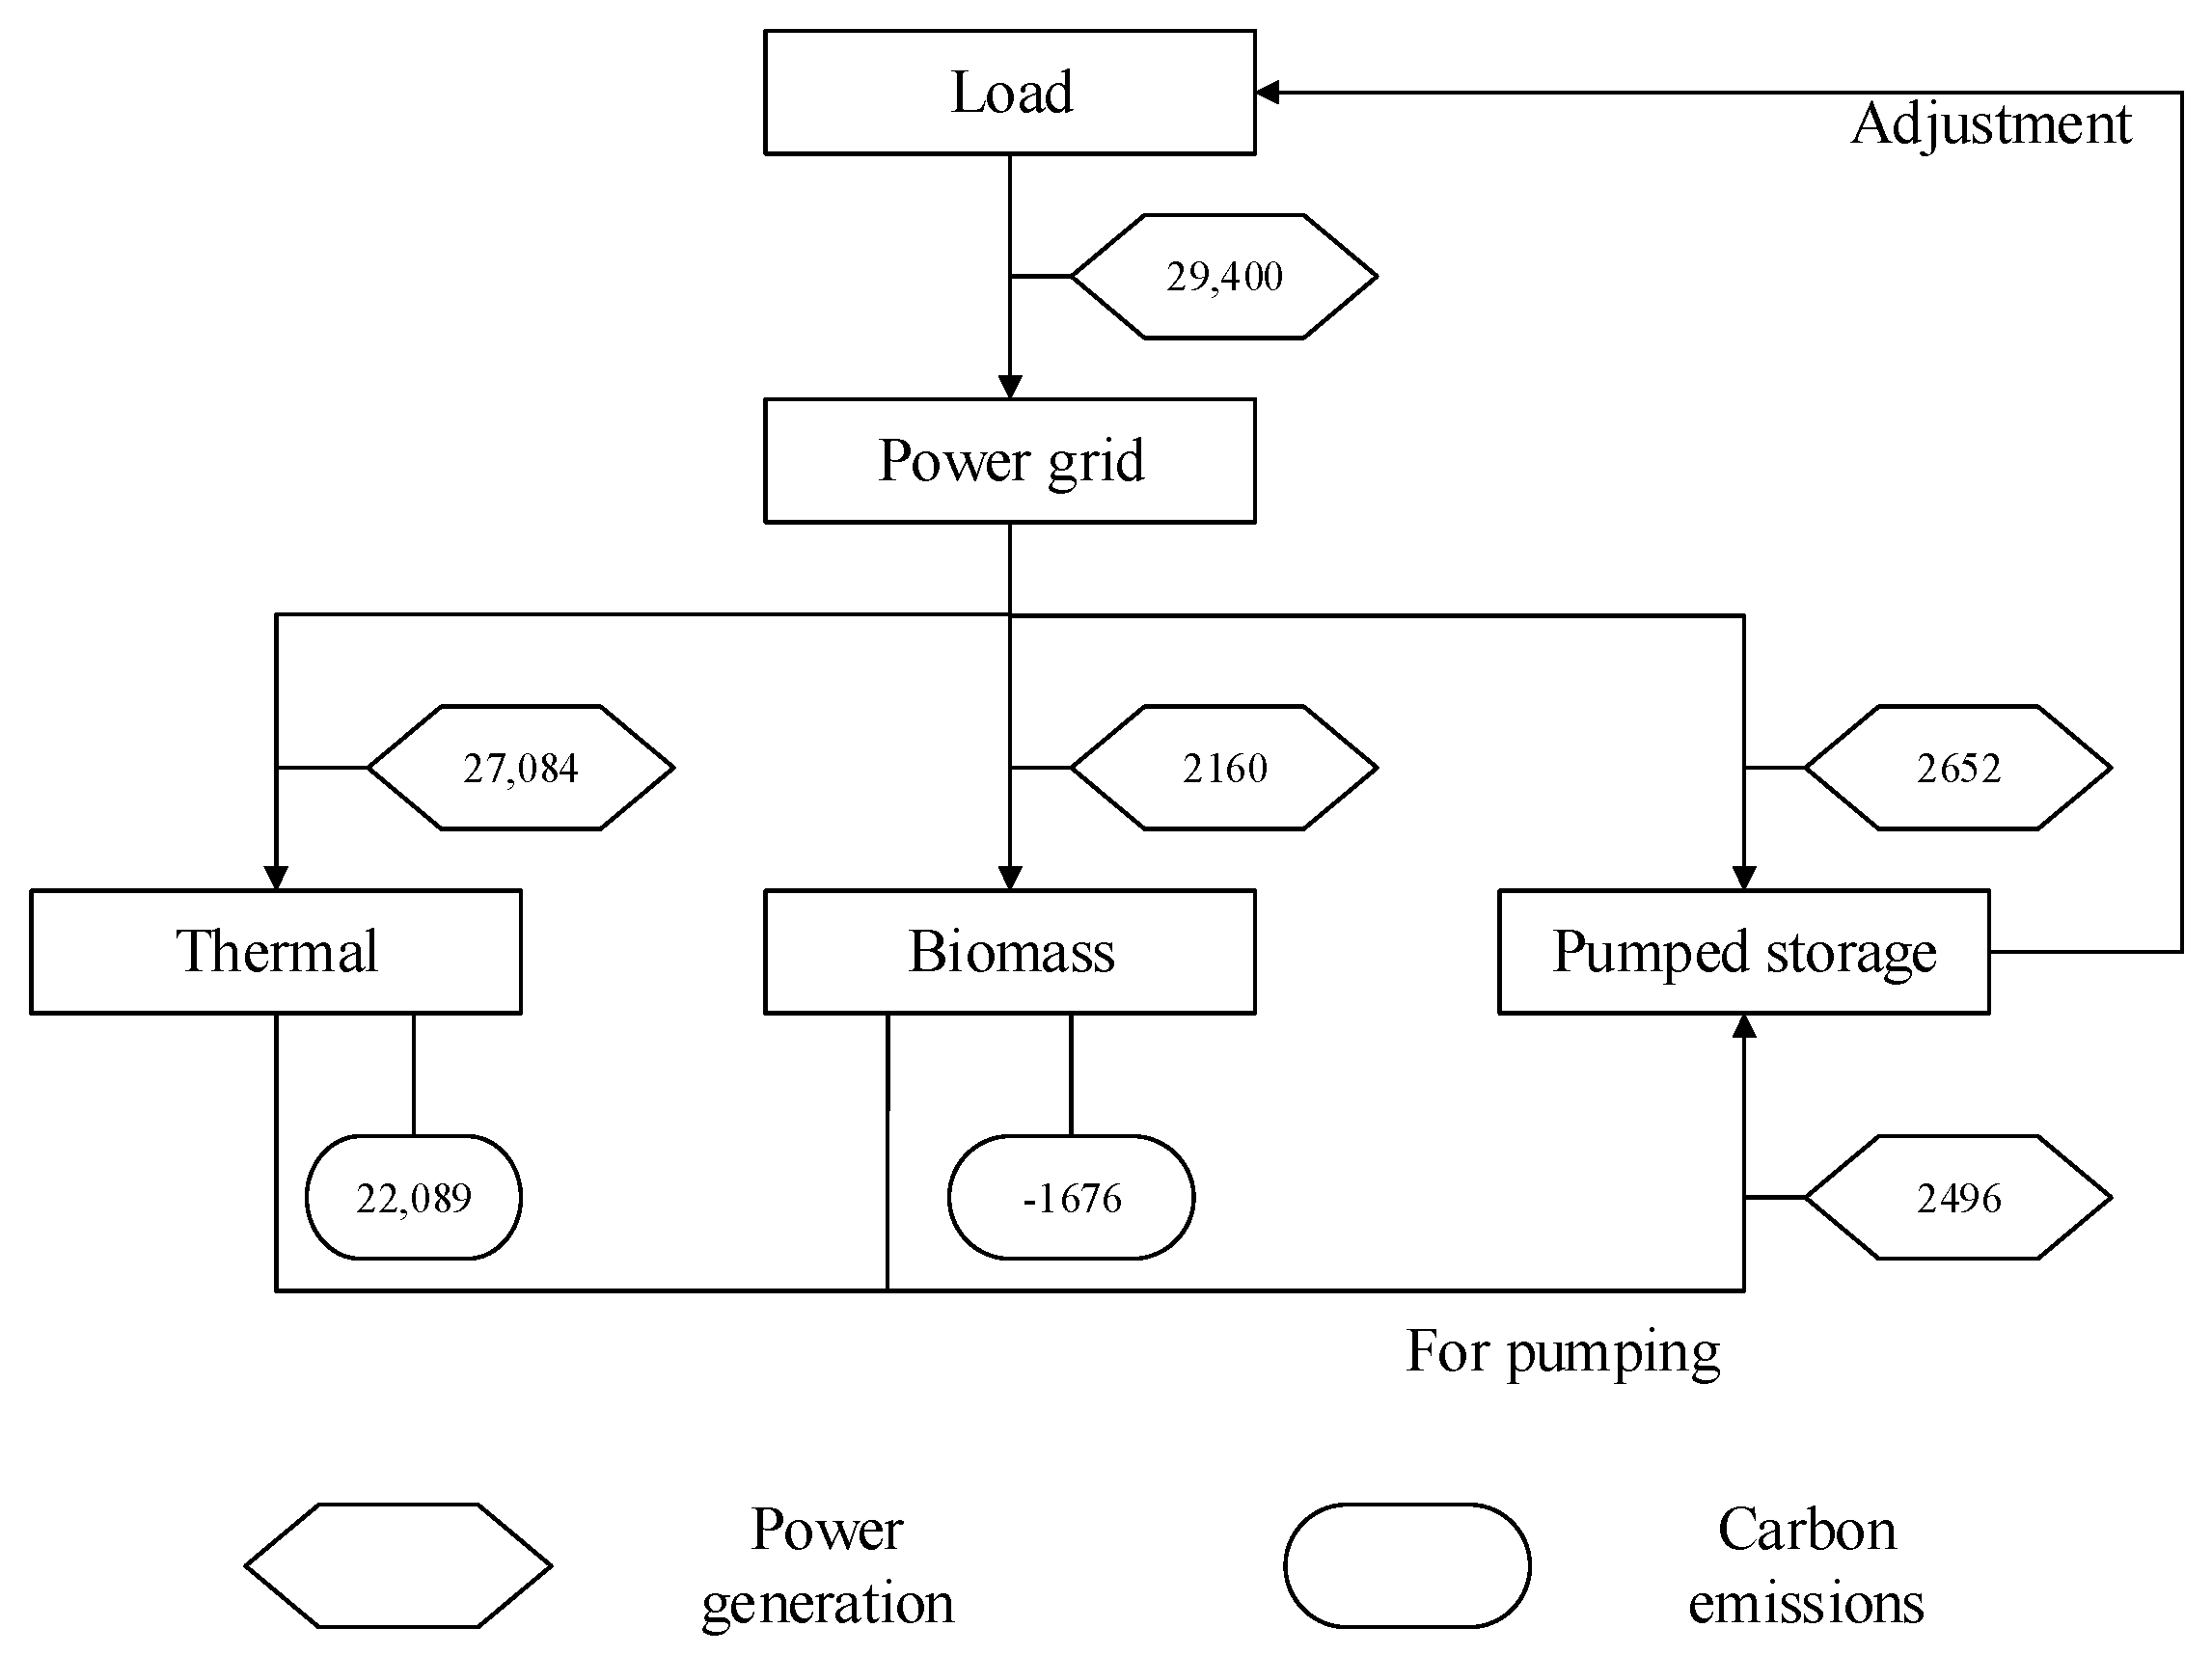
The output results of the original power units under a basic carbon emissions trading system are analyzed. Figure 3 shows the summary power generation and carbon emissions flow of the entire system in one dispatching period, and the detailed results are shown in Appendix A. The generating proportion of renewable energy reached 15%, which meets the requirements of China’s power planning. Thermal and biomass power generation provided 2496 MW·h for meeting the pumping needs of the pumped storage unit, which confirms that this unit will contribute to power consumption. Moreover, the presence of biomass units helped to reduce the average carbon emissions of the system. Figure 4 shows the detailed generating proportion of different units. From this figure, three of the largest-capacity installed thermal power units accounted for 77% of total power output, and their installed capacity accounted for only 65% of the CPDS. The remaining three thermal power units accounted for 15.5% of installed capacity, but only accounted for 8% of the total generation, most of which accounted for by the three largest-capacity installed thermal and biomass power units. This shows that the ratio of power generation to installed capacity does not have a simple linear relationship, and with the characteristics of the unit, the proposed optimization model includes the influence of the carbon trading cost on the output sequence of the power units.
The operating status of the power units could be described by output curves. From Figure 5, the 600 MW thermal unit ran stably in full-load status, as did the biomass units; but the units with outputs of 400 MW and 300 MW had large fluctuations. In the case of the 400 MW thermal unit, this may be caused by load change; and the fluctuations in the 300 MW thermal unit may be caused by the spinning reserve constraint. The output of the 400 MW unit changed more frequently, and its fluctuation was mainly due to lack of load demand. The 300 MW unit is usually used as a reserve capacity unit, and in order to meet the spinning reserve constraint, the unit can only work at peak load. Thus, during the rest of the optimization period, it worked in a low-load state. The pumped storage unit also fluctuated. As for the other small capacity thermal units, they could run stably but just in a low-load state so as to meet load demand. Even though they had output, their power generation was not enough to ensure their profits.
4.1.2. Dispatching Thermal Units Only
Figure 6 shows the thermal power units’ dispatching results when only the thermal power units are operated in the power generation system. The inner ring is the thermal power output structure of the thermal units only, and the outer ring is the result of the basic system. Based on this comparison, it is obvious that in the case of thermal power units only, with the exception of the 400 MW and 300 MW units, the generating output of the other units was smaller than that of the basic system, which indicated that the share of the generating units of the two units was taken up by the other units in the basic system.
Compared to thermal-only power system, the basic system was friendlier to the environment. From Table 5, the total power generation was 29,400 MW·h in the case of thermal power units only, which is equal to the total load demand of the day. However, in the basic system, the total power generation of the thermal units decreased by 7.88% and the coal consumption reduced by 7.54%. Furthermore, due to the carbon-reduction effect of biomass power, the reduction rate of the carbon trading volume was 14.27% when compared with the system of thermal power only, which is more beneficial for power producers and the environment.
In consideration of carbon emissions costs, large-capacity units with their own advanced technology have smaller emissions parameters, so they were given priority for power generation. In the case of thermal units only, the sequence of power generation was sorted by their capacity. Due to the limits of the small load demand, some small-capacity thermal power units almost had no output, and unit operation or stop status was completely determined by the load data. In the basic system, the thermal power units could operate stably on account of the role of the pumped storage units.
4.1.3. Dispatching Thermal and Biomass Units
In order to study the role of the pumped storage units in the power generation dispatching system, the following element was taken into account: the thermal units’ and biomass units’ dispatching system.
The comparative results of power output in different situations are listed in Table 6. It was apparent that the thermal units’ output in the basic system was less than the other units’ output, which also indicated that they had lower carbon emissions and coal consumption. Due to the added renewable energy sources, the share of thermal power declined from 92.65% to 84.91% by calculation.
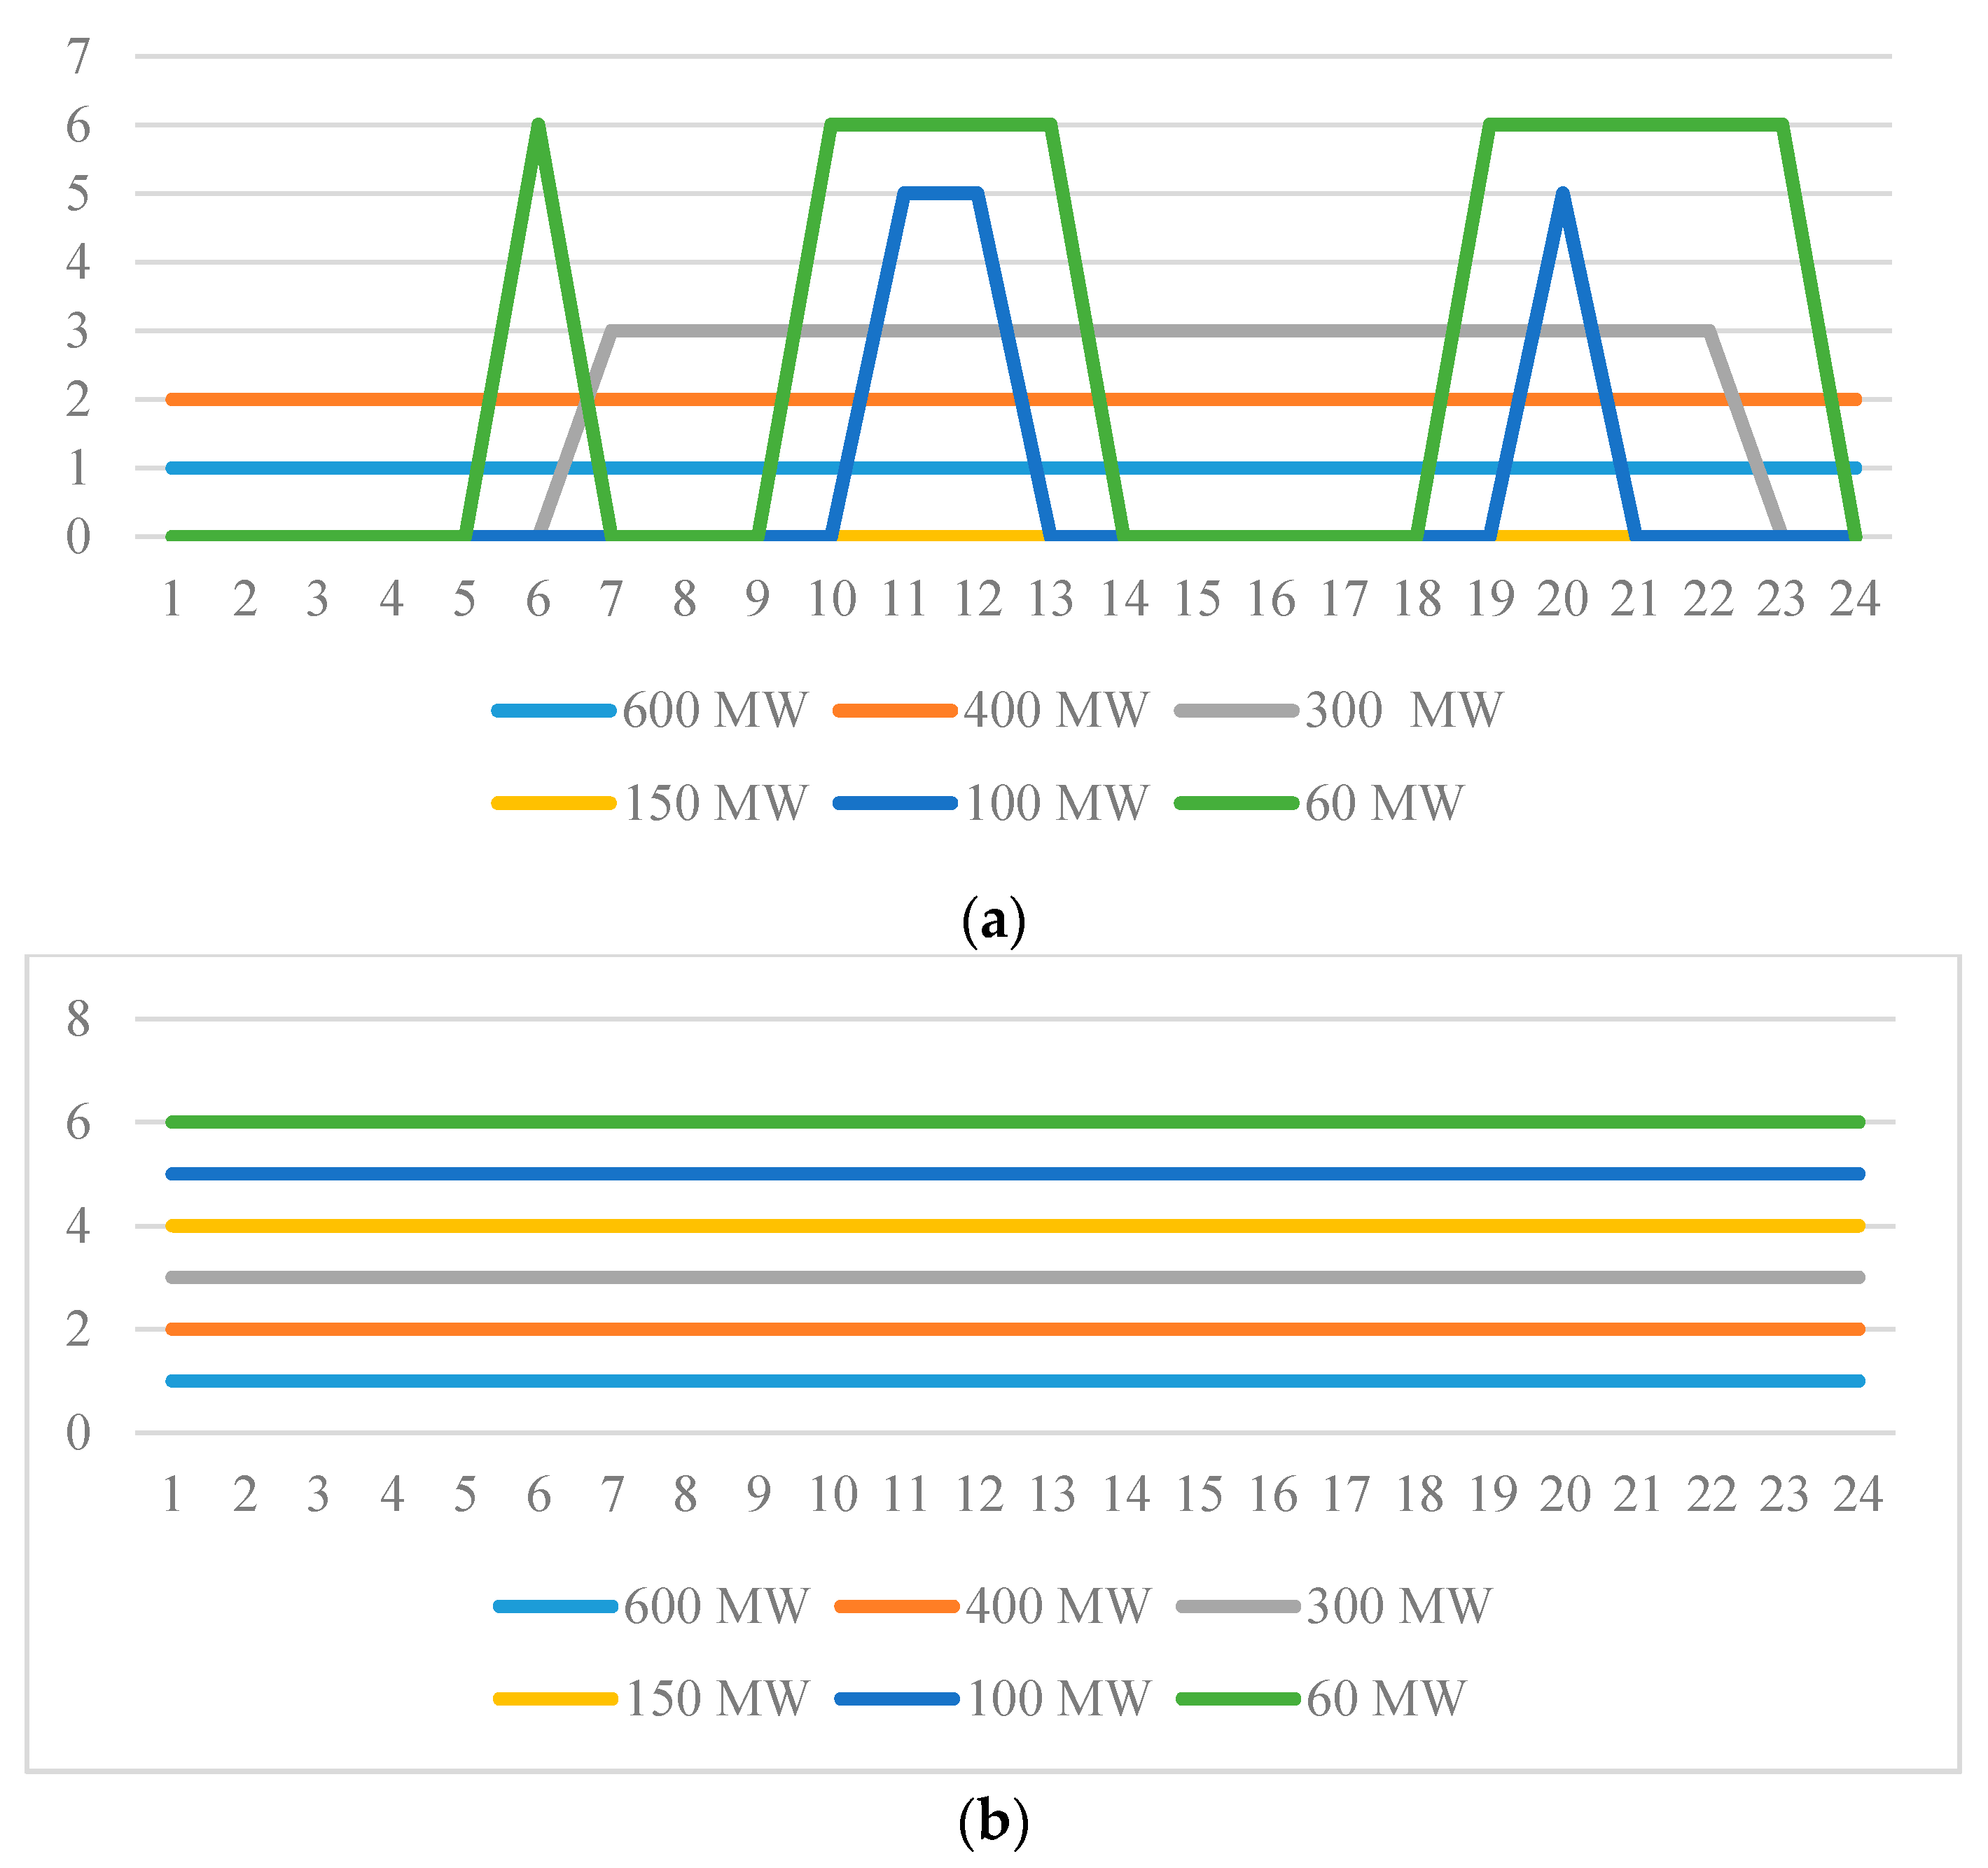
The increase in carbon emissions was not only reflected in the increase in thermal power output, but was also caused by frequent changes in the thermal power units’ start–stop statuses and the resulting increased energy consumption. The thermal units’ start–stop statuses in both situations are shown in Figure 7. In the thermal units’ and biomass units’ dispatching system, all thermal power units were in operation except for the 150 MW unit. As for the frequency of start–stop conversion, the 600 and 400 MW units both had zero instances, the 300 MW unit had two, the 100 MW had three and the 60 MW unit had six instances. We can make the conclusion that the smaller the installed capacity, the higher the frequency of start–stop conversion in the dispatching process. For the basic dispatching system, Figure 7b shows that all units had startup and shutdown conversions due to the presence of the pumped storage unit, which fully illustrates that the pumped storage unit played an important role in the stable operation of the power generation system. However, what cannot be ignored is that the small-capacity thermal power units were running in low-load conditions. The reason for this was that the carbon emissions parameters and the energy consumption parameters of these generators were too large, while the marginal efficiency of power generation was low. Therefore, a higher priority power generation sequence can be obtained.
The pumped storage units worked well to adjust the load demand and help the power generation system operate more stably. Figure 8 shows the real-time output of the pumped storage unit in the basic dispatching system. We learned that when the load demand is little, the pumped storage unit will start to pump water, and when the load rises, it will release the water to generate electricity. The conversion of the output of the pumped storage unit is related to the change of the load. During the optimization period, there were four changes in the state of the unit, corresponding to the overall trend of the load curve.
4.1.4. Dispatching Thermal and Pumped Storage Units
In order to study the role of the biomass units in the power generation dispatching system, the dispatching results in the absence of biomass units were analyzed.
The output structure of the thermal power units in different systems is listed in Table 7. It was evident that the most of thermal units’ output in the basic dispatching system was less than the absence of the biomass units dispatching system. This part of the output was the share of biomass power units occupied. Less thermal power means less coal consumption and a lower carbon emissions level. According to calculations, in the thermal and pumped storage unit dispatching system, carbon emissions per power generation were 746 kg/MW·h, but in the original system were 640 kg/MW·h. This strongly indicated that the biomass power generation had a good effect on carbon reduction.
The output of the 400 and 300 MW thermal units had the largest increase due to the absence of biomass units, followed by the 600 and 150 MW units, while the two other small-capacity units remained virtually unchanged. The installed capacity of the biomass units determined their occupied share of the thermal power units (because of the high installed capacity of the biomass units in this paper, which had a great impact on the output of the thermal power units). Moreover, the 100 and 60 MW thermal power units always operated at low load because the overall load demand and power generation capacity did not match, which is not conducive to the healthy operation of the power generation system. Based on the above analysis, in consideration of the high energy consumption, high carbon emissions and low-load operability of small-capacity thermal power units, they should be eliminated or converted into biomass power units when the local area has abundant biomass resources.
4.2. Carbon Trading System Analysis
In this paper, the carbon emissions trading system was a necessary factor. To study the impact of different CETSs on the results of the optimization model, four CETS scenarios were set (Table 8).
A business-as-usual (BAU) scenario was set; namely, a basic carbon emissions trading system (neutral scenario). In the Conservative scenario, the free quota was higher than in the BAU scenario, and the carbon emissions trading price was less than BAU. The carbon emissions trading price in the Positive scenario was twice that of BAU, but the free quota did not change. Finally, in the Aggressive scenario, the free quota of carbon emissions was 80%, which may significantly improve the carbon emissions trading cost.
Results under different scenarios were analyzed. The detailed data are listed in Table 8 and Figure 8. According to Table 9, prices rising, or the free quota of carbon emissions decreasing, corresponded to a decrease in the total profits of all power units. In the Conservative scenario, carbon emissions per power generation were 644 kg/MW·h, and coal consumption per power generation was 276 kg/MW·h. These two values are both higher than in the BAU scenario, and prove that a more stringent carbon emissions trading system could effectively decrease carbon emissions. However, in the Positive and Aggressive scenarios, it was found that the results were exactly the same as that of BAU scenario.
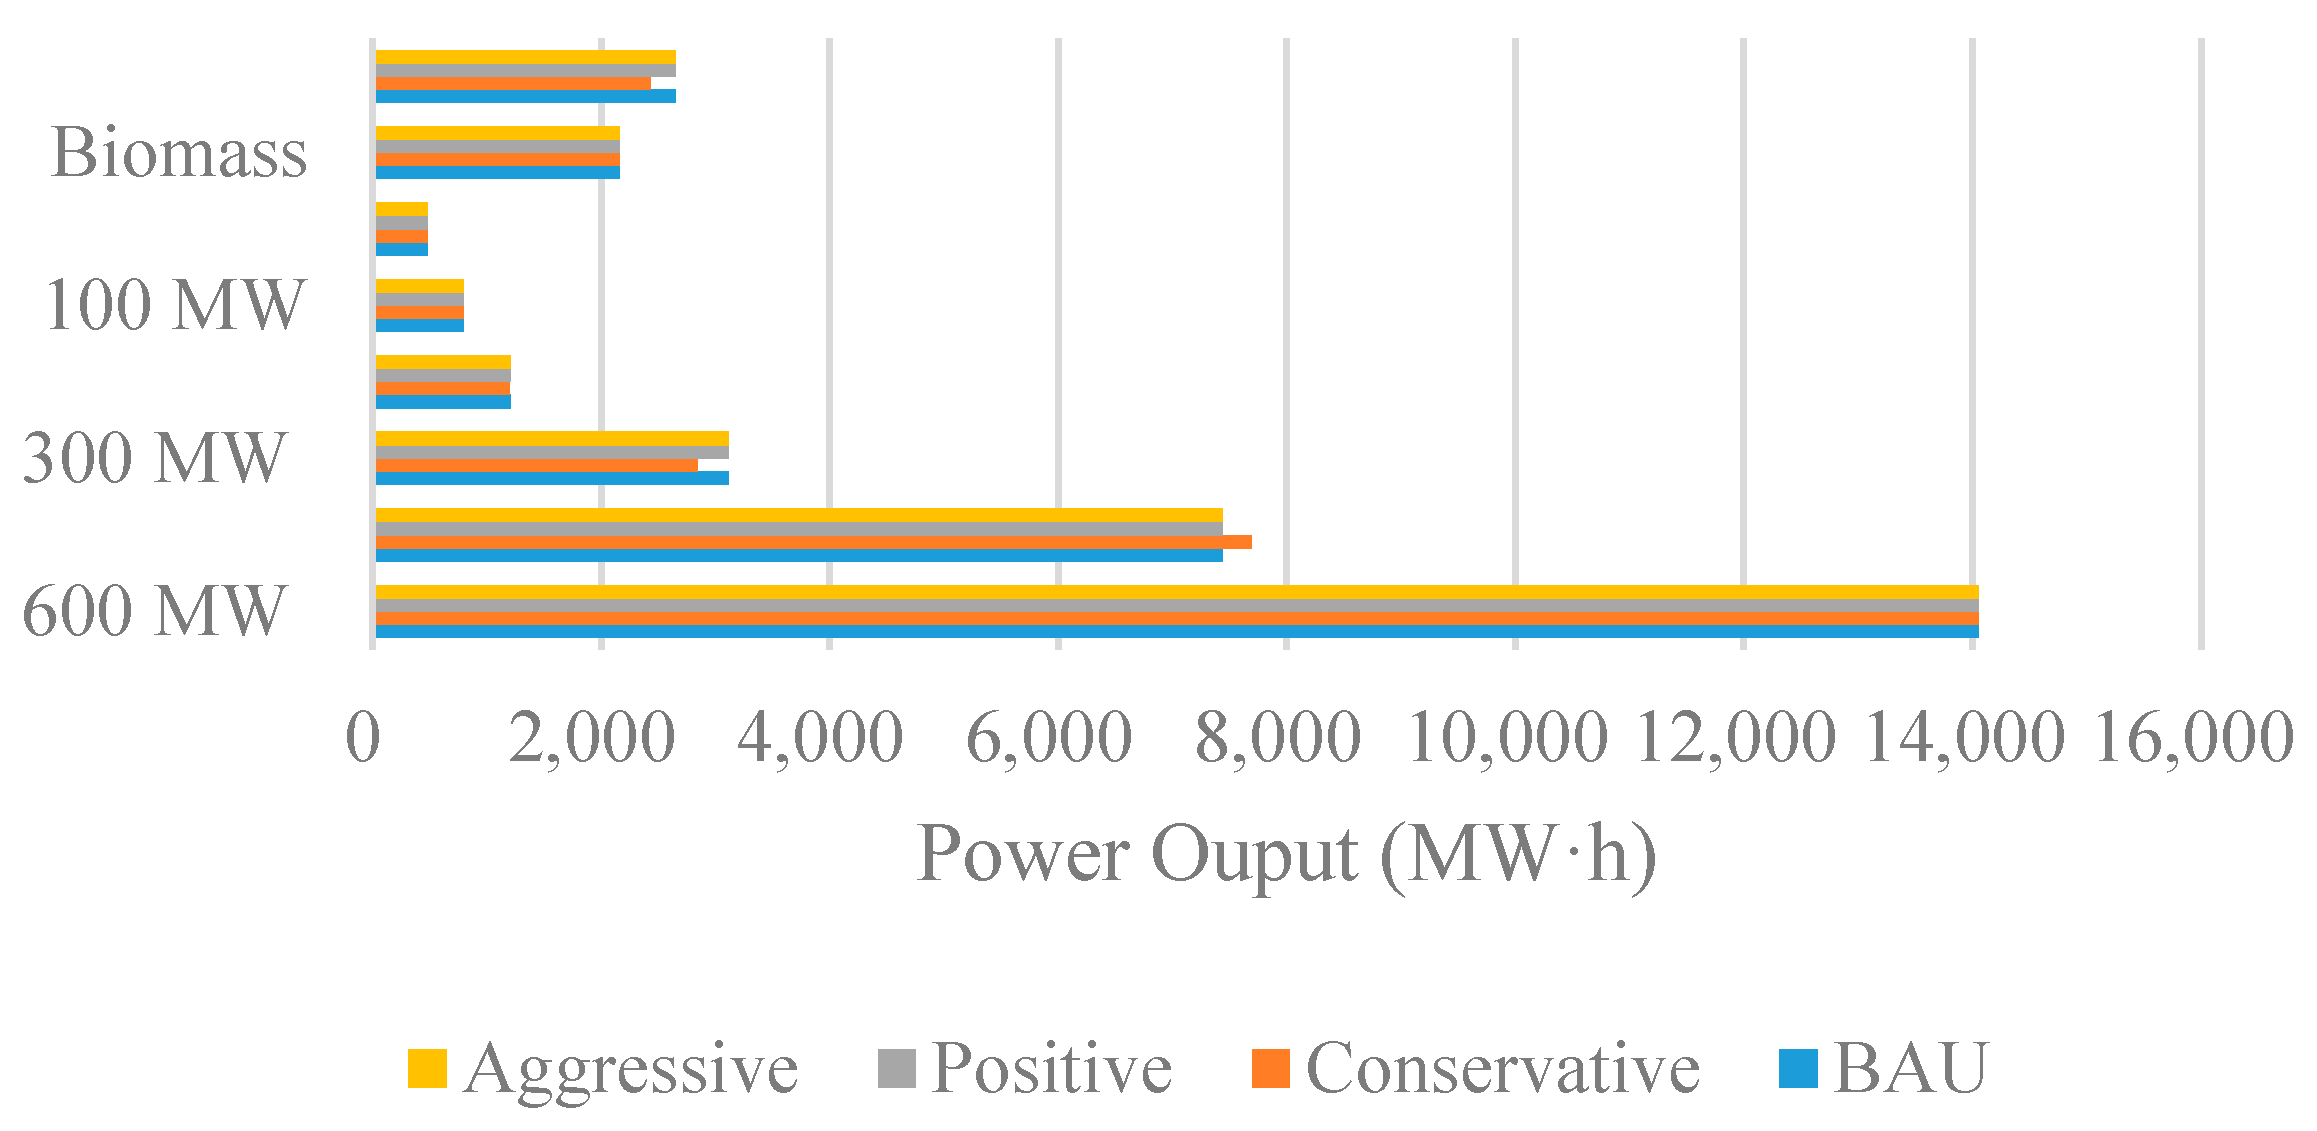
The detailed power output of the specific units could explain these results. From Figure 9, compared with the BAU scenario, the total output in the Conservative scenario was smaller, as was the output of the thermal units. However, it was obvious that the power generation structure of the units did not show an obvious change in the Positive and Aggressive scenarios. This shows that these two scenarios have only a slight effect on the thermal power output. In fact, this bears a relation to the model constraints. In order to meet the equilibrium constraints, the spinning reserve constraints and the power unit constraints of the power system—with regard to total profit—the differences were not significant between the Positive and Aggressive scenarios, even when the carbon emissions trading system was more stringent, i.e., when the carbon price was higher or the carbon quota was lower.
Limited by the model constraints, the thermal power output structure did not change considerably, making the carbon reduction effect not obvious. However, to achieve the purpose of maximizing benefits, the decision maker will tend to reduce the proportion of thermal power and arrange more renewable energy units, thereby reducing coal consumption and cutting down carbon emissions.
4.3. Discussion of Results
In terms of the results of different generator policies under a basic CETS, the function of three types of generators in the proposed CPDS was studied by scenario analysis. The results showed that the CPDS was efficient, and in this system, each generator cooperated with each other to ensure the stability of renewable energy.
In the case study, the sequence of power generation had thermal units after biomass units. This may have caused the proportion power generation attributed to thermal units to be further reduced, while increasing the installed capacity of the biomass generator. However, the total installed capacity of the biomass generator was limited by its fuel supply chain. The pumped storage unit played an active role in adjusting the load demand, generated electricity at the peak of the load and used the residual electricity of other units at the time of low load to pump the water, which smoothed the load fluctuations and increased the proportion of energy generated by renewable means.
With respect to the impact of the CETS on the CPDS, this analysis showed that the impact was not significant. This is probably due to the complexity of the dispatching system and the operational constraints of the generators. The four CETSs set up in the scenario analysis comprised the assumptions made in this study, and their impact can be further studied according to the specific implementation plan of China’s carbon trading market.
5. Conclusions
This study aimed to explore an optimization model of a CPDS for biomass, thermal and pumped storage power, considering a carbon emissions trading system in China. Biomass and thermal power units were coupled to achieve a stable power output, combined with pumped storage power to adjust the load demand. Taking the carbon emissions trading systems as the decision variables, maximizing power generation profit was set as the objective, after deducting fuel cost and carbon emissions cost. As a result, the validity of the proposed model was demonstrated through a simplified power system. The results proved that the proposed CPDS can work healthily and operate stably. As opposed to the randomness and intermittency of wind and photovoltaic power outputs, biomass power units could work at full capacity. The results of the generator policy analysis showed that the thermal power generation share was reduced, which led to the reduction of coal consumption and a lowering of carbon emissions in the optimized dispatching system. This indicated that the proposed combination of units was effective in lowering carbon emissions. Pumped storage units could play a good role in adjusting load demand, relieving the pressure of thermal power units on output adjustment and alleviating the damage to the power generation system caused by load fluctuation. It was proved that the proposed CPDS is reasonable and effective through comparative analysis, and the collaborative dispatching of these three kinds of generators has been realized. A carbon trading system analysis was used to study power output under different CETSs, and the results showed that the CETS had a great influence on power generation profit, but had no significant effect on power generation structure. The more stringent CETSs may not directly affect the level of carbon emissions and coal consumption in power generation, but from the perspective of economic benefits, power plants change their business strategies due to falling profits. Therefore, CETSs indirectly affect the behavior of power plants, and tend to reduce power generation, coal consumption and carbon emissions. After the implementation of the national carbon emissions trading market, those small-capacity thermal power units with high energy consumption and high carbon emissions should be eliminated from the market, or transformed into biomass units. The proposed model can be extended to other power generation systems. Future work will focus more on long-term collaborative optimization, considering the electricity, thermal and carbon markets collaboratively, development projects and the optimization of the situation of cogeneration.
Acknowledgments
This study is supported by the National Social Science Foundation of China (Grant No. 71373077).
Author Contributions
The research conducted in this paper is a part of a master thesis of Yihong Ding under the guidance of Qinliang Tan and Yimei Zhang. Most of the writing was carried out by Yihong Ding under the supervision of Qinliang Tan. All authors have read and approved the final manuscript.
Conflicts of Interest
The authors have no conflicts of interest.
Nomenclature
| Objective function | |
| profit of thermal power units | |
| profit of biomass power units | |
| profit of pumped storage power unit | |
| local feed-in tariff of thermal power | |
| real-time output of thermal unit i at time t | |
| coal fuel cost | |
| carbon emissions cost | |
| price of standard coal | |
| function of coal consumption of thermal power | |
| operation or stop status of thermal power | |
| startup cost of thermal power unit i at time t | |
| shutdown cost of thermal power unit i at time t | |
| carbon emissions trading price | |
| carbon emissions function of thermal power | |
| free quota of carbon emissions | |
| benchmark price of biomass power | |
| real-time output of biomass unit k at time t | |
| biomass fuel cost | |
| carbon emissions trading benefit | |
| average purchase price of biomass fuel | |
| real-time output of biomass unit k at time t | |
| biomass fuel consumption function of biomass | |
| total reduction of carbon emissions of biomass | |
| capacity price of pumped storage unit | |
| capacity adjustment coefficient | |
| capacity of pumped storage power unit | |
| price of pumped storage power generation | |
| real-time output of generating | |
| price of pumping power unit | |
| real-time output of pumping | |
| water flow of generating | |
| water flow of pumping | |
| Constraints | |
| load demand data at time t | |
| upper spinning reserve constraint at time t | |
| lower spinning reserve constraint at time t | |
| maximum possible output of unit i | |
| minimum active output of unit i | |
| output variation range of thermal power | |
| continuous running time of unit i at time t − 1 | |
| minimum continuous running time | |
| continuous downtime of unit i at time t − 1 | |
| minimum continuous downtime | |
| maximum generation power output | |
| maximum pump power output | |
| real-time generation water flow | |
| possible maximum generating water flow | |
| real-time pump water flow | |
| possible maximum pumping water flow | |
| storage capacity at time t | |
| a unit period | |
Appendix A
The results of the proposed optimization model of the power generation dispatching system.

Table A1.
The results of proposed dispatching optimization model.
| Load | 600 MW | 400 MW | 300 MW | 150 MW | 100 MW | 60 MW | Pumping | Generating |
|---|---|---|---|---|---|---|---|---|
| 775 | 600 | 133 | 100 | 50 | 33 | 20 | 251 | 0 |
| 850 | 600 | 208 | 100 | 50 | 33 | 20 | 251 | 0 |
| 925 | 600 | 283 | 100 | 50 | 33 | 20 | 251 | 0 |
| 1000 | 600 | 358 | 100 | 50 | 33 | 20 | 251 | 0 |
| 1075 | 600 | 400 | 133 | 50 | 33 | 20 | 251 | 0 |
| 1150 | 600 | 400 | 194 | 50 | 33 | 20 | 237 | 0 |
| 1225 | 600 | 301 | 100 | 50 | 33 | 20 | 0 | 31 |
| 1275 | 600 | 265 | 100 | 50 | 33 | 20 | 0 | 117 |
| 1375 | 600 | 260 | 100 | 50 | 33 | 20 | 0 | 222 |
| 1450 | 600 | 335 | 100 | 50 | 33 | 20 | 0 | 222 |
| 1525 | 600 | 400 | 110 | 50 | 33 | 20 | 0 | 222 |
| 1475 | 600 | 360 | 100 | 50 | 33 | 20 | 0 | 222 |
| 1400 | 600 | 285 | 100 | 50 | 33 | 20 | 0 | 222 |
| 1350 | 600 | 242 | 100 | 50 | 33 | 20 | 0 | 215 |
| 1275 | 600 | 268 | 100 | 50 | 33 | 20 | 0 | 114 |
| 1225 | 600 | 400 | 283 | 50 | 33 | 20 | 251 | 0 |
| 1175 | 600 | 400 | 233 | 50 | 33 | 20 | 251 | 0 |
| 1300 | 600 | 230 | 100 | 50 | 33 | 20 | 0 | 177 |
| 1425 | 600 | 310 | 100 | 50 | 33 | 20 | 0 | 222 |
| 1500 | 600 | 385 | 100 | 50 | 33 | 20 | 0 | 222 |
| 1400 | 600 | 285 | 100 | 50 | 33 | 20 | 0 | 222 |
| 1250 | 600 | 400 | 300 | 58 | 33 | 20 | 251 | 0 |
| 1100 | 600 | 400 | 158 | 50 | 33 | 20 | 251 | 0 |
| 900 | 252 | 133 | 100 | 50 | 33 | 20 | 0 | 222 |
Note: Biomass power units are all working at full capacity.
References
- Zhang, Y.M.; Huang, G.H.; Lin, Q.G.; Lu, H.W. Integer fuzzy credibility constrained programming for power system management. Energy 2012, 38, 398–405. [Google Scholar] [CrossRef]
- Dai, H.; Xie, X.; Xie, Y.; Liu, J.; Masui, T. Green growth: The economic impacts of large-scale renewable energy development in China. Appl. Energy 2016, 162, 435–449. [Google Scholar] [CrossRef]
- Tang, L.; Wu, J.; Yu, L.; Bao, Q. Carbon emissions trading scheme exploration in China: A multi-agent-based model. Energy Policy 2015, 81, 152–169. [Google Scholar] [CrossRef]
- Zhou, P.; Zhang, L.; Zhou, D.Q.; Xia, W.J. Modeling economic performance of interprovincial CO2 emission reduction quota trading in China. Appl. Energy 2013, 112, 1518–1528. [Google Scholar] [CrossRef]
- Rive, N. Climate policy in Western Europe and avoided costs of air pollution control. Econ. Model. 2010, 27, 103–115. [Google Scholar] [CrossRef]
- Sanin, M.E.; Violante, F.; Mansanet-Bataller, M. Understanding volatility dynamics in the EU-ETS market. Energy Policy 2015, 82, 321–331. [Google Scholar] [CrossRef]
- Hübler, M.; Voigt, S.; Löschel, A. Designing an emissions trading scheme for China—An up-to-date climate policy assessment. Energy Policy 2014, 75, 57–72. [Google Scholar] [CrossRef]
- Xiao, B.; Niu, D.; Guo, X.; Xu, X. The impacts of environmental tax in China: A dynamic recursive multi-sector CGE model. Energies 2015, 8, 7777–7804. [Google Scholar] [CrossRef]
- Li, W.; Lu, C. The research on setting a unified interval of carbon price benchmark in the national carbon trading market of China. Appl. Energy 2015, 155, 728–739. [Google Scholar] [CrossRef]
- Li, H.H.; Ju, L.W.; Tan, Q.K.; Xin, H.; Tan, Z.F. An optimization scheduling model for wind power and thermal power with energy storage system considering carbon emission trading. Math. Probl. Eng. 2015, 2015. [Google Scholar] [CrossRef]
- Bekele, G.; Tadesse, G. Feasibility study of small hydro/PV/wind hybrid system for off-grid rural electrification in Ethiopia. Appl. Energy 2012, 97, 5–15. [Google Scholar] [CrossRef]
- Wang, Y.B.; Xu, H.H. Research and practice of designing hydro/photovoltaic hybrid power system in microgrid. In Proceedings of the 2013 IEEE 39th Photovoltaic Specialists Conference (PVSC), Tampa, FL, USA, 16–21 June 2013. [Google Scholar]
- Campana, P.E.; Li, H.; Zhang, J.; Zhang, R.; Liu, J.; Yan, J. Economic optimization of photovoltaic water pumping systems for irrigation. Energy Convers. Manag. 2015, 95, 32–41. [Google Scholar] [CrossRef]
- Campana, P.E.; Li, H.; Yan, J. Dynamic modelling of a PV pumping system with special consideration on water demand. Appl. Energy 2013, 112, 635–645. [Google Scholar] [CrossRef]
- Ma, T.; Yang, H.; Lu, L. A feasibility study of a stand-alone hybrid solar-wind-battery system for a remote island. Appl. Energy 2014, 121, 149–158. [Google Scholar] [CrossRef]
- Ma, T.; Yang, H.; Lu, L.; Peng, J. Pumped storage-based standalone photovoltaic power generation system: Modeling and techno-economic optimization. Appl. Energy 2015, 137, 649–659. [Google Scholar] [CrossRef]
- Ou, T.C.; Hong, C.M. Dynamic operation and control of microgrid hybrid power systems. Energy 2014, 66, 314–323. [Google Scholar] [CrossRef]
- Ou, T.C.; Lu, K.H.; Huang, C.J. Improvement of transient stability in a hybrid power multi-system using a designed NIDC (novel intelligent damping controller). Energies 2017, 10, 488. [Google Scholar] [CrossRef]
- Ou, T.C.; Su, W.F.; Liu, X.Z.; Huang, S.J.; Tai, T.Y. A modified bird-mating optimization with hill-climbing for connection decisions of transformers. Energies 2016, 9, 671. [Google Scholar] [CrossRef]
- Olsson, A.; Campana, P.E.; Lind, M.; Yan, J. PV water pumping for carbon sequestration in dry land agriculture. Energy Convers. Manag. 2015, 102, 169–179. [Google Scholar] [CrossRef]
- Beluco, A.; de Souza, P.K.; Krenzinger, A. A method to evaluate the effect of complementarity in time between hydro and solar energy on the performance of hybrid hydro PV generating plants. Renew. Energy 2012, 45, 24–30. [Google Scholar] [CrossRef]
- Zhang, X.X.; Yan, K.K.; Lu, Z.G.; He, S.L. Carbon trading based low-carbon economic dispatching for power grid integrated with wind power system. Power Syst. Technol. 2013, 37, 2697–2704. (In Chinese) [Google Scholar]
- Hong, C.M.; Ou, T.C.; Lu, K.H. Development of intelligent MPPT (maximum power point tracking) control for a grid-connected hybrid power generation system. Energy 2013, 50, 270–279. [Google Scholar] [CrossRef]
- Ou, T.C. Ground fault current analysis with a direct building algorithm for microgrid distribution. Electr. Power Energy Syst. 2013, 53, 867–875. [Google Scholar] [CrossRef]
- Ou, T.C. A novel unsymmetrical faults analysis for microgrid distribution systems. Electr. Power Energy Syst. 2012, 43, 1017–1024. [Google Scholar] [CrossRef]
- Montuori, L.; Alcázar-Ortega, M.; Álvarez-Bel, C.; Domijan, A. Integration of renewable energy in microgrids coordinated with demand response resources: Economic evaluation of a biomass gasification plant by Homer Simulator. Appl. Energy 2014, 132, 15–22. [Google Scholar] [CrossRef]
- Carneiro, P.; Ferreira, P. The economic, environmental and strategic value of biomass. Renew. Energy 2012, 44, 17–22. [Google Scholar] [CrossRef] [Green Version]
- Gómez, A.; Rodrigues, M.; Montañés, C.; Dopazo, C.; Fueyo, N. The potential for electricity generation from crop and forestry residues in Spain. Biomass Bioenergy 2010, 34, 703–719. [Google Scholar]
- Zhu, Z.L.; Zhou, J.Y.; Han, Z.X.; Pan, Y. A low-carbon power dispatch model based on policy mechanisms corresponding to different stages. Power Syst. Technol. 2013, 37, 287–294. (In Chinese) [Google Scholar]
- Zeng, M.; Xue, S.; Zhu, X.L.; Duan, K.Y.; Zhang, G. Simulation research on social welfare equilibrium considering uncertainty in generation and consumption sides under development of low-carbon power grids. Power Syst. Technol. 2012, 36, 18–25. (In Chinese) [Google Scholar]
- Li, F.F.; Qiu, J. Multi-objective optimization for integrated hydro-photovoltaic power system. Appl. Energy 2016, 167, 377–384. [Google Scholar] [CrossRef]
- Liu, Y.; Lu, Y. The economic impact of different carbon tax revenue recycling schemes in China: A model-based scenario analysis. Appl. Energy 2015, 141, 96–105. [Google Scholar] [CrossRef]
- Song, Y.P.; Jian, X.M.; Zhuang, Y.J.; Chen, X.K.; Wu, Y.J.; Deng, Y.; Zhu, X.F. Greenhouse gas mitigation benefits of middle-scale biomass power generation project. Guangzhou Chem. Ind. 2016, 12, 12–14. [Google Scholar]
- Lv, C.Y.; Li, X.R. Analysis on energy saving effect of power system based on pumped storage power station. Energy Sav. 2016, 35, 42–46. (In Chinese) [Google Scholar]
- Li, X.J.; Huo, H.Y. Preliminary calculation of operation mode of electricity pricing and benchmark capacity of pumped storage project. Energy China 2015, 12, 41–44. [Google Scholar]
- Dong, A.Y. Research on the Combined Approach and Optimization Model of Wind Power in China; North China Electric Power University: Beijing, China, 2014. [Google Scholar]
- Li, W.; Jia, Z.J. The impact of emission trading scheme and the ratio of free quota: A dynamic recursive CGE model in China. Appl. Energy 2016, 174, 1–14. [Google Scholar] [CrossRef]
Figure 1.
Power generation dispatching system.
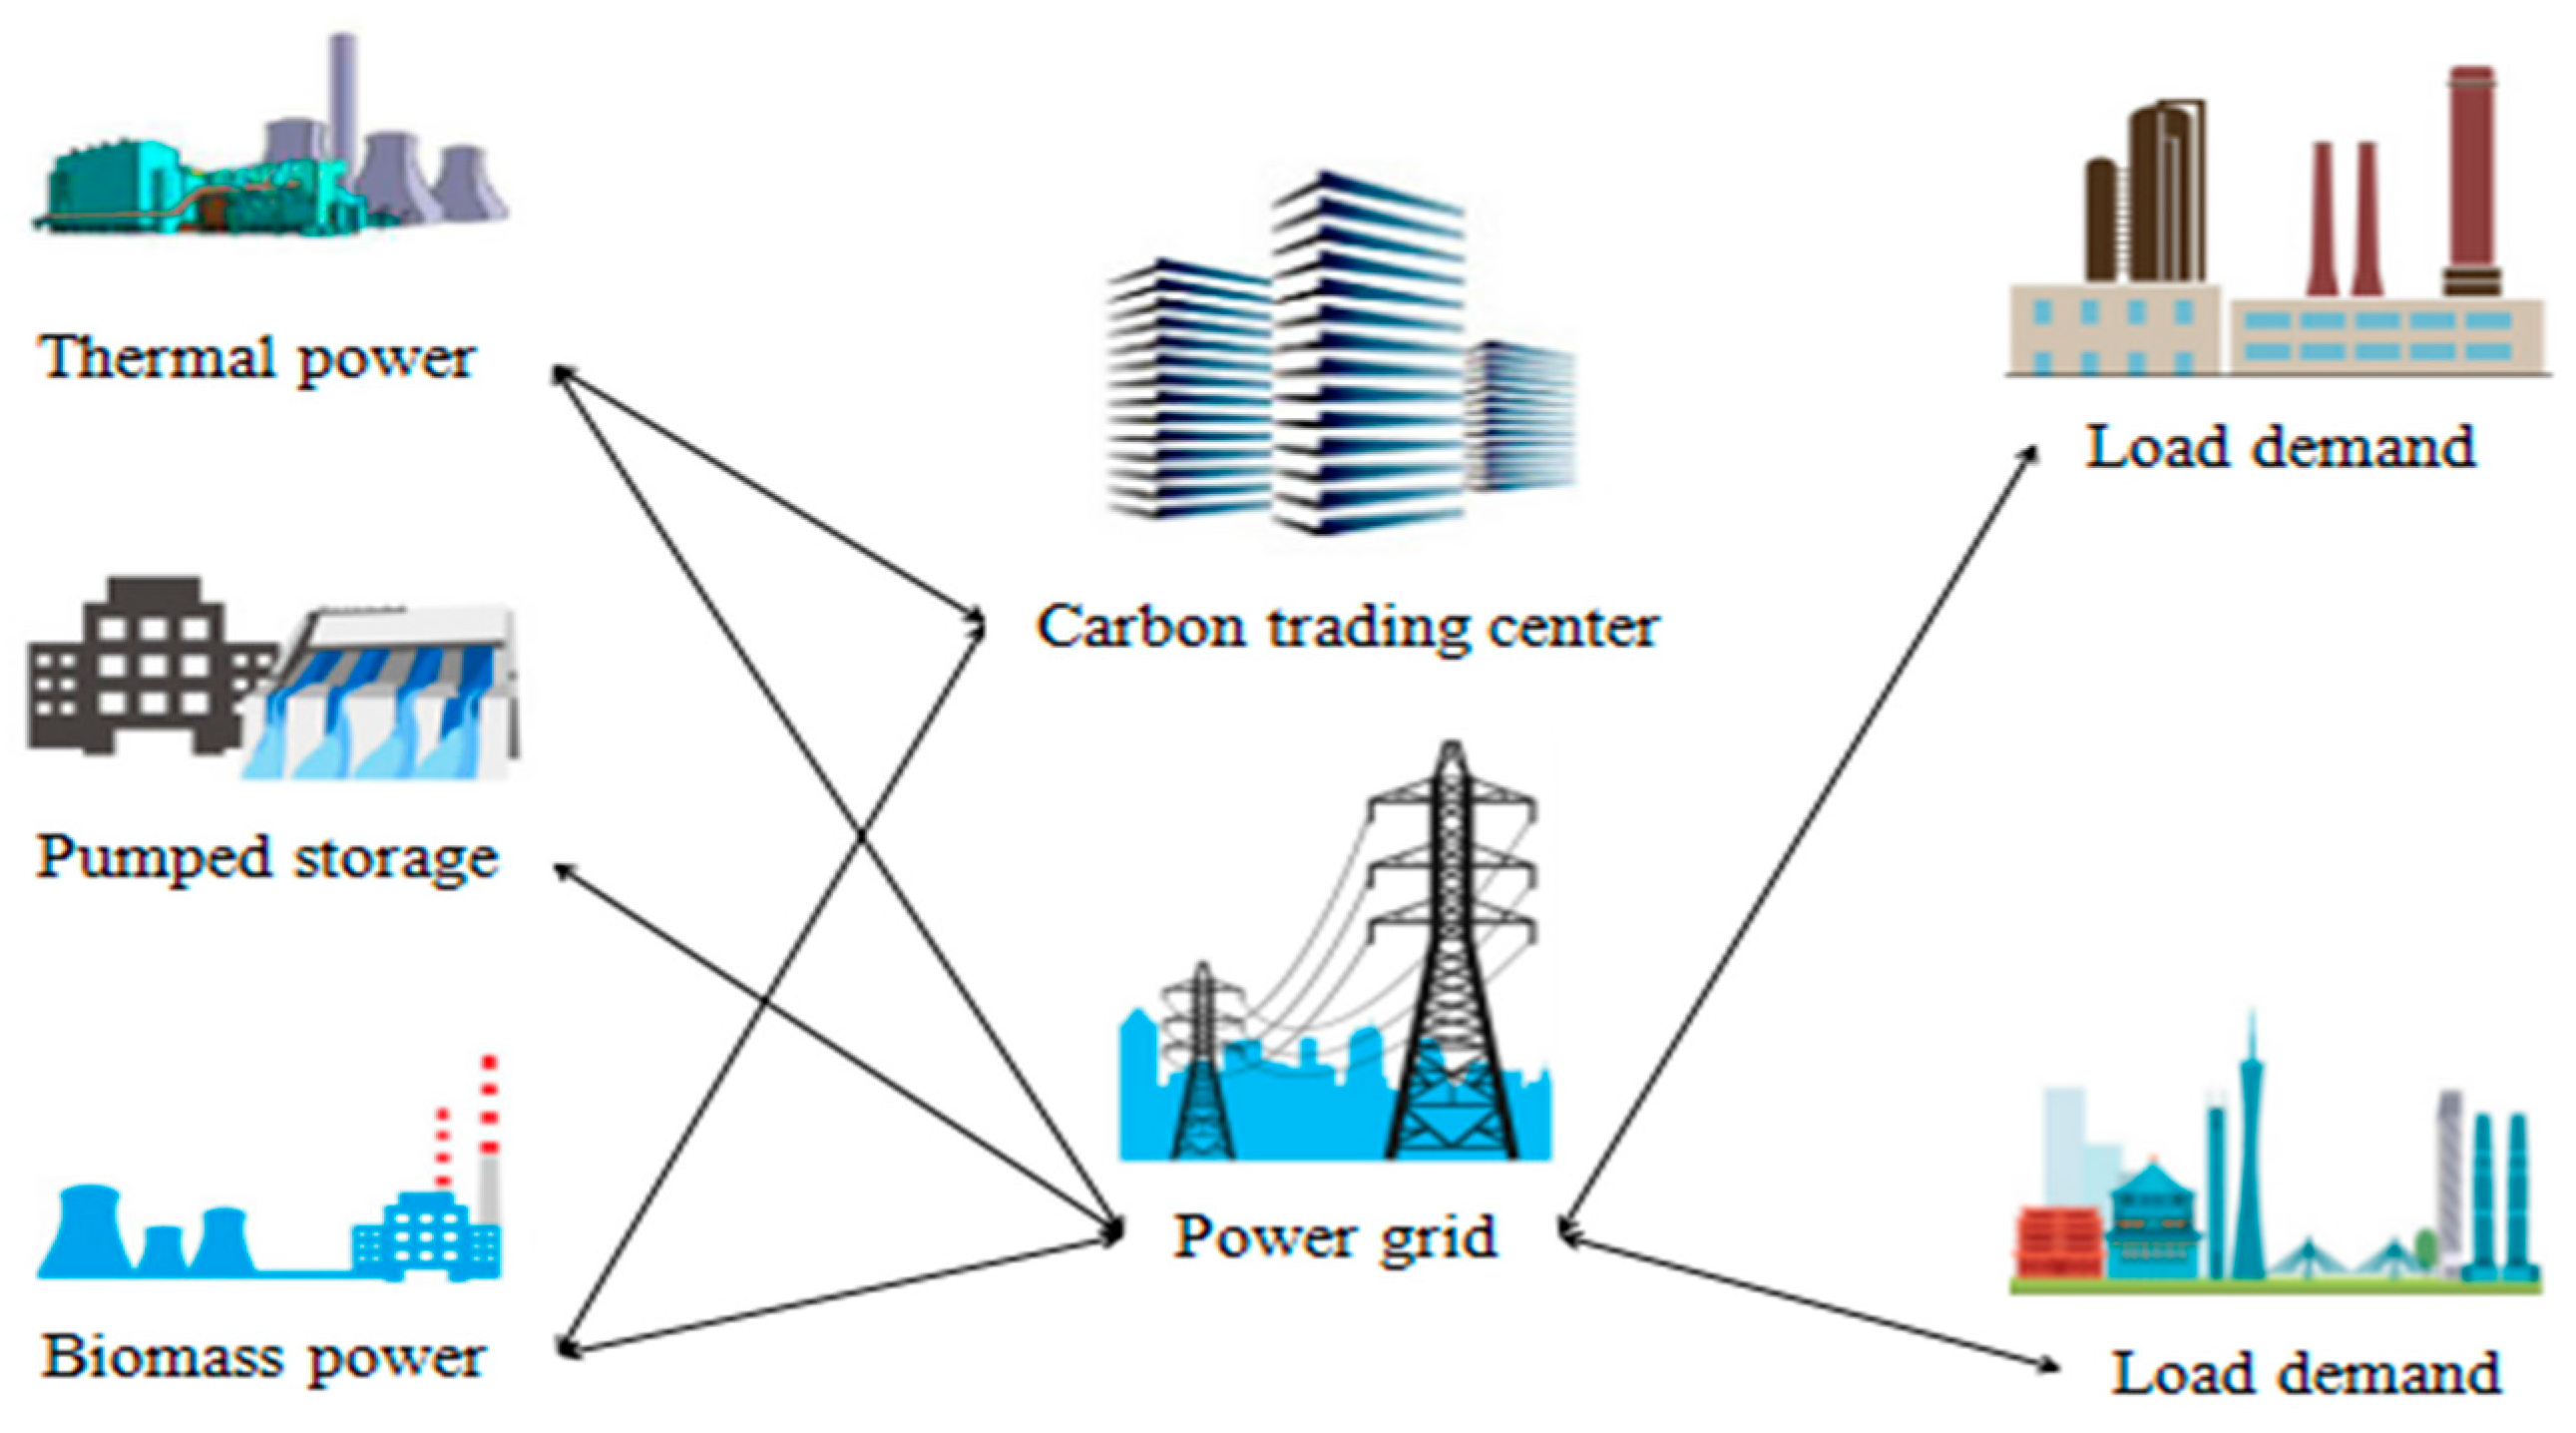
Figure 2.
Flow diagram of the optimization model.
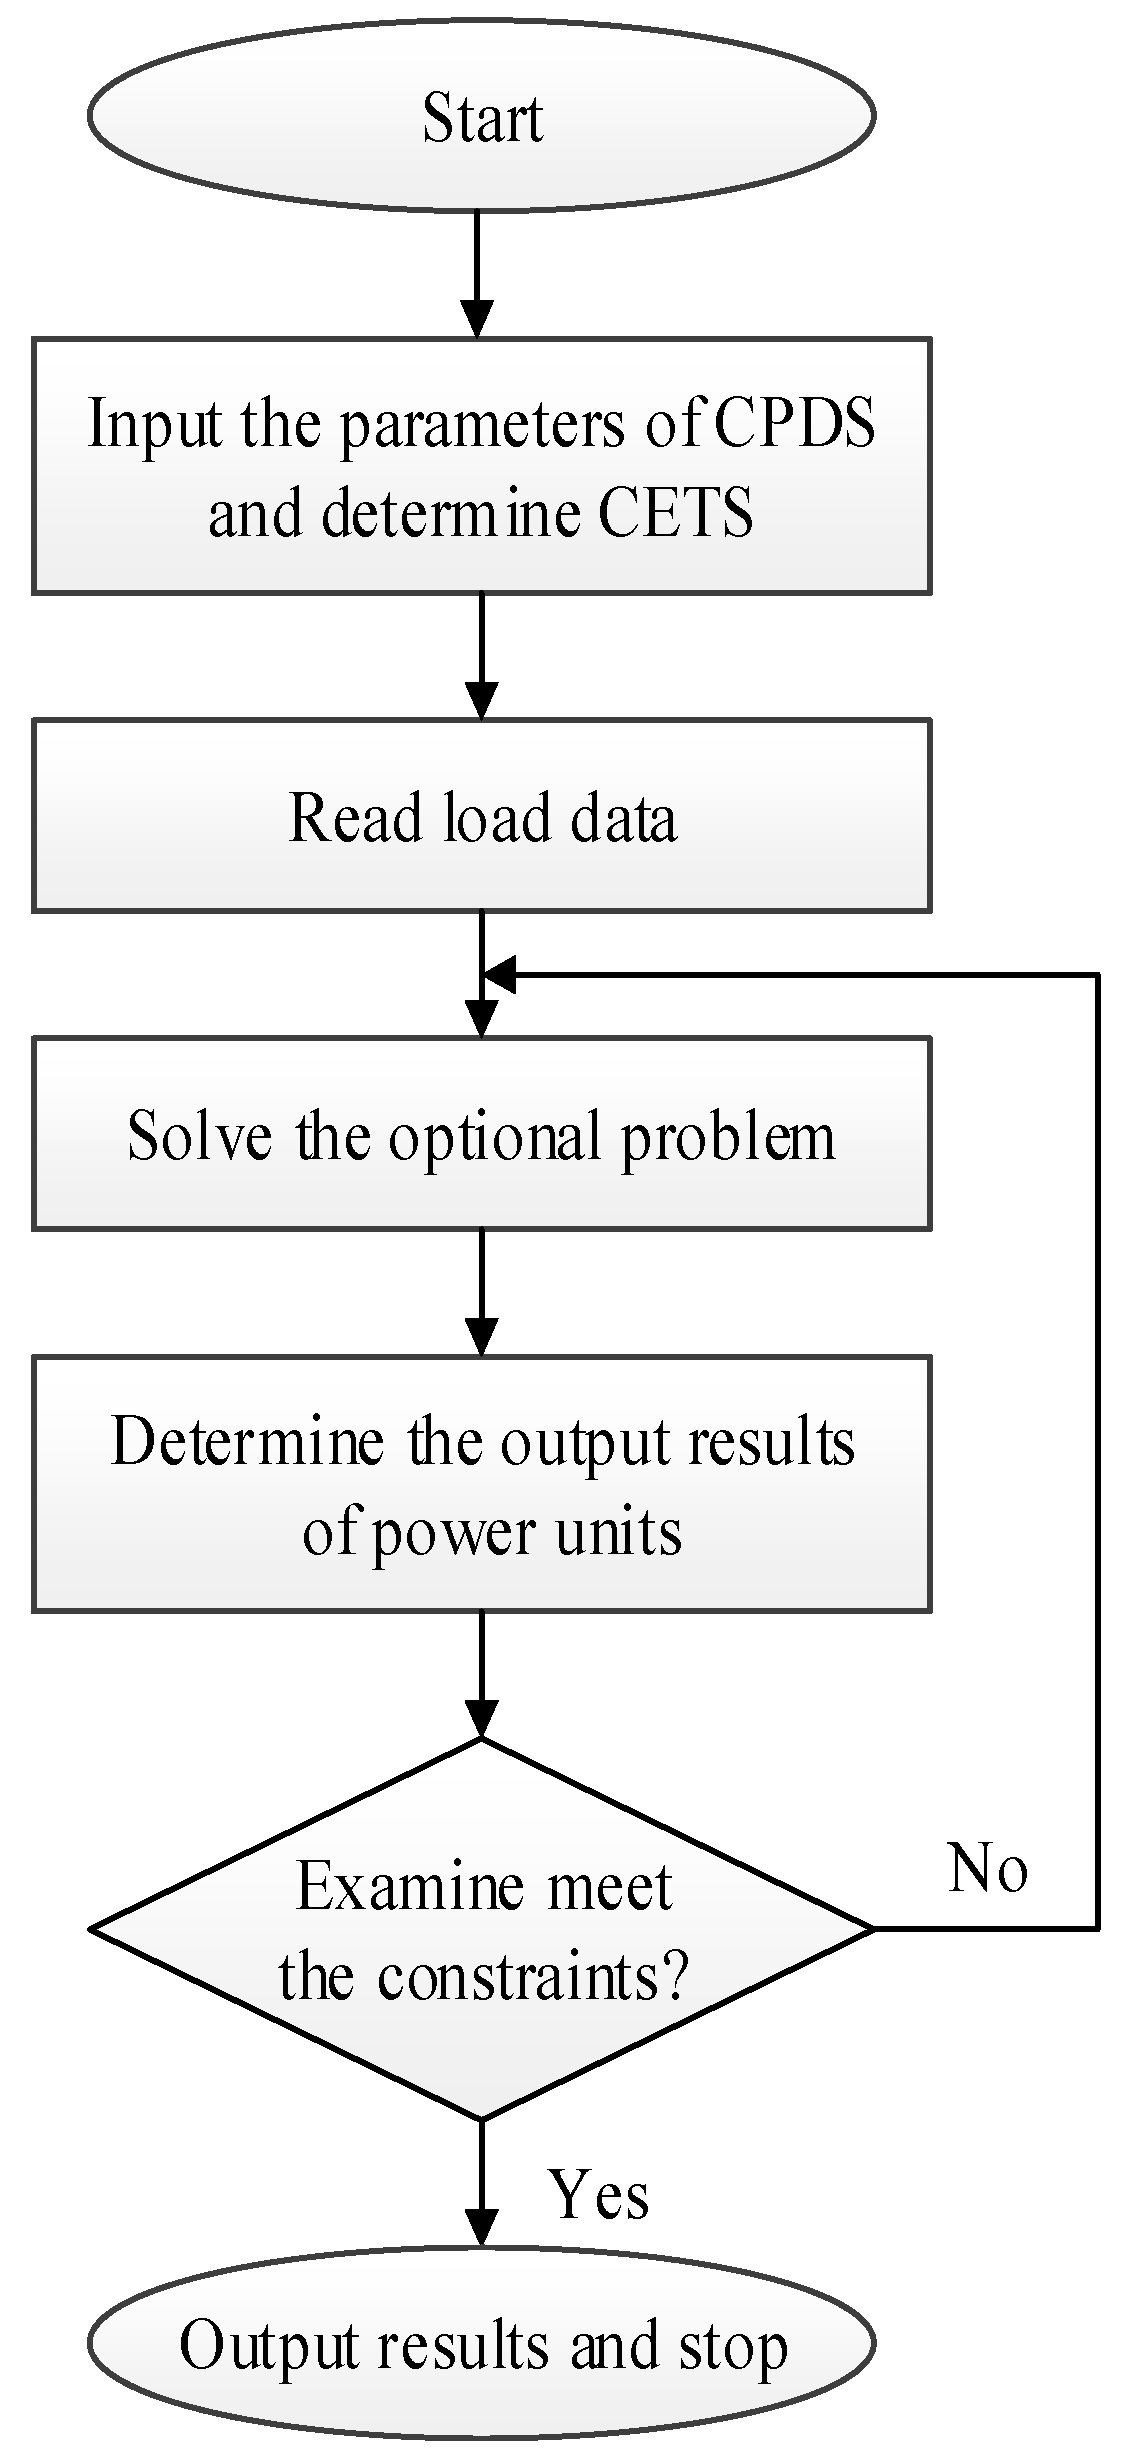
Figure 3.
The power generation and carbon emissions flow of CPDS.

Figure 4.
The generating proportion of different units.
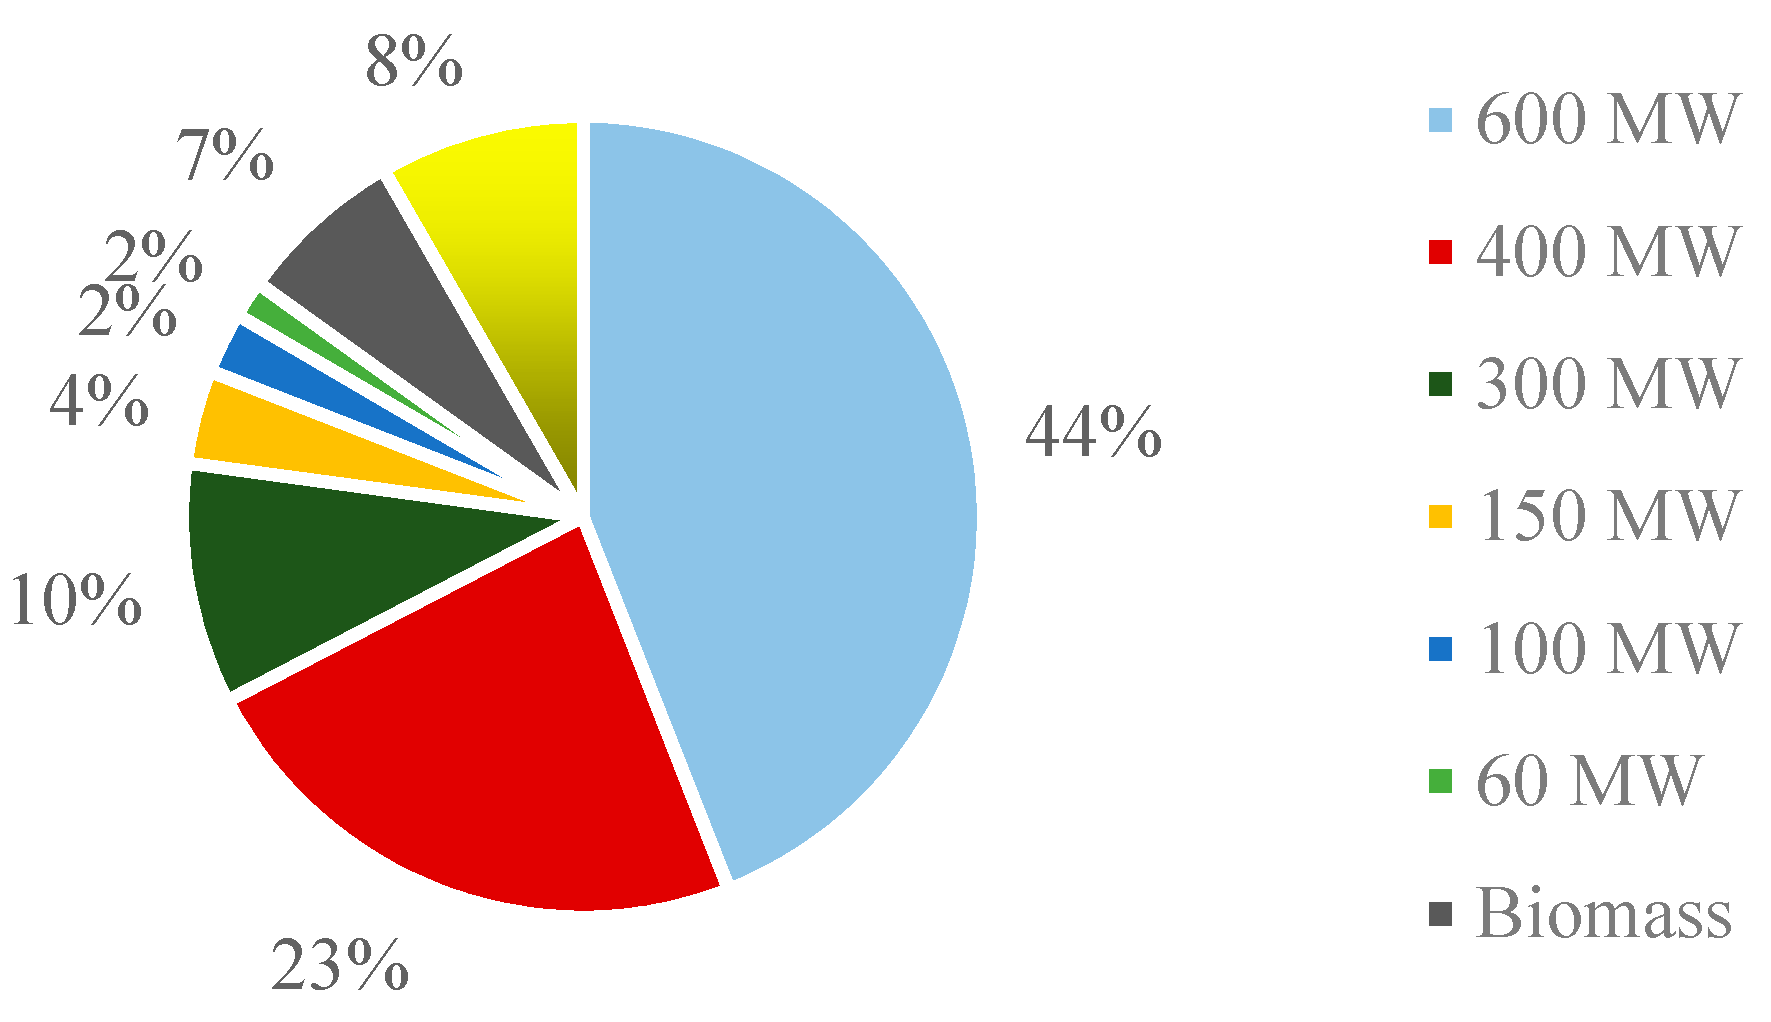
Figure 5.
Power curves of different units.
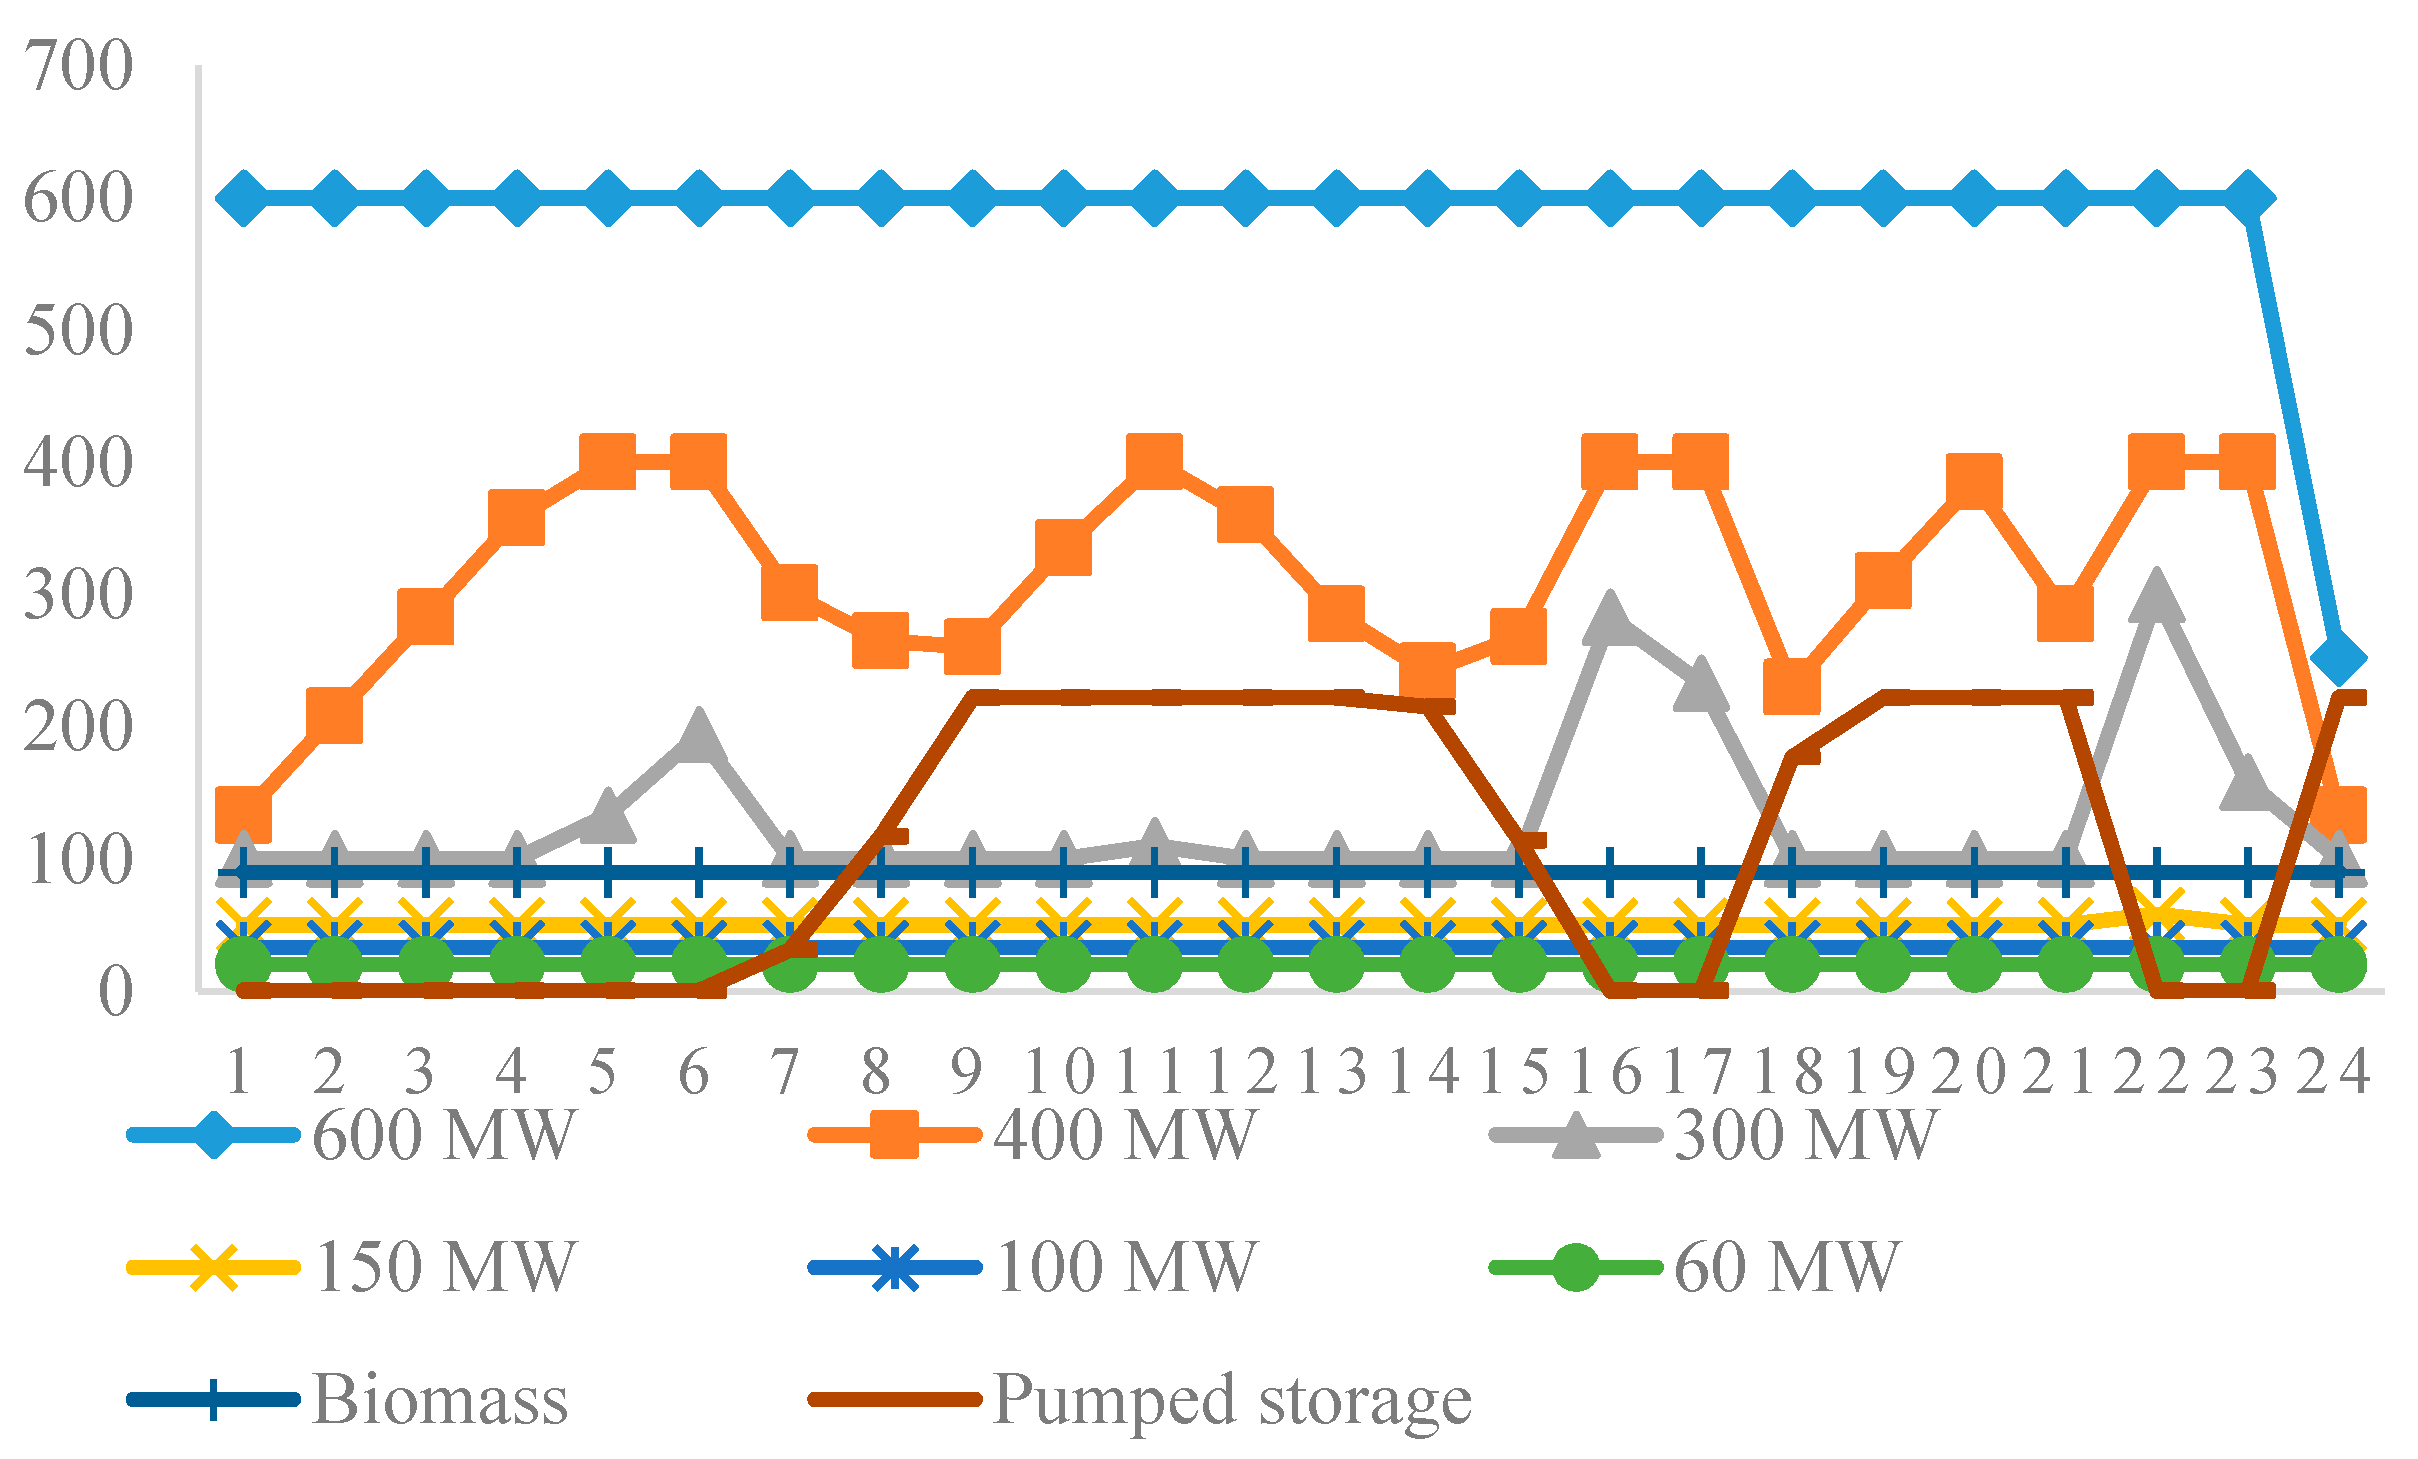
Figure 6.
The comparative results between thermal-only units and the basic system.
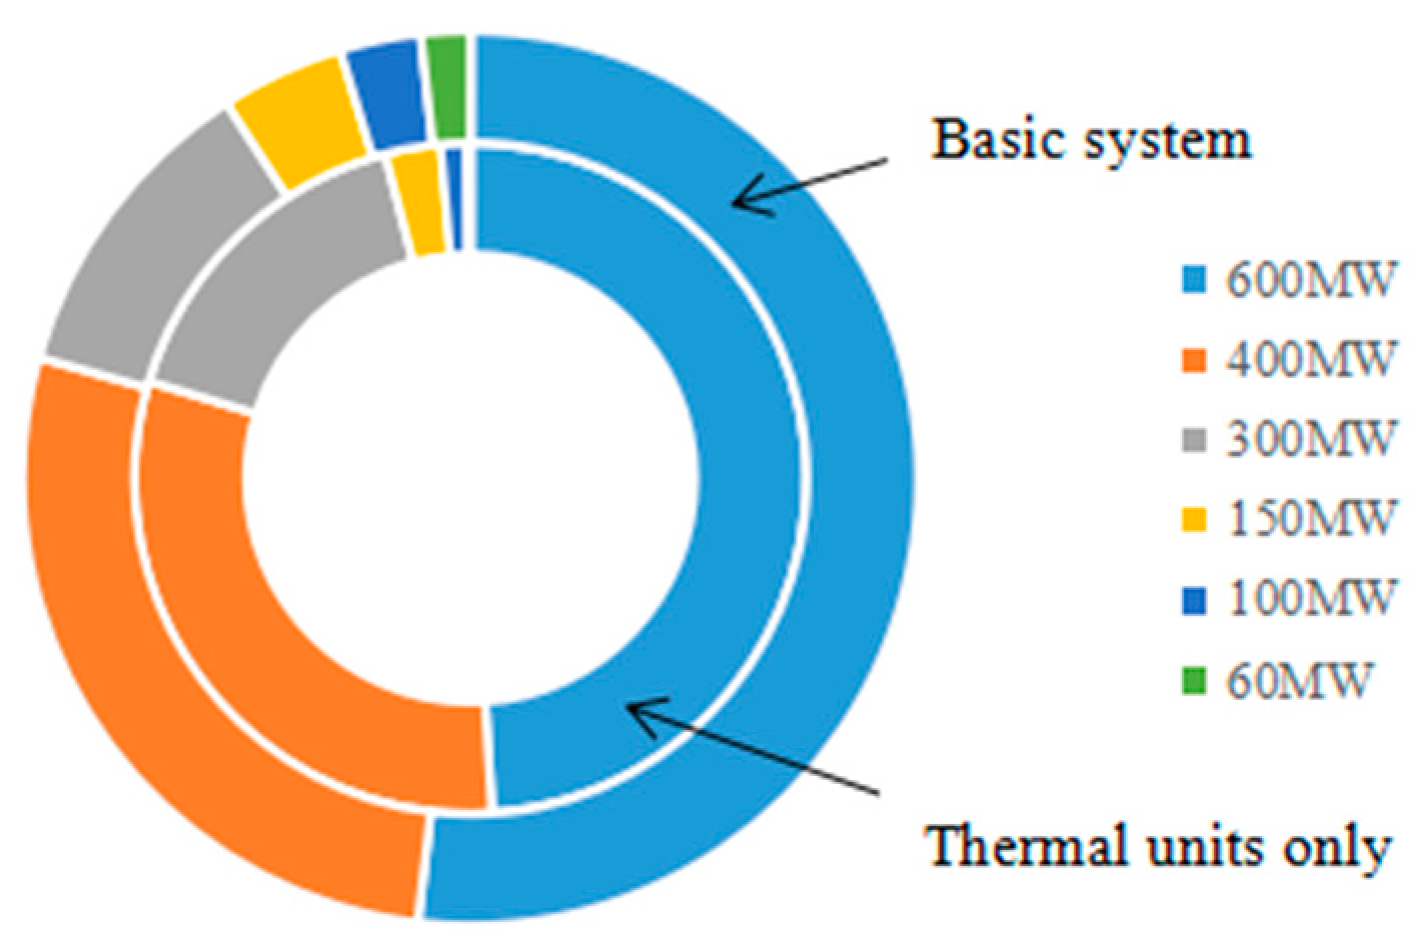
Figure 7.
The thermal units’ operating status in both situations. (a) Thermal units’ and biomass units’ dispatching system; (b) basic dispatching system.
Figure 7.
The thermal units’ operating status in both situations. (a) Thermal units’ and biomass units’ dispatching system; (b) basic dispatching system.

Figure 8.
The real-time output of the pumped storage unit in the basic dispatching system.

Figure 9.
Total power output of units with different carbon scenarios.

Table 1.
The generator set of dispatching system (MW).
| Type | Thermal Power | Biomass Power | Pumped Storage | ||
|---|---|---|---|---|---|
| Installed capacity (MW) | 600 | 400 | 30 | 300 | |
| 300 | 150 | 30 | |||
| 100 | 60 | 30 | |||
| Electric tariffs ($/MW·h) | 55.10 () | 108.75 () | 55.10() | 105,850 $/MW () | |
| Fuel cost ($/t) | 123.25 () | 43.50 () | 41.33 $/MW·h () | ||
Table 2.
A typical day’s system load data (MW).
| Period | Load | Period | Load | Period | Load |
|---|---|---|---|---|---|
| 1 | 775 | 9 | 1375 | 17 | 1175 |
| 2 | 850 | 10 | 1450 | 18 | 1300 |
| 3 | 925 | 11 | 1525 | 19 | 1425 |
| 4 | 1000 | 12 | 1475 | 20 | 1500 |
| 5 | 1075 | 13 | 1400 | 21 | 1400 |
| 6 | 1150 | 14 | 1350 | 22 | 1250 |
| 7 | 1225 | 15 | 1275 | 23 | 1100 |
| 8 | 1275 | 16 | 1225 | 24 | 900 |
Table 3.
Parameters of thermal power and biomass power units.
| Units | × 105 | × 105 | ||||||
|---|---|---|---|---|---|---|---|---|
| 600 MW | 11.71 | 0.274 | 0.644 | 29.04 | 0.680 | 1.60 | None | |
| 400 MW | 8.48 | 0.297 | 1.84 | 21.54 | 0.754 | 4.67 | ||
| 300 MW | 6.17 | 0.308 | 3.66 | 15.8 | 0.788 | 9.37 | ||
| 150 MW | 3.54 | 0.332 | 4.15 | 9.35 | 0.876 | 10.96 | ||
| 100 MW | 1.43 | 0.337 | 9.01 | 3.82 | 0.900 | 24.06 | ||
| 60 MW | 0.67 | 0.345 | 11.02 | 0.88 | 0.9084 | 27.13 | ||
| 1# | None | 1.1 | 0.776 | |||||
| 2# | 1.2 | 0.776 | ||||||
| 3# | 1.3 | 0.776 | ||||||
Table 4.
Factors analyzed in scenario analysis.
| Types | Generator Policy | Carbon Trading Conditions |
|---|---|---|
| 1 | Basic power units | Basic, Conservative, Positive, Aggressive |
| 2 | Thermal units only | Basic trading system |
| 3 | Thermal + biomass | Basic trading system |
| 4 | Thermal + pumped storage | Basic trading system |
Table 5.
The thermal power comparative results in both situations.
| System | Thermal Power Units Output (MW·h) | Carbon Trading Volume (t) | Coal Consumption (t) |
|---|---|---|---|
| Thermal only | 29,400 | 23,811 | 9449 |
| Basic | 27,084 | 20,413 | 8737 |
Table 6.
The power output comparative results in both situations.
| System | Thermal Power (MW·h) | Biomass Power (MW·h) | Pumped Storage Power (MW·h) | Total Profit ($) |
|---|---|---|---|---|
| Thermal and biomass | 27,240 | 2160 | Not considered | 555,975.53 |
| Basic | 27,084 | 2160 | 2652 | 659,278.75 |
Table 7.
The comparative results of power output structure of thermal power units (MW·h).
| Dispatching System | 600 MW | 400 MW | 300 MW | 150 MW | 100 MW | 60 MW | Total Output |
|---|---|---|---|---|---|---|---|
| The absence of biomass units | 14,142 | 8696 | 3753 | 1376 | 792 | 480 | 29,239 |
| Basic system | 14,052 | 7441 | 3111 | 1208 | 792 | 480 | 27,084 |
Table 8.
Different scenario settings.
| Scenarios | Conservative | Neutral | Positive | Aggressive |
|---|---|---|---|---|
| Free quota (%) | 97 | 90 | 90 | 80 |
| Carbon price ($/t) | 7.25 | 14.50 | 29.00 | 14.50 |
Table 9.
Dispatching system optimized results under different scenarios.
| Scenarios | Carbon Emissions (kg/MW·h) | Coal Consumption (kg/MW·h) | Output (MW·h) | Profit ($) |
|---|---|---|---|---|
| BAU | 640 | 274 | 31,896 | 659,278.75 |
| Conservative | 644 | 276 | 31,645 | 672,477.23 |
| Positive | 640 | 274 | 31,896 | 651,589.835 |
| Aggressive | 640 | 274 | 31,896 | 627,284.645 |
© 2017 by the authors. Licensee MDPI, Basel, Switzerland. This article is an open access article distributed under the terms and conditions of the Creative Commons Attribution (CC BY) license (http://creativecommons.org/licenses/by/4.0/).
Share and Cite
MDPI and ACS Style
Tan, Q.; Ding, Y.; Zhang, Y. Optimization Model of an Efficient Collaborative Power Dispatching System for Carbon Emissions Trading in China. Energies 2017, 10, 1405. https://doi.org/10.3390/en10091405
AMA Style
Tan Q, Ding Y, Zhang Y. Optimization Model of an Efficient Collaborative Power Dispatching System for Carbon Emissions Trading in China. Energies. 2017; 10(9):1405. https://doi.org/10.3390/en10091405
Chicago/Turabian StyleTan, Qinliang, Yihong Ding, and Yimei Zhang. 2017. "Optimization Model of an Efficient Collaborative Power Dispatching System for Carbon Emissions Trading in China" Energies 10, no. 9: 1405. https://doi.org/10.3390/en10091405
Note that from the first issue of 2016, this journal uses article numbers instead of page numbers. See further details here.