Abstract
The rapid growth of mobile communication technology and the corresponding significant increase in the number of cellular base stations (BSs) have increased operational expenses (OPEX) for mobile operators, due to increased electricity prices and fossil fuel consumption. Thus, identifying alternative solutions to reduce OPEX has become a major priority of mobile operators. Solar energy is considered an economically attractive and eco-friendly option. This paper examines solar energy solutions for different generations of mobile communications by conducting a comparative analysis of solar-powered BSs based on three aspects: architecture, energy production, and optimal system cost. In addition, the economic feasibility of the solar energy solution compared with conventional sources is discussed. The simulation results suggest that solar-powered BSs would be a suitable long-term solution for the mobile cellular network industry.
1. Introduction
To date, mobile communication is considered one of the most significant technological innovations of modern history. Thus far, four generations of mobile communication systems have been adopted. The first generation (1G) had many disadvantages and is no longer available today [1]. Notably, the number of mobile subscribers has increased dramatically over the years given the enormous development and rapid growth of this technology. In Q3 2016, the total number of mobile subscribers in South Korea was more than 60.8 million distributed among the four major mobile operators: the operator SK has reached approximately 26.7 million, the operator KT is in second place with 15.6 million, the operator LG U+ is number three with 11.9 million, and the operator MVNO has 6.6 million [2]. Figure 1 shows the classifications of the mobile subscribers connection based on different mobile generations. As fourth generation (4G) technology offers high data rates for executing various data-oriented services, such as online gaming, multimedia, and high-quality video streaming, the number of 4G mobile subscribers ranks first compared to the users of other mobile technologies. Consequently, the number of 4G base stations (BSs) has significantly increased compared to other mobile generations, as shown in Figure 2 [3]. Since BSs are considered the key element of energy consumption in cellular networks [4,5], the operational expenses (OPEX) for mobile operators has significantly increased due to the significant percentage of payments allotted to electricity [6,7], which is prompting researchers, vendors, and mobile operators to look for ways to improve the energy efficiency of mobile networks. The green communication initiative aims primarily to increase the energy efficiency of BSs, reduce OPEX, eliminate greenhouse gases, and ensure the evolution capability of BSs in the future [4,5].
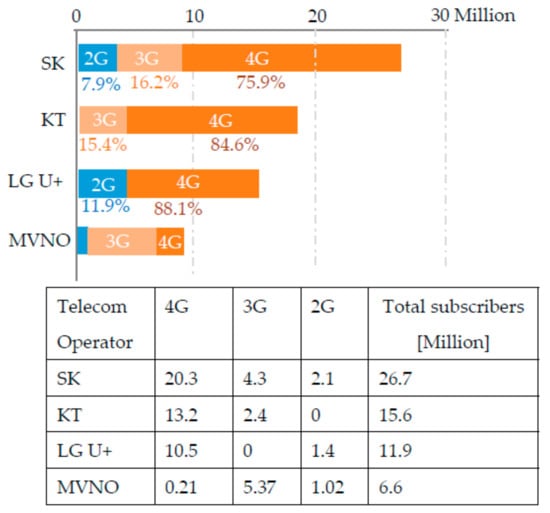
Figure 1.
Mobile subscribers by operator in South Korea (Q3 2016) [2].
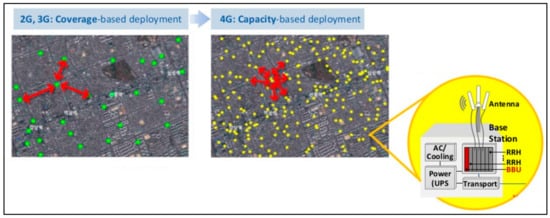
Figure 2.
Realistic deployment of 2G, 3G, and 4G base stations (BSs) [3].
Two approaches were adopted to reduce the OPEX and environmental effects of BSs: (i) regarding energy efficiency, the performance of the majority of the components employed in current BS architecture is unsatisfactory. For instance, power amplifiers (PAs) consume the largest amount of energy in BSs, and most of the input energy is dissipated in the form of heat. Thus, improving the energy consumption of the components in cellular BSs is the focus of the first approach. A significant amount of energy can be saved if more energy-efficient components are employed. However, such an approach incurs high implementation costs [5]; (ii) the second approach features the intelligent management of network elements using data on traffic load variations [7,8]. If data traffic is low, certain elements of the network, such as signal processing units, PAs, cooling equipment, and the entire BS, are switched off. This is a popular technique for improving the energy efficiency of BSs based on data traffic load variations. However, a minimum number of BSs must remain active to support the network’s basic operations [5]. This technique cannot be implemented when the data traffic demand is high, even though it can be easily implemented using the current architecture and does not require any hardware replacement.
High data traffic is usually observed during daylight hours. Thus, cost effectiveness, efficiency, sustainability, and reliability, which are key features of power source requirements for BSs, can be achieved via the exploitation of available energy from solar resources. This is considered a long-term ideal solution for cellular network operators. Moreover, because it is freely available, sunlight is an ideal alternative that can reliably supply power to remote areas. However, designing a solar system requires a feasibility assessment, which can mitigate any poorly designed power supply system, especially those that can inefficiently power a BS. Network operators must also carefully consider the operational and economic aspects before implementing a solar-powered BS.
Today, optimization algorithms and neural network technologies are used in many areas, to find optimal solutions with the lowest cost. A number of studies of green energy systems have been published that have used different optimization models. Ou and Hong [9] examined the performance of a proposed standalone hybrid system consisting of a wind generator and photovoltaic (PV) system to extract the maximum power from wind and PV energy sources and balanced by a fuel cell (FC) system. A general regression neural network with an improved particle swarm optimization algorithm was applied to analyze the performance of the PV generation system. The validity of the developed model was demonstrated through simulation of the proposed algorithm by using MATLAB/Simulink (MathWorks corporate, Natick, MA, USA). Eltamaly and Al-Shamma’a [10] discussed a design, simulation, assessment, and selection of optimum autonomous hybrid renewable energy configuration out of three different configurations included PV, wind, and battery. A genetic algorithm has been used to calculate the optimum sizing for each component at different configurations of the hybrid system for minimum cost and high reliability. Reference [11] discussed apply a hybrid bird-mating optimization approach to connection decisions of distribution transformers. The authors have evaluated the effectiveness of the proposed approach by a comparison to other existing optimization methods such as genetic algorithm (GA), particle swarm optimization (PSO). Reference [12] proposed an algorithm for microgrid distribution ground fault, and discussed the ground fault model of a battery energy storage system. The results shown that the proposed algorithm is robust and accurate. An approach using intelligent damping controller for the static synchronous compensator optimization is proposed in [13] for damping the oscillations of the power system integration of an offshore wind farm and a seashore wave power farm, linking to a hybrid power multi-system. In [14,15], a hybrid solar-grid (or solar-diesel) power system achieved higher energy savings than a purely solar-powered system or traditionally powered grid system over a 10-year period in different southern European cities (e.g., Torino in Italy) and in locations close to the tropics (e.g., Aswan in Egypt). A framework for estimating the probability of power outages in solar-powered cellular BSs in San Diego, USA, and Jaipur, India, was proposed in [16], which analyzed the harvested solar energy, BS load, and battery levels as discrete-time Markov processes. To demonstrate its effectiveness, the proposed model was then compared with simulation results using empirical datasets for solar energy and load data. A framework for avoiding power outages and improving the quality of service (QoS) of a network for off-grid solar-powered BSs was proposed in [17]. Actual BS deployment data and solar energy datasets were used in the evaluation, which demonstrated that the proposed framework outperformed existing benchmarks in terms of reducing power outages and ensuring good delay performance. Giuseppe et al. [18] proposed two discrete-time Markov chain models to achieve the capacity of the solar power (PV panel size and battery capacity) supply of an long term evolution (LTE) macro BS in southern and northern Italy and found that the seasonal behavior significantly influences the sizing process. Therefore, both the irradiance and battery charge must be carefully selected. Off-grid hybrid systems based on the integration of hydrogen technologies into battery and wind/solar power technologies were proposed in [19] to meet the energy requirements associated with remote telecommunications BSs in the UK. A hybrid configuration of hydrogen and battery technologies can continuously transfer power from an off-grid PV or wind power source to a telecommunications BS. Despite the use of fuel cell-based technology and the integration of various components, the models proposed in the literature have only exhibited acceptable stability and reliability levels. A hybrid solar–hydrogen system (hybridized with batteries) was tested in [20] to determine its remote telecommunications application potential in Eureka, Canada, which typically experiences extremely cold temperatures. A case study using a 2 kW polymer electrolyte membrane FC was then conducted to test if the proposed model could fulfill the load requirements for a telecommunications BS. In South Korea, the performance of solar-powered LTE BSs was analyzed in [21], which found that these stations could save up to 48.6% OPEX compared with that of a DG system. A PV/WT (wind turbine) hybrid power system for LTE BSs was examined in [22]; the findings of this study indicated that this hybrid system could save up to 48.52% OPEX compared with that of a DG system. Therefore, the use of solar-powered BSs is a cost-effective option for cellular network operators. Table 1 summarises the relevant references have discussed similar projects performed in different countries.

Table 1.
Similar projects performed in different countries.
This study examines the feasibility of using solar power solutions as the main power sources to supply the energy requirements of cellular BSs. Several BSs are considered according to the different generations of mobile communication technologies. Moreover, a comparative analysis of the various cases is conducted, as the generation of solar energy depends on several factors, including solar radiation, sunlight intensity, and solar panel geolocation, among others. Given that South Korea is located at a latitude between 34° N and 38° N, it is considered an excellent location for solar energy generation, with an average daily solar radiation ranging from 2.474 kWh/m2 in December to 5.622 kWh/m2 in May [31]. The key contributions of this study are summarized as follows: (a) determining the optimal size and technical criteria for a stand-alone solar system that ensures energy autonomy and a long-term energy balance for various generations of the mobile BSs based on the daily solar radiation exposure in South Korea; (b) analyzing and evaluating the feasibility of using a stand-alone solar system in terms of the energy and economic yields to ensure both sustainability and cost effectiveness and (c) evaluating the implications of choosing a stand-alone solar power system compared to conventional sources, such as the electrical grid or a diesel generator in terms of OPEX savings.
The analysis of solar power systems can be challenging because of the large number of design options and the uncertainty of key parameters. Moreover, solar radiation adds further complexity, as it may be intermittent, seasonal, and uncertain. The hybrid optimization model for electric renewables (HOMER) was designed to overcome these challenges. Thus, the optimal design and system efficiency, costs, and energy production were simulated in this paper using the HOMER.
The remainder of this paper is organized as follows. Section 2 presents the system model. Section 3 discusses the HOMER optimization model, the optimization formula, methodology, and system configurations. Section 4 discusses and presents a comparative analysis of various solar-powered BSs. The economic feasibility of the solar system is provided in Section 5. Conclusions and recommendations are presented in Section 6.
2. System Model
The system model contains two main subsystems, the telecommunication load and solar power system, as shown in Figure 3. Details on these subsystems are provided in the following subsections.
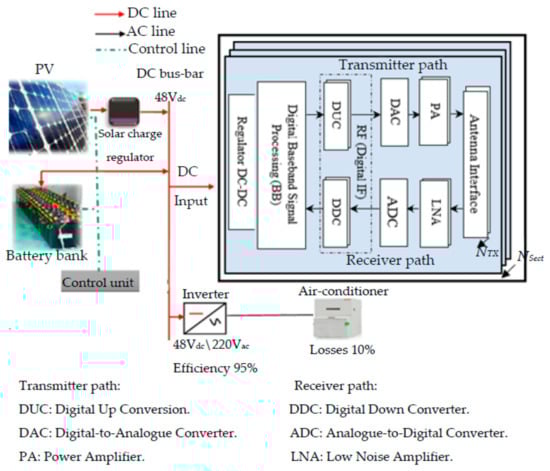
Figure 3.
Schematic for the solar-powered BS.
The control unit monitors the process of output power of the solar system and required power to the cellular base station, and the decision will be one of the following cases:
- Case 1 (normal case): The solar panels feed the required energy to the cellular base station, and store excess energy in a battery bank (charge status) to be used at night or when the power output of the solar panels is not sufficient to cover the load.
- Case 2 (power output of the solar panels is not sufficient to cover the load): in case of a malfunction of the solar panels, or in an inability to provide the energy required to the cellular base station, the battery bank compensates for the shortage of energy. Moreover, the battery bank can supply the cellular base station autonomously at least 3 days, before reaching the maximum depth of discharge (DOD).
- Case 3 (power output of the solar panels and battery bank is not sufficient to cover the load): If the battery bank reaches its maximum DOD and loses the ability to supply the cellular base station the required energy, a backup system (public electrical grid in an urban area or a diesel generator in a rural area) supplies energy to the cellular base station. However, this is a rare case because the solar array can cover the load independently. Moreover, if the solar panels fail to support the cellular base station, the battery bank can supply the cellular base station autonomously at least 3 days, before reaching the maximum DOD; which is considered to be a sufficient time to fix the solar panels.
However, the backup system is suggested as a backup power source to secure the power supply during maintenance. The alternating current (AC) loads are fed directly from the backup system, and the direct current (DC) load feed occurs via a converter (AC\DC).
A solution to the problem associated with asymmetrical faults and imbalances has been discussed in details by Bukhari et al. [32]. The authors proposed integrating a standard current regulated voltage source inverter in parallel to the load and utility mains, so any asymmetrical fault or imbalance can be avoided for sensitive loads. The proposed technique avoids interruption of the power supply during the faults and provides instant protection to critical loads with high power regulating and conditioning capabilities. An unsymmetrical faults analysis method with hybrid compensation was proposed in [33].
2.1. Telecommunication Load
A BS site typically comprises power-consuming equipment, which can be divided into two groups, as shown in Figure 3. The first set of equipment is used in each sector, and consists of the DC-DC regulator, which is the PA that amplifies the transmitted signal, the digital signal processing unit responsible for system processing and coding, and the transceiver, which is responsible for receiving and sending signals from/to mobile stations [34,35]. Comprehensive details on the components of BS components are provided in past works [34,36]. Given that a BS has multiple sectors and antennas, the power consumption of such components must be multiplied by the number of transmitting antennas (NTX) and the number of sectors (NSect) [37]. The second group of equipment, which is common to all sectors, includes the air conditioning units [35]. Notably, the power consumption by the air conditioner and the DC-DC regulator scale linearly with the power consumed by other components [34,38].
The energy efficiency of BS components is constantly improving due to the rapid technological advancements in this field. However, the power consumption of one BS may vary from one cellular generation to another [39]. Figure 4 shows the power consumption of typical cellular macro-BSs for the different cellular generations currently in use. A BS refers to Node B and evolved Node B (eNode B) in 3G and 4G systems, respectively. The nomenclature n/n/n refers to a three-sector site that has n antenna per sector. For example, 2/2/2 indicates that a BS consists of three sectors with two antennas each.
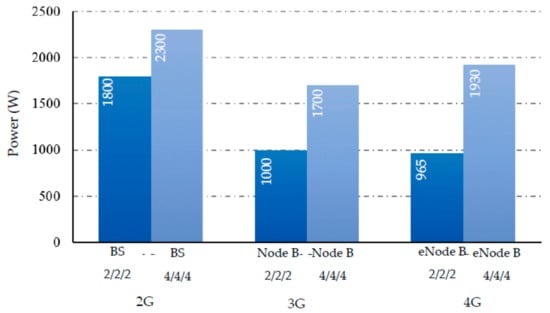
Figure 4.
Total power consumption for common cellular macro-BSs from different cellular generations [34,39,40].
Notably, the fifth generation (5G) technology is rapidly coming into the limelight, and commercial 5G mobile wireless networks are expected to be deployed by 2020. The 5G technology will soon fulfill many requirements, of which delivering high network energy performance is the most critical. This feature is crucial to reduce operational cost and provide network access in a sustainable and resource efficient manner. High energy performance requires a fundamental change in design principles and implementation practices within the mobile telecom industry. 5G will be energy efficient and the power consumption by the base station will decrease significantly.
2.2. Key Components of the Solar System Model
2.2.1. Photo Voltaic
PV panels absorb and convert shortwave solar irradiance into DC electricity to charge batteries and operate BSs. A 1-kW PV panel typically has a 5 m2 area, and the lifetime of a typical PV panel may exceed 25 years [41]. The power generated by a PV panel can be influenced by several factors, such as the DC rating of the PV panel, the tilt angle of the PV panel, and the geographic location or solar irradiation profile of the site at which the panel is located [21]. Large-scale applications typically use PV cells based on mono- and polycrystalline silicon. PV panels with a DC rating of 1 kW are priced at approximately $1000 [21].
2.2.2. Battery
If the available solar energy is insufficient to completely meet the BS load demands or during load-shedding hours at night, a battery bank may be used to store excess electricity for consumption by a BS. The inclusion of a charge controller is recommended to protect the battery. A charge controller or battery regulator limits the rate at which the electric current is added to or drawn from electric batteries, which in turn helps prevent overcharging and potentially protects against overvoltage. These two phenomena can reduce battery performance or lifespan and thus pose a safety risk. Depending on the battery technology, a charge controller can also prevent complete battery draining (“deep discharging”) or perform controlled discharges to protect battery life [42].
2.2.3. Inverter
An inverter is a main element of the system that changes a low DC voltage into usable 220 V AC voltage. Different types of inverters are classified based on installation type, output power, and output wave format. Inverters are called power conditioners, because they change the form of the electric power. Output wave format can be grouped into two categories: modified sine wave and pure sine wave. Unlike others, sine-wave inverters are more sophisticated because of their high-quality performance, and their ability to operate virtually any type of load. Specifically, modified sine wave (MSW) inverters are economical and efficient [42].
3. The Hybrid Optimization Model for Electric Renewables Optimization Model and Problem Formulation
The configuration of the system is studied when designing a solar power system in terms of the following. What components must be included in the system design? How many components must be used, and what is the size of each component? Selecting from numerous technology options and various energy resources is difficult. The HOMER was developed by the U.S. National Renewable Energy Laboratory to simplify the task of designing solar systems and evaluating the maximum number of possible system configurations [43]. The optimal solar system with the lowest net present cost (NPC) is determined using the HOMER micropower optimization model. The NPC includes all incurred costs and revenues during the project lifetime in which the future cash flows are discounted to present values using the discount rate. Specifically, the NPC includes the cost of any component replacements incurred within the project lifetime, the initial capital cost of the system components, and the overall maintenance. Any revenue (salvage value) at the end of the project lifetime reduces the total NPC [43]. The objective function for the system optimization and constraints, methodology of the optimization model, and configurations of the solar system are presented in the following subsections.
3.1. Objective Function and Constraints
The total annualized cost (Cann_tot) represents the annual cost of the project in ($/year), includes the initial costs (), replacement costs (), and O & M costs (, and is expressed mathematically as:
On the other hand, total annualized cost can be defined as the annualized value of the total net present cost, and is expressed mathematically as:
The capital recovery factor (CRF) converts a net present cost (CNPC) into a flow of equal annual payments over a specified time, and calculates this value based on the annual interest rate (i) and number of years (N), and is expressed mathematically as:
The CNPC represents all the costs that occur within the project lifecycle, with future cash flows discounted to the present using the discount rate. NPC includes the initial costs (IC), replacement costs, and O & M costs. Besides, salvage value that occurs at the end of the project lifetime that reduces the total NPC. The salvage value (S) is the value remaining for each component after a project’s lifetime is completed and is computed using:
where Rcomp is the lifetime of the component (years), Rrem is the remaining lifetime of the component (years), and Crep is the replacement cost of the component ($). For example, the project lifetime is 10 years and PV lifetime is 25 years, the salvage value of the PV at the end of the project lifetime will be (Rrem 15 years/Rcomp 25 years) of its replacement cost.
To clarification Equation (2), the annual interest rate i = 1.25% and the number of years N = 10 years, the CRF is equal to 0.107. Suppose that NPC is $1000 at 1.25% interest could therefore be paid back with 10 annual payments of $107 ($1000 × 0.107). The present value of the ten annual payments of $107 is $1000.
This study examines an optimal design of a stand-alone solar system with the objective of minimizing the total system cost NPC, based on different constraints. The NPC objective function for system optimization based on Equation (2) is:
which is subject to:
0 < EPV,
Eannual-demand < EPV,
EBattery + EPV = EBS + ELosses.
- (i)
- The energy output of the PV array (EPV) must always be positive as given in Equation (6) and must be at least 10% of the total annual demand (Eannual-demand). The factors influencing the solar energy generation are the peak capacity of the PV array (YPV) in kW, the peak solar hour (PSH) in hours, and PV efficiency, which represents the relationship between the target yields (fPV) and the actual target. The mathematical modeling in HOMER calculates the total annual energy contribution of the solar array [43] and is expressed as:EPV = YPV × PSH × fPV × 365 day/year.
- (ii)
- To ensure a balance between demand and production power, the energy production of the sources (PV array and battery [EBattery]) should cover the needs of the BS (EBS) plus the losses (ELosses) incurred by a DC-DC regulator, inverter, and active cooling.
The discharging and charging limits of a battery depend on its power rating and vary between the values (Pmin, Pmax), where Pmin is the minimum state of charge and Pmax is the maximum state of charge of the battery, which is also the nominal capacity of the battery bank. Moreover, the DOD, efficiency, days of autonomy (AB), and lifetime of the battery (LB) are important, as they significantly affect the system’s total cost.
The DOD refers to the maximum energy delivered from the battery and is defined using equation [43]:
where SOCmin is the lower limit provided in the battery datasheet so that the battery does not discharge below the minimum state of charge.
In case of a PV array malfunction, the battery bank feeds the required energy load. Thus, the battery bank autonomy (Baut) is a critical factor representing the potential number of days that the battery bank can supply the required energy load without any PV array contribution. This value is expressed as the ratio of the battery bank size to the BS load [43]:
where BV is the nominal voltage of a single battery in V, Nbat is the number of batteries in the battery bank, LBS is the average daily BS load in kWh, and BQ is the nominal capacity of a single battery in Ah.
Meanwhile, battery lifetime can minimize the total replacement cost during a project’s lifecycle. Here, the battery float life and the throughput are the main factors affecting the battery lifecycle. Using HOMER, the battery lifecycle is calculated [43] based on:
where Rbatt,f is the battery float life in years, Qthrpt is the annual battery throughput in kWh, and Qlifetime is the lifetime throughput of a single battery in kWh.
The number of batteries in series is equal to the DC bus-bar voltage (Vb−b) divided by the voltage rating (BV) of one of the batteries selected:
The number of parallel paths is obtained by dividing the total number of batteries by the number of batteries connected in series.
3.2. Methodology
Figure 5 summarizes the optimization methodology to identify the optimal solar system with the lowest NPC [44]. Simulation settings are initially required and include the following: (i) component configurations: range of sizes, cost data (e.g., capital, replacement, and operation and maintenance (O & M) cost), efficiency, lifetime, and technical restraints for every component of the solar system and (ii) system configurations: annual time-series data for the load demand, economic input (annual interest rate), solar irradiation, technical restraints, and project lifetime. Then, HOMER initiates the hourly simulation of every possible configuration, uses the PV array (PPV) to compute the available power, compares it with the electric load (PLoad) and losses (PLosses), and finally decides how the additional power should be generated during deficits (battery discharging) or how the surplus power should be managed in times of excess (battery charging). Finally, HOMER organizes the feasible combinations based on the NPC, which represents the lifecycle cost of the system before selecting the optimal system based on the lowest NPC.
Figure 5.
Flowchart of the optimization process.
3.3. Configuration
Subject to the constraints of the dispatch strategy chosen in the simulation and a set-point of 80%, HOMER decides to meet the power requirements at the lowest cost for each time step. The system must be able to supply electricity to the BS, and the losses incurred over each hour are added. In the present study, the backup power requires 10% of the hourly load requirement, even with a sharp 10% decrease in the solar energy output, to retain sufficient spare capacity to serve the load within an hour. The ten-year lifetime of the project represents the lifetime of typical BS equipment [45]. The annual real interest rate in South Korea used here is 1.25% as of March 2017 [46]. Configuration details are provided in Table 2.
Table 2.
The hybrid optimization model for electric renewables (HOMER) simulation setup.
4. Comparative Analysis of Various Solar-Powered Base Stations
The optimal design of the solar system must satisfy the BS requirements for energy and system losses. The optimal size of the solar system clearly is related to the load demand. Using Equation (9), the annual energy contribution of the solar system is computed, with the results showing that the annual energy is related to the size of the PV array (YPV) for a PV efficiency of 85% and a peak solar time of 4.01 h. However, the tracking system increases the total amount of energy produced by a solar power system by approximately 20–30% [49]. In general, a large solar system can provide a high annual energy contribution. However, the cost of the solar system is highly dependent on the size of the system’s components. Thus, the size of the solar power system must be carefully considered.
The overall cost of a solar power system comprises several items: (i) the initial capital (IC) cost, which is paid at the beginning of the project and is proportion to the system’s components and their sizes; (ii) the O & M cost, which is paid annually and is mostly allotted for operating and maintaining the battery bank; (iii) replacement costs and (iv) the NPC, which refers to the total cost incurred over its lifetime minus the total revenue earned over its lifetime (also known as the “salvage value”) and is computed by obtaining the sum of the total discounted cash flows for each year of a project’s lifetime using the simple formula: IC + replacement + O & M—salvage value = NPC.
On a yearly basis, the simulation is performed using HOMER. The inputs include the load demand, solar irradiance, as well as the technical and economic specifications, as described in Table 2. The results of the various solar-powered BSs are analyzed and compared in the following subsections. In addition, the comparative analysis of the solar-powered BSs for different mobile communications generations is summarized in Table 3.
Table 3.
Summary of optimal criteria for the solar-powered base stations (BSs) for different generations of mobile communications.
4.1. Solar-Powered 2G Base Stations
4.1.1. Solar-Powered 2G BS 2/2/2
The most economically feasible design for a solar-powered 2G BS 2/2/2 uses a 13-kW PV and 64 batteries in eight parallel strings with a 0.25-kW inverter for an NPC cost of $32,614. The annual energy output of the PV array is computed using Equation (9): the PV peak capacity is 13 kW × 4.01 h peak solar hours × PV, with a derating factor of 0.85 × 365 days/year, resulting in 16,173 kWh. The total annual amount of energy produced by the PV array increases by approximately 23% to 20,378 kWh when using a dual tracking system. This amount of energy covers the losses, including battery losses of 1488 kWh, inverter losses of 91 kWh and the needs of the 2G BS 2/2/2 at 15,768 kWh, leaving an annual excess energy of up to 14.87% (3031 kWh). Figure 6 shown the average hourly power contribution of the PV array and battery bank over a 12-month period. It is clear that the minimum power contribution of the PV array is in the first of August, thus the energy stored in the battery bank has reduced into the lowest level, where state of charge (SOC) reached to 30%. However, the battery bank and PV array can supply the 2G BS 2/2/2 load without loss of load probability (LOLP). Moreover, the potential duration of a battery bank meeting the required energy load in case of a PV array malfunction is 2 days and 5 h, as computed by Equation (11). The annual energy output of the battery bank is 8558 kWh, whereas the annual energy input is 10,046 kWh (the roundtrip efficiency reached 85%). Given that the intermittency of power from the PV array, potential variations in the annual solar power output, and battery capacity decrease over the years; additional batteries can be potentially used.
Figure 6.
The average hourly power contribution of the PV array and battery bank.
The battery bank represents the bulk of the IC cost, which represents the bulk part of the NPC cost. The NPC cost is computed as follows: an IC cost of $32,300 (of which the PV is 40.25%, the battery bank is 59.44%, and the inverter is 0.31%) + O & M costs of $7220 (of which the PV is 16.83%, the battery bank is 82.84%, and the inverter is 0.33%)—a salvage value of $6916 (of which the PV is 99.58% and the inverter is 0.42%), which is a total of $32,604. Based on the proposed solar system, HOMER estimated that the lifetime of battery bank is 10 years, which computed based on the Equation (12). Thus, the replacement cost for the system is zero, because the system’s components have a lifetime longer than the project lifetime (BS lifetime of 10 years). More details of the net present cost for the system’s components are given in Figure 7.
Figure 7.
Summary of the net present cost for the system’s components.
4.1.2. Solar-Powered 2G BS 4/4/4
Logically, both the sizes of the components of a solar system and the cost will increase given that the energy demand for the 2G Bs 4/4/4 has also increased. The most economically feasible design for a solar-powered 2G BS 4/4/4 with an NPC of $60,057 can be identified using the HOMER simulation: 128 batteries in eight parallel strings, 17-kW PV, and a 0.3-kW inverter. The total annual energy needed by the 2G BS 4/4/4 is 20,148 kWh, whereas the solar system’s total annual energy production is 26,582 kWh. The difference between consumption and production is equal to the sum of the battery losses of 1969 kWh/year, an excess energy of 4351 kWh/year, and inverter losses of 114 kWh/year. Figure 8 shown the seasonal statistics of the maximum and minimum states power contribution of the PV array and battery bank. The hourly simulation results shown the reduction in the amount of energy stored in the battery bank, which reached the lowest level at the first of August without LOLP. Moreover, the battery bank can supply the 2G BS 4/4/4 load autonomy for 84.14 h (3 days and 12 h). The optimal number of batteries doubles compared to the solar-powered 2G BS 2/2/2, which is a major factor in the doubling of the NPC. The annual energy output is 11,451 kWh, whereas the annual energy input of the battery bank is 13,420 kWh, meaning that the overall efficiency is 85%.
Figure 8.
The average hourly power contribution of the PV array and battery bank.
The total discounted NPC is $60,057, which is obtained using the following formula: an IC of cost $55,520 (of which the PV is 30.62%, the battery bank is 69.16%, and the inverter is 0.22%) + O & M costs of $13,579 (of which the PV is 11.70%, the battery bank is 88.09%, and the inverter is 0.21%)—a salvage value of $9042 (of which the PV is 99.61% and the inverter is 0.39%). The replacement cost is again zero, because the PV array and inverter have a lifetime (as given in Table 2) longer than the project lifetime; and battery bank has an assumed lifetime of 10 years, which is equal to the project lifetime. Figure 9 summarises the net present cost for the proposed solar-powered 2G BS 4/4/4.
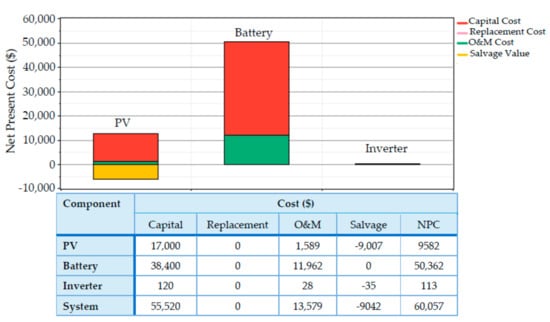
Figure 9.
Summary of the net present cost for the system’s components.
4.2. Solar-Powered 3G Node Bs
4.2.1. Solar-Powered 3G Node B 2/2/2
Due to technological advancements improving the energy efficiency of the hardware, the energy demand of a 3G Node B 2/2/2 is lower than that of 2G BSs. The decrease in the energy demand is reflected in the solar system’s size and costs. The optimal size of the solar-powered 3G Node B 2/2/2 is a 7-kW PV array, 64 batteries, and 0.16-kW inverter for an NPC total of $29,186. The total annual energy production of the solar system is 26,582 kWh, which covers the power requirements of the 3G Node B 2/2/2 of 8555 kWh/year plus the losses (which is an inverter loss of 55 kWh + battery bank losses of 858 kWh), with an annual excess energy of as much as 13.61% (3618 kWh). The seasonal statistics of the maximum and minimum power contribuation of the PV array and battery bank are presented in Figure 10; the highest power contribution of the battery bank occurred at the first of August, due to that the power contribution of the PV array has reduced into the lowest level. However, the proposed solar system can supply the required energy to 3G Node B 2/2/2 load without LOLP. Moreover, if there is a PV array malfunction, the potential number of hours of battery bank autonomy are 99.1 h (4 days and 3 h) without load loss. The annual energy input to the battery bank is 5856 kWh, whereas the annual energy output is 4999 kWh, with a $19,200 initial capital cost and a $5981 O & M cost.
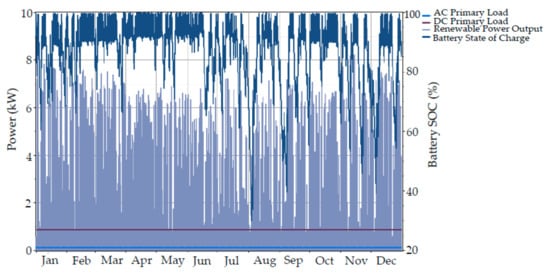
Figure 10.
The average hourly power contribution of the PV array and battery bank.
The total discounted NPC is $29,186; details have given in Figure 11. The breakdown of the NPC cost is an IC cost of $26,264 (of which the PV is 26.65%, the battery bank is 73.10%, and the inverter is 0.25%), O & M costs of $6650 (of which the PV is 9.84%, the battery bank is 89.93%, and the inverter is 0.23%), and a salvage value of $3728 (of which the PV is 99.49% and the inverter is 0.51%).
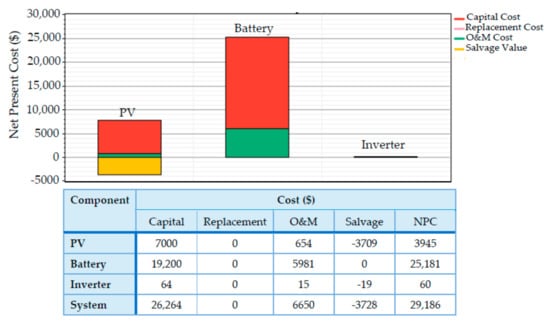
Figure 11.
Summary of the net present cost for the system’s components.
4.2.2. Solar-Powered 3G Node B 4/4/4
The energy demand from the 3G Node B 4/4/4 is less than that for the 2G BS 4/4/4 and 2G BS 2/2/2. However, the energy demand from the 3G Node B 4/4/4 is higher than that for the 3G Node B 2/2/2. Thus, the optimal size of the solar system is greater than for the 3G Node B 2/2/2 and less than for the 2G BS 2/2/2 and 2G BS 4/4/4 systems. The most economically feasible design for the solar-powered 3G Node B 4/4/4 is identified using the HOMER simulation as an 11.5-kW PV array, 128 batteries, and a 0.23-kW inverter with an NPC of $56.931. Figure 12 shown the average hourly values of the PV power output and battery SOC, which demonstrated that the PV and Battery bank can cover the load without LOLP. The annual energy input to the battery bank is 10,024 kWh, whereas the annual energy output is 8556 kWh, resulting in an overall efficiency of 85%. In this case, the battery bank is able to supply a 3G Node B 4/4/4 load autonomously for 115 h (4 days and 19 h).
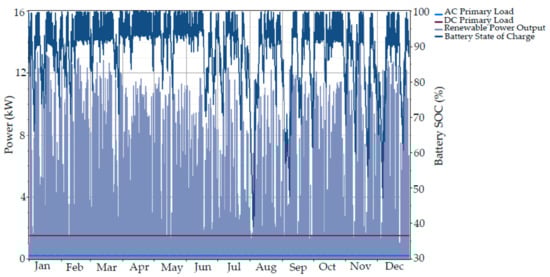
Figure 12.
The average hourly power contribution of the PV array and battery bank.
The breakdown of the NPC cost is an O & M cost of $13,059, IC cost of $49,992, and salvage value of $6120. The battery bank represents 91.60% of the O & M costs and 76.81% of the initial capital. Figure 13 gives more details about the costs of the system’s components over the project lifetime (10 years).
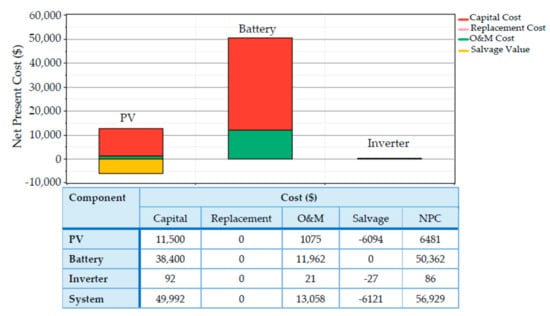
Figure 13.
Summary of the net present cost for the system’s components.
4.3. Solar-Powered 4G eNode Bs
4.3.1. Solar-Powered 4G eNodeB 2/2/2
The energy demand of the 3G Node B 2/2/2 is close to that of the 4G eNode B 2/2/2. Thus, both the solar system’s size and the cost for these BSs are very close. Therefore, the optimal design of the solar system proposed for the 3G Node B 2/2/2 can be used with the 4G eNode B 2/2/2. However, according to the HOMER simulation, the optimal size of the solar system for the 4G eNode B 2/2/2 is a 7-kW PV with 64 batteries in eight parallel strings and a 0.15-kW inverter with an NPC cost of $29,183. The total annual energy production from the solar system, which is 12,819 kWh, can cover the power requirements of the 4G eNode B 2/2/2 of 8454 kWh/year, inverter losses of 42 kWh/year, and battery losses of 838 kWh/year, with an annual excess energy of 3485 kWh. Figure 14 shown the monthly power contribution of the PV array and battery bank, where the minimum power contribution of PV occurs in August, thus the battery bank drain into the lowest level without LOLP. The annual energy output of the battery bank is 4881 kWh, whereas the annual energy input to the bank is 5718 kWh. In case of a PV array malfunction, the batteries can supply the 4G eNode B 2/2/2 load autonomously for 100 h (4 d and 4 h).
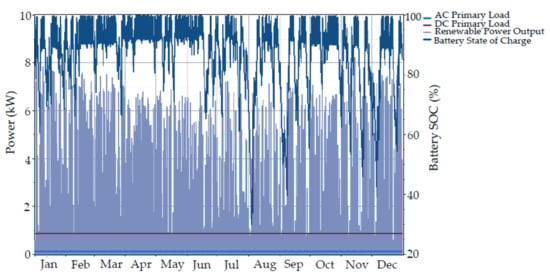
Figure 14.
The average hourly power contribution of the PV array and battery bank.
The major part of the project’s costs is in the battery bank, which accounts for 73.12% of the total initial capital cost and 89.94% of the total O & M cost. The total discounted NPC is $29,183 and consists of the following: O & M costs of $6650 (of which the PV is 9.85%, the battery bank is 89.94%, and the inverter is 0.21%), IC costs of $26,260 (of which the PV is 26.66%, the battery bank is 73.12%, and the inverter is 0.22%), and a salvage value of $3727 (of which the PV is 99.52% and the inverter is 0.48%). The replacement cost is zero. Figure 15 summarises the net present cost for the proposed solar-powered 4G eNodeB 2/2/2.
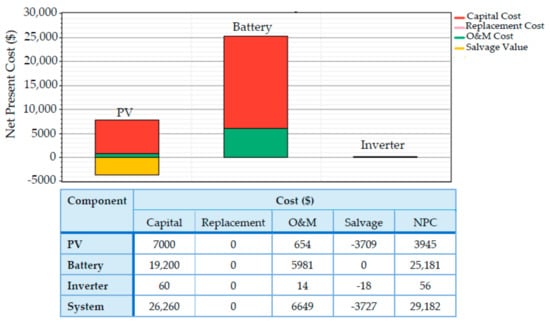
Figure 15.
Summary of the net present cost for the system’s components.
4.3.2. Solar-Powered 4G eNodeB 4/4/4
The most economically feasible design for the solar-powered 4G eNodeB 4/4/4 has the following properties: a 0.23-kW inverter with an NPC cost of $57,777 and a 13-kW PV system with 128 batteries in 16 parallel strings. The total annual energy production of the solar system is 21,406 kWh, which covers the power requirements of the 4G eNode BS 4/4/4 of 16,895 kWh/year plus the losses (which for the battery bank is 1680 kWh + that of the inverter of 89 kWh), with an annual excess energy as high as 12.81% (2742 kWh).
Figure 16 demonstrates the maximum and minimum power contribution of the PV array and battery bank over a 12-month period. In case of a PV array malfunction, the number of hours during which the battery bank can meet the required energy load is 100 h (4 days and 4 h). The annual energy input to the battery bank is 11,486 kWh, whereas the annual energy output is 9806 kWh, resulting in an overall efficiency of 85%. According to the HOMER simulation results, the optimal number of batteries is 128. This number represents the largest initial capital and O & M costs. The NPC is $57,777, which is computed as O & M costs of $13,199 (for which the PV is 9.21%, the battery bank is 90.63%, and the inverter is 0.16%) + IC costs of $51.492 (of which the PV is 25.25%, the battery bank is 74.57%, and the inverter is 0.18%)—a salvage value of $6914 (of which the PV is 99.61% and the inverter is 0.39%). The net present cost details for the system’s components are given in Figure 17.
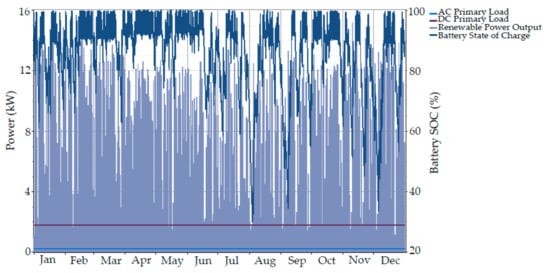
Figure 16.
The average hourly power contribution of the PV array and battery bank.

Figure 17.
Summary of the net present cost for the system’s components.
The simulation results show that the size of the optimum energy stand-alone PV/battery configuration is significantly influenced by variations in the telecommunication load. In addition, the simulation results indicate that all of the proposed solar systems for the different mobile generations satisfy the energy requirements for the BSs and systems’ losses and yield an annual excess energy of more than 10%. Moreover, the potential number of days during which a battery bank can meet the required energy load in the case of a PV array malfunction is more than 2 days.
The IC cost is the major component of the NPC. However, the IC cost is paid once at the beginning of the project lifetime. In addition, the global price of PV systems is decreasing continuously. Furthermore, the OPEX savings achieved over the long-term use of a solar system in the mobile communication sector is a strong motivation to adopt solar as a main power source, which is discussed in the following section.
Notably, the IC and O & M costs, along with the NPC, can be lowered by reducing the number of batteries. However, this is not a recommended option, as reducing the number of batteries leads to a decrease in battery autonomy, which is critical for a solar powered system, which still has to operate at all times, especially in remote and rural areas.
5. Economic Feasibility
The public electrical grid (EG) is typically used to supply power to cellular BSs deployed in urban areas. Diesel generators (DGs) are used to supply power to cellular BSs deployed in remote areas. The analysis presented here discusses the OPEX that can be saved by deploying a solar-powered 2G BS 2/2/2 in remote and urban areas. However, this analysis can be extended to 3G and 4G BSs, yielding a slight difference in the load based on each case. Table 4 summarizes the OPEX that can be saved for mobile operators by deploying solar-powered BSs for various generations of mobile communications in remote and urban areas.
Table 4.
Operational expenses (OPEX) savings for the deployed solar-powered BSs.
The cost of the energy consumed by the 2G BS 2/2/2 of the EG over a project lifetime of 10 years is about KRW 111.187 million, which is equal to $96,802 at a foreign exchange rate of 1 USD = 1184.61 KRW, as of 11 March 2017 [50].
The required DG is approximately 6.5 kW and is computed using the following formula: a maximum 2G BS 2/2/2 load of 1.8 kW divided by the multiple of a DG efficiency of 30% [51] and a converter efficiency of 95%. Meanwhile, the total NPC ($90,469) is computed as follows: O & M costs of $73,309 + initial capital cost of $4290 + replacement cost of $12,870.
- The initial capital cost is $4290 (size 6.5 kW × cost $660/kW).
- The annual O & M cost of the DG is $7331, which can be broken down as follows: (i) $438 for annual DG maintenance based on a DG maintenance cost of $0.05/h × the annual DG operating hours of 8760, and (ii) a fuel cost of $6893 based on a diesel price of $1.04/L [52] × total diesel consumption of 6628 L/year, which is computed based on a specific fuel consumption of 0.388 L/kWh × the annual electrical production of the DG of 17,082 kWh/year (a DG capacity size of 6.5 kW × the DG efficiency of 0.3 × 24 h × 365 day/year). Hence, the total O & M costs over the project’s entire lifetime equal $73,309.
- A mobile operator must change the DG at least three times during a project’s lifetime. In this case, the total DG replacement cost is 3 × (size of 6.5 kW × cost of $660/kW). This is equal to at least $12,870.
Applying a proposed solar-powered 2G BS 2/2/2 in remote and urban areas leads to a total OPEX savings of 63.95% and 66.31%, respectively.
6. Conclusions and Recommendations
This study conducted a comparative analysis of solar-powered BSs for various generations of mobile communication technologies and demonstrated the reliability of the solar power system. According to the simulation results listed in Table 3, all of the proposed solar systems for the different mobile generations cover the basic energy requirements for the BSs without a probable loss of load. In addition, the systems have an annual excess energy of over 10%. Meanwhile, the potential number of days during which a battery bank can feed the required energy load in the case of a PV array malfunction is more than 2 days, which is a sufficient time to fix PV array malfunctions. Thus, these results are indexed to an autonomous and long-term energy balance for a solar-powered BS for various generations of mobile communication technologies. Notably, HOMER’s one-hour time step is small enough to capture the intermittent nature of solar resources and the most crucial statistical aspects of the load. However, HOMER simulates how the system operates over a period of one year and assumes that the key simulation results (throughput and surplus power production) for that year are representative of every other year in the project. Considering that the fluctuations in power from the PV array, potential variations in the annual solar power output and battery capacity decrease over time, additional batteries may be required.
In terms of the economic feasibility of the solar system, Table 4 shows that the cost of the solar power system makes it an attractive option for mobile operators compared to conventional sources. The maximum OPEX savings amounted to 66% for the proposed solar-powered 2G BS 2/2/2 deployed in remote and urban areas, whereas the lowest OPEX savings was 32% for the proposed solar-powered 3G Node B 4/4/4 deployed in a remote area. In general, the OPEX savings ranged approximately between 32% and 66% based on the generation of mobile communication technologies. Thus, the proposed solar systems ensure both sustainability and cost effectiveness for various generations of mobile communication technologies.
In sum, comparing with an experimental and theoretical results of an international contributions that have performed in different countries, as listed in Table 1, and according to the results of this study, it can say that South Korea has a good potential for applying solar energy in telecommunication field.
Conflicts of Interest
The author declares no conflicts of interest.
Abbreviations and Symbols
The following abbreviations and symbols are used in this manuscript:
| Abbreviation | Meaning |
| AC | Alternating Current |
| ADC | Analogue-to-Digital Converter |
| BS | Base Station |
| CRF | Capital Recovery Factor |
| DAC | Digital-to-Analogue Converter |
| DC | Direct Current |
| DDC | Digital Down Converter |
| DOD | Depth of Discharge |
| DUC | Digital Up Conversion |
| FC | Fuel Cell |
| HOMER | Hybrid Optimisation Model for Electric Renewables |
| IC | Initial Costs |
| LNA | Low Noise Amplifier |
| LOLP | Loss of load probability |
| LTE | Long Term Evolution |
| NPC | Net Present Cost |
| O & M | Operation and Maintenance Costs |
| OPEX | Operational Expenses |
| PV | Photo Voltaic |
| SOC | State of Charge |
| TAC | Total Annualised Cost |
| PA | Power Amplifier |
| Cann_tot | Total annualized cost |
| Annualized initial capital | |
| Annualized replacement cost | |
| Annualized O & M cost | |
| Rcomp | Lifetime of the component |
| Rrem | Remaining lifetime of the component |
| NTX | Number of transceivers |
| NSect | Number of sectors |
| EPV | Energy output of the PV array |
| Eannual-demand | Total annual demand |
| YPV | Rated capacity of the PV array |
| fPV | PV derating factor |
| Baut | Battery bank autonomy |
| Nbat | Number of batteries |
| BV | Nominal voltage of a single battery |
| BQ | Nominal capacity of a single battery |
| LBS | Average daily BS load |
| LB | Battery bank lifetime |
| Qlifetime | Lifetime throughput of a single battery |
| Qthrpt | Annual battery throughput |
| Rbatt,f | Battery float life |
| Vb-b | DC bus–bar voltage |
| PLoad | Electric load (BS load) |
| PLosses | Losses |
| Pexcess | Excess power |
| Pdeficit | Deficits power |
| Pchar | Charge battery power |
| Pchar_max | Maximum charge battery power |
| Pdisch | Discharge battery power |
| Pdisch_max | Maximum discharge battery power |
References
- Alsharif, M.H.; Nordin, R. Evolution towards Fifth Generation (5G) Wireless Networks: Current Trends and Challenges in the Deployment of Millimetre Wave, Massive MIMO, and Small cells. Telecommun. Syst. 2016, 64, 617–637. [Google Scholar] [CrossRef]
- Netmanias Report. Korea Communication Market Data. Available online: http://www.netmanias.com/en/?m=view&id=oneshot&no=10954 (accessed on 27 March 2017).
- Netmanias Report. LTE Success Story in Korea. Available online: http://www.netmanias.com/en/?m=view&id=reports&no=7596&vm=ppt (accessed on 27 March 2017).
- Hasan, Z.; Boostanimehr, H.; Bhargava, V.K. Green Cellular Networks: A Survey, Some Research Issues and Challenges. IEEE Commun. Surv. Tutor. 2011, 13, 524–540. [Google Scholar] [CrossRef]
- Wu, J.; Zhang, Y.; Zukerman, M.; Yung, E. Energy-Efficient Base Stations Sleep Mode Techniques in Green Cellular Networks: A Survey. IEEE Commun. Surv. Tutor. 2015, 17, 803–826. [Google Scholar] [CrossRef]
- Feng, D.; Jiang, C.; Lim, G.; Cimini, L.J.; Feng, G.; Li, G.Y. A survey of energy-efficient wireless communications. IEEE Commun. Surv. Tutor. 2013, 15, 167–178. [Google Scholar] [CrossRef]
- Oh, E.; Krishnamachari, B.; Liu, X.; Niu, Z. Toward dynamic energy-efficient operation of cellular network infrastructure. IEEE Commun. Mag. 2011, 49, 56–61. [Google Scholar] [CrossRef]
- Oh, E.; Son, K.; Krishnamachari, B. Dynamic base station switching-on/off strategies for green cellular networks. IEEE Trans. Wirel. Commun. 2013, 12, 2126–2136. [Google Scholar] [CrossRef]
- Ou, T.-C.; Hong, C.-M. Dynamic operation and control of microgrid hybrid power systems. Energy 2014, 66, 314–323. [Google Scholar] [CrossRef]
- Eltamaly, A.M.; Al-Shamma’a, A.A. Optimal configuration for isolated hybrid renewable energy systems. J. Renew. Sustain. Energy 2016, 8, 045502. [Google Scholar] [CrossRef]
- Ou, T.-C.; Su, W.-F.; Liu, X.-Z.; Huang, S.-J.; Tai, T.-Y. A modified bird-mating optimization with hill-climbing for connection decisions of transformers. Energies 2016, 9, 671. [Google Scholar] [CrossRef]
- Ou, T.-C. Ground fault current analysis with a direct building algorithm for microgrid distribution. Int. J. Electr. Power Energy Syst. 2013, 53, 867–875. [Google Scholar] [CrossRef]
- Ou, T.-C.; Lu, K.-H.; Huang, C.-J. Improvement of transient stability in a hybrid power multi-system using a designed NIDC (Novel Intelligent Damping Controller). Energies 2017, 10, 488. [Google Scholar] [CrossRef]
- Zhang, Y.; Meo, M.; Gerboni, R.; Marsan, M.A. Minimum cost solar power systems for LTE macro base stations. Comput. Netw. 2017, 112, 12–23. [Google Scholar] [CrossRef]
- Meo, M.; Zhang, Y.; Gerboni, R.; Marsan, M.A. Dimensioning the power supply of a LTE macro BS connected to a PV panel and the power grid. In Proceedings of the 2015 IEEE International Conference on Communications (ICC), London, UK, 8–12 June 2015; pp. 178–184. [Google Scholar]
- Chamola, V.; Sikdar, B. Power Outage Estimation and Resource Dimensioning for Solar Powered Cellular Base Stations. IEEE Trans. Commun. 2016, 64, 5278–5289. [Google Scholar] [CrossRef]
- Chamola, V.; Krishnamachari, B.; Sikdar, B. Green Energy and Delay Aware Downlink Power Control and User Association for off-Grid Solar Powered Base Stations. IEEE Syst. J. 2017, 1–12. [Google Scholar] [CrossRef]
- Leonardi, G.; Meo, M.; Marsan, M.A. Markovian models of solar power supply for a LTE macro BS. In Proceedings of the 2016 IEEE International Conference on Communications (ICC), Kuala Lumpur, Malaysia, 23–27 May 2016; pp. 1–7. [Google Scholar]
- Scamman, D.; Newborough, M.; Bustamante, H. Hybrid hydrogen-battery systems for renewable off-grid telecom power. Int. J. Hydrog. Energy 2015, 40, 13876–13887. [Google Scholar] [CrossRef]
- Nguyen, H.Q.; Aris, A.M.; Shabani, B. PEM fuel cell heat recovery for preheating inlet air in standalone solar-hydrogen systems for telecommunication applications: An exergy analysis. Int. J. Hydrog. Energy 2016, 41, 2987–3003. [Google Scholar] [CrossRef]
- Alsharif, M.H.; Kim, J. Optimal Solar Power System for Remote Telecommunication Base Stations: A Case Study Based on the Characteristics of South Korea’s Solar Radiation Exposure. Sustainability 2016, 8, 942. [Google Scholar] [CrossRef]
- Alsharif, M.H.; Kim, J. Hybrid Off-Grid SPV/WTG Power System for Remote Cellular Base Stations towards Green and Sustainable Cellular Networks in South Korea. Energies 2017, 10, 9. [Google Scholar] [CrossRef]
- Alsharif, M.H.; Nordin, R.; Ismail, M. Green wireless network optimisation strategies within smart grid environments for Long Term Evolution (LTE) cellular networks in Malaysia. Renew. Energy 2016, 85, 157–170. [Google Scholar] [CrossRef]
- Alsharif, M.H.; Nordin, R.; Ismail, M. Energy optimisation of hybrid off-grid system for remote telecommunication base station deployment in Malaysia. EURASIP J. Wirel. Commun. Netw. 2015, 2015, 1–15. [Google Scholar] [CrossRef]
- Amutha, W.M.; Rajini, V. Techno-economic evaluation of various hybrid power systems for rural telecom. Renew. Sustain. Energy Rev. 2015, 43, 553–561. [Google Scholar] [CrossRef]
- Moury, S.; Khandoker, N.M.; Haider, M.S. Feasibility Study of Solar PV Arrays in Grid Connected Cellular BTS Sites. In Proceedings of the 2012 IEEE International Conference on Advances in Power Conversion and Energy Technologies (APCET), Mylavaram, India, 2–4 August 2012; pp. 1–5. [Google Scholar]
- Asif, R.; Khanzada, F. Cellular Base Station Powered by Hybrid Energy Options. Int. J. Comput. Appl. 2015, 115, 35–39. [Google Scholar] [CrossRef]
- Olatomiwa, L.; Mekhilef, S.; Huda, A.; Sanusi, K. Techno-economic analysis of hybrid PV-diesel-battery and PV-wind-diesel-battery power systems for mobile BTS: The way forward for rural development. Energy Sci. Eng. 2015, 3, 271–285. [Google Scholar] [CrossRef]
- Paudel, S.; Dahal, M.S.; Adhikari, M.; Shrestha, J.N. Technical and Economic Assessment of Renewable Energy Sources for Telecom Application: A Case Study of Nepal Telecom. In Proceedings of the 5th International Conference on Power and Energy Systems, Kathmandu, Nepal, 28–30 October 2013; pp. 1–6. [Google Scholar]
- Martínez-Díaz, M.; Villafáfila-Robles, R.; Montesinos-Miracle, D.; Sudrià-Andreu, A. Study of optimization design criteria for stand-alone hybrid renewable power systems. In Proceedings of the International Conference on Renewable Energies and Power Quality (ICREPQ’13), Bilbao, Spain, 20–22 March 2013; pp. 1–5. [Google Scholar]
- Korea Meteorological Administration. Annual Climatological Report 2013, Korea Meteorological Administration. Available online: http://www.kma.go.kr/weather/observation/data_monthly.jsp (accessed on 27 March 2017).
- Bukhari, S.S.H.; Atiq, S.; Lipo, A.T.; Kwon, B. Asymmetrical fault correction for the sensitive loads using a current regulated voltage source inverter. Energies 2016, 9, 196. [Google Scholar] [CrossRef]
- Ou, T.-C. A novel unsymmetrical faults analysis for microgrid distribution systems. Int. J. Electr. Power Energy Syst. 2012, 43, 1017–1024. [Google Scholar] [CrossRef]
- Imran, M.; Katranaras, E.; Auer, G.; Blume, O.; Giannini, V.; Godor, I.; Jading, Y.; Olsson, M.; Sabella, D.; Skillermark, P. Energy Efficiency Analysis of the Reference Systems, Areas of Improvements and Target Breakdown; ICT-EARTH Project, Deliverable D2. 3; EC-IST Office: Brussels, Belgium, 2011. [Google Scholar]
- Deruyck, M.; Joseph, W.; Martens, L. Power consumption model for macrocell and microcell base stations. Trans. Emerg. Telecommun. Technol. 2014, 25, 320–333. [Google Scholar] [CrossRef]
- Simić, I.S. Evolution of mobile base station architectures. Microw. Rev. 2007, 13, 29–34. [Google Scholar]
- Deruyck, M.; Tanghe, E.; Joseph, W.; Martens, L. Modelling and optimization of power consumption in wireless access networks. Comput. Commun. 2011, 34, 2036–2046. [Google Scholar] [CrossRef]
- Auer, G.; Giannini, V.; Desset, C.; Godor, I.; Skillermark, P.; Olsson, M. How much energy is needed to run a wireless network? IEEE Wirel. Commun. 2011, 18, 40–49. [Google Scholar] [CrossRef]
- Motorola Reach. Alternative Power for Mobile Telephony Base Stations. Solution Paper. 2007. Available online: http://content.motorolasolutions.com/web/Business/Solutions/Technologies/WiMax/Access%20Services%20Network/_Documents/_Static%20Files/6682_MotDoc.pdf (accessed on 27 March 2017).
- Infinite Focus Group. Alternative and Sustainable Power for Nigerian GSM/Mobile Base Stations. Ireland. Available online: http://infinitefocus-group.com/yahoo_site_admin/assets/docs/WHITE_Paper_Globacom.16865153.pdf (accessed on 27 March 2017).
- Marsan, M.A.; Bucalo, G.; di Caro, A.; Meo, M.; Zhang, Y. Towards zero grid electricity networking: Powering BSs with renewable energy sources. In Proceedings of the 2013 IEEE International Conference oncommunications (ICC), Budapest, Hungary, 9–13 June 2013; pp. 596–601. [Google Scholar]
- Schmitt, G. The Green Base Station. In Proceedings of the 4th International Conference on Telecommunication-Energy Special Conference (TELESCON), Vienna, Austria, 10–13 May 2009; pp. 1–6. [Google Scholar]
- Lambert, T.; Gilman, P.; Lilienthal, P. Micropower System Modeling with HOMER. 2006. Available online: http://homerenergy.com/documents/MicropowerSystemModelingWithHOMER.pdf (accessed on 27 March 2017).
- Alsharif, M.H. A Solar Energy Solution for Sustainable Third Generation Mobile Networks. Energies 2017, 10, 429. [Google Scholar] [CrossRef]
- Ge, X.; Cheng, H.; Guizani, M.; Han, T. 5G wireless backhaul networks: Challenges and research advances. IEEE Netw. 2014, 28, 6–11. [Google Scholar] [CrossRef]
- The Bank of Korea Monetary Policy. Available online: http://www.bok.or.kr/baserate/baserateList.action?%20menuNaviId=33 (accessed on 27 March 2017).
- Chamola, V.; Sikdar, B. Solar powered cellular base stations: Current scenario, issues and proposed solutions. IEEE Commun. Mag. 2016, 54, 108–114. [Google Scholar] [CrossRef]
- Trojan Battery Incorporation. Available online: http://www.trojanbattery.com/ (accessed on 5 June 2017).
- Lee, J.F.; Rahim, N.A.; Al-Turki, Y.A. Performance of dual-axis solar tracker versus static solar system by segmented clearness index in Malaysia. Int. J. Photoenergy 2013, 2013, 820714. [Google Scholar] [CrossRef]
- Korean Energy Corporation. Available online: https://home.kepco.co.kr/kepco/EN/F/B/ENFBPP002.do?menuCd=EN060202 (accessed on 27 March 2017).
- Kusakana, K.; Vermaak, H.J. Hybrid Renewable Power Systems for Mobile Telephony Base Stations in Developing Countries. Renew. Energy 2013, 51, 419–425. [Google Scholar] [CrossRef]
- Global Petrol Prices. Available online: http://www.globalpetrolprices.com/South-Korea/diesel_prices/ (accessed on 27 March 2017).
© 2017 by the author. Licensee MDPI, Basel, Switzerland. This article is an open access article distributed under the terms and conditions of the Creative Commons Attribution (CC BY) license (http://creativecommons.org/licenses/by/4.0/).