1. Introduction
The importance of the building sector’s energy behavior became painfully apparent in 1973 with the first oil crisis. A series of policy measures has been introduced since then, leading to a radical change of the regulatory approach of the buildings’ energy performance, culminating in the European Directives on the Energy Performance of Buildings (91/2002, 31/2010) and their harmonization in regulations and standards of the 29 member states [
1].
Still, one cannot fail to notice that the bulk of the European building stock was constructed before 1990, with 38% of it dating even before 1960 and 45.3% dating between 1961 and 1990 [
2]. The figures in Greece are similar, with 68% of the buildings being built before 1981 and hence prior to the introduction of the thermal insulation regulation [
3,
4]. Furthermore, with an average annual construction rate of 1.3% over the last 20 years, which has not been followed by a corresponding rate of old building demolition, the overall heated and cooled area has increased accordingly. Hence, and despite the very important progress made in the energy performance of contemporary buildings, the final energy consumed by the building sector still accounted in 2015 for 39% of the total final energy, consumed in Europe [
5]. It is therefore evident that the development of a feasible and sustainable approach towards improving the building stock’s energy performance is a prerequisite with respect to the ambitious European energy and environment goals for 2030.
The same applies to the need to improve the prevailing indoor environmental quality conditions, both in new and existing buildings, in parallel with the improvement of their energy efficiency. This is clearly expressed in the European and national regulatory frameworks, in the form of International Standards (ΕΝ ISO 7730:2005, ΕΝ ISO 15251:2006). These documents emphasize the importance of upgrading the occupants’ comfort, while increasing the buildings’ energy performance and reducing their energy consumption in the same line of approach [
6,
7,
8,
9].
Special focus has to be given to office buildings, which not only account for 23% of the non-residential building stock, but are in need of proper refurbishments [
2]. This comes as a result of the fact that people tend to spend a great part of their overall life (60–90%) in the built environment [
10]. Furthermore, the indoor environment conditions of office buildings have a documented impact on the occupants’ concentration and productivity levels [
7]. It is hence also an issue of economics and competiveness, apart from the impact on the health and well-being of people.
A thorough evaluation of an office building’s indoor environment calls for the combined in situ measurement of thermophysical parameters and the analysis of occupants’ perception, feelings and attitudes [
11,
12]. The literature indicates that numerous studies of this type have being conducted both in climate chambers [
13,
14] and existing buildings [
15,
16,
17]. In the majority of these cases, the main areas of interest were the indoor environment and comfort issues such as lighting, acoustics, thermal comfort and air quality [
12,
18,
19,
20,
21,
22,
23,
24,
25].
Indraganti et al [
18,
19], for example, found age and gender correlations in the behavioral adaptation of building occupants in India. Moreover, the same methodological approach was followed by researchers , during the evaluation of office buildings in Germany and Italy, respectively [
20,
21]. Specifically, Kuchen and Fisch [
20] measured a variety of indoor thermophysical parameters (air temperature, relative humidity, air velocity, radiant temperature, clothing and activity) as well as psychological, physiological and physical aspects, and concluded that a relation existed between operative and neutral temperature, through regression model techniques. Ricciardi and Buratti [
21] investigated open plan office areas, conducting an in depth indoor thermophysical evaluation during winter and summer periods, along with a revealed preference survey, leading to a regression model correlating the predicted mean vote (PMV) index and the operative temperature. Moreover, Kim and de Dear [
22] identified the nonlinear relationship between individual indoor environmental quality and workspace satisfaction, whereas Antoniadou et al. [
25] developed a binary logistic regression model between occupants’ complaints about ventilation and their socioeconomic background and building characteristics.
Furthermore, similar studies have been conducted in offices located in university areas. Liu et al. [
12] measured the indoor conditions parameters and occupants’ perceptions in Italy. They examined correlations among the occupants’ interaction and control of indoor conditions in their office area and the occupants’ comfort sensation per seasons. The outcome of their research was that statistical important correlations were specified only in the cases of the winter and summer periods. Wagner et al [
23], in order to specify the occupants’ needs and upgrade their productivity, investigated correlations between occupants’ comfort sensations, which were based on the existing indoor conditions and the PMV index. Finally, Antoniadou and Papadopoulos [
24] related occupants’ dissatisfaction concerning the indoor conditions (ventilation, heating, cooling etc.) and their socioeconomic characteristics along with their perception of indoor environment conditions during the winter and summer period.
As it can be deduced from this synoptic literature review, further analysis on building evaluation and occupants’ interaction is appropriate. In detail, this analysis indicates that only in the recent years a rather small portion of researchers have focused on in depth analyses of the relations between building occupants’ personal characteristics and attitude and the indoor environment conditions. Therefore, a detailed analysis where the occupants’ and their special characteristics are at the epicenter has to be further implemented. The literature analysis also indicates that, in the last decades, researches are focusing on the evaluation of occupants’ perception of indoor conditions, without an in depth investigating their socioeconomic and individual characteristics. Therefore, further research has to be conducted in this aspect and especially in the development of an integrated methodological approach aiming to interpret the indirect and direct occupants’ characteristics that affect comfort in office buildings. In this framework, an integrated methodological framework for the determination of a personalized comfort model is presented in this study, along with some early results of its implementation. During the implementation, an evaluation of indoor environment conditions in office buildings has been performed, denoting the relation between occupants’ perception of overall comfort satisfaction and individual characteristics and in situ measurements. This approach enables an in depth evaluation of buildings, depicting the parameters that policy makers should consider, while outlining the existing indoor conditions, so that appropriate strategies and plans can be applied for achieving in the near future the nearly zero energy buildings (nZEB) status.
2. Methodology
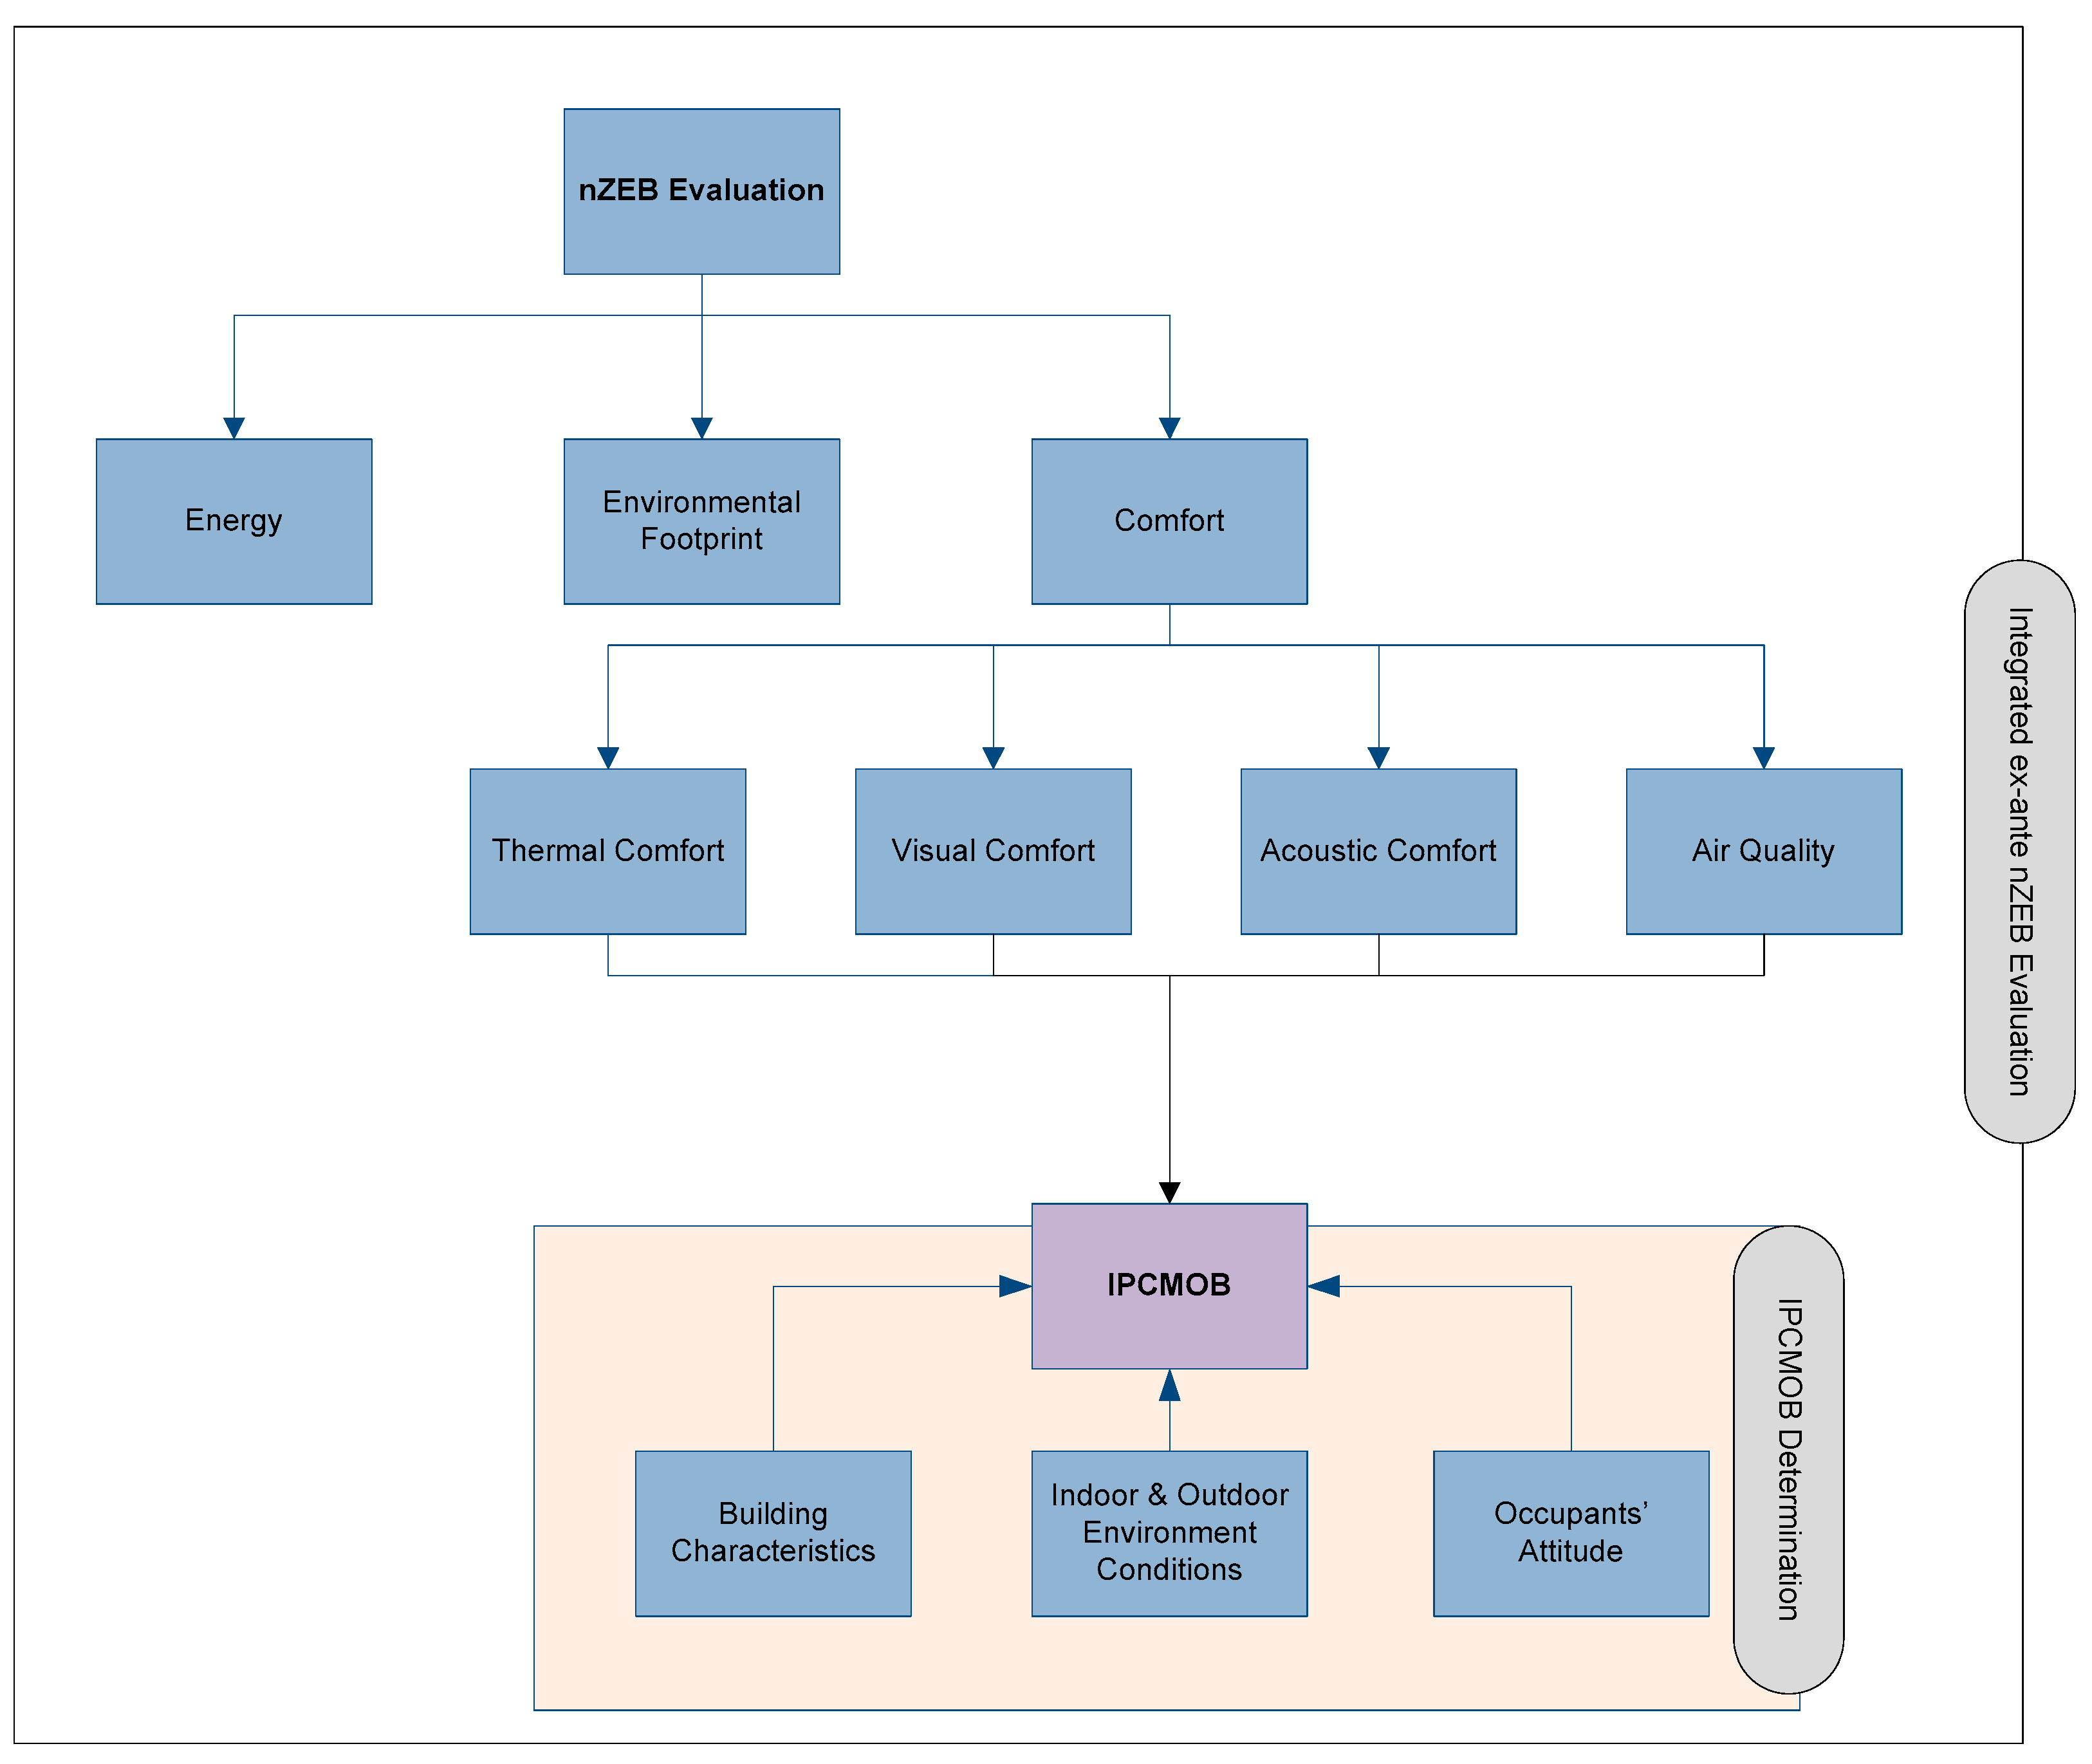
As indoor environment conditions have to comply with multiple requirements, the evaluation procedure is in reality a complex, multi-criteria one. This paper presents a methodological framework for the development of an integrated, personalized comfort model. Based on the existing institutional framework, the development and construction of nZEB is essential and immediate. For the evaluation of a nZEB during the design stage, three main domains are evaluated: energy, environmental profile and comfort (
Figure 1) [
9].
Our analysis focuses on comfort, hence the energy and environmental footprint aspects will not be discussed extensively in this paper. Based on the existing approach, the aspects that define comfort (visual, thermal, acoustic and air quality) are determined by direct specified parameters. However, a more personalized perspective, highlighting the occupants’ attitude and needs based on their individual/psychometric and psychological background while considering the aforementioned comfort parameters, would be of great interest. This approach is of great interest, as the individual aspect has not been well analyzed so far as outlined above. In this way, an integrated evaluation prior to construction could possibly help not only designers and project developers, but also policy makers to evaluate in advance the occupants’ attitude, their behavior and their adaptation to the construction. This approach leads to the elaboration of an integrated personalized comfort model in office buildings index (IPCMOB), which lies in the epicenter of the methodology developed and discussed in this paper.
IPCMOB is an index that includes the aspects of thermal, visual, acoustic comfort and air quality along with the occupants’ perspective and constitute a result of our research analysis in order to achieved a more detailed and in depth determination of comfort in case of office buildings. In detail, the IPCMOB index is based on three pillars; the building’s characteristics, the occupants’ attitude and the indoor and outdoor environment conditions (
Figure 1).
Regarding the building’s characteristics, the architectural design and structure, alongside the lighting applications and Heating Ventilation and Air Conditioning (HVAC) systems are considered. In this line of approach, an in-depth determination of the buildings’ aspects is achieved. The main aspects of the analysis are the structure and architectural characteristics of the building. In detail, the orientation, openings’ geometry and placement along with the areas’ geometry are evaluated as they can contribute to a variety of comfort aspects such as visual comfort and air quality. Moreover, the HVAC systems alongside the lighting applications are evaluated, as they can affect both thermal and visual comfort of the buildings’ occupants.
In case of the environment conditions, both indoor and outdoor thermophysical parameters and microclimate characteristics are determined. In detail, a variety of qualitative and quantitative parameters are considered. Regarding the outdoor environment conditions both the air temperature and relative humidity levels are evaluated, along with a detailed description of the environmental surroundings of the buildings under evaluation. In case of the indoor environment conditions, a variety of thermophysical parameters such as the air temperature, relative humidity, air velocity, radiant temperature and CO2 levels along with the PMV/PPD (predicted percentage of dissatisfied) indexes, are determined. In this respect, possible parameters affecting both thermal and acoustic comfort can be evaluated.
Finally, the occupants’ attitude and special features are documented. In detail information is sought about the users’ psychology during their presence in office, and their background, i.e., factors like age, education, lifestyle, habits and other socioeconomic parameters. It is those features that are vital in order to understand how users appreciate prevailing comfort conditions.
Consequently, the occupants’ perception of indoor is evaluated, focusing on thermal, visual, acoustic comfort and air quality both for winter and summer, as well as on their control over the indoor environment conditions and possible sick building syndrome symptoms. The data gathered in this way provide adequate information in order to be able to analyze the three pillars and come up with a numerical value for the IPCMOB index.
An implementation of the aforementioned methodological approach is conducted in the framework of this study and preliminary results indicating possible correlations between a variety of occupants’ individual characteristics and their perception of comfort during the winter and summer periods are presented. Those findings have produced promising preliminary results, indicating that the occupants’ attitude aspect has to be taken seriously into consideration, both by designers and policy makers.
3. Case Study
The presented methodological framework was applied in Thessaloniki, a city located in northern Greece. The microclimate conditions of the area indicated that the climate profile of the region of Thessaloniki is representative for a Mediterranean, coastal city similar to a series of other Mediterranean cities, like Toulon (France) or Split (Croatia), based on the latest World Maps of Köppen-Geiger Climate Classification in 2017 [
26,
27,
28]. Therefore, the climate conditions of the area are characterized by both mild winters and warm and humid summers with high outdoor temperature monitored from the late spring to early fall periods.
Three office buildings in the Pylaia-Hortiatis Municipality were evaluated, which were all constructed between 1995 and 2002. They are representative of a significant group of fairly new office buildings, which on the one hand are old enough to need improvements in certain aspects of their performance, but on the other hand they are new enough to justify significant interventions and the respective investments, as they comply with contemporary static and safety regulations and also with the operational requirements of modern office use.
Those buildings are in compliance with the first Greek Thermal Insulation Regulation, which was issued in 1979 and have a thermal resistance coefficient for the buildings (Um) varying from 0.67 to 0.74 W/m
2K, with the roof, ground floor and bearing structure being externally insulated and with brickwork in the cavity. The latest regulation on the energy performance of buildings, known as KENAK (greek regulation of energy in buildings), which was issued in 2010 as part of the implementation of the initial European Energy Performance of Buildings Directive. In 2013, the Greek Law 4122/2013 was published, introduced the definition of the net zero energy buildings for both commercial and private buildings [
29], in accordance with the requirements of the recast Energy Performance of Buildings Directive. It will therefore be a goal in the coming years to refurbish those buildings and raise their performance to the level of the current legislation. A description of the buildings’ envelope, their main structural elements and HVAC systems is presented in the following paragraphs.
Building A
Building A is the Engineering and Technical Services Department of the municipality (
Table 1). It is a two-storied building with a basement, ground-floor and two upper floors, with a conditioned floor area of approximately 518 m
2. The entire building is occupied by offices and its construction was completed in 1998. Concerning the current state of the building, the two main areas of interest are: (a) the building’s envelope and (b) the HVAC systems. Building A is a corner, square building with a variety of openings in all façades and double glazed, aluminum framed windows, with no external sun-protection systems other than internal blinds. The number and dimensions of openings in every office is considered to be sufficient for lighting and ventilation, based on the offices’ dimensions, number of employees and usage.
In order to achieve the appropriate indoor conditions during winter, a central gas boiler with autonomy per zone is used, that feeds radiator panels. Furthermore, local heat pumps (room air-conditioners) are installed in almost every office and are occasionally used for heating. The operation schedule of the central heating system corresponds with the office hours of the Municipality, namely from 07:00 a.m. to 04:00 p.m. During summer period, cooling is achieved by means of natural ventilation and by the aforementioned local air conditioning unit. Concerning the artificial lighting, the majority of the lamps used are fluorescent and the total level of lighting in all offices can be characterized as adequate. However, there are neither occupancy nor lighting intensity sensors.
Building B
The second building under evaluation, Building B, is the former Town Hall of Pylaia-Hortiatis’ Municipality which was constructed in 1995 (
Table 1). It is a two building construction, connected by means of an external corridor, with a ground-floor and two upper floors; the conditioned floor area is approximately 844 m
2.
Concerning the architectural characteristics of the building, it features openings in every façade and all windows are aluminum framed, with tinted double glazing, to ensure low thermal losses and sufficient natural lighting. Given its construction period, the building can be considered to be adequately insulated, with respect to contemporary requirements.
In order to achieve a better understanding of the building, the HVAC systems should also be mentioned. During winter period, heating is achieved by means of a geothermal system, with heat pumps and fan-coils as terminal units; its operation schedule is from 7:00 a.m. to 4:00 p.m. Moreover, in addition to the central heating system, portable heating means are used (e.g., electric heaters). The geothermal system is also being used for the cooling period. It should be noted that this building was the first Greek public building to be heated and cooled by means of geothermal energy. The performance of the building was measured and evaluated by the Process Equipment Design Laboratory of the Aristotle University Thessaloniki over a four year period. As found out, annual primary energy savings of between 45% and 97% were achieved for the heating period compared to a conventional oil fired boiler heating, depending on the seasonal weather variations. With respect to cooling, savings between 28% and 55% were achieved, compared to conventional air-to-air heat pumps [
30]. Finally, concerning the artificial lighting, fluorescent tubes are used, without any automation in the controls; the total level of lighting in offices is found to be adequate. In cases of corridors. An autonomous artificial lighting system is implemented, using movement sensors, so as reduce the energy consumed.
Building C
The last building under evaluation, Building C, is the current Town Hall of Pylaia-Hortiatis Municipality (
Table 1). It is a complex of two buildings, connected by an external corridor, both featuring basement, ground floor and first floor, with a conditioned floor area of approximately 4564 m
2. The building was constructed in 2002 and offices are located in both structures, but in the East building, the majority of the areas are art and culture halls.
Both structures have openings in all external façades, with sliding, aluminum framed, double glazed windows to achieve a satisfactory level of energy efficiency. In order to achieve adequate daylight control, both internal and external blinds are installed and used. Moreover, the number and dimensions of openings in the offices is considered sufficient for lighting and ventilation, based on the offices’ dimensions, number of employees and usage.
Concerning the HVAC systems of the buildings, heating and cooling are achieved by means of a central, natural gas fired boiler and a central chiller, respectively, and their operation schedule is from 7:00 a.m. to 4:00 p.m. A dual air duct system is being used to circulate the warm and cold air, respectively. The same duct system is also being used for the building’s ventilation. In addition, natural ventilation is provided through the windows, particularly in the spring and fall period. Finally, concerning the artificial lighting, fluorescent tubes are used and the total level of lighting in offices is found to be adequate.
3.1. In Situ Measurements
In order to evaluate in a quantitative and objective way the indoor and outdoor environmental conditions of the office buildings, measurements were carried out by using dedicated equipment. In detail, a meteorological station (HOBO U30, Onset, MA, USA) was set up on a 5 m pole for the duration of the measurement period, so as to determine the microclimate conditions (air temperature, relative humidity and wind speed), prevailing in the specific site, as the Municipality of Pylaia-Hortiatis is located on the foothills of Hortiatis Mountain.
Table 2 presents the indoor parameters measured and recorded during the campaign, as well as the equipment used with its respective measurement range and accuracy.
The measurements were carried out for a week in each building, both during the winter and summer period of 2016; sensors were placed in representative office areas, according to the architectural design of the buildings, so as to achieve a reliable and valid indoor environment evaluation (
Table 3). In detail, typical office areas were chosen in every floor and for every orientation of each building. The office areas are working areas, which were continually occupied during the measurement periods and the sensors were placed in accordance with the requirements of the ISO 7726 standard [
36]. In all areas listed in
Table 3, the indoor air temperature and relative humidity levels were determined. However, the monitoring of CO
2 measures and PMV/PPD indices occurred only in Offices 1, 5 and 7 of Buildings A, B and C, respectively. These areas were chosen as the most representative for each building regarding their structural and architectural characteristics, as well as their occupant density.
In parallel to the in situ measurements, a revealed preference survey was conducted, specifying the occupants’ perception of indoor conditions.
3.2. Qualitative Evaluation
Along with the in situ monitoring of the environmental conditions, the determination of the occupants’ attitude and perspective is essential. Therefore, a revealed preference survey was conducted, specifying the occupants’ perception of indoor environment conditions in the winter and in the summer period. This type of analysis is widely used and is found to be extremely promising, as it can offer an initial depict of the parameters that need to be taken into consideration, leading even to a different prospective of the designing stage, as indirect values and conditions can be determined [
37,
38]. The stated methodological approach for the evaluation and determination of indirect conditions, is performed in four stages: (a) the evaluation of criteria and prospective parameters, (b) determination of the questionnaire’s structure, (c) data collection, and (d) data analysis [
39].
For the purpose of the study a self-assessment questionnaire was designed. The questionnaire is divided into three main areas which include: (a) personal characteristics, (b) comfort perception, and (c) additional information concerning the relation between occupants and buildings’ systems and their sufficiency. The questionnaire is presented in
Supplementary Materials. As part of the survey, 127 questionnaires were distributed to the buildings’ occupants. They were completed with the assistance of the research team, so as to minimize errors of apprehension and of misjudgment by the employees. A total of 106 questionnaires were collected (a response rate of 83.5%), which corresponds to a survey with a confidence level of 95% and a margin error of 4% of the sample [
40].
4. Results
4.1. Numerical Evaluation
The indoor environment conditions affect the occupants’ well-being and productivity so their reliable evaluation is therefore of importance. The Greek National Technical Guidelines indicate that, in office buildings, the desirable temperature levels for the winter and summer periods are 20 °C and 26 °C, respectively [
41]. However, achieving stable indoor air temperature conditions in real buildings is not always easy, as a variety of parameters can affect them. Those parameters are the microclimate, architectural and structural characteristics of the building, along with the operation and efficiency of the HVAC systems and, last but not least, the users’ behavior.
Moreover, an integrated evaluation of the indoor conditions has to consider the levels of CO
2, as a reliable indicator for indoor air quality (IAQ) [
42]. The determination of poor air quality in a building can lead to a variety of health problems among occupants. Therefore, the monitoring of indoor CO
2 level is essential and can improve the indoor environment conditions and well-being of occupants in a building.
4.1.1. Indoor Air Temperature
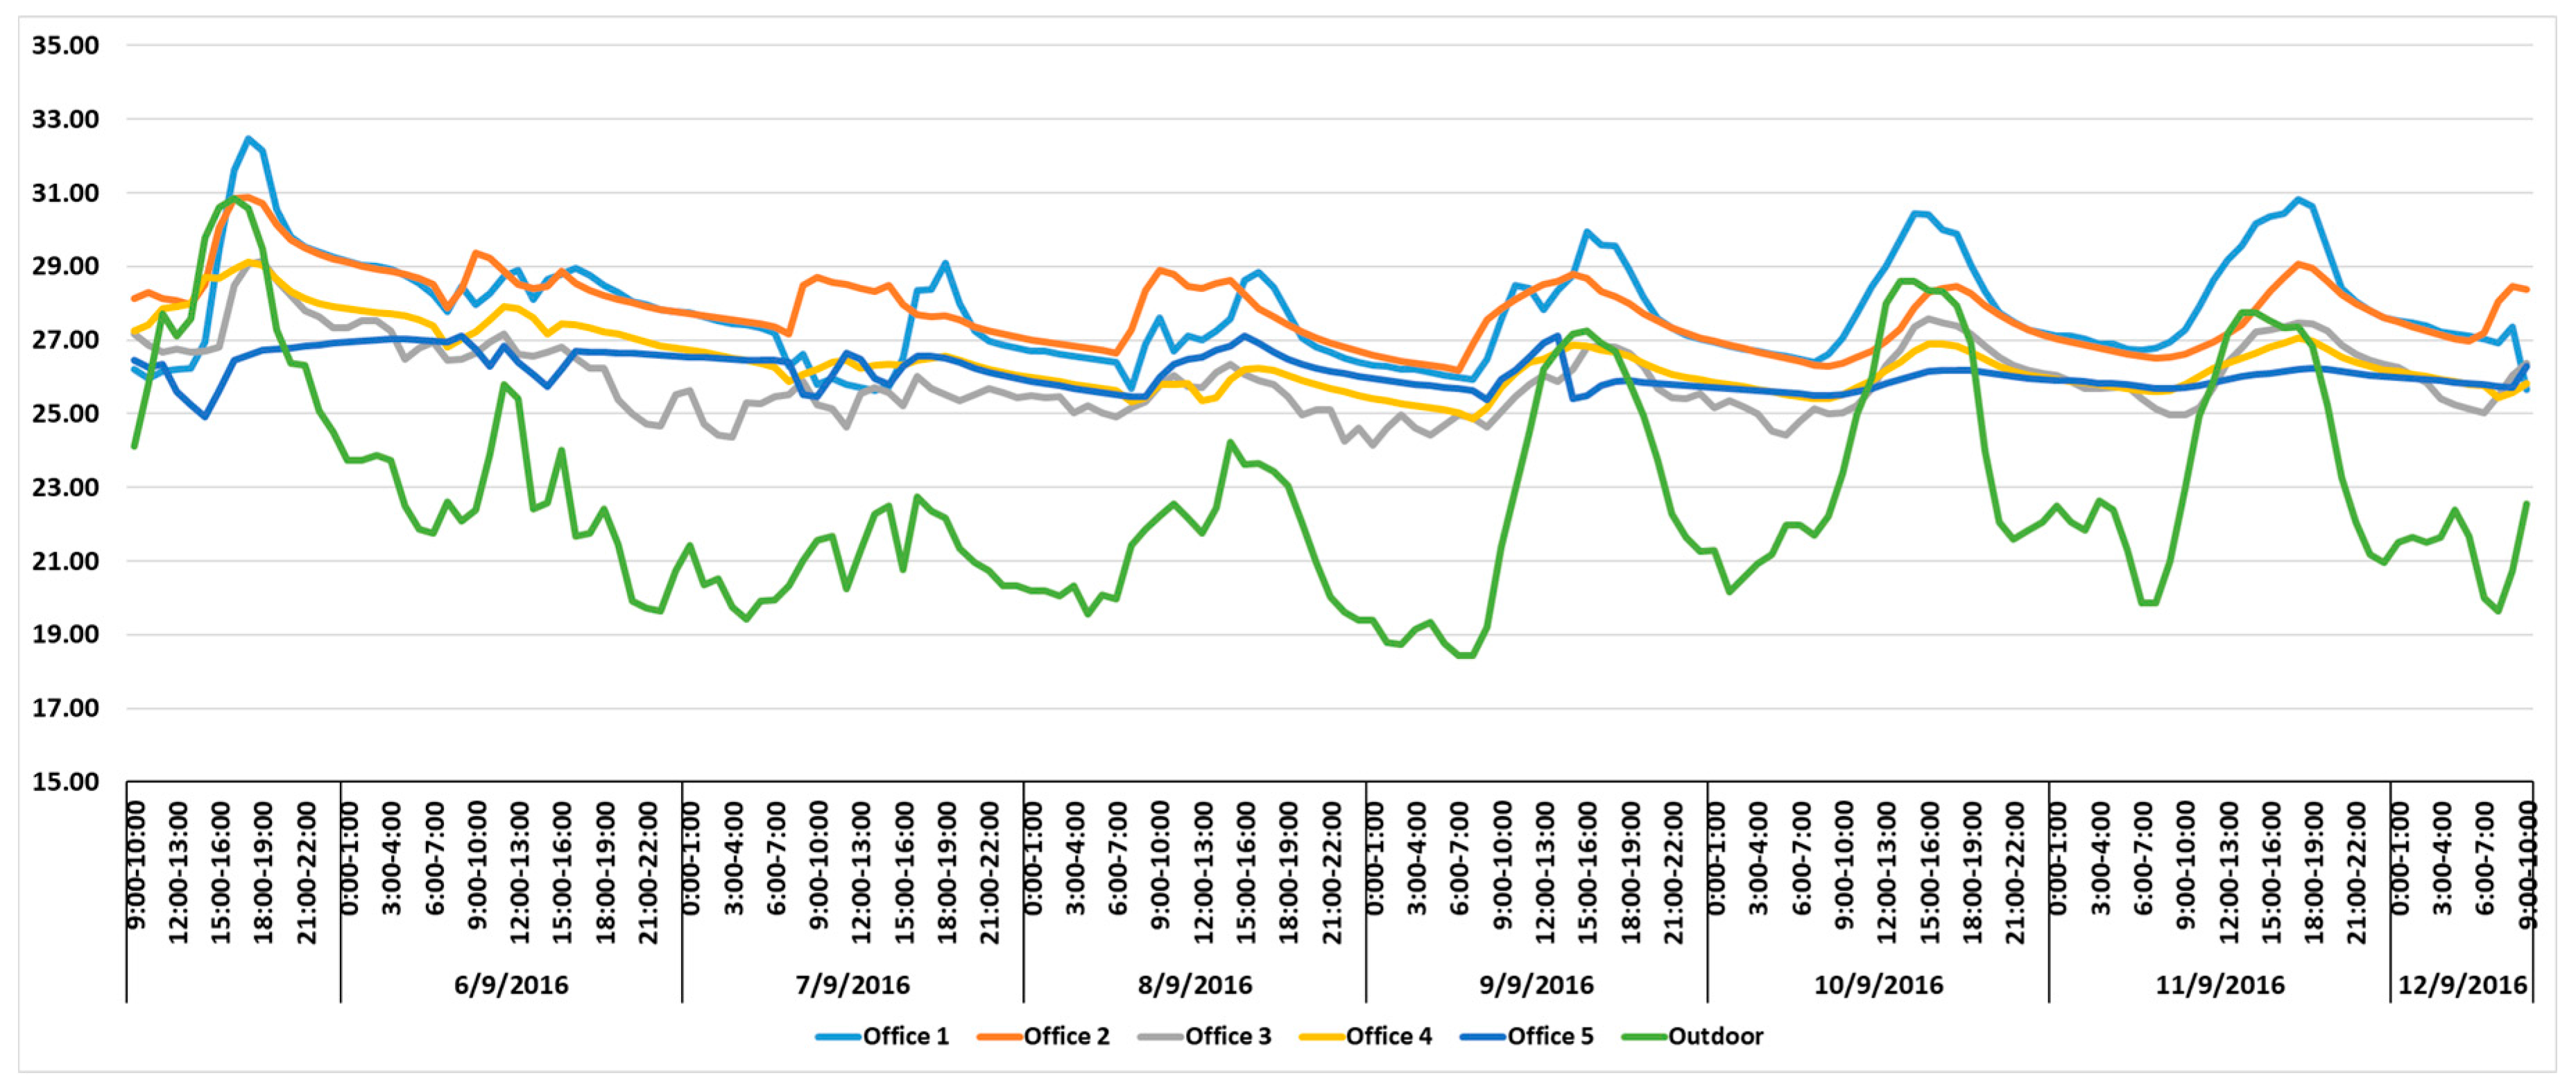
In Building A the measurement period was from 19 February 2016 to 26 February 2016 and from 5 September 2016 to 12 September 2016, for the winter and summer periods, respectively. The temperature levels of the under evaluation areas are depicted in
Figure 2 and
Figure 3, along with the prevailing external temperature values. The evaluation demonstrates that during winter, in all cases, the indoor temperature was significantly higher than the external one, varying from 18 °C to 27 °C, with the lowest monitored temperature being during the late night and early morning period.
During office hours, the temperature levels vary from 21 °C to 26 °C, creating by and large a comfortable work environment for the occupants, although it gets for warm for short periods. In detail, during office hours a general increase of indoor temperature by approximately 5 °C is monitored, due to the simultaneous operation of the heating system and the occurrence of solar gains.
During summer, the offices on the upper floor reached the highest temperatures, whereas in the offices of the 1st and the ground floor, lower temperatures were monitored. This differentiation was expected, as the roof features conventional coating materials and no additional cooling techniques, like night-time ventilation, were being used. As previous research has shown, cool materials, with a high solar reflectance and high emissivity, would be a good option in this case: for the climate conditions of the area, the use of conventional materials can lead to quite high surface roof temperatures (up to 56 °C) during summer, burdening hence thermally the building’s interior, whilst the use of cooling materials can reduce those temperatures by up to 12 °C [
43,
44,
45].
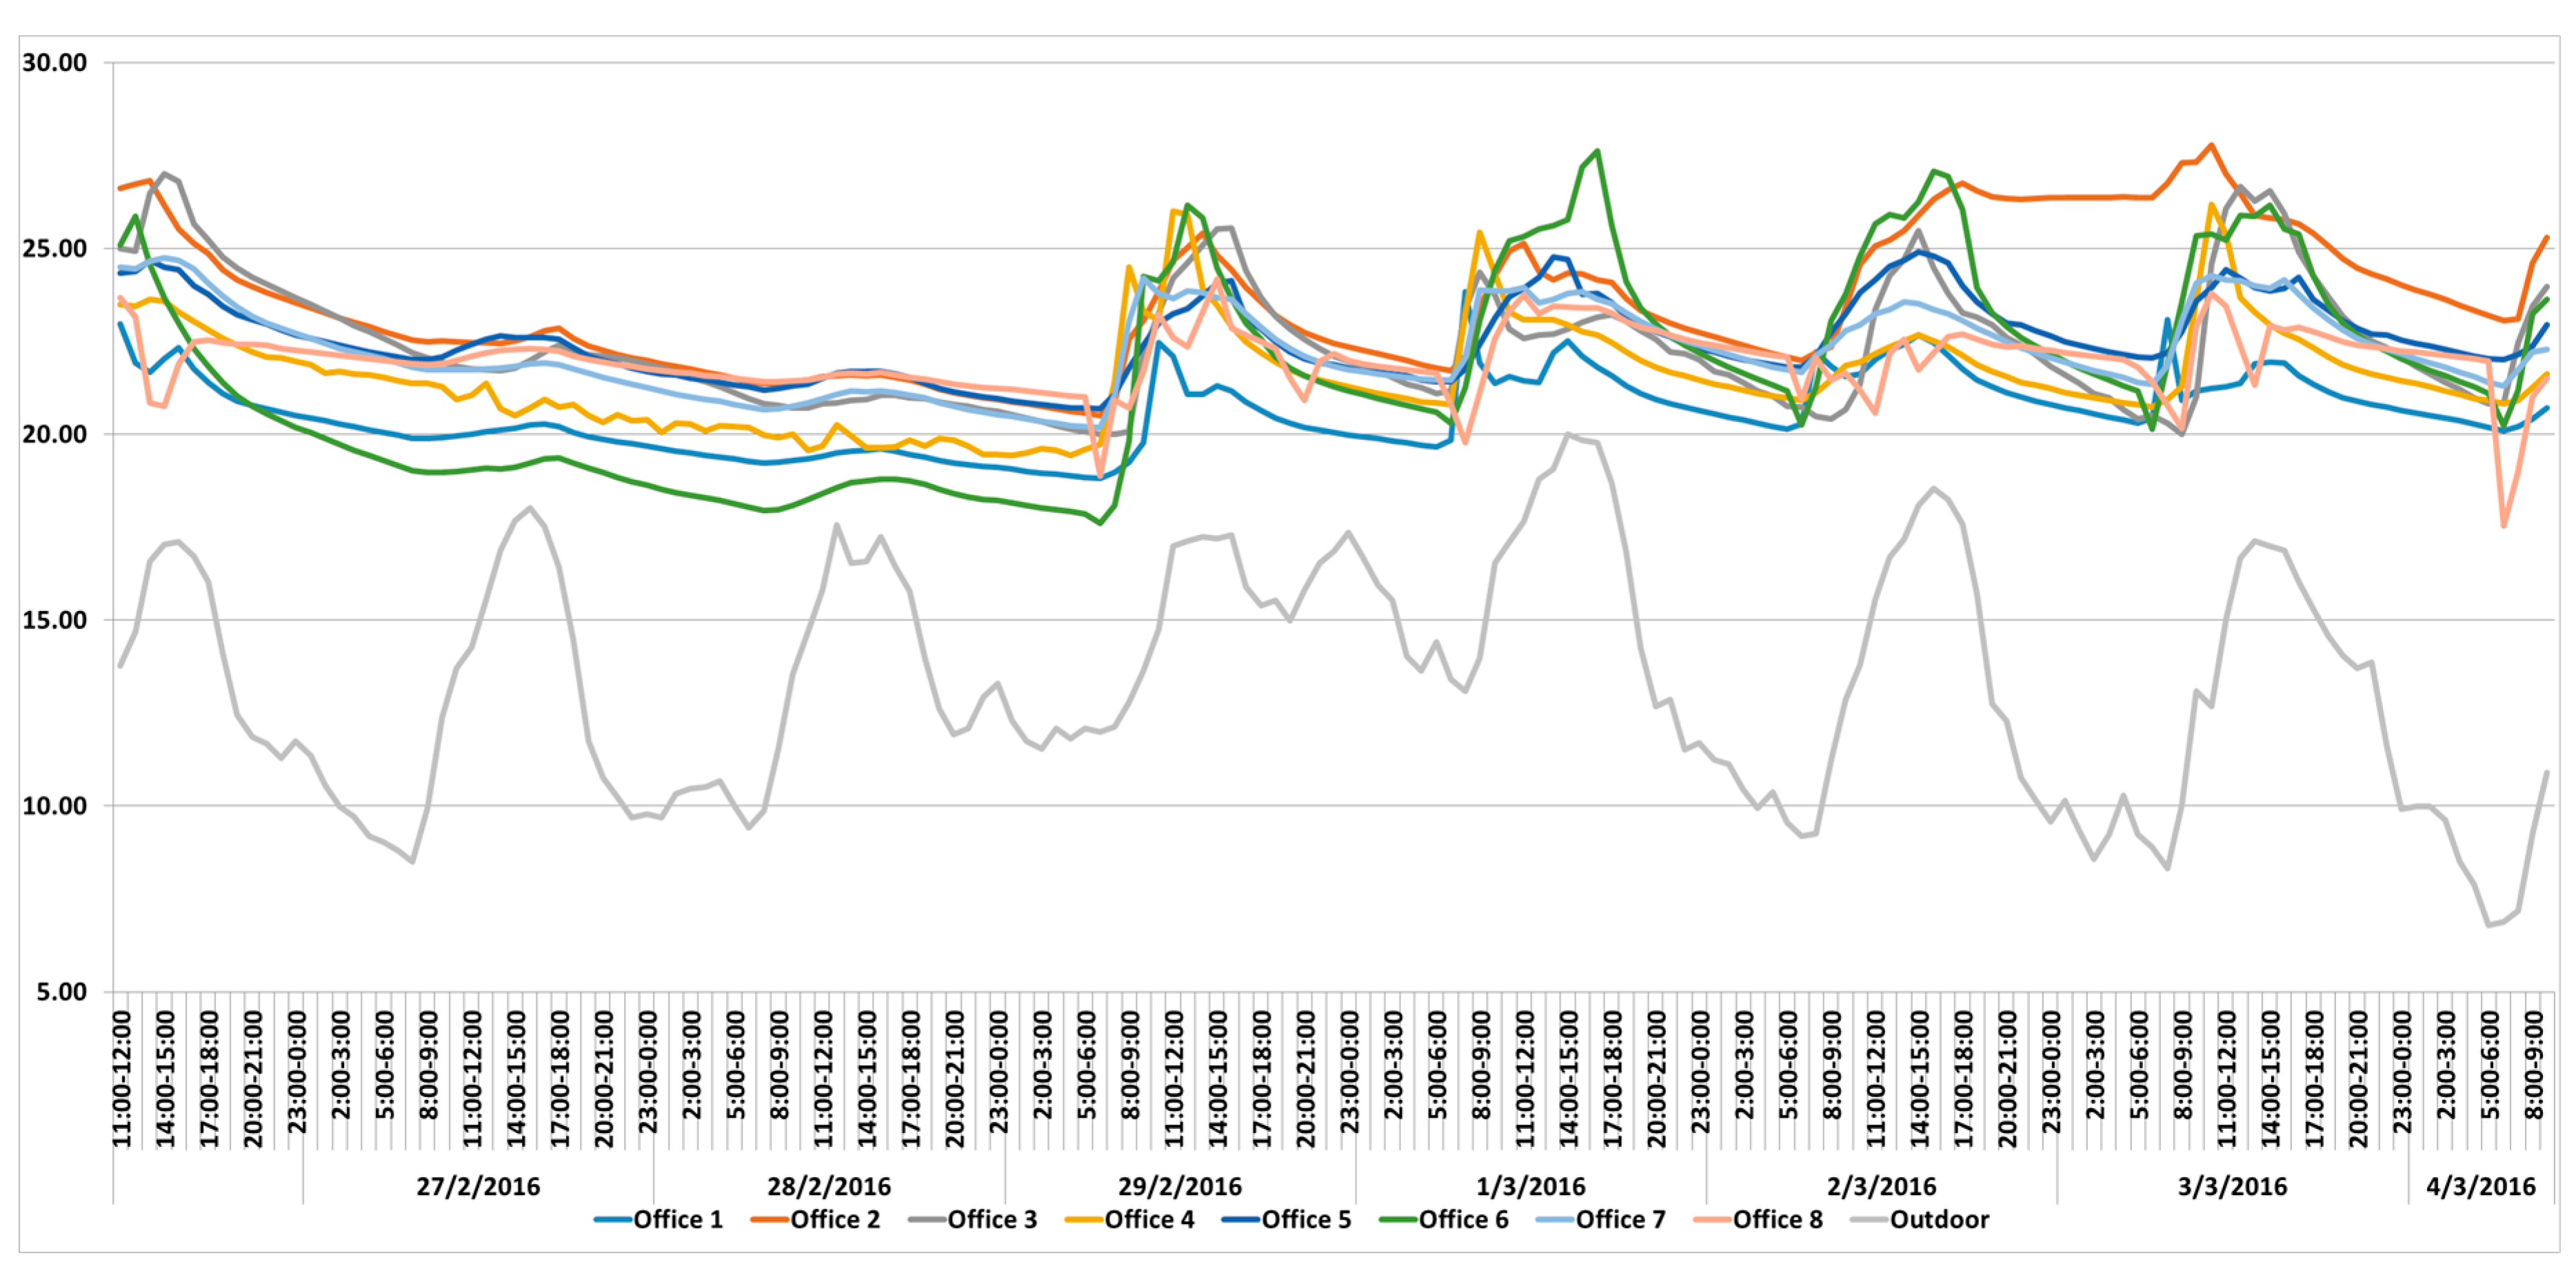
Measurements in Building B were conducted in the winter (26 February–4 March 2016) and summer (12–19 September 2016) periods. The analysis during winter (
Figure 4) highlighted that the indoor air temperature conditions correspond to a comfortable working environment for the occupants, although at noon high temperature levels are monitored. The building is in that sense rather overheated, as a result of its good thermal insulation, its inadequate ventilation, as it will be seen in the next section, and a rather inefficient thermostatic control. The quality of the building’s thermal insulation and high thermal storage capacity of the building’s envelope are proven by the fact that during the weekend (27–28 February 2016) the temperature levels decrease only slightly compared to weekdays, despite the lack of heating and internal loads.
Moreover, the importance of the limited exposure of the façade to solar radiation due to the building density of the area as depicted from the close horizon (the surrounding built area of the building), additional heating means is shown especially in cases of Offices 4 and 5. Although both offices have the same orientation and location in the building, a 2 degrees’ air temperature difference is monitored. The main causes of this outcome are the differentiation of the facade’s insolation and the capability of the occupants’ to modify the indoor air temperature. The close horizon of Office 5 includes many buildings and therefore only minor solar gains can be attained. On the contrary Office 4 has less buildings affecting its solar gains and also, additional portable heating means are used by the occupants.
Also, during summer (
Figure 5), the offices of the upper floor (Offices 1, 2, 4 & 5) experienced the higher temperature conditions, especially during the weekend; this didn’t affect employees, as the office was not used, but it does reflect the building’s thermal behavior. Moreover, the analysis shows that in all areas under evaluation, except for Office 5, the air temperature does not exceed 27 °C, creating a comfortable work environment for the occupants. Another outcome worth mentioning, is that the air temperature reduction monitored in all cases during the early morning period. This decrease, is a result of the natural ventilation of the areas by the cleaning personnel of the building.
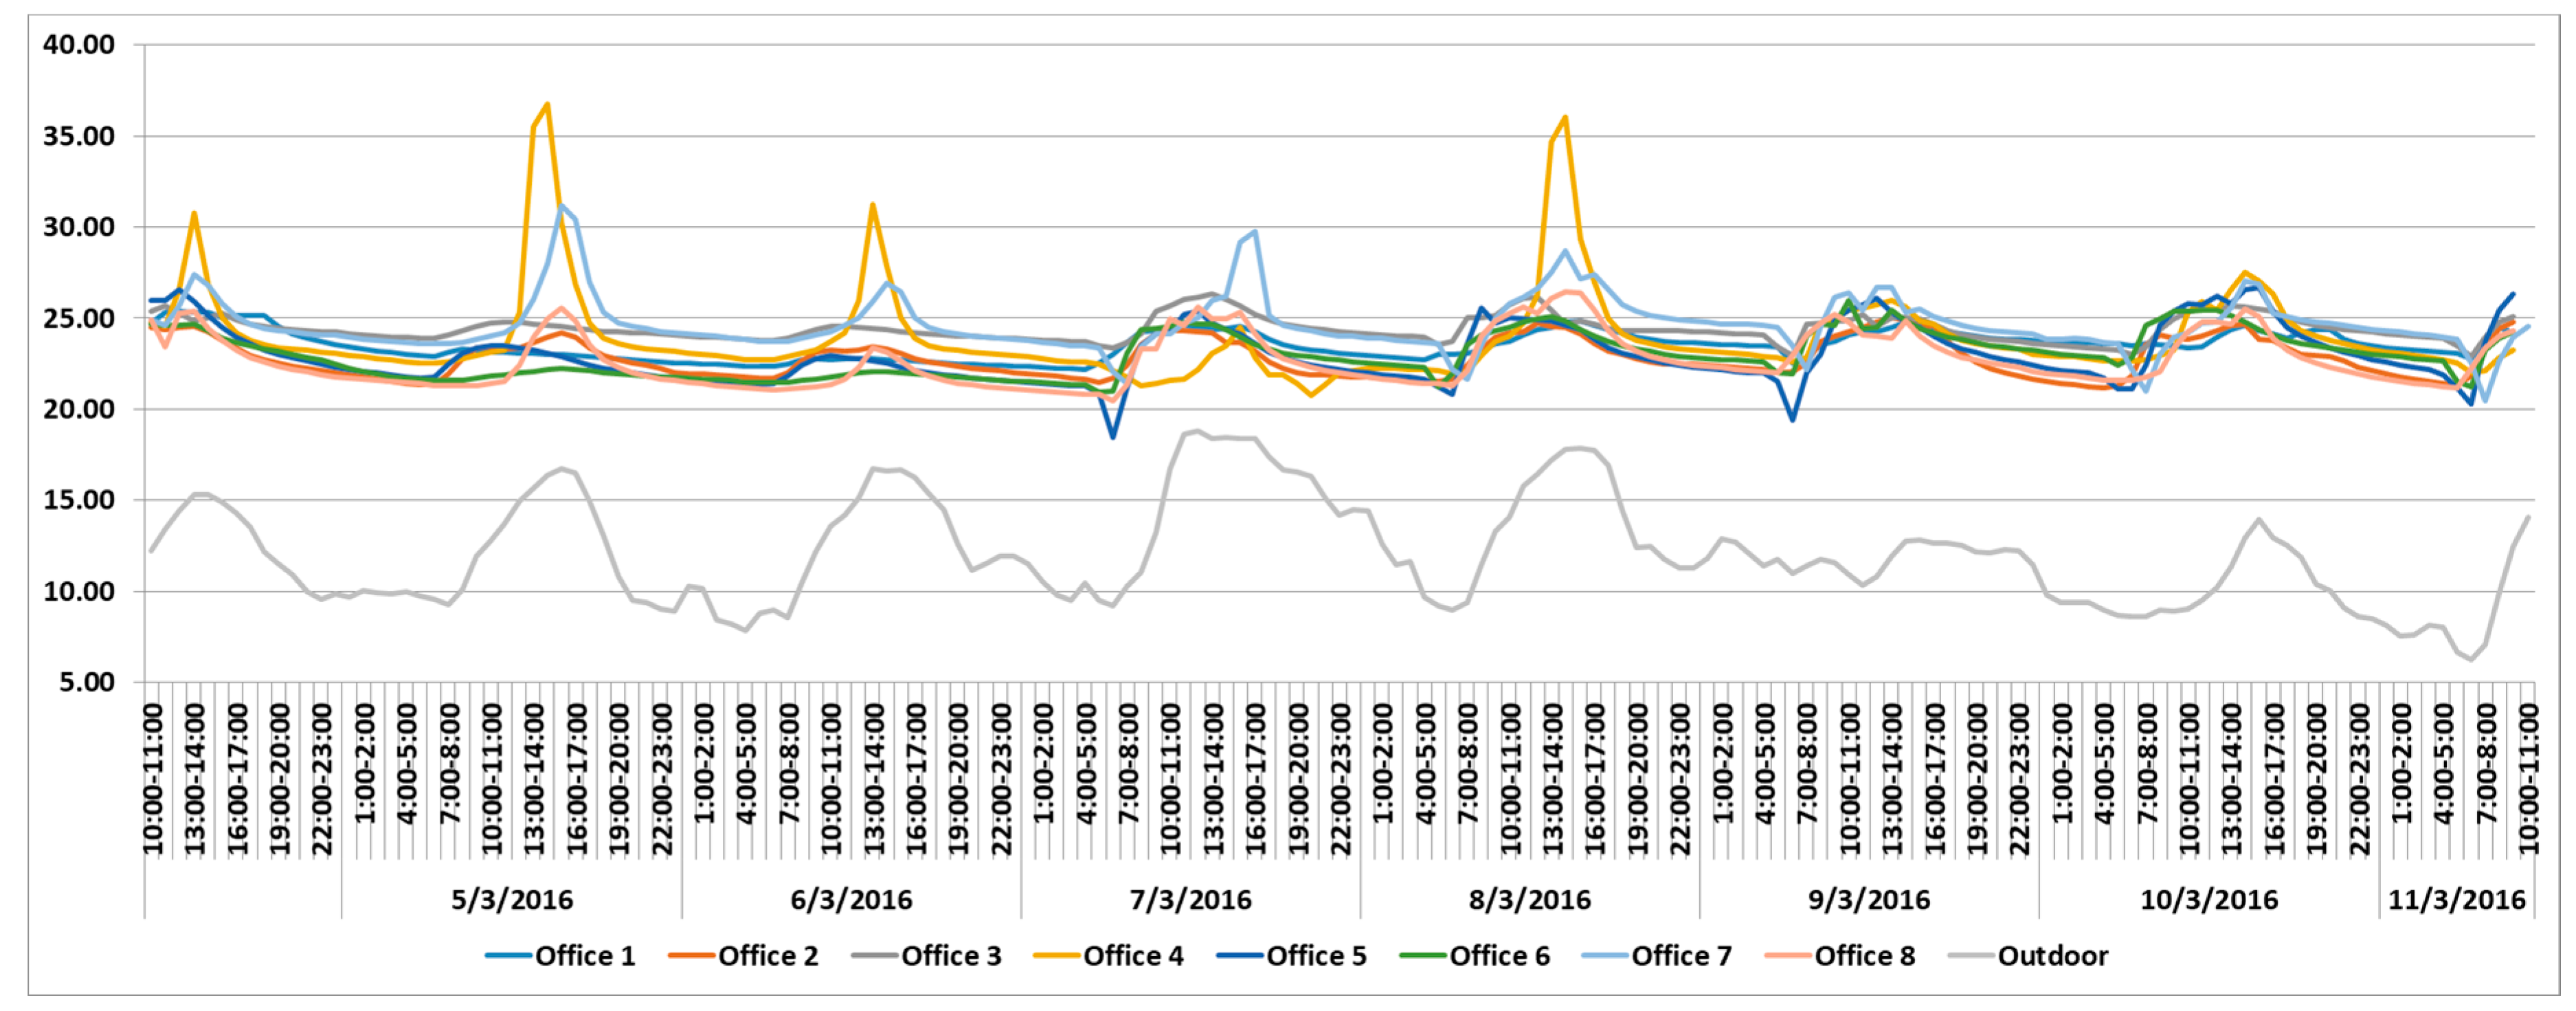
In case of Building C, the measurement period ran from 4 March 2016 to 11 March 2016 and from 19 September 2016 to 26 September 2016, for the winter and summer, respectively. As depicted from the analysis (
Figure 6), during winter the indoor temperature conditions in almost all monitored cases vary from 20 °C to 25 °C with isolated and temporary increases during the late afternoon period in the southwest oriented offices (Offices 4 and 7). The building’s winter performance is overall reasonable, with good thermal comfort conditions.
In the summer (
Figure 7), the temperature values monitored are also good, not exceeding 26 °C with one clear exception: the overheating of the southwest oriented offices during the late afternoon period is drastic, especially in case of Office 4, which is on the upper floor and hence more exposed; in this case the indoor temperature reaches 35 °C. It is clear that the orientation of this part of the building, combined with the lack of sun protection, leads to very unfavorable conditions, which cannot be offset by the air-conditioning system. In all other areas under evaluation, the temperature conditions can be characterized as ranging from adequate to comfortable, as the temperature records only a slight differentiation with a range from 24 °C to 26 °C. Therefore, very satisfactory indoor temperature conditions are monitored in the majority of the offices, except for the southwest oriented ones.
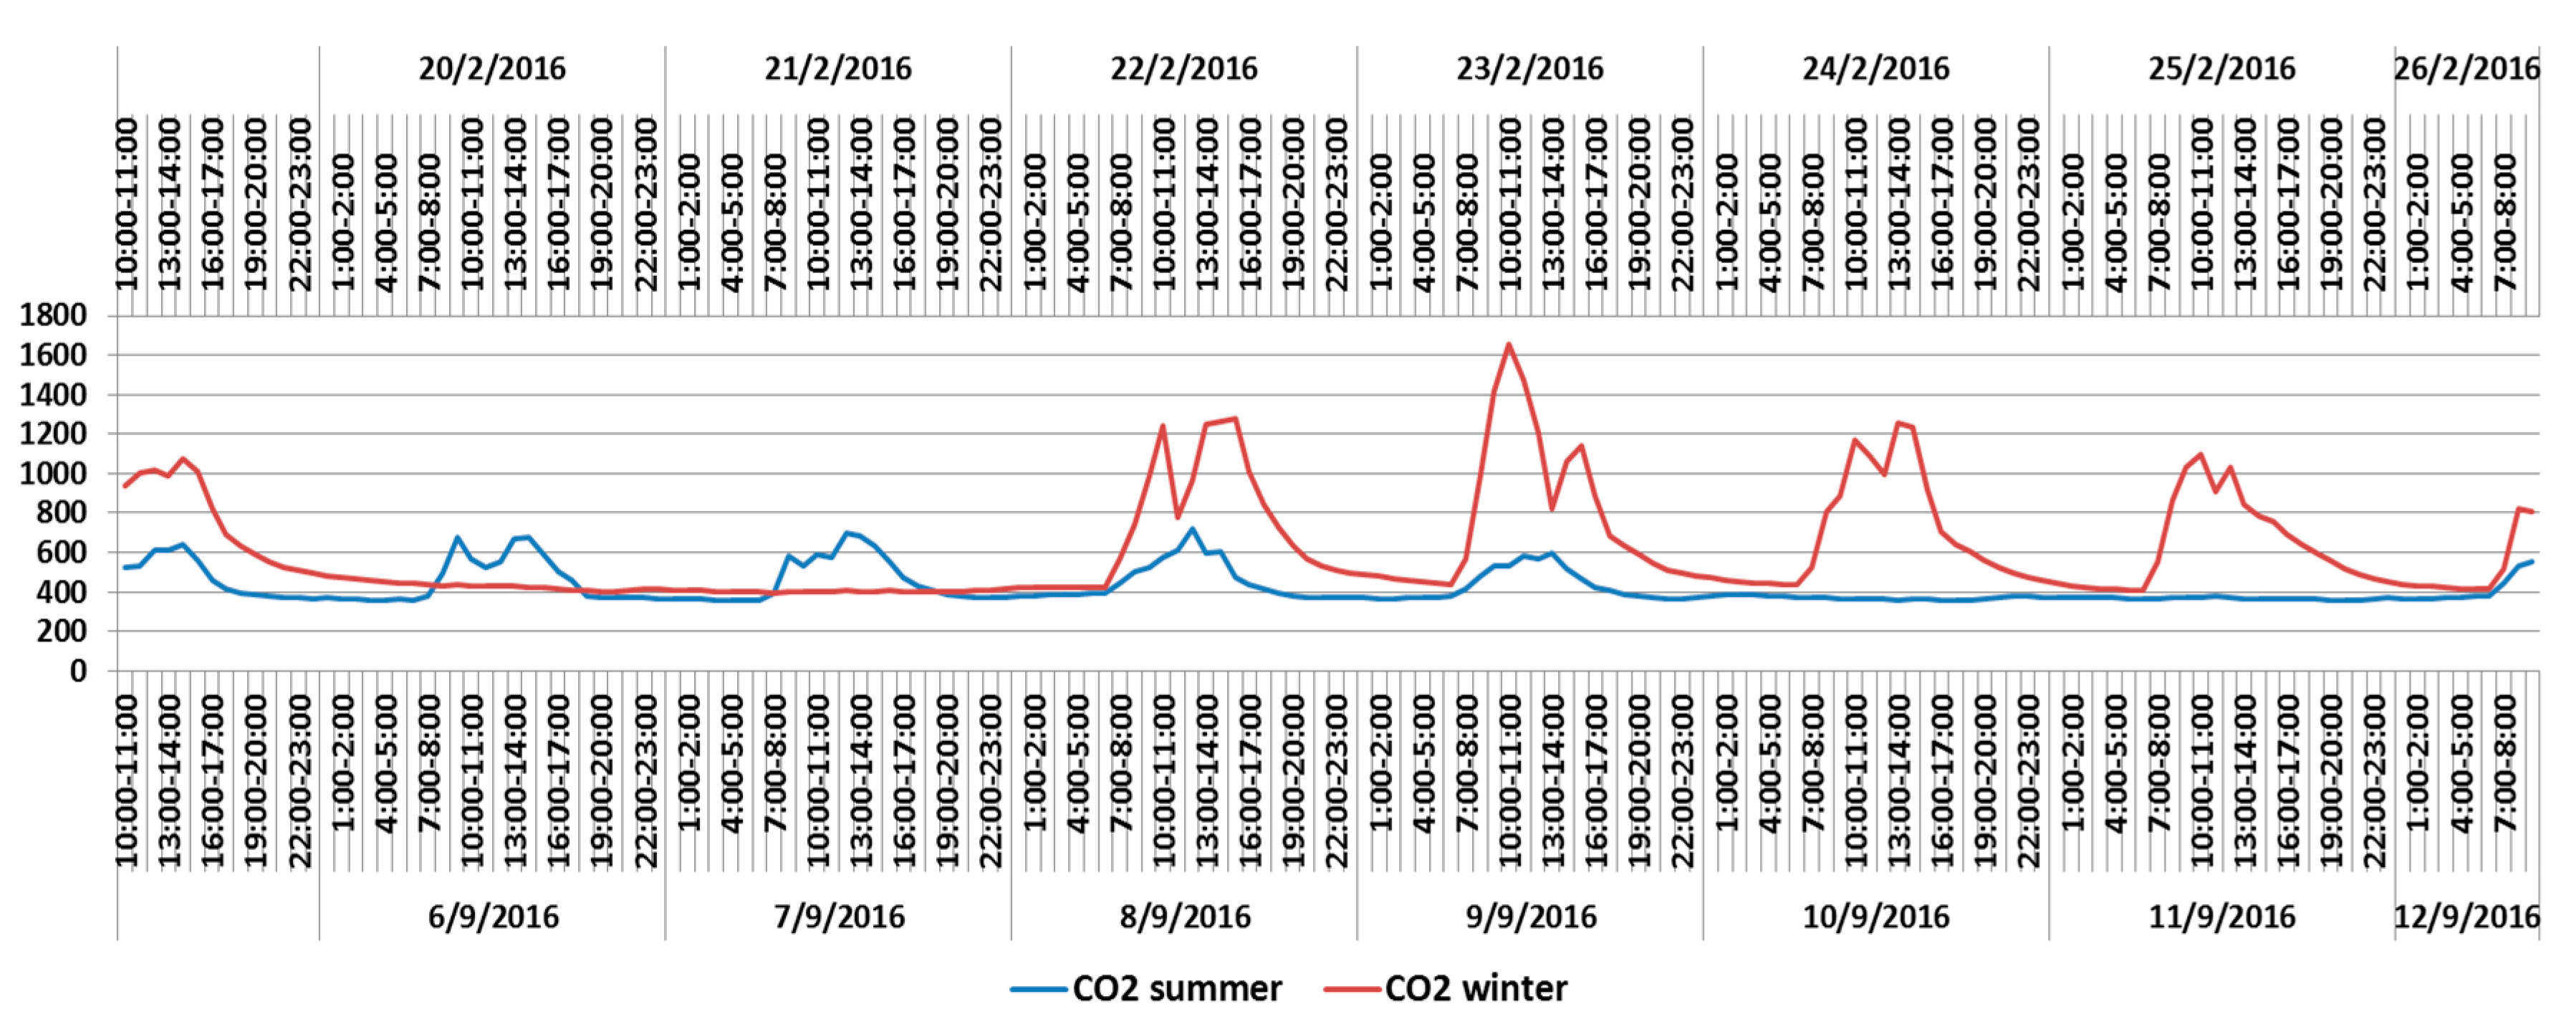
4.1.2. Indoor Air Quality
Apart from the thermal comfort, IAQ is also important, therefore CO
2 levels were measured, as they constitute a representative index of the ventilation and the prevailing air quality. The results of the measurement period are presented in
Figure 8,
Figure 9 and
Figure 10 for the respective buildings under evaluation.
The indoor CO
2 levels are evaluated based on the outdoor CO
2 concentration, in accordance with ASHRAE 62.1:2013. As outlined in Annexes B and C of the guideline, a stable concentration level of CO
2 at 700 ppm above the outdoor levels is recommended, as this ensures a comfortable and widely acceptable IAQ. The accepted levels of CO
2 concentration of the external environment vary from 300 to 500 ppm, therefore a maximum indoor concentration level of 1000 to 1200 ppm is recommended. Conditions where the levels of CO
2 exceed 5000 ppm can be characterized as extremely dangerous [
42].
As deduced from the analysis, the CO
2 levels differ during the week. In the cases of Buildings A and B, which are naturally ventilated, the measured CO
2 levels during winter vary from 500 ppm in the morning to 1200 ppm at noon and reach for a short period of time even higher levels (
Figure 8 and
Figure 9). The office area where the CO
2 sensor is placed, in the case of Building A, has four permanent occupants and is rarely ventilated; moreover, as it is a public service building, a varying number of citizens (on average 15 per day) visit the office, but it can occur that they come to the building almost at the same time, within a period of two hours, thus leading to high CO
2 production rates. Regarding Building B, in the area under evaluation, two people are permanently working and is determined that almost twenty people enter the office during a typical day.
The summer measurements indicated that the CO2 levels during office hours vary at lower and acceptable levels. This differentiation between the winter and summer measurements is a result of the combination of climate conditions that allow for a more frequent and intense natural ventilation and of the reduced presence of public and, in some periods, of employees due to leaves. As the interviews indicated, during summer, the employees stated that they ventilate their offices more often and over prolonged periods. Furthermore, the occupants’ density is reduced, due to the vacations of the employees, and visits by the public are reduced to a significant extent.
Regarding Building C, the analysis outlined that the CO
2 levels for both seasons under evaluation, do not exceed the 1200 ppm and vary from 400 ppm to 1000 ppm during summer and 400 ppm to 1200 ppm during winter (
Figure 10). In the area under evaluation two people are permanently working and is was determined that almost fifty people enter the office during a typical day. In conclusion, slight differences are noted between the two seasons. The main reason for this outcome is the existence and operation of the mechanical ventilation system, which allows for an almost constant ventilation, in contrast to buildings A and B where the users’ determine arbitrarily the ventilation.
4.1.3. Thermal Comfort
The last parameter evaluated is the comfort sensation as expressed by the PMV index. The determination of this parameter is achieved by utilizing the measurements of a Testo 480 instrument (Testo, Lenzkirch, Germany). In order to determine the PMV index, the metabolic rate and the clothing of the occupants is specified. Based on ISO 7730:2005, a metabolic rate of 70 W/m
2 was chosen and the clothing of occupants’ corresponds to 1.1clo and 0.6clo during winter and summer, respectively, which involves typical office activity and casual office clothing choices [
6].
In Building A, during the measurement period, the PMV index varies from 0 to 1 during winter and from 0.5 to 2, during the cooling period (
Figure 11). The minimum values are monitored during the early morning and the highest at 4:00 p.m. The increase of the PMV index affects, as expected, the PPD index; however the monitored conditions correspond to preferable work environment conditions. During the cooling period, despite the use of cooling systems, the value of PMV index rises due to the use of the area. Therefore, preferable conditions for the occupants prevail only for a small period of time during the working day, as especially in the late afternoon period a significant part of the occupants (more than 45%) express discomfort.
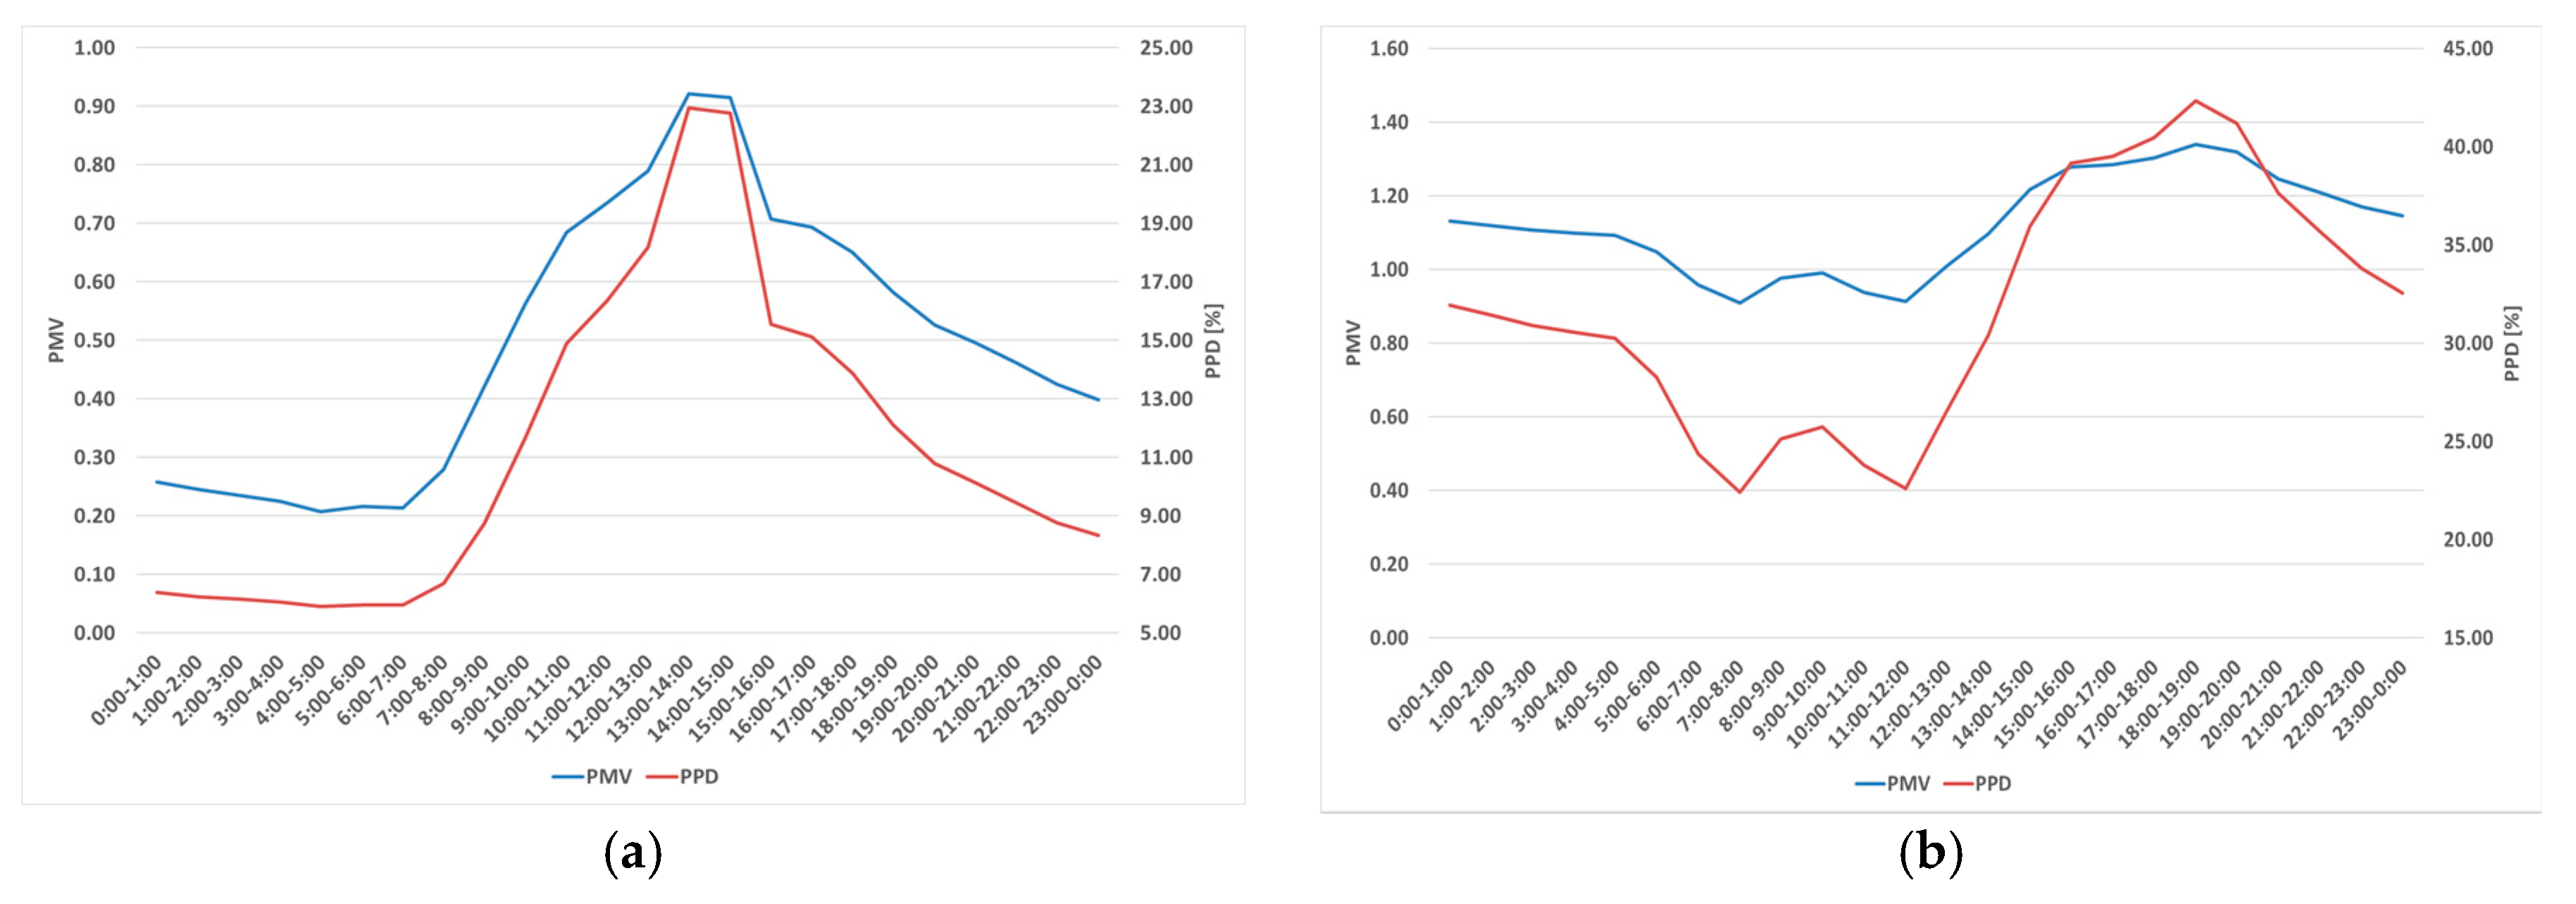
The same variation pattern of PMV index is indicated in Building B, varying from 0.2 to 0.9 during winter. Considering a typical day (
Figure 12a), the analysis outlines that during early the morning period, the monitored PMV index is lower compared to the office hours period, when a gradual increase is determined. The PMV index levels correspond to desirable indoor environment conditions. During summer, the daily variation of PMV index is different. In detail, the index’s range is determined to be between 0.8 to 1.5, with slight variations during the typical day (
Figure 12b), leading to a higher index level after 2:00 p.m., where 35% of the occupants are expressing their dissatisfaction based on the results of the in situ monitoring.
Finally, the analysis for Building C showed that the PMV index ranges from −0.08 to 1.6 during winter and from 0 to 1.4 during summer, achieving suitable indoor environment conditions for the users. In
Figure 13, typical days of both periods are presented and it can be deduced that during the heating period a gradual increase of the PMV index is determined reaching the highest values after 2:00 p.m. In the case of the cooling period, the PMV variation pattern is similar to the one monitored during winter, reaching lower values and achieving higher percent rates of occupants’ satisfaction. Therefore, preferable indoor conditions are observed for the productivity and well-being of the occupants, creating a comfortable work environment.
An analytical presentation of the collected data for all cases is given in
Table 4 and
Table 5, both for winter and summer periods.
4.2. Qualitative Evaluation
Initially, a descriptive analysis was conducted in every building, denoting the occupants’ perceived comfort sensation in their office. In detail, the respondents had to evaluate in the distributed questionnaire the indoor conditions of air temperature, air quality, lighting and noise level and comfort as subjectively perceived in a Likert scale from 1 (unsatisfactory) to 7 (satisfactory). This qualitative evaluation was performed for both winter and summer periods and the results of the analysis are depicted in
Table 6.
In the case of Building A, the analysis showed that the majority of the respondents were satisfied with the indoor conditions and described them as neutral in both seasons. Regarding the indoor air temperature, the majority of the occupants, 80% and 70% for winter and summer respectively, expressed satisfaction with 50% and 35%, respectively, noting a level of satisfaction over 6 in the 7-scale questionnaire. In case of the air quality a differentiation is observable between the winter and summer periods. During winter the majority of occupants (63.2%) expressed dissatisfaction with the IAQ, whereas during summer the situation is reversed, with the majority of the respondents (72.2%) expressing satisfaction with this parameter. Furthermore, the total lighting and noise level were evaluated and the analysis inferred a positive reaction of the occupants over this issue. In detail, 77.3% and 75% of the occupants scored a satisfaction level over 5 concerning lighting and over 4 concerning noise during winter and summer, respectively. Finally, the overall perceived comfort of the occupants was determined, with 63.6% and 65% of the occupants marking it as satisfactory (grade over 5).
Furthermore, the statistical analysis in case of Building B documented that the majority of respondents expressed their satisfaction with the indoor conditions during both winter and summer. In detail, 73.6% of the respondents expressed their high satisfaction concerning indoor air temperature during winter, while 45% said so during summer. Moreover, during summer 25% of the respondents scored this parameter with a 4 on a scale of 7. Also, the IAQ was evaluated by the majority of the respondents (76.2%) to range from slightly unsatisfactory to slightly satisfactory during the winter period. However, in the summer period 38.1% were unsatisfied while 28.6% scored this parameter with a 4 on a scale of 7. The total lighting level was also evaluated and the majority of the respondents expressed their high satisfaction, with 61.9% and 57.1% for winter and summer, respectively. The total noise level parameter was also evaluated. In this case, 42.8% and 47.6% of the occupants expressed their satisfaction over this issue (scored over 5) during winter and summer, respectively, while 33.3% in both cases evaluated it with a score of 4. Concerning the overall perceived comfort, 71.4% of the occupants are satisfied over this issue during winter, however, during summer 71.5% characterized it as ranging from slightly unsatisfactory to slightly satisfactory.
Regarding Building C, the analysis showed that the majority of the occupants were satisfied with the indoor conditions during winter and summer. The majority of the respondents, 73.7% and 64.9%, characterized the indoor air temperature as satisfactory during the winter and summer periods, respectively. Moreover, the occupants’ attitude towards IAQ was evaluated and it is noted that during winter 60.8% and summer 50.9% of the occupants are satisfied. In the case of summer, 28.3% of the respondents evaluated this issue as neutral, with a 4 in the scale of 7. Furthermore, the total lighting and noise levels were evaluated by the respondents. In the first case, an overall satisfaction in both cased was denoted with 83.9% and 82.5% during winter and summer respectively, whereas concerning the noise levels, half were satisfied and 37.1% dissatisfied during winter, and 54.8% versus 37.1%, respectively during summer. Finally, the overall comfort as perceived by the occupants was determined during winter and summer periods and the analysis deduced that 74.2% and 72.6%, respectively, are satisfied over this issue.
Moreover, in the framework of this study, probable correlations between the occupants’ perception of comfort and their social characteristics were investigated by using the SPSS Statistics software version 23, distributed by IBM, USA. An inferential analysis was implemented and due to the nature of the data, a non-parametric Wilcoxon analysis was conducted. The results of the analyzed correlations are depicted in
Table 7.
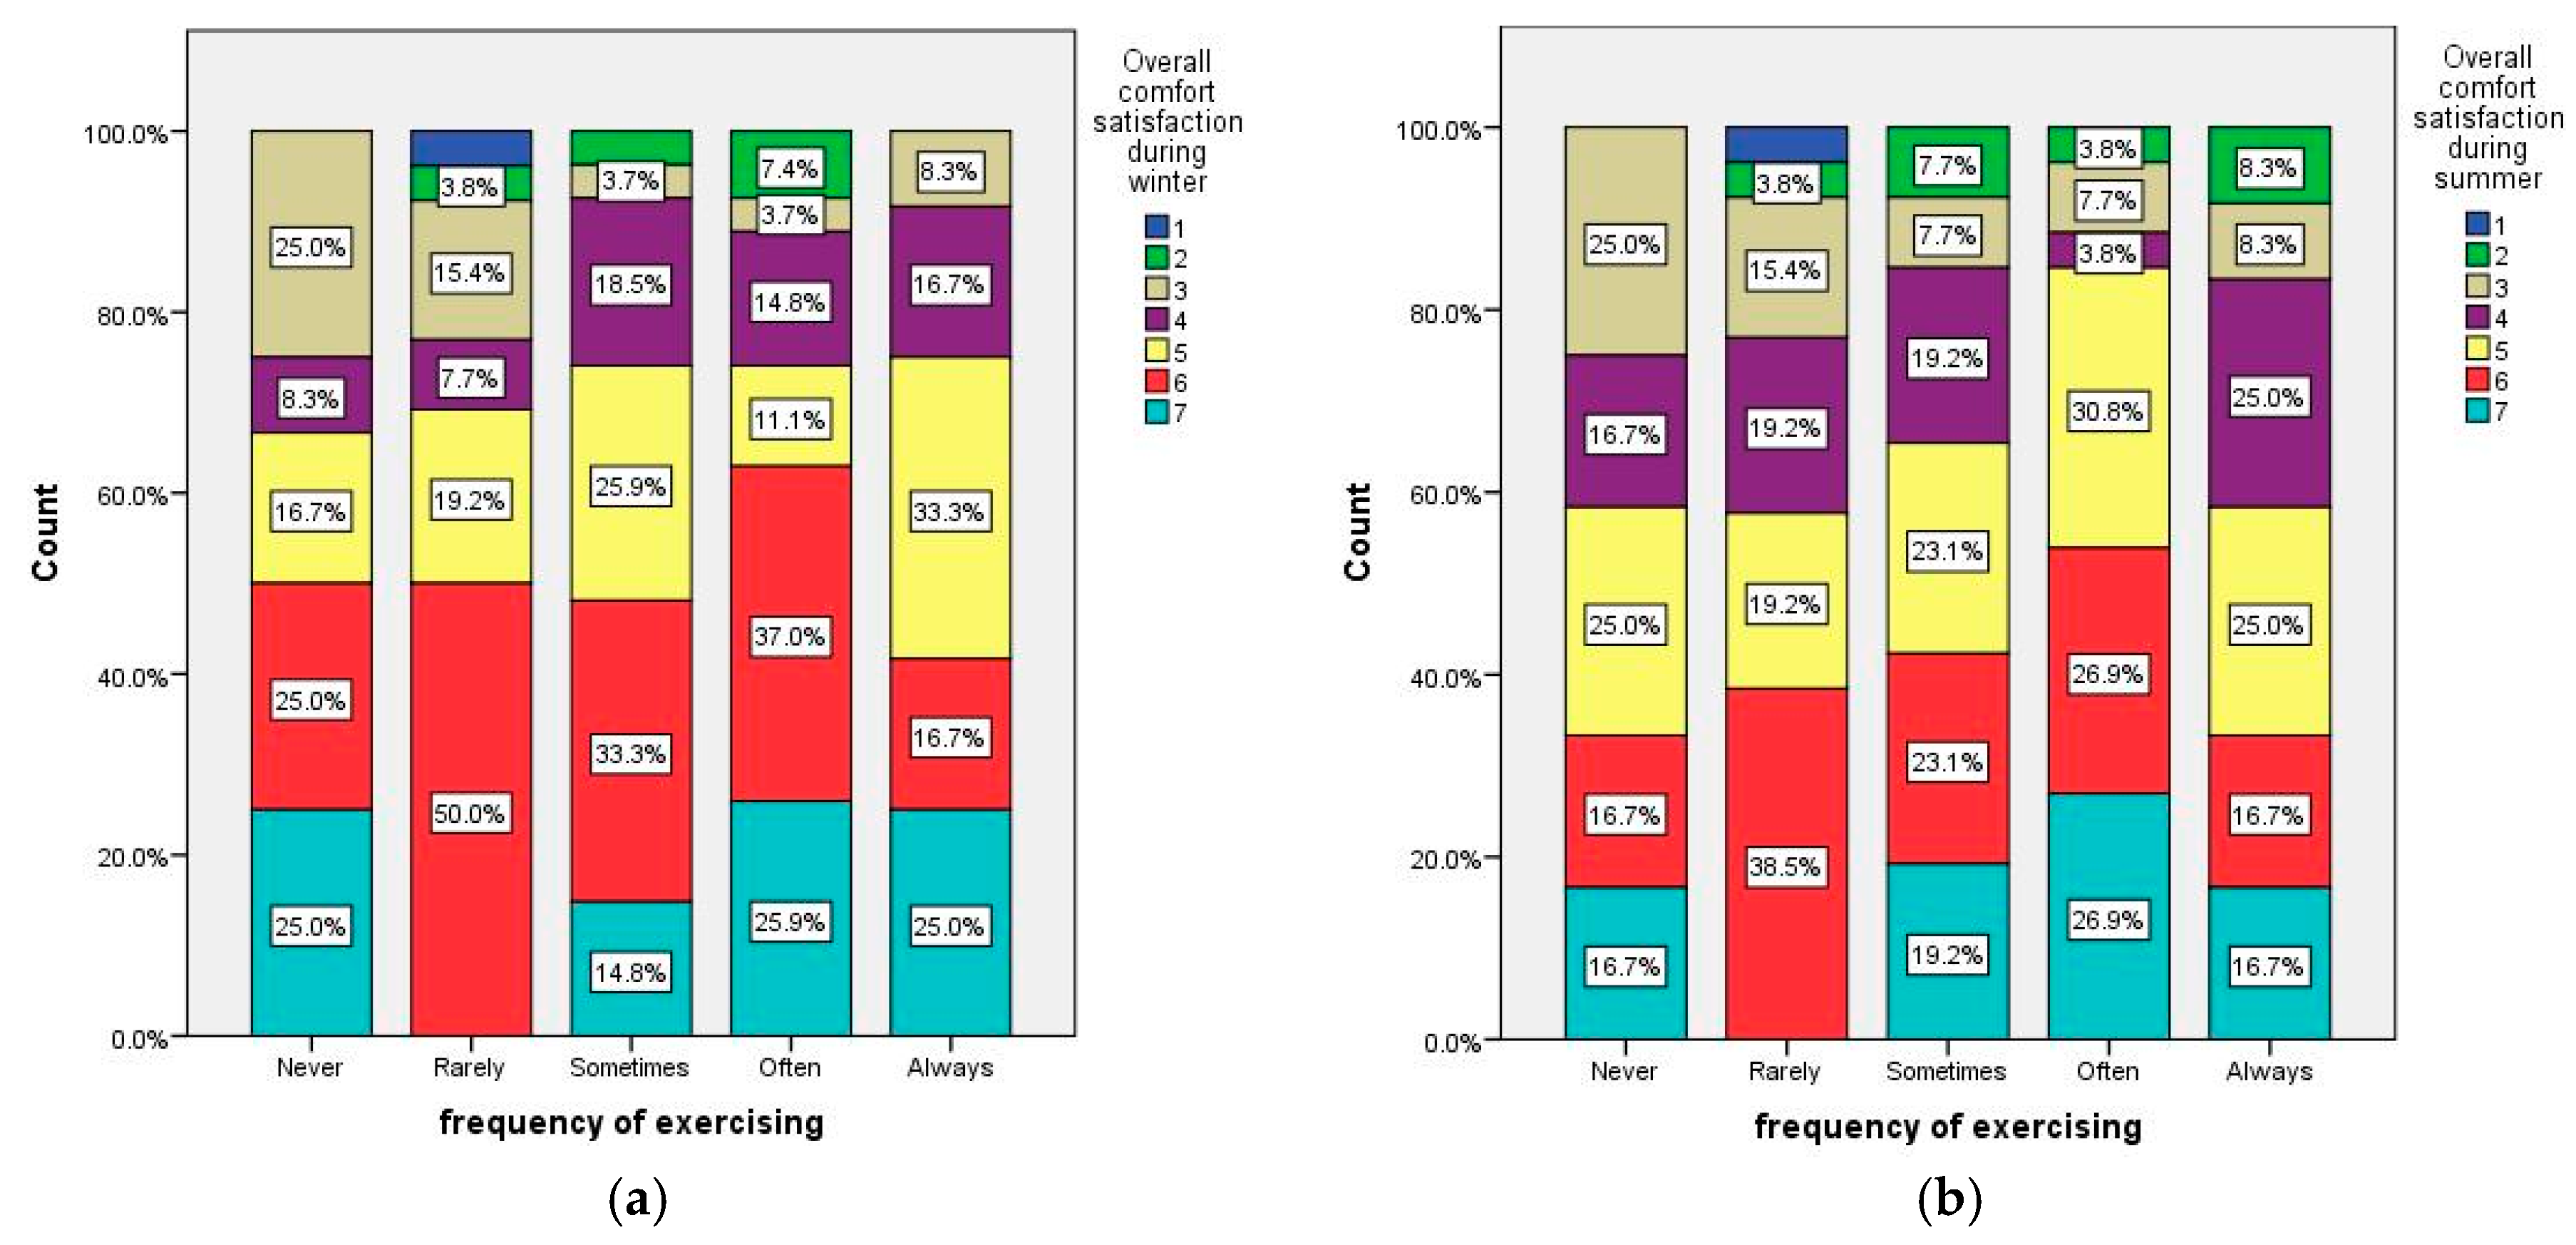
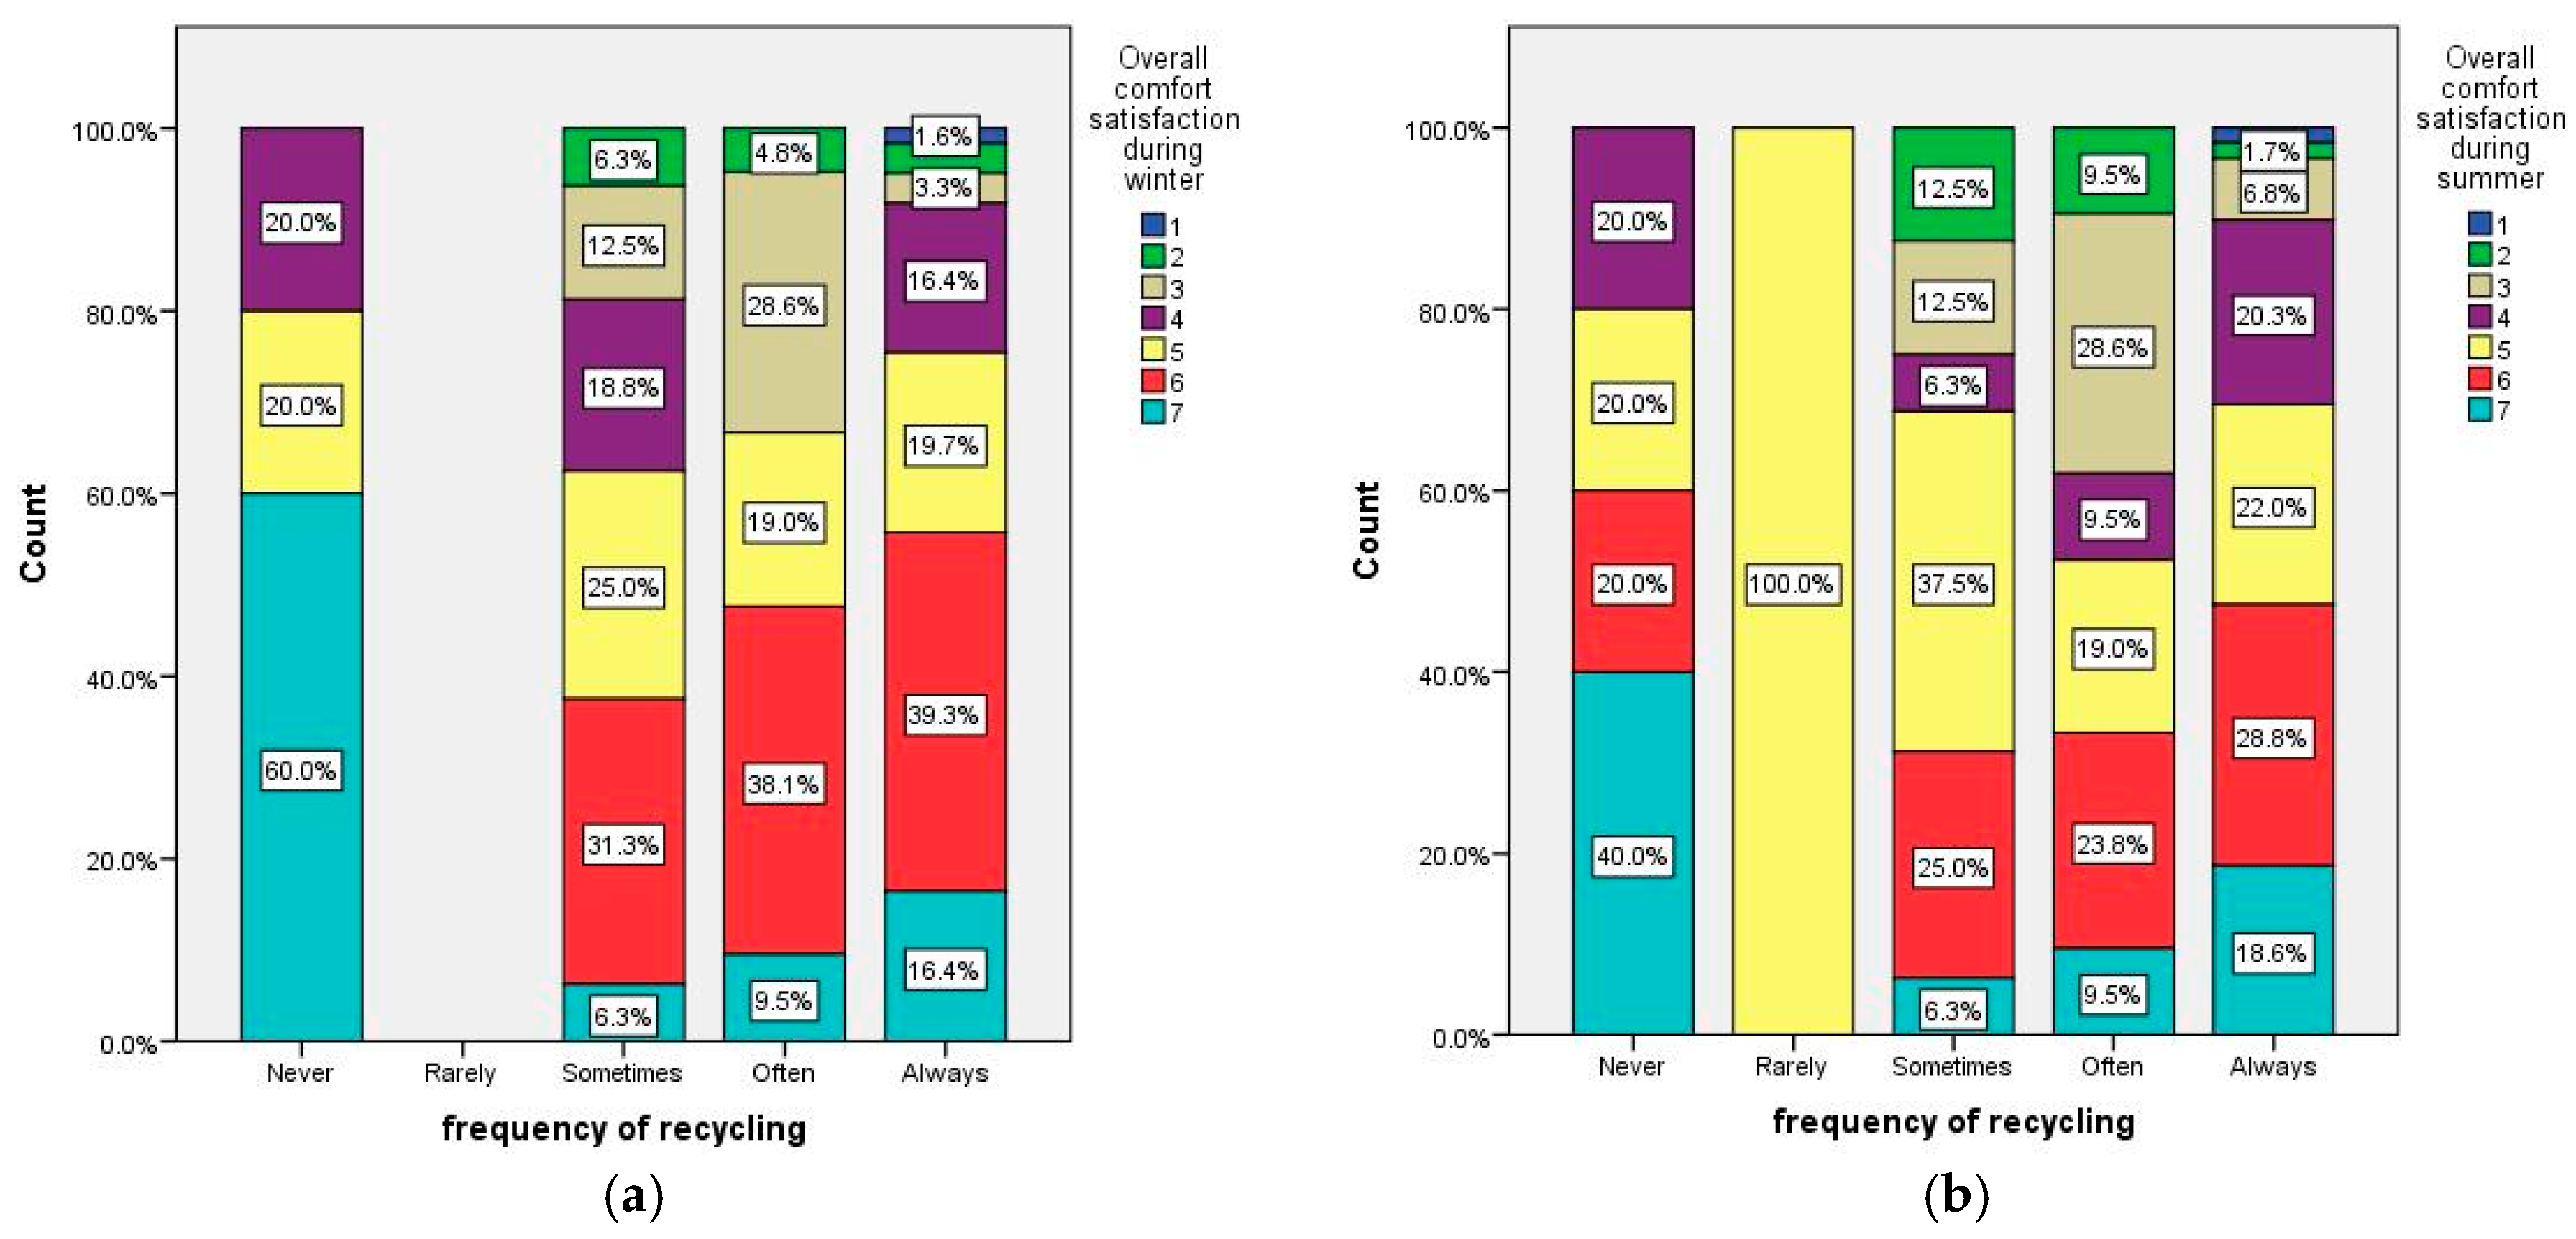
Regarding the occupants’ perception of overall comfort satisfaction for both seasons, probable correlations are evaluated and it is deduced that all pairs presented in
Table 7 are correlated with a confidence interval of 99% (sig < 0.01), with the frequency of exercising (as an expression of a health-conscious way of life) and recycling (as an expression of environmental conscious way of life) along with the clothing choice and the occupants’ sensibility in temperature differences. In detail, the analysis depicts that in both seasons, the occupants who regularly exercise and always recycle express a high satisfaction concerning the perceived overall comfort satisfaction in both seasons (
Figure 14 and
Figure 15). In detail, the respondents were asked to determine how often they exercise and recycle in their life (questions A. 15a-b,
Supplementary Materials).
More specifically, regarding the frequency of exercising, the analysis depicted that the majority of the respondents with 55.8% and 53%, who are regularly exercising, express high satisfaction concerning the overall comfort sensation during their stay in the office area in the winter and summer period, respectively. Moreover, the occupants’ recycling attitude was monitored as a parameter of their environmental consciousness, and the analysis depicted a statistically significant correlation. In detail, the analysis denotes that 85.4% of the respondents expressed high overall satisfaction during winter period with more than 68% of them recycle from often to always and 52.7% recycle always. Regarding the summer period, the percentage of occupants’ satisfaction is reduced reaching 66.7%, with 60.3% of them recycling always. In this line of approach, we can conclude that those initial results outline very promising outcomes regarding these indirect health- and environment-centric specified parameters.
Moreover, the analysis focuses on the relations among perceived overall comfort satisfaction during winter and summer periods and the clothing choices and sensitivity in temperature differentiations by the occupants. Specifically, as shown in
Figure 16, when the occupants choose very light clothing, during summer, and medium to warmer, during winter, their perception of overall comfort satisfaction is high for the winter period. This outcome outlines the occupants’ tolerance to temperature differentiations. In detail, it can be deduced that the occupants’ clothing attitude highlights that the indoor conditions during winter are in preferable levels, as only when using medium clothing can preferable comfort conditions be achieved. Moreover, those people tend to adapt more difficultly to the higher temperature conditions during summer and therefore prefer light clothing choices. In case of their overall comfort satisfaction during summer, it is noted that high levels can be achieved when the light clothing choice is made.
Finally, the relation between the overall comfort and the occupants’ sensitivity in temperature variation was evaluated. From the conducted analysis is denoted, that the occupants, who express high satisfaction for the indoor overall comfort (
Figure 17) for both seasons, are self-described as medium to low sensitive to temperature differentiations. This outcome indicates that the occupants can easily adapt to the indoor conditions especially during winter.
5. Discussion and Conclusions
Documentation and evaluation of indoor conditions in office buildings is crucial, as the main aim of the contemporary regulations is the combination of ensuring both buildings’ energy efficiency and occupants’ well-being, by means of high indoor environmental quality. This aim is expected to determine building design for the coming decade, as we move towards the (nearly) Zero Energy Building. It was in this line of approach, that a new integrated methodological approach was developed by the authors. Its main goal is to consider the occupants’ attitudes and personal features, as the occupants are a crucial link in the decision-making process, in order to design and refurbish more energy efficient and more comfortable office buildings.
In detail, the developed methodological framework specified that the interpretation of the occupants’ attitudes and needs constitutes a multi-criteria problem, which has a deep impact both on the design process of a construction and on the evaluation of the conditions prevailing in buildings. The current state of regulations and the prevailing practice is that the determination of comfort is achieved by means of thermophysical indoor environment parameters and occupants’ interaction. Therefore, this approach lacks a more personalized aspect, where the occupants’ socioeconomic and individual/psychometric characteristics are considered. It is the goal of this methodological approach to try and bridge this research gap.
As part of the methodological framework’s development, a preliminary implementation was carried out, by means of an extensive evaluation of three office buildings, and a series of interesting results were obtained and are presented in this paper. The evaluation of three office buildings in the Mediterranean region was performed as an integrated one, divided into two main sectors, a quantitative and a qualitative one. The quantitative evaluation concluded that in all cases and for both seasons, the indoor temperature conditions range corresponded to acceptable levels, revealing comfortable indoor environment conditions. Only in certain monitored areas during summer and for a specific period, was overheating observed, due to the areas’ orientation and lack of sun-protection and of passive cooling techniques. Also, the IAQ evaluation in cases where no mechanical ventilation is used, showed that there are better IAQ conditions during summer, compared to winter, due to the reduction of natural ventilation performed by the users in the latter case. Another parameter used for the evaluation was the PMV index; its analysis led to the result that comfortable conditions prevailed during winter, albeit sometimes too warm in one building. However, during summer and in cases without mechanical ventilation/central air-conditioning, discomfort occurred after 2:00 p.m., as a result of unfavorable orientation and heat accumulation.
In order to minimize those problems, additional constructive measures should be applied. In detail, the overheating of the upper floor areas can be reduced through the use of innovative cool materials on the roof, so that the solar loads can be reduced. The use of external sun-protection is also of high significance, it is however not easily applicable in existing buildings, as it implies a change in the façade’s architecture. It should, however, be considered as part of a major refurbishment. Moreover, the implementation of mechanical ventilation systems can lead to a much more controlled and constant ventilation and hence to high IAQ levels, independently of the outdoor conditions and the occupants’ attitude towards natural ventilation.
The findings of the numerical evaluation regarding temperature conditions, IAQ and PMV index are confirmed by the qualitative analysis. In detail, a general acceptance of the indoor air temperature conditions during winter and summer is confirmed by the majority of the respondents. However, in certain cases dissatisfaction due to overheating is expressed by the occupants, especially in Building B during the summer period. Regarding the IAQ, the monitored differentiation of the CO2 concentration levels between winter and summer period as a result of the limited ventilation during winter in natural ventilated buildings, is being noticed also by the respondents. In detail, the respondents in the cases of Buildings A and B expressed dissatisfaction regarding IAQ during the winter and satisfaction in the summer. On the other hand, the respondents of Building C, where a mechanical ventilation system is installed, expressed high satisfaction with the matter for both seasons. Regarding PMV index, the monitored data were confirmed by the survey results and therefore, further analysis on the social characteristics should be endorsed.
Furthermore, the linkage of the overall comfort perception to a variety of individual aspects was evaluated and the concluded findings are very promising. The conducted analysis highlighted that parameters such as exercising, recycling, clothing choices and occupants’ sensitivity to temperature changes can interact with the occupants’ comfort satisfaction. In this line of approach, it is determined that the implementation of a methodological framework where the user is on the epicenter and his individual characteristics are considered, can improve his comfort satisfaction. Therefore, further analysis on this direction has to be conducted, emphasizing on socioeconomic and environmental aspects as well as occupants’ attitudes and interaction with the indoor environment. A main goal of these analysis is the determination of the IPCMOB index.
In that sense, it was established that the integrated quantitative and qualitative evaluation of thermal comfort is not only important but also necessary, as it sheds a different light on the measured thermophysical properties. The study produced significant data, which have still to be further evaluated, in order both to assess and to elaborate proposals improving the prevailing conditions. This can set the boundary conditions for an efficient and effective deep renovation of the buildings in the years to come. Finally, it should not be overlooked that the indoor working environment conditions play a vital role in employees’ productivity, well-being and health. In this line of approach, further and more detailed analysis is needed, in order to highlight possible causes for dissatisfaction and elaborate solutions to those problems. Therefore, further analysis should be conducted in order to achieve a better understanding of building occupants’ needs and attitude towards an energy efficient and comfortable work environment.


