Efficiency Evaluation and Policy Analysis of Industrial Wastewater Control in China


1
Business School, University of Shanghai for Science and Technology, Shanghai 200093, China
2
School of Mathematical Sciences, Tongji University, Shanghai 200092, China
*
Author to whom correspondence should be addressed.
Energies 2017, 10(8), 1201; https://doi.org/10.3390/en10081201
Submission received: 24 July 2017
/
Revised: 7 August 2017
/
Accepted: 11 August 2017
/
Published: 14 August 2017
Abstract
:With increasing emissions of industrial wastewater and poor control measures, environmental pollution has become a serious issue haunting China’s economic development. Meanwhile, the current pollution management policy system in China is mainly under the supervision of the central government and executed by local governments. Under the current economic growth model of China, the industrial sector remains the dominant segment of our economy, which makes the Total Factor Efficiency (TFE) evaluation and policy analysis of industrial wastewater control decisive factors concerning China’s future economic growth and sustainable development. Based on existing studies of China and abroad, and with the help of a Data Envelope Analysis (DEA) model, this paper used 39 industrial sectors and their input-output data from 2003 to 2014 of China as Decision Making Units to calculate the TFE of wastewater control in different industrial sectors of China. Moreover, we have designed and adopted our own MATLAB programming for optimization solutions of multi-variable constrained nonlinear functions in order to obtain a more accurate estimation of the TFE of wastewater control. Based on our calculation results, this paper further explained the difference in TFE and policy implications across typical industries in China, and offered policy recommendations accordingly.
1. Introduction
China has achieved remarkable economic growth since the reform and opening-up in 1978. However, until today, the biggest segment of China’s economy, the industrial segment, still hasn’t evolved out of the traditional extensive growth model. This growth model featured by “high energy consumption, heavy waste, and heavy pollution” in order to pursue output has resulted in huge amounts of industrial pollution and caused severe damage to the environment during China’s fast industrial development, especially the industrial wastewater [1].
Industrial pollution refers to the waste or energy that directly or indirectly enters into the environment during the industrial production process and that pollutes the air, water or land damaging people’s health and living environments [2]. In the language of Economics, industrial pollution is a typical example of a negative externality: the social cost of pollution is higher than the private cost to the polluter, causing market failure due to the externality nature of the problem. The market mechanism cannot incentivize the polluter to voluntarily bear the external costs incurred, which will eventually be absorbed by the public, causing inefficiency in resource allocation and a decrease in the aggregate welfare of society, curbing the sustainable development of a country.
With the growing emission of industrial wastewater, China’s future sustainable development is facing serious challenges. In recent years, although the central government has been increasing investment in the treatment and management of industrial wastewater at the local level, as well as imposing strict controls and supervision on wastewater emission of industrial producers, these measures didn’t bring down the total emission of industrial wastewater. Therefore, the control and management of industrial wastewater and water pollution is still one of the major tasks of China’s environmental construction (Figure 1) [3].
In terms of industrial wastewater emissions, the current pollution management system in China has played an important and positive role and achieved a lot in regional environmental protection, industrial structure optimization and wastewater emission reduction. However, this system is mainly under the management and supervision of the central government and executed by various local governments. It still has the following defects:
First, the current system overemphasizes the role of governments in the design and implementation of industrial wastewater policies. Currently, the policy system for control and management of industrial wastewater as well as water pollution treatment heavily rely on the central government and various local governments. The government covers almost all functions including policy design, implementation, policy monitoring and management, but rarely delegates the tasks to social organizations, non-governmental organizations or individuals, resulting in a massive and highly-complicated bureaucracy system, featured by vague roles and responsibility, inefficient implementation and poor monitoring. Therefore, the industrial wastewater management system in China has very clear characteristics of “Big Government” and “Planned Economy”, lacking the flexible adjustment of the market mechanism.
Second, in the design of industrial wastewater control policy, the government over emphasizes the trinity of “Resource, Environment, and Economy”. The policy-makers tend to base the design of such policies on whether they can be tolerated by local companies and try to minimize the negative impacts on local economic growth. In reality, the treatment and management of industrial wastewater always loses to economic growth in priority, resulting in a so-called “environment-and-economy-balanced” wastewater management and water pollution control strategy.
Last, the industrial wastewater management policies tend to focus on the solution of current issues, but lack the predictive and preventive thinking against potential issues of the future. China is at a growth stage featured by fast industrialization and strong economic growth, which will inevitably bring numerous environmental problems along the process. Therefore, the design of industrial wastewater control policies needs to think beyond the current and existing environmental problems and actively think about and prevent new issues that may appear related to the pollution of industrial wastewater. Only in this way can we overcome the “shortsightedness” of current policies.
Although end-of-pipe control is still the focus of wastewater management, theories about regulation water quality in the receiving waters are proposed in a number of countries [4]. Regulating wastewater discharge is the most direct measure to limit passive influences to the environment [5,6,7], but the cost is still somewhat prohibitive [8,9,10,11,12]. Researchers also consider the relationship between spill frequency of wastewater and receiving water quality [13,14].
Moreover, operational regulations are proposed to control the wastewater pollution in a more effective manner with lower cost than the conventional regulations. Integrated wastewater governance became one of the most important topics in this area [15,16]. Researchers focused on recovering and recycling, treatment technologies, and efficient operations [17,18,19,20,21,22,23], with argument that the relationship between sewer and wastewater treatment plants should be considered carefully to provide accurate evaluation of the urban wastewater system [13].
Mathematical models are developed and widely used for evaluating the wastewater treatment [4,12,24,25,26], including multiple objective optimization ones [27,28]. Based on those theoretical and empirical studies, we intended to construct a Total Factor Efficiency (TFE) model of China’s industrial wastewater control practices, and a comprehensive research framework on sustainable development based on theoretical and empirical analysis as well as data of wastewater emission and water pollution control by various industries in China.
In the following parts, we will introduce the literature in the field of industrial pollution protection and control in Part 2. In Part 3, we have adopted the Data Envelope Analysis (DEA) model commonly used by studies on wastewater emission in order to calculate the wastewater management TFE by controlling maximum expected output and minimum wastewater emission in various industries. In Part 4, we have connected the theoretical model with our MATLAB programming to quantify and analyze the wastewater management TFE of various industries in China under the assumption of maximum output and minimum wastewater emission (undesirable output), and provided possible reasons for the gaps in between. Part 5 serves as the conclusion of this paper and accordingly suggests a few policy recommendations.
2. Literature Review
Using the argument of a lighthouse, Sidgwick illustrated in 1883 the so-called “Free-Riding” phenomenon in Economics, and laid the foundation for the Externality Theory regarding pollution [29]. Based on Sidgwick’s theory, Marshall further introduced in 1890 the concept of “external diseconomy”, and argued that externality is the impact of one economic agent’s behavior on another economic agent’s welfare that is not reflected by monetary trade or market transaction [30]. Pigou (1920) extended the externality theory to the field of environment pollution. He argued that environment resources have the same traits as public goods. The plants do not need to bear the cost for emission of pollutants. As a result, this cost is absorbed by the society and other individuals and there’s a huge imbalance between the cost of polluting plants and social costs [31]. Dales introduced the Emission Trading Theory in 1968. He argued that the environmental pollution resulted from externality problems cannot be solved simply by government intervention or market mechanism. The maximization of welfare relies on the combination of government measures and market trade [32].
As the research deepened in this field and development of analysis methods, the study on wastewater emissions had gradually turned from qualitative study to quantitative analysis. Upton (1968) argued that there is an optimal tax on water pollution for companies, and calculated the cost that one society needs to bear in order to ensure clean water resources [33]. Based on the algorithm developed by Dantzig-Wolfe and the data of the Miami River in Ohio, Hass concluded in 1970 that a pollution management method both satisfying optimal pollution taxation and water quality even if the central government doesn’t know the form of the cost function of pollution control [34]. However, there are also quite a few studies that reached the opposite conclusion: based on their quantitative analysis on the effects of taxation on wastewater and solid waste emission, Coeck et al. concluded in 1995 that taxation cannot obtain the optimal result of pollution reduction and tax income increase at the same time. The reason is that the plants will view emission tax only as one of the commercial taxes; therefore, this method has very limited incentive for emission reduction [35]. Schöb argued in 1997 that environmental taxation cannot necessarily improve the environment. On the contrary, it may even result in negative effects on the environment [36]. After analyzing the taxation system of the US as well as river transportation, Boyd concluded that a theoretically optimal water pollution taxation is not practical in reality [37].
In the meantime, the quantitative analysis tools for wastewater emission studies have also grown in complexity. Leontief adopted the input-output matrix and treated environmental pollution as an endogenous variable in the production function, eventually including the environmental and pollution factors into the National Economic Accounting System [38]. Kwerel adopted in 1977 the static model with “Price-Quantity” variables in order to study the possibility and proper methods to encourage competitive companies to publish their actual cost of pollution reduction to the authority [39]. Polinsky and Shavell introduced in 1979 the assumption of risk aversion of polluting companies as an important constraint into their model. They set the total assets of one company or individual as the maximum level of penalty, and discovered that due to low-efficiency supervision and penalties far beyond the social cost of pollution, the incentive from penalties cannot apply to risk-averse companies, and therefore the efficient allocation of resources cannot be realized [40]. Benford in 1998 further developed Kwerel’s static model into a dynamic model, and obtained the optimal expansion path of the Kwerel Model under perfect competition assumptions, with the finding that pollution would gradually decrease as time passes under this model [41]. From the “Price-Quantity” point-of-view and based on Weitzman’s research approach, Newell et al. studied in 1999 the result of existing pollution control measures, and found that when the slope of the marginal cost reduction curve is larger than that of the marginal loss curve, the results of taxation is much better than that of emission quota measures [42]. Moledina et al. (2003) analyzed the different results of taxation and emission licensing measures from a dynamic view, and concluded that under the taxation scenario, the companies are over-incentivized to reduce pollution now in order to enjoy a lower tax rate in the future; while under the emission licensing measures, the companies are inclined to over-report their current pollution emission volumes in order to get a higher emission quota in the future [43].
In recent years, Data Envelope Analysis (DEA) has been widely used in studies on ecological efficiency evaluation of different industries, including farming, petroleum refining, and water utilities [44,45,46]. One big advantage of the DEA model is that it doesn’t require a specific form of the input-output production function, or an assumption and estimation of the parameters and weight, so it can avoid the interference of subjectivity in model design and calculation results. In the wastewater treatment field, Chen and Fan used the DEA model in 2009 to calculate the industrial wastewater control efficiency of various provinces in China, and studied the developing trends of such efficiency with help of the Malmquist Index [47]. Sala-Garrido et al. (2011) compared the technical efficiency of different wastewater treatment systems based on a DEA meta-frontier model [48]. In 2013 Hu et al. adopted the panel data of 26 provinces in China from 2003 to 2010 and the DEA model to assess the wastewater management efficiency of Hubei Province. Their results showed that the wastewater management efficiency of Hubei Province had improved by 53% in 2010 compared with in 2003, and showed a trend of simultaneous and balanced improvement [49]. Yin et al. have split the Composite Technical Efficiency in the DEA model into Pure Technical Efficiency and Scale Efficiency, and discovered that 1999 marked a turning point since when the dominant factor in China’s industrial wastewater control efficiency has switched from Pure Technical Efficiency to Scale Efficiency [50]. Meanwhile, the slacks-based DEA model (SBM) is used for efficiency evaluation. Lorenzo-Toja et al. evaluated the ecological efficiency of wastewater treatment plants in Spain with SBM and a life cycle assessment (LCA) method [51]. Liu et al. adopted the DEA model that included undesirable outputs to assess the wastewater control efficiency of 10 industries in China including steel smelting from 2003 to 2012. They pointed out that the wastewater control efficiency of the mining sector in China has shown an improving trend, but with different efficiency levels in different industries [52]. Moreover, Dong et al. measured and explained ecological efficiencies of wastewater treatment plants in China. By assessing 736 sample plants across China under the framework of uncertainty research, they found that size of plant, overcapacity, climate type, and influent characteristics significantly influence the mean efficiency and performance sensitivity of wastewater treatment plants [53].
In conclusion, there is a lot of established theory and literature in the field of industrial wastewater control efficiency studies in China and abroad. However, in terms of the study on the TFE of wastewater control in China, most researchers set the Decision Making Units (DMU) based on regions or provinces, but not by industries. This paper intends to calculate and analyze the TFE of wastewater control in different industrial sectors of China by the DEA model based on the input-output data of 39 different industries from 2003 to 2014 in order to add innovation and improve existing studies.
3. Methodology and Data
3.1. The DEA Model
This paper has adopted the DEA model to measure the TFE of wastewater control in different industrial sectors of China. The DEA model, which was first introduced by Charnes and Cooper in 1984 [54], is the application of mathematical programming model to evaluate the relative effectiveness of the “department” or “unit” with multiple inputs and outputs. As a nonparametric estimation method, the DEA model can be used to determine the structure of the production frontier. In particular, there is no need to estimate the parameters in advance when the DEA model is used. It has great advantages in avoiding subjective factors, simplifying algorithms and reducing errors. Hence we chose it instead of other alternative assessment methods, such as Analytic Hierarchy Process (AHP) [55,56,57,58], Principal Components Analysis (PCA) [59,60], and Technique for Order Preference by Similarity to an Ideal Solution (TOPSIS) [61,62,63], etc. In recent years, the DEA model has been widely used in the study of industrial wastewater control efficiency. For example, in 2011 Zheng chose eight districts of Hangzhou (Zhejiang Province, China) as DMU, and constructed input-output variables for assessment of industrial pollution control based on the DEA model. From an empirical analysis, he concluded that among the eight districts, there were three districts, including the main urban area, with high wastewater control efficiency, while the remaining five districts had low wastewater control efficiency and required stronger measures [64]. By using the DEA Model, Wang and Sun analyzed in 2017 the efficiency of environmental investment in Shandong Province of China in terms of wastewater, exhaust gas and pollution control efficiency from 2005 to 2010. The results showed that the wastewater control efficiency of Shandong Province was highly unstable and the economic development of some regions was not proportional to their achievement in wastewater control [65].
Based on the existing practice by academia to calculate wastewater control efficiency with help of the DEA Model, this paper used the 39 industries of China as DMU, adopted labor, capital, and total energy consumption as input factors of the production process, and calculated the optimal TFE on the production possibility frontier of wastewater control. The optimal TFE is based on the maximum industrial output of various DMU’s calculated by the DEA Model. The TFE of industrial wastewater control (TFEPWi,t) can be written as below:
In the equation above, is the expected wastewater emission on the production possibility frontier of , while is the actual wastewater emission of at period .
After introducing the TFE of wastewater control (), let us construct the DEA-SBM Model. In our model, for each , the input vector of m production factors at period is ; its desirable output vector of products is written as , and its undesirable output vector of products is expressed as . Let the Input Matrix , Undesirable Output Matrix and Desirable Output Matrix be:
In Equations (2)–(4) above, ; ; , which respectively represent the i-th column vector of Input Matrix , Undesirable Output Matrix and Desirable Output Matrix , i.e., the i-th ’s actual input vector, actual undesirable output vector and actual desirable output vector. When , and are all larger than zero, the Input-Output possibility set () of could be written as:
In Formula (5) above, represents the ratio vector of the actual output compared with the optimal output on the production possibility frontier of . If , it means that the actual input is higher compared with the optimal input on the production possibility frontier. If , it means that compared with the undesirable output on the production possibility frontier, the actual undesirable output is higher. If , it means that the actual desirable output is lower than the desirable output level on the production possibility frontier.
Therefore, based on our DEA-SBM model, we could obtain the efficiency index of the ith from the Optimization Target Function as below:
This paper has used the fmincon() Function in the MATLAB software (version R2016a) which is widely used for the optimization solution of multi-variable constrained nonlinear functions, and made a few adjustments on the form of the target functions in our DEA-SBM model. By using matrices of known variables and ratio vectors to express the Slack Variable Vector, we are able to keep the MATLAB programming functions in consistence with the form of the target functions in our DEA-SBM model. Through multiple tests, the results from this model are highly robust with different initial variable values, and the calculations have shown good convergence and high accuracy. Therefore, we have good reason to believe that the calculation result from this DEA-SBM model is the global optimal solution rather than the local optimal solution of an optimization problem.
The efficiency indicator obtained from this optimization model above should range between 0 and 1, and decreases monotonically with the increase of “Input Slack” and “Output Slack”. The increase in “Input Slack” means there’s waste in input factors, so the efficiency is lower. The increase in “Undesirable Output Slack” means the output is getting farther away from the undesirable output level on the production possibility frontier, so the production efficiency is lower. The increase in “Desirable Output Slack” means the actual output is moving away from the optimal desirable output level on the production possibility frontier, and therefore the production efficiency is also lower. When , which means the “Input Slack” and “Output Slack” are both 0, the input-output level or ratio of this DMU has reached optimization and the highest production efficiency.
In order to obtain the TFE of industrial wastewater control from the DEA-SBM Model, we introduced three input variables (capital, labor, and total energy consumption), one undesirable output (industrial wastewater emission) and one desirable output (industrial value-added).
However, the use of the DEA model may also have its limitations in our research because it only treats a single objective, which may cause uncertainty [66,67]. To deal with this problem, researchers have made a number of improvements to the original DEA model, such as chance-constrained and imprecise method [68], tolerance method [69], Monte Carlo method [70], and tolerance method combining with the system of ranking indicators [71,72]. In 2017 Dong et al. combined the DEA with uncertainty analysis, and added the negative environmental factors into the measurement of efficiencies [53].
Considering the advantages and limitations of DEA method, we carefully choose the input and output variables and use the official data released by National Bureau of Statistics of China. Moreover, we do the calculation work using a MATLAB algorithm designed by ourselves, to achieve originality in our research and high calculation accuracy. At last, we explain the results by contrasting the total factor efficiency of water resource and total factor efficiency of energy, in addition to comparing those efficiency in different regions and main provinces in China. We also further improve our algorithm, hoping to develop multiple-objective calculation algorithm in the near future.
3.2. Variables and Data Selection
Based on the official statistical data of China from 2003 to 2014 from National Bureau of Statistics of China, China Industrial Statistical Yearbook and Energy Statistical Yearbook, this paper constructed a database for the DEA Model on wastewater control TFE analysis by various industries. At the same time, based on the industry classification guideline (GB/T4754-2002 and GB/T4754-2011) published by the National Bureau of Statistics of China, we have standardized and aligned the industry categorization of our industry-level data in the research period. The input variables adopted in this paper include:
- (1)
- Capital. Based on the common practice in similar studies, we chose capital stock from annual fixed assets investment in different industries as our Capital input factor. In our calculation, we adopted the commonly used “Perpetual Inventory” accounting method to estimate the Capital Stock from Annual Fixed Assets Investment of each industry in each year :
In Equation (7) above, means last year’s capital stock from fixed assets investment of certain industry; is the new fixed assets investment in current year by that industry; is the depreciation rate of fixed assets of that industry. Based on the estimation method of Capital Stock by Hall and Jones [73], the capital stock from fixed assets investment by that industry in last year could be written as:
In Equation (8), means the new fixed assets investment in last year in that industry; is the growth rate of fixed assets investment in that industry. In order to generalize the estimation, we used the geometric method to calculate the average growth rate of fixed assets investment in an year period:
From Equations (7)–(9), we can obtain the average capital stock of each industry in China each year. In our calculation, we adjusted the “Fixed Assets Investment” amount of each year based on the “Price Indices of Investment in Fixed Assets” (PIIFA) with year 2003 being the base period. Our data source was the “China Statistical Yearbook” officially published by the National Bureau of Statistics of China [3].
- (2)
- Labor. The average number of workers in different industries of China each year. The data source was also the “China Statistical Yearbook” published by the National Bureau of Statistics [3].
- (3)
- Total Energy Consumption. In order to better measure the efficiency of industrial wastewater control, we chose the total energy consumption in different industries of China as our most important input factor in this research. According to Fan, industrial wastewater is not just the product of water resource input in the industrial production process [74]. Therefore, it is more appropriate to use the total energy consumption of each industry to assess their efficiency of industrial wastewater control. Our data here came from “China Statistical Yearbook” and “China Energy Statistical Yearbook” published by the National Bureau of Statistics [3,75].
The output variables adopted in this paper include the below two categories:
- (1)
- Industrial Value Added. This is a direct component of our country’s GDP based on the Output Method. Across the years, the industrial value added has taken the largest proportion in our country’s annual GDP calculated by the Output Method [76].Therefore, the industrial value added is not only the most important indicator of certain industry’s output level, but also an important indicator to measure China’s economic growth. Our data came from the “China Statistical Yearbook” published by the National Bureau of Statistics of China, and we adjusted the annual industrial value added of each industry within the study period by use of the GDP Deflator in our computation [3].
- (2)
- Industrial Wastewater Emission as an Undesirable Output. Regarding the Undesirable Output, some studies categorized it as an input factor. As stated above, this practice has its rationality given the setting of the DEA Model. However, undesirable output itself is still an output, a product of various input factors. Therefore, in this study, it is inappropriate to set undesirable outputs as inputs for the purpose of estimating its influence on the TFE of energy consumption and wastewater control. Based on the theoretical model in Part 3.1, we enhanced our model by treating the undesirable output as the output in the DEA Model. In their recent empirical studies, Ma [77] and Li et al. [78] have also adopted the same treatment. In our computation, this paper introduced the Annual Total Wastewater Emission by different industries published by the National Bureau of Statistics of China as our undesirable output [3].
3.3. Calculation Method and MATLAB Programming
Before we started the calculation, we had tried almost all the available DEA software including DEAP, DEA-Solver, MaxDEA, etc. Although the calculation results from these different software were quite similar, there were still some differences. Moreover, these commonly used DEA software packages didn’t provide explicit calculation procedures. While one could easily obtain the results by feeding the input and output data of various DMU’s into the computer, we were unable to decide which DEA software could provide the most accurate results, or was the best fit for our study. In order to achieve the highest calculation accuracy and the originality of our calculation method, we therefore designed and developed our own MATLAB programming based on the assumption of maximized industrial value added and minimized unfavorable output in order to check whether each DMU in China’s industrial sector has reached the optimal efficiency in terms of wastewater control. Our purpose is to accurately assess the TFE of wastewater control in different industries and ensure the effectiveness of our calculation results.
4. Results and Discussion
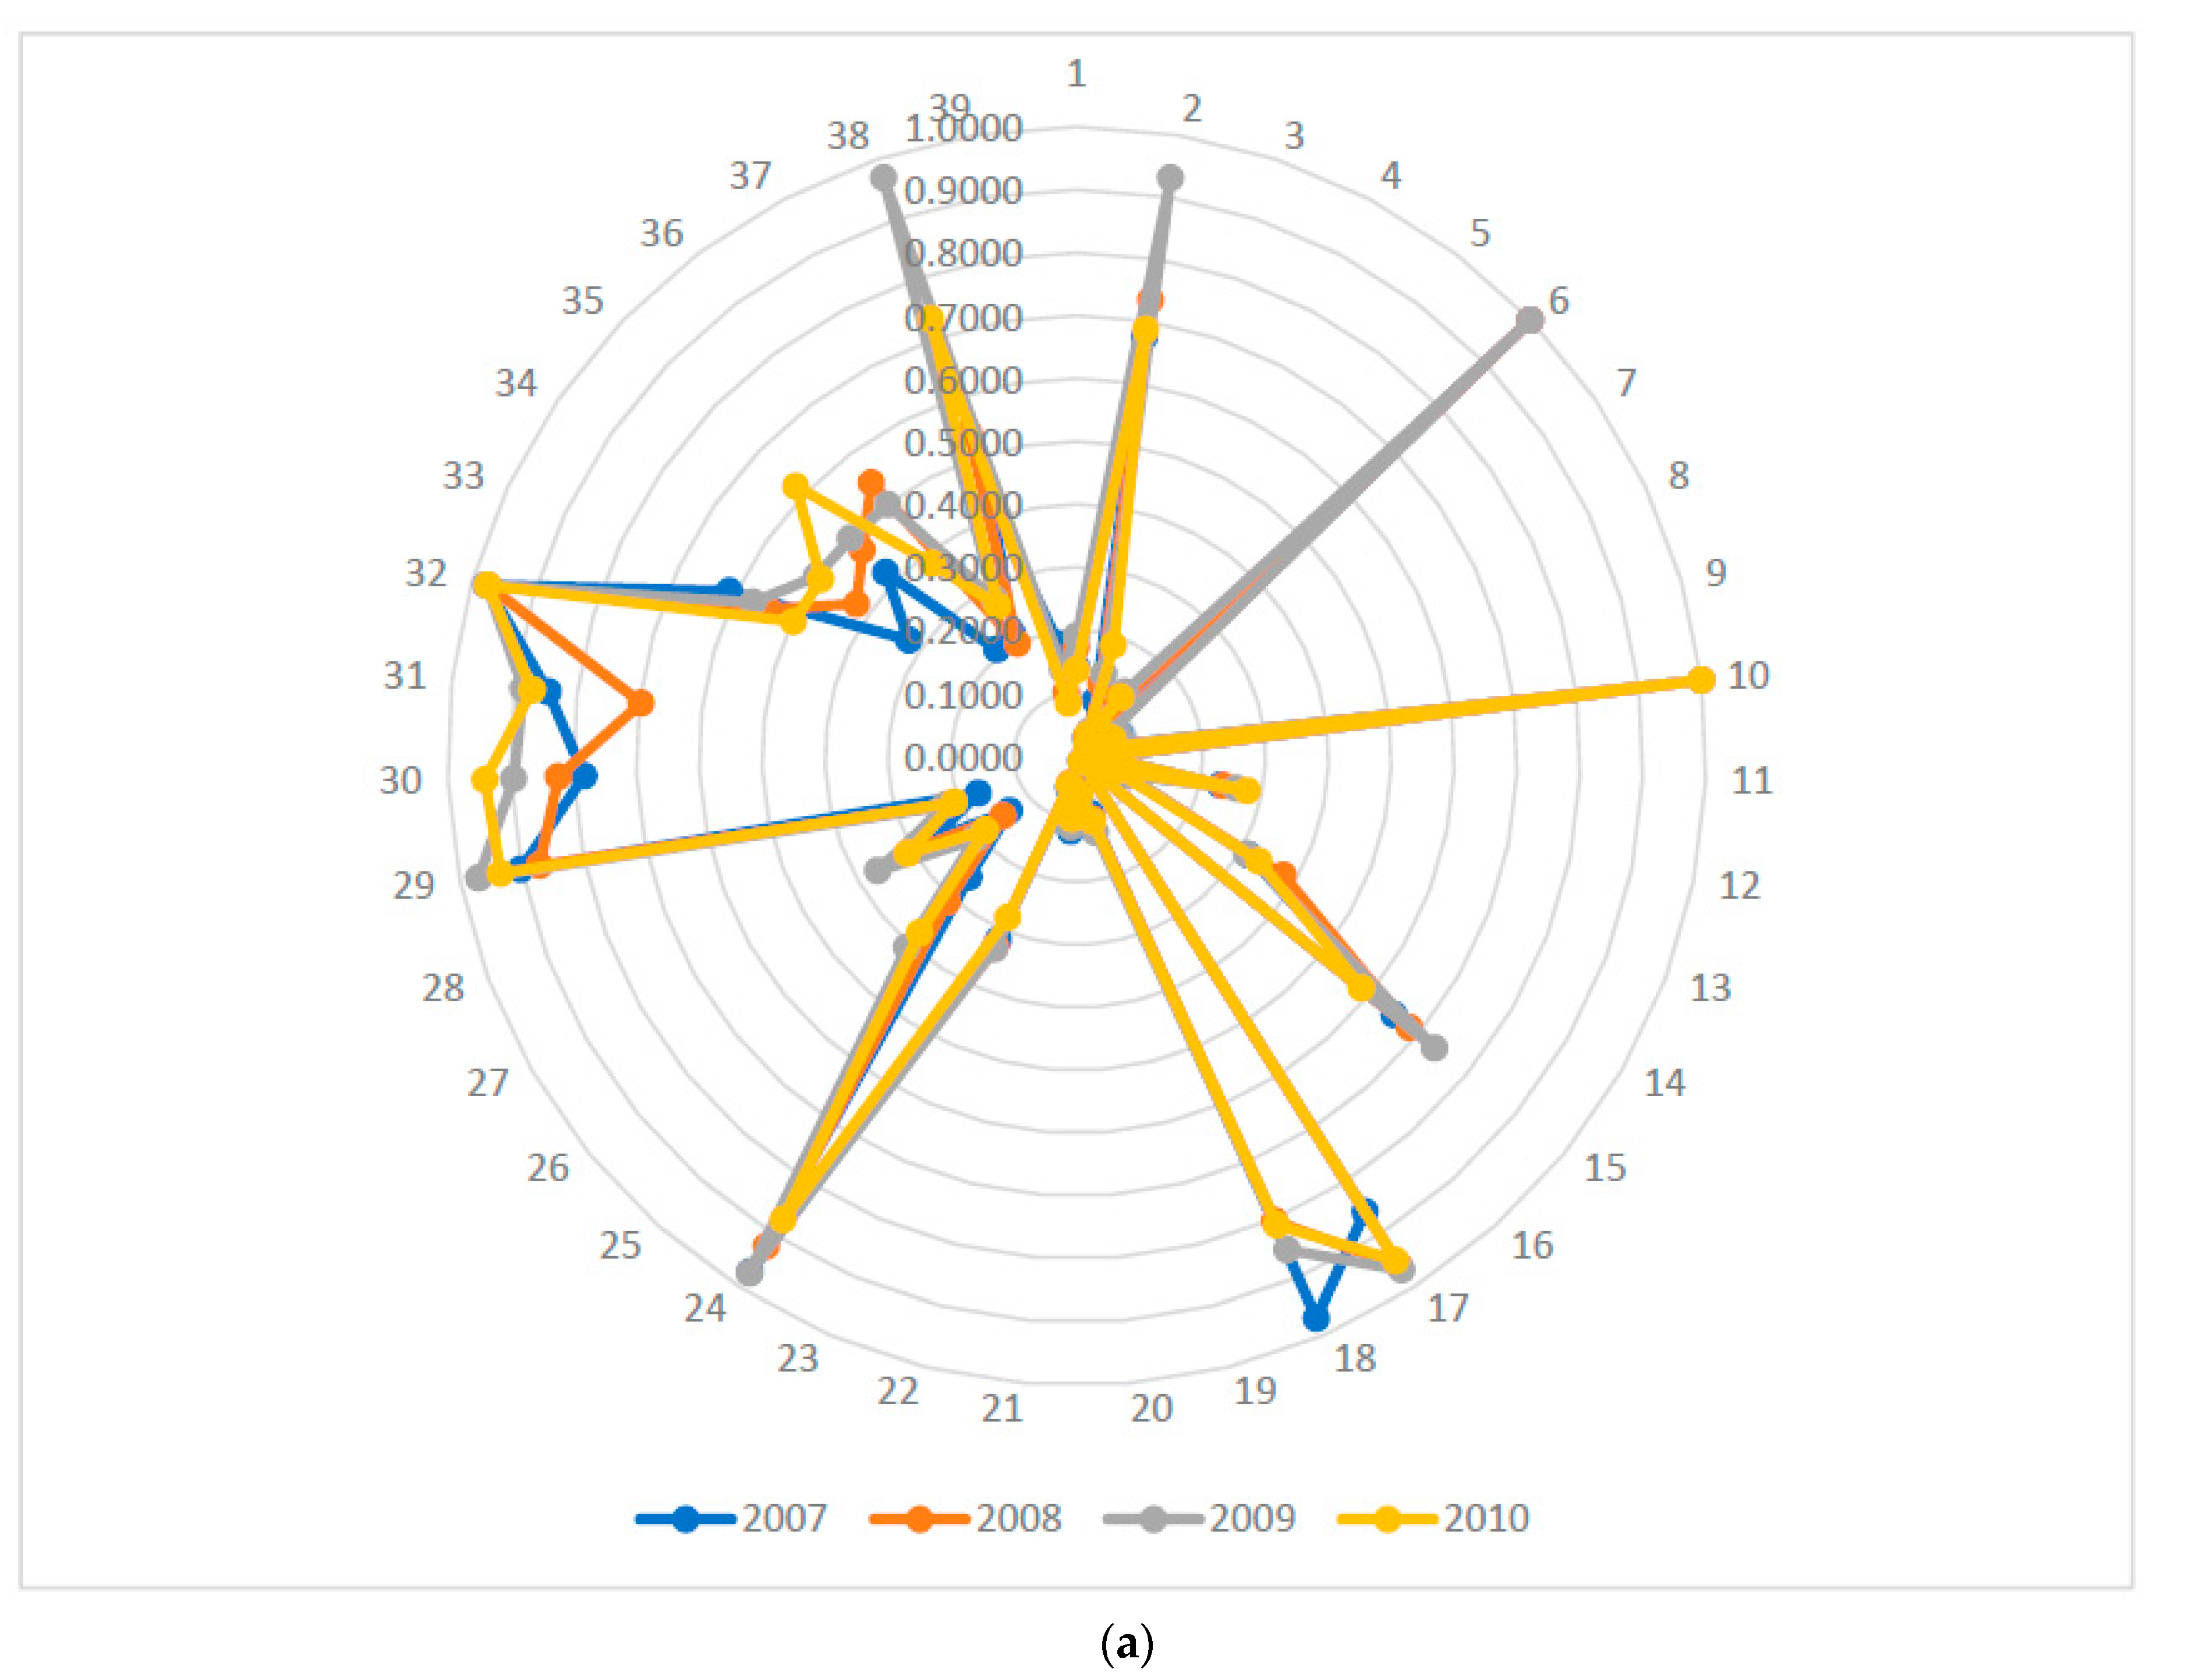
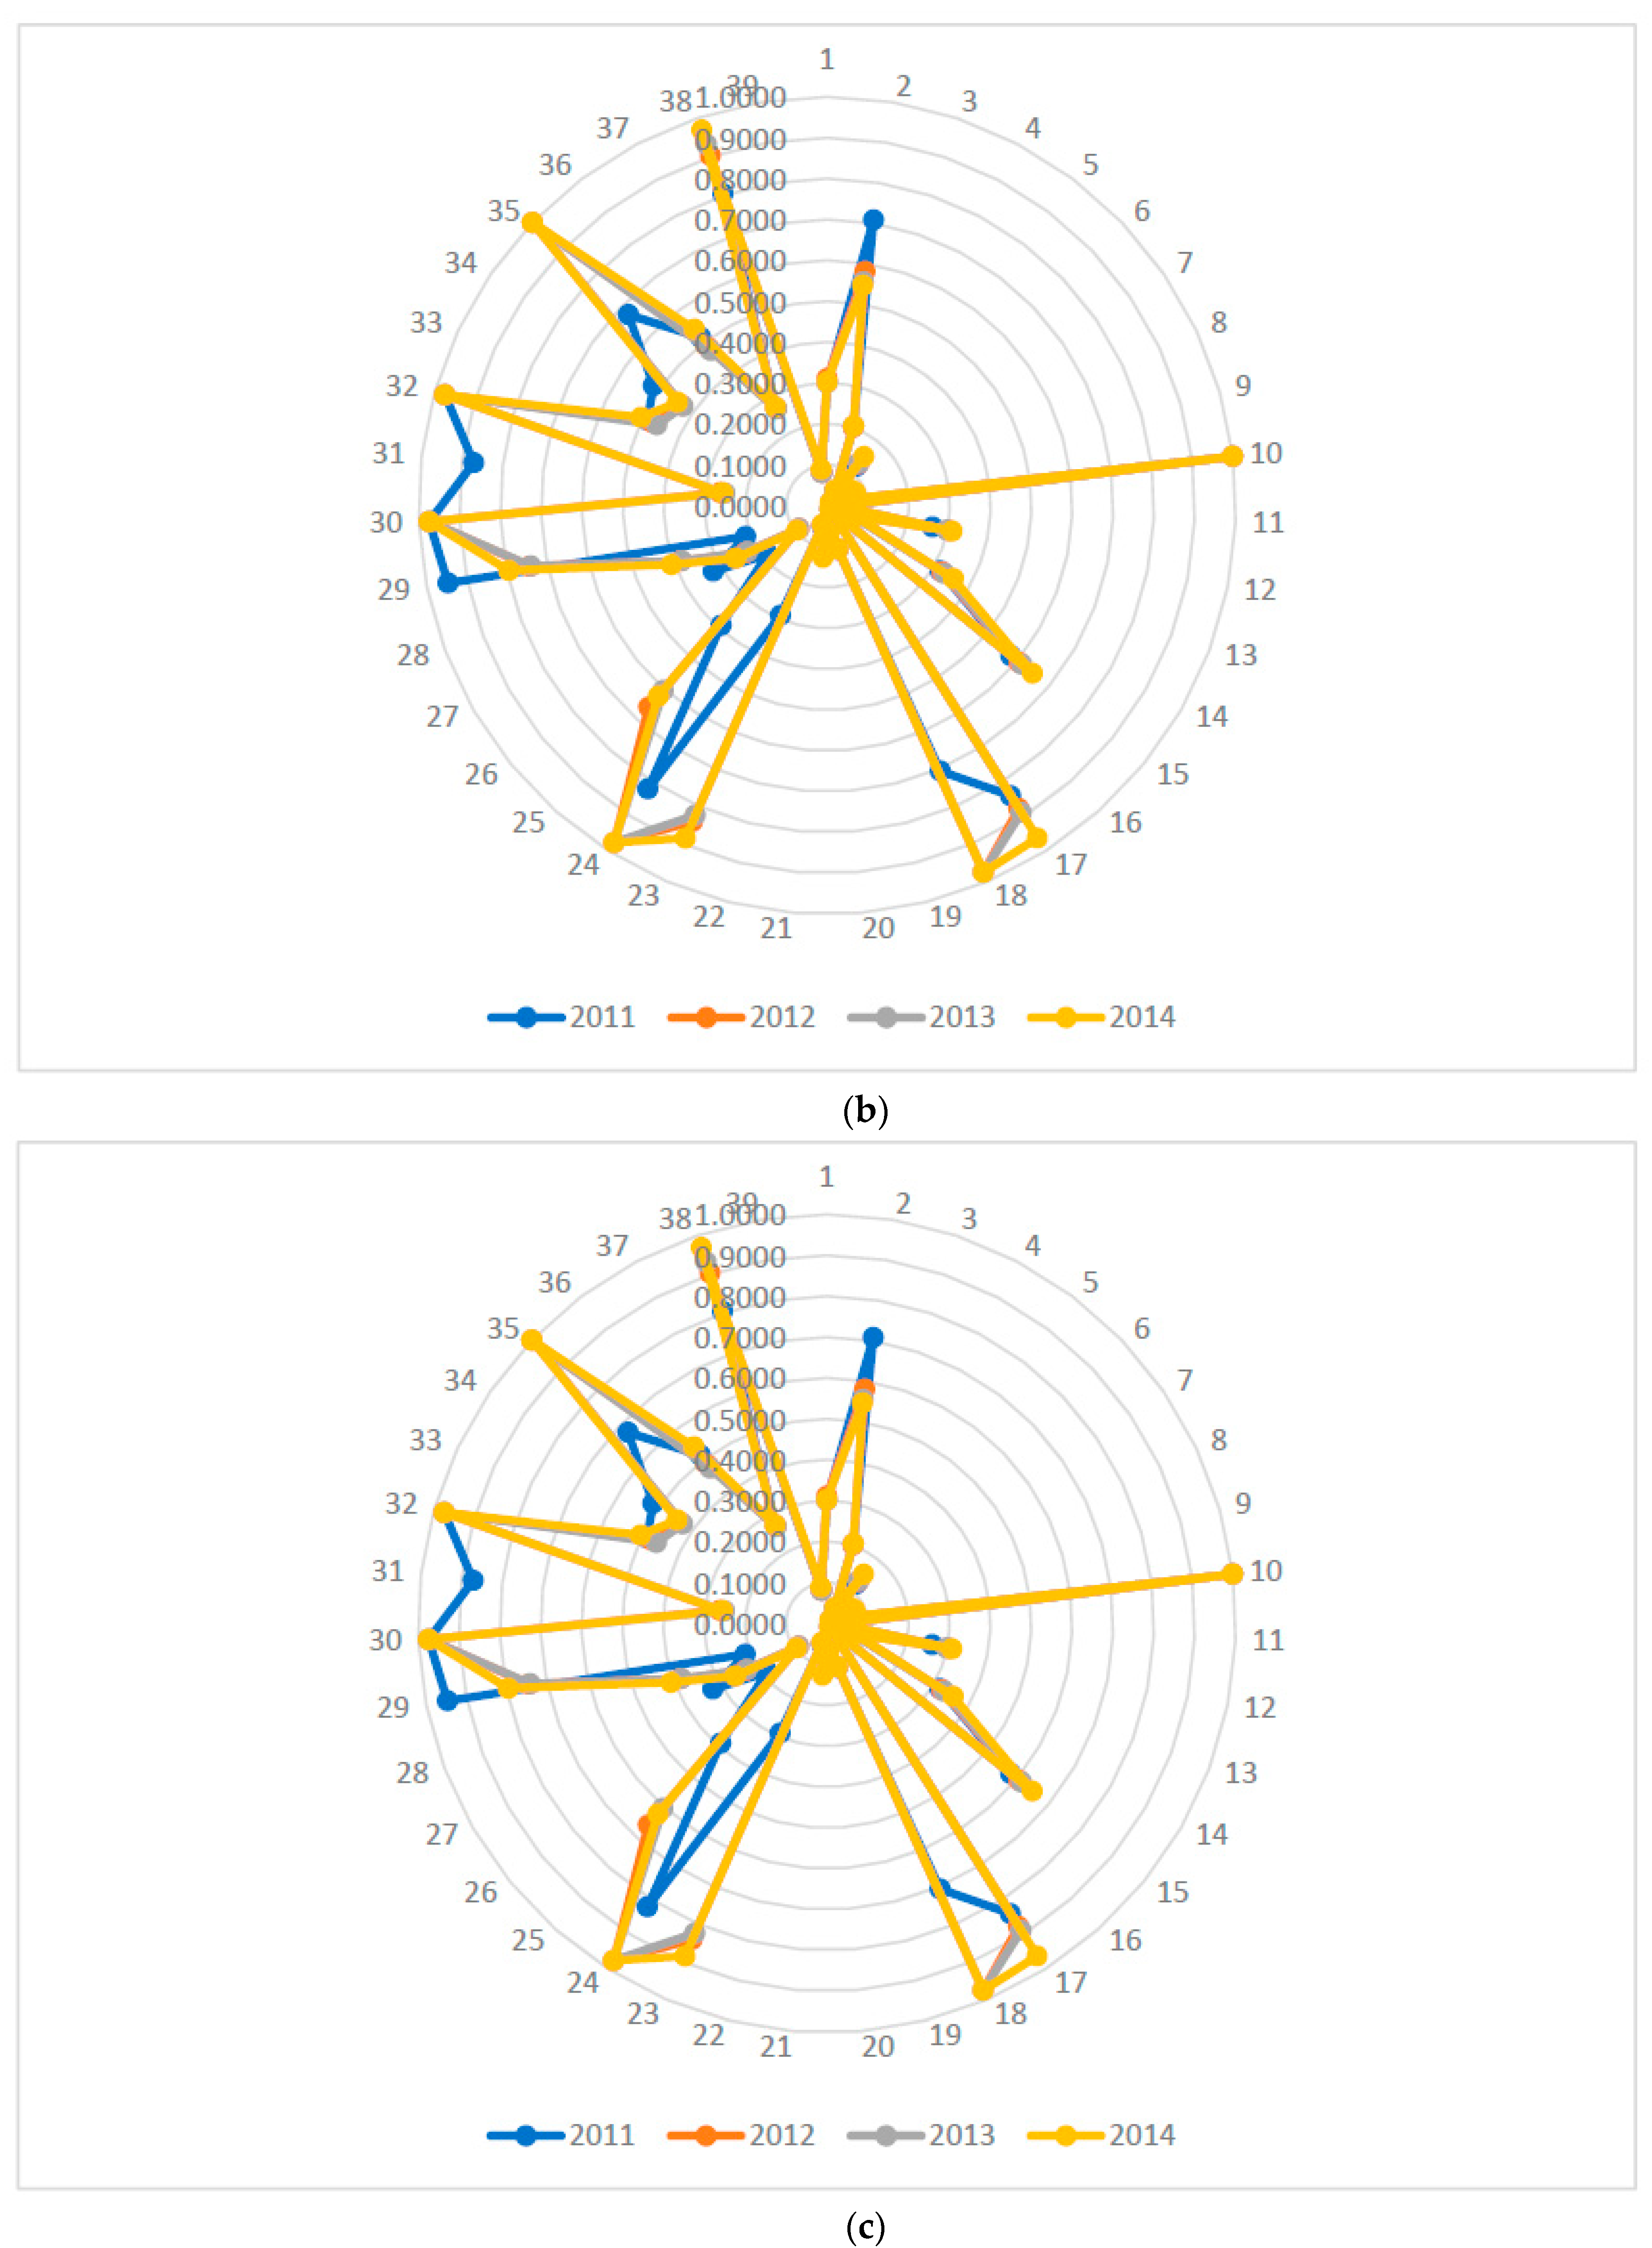
Based on the DEA Model and the MATLAB programming designed by ourselves, as well as the input-output variables listed in Section 3.2, we obtained the TFE in wastewater control of different industries in China from 2003 to 2014 (please refer to Table S1 in the Supplementary Materials and Figure 2).
From Table S1 and Figure 2, we can conclude that from 2003 to 2014, the TFE of wastewater control in different industries of China has presented clear patterns as discussed below:
- (1)
- Generally speaking, the TFE of wastewater control in the industrial sectors of China is quite low and far from satisfactory. Taking the year 2014 as an example, in that year, only 15 industries or 38.46% of the total industries in the list had reached a wastewater control TFE of above 0.5. Among these 15 industries, except for the tobacco industry which is under a national monopoly and maintained the optimal TFE of 1 throughout the study period, there were six industries that experienced efficiency declines compared with 2003, and the other eight industries had all shown fluctuations in wastewater control TFE during the study period.
- (2)
- The paper manufacturing industry, chemical industry and textile industry—the three biggest wastewater emission industries of China [3]—had not shown clear improvement in the TFE of wastewater control in the study period. For the paper manufacturing industry, its TFE had been declining all the way from the peak level of 0.016 in 2003, especially after 2009, with its TFE in 2014 decreasing by 21.05% compared with its 2009 level. For the textile industry whose TFE of wastewater control had also been decreasing since 2003, although its TFE has recovered a little in 2014, its level in 2014 was still 65% lower than its level in 2003. Furthermore, as the lowest point in the entire study period, the TFE of the textile industry in 2013 was only 33.68% of that in 2003. The chemical industry was better than the other two industries, with its TFE in 2014 reaching a peak and increased 29.49% compared with its 2003 level. However, this industry still had two major problems. First, the absolute level of its TFE was comparatively low throughout the study period, which had never reached higher than 0.07. Second, its TFE was quite unstable in the study period, with two big fluctuation occurring between 2004 and 2007, and between 2010 and 2013.
- (3)
- The TFE of wastewater control was lower in the industrial raw material industry than in the finished industrial product industry. For example, the non-ferrous metal mining and dressing industry’s TFE of wastewater control had never reached a value higher than 0.05 throughout the entire study period, with its level being even below 0.035 from 2004 to 2008. Despite its distinct improvement in the study period, the TFE of the chemical raw material industry had been lingering below 0.07. Therefore, in order to improve the wastewater control TFE of Chinese industrial sectors, we must put great emphasis on the raw material industry; otherwise, it will be difficult to ensure the improvement of TFE from its origin.
- (4)
- The wastewater control TFE of the food and beverage industry in China had been comparatively low. In the study period, the wastewater control TFE of China’s food manufacturing industry, beverage manufacturing industry and farm and sideline product processing industry were all below 0.15. Moreover, the TFE of the food and beverage manufacturing industry had also been declining with their level dropping below 0.08 in 2014. The component of the wastewater from food and beverage industries were highly complicated. For example, for the industries that process food products of animal origin, their wastewater could contain animal fur, grease, feces and probably animal germs, and therefore could cause great damage to the environment and human being as serious as those from the industrial raw material industries [79]. To make things worse, the entry barrier of the food and beverage industry is not high in China, especially in small towns and villages where numerous food processing companies and workshops prosper. Although these food processing companies have been improving their wastewater control technology as they expand their business, it is an indisputable fact that the wastewater from the food and beverage industry has become a growing issue with difficulty in management, regulation, and supervision [80]. Therefore, we must put great effort on the wastewater control issue in the food and beverage industry to ensure food and environment safety in this country with rich food culture.
- (5)
- There are still big improvement areas in the wastewater control TFE of high and new tech industries. In the current industry structure of China, the high and new tech industries are represented by the Information Communications Technology (ICT) industry, computer manufacturing industry and instrument and apparatus manufacturing industry. Although the TFE in wastewater control of these industries was better than that of the above industries such as paper manufacturing industry, chemical industry, textile industry and food and beverage industry, the TFE of high and new tech industries was far from optimal. The TFE of the ICT industry and computer manufacturing industry had shown a declining trend in the study period, which decreased by 52.20% from the almost optimal level of 0.9647 in 2003 to the lowest point of 0.4611 in 2013, and recovered a little in 2014 to barely reach 0.5. The situation in the instrument and apparatus manufacturing industry was better than the other two industries, but its TFE in 2014 was only 0.4453, lower than 0.5 and its peak level within the study period. One interesting comparison is that also within the same study period, our ICT industry and computer manufacturing industry had made remarkable achievements, especially in the area of supercomputer. After one of our supercomputers was ranked the world’s second-fastest machine by U.S. and European researchers in 2010, the Tianhe-series supercomputers that came out after 2011 had been ranked the world’s fastest computer for several years [81]. This means as China is achieving more and more breakthroughs in the field of high and new technologies, and these industries should also make every effort to improve its TFE in wastewater control. Only in this way can we ensure sustainable development of these high and new tech industries. The new ICT, combined with advanced modelling tools, contributes a lot to the wastewater management. Schutze discussed the optimization methods to achieve the best system performance with various objectives [82]. After that, integrated modelling of the receiving water body, the sewer system, and wastewater treatment plants (WWTP) begin to provide a comprehensive evaluation of wastewater treatment system [83,84]. Researchers also consider the uncertainty in new ICT and advanced modelling application [85,86,87], and use the genetic algorithm to find optimal solutions [88,89,90]. By using genetic algorithm (NSGA II), Fu et al. discussed the optimization of multi-objective control of urban wastewater system [28].
- (6)
- The tobacco industry was the only industry within our study scope to keep the optimal wastewater control TFE of 1 throughout the study period. According to our analysis, this is probably due to the management and operational system of this industry in China. Because this is an industry with its own specialty and concerns the country’s tax revenue, in 1981, the State Council of China decided to use the system of “State Tobacco Monopoly” to centralize the management of this industry, covering manufacturing, distribution, sales as well as management of employees and properties. In January 1982, the State Council officially named China Tobacco Corporation as the administration and management institution of this industry. In January 1984, the State Tobacco Monopoly Bureau of China was officially established to work with China Tobacco Corporation to centrally manage the tobacco industry of China with exclusive state manufacturing, distribution and selling or so-called “Monopoly Franchise Model”. Therefore, the tobacco industry was a completely state monopoly and state controlled industry, with its employee, property, manufacturing, supply, sales, and trading all under central management and all the tobacco companies in this industry belonging to state-owned enterprises (SOE) [91]. Under such management structure, it was easier to execute the environmental protection policies and regulations of the central government in this industry. Not only did this industry have less wastewater emission, but it was also equipped with more advanced wastewater control facilities and procedures. Taking a typical state-owned cigarette factory as an example, it normally has both above-ground and under-ground wastewater waste water treatment stations, including the above-ground integrated equipment room and the under-ground concrete basins. The former is equipped with devices including air flotation, belt pressure filter, deodorizing plant and laboratory, while the latter is equipped with underground equipment room and blower room. Meanwhile, the harmful gas from the wastewater treatment stations was also collected and cleaned by special equipment before released into the atmosphere [92,93]. Of course, since the tobacco industry is a specially industry with unique management system. Therefore, it is not practical to require all the other industrial sectors to follow the practice in the tobacco industry in terms of wastewater treatment and control. However, there are still valuable lessons for the other industries in terms of equipment and management.
5. Conclusions and Policy Recommendations
This paper has conducted both a theoretical and empirical study on the wastewater control TFE of various industrial sectors in China from 2003 to 2014. Based on the DEA model and MATLAB programming calculations, we have discussed the wastewater control and sustainable development of China’s industrial sectors. Our conclusion is that although China has experienced continuous GDP growth and remarkable industrial development, the TFE of wastewater control in the industrial sectors is still far from optimal. Furthermore, in some industries, the low efficiency in wastewater control has become one of the obstacles to its sustainable development. Therefore, we propose the following policy recommendations in order for China to improve its industrial wastewater control efficiency:
- (1)
- Strengthen government supervision and management as well as legal construction in the field of environmental protection. All levels of the government and environmental protection departments should learn from the successful experience of the tobacco industry, and continuously upgrade industrial structure based on the overall urban planning and environmental planning of different regions and cities as well as making appropriate industrial policies accordingly. The government should enhance the monitoring and regulation on the structure of industrial products and their raw materials in different regions and work closely with the environmental protection departments to strictly regulate and monitor the wastewater emission volumes, standards and methods, and strengthen the law enforcement on companies that violate wastewater treatment and control regulations.
- (2)
- Enhance the awareness of environmental protection of various industrial companies, and help them improve their wastewater control equipment and procedures. Currently, one of the main reasons of high industrial wastewater emission and low wastewater control efficiency in China is industrial companies’ poor environmental awareness and outdated wastewater control equipment and procedures. Therefore, at the same time of enhancing industrial wastewater treatment technology and emission monitoring, it is crucial for us to improve industrial companies’ environmental awareness, and improve the TFE of industrial wastewater control from the origin by integrating factors such as environment management system, wastewater management and control performance into the industrial companies’ production and management processes.
- (3)
- At the same time government regulation and company environmental awareness are strengthened, make every effort to improve the TFE of industrial wastewater control by technology advancements. The government should design appropriate incentives for industrial companies to upgrade and improve their wastewater treatment and disposal technology. By adopting clean production technology with high utilization efficiency and low pollutant emission, timely replacement of outdated technology and equipment that cause serious water pollution, improving the recycle rate of water resources in the production process, and reducing wastewater emissions, the companies can achieve continuous improvements in the TFE of industrial wastewater control.
Supplementary Materials
The following are available online at www.mdpi.com/1996-1073/10/8/1201/s1, Table S1: TFE of Wastewater Control in Different Industries of China, 2003–2014.
Acknowledgments
The first author was financially supported by the Scientific Research Foundation of Business School, University of Shanghai for Science and Technology (1D-17-303-003). The second author was financially supported by the National Natural Science Foundation of China (Grant No. 11501418) and the Shanghai Sailing Program (15YF1412500). Moreover, both authors appreciate the support from the Fundamental Research Funds for the Central Universities of China.
Author Contributions
Weixin Yang organized the whole research, collected original data, and analyzed the data and background materials. As the correspondence author, Lingguang Li performed calculations, designed the methodology and MATLAB program, and provided the final figures. Both authors carefully read and approve the final manuscript.
Conflicts of Interest
The authors declare no conflict of interest.
Appendix A. MATLAB Algorithm
| function DEASBMG = DEA(x) |
| clc |
| clear |
| global N s Ig Ib Og Ob; |
| global X Y m n i; |
| Xg = []; |
| Xb = []; |
| Yg = []; |
| Yb = []; |
| Var = []; |
| [s,N] = size(Var); |
| g = ; |
| r0 = zeros(s,1); |
| R = zeros(s,s); |
| fval = zeros(s,N); |
| Theta = zeros(s,N); |
| for k = 1:N |
| Ig = Xg'; |
| Ib = Xb'; |
| Og = Yg'; |
| Ob = Var(:,k)'; |
| X = [Ig;Ob]; |
| Y = [Ib;Og]; |
| A = [X;-Y]; |
| [m,s] = size(X); |
| [n,s] = size(Y); |
| for i = 1:s |
| [R(:,i),fval(i,k)] = fmincon(@Efficiency,r0,A,A(:,i),[],[],zeros(s,1),[]); |
| Theta(i,k) = (X(g,:)*R(:,i))/X(g,i); |
| end |
| end |
| function P = Efficiency(r) |
| global m; |
| global n; |
| global X; |
| global Y; |
| global i; |
| Input = 0; Output = 0; |
| for j = 1:m |
| Input = Input+(X(j,:)*r)/X(j,i); |
| end |
| for j = 1:n |
| Output = Output+(Y(j,:)*r)/Y(j,i); |
| end |
| P = (n*Input)/(m*Output); |
References
- Li, B.; Peng, X.; Ouyang, M. Environmental regulation, green total factor productivity and the transformation of China’s industrial development mode—Analysis based on data of China’s 36 industries. China Ind. Econ. 2013, 4, 56–68. [Google Scholar]
- Alien, D.T.; Foecke, T.; Klee, H., Jr.; Beck, W.B.; Ross, L.L.; Purcell, A.H.; Hirschhorn, J.S.; Freeman, H. Industrial pollution prevention. J. Air Waste Manag. Assoc. 1992, 42, 1159–1167. [Google Scholar] [CrossRef]
- National Bureau of Statistics of China. China Statistical Yearbook, 2004–2015; China Statistic Press: Beijing, China, 2015.
- Meng, F.; Fu, G.; Butler, D. Water quality permitting: From end-of-pipe to operational strategies. Water Res. 2016, 101, 114–126. [Google Scholar] [CrossRef] [PubMed] [Green Version]
- U.S. Environmental Protection Agency (EPA). Combined Sewer Overflows Guidance for Long-Term Control Plan; U.S. Environmental Protection Agency: Washington, DC, USA, 1995.
- U.S. Environmental Protection Agency. National Pollutant Discharge Elimination System (NPDES) Permit Writers’ Manual; U.S. Environmental Protection Agency: Washington, DC, USA, 2010.
- U.S. Environmental Protection Agency. Exposure Factors Handbook: 2011 Edition; U.S. Environmental Protection Agency: Washington, DC, USA, 2011.
- Severn Trent Water Limited. Changing Course through the Sustainable Implementation of the Water Framework Directive; Severn Trent Water Limited: Coventry, UK, 2013; pp. 1–46. [Google Scholar]
- Georges, K.; Thornton, A.; Sadler, R. Evidence: Transforming Wastewater Treatment to Reduce Carbon Emissions; European Environment Agency: Bristol, UK, 2009; ISBN 9781849111522. [Google Scholar]
- Flores-Alsina, X.; Corominas, L.; Snip, L.; Vanrolleghem, P.A. Including greenhouse gas emissions during benchmarking of wastewater treatment plant control strategies. Water Res. 2011, 45, 4700–4710. [Google Scholar] [CrossRef] [PubMed]
- Sweetapple, C.; Fu, G.; Butler, D. Multi-objective optimisation of wastewater treatment plant control to reduce greenhouse gas emissions. Water Res. 2014, 55, 52–62. [Google Scholar] [CrossRef] [PubMed] [Green Version]
- Sweetapple, C.; Fu, G.; Butler, D. Identifying sensitive sources and key control handles for the reduction of greenhouse gas emissions from wastewater treatment. Water Res. 2014, 62, 249–259. [Google Scholar] [CrossRef] [PubMed] [Green Version]
- Lau, J.; Butler, D.; Schütze, M. Is combined sewer overflow spill frequency/volume a good indicator of receiving water quality impact? Urban Water 2002, 4, 181–189. [Google Scholar] [CrossRef]
- Clifforde, T.; Crabtree, R.W.; Andrews, H.O. 10 Years Experience of CSO Management in the United Kingdom. Proc. Water Environ. Fed. 2006, 2006, 3744–3756. [Google Scholar] [CrossRef]
- U.S. Environmental Protection Agency (EPA). Watershed-Based National Pollutant Discharge Elimination System (NPDES) Permitting Technical Guidance; U.S. Environmental Protection Agency: Washington, DC, USA, 2007; pp. 1–84.
- Selman, M. Water quality trading programs: An international overview. WRI Issue Brief Water Qual. Trading 2009, 1, 1–16. [Google Scholar]
- Strous, M.; Van Gerven, E.; Zheng, P.; Kuenen, J.G.; Jetten, M.S.M. Ammonium removal from concentrated waste streams with the anaerobic ammonium oxidation (anammox) process in different reactor configurations. Water Res. 1997, 31, 1955–1962. [Google Scholar] [CrossRef]
- Guest, J.S.; Skerlos, S.J.; Barnard, J.L.; Beck, M.B.; Daigger, G.T.; Hilger, H.; Jackson, S.J.; Karvazy, K.; Kelly, L.; Macpherson, L.; et al. A new planning and design paradigm to achieve sustainable resource recovery from wastewater. Environ. Sci. Technol. 2009, 43, 6126–6130. [Google Scholar] [CrossRef] [PubMed]
- Thornton, A.; Sunner, N.; Haeck, M. Real time control for reduced aeration and chemical consumption: A full scale study. Water Sci. Technol. 2010, 61, 2169–2175. [Google Scholar] [CrossRef] [PubMed]
- McCarty, P.L.; Bae, J.; Kim, J. Domestic wastewater treatment as a net energy producer—Can this be achieved? Environ. Sci. Technol. 2011, 45, 7100–7106. [Google Scholar] [CrossRef] [PubMed]
- Office of Wastewater Management U.S. Environmental Protection Agency. Emerging Technologies for Wastewater Treatment and In-Plant Wet Weather Management; U.S. Environmental Protection Agency: Washington, DC, USA, 2013.
- Jin, Z.; Gong, H.; Wang, K. Application of hybrid coagulation microfiltration with air backflushing to direct sewage concentration for organic matter recovery. J. Hazard. Mater. 2015, 283, 824–831. [Google Scholar] [CrossRef] [PubMed]
- Castro-Barros, C.M.; Daelman, M.R.J.; Mampaey, K.E.; Van Loosdrecht, M.C.M.; Volcke, E.I.P. Effect of aeration regime on N2O emission from partial nitritation-anammox in a full-scale granular sludge reactor. Water Res. 2015, 68, 793–803. [Google Scholar] [CrossRef] [PubMed]
- Vanrolleghem, P.A.; Benedetti, L.; Meirlaen, J. Modelling and real-time control of the integrated urban wastewater system. Environ. Model. Softw. 2005, 20, 427–442. [Google Scholar] [CrossRef]
- Schütze, M.; Butler, D.; Beck, B.M. Modelling, Simulation and Control of Urban Wastewater Systems; Springer Science & Business Media: Berlin, Germany, 2011. [Google Scholar]
- Bach, P.M.; Rauch, W.; Mikkelsen, P.S.; McCarthy, D.T.; Deletic, A. A critical review of integrated urban water modelling—Urban drainage and beyond. Environ. Model. Softw. 2014, 54, 88–107. [Google Scholar] [CrossRef]
- Deb, K.; Pratap, A.; Agarwal, S.; Meyarivan, T. A fast and elitist multiobjective genetic algorithm: NSGA-II. IEEE Trans. Evolut. Comput. 2002, 6, 182–197. [Google Scholar] [CrossRef]
- Fu, G.; Butler, D.; Khu, S.-T. Multiple objective optimal control of integrated urban wastewater systems. Environ. Model. Softw. 2008, 23, 225–234. [Google Scholar] [CrossRef]
- Sidgwick, H. The Principles of Political Economy; Macmillan and Co., Ltd.: London, UK, 1883. [Google Scholar]
- Alfred, M. Principles of Economics; Macmillan and Co., Ltd.: London, UK, 1890. [Google Scholar]
- Pigou, A.C. The Economics of Welfare; Macmillan and Co., Ltd.: London, UK, 1920. [Google Scholar]
- Dales, J.H. Pollution, Property & Prices: An Essay in Policy-Making and Economics; University of Toronto Press: Toronto, ON, Canada, 1968. [Google Scholar]
- Upton, C. Optimal Taxing of Water Pollution. Water Resour. Res. 1968, 4, 865–875. [Google Scholar] [CrossRef]
- Hass, J.E. Optimal taxing for the abatement of water pollution. Water Resour. Res. 1970, 6, 353–365. [Google Scholar] [CrossRef]
- Coeck, C.; S’Jegers, R.; Verbeke, A.; Winkelmans, W. The Effects of Environmental Taxes: An Empirical Study of Water and Solid Waste Levies in Flanders. Ann. Public Coop. Econ. 1995, 66, 479–497. [Google Scholar] [CrossRef]
- Schöb, R. Environmental taxes and pre-existing distortions: The normalization trap. Int. Tax Public Financ. 1997, 4, 167–176. [Google Scholar] [CrossRef]
- Boyd, J. Water pollution taxes: A good idea doomed to failure? Public Financ. Manag. 2003, 1, 34–66. [Google Scholar] [CrossRef]
- Leontief, W. Environmental repercussions and the economic structure: An input-output approach. Rev. Econ. Stat. 1970, 52, 262–271. [Google Scholar] [CrossRef]
- Kwerel, E. To tell the truth: Imperfect information and optimal pollution control. Rev. Econ. Stud. 1977, 44, 595–601. [Google Scholar] [CrossRef]
- Polinsky, A.M.; Shavell, S. The optimal tradeoff between the probability and magnitude of fines. Am. Econ. Rev. 1979, 69, 880–891. [Google Scholar]
- Benford, F.A. On the dynamics of the regulation of pollution: Incentive compatible regulation of a persistent pollutant. J. Environ. Econ. Manag. 1998, 36, 1–25. [Google Scholar] [CrossRef]
- Newell, R.G.; Jaffe, A.B.; Stavins, R.N. The induced innovation hypothesis and energy-saving technological change. Q. J. Econ. 1999, 114, 941–975. [Google Scholar] [CrossRef]
- Moledina, A.A.; Coggins, J.S.; Polasky, S.; Costello, C. Dynamic environmental policy with strategic firms: Prices versus quantities. J. Environ. Econ. Manag. 2003, 45, 356–376. [Google Scholar] [CrossRef]
- Luptacik, M. Data envelopment analysis as a tool for measurement of eco-efficiency. In Optimization, Dynamics, and Economic Analysis; Springer: Berlin, Germany, 2000; pp. 36–48. [Google Scholar]
- Ma, Z. Data Envelopment Analysis: Models and Methodology; Science Press: Beijing, China, 2010. [Google Scholar]
- Iribarren, D.; Vázquez-Rowe, I.; Moreira, M.T.; Feijoo, G. Further potentials in the joint implementation of life cycle assessment and data envelopment analysis. Sci. Total Environ. 2010, 408, 5265–5272. [Google Scholar] [CrossRef] [PubMed]
- Chen, X.S.; Fan, D.C. Empirical study on status of industrial water pollution and treatment efficiency in China. Stat. Inf. Forum 2009, 3, 30–35. [Google Scholar]
- Sala-Garrido, R.; Molinos-Senante, M.; Hernández-Sancho, F. Comparing the efficiency of wastewater treatment technologies through a DEA metafrontier model. Chem. Eng. J. 2011, 173, 766–772. [Google Scholar] [CrossRef]
- Hu, X.B.; Wu, H.Y.; Ge, X.D.; Zhu, D.W.; Zhou, W.B.; Cheng, D.S. Method for Efficiency Assessment of Wastewater Treatment and Application Based on DEA. Water Resour. Prot. 2013, 4, 77–81. [Google Scholar]
- Yin, Y.C.; Liu, Y.G.; Xu, Y.Q.; Liu, S.B.; Guo, Y.M.; Hu, X.J.; Li, J.; Wang, Y.Q. Industrial Pollution Abatement Efficiency in China Based on DEA Model. Chin. J. Environ. Eng. 2015, 6, 3063–3068. [Google Scholar]
- Lorenzo-Toja, Y.; Vázquez-Rowe, I.; Chenel, S.; Marin-Navarro, D.; Moreira, M.T.; Feijoo, G. Eco-efficiency analysis of Spanish WWTPs using the LCA+DEA method. Water Res. 2015, 68, 651–666. [Google Scholar] [CrossRef] [PubMed]
- Liu, Y.L.; Gong, B.; Liu, X.G. An Appraise of Wastewater Treatment Efficiency in China Mineral Industries Based on DEA Models with Undesirable Outputs. Chin. J. Environ. Eng. 2017, 4, 2073–2078. [Google Scholar]
- Dong, X.; Zhang, X.; Zeng, S. Measuring and explaining eco-efficiencies of wastewater treatment plants in China: An uncertainty analysis perspective. Water Res. 2017, 112, 195–207. [Google Scholar] [CrossRef] [PubMed]
- Charnes, A.; Cooper, W.W. Preface to topics in data envelopment analysis. Ann. Oper. Res. 1984, 2, 59–94. [Google Scholar] [CrossRef]
- Satty, T.L. An Eigenvalue Allocation Model for Prioritization and Planning; Energy Management and Policy Center, University of Pennsylvania: Philadelphia, PA, USA, 1972. [Google Scholar]
- An, K.; Liu, H.J.; Zhu, H.; Dong, Z.Y.; Hur, K. Evaluation of Conservation Voltage Reduction with Analytic Hierarchy Process: A Decision Support Framework in Grid Operations Planning. Energies 2016, 9, 1074. [Google Scholar] [CrossRef]
- Zeng, F.; Cheng, X.; Guo, J.; Tao, L.; Chen, Z. Hybridising Human Judgment, AHP, Grey Theory, and Fuzzy Expert Systems for Candidate Well Selection in Fractured Reservoirs. Energies 2017, 10, 447. [Google Scholar] [CrossRef]
- Dinmohammadi, A.; Shafiee, M. Determination of the Most Suitable Technology Transfer Strategy for Wind Turbines Using an Integrated AHP-TOPSIS Decision Model. Energies 2017, 10, 642. [Google Scholar] [CrossRef]
- Pozo, F.; Vidal, Y. Wind Turbine Fault Detection through Principal Component Analysis and Statistical Hypothesis Testing. Energies 2016, 9, 3. [Google Scholar] [CrossRef] [Green Version]
- Aboytes-Ojeda, M.; Castillo-Villar, K.; Yu, T.; Boyer, C.; English, B.; Larson, J.; Kline, L.; Labbé, N. A Principal Component Analysis in Switchgrass Chemical Composition. Energies 2016, 9, 913. [Google Scholar] [CrossRef]
- Hwang, C.-L.; Yoon, K. Multiple Attribute Decision Making:Methods and Applications, A State-of-the-Art Survey; Springer: New York, NY, USA, 1981. [Google Scholar]
- Kolios, A.; Mytilinou, V.; Lozano-Minguez, E.; Salonitis, K. A comparative study of multiple-criteria decision-making methods under stochastic inputs. Energies 2016, 9, 566. [Google Scholar] [CrossRef]
- Gligorić, M.; Gligorić, Z.; Beljić, Č.; Torbica, S.; Štrbac Savić, S.; Nedeljković Ostojić, J. Multi-Attribute Technological Modeling of Coal Deposits Based on the Fuzzy TOPSIS and C-Mean Clustering Algorithms. Energies 2016, 9, 1059. [Google Scholar] [CrossRef]
- Zheng, L.J. Research on Efficiency of Industrial Pollution Control in Hangzhou Based on DEA. Stat. Theory Pract. 2011, 2, 49–51. [Google Scholar]
- Wang, L.F.; Sun, P.P. Study on Evaluation Index System of Regional Environmental Governance Efficiency. Stat. Decis. 2012, 10, 60–62. [Google Scholar]
- Sala-Garrido, R.; Hernández-Sancho, F.; Molinos-Senante, M. Assessing the efficiency of wastewater treatment plants in an uncertain context: A DEA with tolerances approach. Environ. Sci. Policy 2012, 18, 34–44. [Google Scholar] [CrossRef]
- Kao, C.; Liu, S.T. Fuzzy efficiency measures in data envelopment analysis. Fuzzy Sets Syst. 2000, 113, 427–437. [Google Scholar] [CrossRef]
- Cooper, W.W. Operational research/management science: Where it’s been. Where it should be going? J. Oper. Res. Soc. 1999, 50, 3–11. [Google Scholar] [CrossRef]
- Bonilla, M.; Casasús, T.; Medal, A.; Sala, R. An efficiency analysis with tolerance of the Spanish port system. Int. J. Transp. Econ. Riv. Int. Econ. Trasp. 2004, 31, 379–400. [Google Scholar]
- Kao, C.; Liu, S.-T. Stochastic data envelopment analysis in measuring the efficiency of Taiwan commercial banks. Eur. J. Oper. Res. 2009, 196, 312–322. [Google Scholar] [CrossRef]
- Bosca, J.E.; Liern, V.; Sala, R.; Martinez, A. Ranking decision making units by means of soft computing DEA models. Int. J. Uncertain. Fuzziness Knowl. Based Syst. 2011, 19, 115–134. [Google Scholar] [CrossRef]
- Molinos-Senante, M.; Donoso, G.; Sala-Garrido, R. Assessing the efficiency of Chilean water and sewerage companies accounting for uncertainty. Environ. Sci. Policy 2016, 61, 116–123. [Google Scholar] [CrossRef]
- Hall, R.E.; Jones, C.I. Why do some countries produce so much more output per worker than others? Q. J. Econ. 1999, 114, 83–116. [Google Scholar] [CrossRef]
- Fan, Q. Research on Interest Conflict for Preventing and Controlling of Local Industrial Pollution under Perspective of Interests Group. Ph.D. Thesis, Liaoning University, Shenyang, China, 2011. [Google Scholar]
- National Bureau of Statistics of China. China Energy Statistical Yearbook, 2004–2015; China Statistic Press: Beijing, China, 2015.
- National Bureau of Statistics of China. China Statistical Yearbook, 1979–2015; China Statistic Press: Beijing, China, 2015.
- Ma, H.L.; Huang, D.C.; Zhang, J.G. Water resource utility efficiency and its influencing factors considering undesirable goods. China Popul. Resour. Environ. 2012, 22, 35–42. [Google Scholar]
- Li, G.J.; Huang, D.H.; Li, Y.L. China’s input-output efficiency of water-energy-food nexus based on the Data Envelopment Analysis (DEA) model. Sustainability 2016, 8, 927. [Google Scholar] [CrossRef]
- Ma, S. Detection Method and Evaluation Technique of Biological Toxicity of Sewage. China Urban Econ. 2011, 6, 156–158. [Google Scholar]
- Kong, L.; Li, R. Relations between Political Connections, Corporate Financial Performance and Enterprise Social Responsibility: A Case Study on the Food and Beverage Industry in China. J. Beijing Jiaotong Univ. Soc. Sci. Ed. 2015, 3, 53–61. [Google Scholar]
- Wang, H.F.; Chen, Q.K. General Purpose Computing of Graphics Processing Unit: A Survey. Chin. J. Comput. 2013, 4, 757–772. [Google Scholar] [CrossRef]
- Schuetze, M.R. Integrated Simulation and Optimum Control of the Urban Wastewater System. Ph.D. and D.I.C. Thesis, Department of Civil Engineering, Imperial College, University of London, London, UK, 1998. [Google Scholar]
- Meirlaen, J. Immission Based Real-Time Control of the Integrated Urban Wastewater System. Ph.D. Thesis, Ghent University, Gent, Belgium, 2002. [Google Scholar]
- Butler, D.; Schütze, M. Integrating simulation models with a view to optimal control of urban wastewater systems. Environ. Model. Softw. 2005, 20, 415–426. [Google Scholar] [CrossRef]
- Refsgaard, J.C.; van der Sluijs, J.P.; Højberg, A.L.; Vanrolleghem, P.A. Uncertainty in the environmental modelling process—A framework and guidance. Environ. Model. Softw. 2007, 22, 1543–1556. [Google Scholar] [CrossRef]
- Ragas, A.M.J.; Huijbregts, M.A.J.; Henning-de Jong, I.; Leuven, R.S.E.W. Uncertainty in environmental risk assessment: Implications for risk-based management of river basins. Integr. Environ. Assess. Manag. 2009, 5, 27–37. [Google Scholar] [CrossRef] [PubMed]
- Carter, J.G.; White, I. Environmental planning and management in an age of uncertainty: The case of the Water Framework Directive. J. Environ. Manag. 2012, 113, 228–236. [Google Scholar] [CrossRef] [PubMed]
- Boomgaard, M.E.; Langeveld, J.G.; Clemens, F.H.L.R. Wastewater system optimization using genetic algorithms. In Bridging the Gap: Meeting the World’s Water and Environmental Resources Challenges; American Society of Civil Engineers (ASCE): New York, NY, USA, 2001; pp. 1–9. [Google Scholar]
- Khu, S.-T.; di Pierro, F.; Savić, D.; Djordjević, S.; Walters, G.A. Incorporating spatial and temporal information for urban drainage model calibration: An approach using preference ordering genetic algorithm. Adv. Water Resour. 2006, 29, 1168–1181. [Google Scholar] [CrossRef]
- Muschalla, D.; Schrφter, K.; Schütze, M. Multi-objective evolutionary algorithms in the field of urban drainage. In Proceedings of the Seventh International Conference on Hydroinformatics, Nice, France, 4–8 September 2006. [Google Scholar]
- Zhao, S.L. Study on the Existence and Development of Tobacco Monopoly System in China. China Collect. Econ. 2010, 1, 62–63. [Google Scholar]
- Ma, B.Q. Wastewater Treatment in Shanghai Tobacco Factory. Tob. Sci. Technol. 2004, 6, 3–5. [Google Scholar]
- Wu, H.; Xiang, F.; Guan, Y.X. Study on Tobacco Wastewater Processing Techniques. Shanxi Archit. 2012, 7, 129–130. [Google Scholar]
Figure 1.
The GDP and industrial wastewater emissions of China, 2003–2014. Data source: National Bureau of Statistics of China (2004–2015).
Figure 1.
The GDP and industrial wastewater emissions of China, 2003–2014. Data source: National Bureau of Statistics of China (2004–2015).
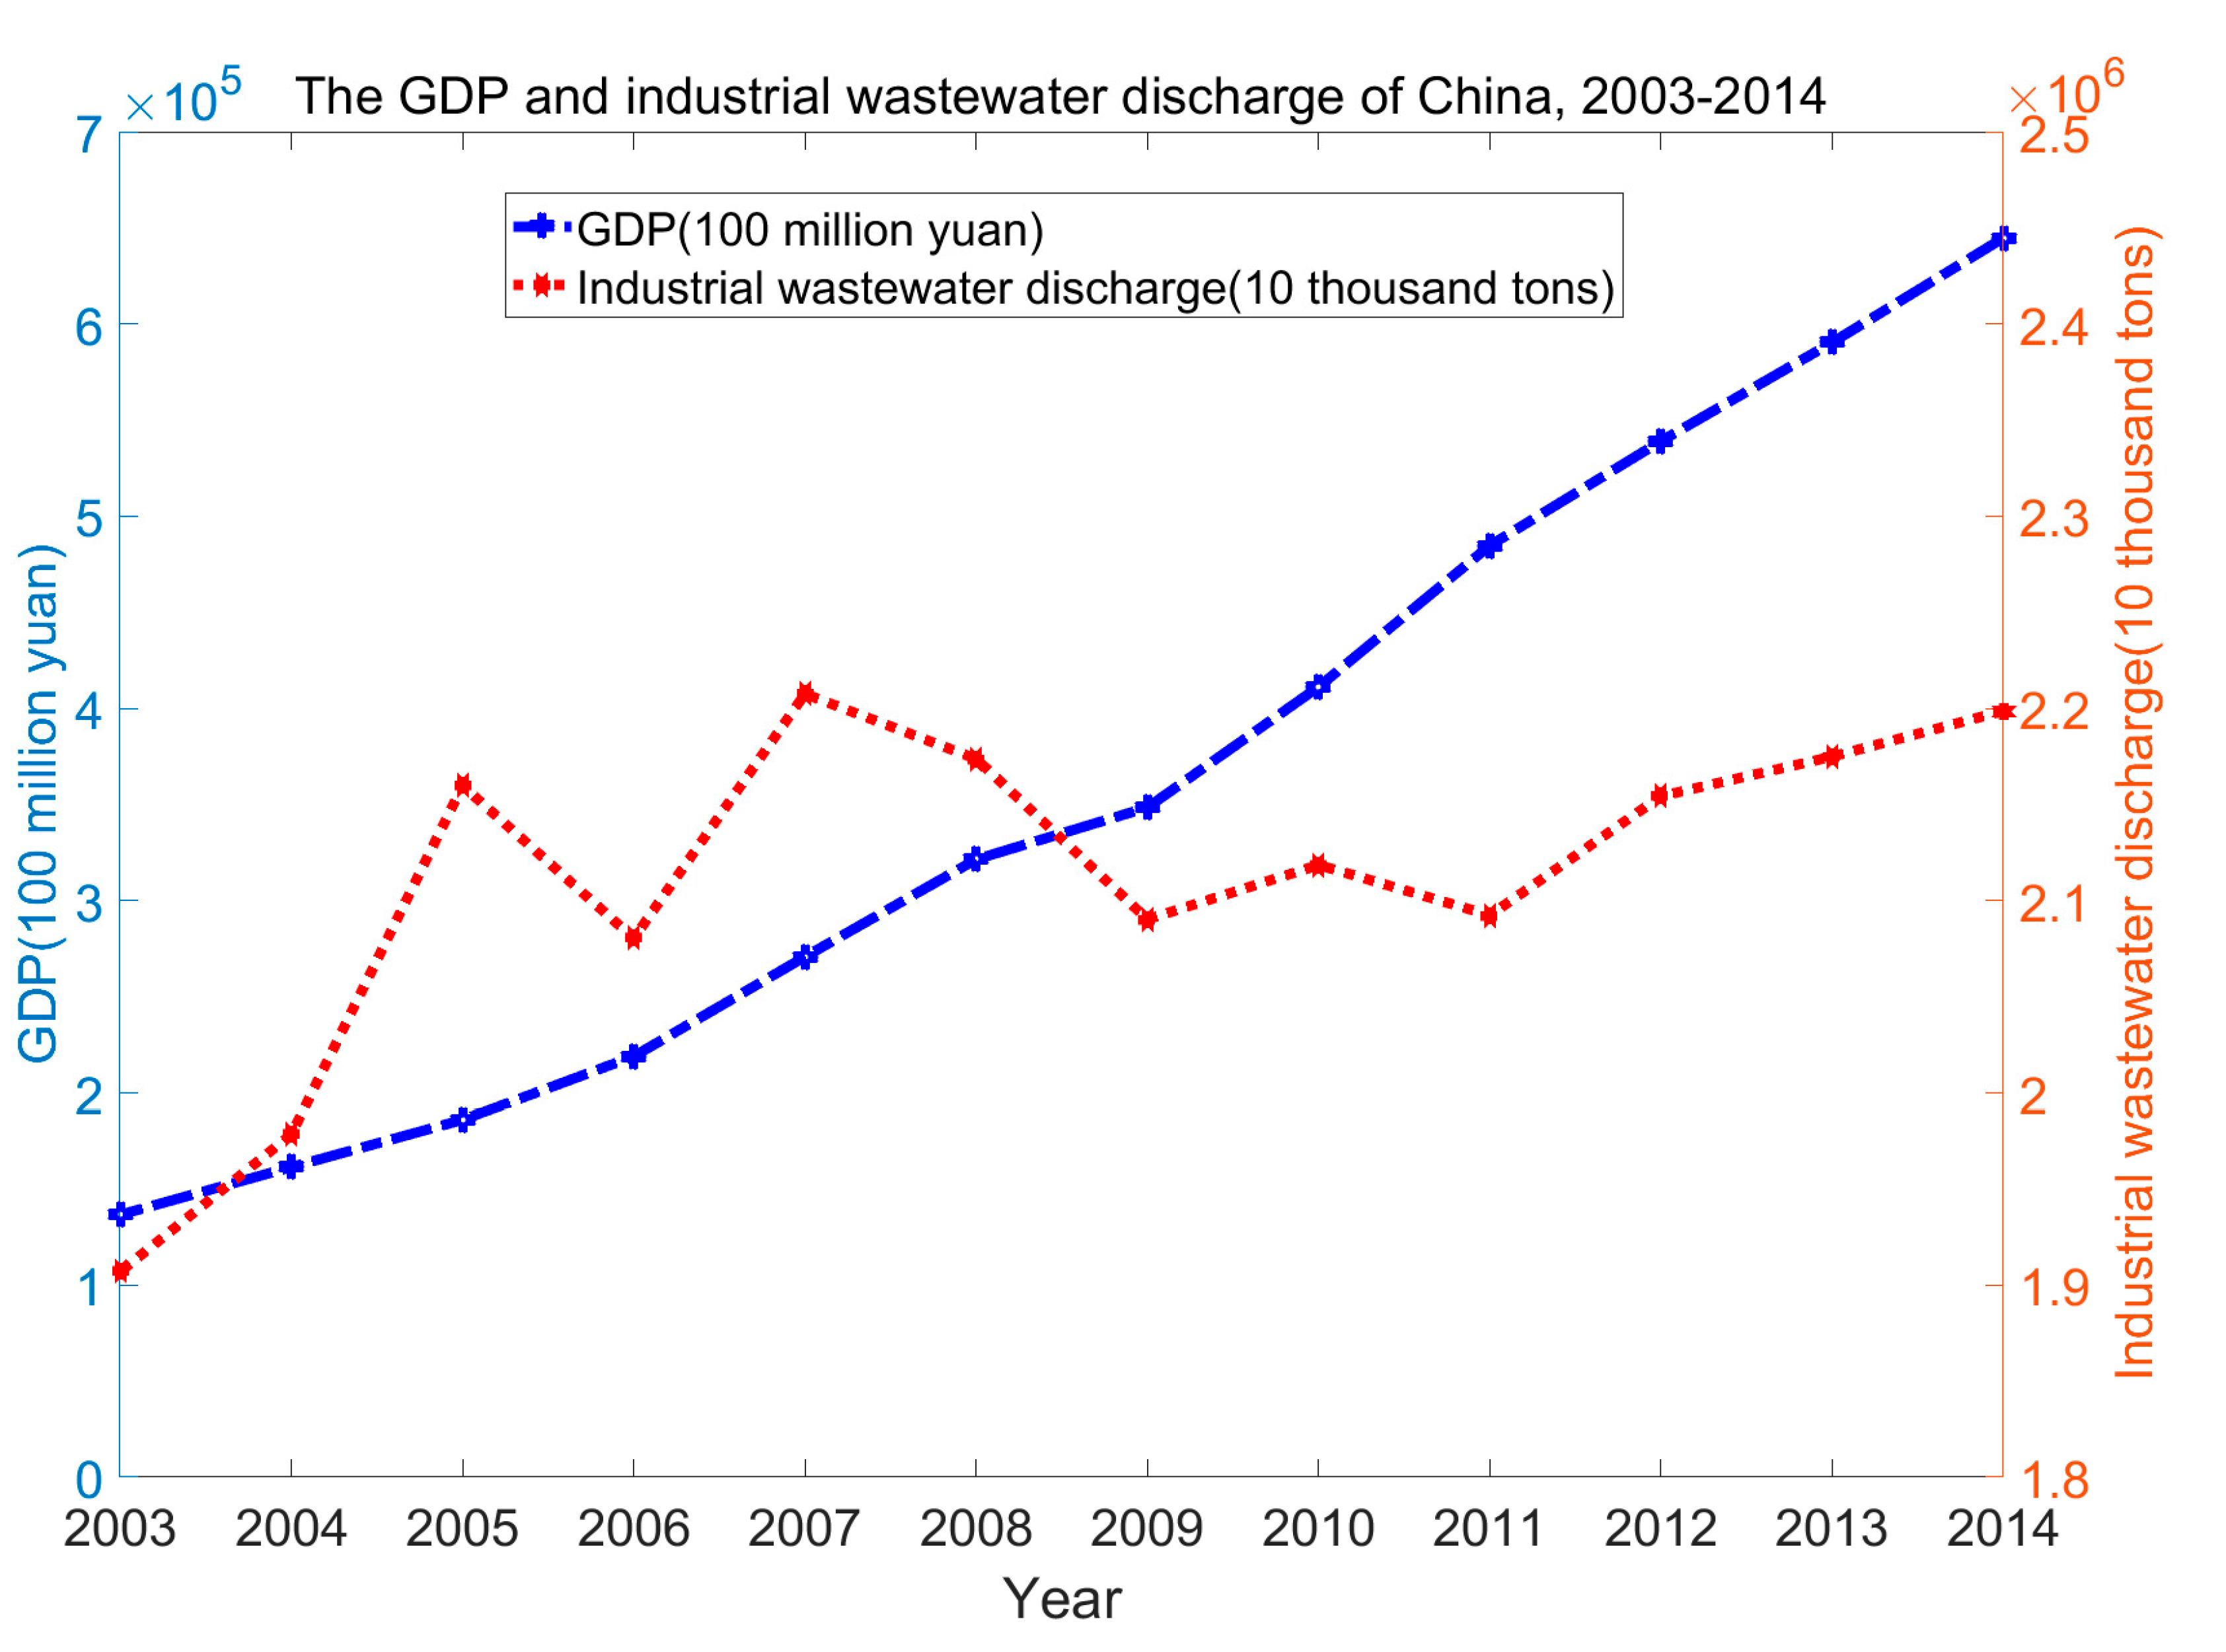
Figure 2.
TFE of wastewater control in different industries of China, 2003–2014: (a) TFE of wastewater control in different industries of China, 2003–2006; (b) TFE of wastewater control in different industries of China, 2007–2010 and (c) TFE of wastewater control in different industries of China, 2011–2014 (the serial numbers from 1 to 39 in Figure 2 correspond to the industrial sectors in Table S1).


© 2017 by the authors. Licensee MDPI, Basel, Switzerland. This article is an open access article distributed under the terms and conditions of the Creative Commons Attribution (CC BY) license (http://creativecommons.org/licenses/by/4.0/).
Share and Cite
MDPI and ACS Style
Yang, W.; Li, L. Efficiency Evaluation and Policy Analysis of Industrial Wastewater Control in China. Energies 2017, 10, 1201. https://doi.org/10.3390/en10081201
AMA Style
Yang W, Li L. Efficiency Evaluation and Policy Analysis of Industrial Wastewater Control in China. Energies. 2017; 10(8):1201. https://doi.org/10.3390/en10081201
Chicago/Turabian StyleYang, Weixin, and Lingguang Li. 2017. "Efficiency Evaluation and Policy Analysis of Industrial Wastewater Control in China" Energies 10, no. 8: 1201. https://doi.org/10.3390/en10081201
Note that from the first issue of 2016, this journal uses article numbers instead of page numbers. See further details here.