This section presents the forecasting performance of the proposed SD-EMD-LSTM model. The hourly electric load data from NE-ISO 2003 to 2016 is employed for the models. The forecasting has been conducted in two time scales, namely, one day ahead (24 h) and one week ahead (168 h).
First, we present the experiments on applying the weighted k-means-based SD selection algorithm for load forecasting, as well as analyze the optimum value of the clusters k. Second, we verify the clustering effect of the proposed SD selection method and the need of using the supplemental feature. Third, experiments in two time scales are conducted to compare the proposed model with the standalone LSTM, SD-LSTM, and EMD-LSTM models to show the fitting effect of the hybrid model. Lastly, we compare the forecasting performance with three other models (i.e., ARIMA, BPNN, and SVR) to illustrate the forecasting accuracy and stability of the SD-EMD-LSTM model. The structure of BPNN model comprises of 3 layers viz. input, hidden and output layers(6-20-1), where the transfer functions of hidden layer and output layer are tansig and purelin, respectively. While the training function uses traingdm, the learning function of threshold and weights use learnged. SVR with LIBSVM package with , , .
5.2. Empirical Results and Analysis
We perform simulations of the four examples to verify the predictive ability of the proposed method:
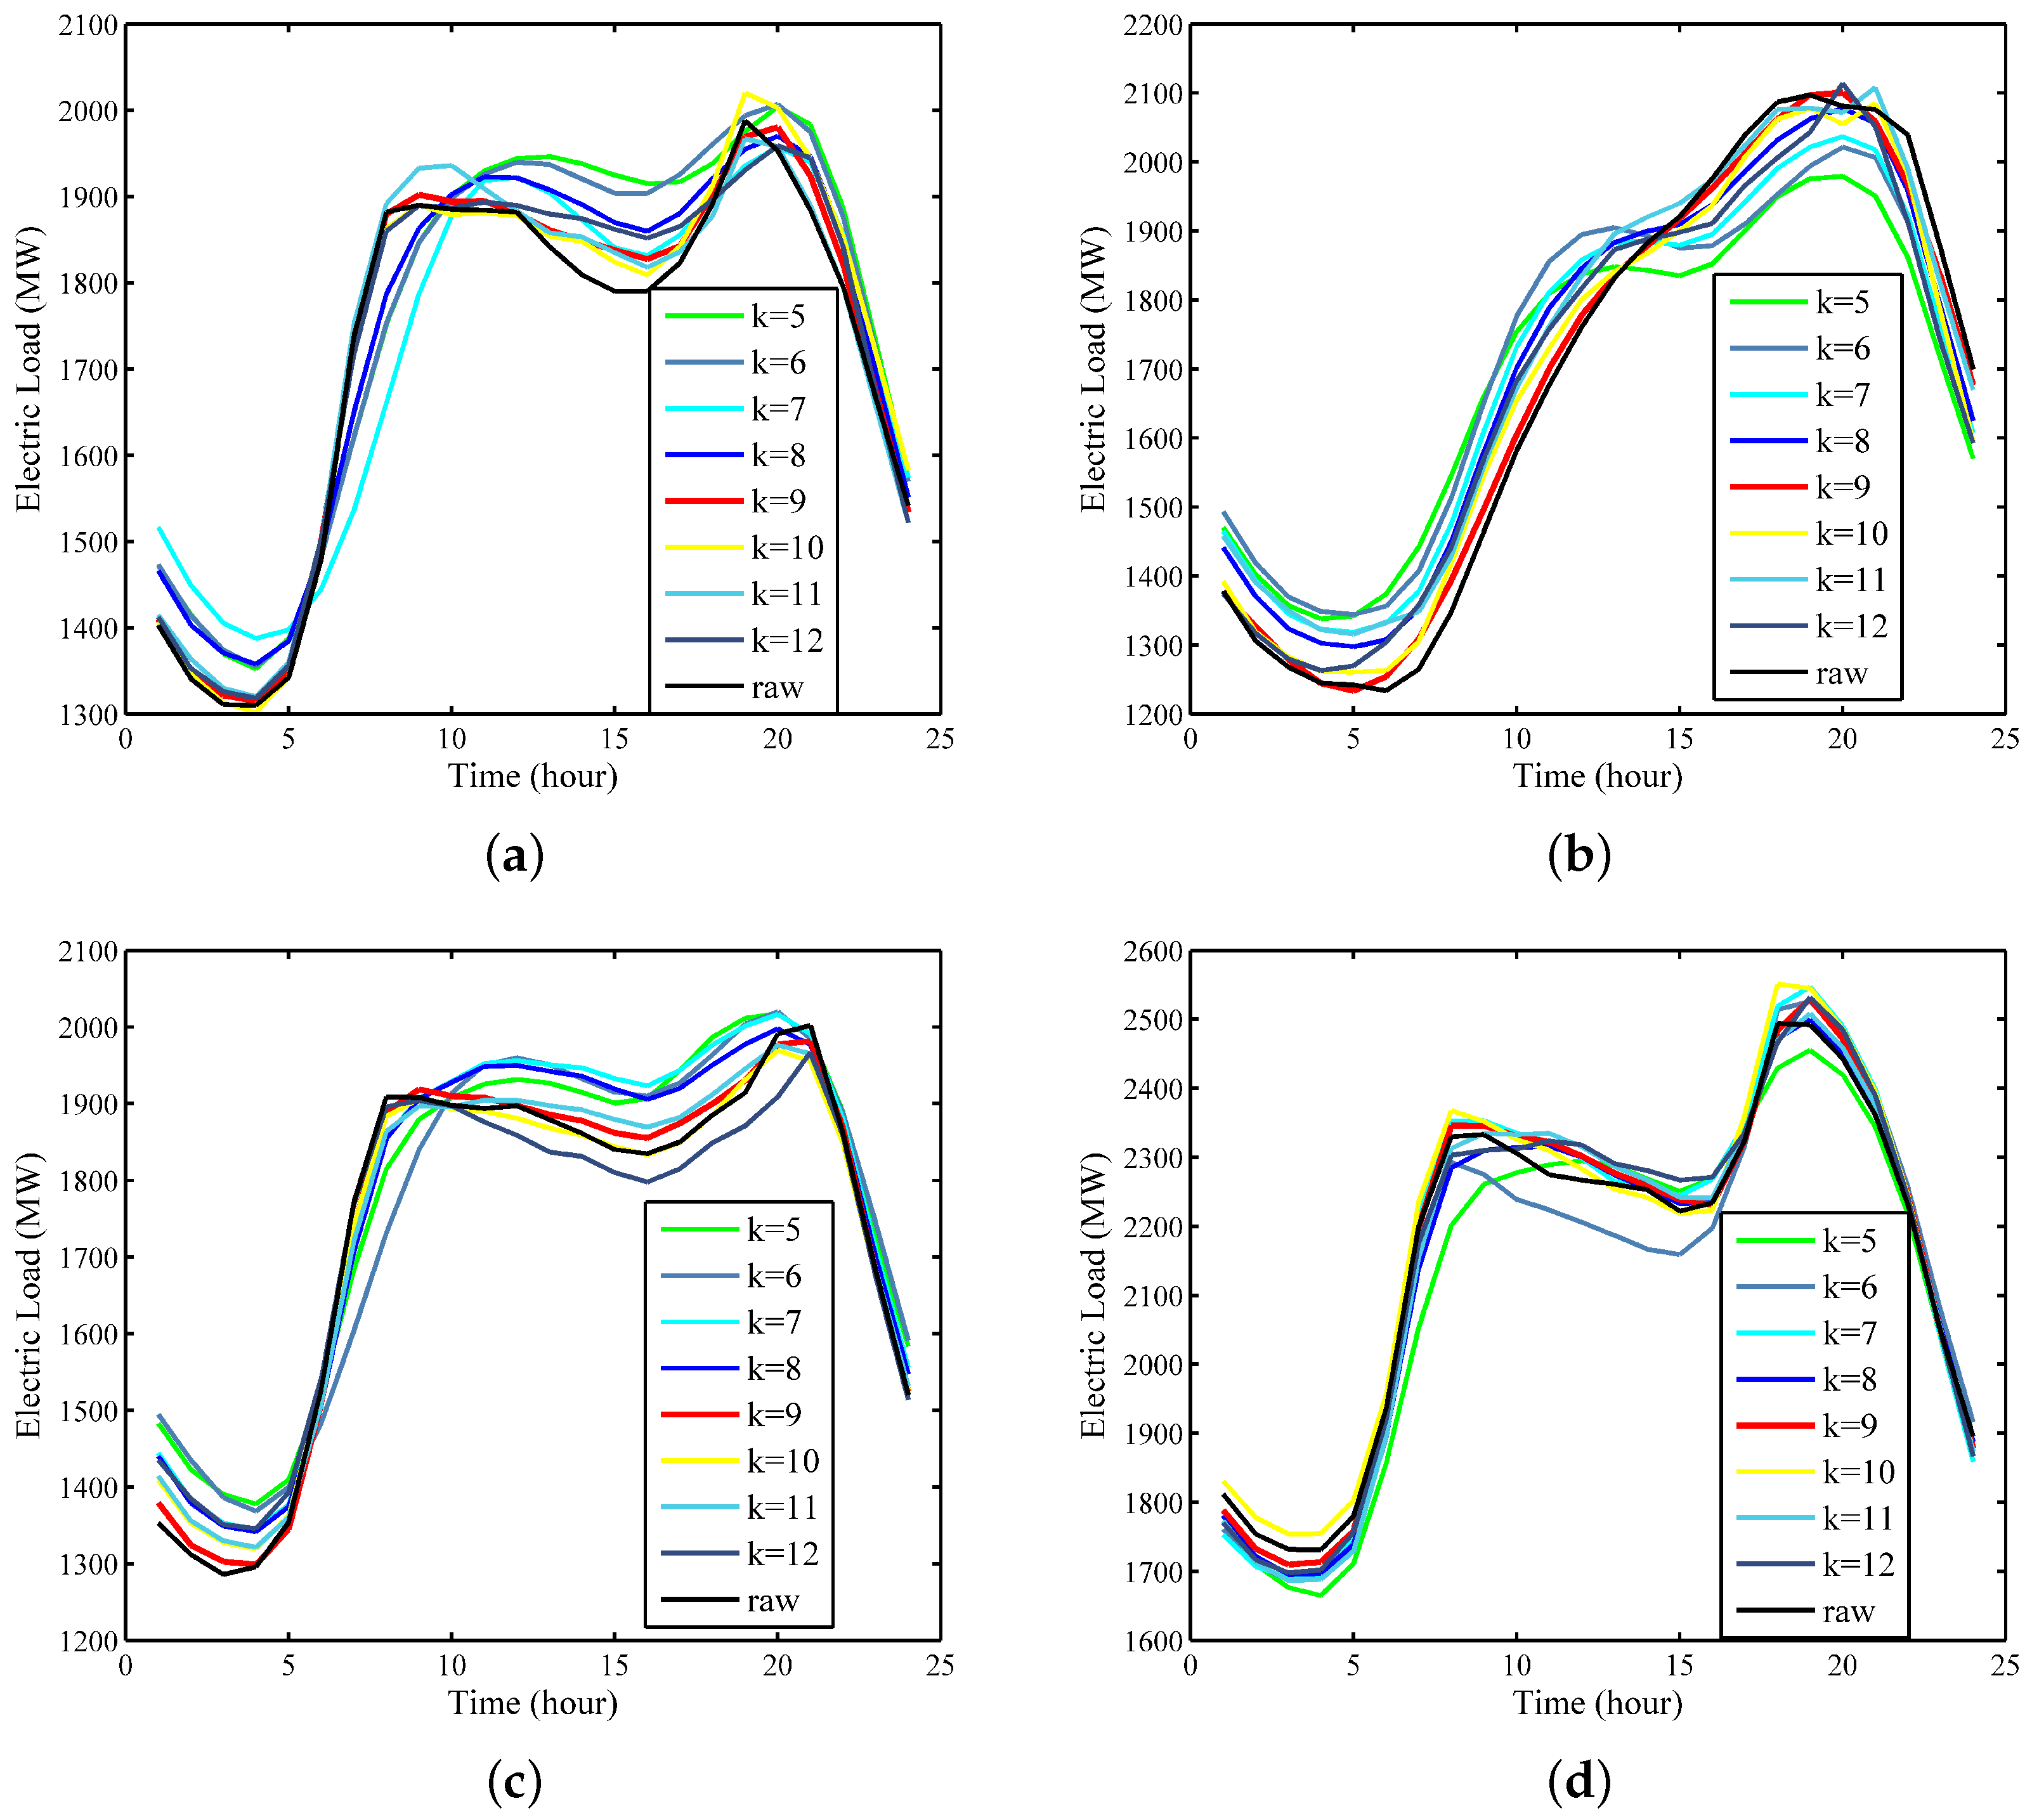
Example 1: Through the enumeration method, k ranges from 5 to 12, the run is repeated several times in each k value using the Xgboost-k-means-based SD-EMD-LSTM model. Thereafter, the prediction accuracy of each k is calculated. Experiments of the 24-h-ahead forecasting in different seasons are performed to analyze the best k value with the highest prediction accuracy.
Figure 11 shows that when the number of clusters equals 9, the prediction curve most closely follows the raw curve in four days, including 30 October 2016, 5 July 2015, 13 April 2014, and 22 February 2013, which represent the four seasons.
MAPE can also be used to determine the ideal number of clusters. Comparison results (see
Table 2) show that the proposed model with 9 clusters outperformed all the other cluster numbers with the smallest forecasting MAPE of 0.97%. That is, the proposed Xgboost-k-means method can effectively merge SDs into one cluster. Consequently, we define k = 9 as a priori knowledge in the proposed SD-EMD-LSTM model to select SD for the subsequent load forecasting.
Example 2: This example includes two cases. Case 1 verifies the clustering effect of the proposed SD selection method, and the simple k-means algorithm is used to the SD selection for comparison with the proposed Xgboost-k-means model. Case 2 demonstrates the importance of using the supplemental feature, namely, day-ahead peak load. The training period in this example is from 2003 to 2015, and the prediction period is 2016.
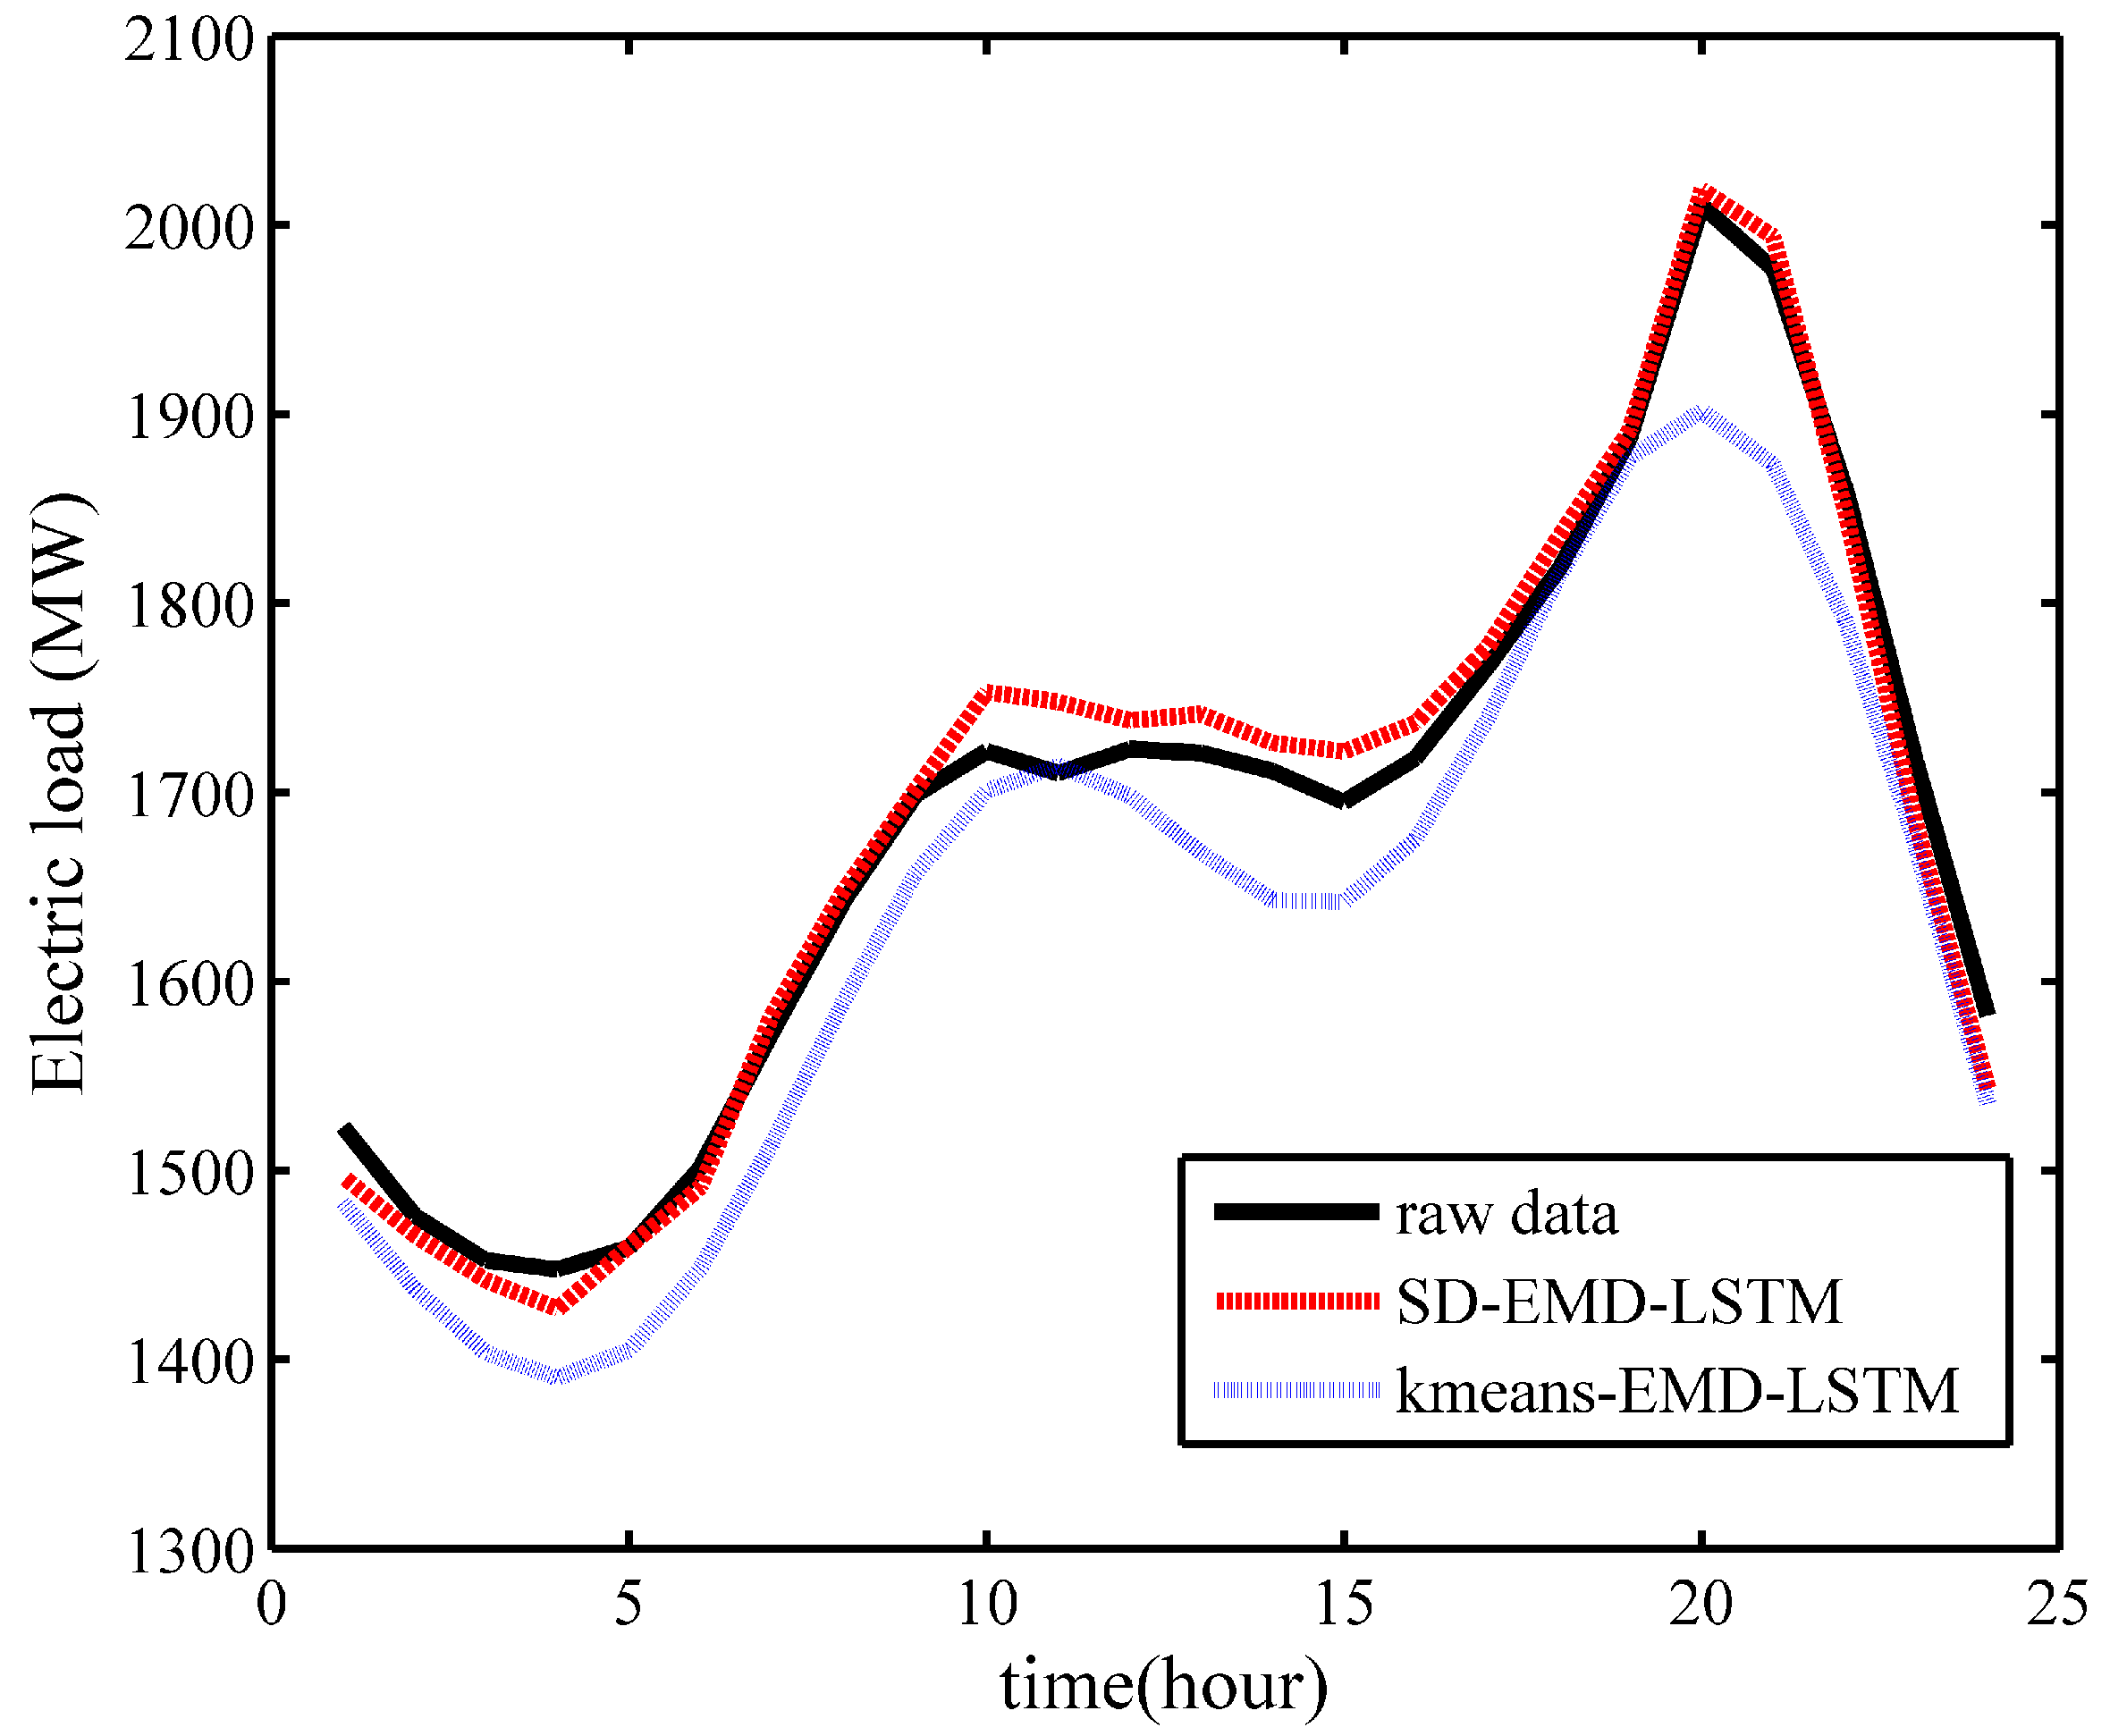
Case 1: EMD-LSTM is combined with the proposed SD selection method and simple k-means algorithm respectively to verify its performance. In the one-day ahead load forecasting as shown in
Figure 12, Xgboost-k-means hybrid with the EMD-LSTM model fits the raw data better than the simple k-means clustering algorithm. That is, the Xgboost-k-means algorithm could merge SDs into one cluster more effectively, thereby improving the prediction accuracy.
Table 3 also verifies this scenario, which shows that the SD-EMD-LSTM model achieved an improved forecasting performance with a considerably small MAPE, as well as agrees with the conclusion presented in
Section 3. The reason lies in that the Xgboost algorithm has considerable ability to access each feature’s weight, the limitation of the dimensionality is generally reduced, and the models are obtained with increasing the forecasting accuracy.
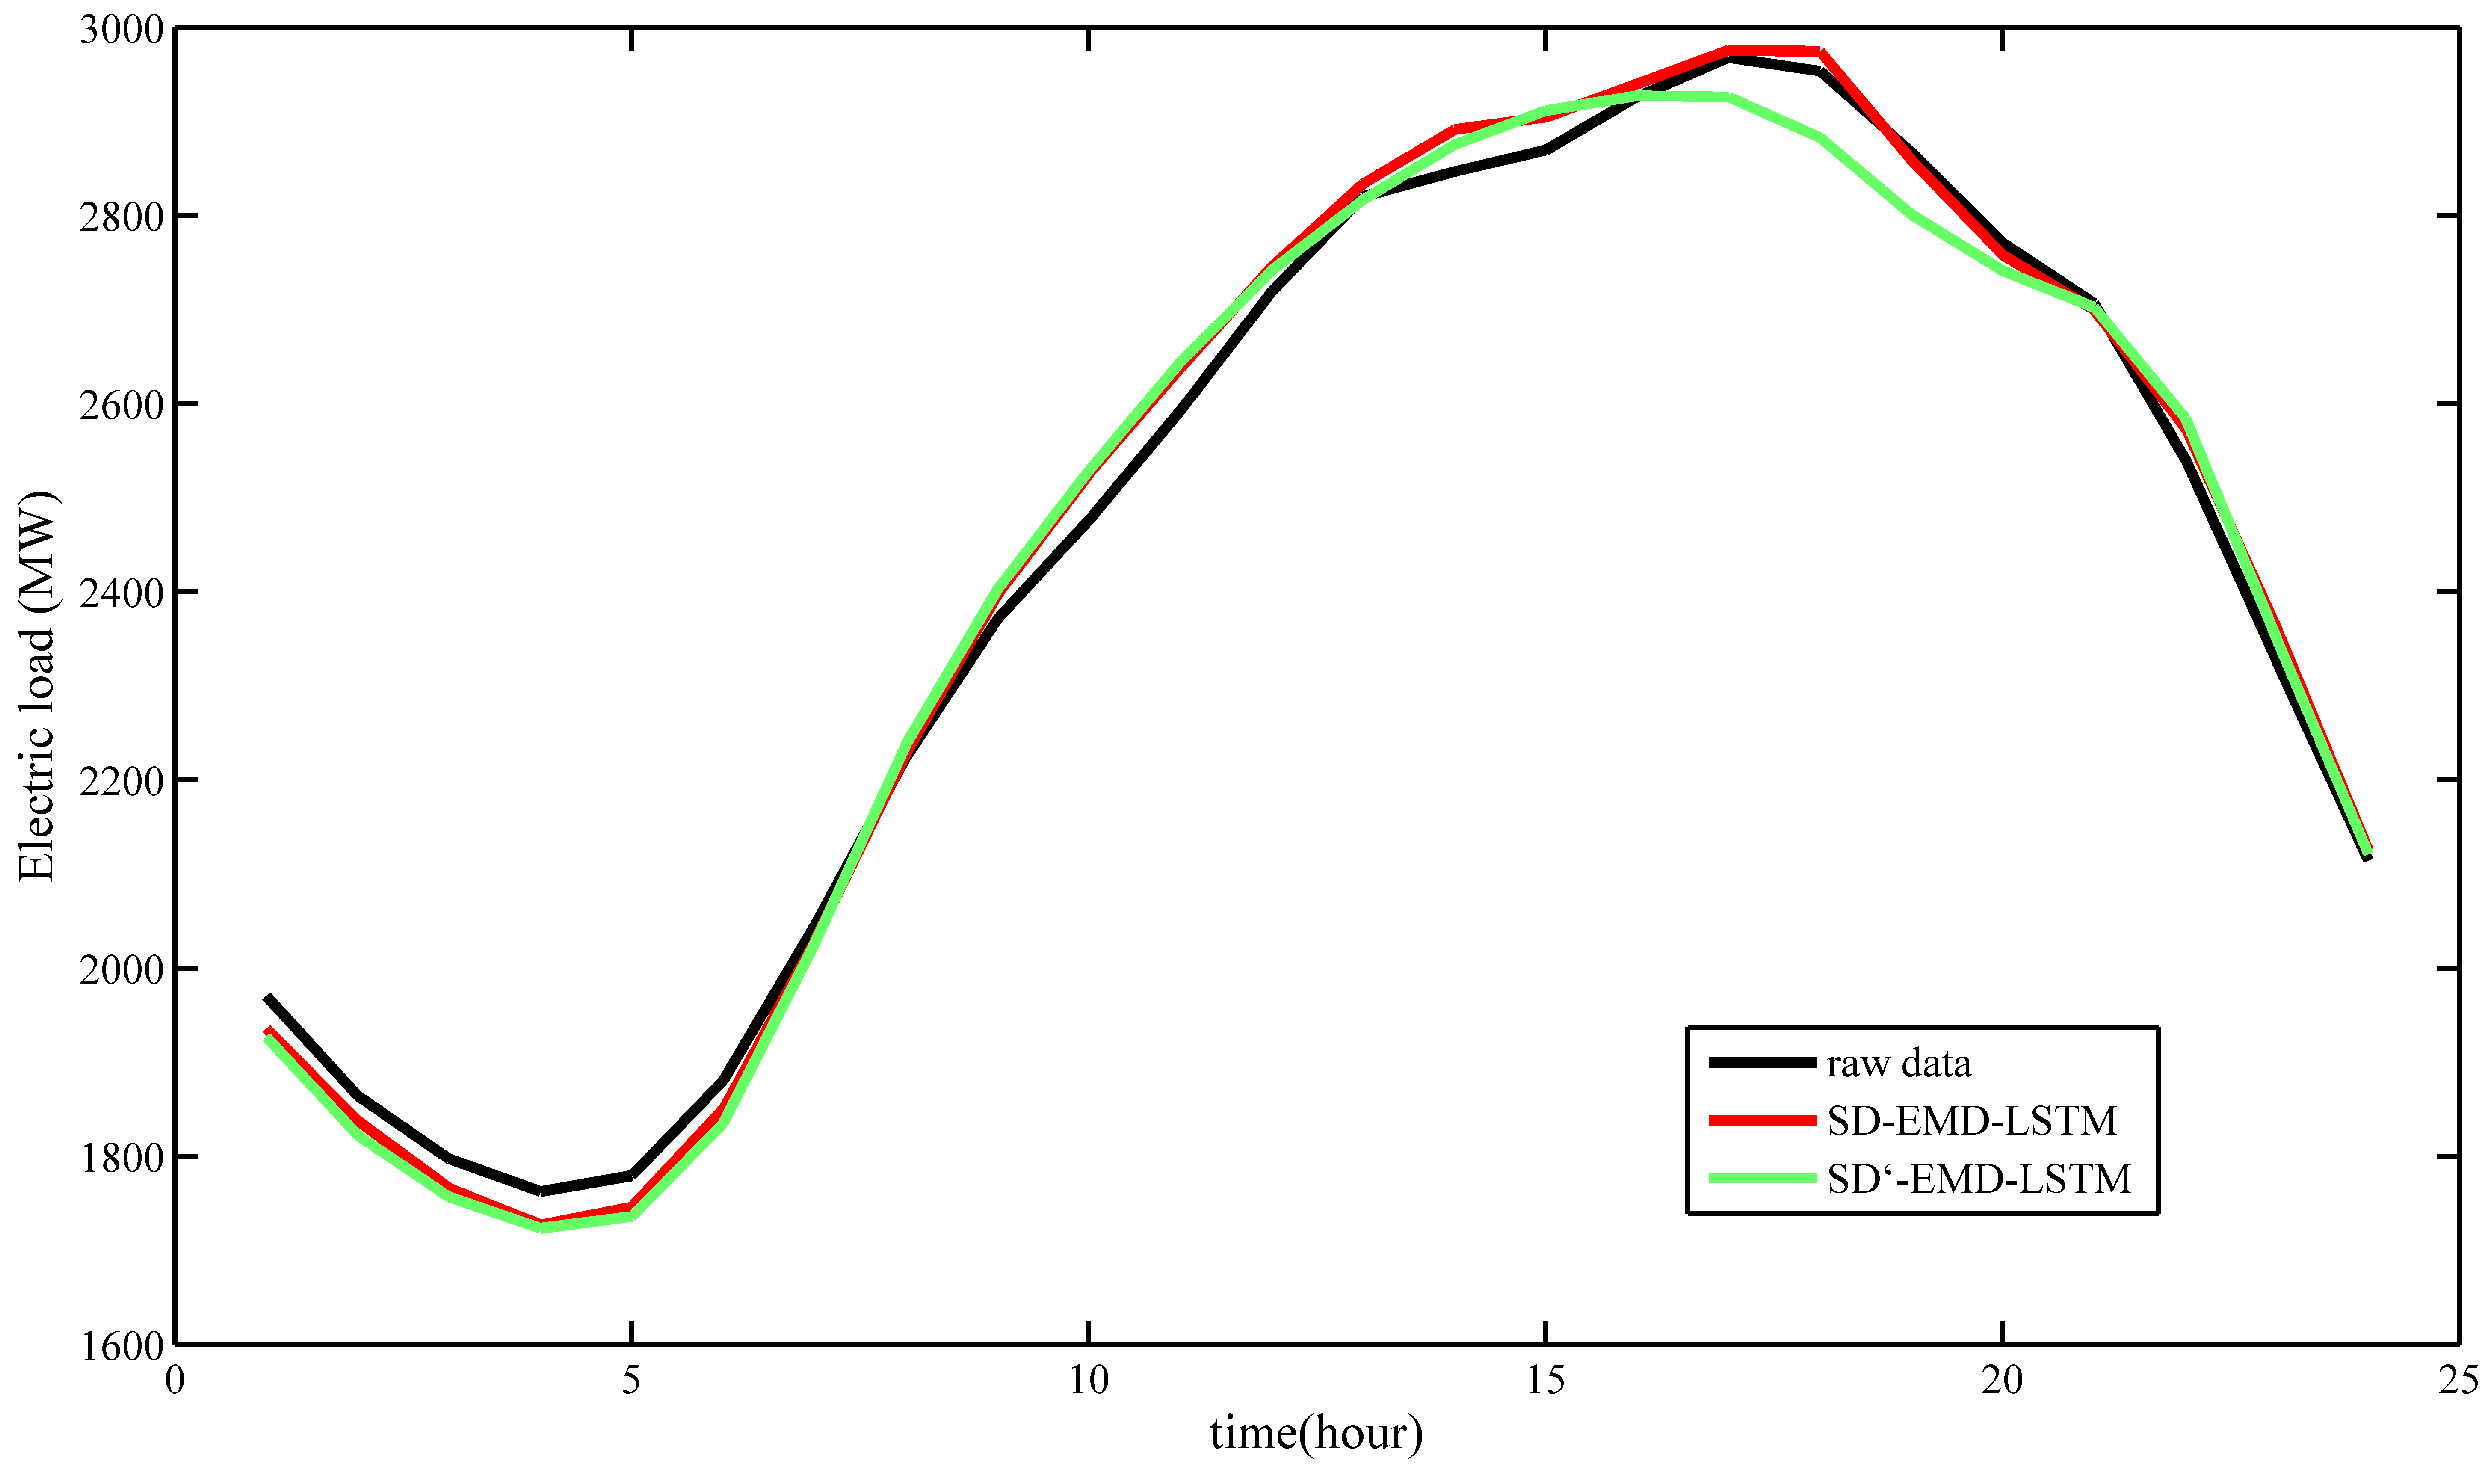
Case 2: The SD-EMD-LSTM model is used with and without the supplemental feature (i.e., day-ahead peak load) to analyze the prediction accuracy on the one-day ahead load forecasting. Further details are shown in
Figure 13.
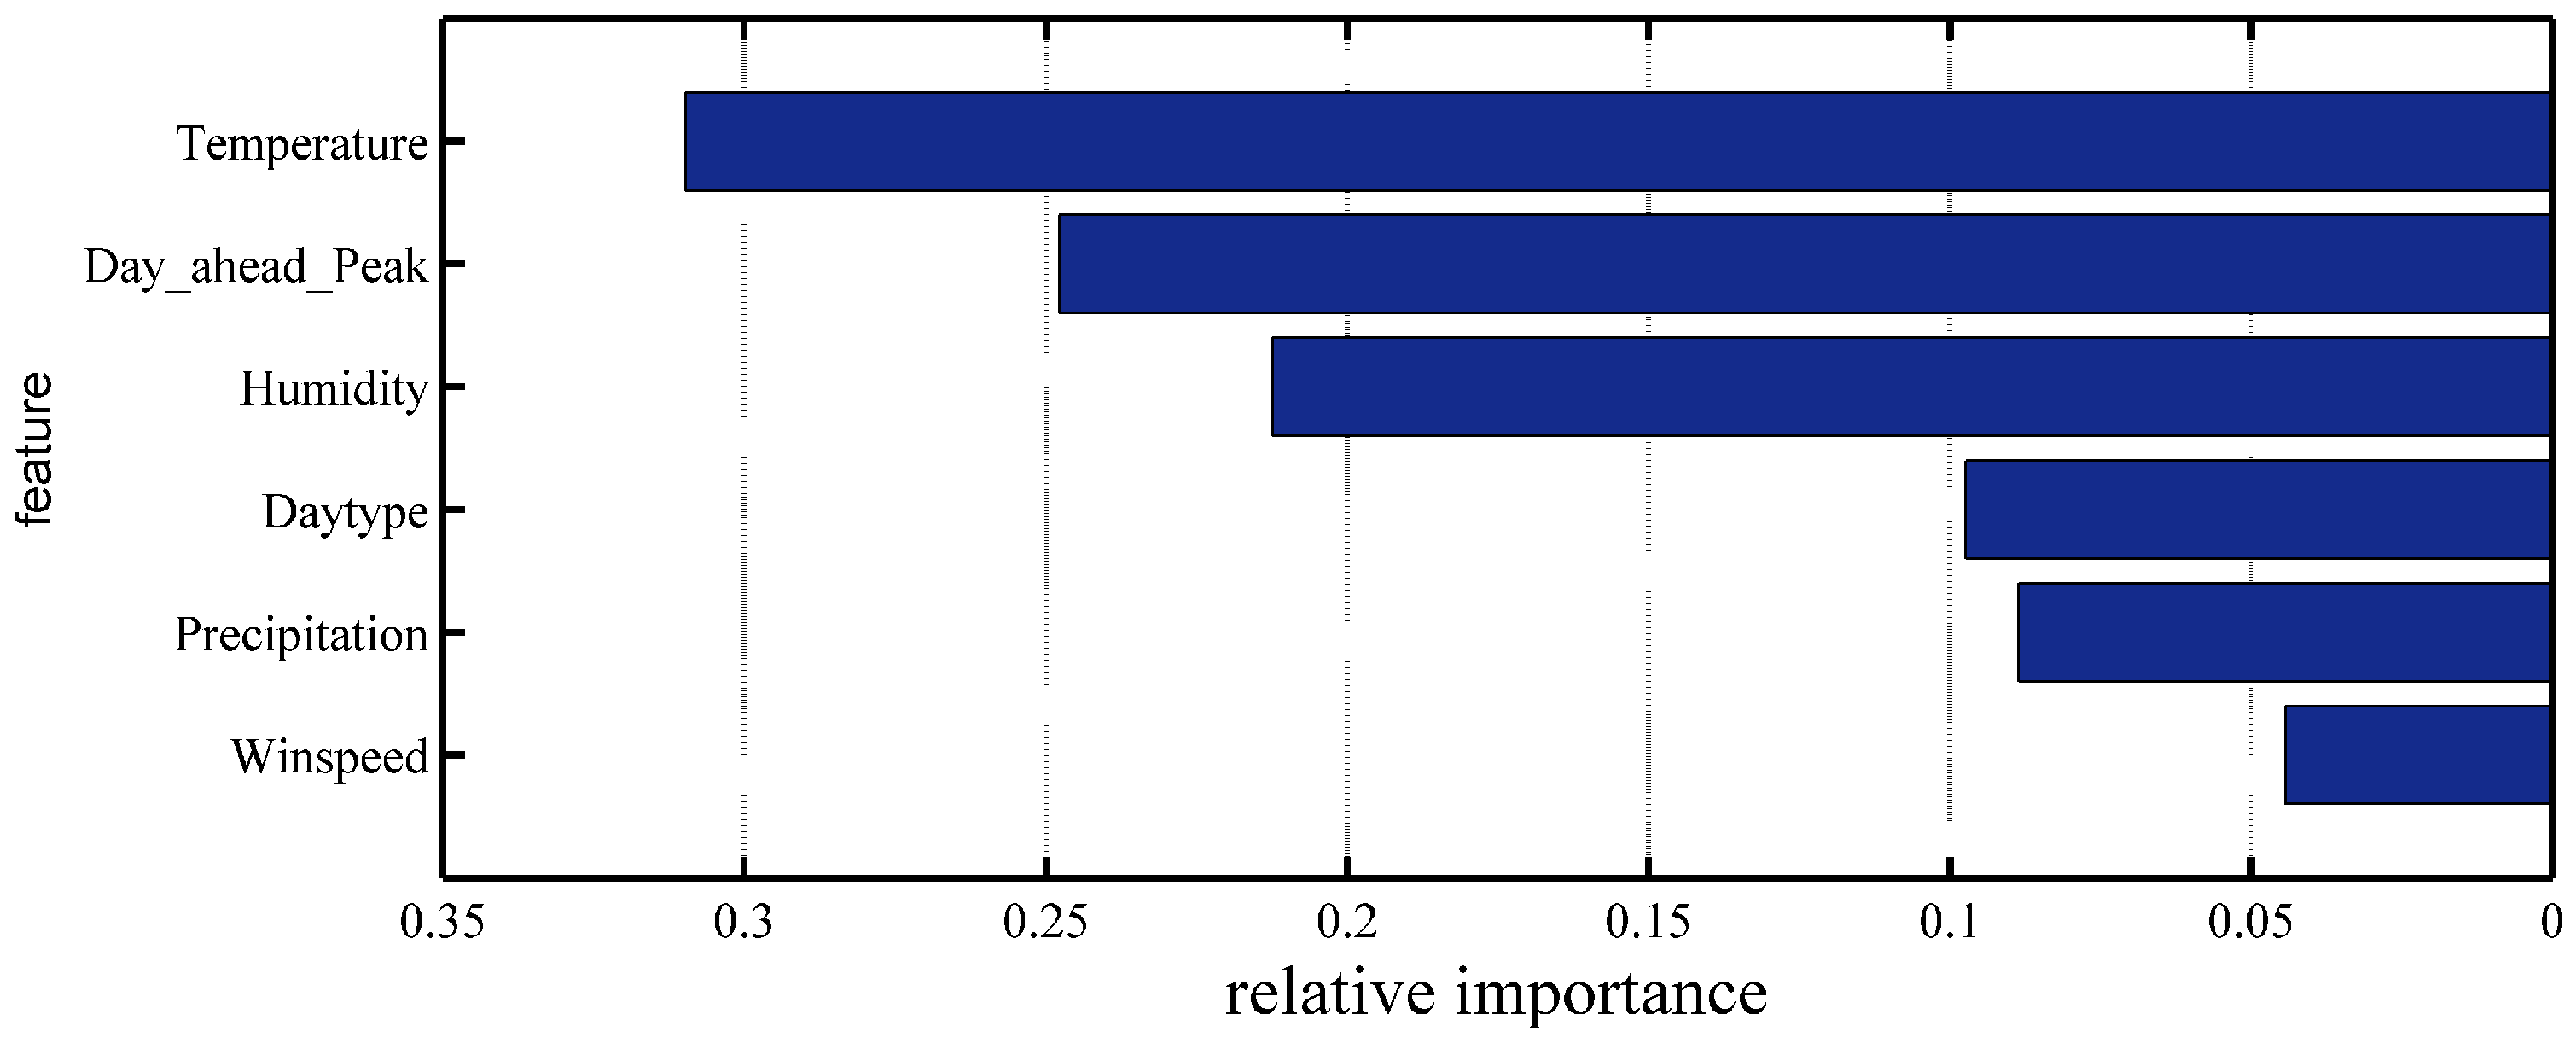
The most significant forecasting errors often occur at the peak points of the forecast load curve. The reason is that the proposed model with the supplemental feature (i.e., day-ahead peak load) can achieve an improved forecasting performance at the peak points.
The hourly mean absolute percentage errors listed in
Table 4 indicate that the proposed model with supplemental input feature (i.e., day-ahead peak load) obtained an average MAPE of 1.10%. This value is lower than the 1.44% obtained in the model without the supplemental input feature. Furthermore, SD-EMD-LSTM with supplemental input feature has good prediction accuracy during peak hours (i.e., from 15:00 to 20:00). Therefore, the day-ahead peak load should be the supplemental input feature for load forecasting.
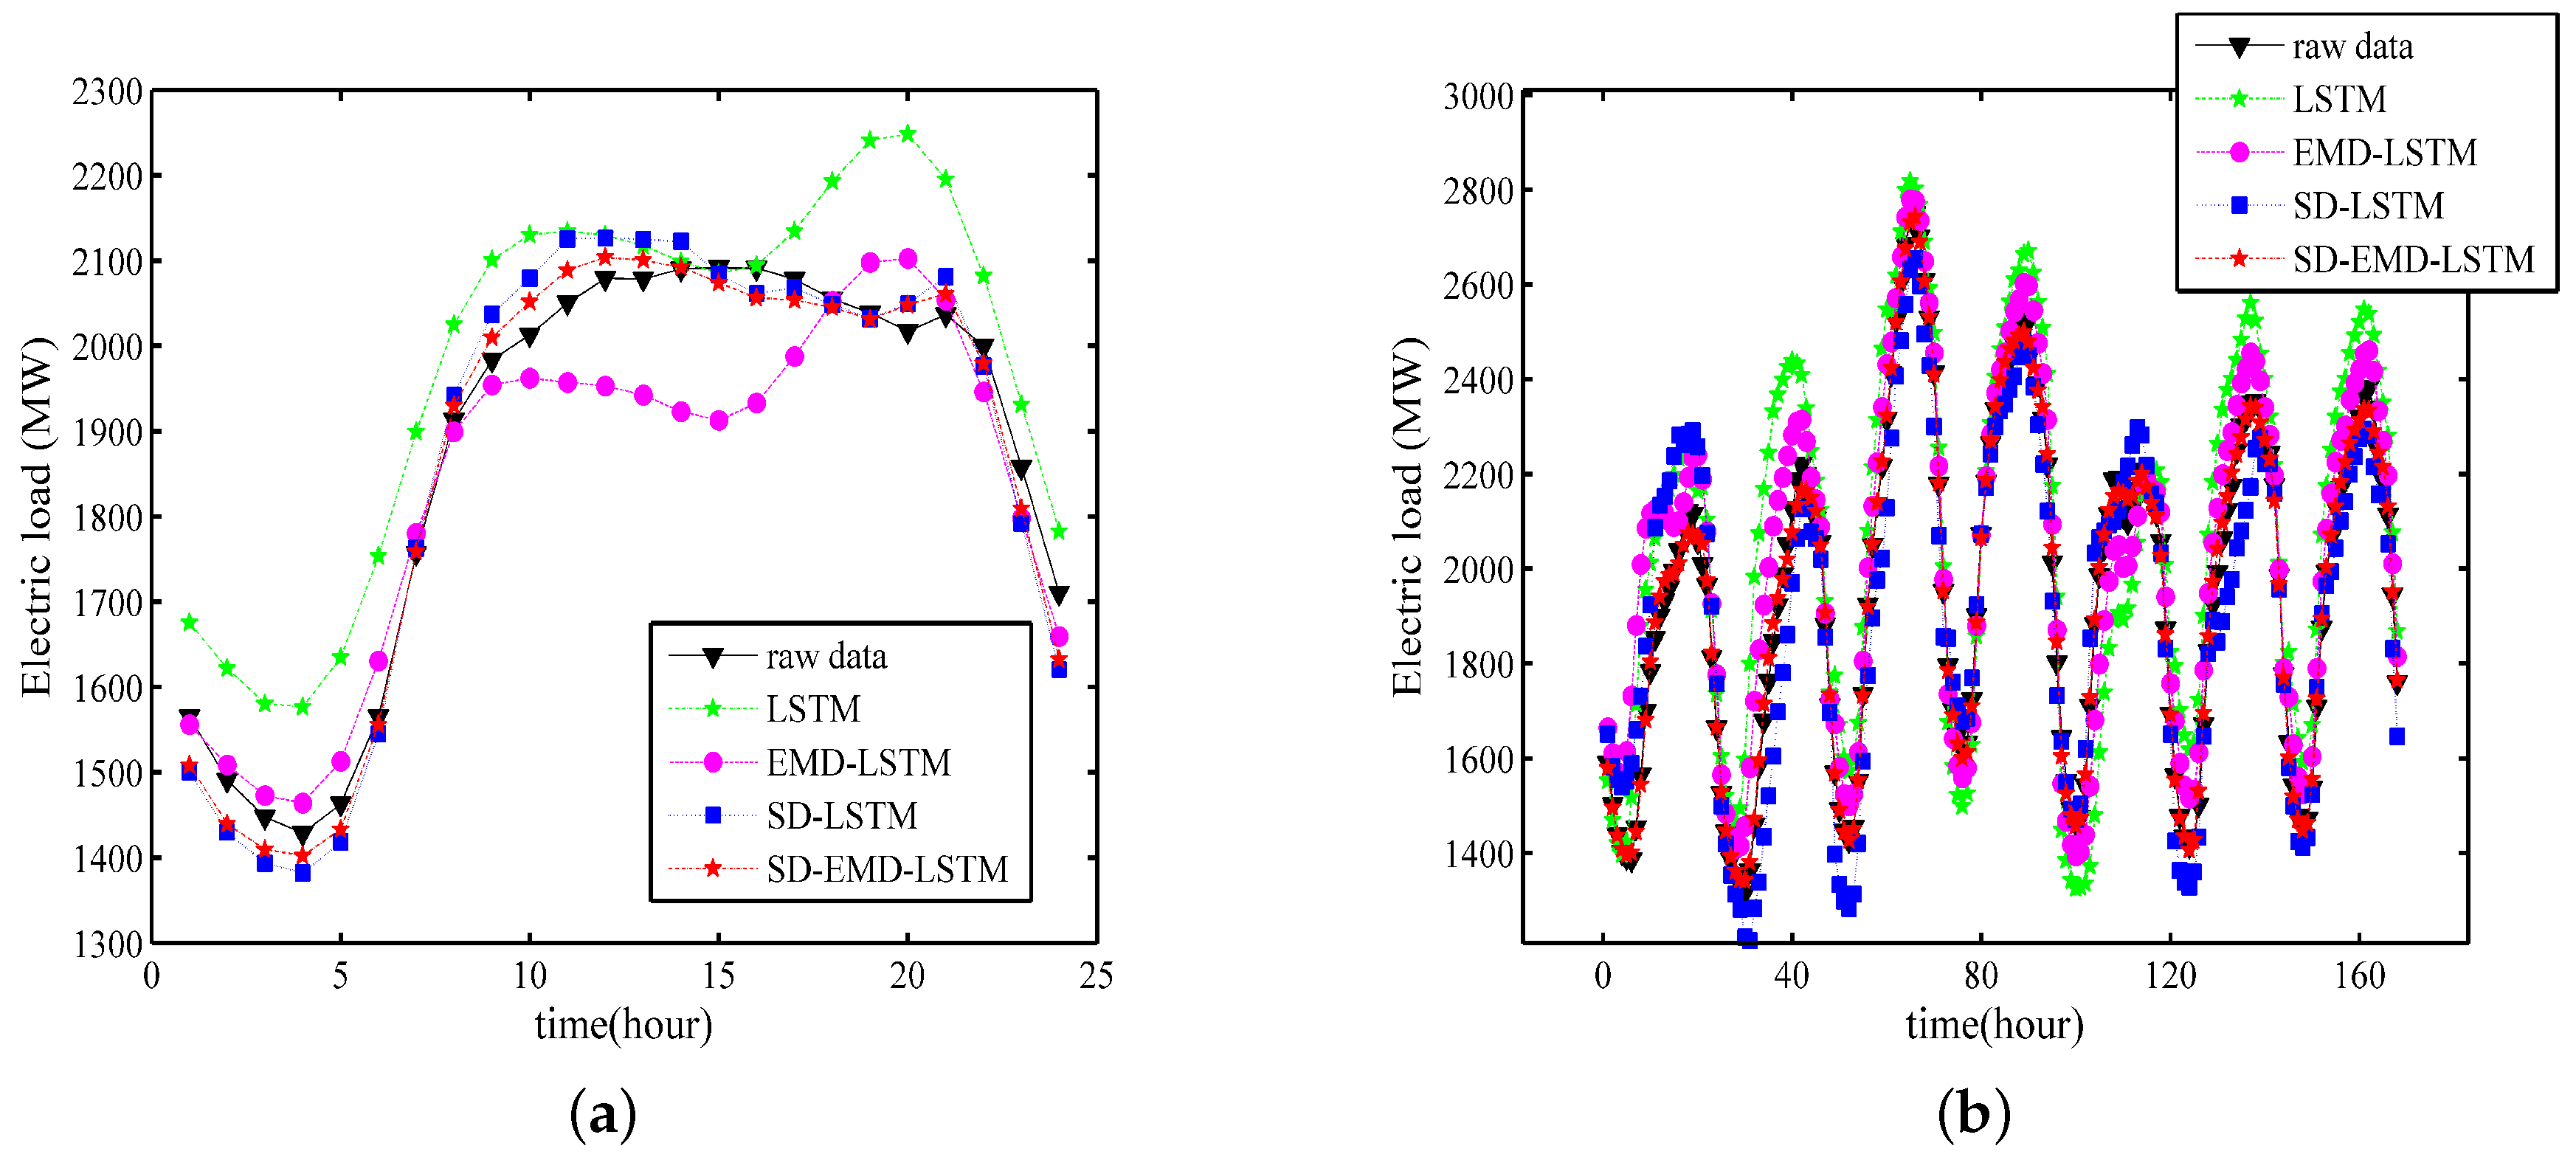
Example 3: This example compares the forecasting value of the proposed SD-EMD-LSTM model to the single LSTM, SD-LSTM, and EMD-LSTM models. The experiments have a forecasting horizon of h = 24 h and h = 168 h. The training period is from 2003 to 2014, and the prediction period is 2015.
Figure 14a,b show the one-day ahead and one-week ahead forecasting results of the single LSTM, SD-LSTM, EMD-LSTM, and proposed SD-EMD-LSTM models, respectively.
We can conclude from
Figure 14 that the forecasting curve of the proposed SD-EMD-LSTM model follows the raw data better than the other alternative models for the two forecasting horizon in Example 3. Evidently, comparing the LSTM curve with those of SD-LSTM and EMD-LSTM shows that the SD selection can generally enhances the accuracy of the load forecasting in the one-day-ahead and one-week-ahead forecasting. EMD can also effectively determine the general trend of the real time series.
Table 5 shows the MAPE values per month of all the models in Example 3. The last row of
Table 4 lists the average MAPE values for the experiment based on 12 months. The LSTM neural networks combined with the Xgboost-k-means-based SD selection method is better than the LSTM neural networks combined with the EMD model but is slightly inferior to the SD-EMD-LSTM model. The evaluation results of the MAPE indexes and prediction curves for the four models tend to be consistent.
Example 3 enables us to conclude the following points.
- (1)
The fitting effect of the hybrid model is evidently better than that of the single LSTM neural networks model in both time scales.
- (2)
The Xgboost-k-means method can effectively merge SDs into one cluster and prevent the LSTM neural networks from being trapped into a local optimum, thereby substantially improving the prediction accuracy.
- (3)
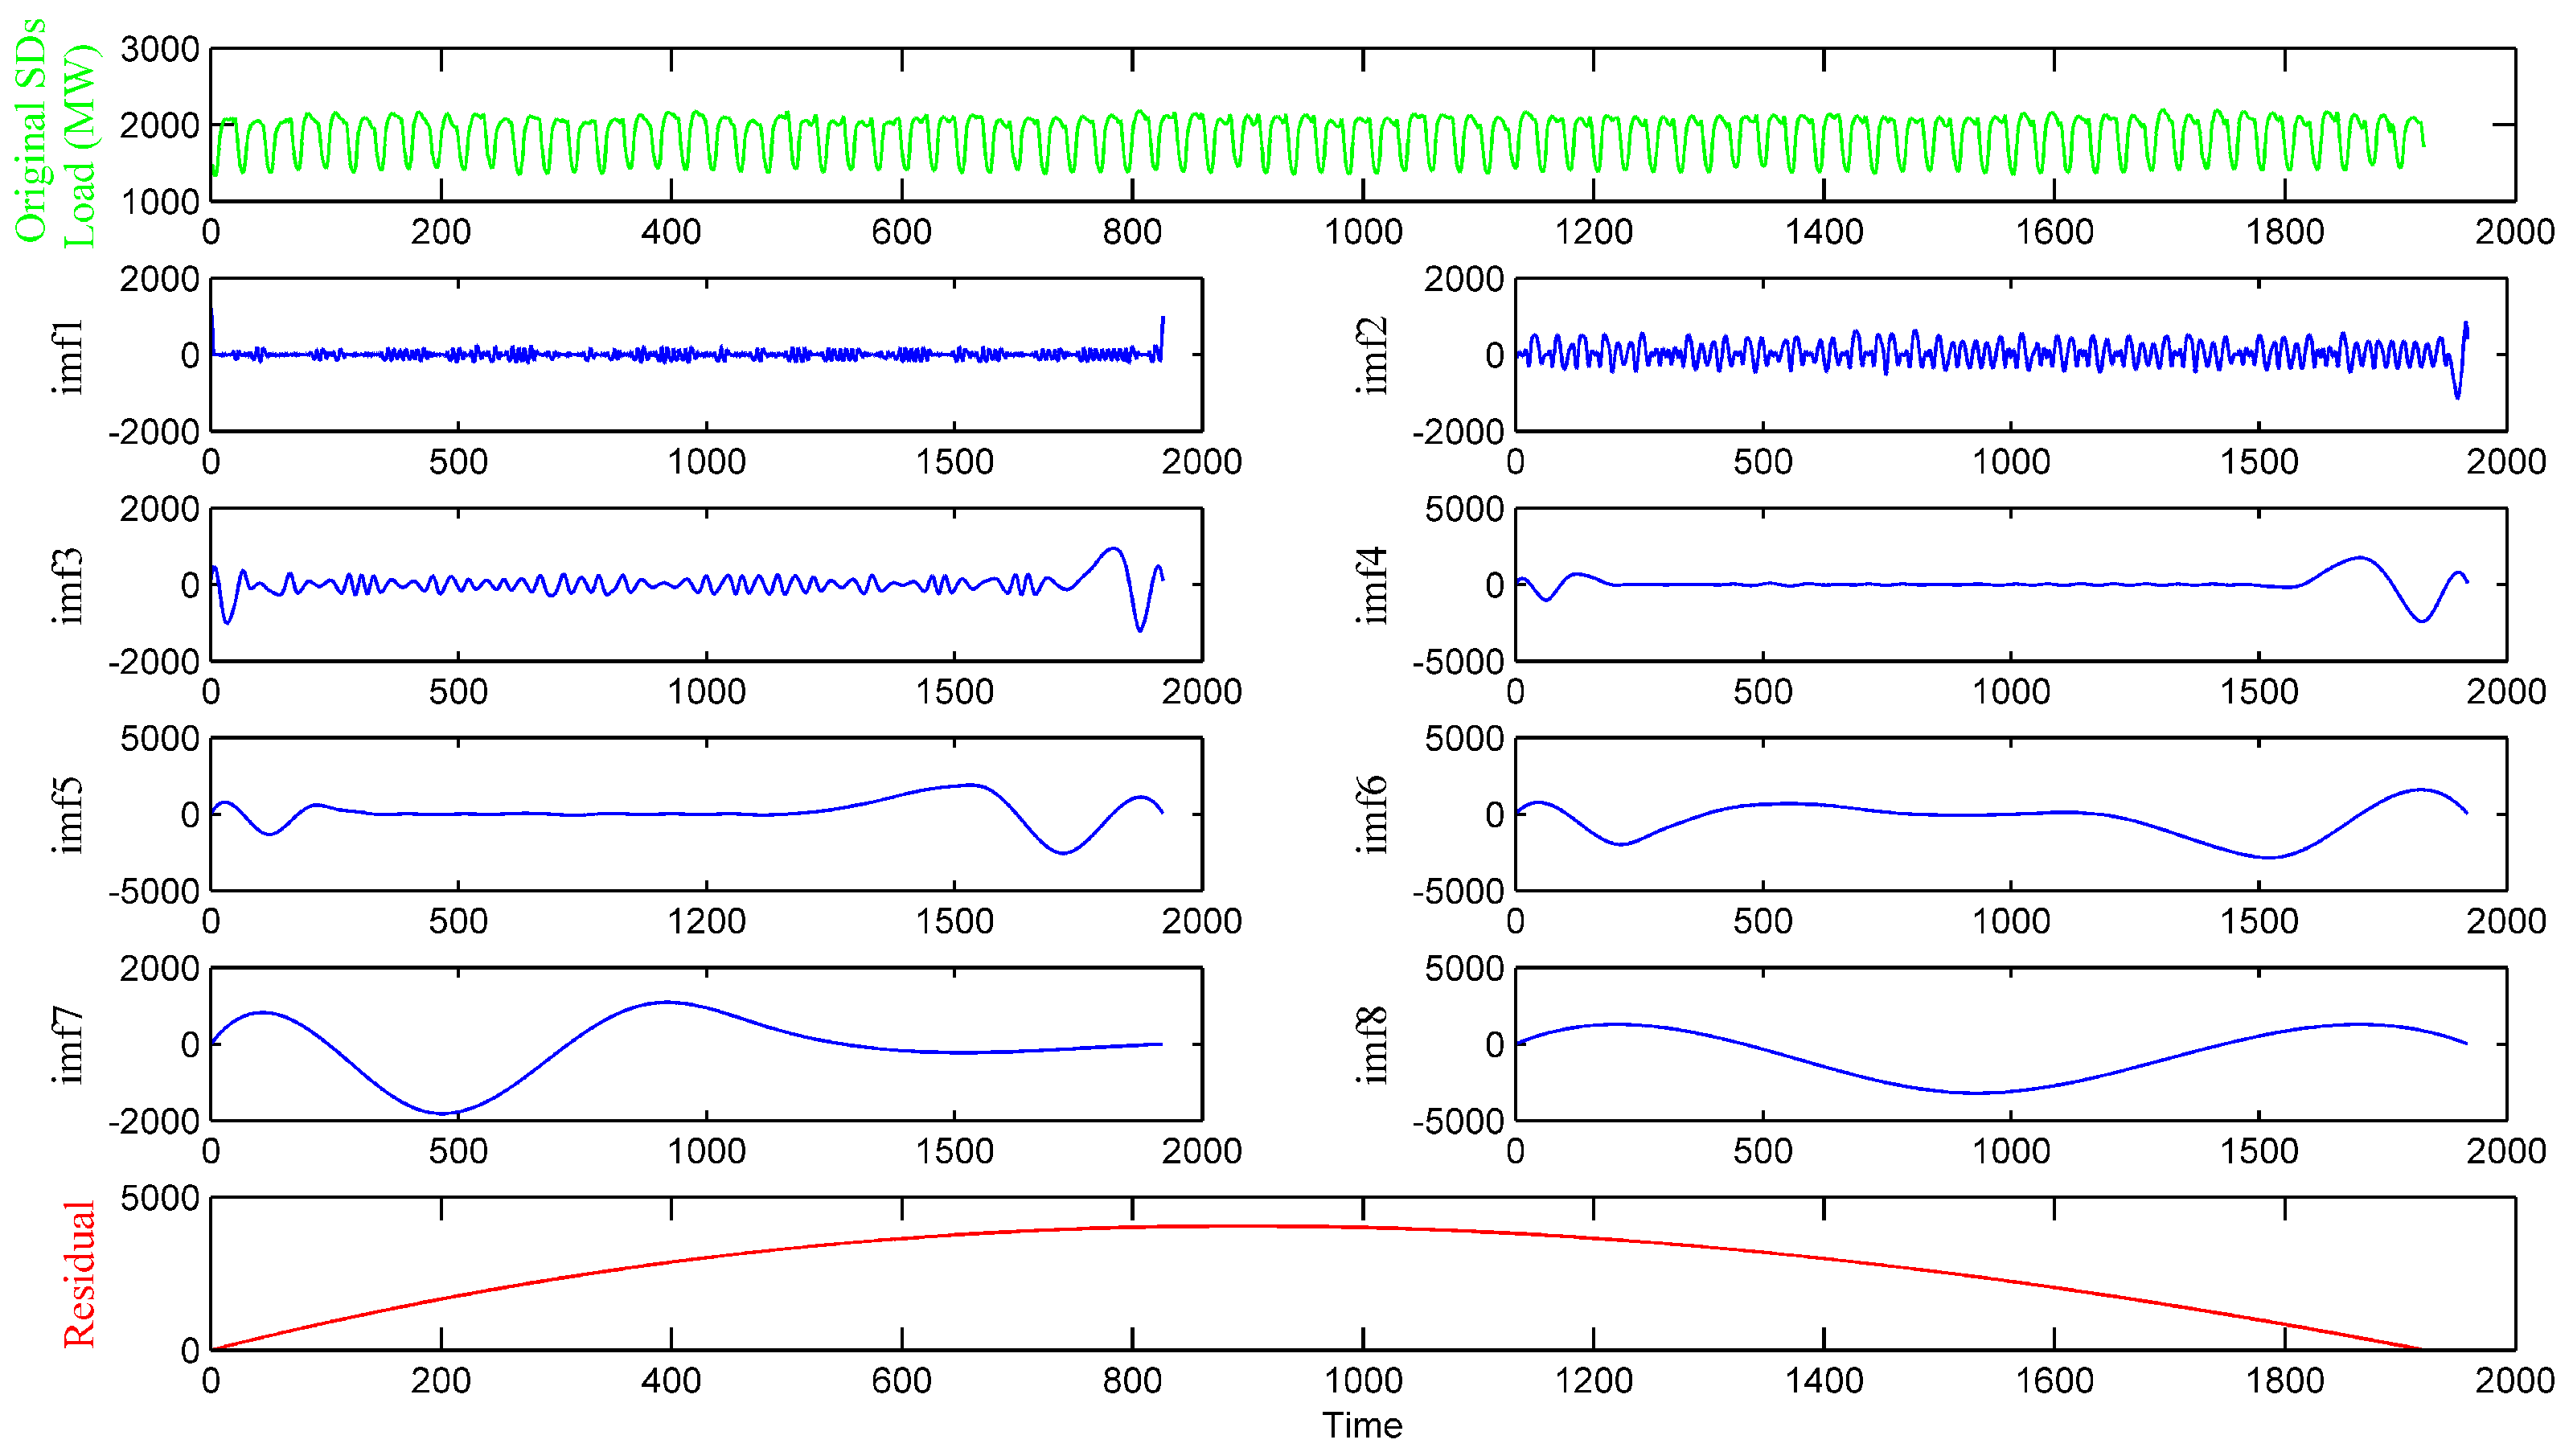
The data decomposition method divides the singular values into separated IMFs and determines the general trend of the real time series, thereby effectively improving the performance and robustness of the model.
In general, the SD-EMD-LSTM model significantly outperforms the three other methods and achieves a good prediction effect in STLF.
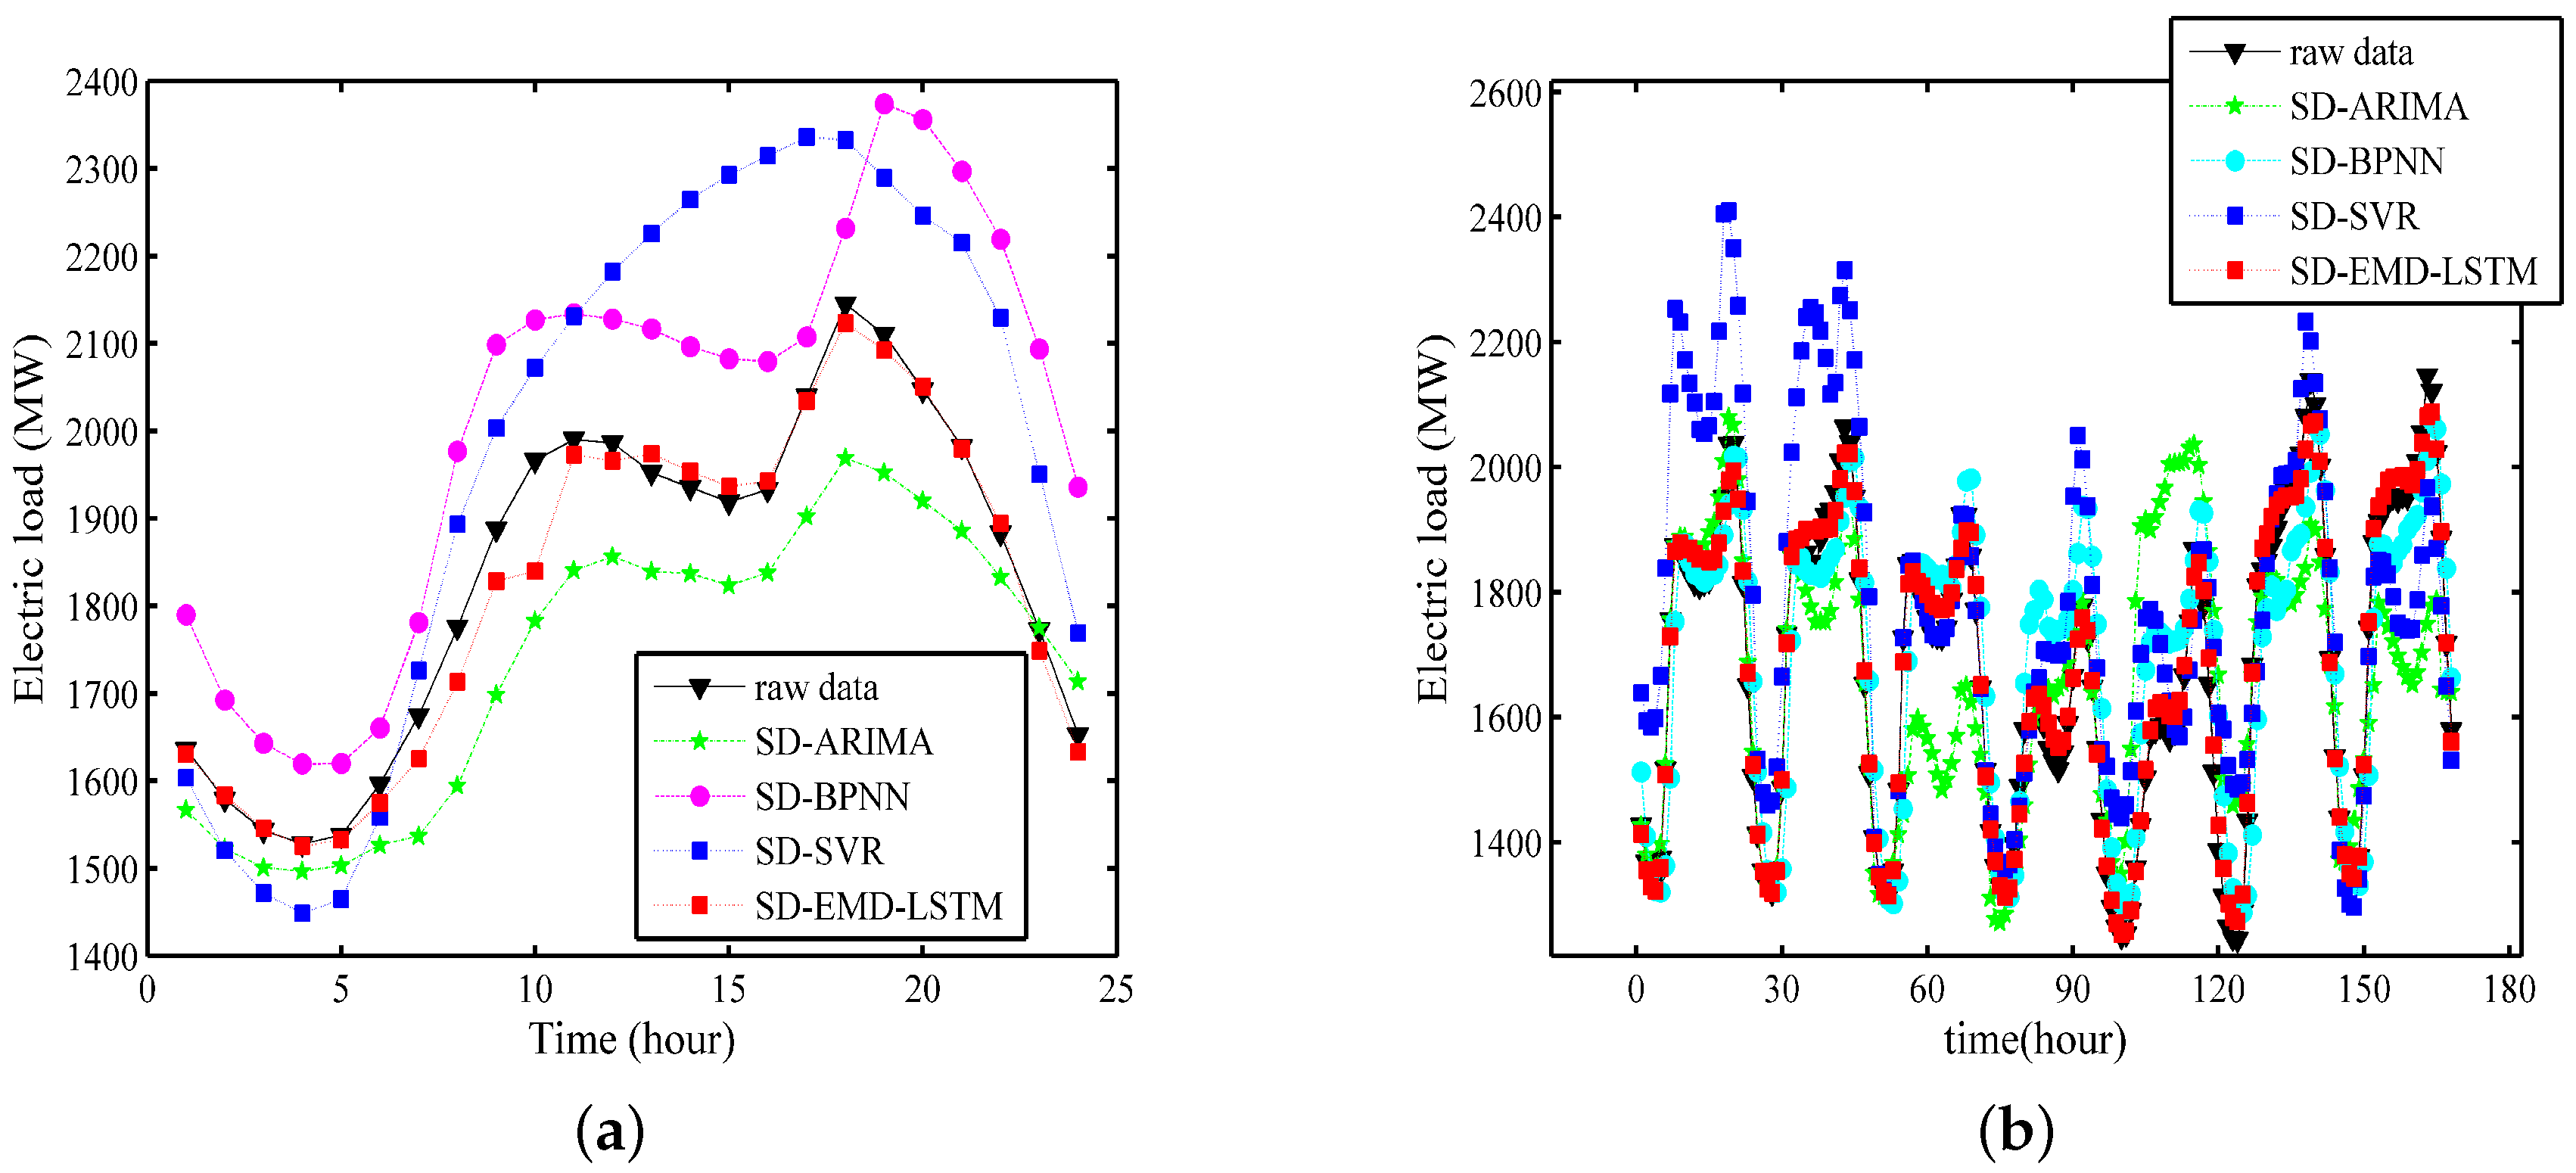
Example 4: This example compares the forecasting results of ARIMA, BPNN, SVR, and the proposed SD-EMD-LSTM model. For a fair comparison, we compare their performance with the same input data sets (i.e., SDs).
Figure 15a,b show the one-day ahead and one-week ahead forecasting results, respectively. The training period is from 2003 to 2013, and the prediction period is 2014.
Figure 15 shows that the forecasting curve of the proposed SD-EMD-LSTM model is closer to the raw load curve than the other alternative models in Example 4. The performance results of the three other methods are insufficient for STLF.
From the MAPE values in
Table 6, the experiment results indicate that the proposed model is significantly superior to the SVR, ARIMA, and BPNN models. MAPE of the SD-EMD-LSTM model is the lowest among all the models. Its prediction accuracy also reaches 98.96% and 98.44% in the 24-h-ahead and 168-h-ahead forecasting, respectively. ARIMA has the maximum MAPE value. Although the three other models determined the general trend of the raw data, their forecasting errors were extremely high.
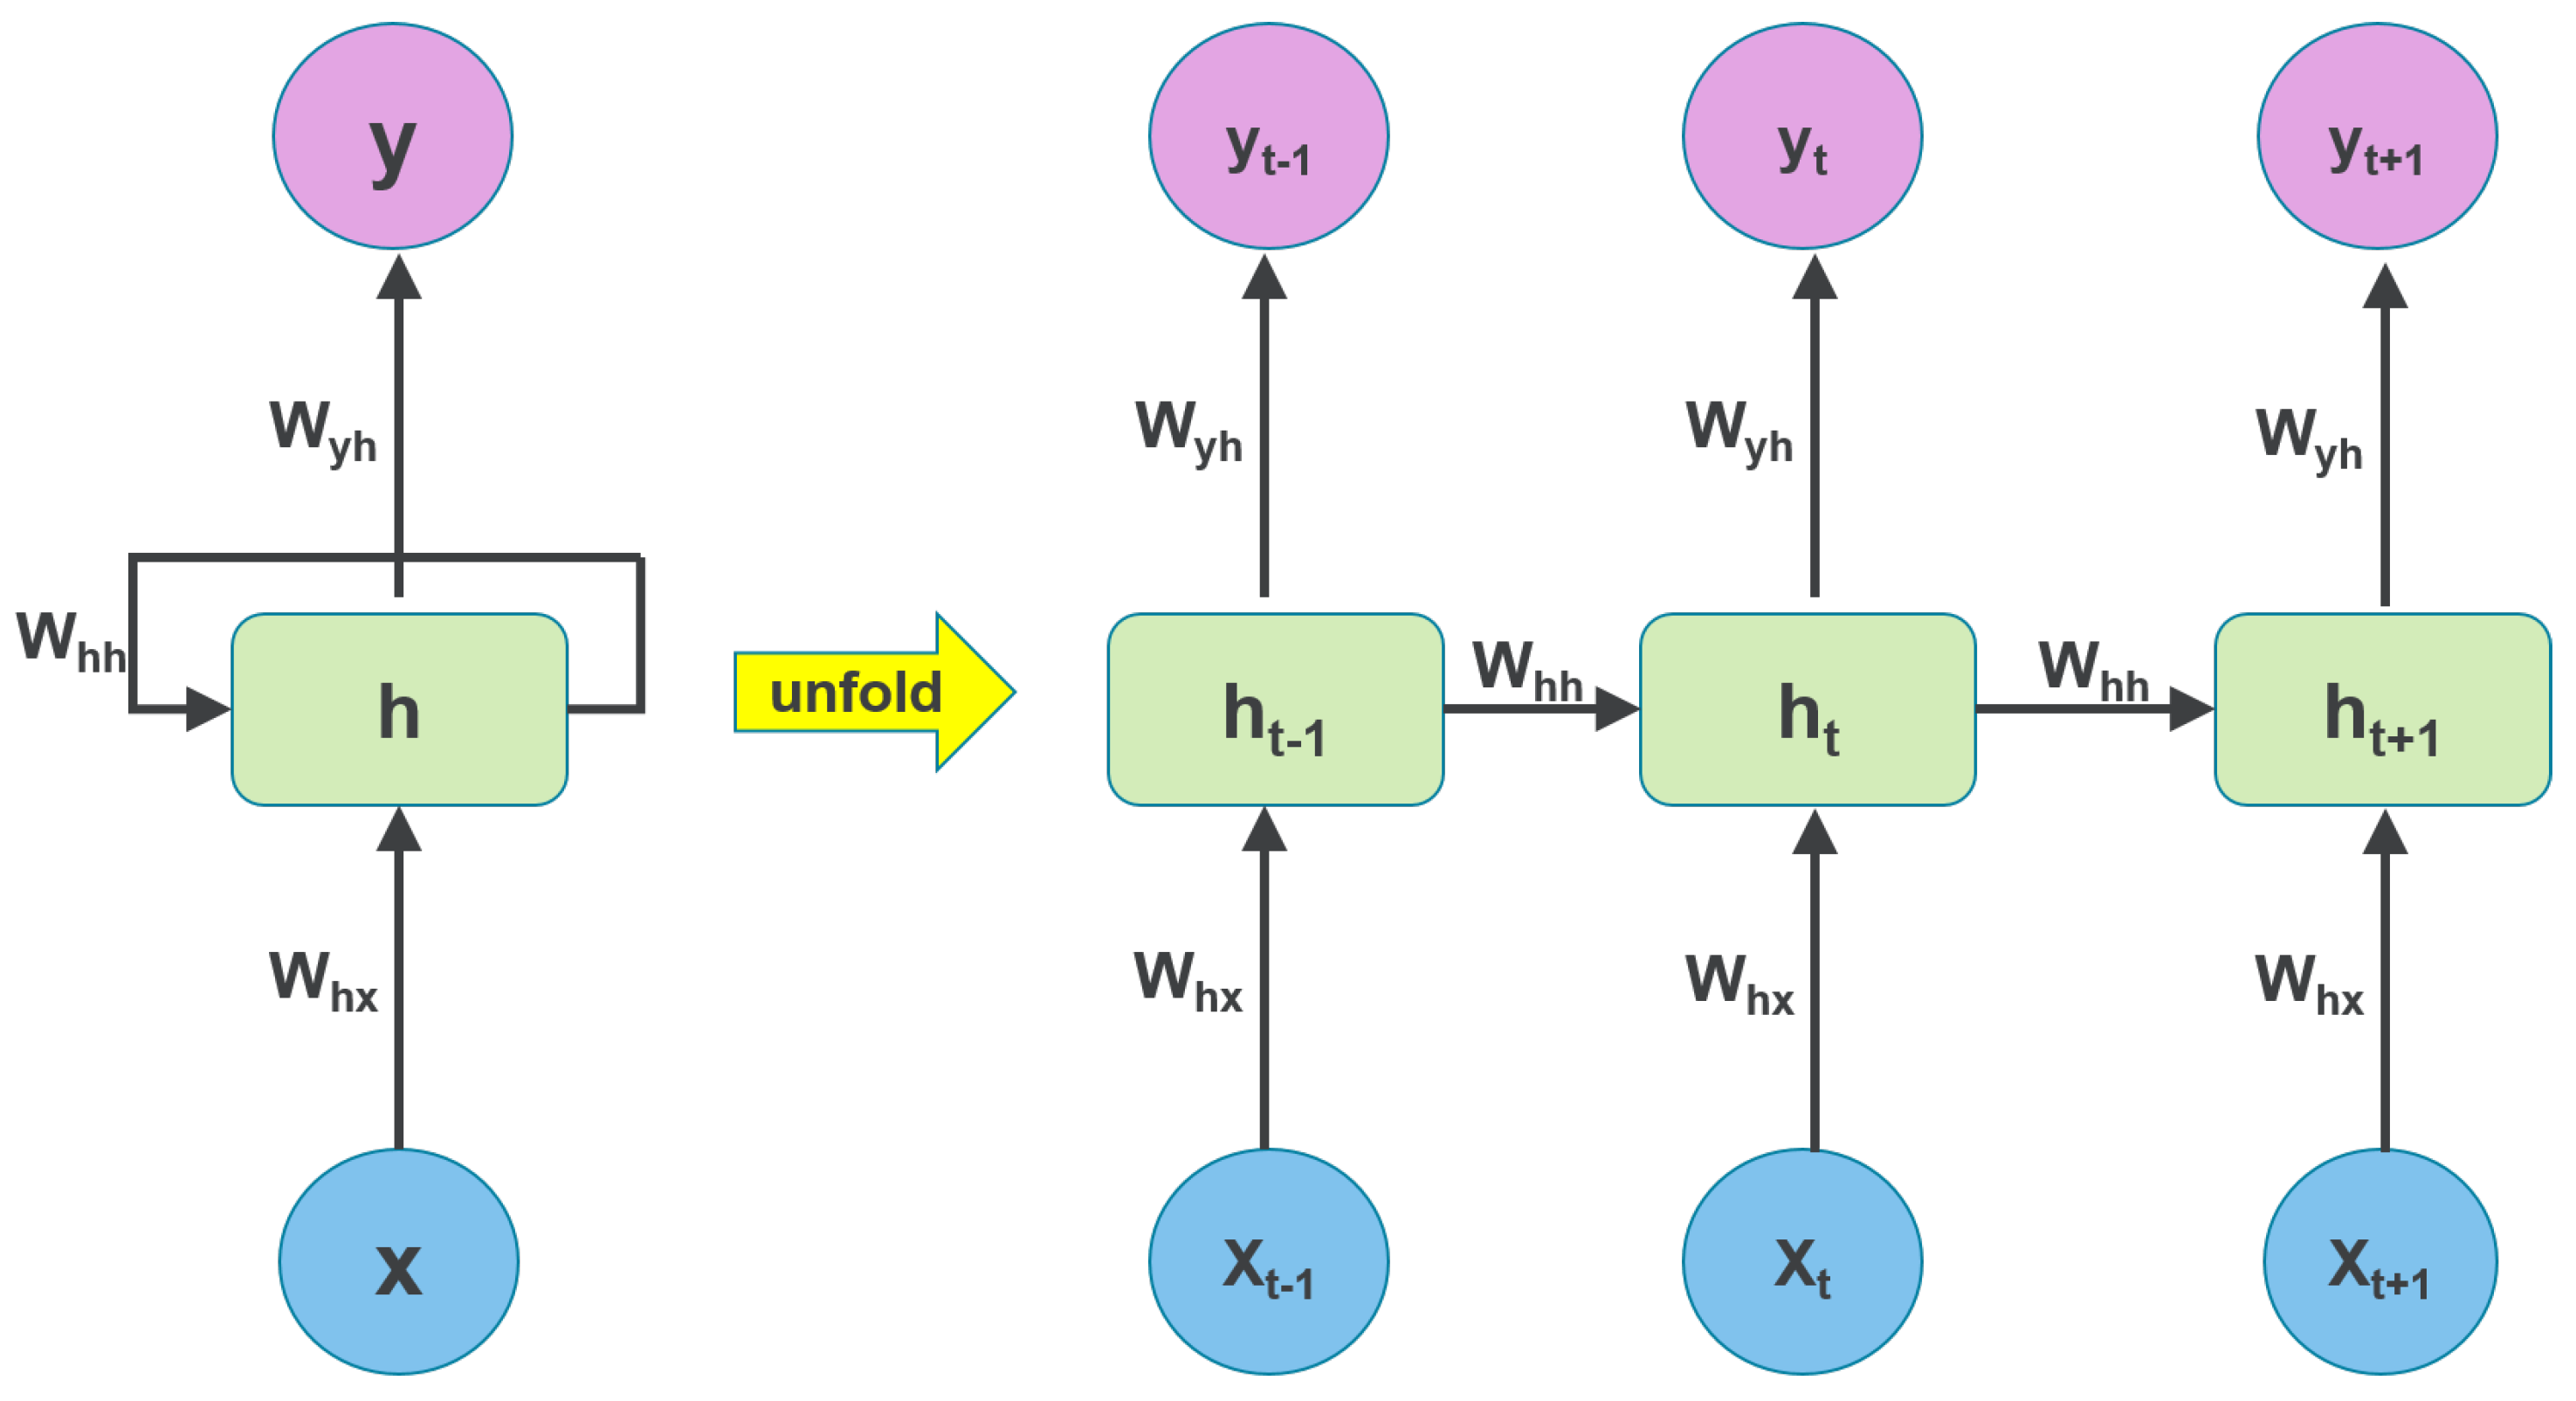
The comparison between the two different forecasting time scales demonstrate that the accuracy of the proposed hybrid model exhibit minimal changes because the LSTM neural networks can maximize the long-term dependencies in the electric load time series for substantially accurate forecasting. That is, the SD-EMD-LSTM model can perform longer-horizon load forecasting. Overall, the proposed hybrid model provides a powerful method that can outperform many other forecasting methods in the challenging STLF problem.


