
System-Level Value of a Gas Engine Power Plant in Electricity and Reserve Production


1
Department of Electrical Engineering and Automation, School of Electrical Engineering, Aalto University, FI-00076 AALTO Espoo, Finland
2
VTT Technical Research Centre of Finland, 02044 VTT Espoo, Finland
3
Wärtsilä, Energy Solutions, FI-00530 Helsinki, Finland
*
Author to whom correspondence should be addressed.
Energies 2017, 10(7), 983; https://doi.org/10.3390/en10070983
Submission received: 13 May 2017
/
Revised: 19 June 2017
/
Accepted: 4 July 2017
/
Published: 12 July 2017
Abstract
:Power systems require a certain amount of flexibility to meet varying demand and to be able to cope with unexpected events, and this requirement is expected to increase with the emergence of variable power generation. In this paper, we focus on gas engine power plant technology and the beneficial influence its flexible operation can have on a power system. The study introduces the concept of a combined-cycle gas engine power plant (CCGE), which comprises a combination of several gas-fired combustion engines and a steam turbine. The operation of CCGE is then comprehensively analyzed in electricity and reserve production in the South African power system and compared with combined-cycle gas turbine (CCGT) technology. Even though CCGE is a form of technology that has already been commercialized, it is rarely considered as a source of flexibility in the academic research. That is the notion providing the motivation for this study. Our core contribution is to show that the flexibility of CCGE can be valuable in power systems. The methodology is based on the unit-level model of the studied system and the solving of a day-ahead unit commitment problem for each day of the simulated 11-year period. The simulation studies reveal how a CCGE is able to offer system flexibility to follow hourly load variations and capacity to provide reserve power effectively.
1. Introduction
Flexibility is a central feature in power systems. It describes the capability of a system to follow the variations in electricity demand and its ability to respond to possible uncertainties, such as faults. A major share of the flexibility is conventionally provided by different generation units, which can adjust their output power and start up or shut down if needed. However, the installation of variable power generation, such as through wind power and photovoltaics (PVs), is likely to increase the requirement for flexibility. This may pose challenges to existing thermal power plants that are not designed for cycling operation with increased variability. More frequent ramping and starting causes wear and tear on the plants, leading to higher maintenance costs [1]. The cycling is also likely to increase the emissions of the cycling plants, while their part-loading decreases the plant efficiency in general [2]. Furthermore, as discussed in [1], the planning of maintenance breaks becomes more difficult with high wind penetration because the breaks can no longer be scheduled based on predictable low demand periods.
Several strategies to increase the power system flexibility have been proposed, including improvements in the thermal power plants [3] and the installation of energy storage [4], to name a few. The potential of engine power plants as a source of power system level flexibility is rarely considered in the literature. Typical articles consider engines as a form of small-scale distributed generation, generating electricity and possibly also providing heat [5,6,7]. In this kind of application, the flexibility of the generation can be improved by decoupling electricity and heat production with thermal storage [6]. The flexibility of gas engines to assist in wind power integration is considered in [8] but also in this case, the engines are utilized in distributed co-generation. Brouwer et al. [9] reviewed several intermittent renewable generation integration studies. They concluded that among several other flexible technologies, gas engine peaking plants should also be considered, as they add power system flexibility and they can be economical.
This study is motivated by the fact that there is clearly a lack of literature considering the flexibility a modern, large-scale, engine power plant is able to offer. Engines allow efficient part-load operation and they start-up within 5 to 15 min, faster than most other generation technologies [10]. An engine power plant comprises multiple engines that can be flexibly controlled, while the efficiency of the plant is optimized and a minimum generation level of a single engine is achieved. The waste heat of the engines can further be utilized to produce steam for a steam turbine, which increases the plant’s electricity output and efficiency [11]. In general, the operational features of an engine power plant seem to offer an attractive source of power system flexibility, which could ease the problems caused by the cycling of thermal generation.
In this paper, we firstly discuss about the concept of an electricity generating gas engine power plant with the capability for combined-cycle operation (CCGE). Secondly, its flexibility and system level value in electricity and reserve production is investigated in the South African power system. Our core contribution is to show that the flexibility of the studied technology can be beneficial in power systems. By flexibility, we mean the ability to follow net load (load minus variable generation) variations and to provide reserves for the maintenance of system frequency. The main focus in the present study is on the operational expenses (OPEX), whereas the capital expenses are not considered. This exclusion is considered to be justifiable as long as we aim at understanding the system-level value of the plant’s flexibility, with the value being the decrease in the operation cost of the studied system. With that target in mind, the study employs a techno-economic model of the investigated power system with each of the conventional generation units represented (renewable generation modeled as time series). The model is simulated with one-hour resolution over several years in order to accommodate different system conditions in the results. The simulations comprise scenarios with and without CCGE and the combined-cycle gas turbine (CCGT) to allow us to compare them and analyze their influence on the cost of electricity generation and reserve production. However, the authors wish to emphasize that the purpose of the comparison is not to claim that one of these technologies outperforms the other, as the system under consideration strongly affects the technology choices and the results are sensitive to the used technical parameters of the generation units. The comparison is rather to show that the flexibility of CCGE has value even though CCGE has a lower efficiency compared to CCGT, a more commonly utilized form of gas-fired technology.
There are two main reasons why the South African power system is a potential system for a CCGE. Firstly, a major share of the electricity demand is supplied by coal-fired generation, for which the generation costs are low but which is quite inflexible. The base load capacity is also expected to increase along with the number of installed nuclear power plants in the future. Secondly, the amount of generation to follow daily load and variable power generation variations is low. Currently, this capacity mainly consists of hydro and diesel-fired generation. As the generation mix of the system will likely change in the near future, the simulations are performed over a period of several years by considering the expected future power plants. This enables us to assess the value of the flexibility under different system conditions. In the beginning of the simulation period, the system has a rather low capacity margin (the available generation capacity exceeding the expected peak demand), while it increases towards the end of the period. The capacity margin has a high influence on the use of combined cycle power plants.
The rest of this paper is organized as follows. In Section 2, the concept of the gas engine power plant is introduced in more detail. Section 3 introduces the South African power system, explains the modeling procedure, and summarizes the studied cases. The simulation results are presented in Section 4 and conclusions are written in Section 5.
2. Gas Engine Power Plant
2.1. Engines and Plant Concept
Engines support a wide range of applications in power generation from small residential co-generation [12] to larger industrial and national grid power supply [13,14]. Due to the wide range of applications, the rated electrical output for a generator driven by an engine can vary, for example, from 5 kW to 18 MW. Different engines are also able to operate with various fuels, such as diesel, heavy fuel oil, and natural gas [11]. Here, we will focus on gas-fired engine power plants generating only electricity.
A typical electricity generating engine power plant comprises multiple prime mover generator sets and a possible steam turbine to exploit waste heat and increase electricity output. As a prime mover, different gas engine technologies can be employed. Typically, they are divided into spark ignition and dual fuel engines [11]. The net electrical efficiency of an engine can reach approximately 40–48% [10]. In the case of a CCGE, the combined cycle operation is able to increase the plant’s efficiency by 3–4% and the electricity output by 8–10% [15,16,17]. The actual electricity generation capacity of a plant depends mainly on the installed number of prime movers and is thus scalable.
2.2. Operation
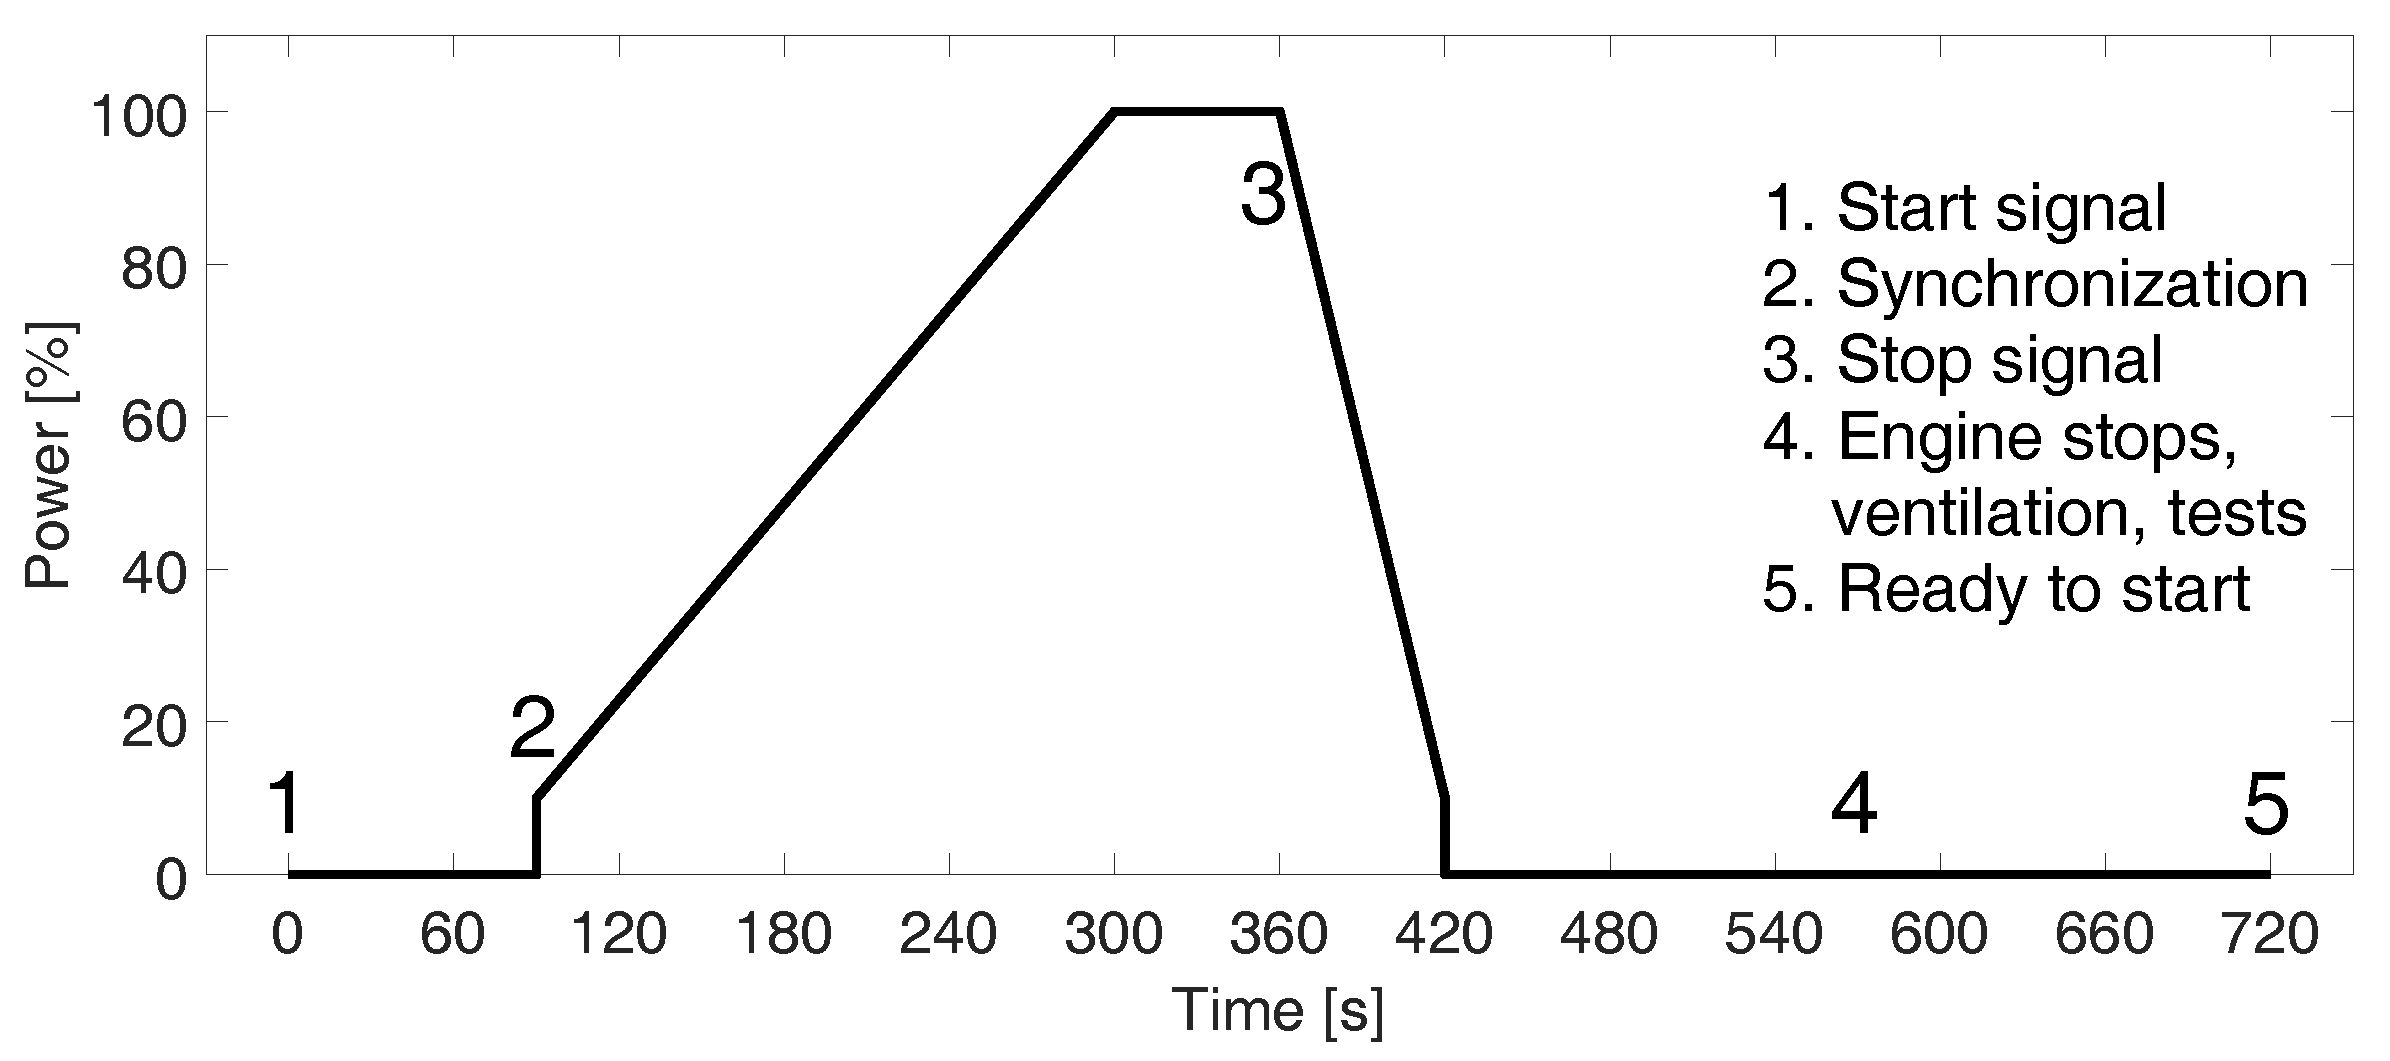
An engine power plant offers notable operational advantages, which originate either from the prime mover technology or from the structure of the plant. Operational features linked to a gas engine are fast start-ups, with the possibility of partial loading and fuel switching during operation [10]. The operation of a preheated engine during one on/off-cycle is illustrated in Figure 1, which is based on the reported performance in [17]. As seen in the figure, the engine is able to reach maximum generation within 5 min during start-up. After a 1-min shut-down, it is ready for restart in 5 min.
The structure of an engine power plant offers significant freedom to control the plant’s generation. As a plant consists of multiple engines, the generation of the plant is controlled by ramping single engines or switching them on and off [17,18]. Therefore, the whole plant provides high operational ramp rates, fast start-ups and shut-downs, and low minimum generation level. Furthermore, the partial load efficiency of the plant can be optimized. If the plant also comprises a steam turbine, the flexibility of the plant is not significantly reduced, as operation is possible in single and combined cycle modes. However, starting the turbine requires tens of minutes but it generates only a small part of the total electricity output [16].
2.3. Applicability to Frequency Control
Frequency control is a crucial function in power system operation, ensuring balance between electricity consumption and generation at the moment of delivery. The process of frequency maintenance and the activated reserves can be divided into primary, secondary, and tertiary controls and reserves, although names and technical requirements vary from system to system [19]. According to [14,17], gas engine power plants have shown potential to provide primary and secondary controlled reserves, which have the strictest technical requirements. The latter reserve type is particularly interesting because of the requirements. Typically, the resources need to respond within 10–30 s and to be fully activated within 15 min [19]. This is to say that the engines are able to produce secondary controlled upward reserve without being on and synchronized if slightly longer response time is allowed. We investigate this possibility and its influence on the system operation cost in the simulations.
3. Methodology
3.1. South African Power System
The system level value of CCGE is investigated by employing the South African power system as an example. The modeling of the system is based on the integrated resource plan (IRP), an official plan governing the development of South African electricity generation capacity during a timespan of 2010–2030 [20]. Here, we focus on the last half of the time period, 2020–2030, and modify the part of the gas-fired generation to fit our study. A period of several years is selected as it allows the simulations to capture different system conditions in the results. For example, the capacity margin of the system varies from year to year and has a high influence on the use of combined cycle power plants for electricity and reserve production.
The electricity generation of the system currently relies strongly on thermal power generation, particularly on coal power plants, which cover approximately 80% of the total generation capacity [20]. In addition to coal, electricity demand is mainly supplied by a nuclear power plant, gas turbines, and hydro, but their share is remarkably lower [21]. The gas turbines (open-cycle gas turbines, OCGTs) are used as peaking units and they are fueled by diesel [22]. According to the IRP, coal-fired generation will also have a major role in the future, but new nuclear and hydro generation installations, as well as OCGTs, PVs, wind power, and gas-fired generation installations are planned during the studied time period. At the beginning of the period, the installed generation capacity is roughly 66 GW and it is expected to grow to 90 GW by 2030, whereas the peak demand is 53 GW in 2020 and 68 GW in 2030. The generation capacity in South Africa is mostly owned and operated by Eskom, a state-owned utility, who is also responsible for operating the transmission system [23]. The system is practically vertically integrated and lacks a competitive electricity market structure. However, the state has recently started to implement processes to encourage the participation of independent power producers (IPPs) in power generation [23].
3.2. Modeling the System
The methodology to investigate the influence of gas engine power plants is based on the simulation of the studied power system. This is to say, the generating units of the system are first represented by their technical and economical parameters, after which the operation of the system is optimized to commit the best generation mix to supply the demand. The model is implemented and simulated using the commercial software PLEXOS, which is a rather popular modeling tool in system-level techno-economic studies [24,25,26]. The software allows us to build a unit level model of the system and run a daily unit commitment to co-optimize electricity and reserve production. Such an approach is well-suited in modeling the South African system, where a somewhat similar day-ahead co-optimization is utilized to minimize the cost of supplying the daily electricity demand and reserves [27].
In the present study, the objective of the day-ahead unit commitment is to minimize the sum of generators’ fuel costs, start-up costs, variable operation and maintenance (VO&M) costs, ramping costs, emission costs, and the cost of load curtailment. The objective is minimized subject to system-level constraints (supply–demand balance, requirements for upward and downward reserves) and power plant technical constraints. A model of a single generation unit consists of the following characteristics: minimum and maximum generation (Min and Max Gen) levels, heat rate curves, as well as the aforementioned cost components. The key data assumptions regarding the thermal power generation mix are presented in Table 1. If the fleet contains units with different technical parameters, the table shows a value interval. It is assumed that technical and cost parameters remain constant over the simulation period and only the number of units is varied. Furthermore, we assume that most of the new coal generation utilizes circulating fluidized bed (CFB) technology. One can find the full picture of the simulated generation capacity and its development in Figure 2a in Section 4.1.
Time series for the modeling of electricity demand, hydro (run-of-river) and wind power, and PV are obtained from Eskom. The series are scaled up based on the new installed capacity and peak demand reported in the IRP. Network constraints and interconnections are not considered in the simulation model but imported hydro generation is modeled as a fixed time series. Neglecting the interconnections is reasonable as their role is minor in practice. There is also a minor share of other production types, such as industrial generation, that are modeled as constant base load or intermediate generation and referred to as “embedded” from now on.
The unit commitment problem is assumed to be deterministic, i.e., all the uncertainty associated with a day-ahead optimization of a power system is neglected. The deterministic approach provides information on the utilization of flexibility for daily net load following as well as on the provision of reserve capacity. However, the authors recognize the fact that the inclusion of the uncertainties would offer deeper insight to the use of flexibility, particularly during sub-hourly operation. The unit commitment problem is solved for each day of the simulation period using one-hour resolution and six-day look-ahead with 4-h resolution, which is required to allow the scheduling of pump storage (PS). Before the actual day-by-day simulation, PLEXOS optimizes the annual maintenance schedules for power plants. In addition to the maintenance breaks, forced outages for power plants are defined so that the simulations are run with randomized outages, which are then saved and used as an input in each case. The maintenance breaks and forced outages included as the system conditions are rather tight at the beginning of the simulation period and the availability of the coal power plant fleet is less than 80% [20]. The value of 73% is used.
Since the system may not have sufficient generation capacity available to supply the demand at all times, load curtailment, or demand response (DR) back up, is allowed but at a rather high price. Thus, DR back-up is modeled to be the last action taken to ensure supply-demand balance as well as the feasibility of the optimization problem. From the simulation output, its actual cost is calculated using a price of $150/MWh [28]. The currency is assumed to be US dollars.
3.3. Modeling of Combined-Cycle Generation
As stated in the IRP, CCGT capacity will be installed in the system during the timespan from 2020 to 2030. In order to simplify the analysis, we assume that 3 GW of either CCGT or CCGE generation capacity is installed to the system in 2020 and that the amount remains constant. These technologies are characterized in the model as described in Section 3.2 and Table 1. It would be important to investigate sensitivities on fuel prices and combined cycle power plant characteristics, but due to the required modeling efforts this remains as future work. In this study, the selected CCGT characteristics represent plant technology, of which capital expenditures are comparable with the studied CCGE technology.
The gas engine power plants with a steam turbine are approximately modeled by 150 engines, each with a rated power of 20 MW that includes the effect of a steam turbine (8–10%). For example, this is to say that there are engines with rated power of 18 MW and several steam turbines providing the additional 2-MW output per engine. Summarizing, in the optimization model, the 3 GW of CCGE capacity is modeled by the 150 engines, each having a maximum generation level of 20 MW. The optimization model considers each engine as they were individual power plants in the generation mix of the simulated system. That is, they are handled by PLEXOS as with the rest of the generation units. A model of a single unit consists of the minimum and maximum generation levels, heat rate curves, and its cost components. The employed model is assumed to be sufficiently accurate for the present study, considering the amount of gas-fired generation in the system, the influence of a steam turbine, and the 1-h simulation time step. Similarly, the 3 GW of CCGT capacity is modeled as 12 generation units for which the data is given in Table 1.
3.4. Reserves
In the South African power system, the system frequency is managed by several separate reserves, such as instantaneous, regulating, and 10-min reserves [29]. The instantaneous reserve is the one stabilizing the frequency after a contingency and it should be fully available within 10 s. After the activation of this reserve, the regulating reserves are utilized to restore the frequency. They start to respond within 10 s and are fully activated within 10 min. The next reserve type to react is the 10-min reserve, which further releases the instantaneous and regulating reserves. In our model, only the first two reserve types are considered. The 10-min reserves could be provided mostly by non-spinning diesel-fired generation capacity so its influence on the simulation results would presumably be negligible. The power plants are required to provide 650 MW of the instantaneous reserve upwards and 575 MW of the regulating down-reserve, whereas the regulating up-reserve increases from 575 MW to 1500 MW during the simulated time period. The aforementioned numbers are mean values as the reserve requirements for summer and winter differ slightly. Apart from the future increase, the values are based on the estimated technical requirements in 2020 [29]. The future increase in the amount of regulating reserve is assumed because of the fact that the variable renewable generation nearly triples and consumption increases by 28% during the simulation period.
In the model, the reserves are provided by online units purely based on economic criteria, i.e., the optimization reserves a proportion of unit’s generation capacity so that the most economical units from the viewpoint of the system are partially loaded. The activation of reserves is not considered in the simulations, except if the cost of generating electricity rises high. This is to say, the reserves are activated before using the DR back-up.
As we argued earlier, an engine power plant could provide secondary, or regulating, reserve from the offline state owing to its rapid start-up. The engines are able to synchronize within 90 s and to provide maximum output within 5 min, as a result of which they nearly fulfill the requirements of the upward regulating reserves in the South African power system. The simulations compare the situations where CCGEs are allowed to provide the reserve either from online or offline (spinning or non-spinning).
3.5. Summary of the Studied Cases
With the simulations, we aim to analyze two main aspects: CCGE’s influence on the system and the flexibility of the technology, i.e., its performance in reserve provision and cycling in typical daily operation. Therefore, the simulations are selected to include cases with and without reserve provision to allow the assessment and comparison of CCGE’s benefit and operation in both situations. The simulations also comprise cases with CCGTs. All the studied cases are listed in the following:
- No gas: This is the base case, including all the power plants except the gas-fired generation.
- TURB: 3 GW of CCGTs participating only in electricity generation are added to the system.
- TURB + SPIN: As for TURB, but CCGTs are also allowed to provide reserve capacity.
- ENG: 3 GW of CCGEs participating only in electricity generation are added to the system instead of CCGTs.
- ENG + SPIN: As for ENG but CCGEs are also allowed to provide reserve capacity.
- ENG + NSPIN: As for ENG + SPIN but CCGEs are also allowed to provide regulating up- reserve capacity without being online. This case is used to analyze the benefit of the rapid start-up of gas engines.
4. Results
4.1. Operation Overview
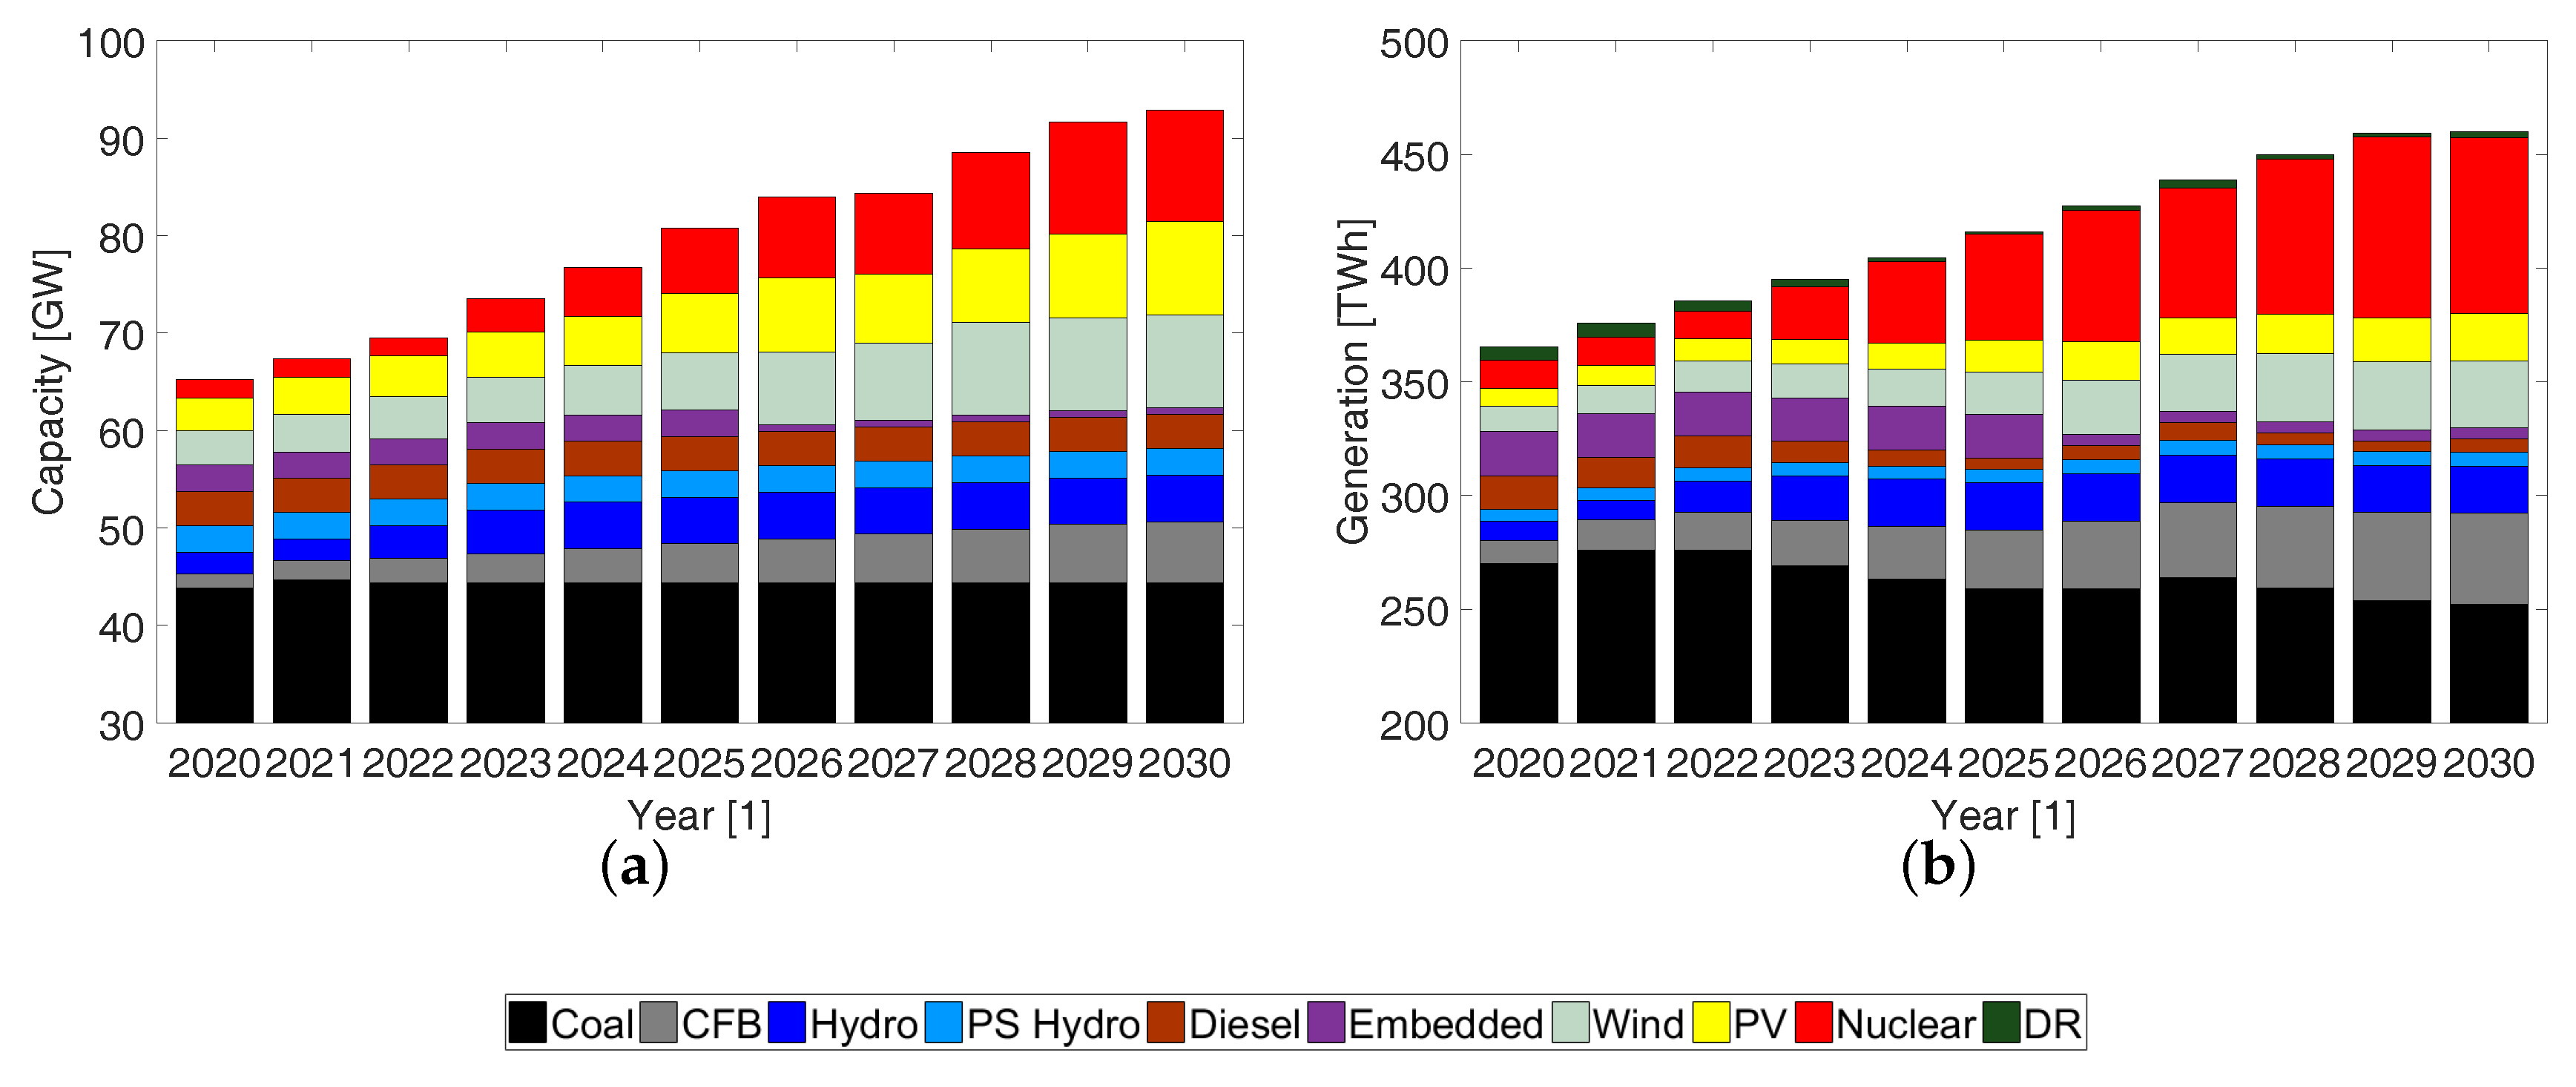
Installed generation capacity and yearly generation, including the use of DR back-up, are illustrated for the no gas case in Figure 2. As seen in Figure 2a, the new installed capacity is from mainly nuclear, wind, and PV sources, for which the respective capacities increase over the simulation period. These technologies (in particular nuclear technology), are also supplying the growing electricity demand, as shown in Figure 2b. While new capacity is installed, the requirements for DR back-up and the utilization of diesel power plants and conventional coal decrease.
When the gas-fired generation is installed, it replaces the generation of diesel and coal power plants as well as reducing the need for load curtailment. The effects of CCGE and CCGT on the generation of other technologies are presented in more detail in Table 2, which shows changes in technologies’ capacity factors compared to the no gas case. Only impacts are reported. As can be seen, CCGTs reduce slightly more coal-fired generation and CCGEs more diesel and DR back-up. The reduction is smaller in general when the gas-fired generation is able to produce reserves. The changes in the capacity factor of the DR back-up indicate that approximately 70% less is required compared to the no gas case, while the change in the diesel’s capacity factor means the utilization has roughly halved.
CCGE generation itself has an average capacity factor of 39.5% in the ENG case but it is reduced to 32.4% when spinning reserves are allowed and to 30.9% when non-spinning reserves are allowed. For CCGTs, the numbers are 38.9% and 37% in the TURB and TURB + SPIN cases, respectively. Furthermore, due to the changes in the generation mix during the studied decade, the gas-fired power plants act more as mid-merit power generation (capacity factor 49–61%) at the beginning of the period, whereas the installation of new generation capacity reduces their capacity factor to 17–25% in 2025 and 2029, i.e., the gas-fired plants act more as peaking power plants. On the other hand, the low capacity factor is partially explained by the provided reserve capacity. This is the reason why the lowest yearly capacity factor, 16.6%, is observed with CCGEs. For CCGTs, the lowest value is 24.9%.
4.2. Reserves
In addition to the optimization of electricity generation, the system is required to schedule a proportion of generation capacity for reserves. Here, the utilization of different technologies in reserves are expressed as a ratio of provided reserve capacity to the product of the simulation time and the installed capacity (cf. definition of capacity factor). The results for each case and reserve providing technology are written in Table 3. Relative to the installed capacity, CCGE power plants offer a considerable amount of upward reserves (only regulating reserve), particularly if participation from the non-spinning state is allowed. In absolute values, coal power plants provide the largest part of the reserves, which is understandable considering their significant installed capacity. However, in the ENG + NSPIN case, the gas engines are able to provide a significant part, 36%, of all upward reserves, whereas they provide approximately 13% of the reserves if spinning operation is required.
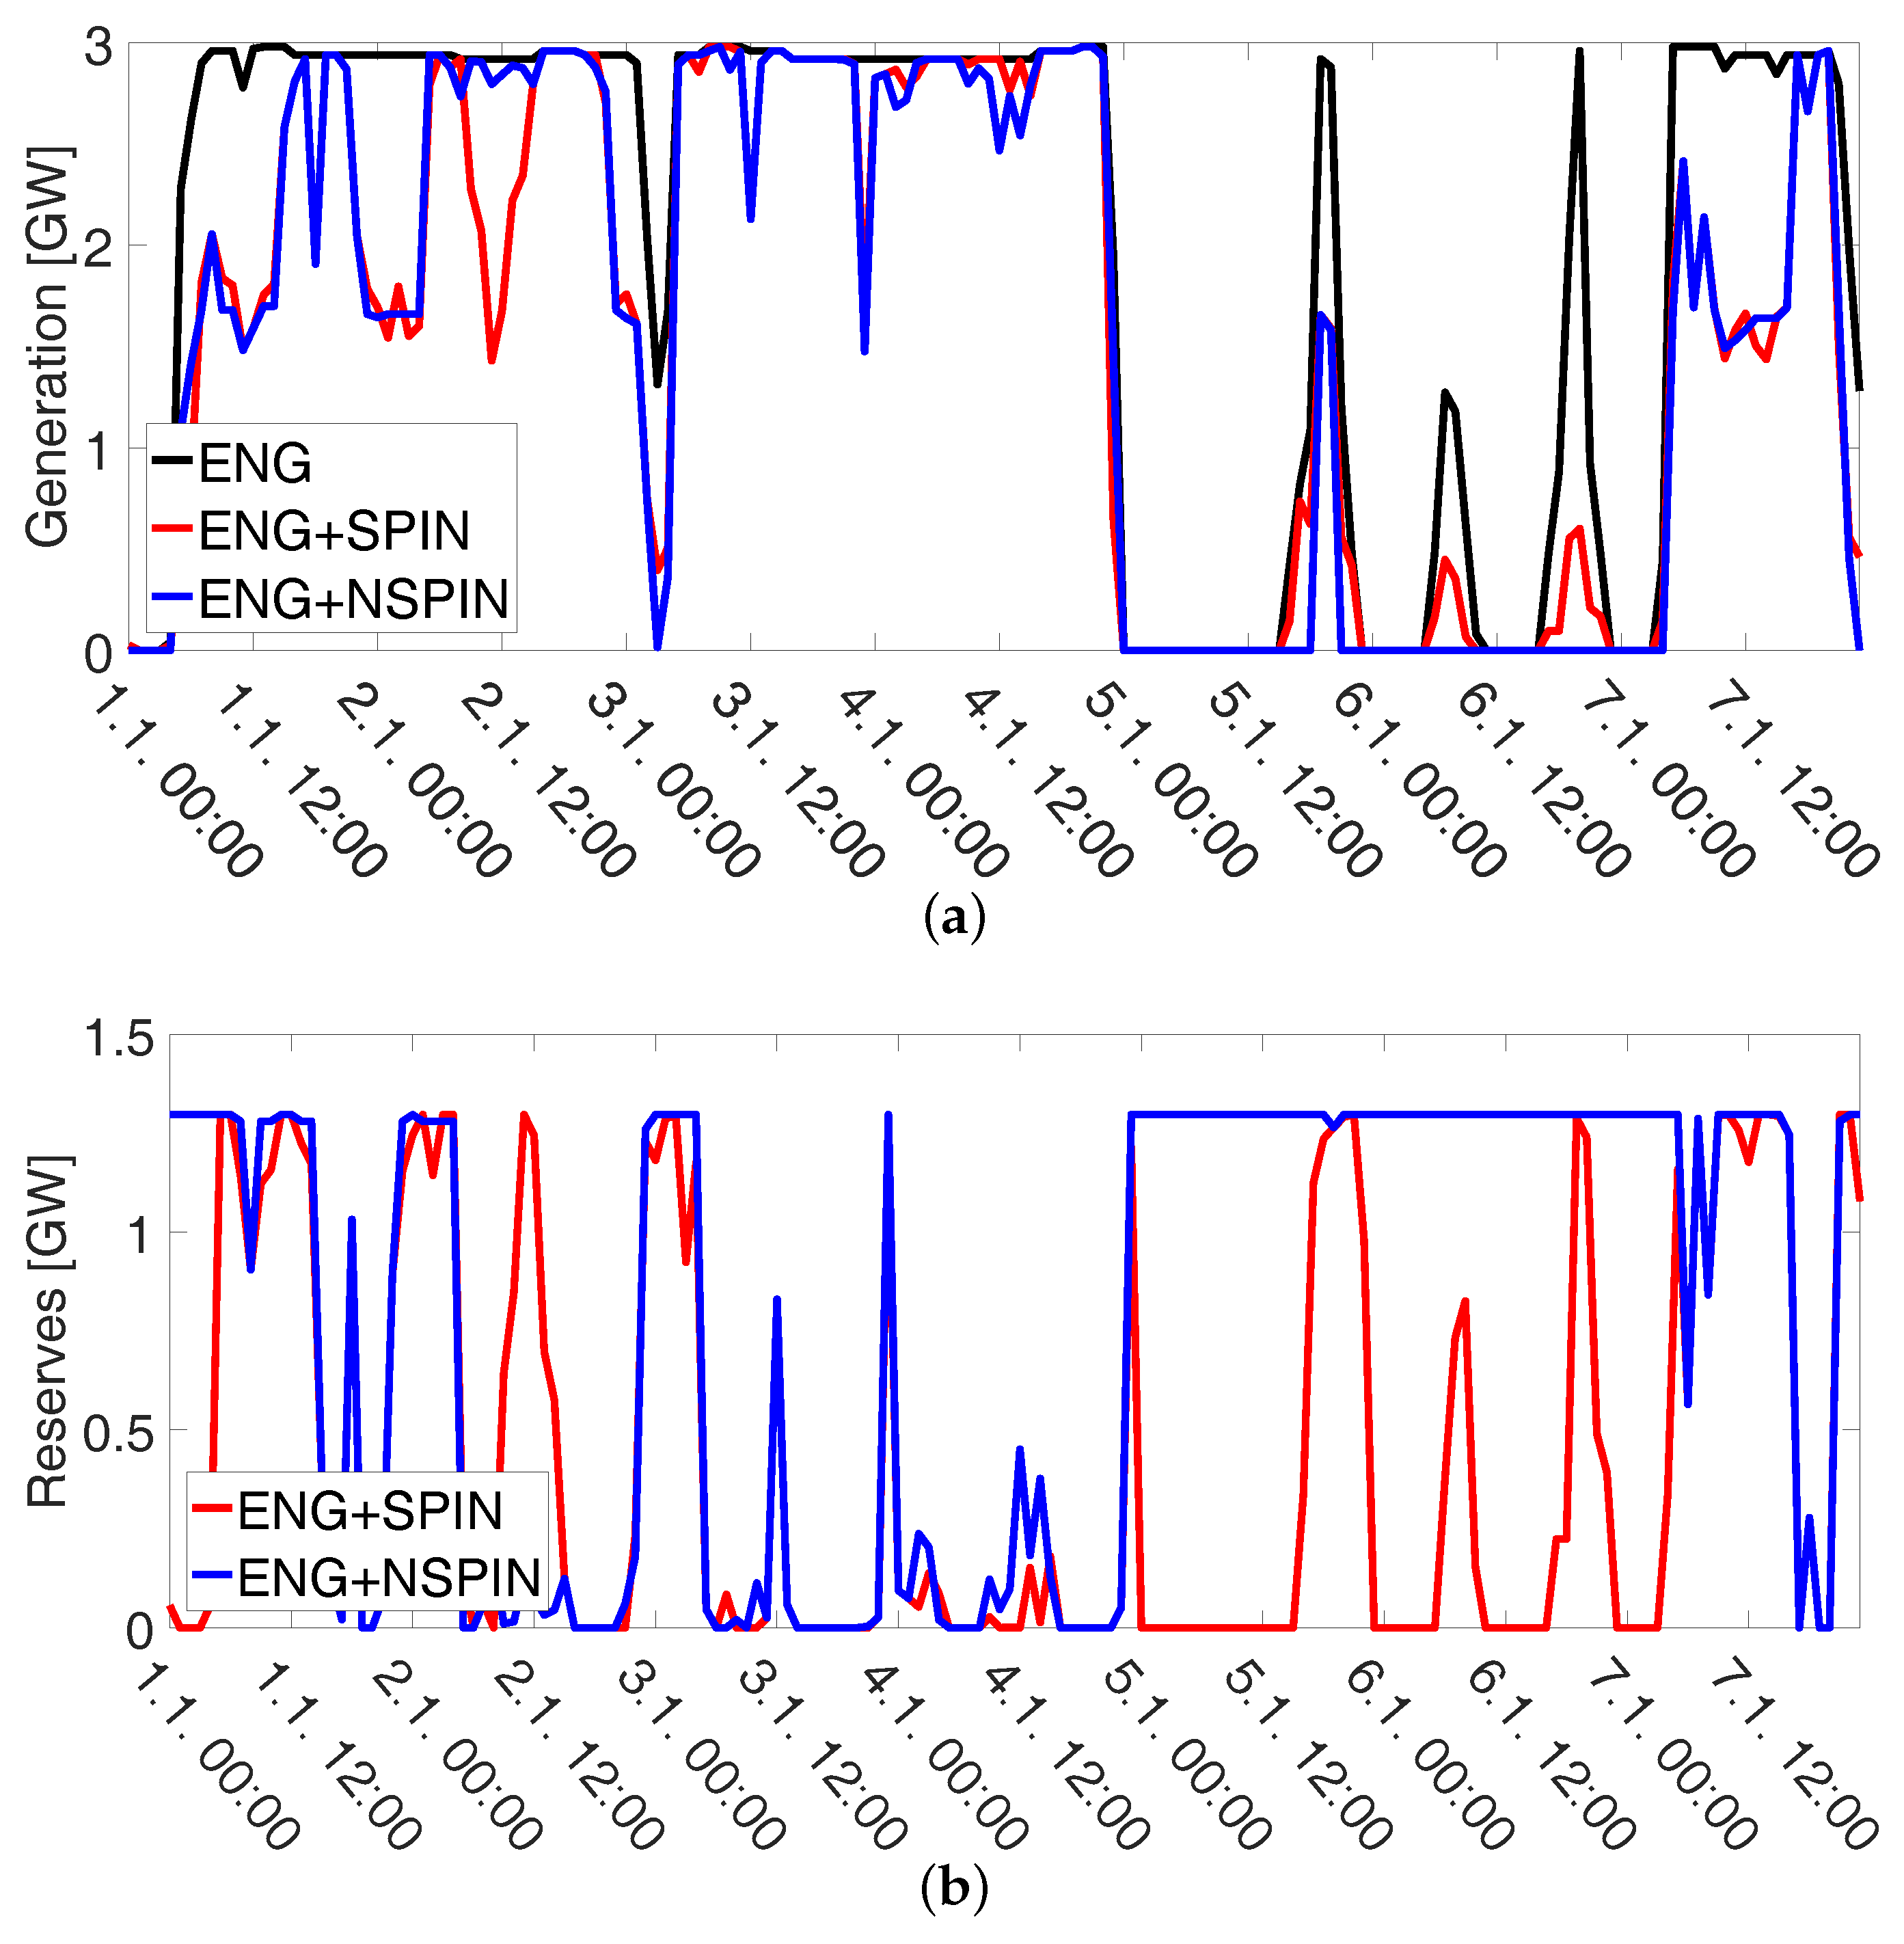
The operation of CCGEs for an illustrative week in 2030 is depicted in Figure 3, presenting electricity and reserve production. As can be seen, the electricity generation decreases even during peak hours once the plants are allowed to provide reserves. CCGEs seem to provide a remarkable amount of their total generation capacity for the upward regulating reserves once they produce reserves. After the non-spinning reserves are enabled, the plants tend to stay more offline while increasing the offer of reserves.
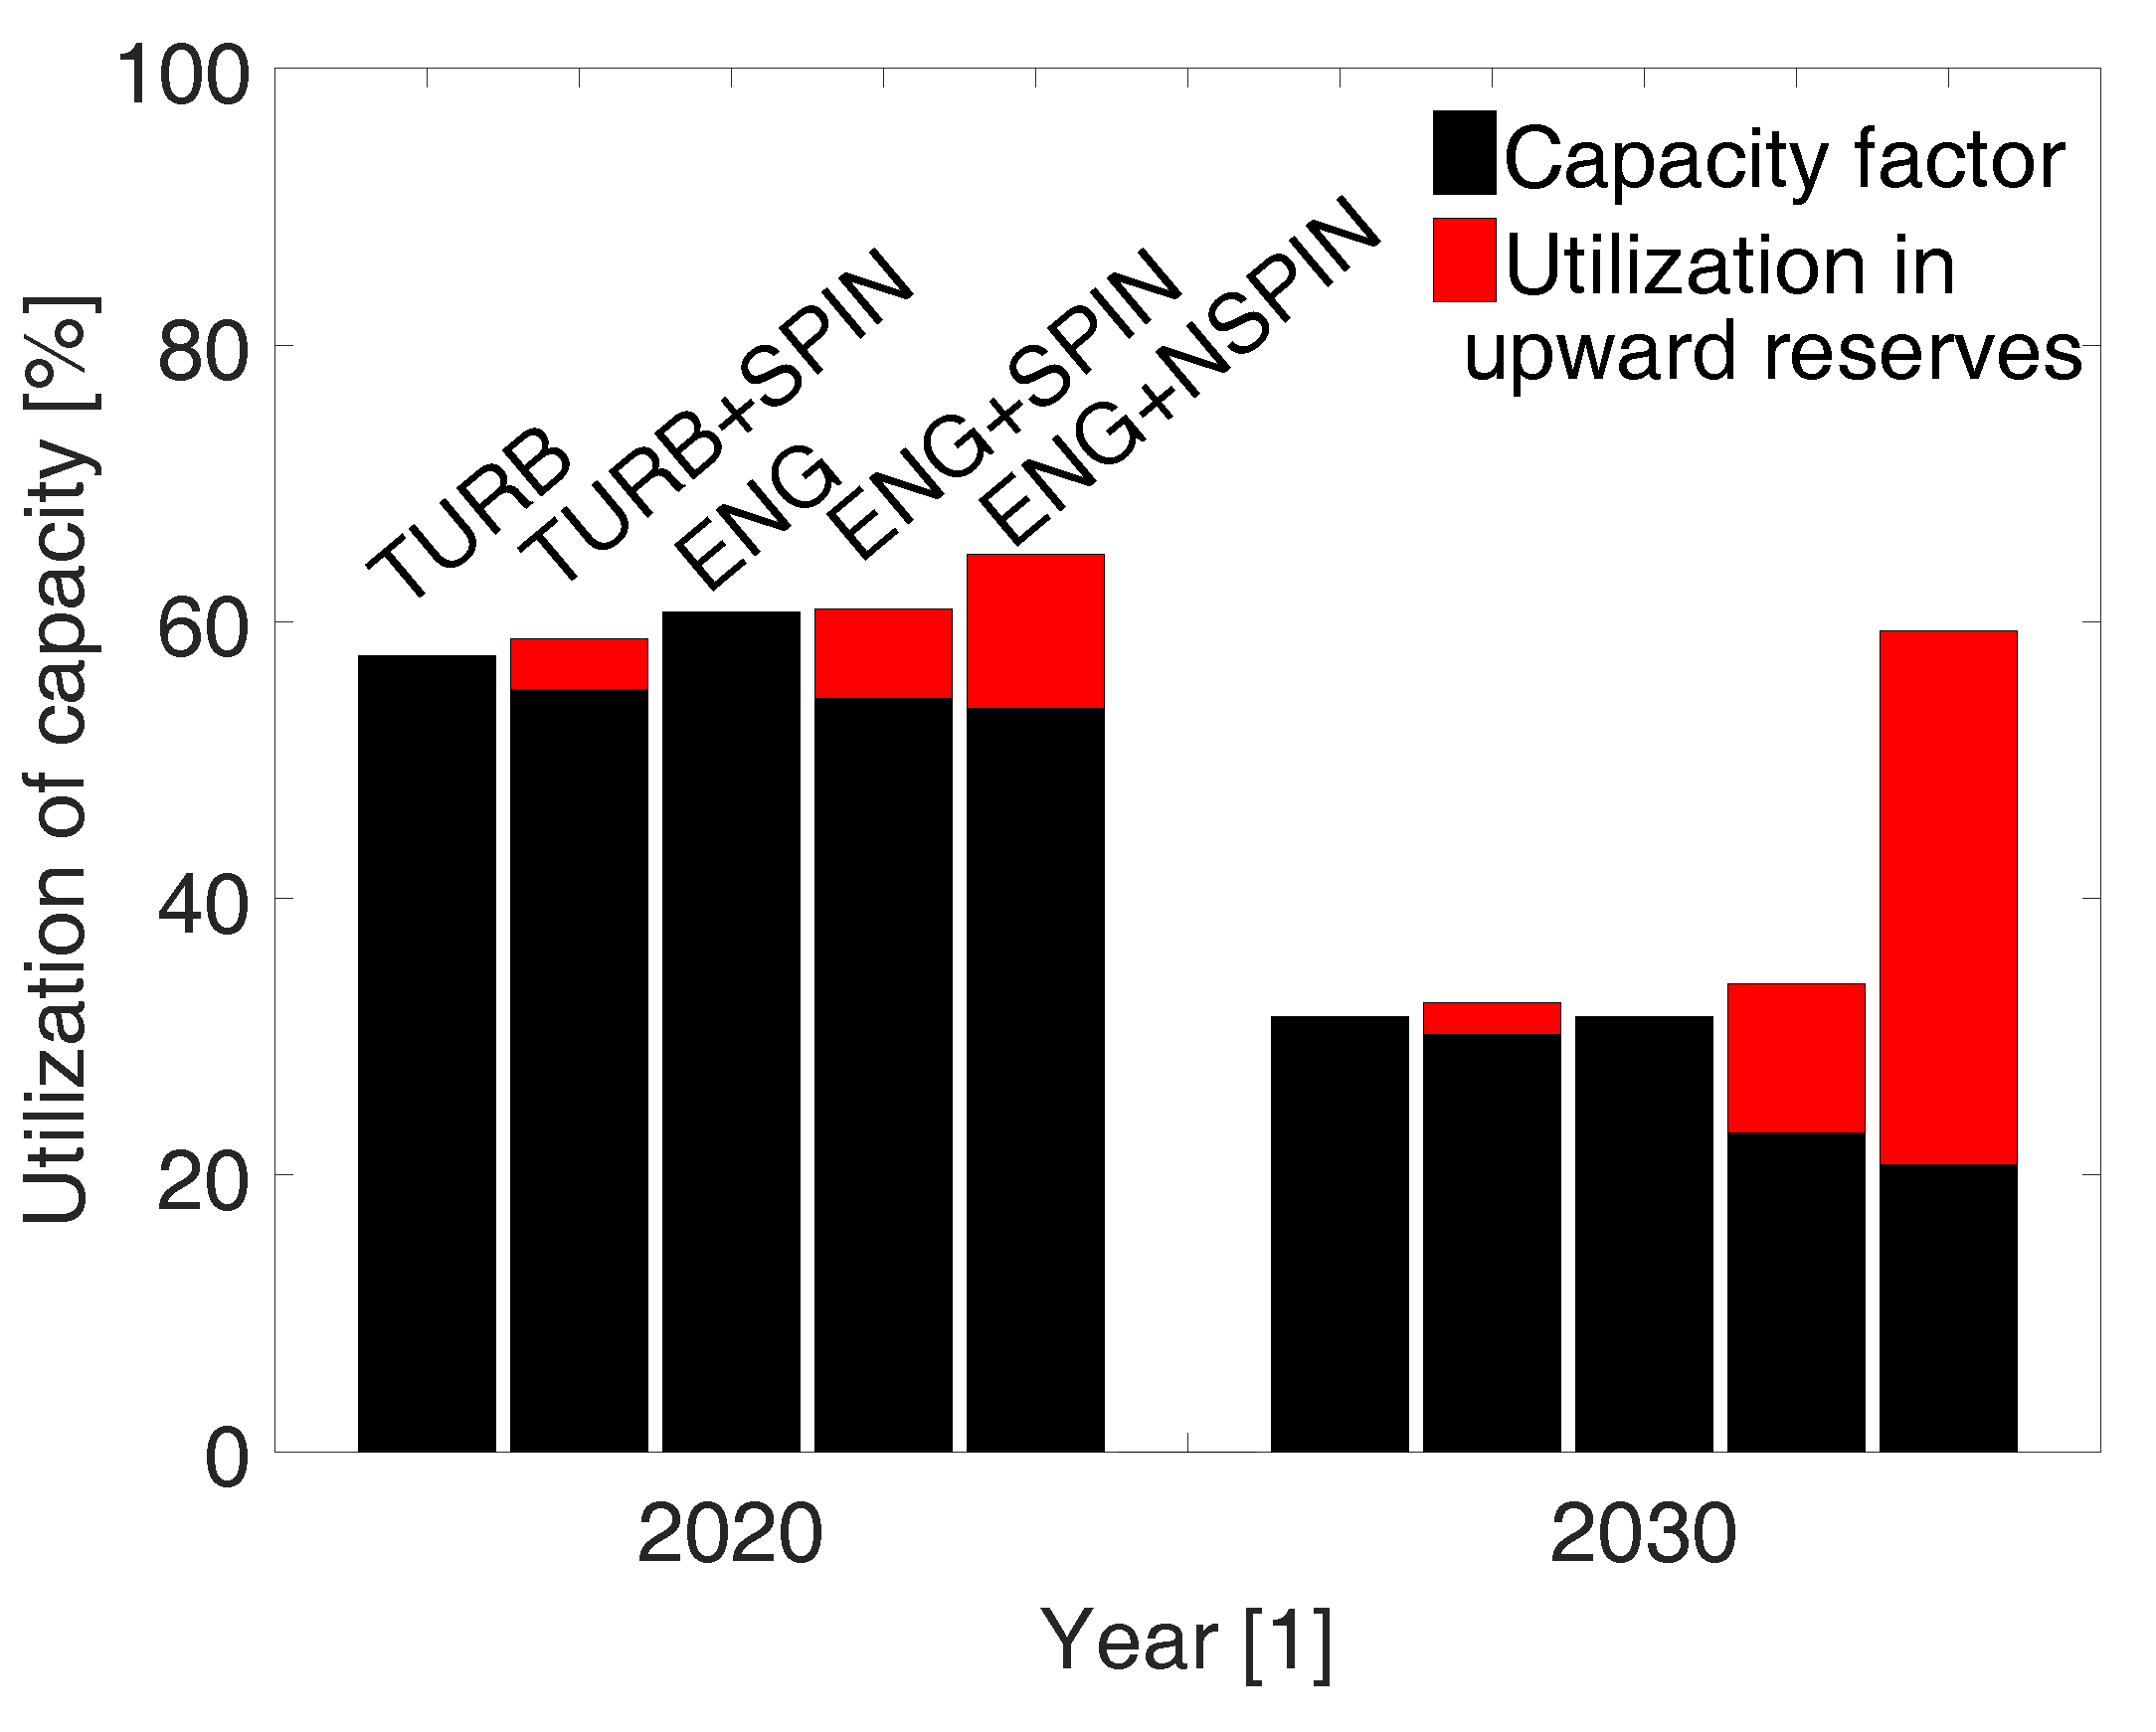
Since the results have now discussed the utilization of the CCGEs in the electricity and reserve supply, it is possible to inspect the total use of the plants’ capacity. This can be done by summing the capacity factor and the utilization in upward reserves. The sum indicates well the contribution of a power plant on the power system operation particularly if the plant stays partially loaded in order to provide reserve capacity. For the gas-fired technologies, Figure 4 depicts the sums of the capacity factor and the utilization in upward reserves in 2020 and 2030. When only electricity generation was considered, it was noted that the capacity factor of CCGEs is relatively low if it participated in the reserve provision. However, after including the reserves, we can see that the installed CCGE capacity is effectively employed: the utilization of capacity becomes greater than in the energy-only case. If the engines are allowed to produce regulating reserves from the non-spinning state, the utilization of CCGE capacity remains particularly high through the simulation period, despite the reduced role in electricity generation.
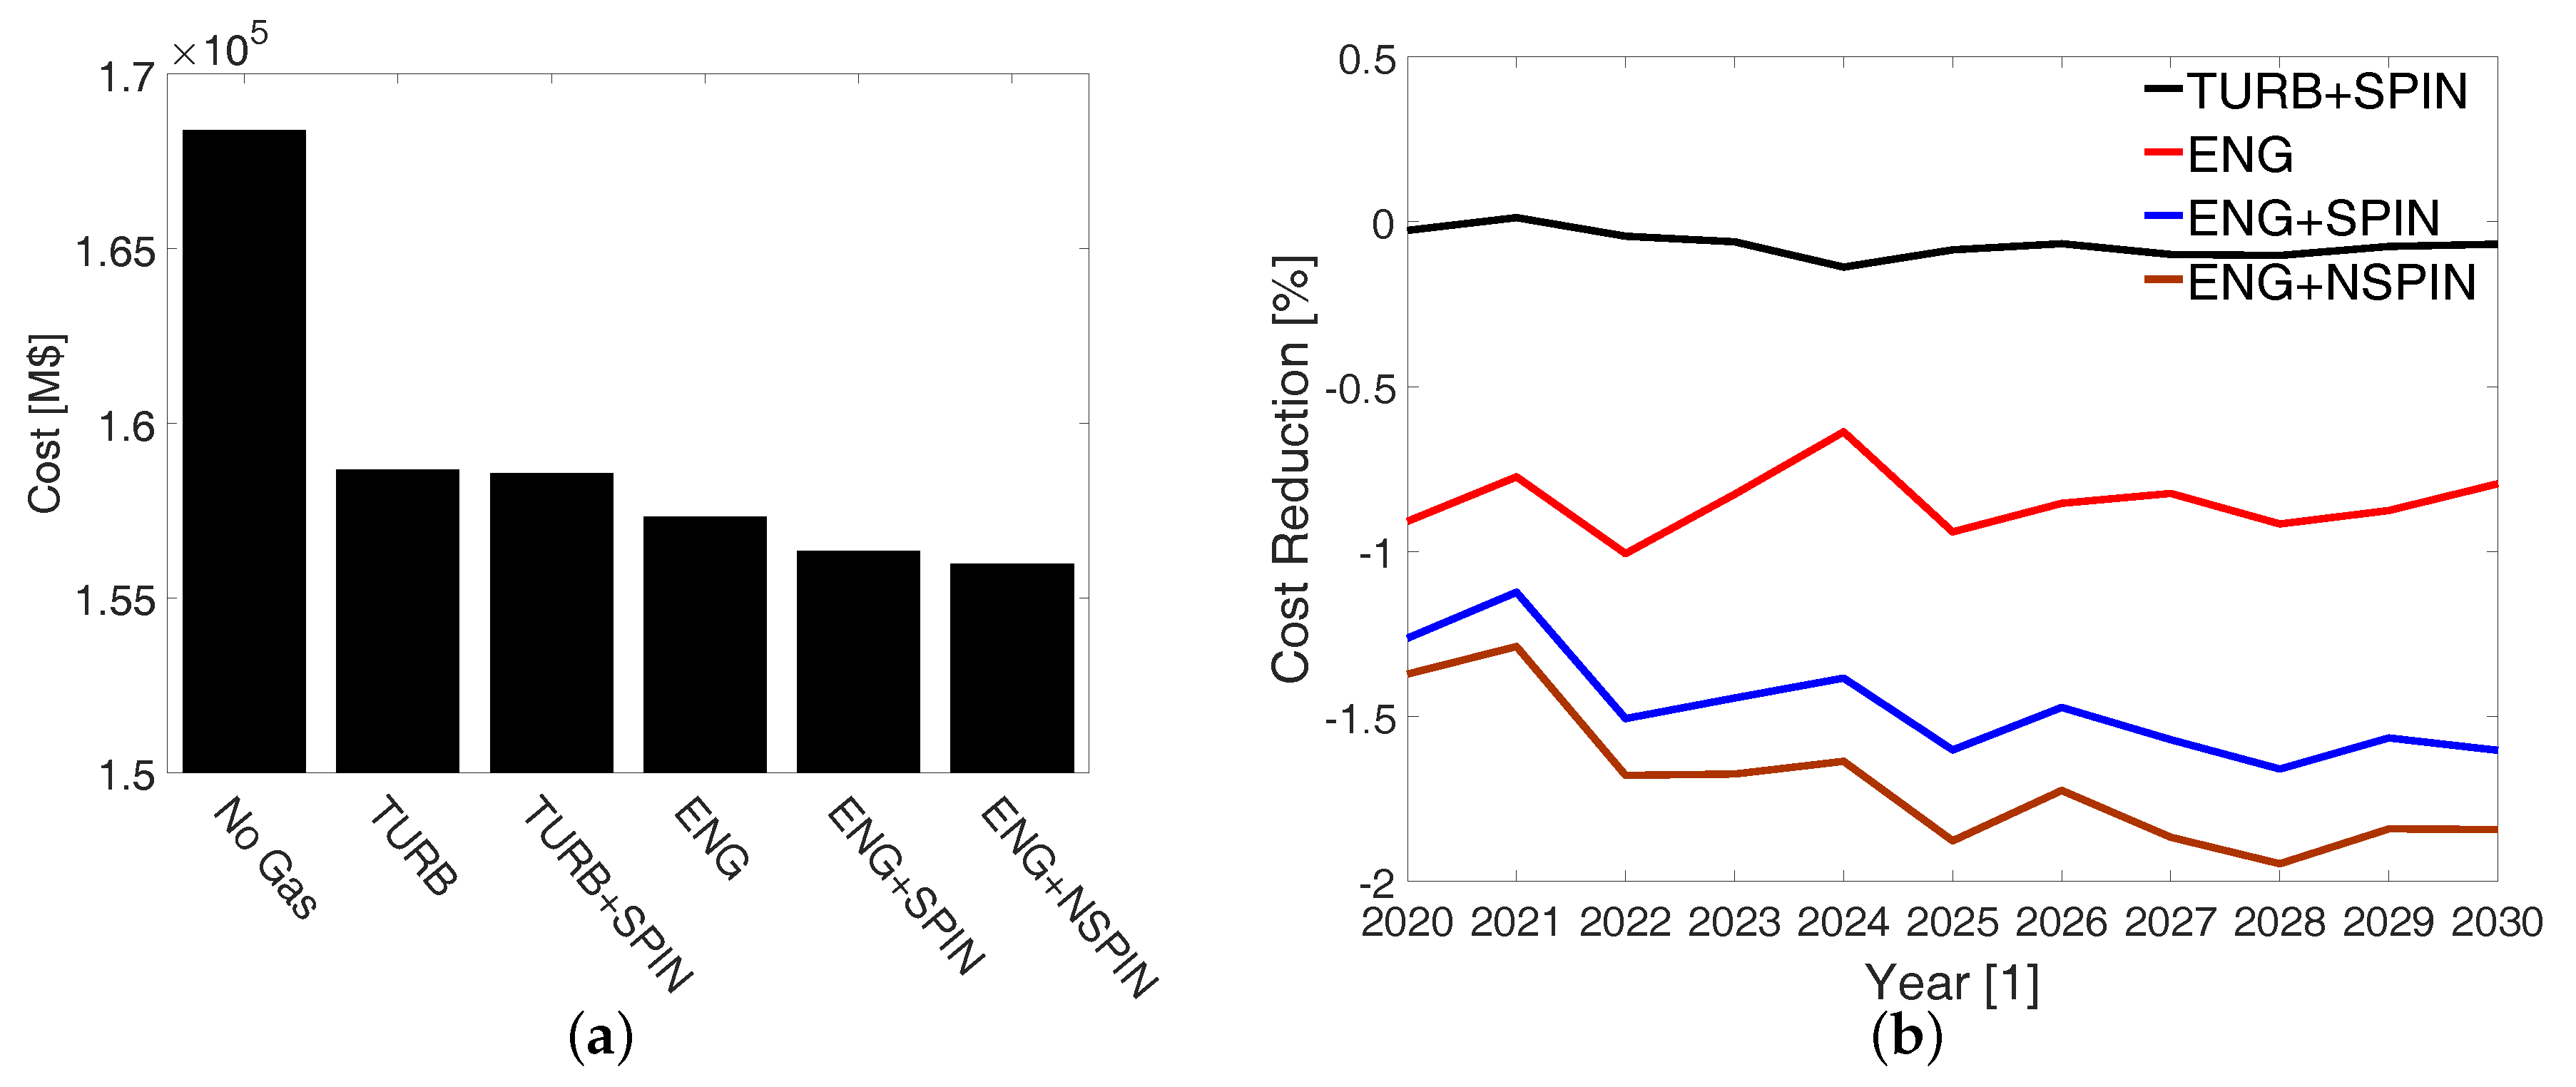
4.3. System Operation Cost
The total system operation cost for each case is depicted in Figure 5a and the yearly changes in the costs compared to the TURB case are further presented in Figure 5b. In general, the utilization of gas greatly decreases the operation cost of the system. The savings are achieved mainly from the reduced need for diesel-fired generation and load curtailment. Particularly during the first years of the simulation period and the period from 2025 to 2027, the use of diesel increases the operation cost of the system. When cases TURB and ENG are compared, the cost of running CCGEs is slightly higher but savings are achieved from the reduced need for diesel and DR. Furthermore, more coal is used, resulting in a cheaper system operation cost compared to TURB.
In the cases with a possibility to provide reserve capacity, similar kinds of changes in costs can be observed, but with CCGEs, greater savings are achieved. The increased savings compared to the energy only cases mainly come from the reduced utilization of gas-fired technologies. This is to say, the technologies maintain available generation capacity for the reserves, reducing their electricity generation. Their decreased generation is further replaced by cheaper coal power plants. Furthermore, savings are even higher in the ENG+NSPIN case as CCGEs can provide the reserve capacity without being online.
In Figure 5b, it is possible to see that the CCGEs’ beneficial influence on the reserve cost (the difference between the energy only and reserve cases) increases towards the year 2030. At the beginning of the simulation period, CCGEs have more value in the electricity generation but when the generation capacity of the system increases, CCGEs provide more upward regulating reserves.
However, the reader should note that even though CCGEs improve the system’s economic operation by participating in the reserve provision, the simulation does not consider reserve activation. Here, the savings are due to the efficient scheduling of generation capacity but the activation would cause its cost, particularly if upward reserves are required. The activation of downward reserves may also cause some extra cost because of ramping and less optimal dispatch compared to the day-ahead optimization.
4.4. Cycling
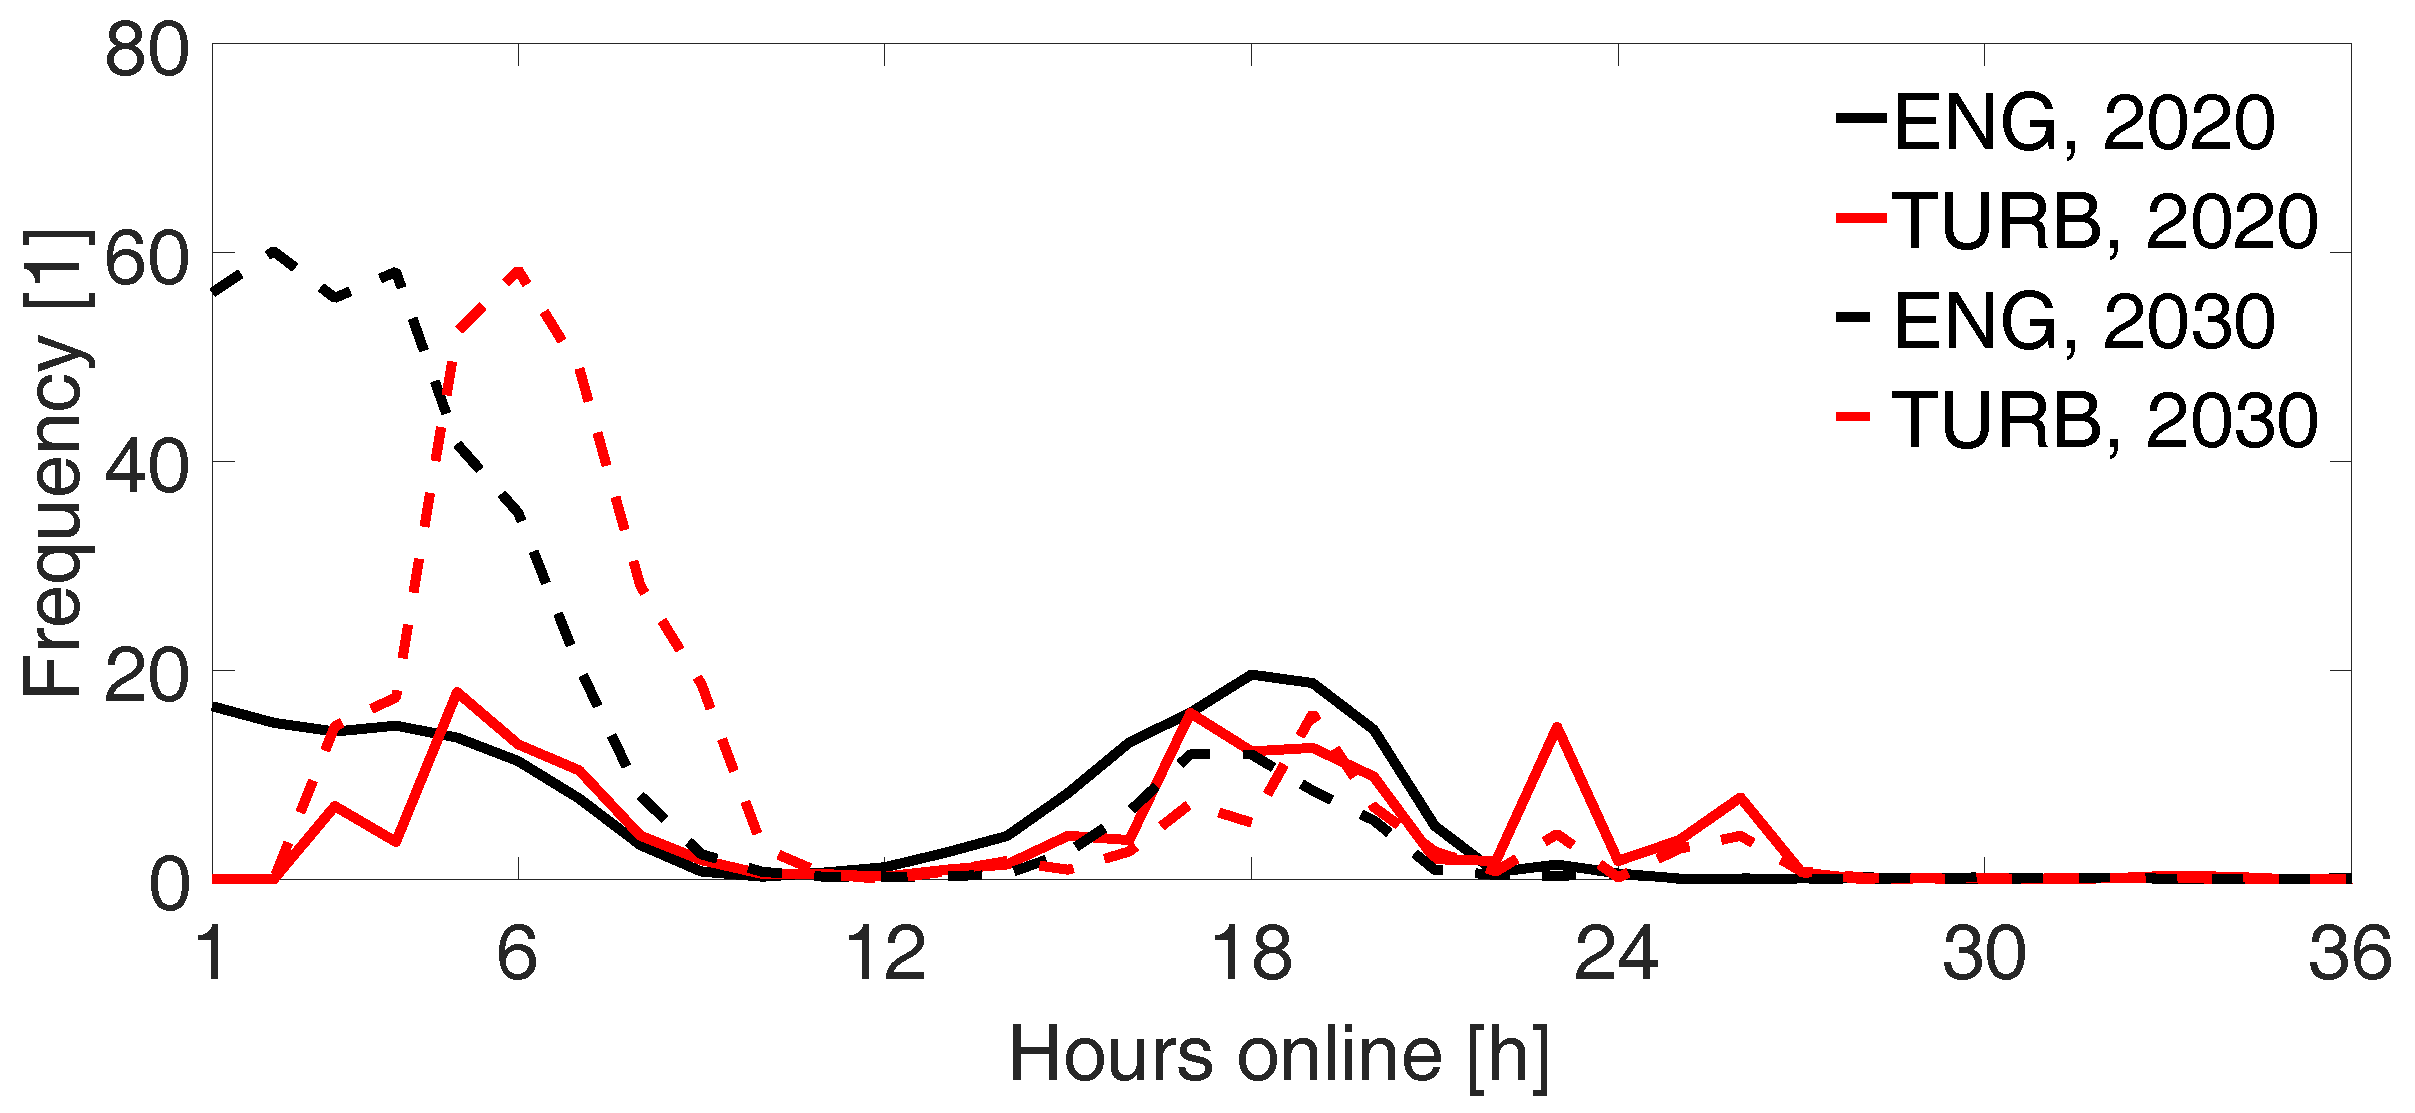
Lastly in this section, we analyze the cycling of the simulated power plants, which is aimed to illustrate CCGEs’ ability to provide flexibility for the balancing of daily load, or net load, variations. Figure 6 presents the histogram of average on-times for CCGEs and compares the distributions with CCGTs in 2020 and 2030. In 2020, the gas-fired technologies tend to stay online either less than 10 h or 12–24 h. One can also note that 1- and 2-h online times are common for CCGEs, whereas CCGTs do not start for such short periods. In 2030, the share of online times of less than 10 h becomes greater, while longer online cycles are rarer compared to 2020. This is also in line with our earlier observation that CCGEs tend to be mid-merit power plants at first, and become peaking plants towards the end of the simulated period. The reader should note that Figure 6 only presents the most common online times, but the power plants also stay on for longer time periods. For example in 2020, CCGEs and CCGTs were observed to remain online for more than two weeks, whereas maximum online times of a less than a week were observed in 2030.
In addition to cycling on and off in order to balance load variations, the cycling of CCGEs allows other generators to provide more stable output. When CCGEs are installed to generate electricity, the ramping of coal power plants is reduced by 6.5%, but when CCGEs also provide spinning reserves or spinning and non-spinning, the ramping is reduced by 5.3% and 3.3%, respectively. Interestingly, with CCGTs producing only electricity, the ramping of coal power plants increases 5%.
5. Conclusions
In this paper, we studied the system-level impact of a gas engine power plant when it provided the system with electricity and reserves. Only operational costs were considered. The thermal generation-dominated power system of South African was employed as a case study. Of particular interest was to showcase the flexibility of the investigated technology, i.e., the technology’s ability to provide reserves and follow the hourly load variations. We also simulated the system with combined-cycle gas turbines, a more widespread form of gas-fired technology, in order to better illustrate the value of CCGE’s flexibility.
In the simulation studies, it was shown that the utilization of CCGEs decreases the system operation costs, with savings mainly coming from the replaced diesel-fired generation. Compared to CCGTs, a greater reduction in the operation cost was achieved with CCGEs not only because gas engines reduced more the use of diesel and DR back-up, but also because the utilization of cheap coal-fired generation was increased. Thus, CCGE seems to offer flexibility for the system to follow daily variations in load and variable power generation, while allowing base load power plants to generate a stable output. This observation is also supported by the notion that the installation of CCGEs reduces the ramping of coal power plants. The reason for the advantageous operation is the low start-up cost of an engine and the gas engine power plant’s wide output power range, as a result of which the operation of the power plant is rather unrestricted.
As the gas-fired power plants were allowed to provide reserves, further savings were achieved compared to the energy-only cases, particularly with CCGEs. Gas engines effectively replaced coal-fired generation in reserve provision and thus, coal-fired power plants were able to generate more electricity. This is due to the fact that coal is cheaper, leading to savings via reduced use of gas and increased use of cheaper coal. Furthermore, it was proposed that CCGEs could provide a part of the spinning reserve capacity from the non-spinning state, as they are capable of starting up rapidly. The result indicated that CCGEs could benefit the system even more if such an operation was allowed. In such a case, the installed CCGE capacity can be utilized effectively in the power system operation.
The results of this study should be interpreted with care. The benefit from CCGEs compared to CCGTs is naturally influenced by the assumptions about their relative efficiency, operational costs and minimum generation levels. The selected values can be found in currently available technologies, but they are subject to change as both forms of technology evolve. The values can also be influenced by power plant features currently available at additional cost. For future studies, our interest is to study how the activation of the reserves affects the results.
Acknowledgments
The authors would like to thank Eskom for providing data for the modeling. This work was carried out in the research program Flexible Energy Systems (FLEXe) and supported by Tekes—the Finnish Funding Agency for Innovation. The aim of FLEXe is to create novel technological and business concepts enhancing the radical transition from the current energy systems towards sustainable systems. The FLEXe consortium consists of 17 industrial partners and 10 research organisations. The programme is coordinated by CLIC Innovation Ltd. (www.clicinnovation.fi.)
Author Contributions
Antti Alahäivälä analyzed the simulation results, wrote the manuscript, and designed the simulations together with Jyrki Leino who was responsible of simulation model implementation. Juha Kiviluoma and Matti Lehtonen gave guidance and helped to improve the quality of the manuscript.
Conflicts of Interest
The authors declare no conflict of interest.
References
- Kubik, M.; Coker, P.; Hunt, C. The role of conventional generation in managing variability. Energy Policy 2012, 50, 253–261. [Google Scholar] [CrossRef]
- Turconi, R.; O’Dwyer, C.; Flynn, D.; Astrup, T. Emissions from cycling of thermal power plants in electricity systems with high penetration of wind power: Life cycle assessment for Ireland. Appl. Energy 2014, 131, 1–8. [Google Scholar] [CrossRef]
- Kubik, M.; Coker, P.; Barlow, J. Increasing thermal plant flexibility in a high renewables power system. Appl. Energy 2015, 154, 102–111. [Google Scholar] [CrossRef]
- Alizadeh, M.; Moghaddam, M.P.; Amjady, N.; Siano, P.; Sheikh-El-Eslami, M. Flexibility in future power systems with high renewable penetration: A review. Renew. Sustain. Energy Rev. 2016, 57, 1186–1193. [Google Scholar] [CrossRef]
- Ackermann, T.; Andersson, G.; Söder, L. Distributed generation: A definition. Electr. Power Syst. Res. 2001, 57, 195–204. [Google Scholar] [CrossRef]
- Fragaki, A.; Andersen, A.N.; Toke, D. Exploration of economical sizing of gas engine and thermal store for combined heat and power plants in the UK. Energy 2008, 33, 1659–1670. [Google Scholar] [CrossRef]
- Meybodi, M.A.; Behnia, M. Impact of carbon tax on internal combustion engine size selection in a medium scale CHP system. Appl. Energy 2011, 88, 5153–5163. [Google Scholar] [CrossRef]
- Ummels, B.C.; Pelgrum, E.; Gibescu, M.; Kling, W.L. Comparison of integration solutions for wind power in the Netherlands. IET Renew. Power Gen. 2009, 3, 279–292. [Google Scholar] [CrossRef]
- Brouwer, A.S.; van den Broek, M.; Seebregts, A.; Faaij, A. Impacts of large-scale Intermittent Renewable Energy Sources on electricity systems, and how these can be modeled. Renew. Sustain. Energy Rev. 2014, 33, 443–466. [Google Scholar] [CrossRef]
- The Danish Energy Agency and Energinet.dk. Technology Data for Energy Plants. 2014. Available online: http://www.ens.dk/node/2252 (accessed on 26 June 2016).
- Niemi, S. Survey of Modern Power Plants Driven by Diesel and Gas Engines; Technical Research Centre of Finland (VTT): Espoo, Finland, 1997. [Google Scholar]
- Paepe, M.D.; D’Herdt, P.; Mertens, D. Micro-CHP systems for residential applications. Energy Convers. Manag. 2006, 47, 3435–3446. [Google Scholar] [CrossRef]
- Castro, P.M.; Grossmann, I.E.; Veldhuizen, P.; Esplin, D. Optimal maintenance scheduling of a gas engine power plant using generalized disjunctive programming. AIChE J. 2014, 60, 2083–2097. [Google Scholar] [CrossRef]
- Kılıç, L.; Arsoy, A.B. Evaluation of frequency control application for distributed generation in Turkey. Int. J. Electr. Power Enery Syst. 2015, 67, 501–509. [Google Scholar] [CrossRef]
- MAN Diesel & Turbo. Power Plants Programme. 2016. Available online: http://powerplants.man.eu/media-download/brochures (accessed on 26 June 2016).
- Wärtsilä. Power Plants Solutions. 2016. Available online: https://www.wartsila.com/energy/what-we-do/solutions-catalogue-2016 (accessed on 26 June 2016).
- Wideskog, M.; Wägar, N. Operational flexibility with Wärtsilä 50SG. In Proceedings of the Power-Gen Asia 2014, Kuala Lumpur, Malaysia, 10–12 September 2014. [Google Scholar]
- Payrhuber, K.; Chvatal, D. Gas engine’s flexibility. In Proceedings of the 7th International Energy Industry Conference Vienna University of Technology (IEWT), Vienna, Austria, 16–18 February 2011. [Google Scholar]
- Rebours, Y.G.; Kirschen, D.S.; Trotignon, M.; Rossignol, S. A survey of frequency and voltage control ancillary services—Part I: Technical features. IEEE Trans. Power Syst. 2007, 22, 350–357. [Google Scholar] [CrossRef]
- The Department of Energy. Integrated Resource Plan 2010 Update. 2013. Available online: http://www.doe-irp.co.za/ (accessed on 9 May 2016).
- Eskom. Fact Sheets. 2015. Available online: http://www.eskom.co.za/IR2015/ (accessed on 9 May 2016).
- Eskom. Power Stations and Pumped Storage Schemes. 2016. Available online: http://www.eskom.co.za/Whatweredoing/ElectricityGeneration/Pages/ElectricityGeneration.aspx (accessed on 9 May 2016).
- The Department of Energy. Electricity Overview. 2016. Available online: http://www.energy.gov.za/files/electricity_frame.html (accessed on 26 June 2016).
- Garrigle, E.M.; Deane, J.; Leahy, P. How much wind energy will be curtailed on the 2020 Irish power system? Renew. Energy 2013, 55, 544–553. [Google Scholar] [CrossRef]
- Foley, A.; Lobera, I.D. Impacts of compressed air energy storage plant on an electricity market with a large renewable energy portfolio. Energy 2013, 57, 85–94. [Google Scholar] [CrossRef]
- Deane, J.; Dalton, G.; Gallachóir, B.O. Modelling the economic impacts of 500 MW of wave power in Ireland. Energy Policy 2012, 45, 614–627. [Google Scholar] [CrossRef]
- National Energy Regulator of South Africa. The South African Grid Code: The Scheduling and Dispatch Rules. 2015. Available online: http://www.nersa.org.za/ (accessed on 9 May 2016).
- Eskom. Demand Response. 2016. Available online: http://www.eskom.co.za/sites/idm/ManageYourConsumption/Pages/DemandResponse.aspx (accessed on 9 May 2016).
- Eskom. Ancilliary Services—Technical Requirements. 2016. Available online: http://www.eskom.co.za/Whatweredoing/AncilliaryServices/Pages/Ancilliary_Services_Technical_Requirements.aspx (accessed on 9 May 2016).
Figure 1.
Performance of a gas engine in start-up and shut-down [17]. The engine has no minimum on-time once it has started.
Figure 1.
Performance of a gas engine in start-up and shut-down [17]. The engine has no minimum on-time once it has started.

Figure 2.
Yearly installed generation capacity (a) and generation (b) for the no gas case.

Figure 3.
Illustrations of the operation of CCGEs in electricity and reserve production. (a) Hourly generation for a week including all the cases with gas engines; (b) Hourly upward reserve capacity of gas engines for the same time period.
Figure 3.
Illustrations of the operation of CCGEs in electricity and reserve production. (a) Hourly generation for a week including all the cases with gas engines; (b) Hourly upward reserve capacity of gas engines for the same time period.

Figure 4.
Utilization of installed capacity in energy and reserve production for the gas-fired technologies in 2020 and 2030. The bars are in the same order in the case of 2020 and 2030.
Figure 4.
Utilization of installed capacity in energy and reserve production for the gas-fired technologies in 2020 and 2030. The bars are in the same order in the case of 2020 and 2030.

Figure 5.
Total operation cost of the system for each case (a) and the yearly reductions compared to the TURB case (b).
Figure 5.
Total operation cost of the system for each case (a) and the yearly reductions compared to the TURB case (b).

Figure 6.
Online time distributions of CCGE and CCGT for energy-only cases in 2020 and 2030.

Table 1.
Technical parameters and their intervals for thermal power plant mix. The intervals are used as the power plant fleet contains plants with different technical characteristics. In the case of the unit numbers, the interval indicates the commitment of new plants during the studied timespan. CFB: circulating fluidized bed; CCGE: combined-cycle gas engine; CCGT: combined-cycle gas turbine; VO&M: variable operation and maintenance costs; Min Gen: minimum generation and Max Gen: maximum generation.
| Technology | Min Gen (MW) | Max Gen (MW) | Units (1) | Start-Up Cost (k$) | VO&M ($/MWh) | Full-Load Efficiency (%) | Fuel Price ($/GJ) |
|---|---|---|---|---|---|---|---|
| Coal | 60–430 | 100–720 | 89–94 | 15–108 | 10 | 27.0–37.8 | 2.1 |
| Coal CFB | 175 | 250 | 6–25 | 38 | 10 | 35.9 | 0.9 |
| Nuclear | 810–1440 | 930–1600 | 2–8 | 186–500 | 2.7 | 33.3 | 0.1 |
| CCGE | 6 | 20 | 150 | 0 | 7.5 | 49.5 | 12 |
| CCGT | 200 | 250 | 12 | 15 | 4 | 55.0 | 12 |
| Diesel | 40–130 | 57–185 | 26 | 3–11 | 6 | 30.0–35.0 | 26.7 |
Table 2.
Changes in the capacity factors of different technologies compared to no gas case. Reported units are in percentage points. PS: pump storage and DR: demand response.
Table 2.
Changes in the capacity factors of different technologies compared to no gas case. Reported units are in percentage points. PS: pump storage and DR: demand response.
| Technology | TURB | TURB + SPIN | ENG | ENG + SPIN | ENG + NSPIN |
|---|---|---|---|---|---|
| Coal | |||||
| Coal CFB | 0.13 | ||||
| PS Hydro | 0.35 | ||||
| Diesel | |||||
| DR back-up |
Table 3.
The utilization of different technologies in upward reserves (instantaneous and regulating). Reported units are in percentage points.
Table 3.
The utilization of different technologies in upward reserves (instantaneous and regulating). Reported units are in percentage points.
| Technology | No Gas | TURB | TURB + SPIN | ENG | ENG + SPIN | ENG + NSPIN |
|---|---|---|---|---|---|---|
| Coal | 3.14 | 3.93 | 3.76 | 4.05 | 3.52 | 2.69 |
| Coal CFB | 6.41 | 6.51 | 6.62 | 6.32 | 6.00 | 3.54 |
| CCGE | - | - | - | 0 | 8.72 | 24.67 |
| CCGT | - | 0 | 2.93 | - | - | - |
© 2017 by the authors. Licensee MDPI, Basel, Switzerland. This article is an open access article distributed under the terms and conditions of the Creative Commons Attribution (CC BY) license (http://creativecommons.org/licenses/by/4.0/).
Share and Cite
MDPI and ACS Style
Alahäivälä, A.; Kiviluoma, J.; Leino, J.; Lehtonen, M. System-Level Value of a Gas Engine Power Plant in Electricity and Reserve Production. Energies 2017, 10, 983. https://doi.org/10.3390/en10070983
AMA Style
Alahäivälä A, Kiviluoma J, Leino J, Lehtonen M. System-Level Value of a Gas Engine Power Plant in Electricity and Reserve Production. Energies. 2017; 10(7):983. https://doi.org/10.3390/en10070983
Chicago/Turabian StyleAlahäivälä, Antti, Juha Kiviluoma, Jyrki Leino, and Matti Lehtonen. 2017. "System-Level Value of a Gas Engine Power Plant in Electricity and Reserve Production" Energies 10, no. 7: 983. https://doi.org/10.3390/en10070983
Note that from the first issue of 2016, this journal uses article numbers instead of page numbers. See further details here.