Exergy Replacement Cost of Fossil Fuels: Closing the Carbon Cycle


1
MARETEC, Department of Mechanical Engineering, Instituto Superior Técnico, Universidade de Lisboa, Avenida Rovisco Pais 1, 1049-001 Lisboa, Portugal
2
Mining and Industrial Engineering School of Almadén, Universidad de Castilla–La Mancha, Plaza Manuel Meca 1, 13400 Almadén, Spain
*
Author to whom correspondence should be addressed.
Energies 2017, 10(7), 979; https://doi.org/10.3390/en10070979
Submission received: 10 May 2017
/
Revised: 3 July 2017
/
Accepted: 6 July 2017
/
Published: 12 July 2017
Abstract
:The Exergy Replacement Cost (ERC) is an indicator that is used to ascertain the sustainability of non-renewable resource depletion. Specifically, it measures the amount of exergy society would have to expend if it were forced to re-capture and re-concentrate dispersed minerals back into a manmade usable deposit. Due to an assumption regarding the non-substitutability of fossil fuels, the original method failed to properly account for them. In fact, it sub-estimated their exergy replacement cost forty-seven-fold, on average, when considering solar radiation to fuel, and by approximately fivefold when going from crop to fuel. This new method, via the cumulative exergy consumption (CExC), calculates the exergy replacement cost of photosynthesis and bio-energy production, as together they form the best available technology when it comes to closing the carbon cycle. This approach ties together the “cradle to grave” to the “grave to cradle”, standardises the ERC calculations and enables comparisons between fuel and non-fuel mineral consumption. It also opens a discussion as to the role of the ERC in sustainability debates and whether resource depletion should be a matter of geological patrimony or material/energy services.
1. Introduction
Under the current economic and industrial system, the conversion of natural capital into economic capital stimulates and maintains growth. The problem is that neoclassical economics accounts for linear flows in only one direction—from the cradle to the grave. This has led to various negative externalities, including environmental degradation and the destruction/depletion of both renewable and non-renewable resources. This has occurred at an accelerated rate due to a throw away culture and what Krausmann et al. [1] call a mass accumulation of material stock, coupled with an overriding assumption that Nature will “one day in the future” clear up the mess, with help from technology [2].
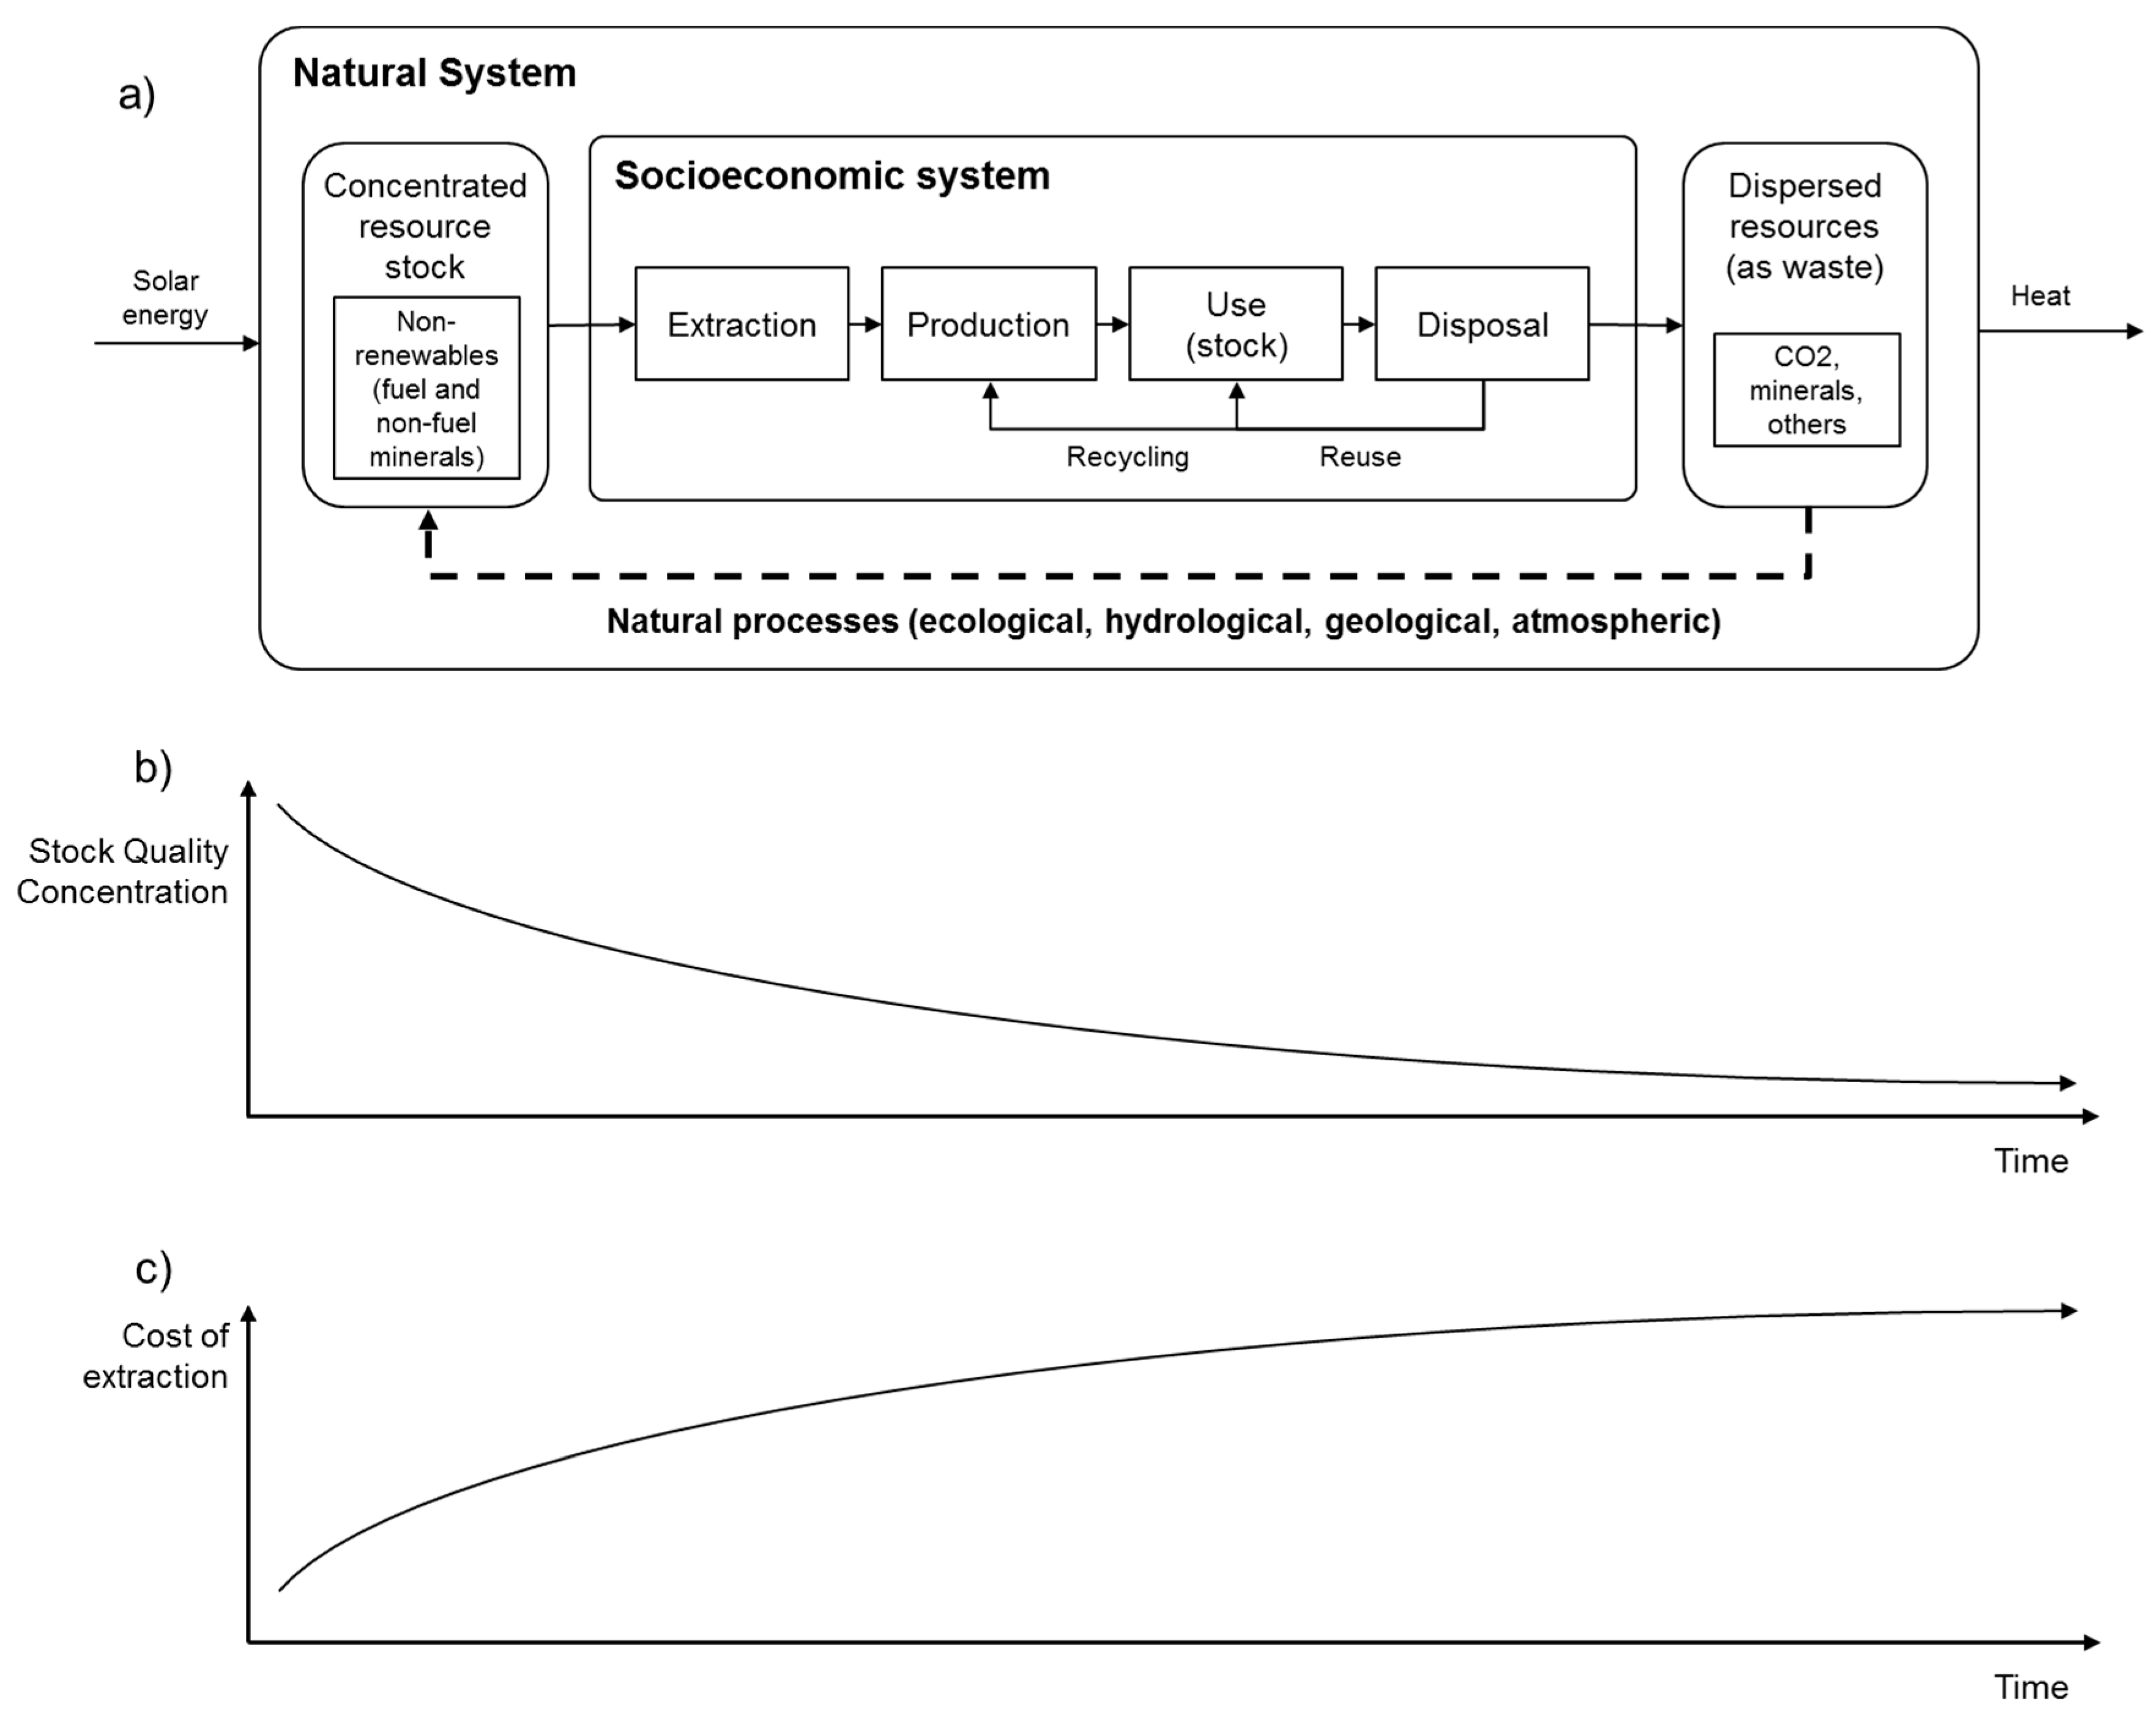
However, new technologies may not necessarily close cycles. Open material cycles, as shown by the socio-economic system boundary in Figure 1a, do not guarantee that future generations will be able to obtain the material and energy services they require to maintain present living standards. Solar panels, for example, may produce a cleaner energy at source but their production still requires intense mining to obtain the rare elements contained within their photovoltaic cells. If less than 100% of these cells are recycled waste is generated. This then becomes a burden for future generations and makes it increasingly difficult, and more expensive, for society to create new technologies using new resources, given that natural stock quality (concentration) will decrease (Figure 1b). In other words, society will spend more energy extracting each additional unit of resources, as shown in Figure 1c. The only way to prevent this from happening is to redesign the economy, its indicators and its underlying philosophies, so that material cycles can be closed. The dashed line in Figure 1a represents the natural way of closing material cycles. Unfortunately, society is extracting, using (accumulating) and throwing away materials faster than Nature can regenerate. This has a negative effect on fossil fuel and non-fuel stocks. The quantity of non-fuels, per se, is not reduced, but the quality of their stocks (that can be exploited for future development) are affected (Figure 1b). Even substituting fossil fuels, with bio-equivalents, which closes the material cycle, is subject to scarcity, given land availability concerns and the limited production of algal fuels.
The open cycle economy and its underpinning framework explain why current methodologies, applied within cradle to grave life cycle assessment (LCA) approaches, do not literally calculate the entire life cycle. In fact, they stop when a product is disposed of, be it the first time or following various recycling attempts. This led Valero and Valero [3] to create a life cycle assessment which moves in the opposite direction, going from the grave to cradle. They coined it the exergy replacement cost (ERC) [4] and defined it as:
The total exergy required to mine and concentrate a mineral deposit from Thanatia, using currently available technologies [which is] what it would cost to replace, employing current technology, the mineral wealth that Man extracts, uses and finally disperses.[5] (p. 829)
It provides a measure of the amount of energy one should invest in recovering the mineral deposits to their initial conditions of composition and concentration.[6] (p. 351)
The term “Thanatia” represents an exergy baseline of a theoretical future Earth where all viable non-renewable resources have been consumed and dispersed. Despite the fact that mineral deposits are said to exist (there are no viable resources) the baseline Thanatia assumes the concentration of the Earth’s crust to be that of an average piece of bedrock. Valero and Valero’s [5] concept is concerned with the amount of actual exergy needed to re-concentrate a mineral from Thanatia back to the conditions of the mine where it was originally found. As mineral deposits become exhausted, the exergy difference between a mine and the baseline reduces.
We agree that the ERC can be used to measure depletion, but that the definition needs to be clarified. However, we do not believe that the original definition of the ERC, as it stands, is accurate, as society does not need to consume exergy to place a mineral back into a mine (geological formation), but instead needs to consume the exergy necessary to provide a usable manmade deposit. In other words, the ERC supports the circular economy philosophy of striving for all outputs to be reincorporated back into inputs that can expand the economy without unnecessarily destroying the natural capital on which societal wellbeing and economic growth depend.
In theory, the ERC can be used to evaluate the sustainability of any defined process or product, given that it measures the amount of exergy society would have to consume in order to re-capture and re-concentrate a mineral to the point that it can be exploited by future generations to meet their needs, which is the Brundtland [7] definition of sustainable development. Yet, the ERC method was, only applied to non-fuel minerals, until recently, because of Valero and Valero’s [6] focus on society’s current inability to accelerate geological processes to provide fossil fuels, rather than Nature’s ability, through photosynthesis, to provide a usable deposit that fulfils the function of fossil fuels, in the form of biomass. Photosynthesis is important to the ERC concept because, although there is some research into synthetic fossil fuels, currently it is the only way that the carbon cycle can be closed, given that no stablished technology exists which can capture, concentrate and re-convert atmospheric carbon dioxide back into a fossil fuel. The ERC is the exergy cost that is associated with the processes represented by the dashed line in Figure 1a.
Combining photosynthesis and the technological advancements achieved in bio-product manufacture means that the calculation of both non-fuels and fossil fuels can be standardised, through an alternative pathway (Figure 2). This allows for a quantitative comparison between them both and removes the inconsistencies between the non-fuel and fuel mineral calculations that existed previously. Such inconsistencies led to a considerable sub-estimation of the physical and economic cost of providing future generations with the resources needed to fulfil functions that are currently being supported by fossil fuels.
2. The Exergy Replacement Cost and Resource Depletion
There are various ways to measure resource depletion with the exact nature of the method dependent on whether one is concerned with abiotic or biotic resource consumption, or is trying to combine both. This paper, whilst focused on fossil fuels is concerned with both non-fuel and fuel mineral depletion. We define the latter as a reduction in the availability of extractable or recyclable material that serves a given function(s) in society, and which does not regenerate naturally (or where any possible regeneration is negligible as to discount it) over the span of a human lifetime.
The ERC theory is built upon the idea that for society to use a resource two sequential processes have to occur. The first is the creation of natural compounds e.g., hematite (Fe2O3, 69.9% Fe) or glucose (C6H12O6). The second is the concentration of those compounds into viable deposits. Equation (1) is the generic formula for the ERC calculation and is derived from [6]:
where by, is the ERC of compound i; is the chemical exergy of i; is concentration exergy of i; and , as dimensionless parameters, are the chemical (formation) and concentration exergy costs when the best available technology (BAT) is used to respectively form and concentrate i.
The ERC, like the energy returned on energy invested (EROI) is founded on the fact that as a resource is extracted over time, the quantity and quality of deposits still available tends to decrease and the exergy investment to obtain the same unit will rise, assuming that best technology is used and that the easiest deposits to extract are the most desirable and the first to become depleted [9,10,11].
Whilst the EROI is used to quantitatively evaluate the effort, or energy, needed to obtain one unit of fossil fuel, the ERC goes one step further by calculating how much exergy would have to be invested to re-concentrate that which has been extracted and dispersed throughout time, back into a manmade usable deposit, relative to a theoretical “Depleted Earth” here abiotic resources are present in a completely dispersed state (i.e., no mineral deposits exist). The difference between Thanatia and a “Depleted Earth” is conceptual and subtle. The former considers the depleted planet to be one where no viable resources can be extracted. The latter states that there are no deposits, regardless of viability, which is a necessary assumption to undertake the exergy analysis. The reference state upon which the calculations are framed is the same. The application of the method is thus not affected. Figure 3 shows the theoretical evolution of mineral resources in terms of exergy. The “Pristine Earth” represents an Earth that has a bounty of exergy reserves because they have been built up over time and have not been extracted. As society develops extraction occurs and the exergy available to each successive generation reduces until the Earth’s exergy stock becomes excessively depleted and no viable deposits are left. This situation is depicted in the section of the graph labelled “Depleted Earth”. At this point exergy stocks are low but do not reach zero (exhausted Earth). Further, societal development is only possible once best available technologies re-establish the stock through the creation of new manmade deposits.
Figure 3, although theoretical, holds true as long as society extracts faster than Nature can restore. The net effect of depletion will always follow a decline if consumption outstrips resource formation and concentration. The situation may change when society realises that they are running out of relatively inelastic goods, such as non-fuels.
There is a considerable body of literature that applies the ERC to non-fuel mineral depletion on global [6,12,13], regional [14], national [11,15,16,17,18,19] and product scales [20], but as of yet, to our knowledge, only Whiting et al. [8,21] have explored the idea of expanding and standardising the ERC concept to include fuel minerals. The ERC had not been applied previously to fuels because according to Valero and Valero [6] (p. 280):
It makes no sense to apply exergy replacement costs to fossil fuels, due to the impossibility of reproducing the photosynthetic process that once created the resource.
This statement, which was also included in Calvo et al. [14], led the “Zaragoza school” to either ignore fuels or calculate their ERC using chemical exergy, through the high heating value [11,14,15,16,17,18,19], which is not consistent with the theory. Chemical exergy is not the same as the exergy required to re-capture and re-concentrate carbon dioxide, using current available technology, into a hydrocarbon that can be re-used. In fact, chemical exergy is the maximum amount of work that you can produce, in this case with a hydrocarbon. It is also equal to the minimum amount of work needed to produce it from Szargut’s reference state [22,23]. The difference between the ERC and chemical exergy is that the former represents the cumulative exergy required to obtain a resource using current (or best) available technology, whilst the latter is the “minimum replacement cost”. Furthermore, the problem with Valero and Valero’s [6] statement is that there is an inherent assumption that the only way to create new fuel deposits is through geological processes that transform organic material into fossil fuels. And, whilst it is true that fossil fuels cannot be reproduced within an individual’s lifetime with current best available technology, such as carbon capture and storage, the carbon cycle can be closed through photosynthesis. Consequently, best available technology, as it stands, is the planting and processing of fuel crops, or the diversion of organic wastes, to produce alternative fuels that fulfil the function of fossil fuels. In fact, since the publication of Valero and Valero [6], there has been increasing evidence to demonstrate that current technology from “crop to fuel” can, and has, partially replaced the functions of fossil fuels through biological equivalents, such as biofuels and biopolymers. This alternative pathway is shown in Figure 2.
The exergy efficiency of photosynthesis (solar radiation to crop) can be calculated as the energy content of the glucose produced, divided by the incident radiant energy. This includes the cost of living, and involves everything from the degradation of sugars and biomass to produce high energy molecules (such as ATP), to the repair, maintenance, and manufacture of the complex proteins in the photosystems and the enzymes used in the Calvin cycle. A scan of available academic literature shows a wide range of terrestrial plant photosynthetic exergy efficiencies. The exact value varies from anywhere between 2 and 41 percent [24,25,26,27,28,29], due to the considerable methodological differences that exist. Silva et al. [27] calculated the overall exergy efficiency of photosynthesis at 3.9 percent. They state that the exergy cost of photosynthesis is 25.44 MJ/MJ of glucose. In other words, for every 1 MJ of biomass produced, approximately 25 MJ of exergy is consumed. This exergy cost is the one taken as the baseline in the present paper.
Sorguven and Ozilgen [30] state that photosynthetic microalgae, after taking into consideration their metabolic exergy costs, convert 3.8 percent of solar exergy into chemical exergy, which they store as an algal lipid biomass. Beal et al. [26] state that algal photosynthetic efficiencies, in a highly productive case scenario, are 2.95 percent, after factoring in metabolic exergy costs. The inclusion of solar radiation and photosynthesis as a means to measure the exergy required to substitute fossil fuels is important because it extends and standardises the ERC approach for both fuels and non-fuels.
3. Substituting Fossil Fuel Functions
Fossil fuels account for more than 80 percent of the world’s primary energy consumption and their demand, according to the International Energy Agency [31], British Petroleum [32] and the International Panel of Climate Change [33], will increase in order to fulfil societal needs. Such needs are increasingly driven by an expanding global economy fed by the developing world’s population growth and their emerging middle class, eager to catch up with the lifestyles enjoyed by their developed world counterparts. This has led to debates regarding the sustainability of societal preferences and a linear economy built on the premise that technological advancement will enable infinite growth [2].
Certainly, conventional fossil fuel deposits are reducing, leading to more unconventional extractions with uncertain impacts on the environment and with a limited extension of resource availability, as can be seen in peak fossil fuel calculations.
According to Mohr and Evans [34] and Mohr et al. [35], who undertook an extensive statistical/literature review, respective global coal, natural gas and oil production, was 187 EJ/year (2012), 113 EJ/year (2008) and 170 EJ/year (2012). Their peak fossil fuel “best guess” for all types of coal is 245.9 EJ/year, peaking in 2021, whilst for conventional oil the peak is estimated to have occurred in 2006 at 167 EJ/year. For all types of oil, including unconventional options, the peak is estimated to have occurred in 2011 at 174.7 EJ/year. For extra heavy crude, the peak is estimated at 29.5 EJ/year in 2081 and for natural bitumen at 42.1 EJ/year, also in 2081. The conventional natural gas peak is projected to occur in 2037 at 134.8 EJ/year. For all types of gas this peak extends to 2052 at 193.6 EJ/year, because of non-conventional options such as shale, which is estimated to peak in 2127 at 56.8 EJ/year [35].
Yet, not only is the overall global fossil fuel production reducing, but it is also getting more expensive to produce each successive unit. Evidence of this phenomenon can be seen in EROI calculations and historical trends. According to a new methodology proposed by Court and Fizaine [36], oil’s peak EROI at 43:1, which occurred in 1943, will stand at 15:1 in 2018 and lower still at 10:1 in 2035. The same pattern can be seen for both gas and coal. The peak EROI for fossil fuels generally is 42.1, which is estimated to have occurred in 1965. This EROI will be down to 15:1 and 10:1 in 2060 and 2080 respectively.
Consequently, the replacement of fossil fuels with biomass, biofuels, biogas and biopolymers is becoming an increasingly promising option. Notably, bio-energy is a renewable and relatively clean feedstock for producing modern energy carriers, such as electricity and transportation fuels [37]. Furthermore, energy crops can recuperate, through photosynthetic processes, in their early life stages, the carbon dioxide released upon the burning of fossil fuels. This means they can create fuel alternatives within a short enough timeframe for the resource to be considered renewable. Given that bio alternatives are derived from plant or microbial sources, which use carbon dioxide as their feedstock in photosynthesis, an additional benefit is that the carbon cycle can be closed.
Biomass can replace coal and biogas can replace natural gas. Coal in commercial pig iron production has been successfully substituted for charcoal in smaller furnaces [38], whilst the coal/coke employed in basic oxygen steelmaking has been swapped in pilot tests [39]. Multiple trials using biochar, a type of charcoal yielded in pyrolysis, have provided positive results for medium sized recycled steel production via an electric arc furnace [40]. Such furnaces account for half of the European Union’s steel production. Biogas produced in conjunction with biochar has not been tested due to storage difficulties. However, model simulations do imply that the natural gas used in EAFs could be replaced by biogas [41].
Biofuels can be exploited instead of oil, whereby the gasoline fraction is substituted for bioethanol, whilst diesel can be switched for biodiesel. For aviation fuel alternatives, the case is less clear cut. There have been various successful tests, mostly with blends, although also with neat, that show that one can replace jet fuel with biodiesel obtained from algae, and non-edible energy crops such as camelina and jatropha [42]. For example, using a 50/50 blend of regular fuel and bio-kerosene, derived from jatropha, in one of the plane’s two engines, the airline Lufthansa operated 1187 domestic flights in 2011 between Frankfurt and Hamburg; however, tests were stopped due to lack of biofuel supplies [43]. Whilst certain technical compatibility issues, agricultural and policy/legal complications slow the technological development and industrial acceptance required for biofuels to completely replace kerosene commercially [44,45], it is technically possible.
Plastics, currently derived from either gas or oil, could be produced through the use of higher plant or microbial produced biopolymers. Although wastes may also be used to create bio crude, via the thermal depolymerisation of plastics or the pyrolysis of tyres, these technologies were not included in the calculations. Such possibilities are still very much in the experimental stage, as indicated by review papers such as Osayi et al. [46]. Any assumptions, as to their widespread use into the future are weak at best. In addition, the recycling process is not a renewable one and waste is always produced, making 100 percent conversion rates impossible. Consequently, and even if all the input material (plastic or tyres) could be converted into bio crude, for instance, there will always be, as long as demand continues to grow, a need for fresh non-recyclate. Biological waste sources may also be used to create bio-energy, hence the inclusion of sewage sludge, as a means to create biogas and the use of waste cooking oil, to replace aviation fuel in the calculations [47].
Bitumen replacement with biochar is deemed possible and has been researched. Zhao et al. [48] studied the physio-chemical properties of biochar used as an asphalt cement modifier. Kolokolova [49] looked at pyrolysis optimisation for the eventual development of a commercial bio-bitumen. The most practical example, to date, is that of low net traffic Icelandic roads. In 2006, the Icelandic Road Administration started to promote and use bio-oils such as fatty acid methyl ester from rapeseed oil and ethyl ester from fish oil for binder modification in road surface dressing. The main problems have resulted from a lack of standards/guidelines for the bio-oil modification of bitumen, which can be addressed [50].
Algae may provide promising biofuel alternatives as they do not need fertile soils in which to grow. This is something of fundamental importance as a lack of suitable land or freshwater will severely inhibit plant growth or create socio-political tensions, with the fuel or food debate, thus placing restrictions on economic development.
For the same quantity of oil production microalgae require 49 times less land than rapeseed and 132 times less than soybean [51]. Some algae species may be grown in agricultural and municipal wastewater, brackish and saline ground water and even hyper-saline brines [52]. This reduces freshwater abstraction. Furthermore, compared with terrestrial plants, microalgae can grow 10 to 50 times faster than other biofuel crops [53,54], resulting in an extremely high CO2 fixation rate, which means that algal biofuels have the potential to be carbon neutral, and therefore not a contributing factor of climate change.
Neochloris oleoabundans (recently reclassified as Ettlia oleoabundans) is an ideal candidate for biofuel production because it has consistently provided quality high lipid concentrations of between 17.5 to 56 percent of dry weight in a range of laboratory conditions [55,56,57,58,59]. It is a robust green algae that produces a considerable lipid yield, regardless of whether it is cultivated in fresh, brackish or seawater media, or subjected to intense light exposure, pH variations, mixotrophy or differing levels of nitrogen starvation [60,61].
Nevertheless, research is only at the exploratory stage and most experts think that from 2021 to 2030 algal biofuel will represent between only 1 to 5 percent of the total worldwide fuel consumption, which from 2030 onwards could, under the right geopolitical and socio-economic conditions, increase to 10 percent or even 25 percent [51].
4. Method
Bio-products were used exclusively in the method because whilst other renewable energy technologies, such as solar panels or wind turbines, can replace some of the functions of fossil fuels, they cannot capture and re-concentrate atmospheric carbon dioxide into a hydrocarbon that can be burnt or stored in non-energy products and therefore do not close the fossil fuel cycle. This is because even if solar panels are used to provide “clean” electricity at source, the rare earth elements mined to produce the cells contain embodied carbon, which leaves the cycle open and supports linear cradle to grave economic thinking.
To quantify the energy resources required to make bioproducts available to society, by recycling atmospheric CO2, a life cycle assessment (LCA) study of the substitutes for fossil fuels, as identified and explained in the previous section, was carried out.
The ERC of fossil fuels can be calculated by applying the cumulative exergy cost, through the LCA, to the life stages of fossil fuel equivalents, thus tying together conventional LCA methodology with that of the ERC. This is made possible by extending the initial LCA boundary to include solar radiation as the first step, meaning that it precedes the crop.
Typically, in a LCA of a biofuel product it is the final step that changes the boundary, i.e., from “crop to fuel”, “crop to tank” or “crop to wheel”. To our knowledge, no biofuel LCA papers consider the exergy consumption which occurs before the crop. Liao et al. [62] do include some element of solar radiation in their calculation, but likewise begin at the crop stage–given their focus on the technosphere. Consequently, they only consider the fraction of solar radiation stored in the crop as chemical exergy and do not consider the exergy contribution of the solar radiation that reaches a plant’s leaf.
4.1. Scope of the Analysis
Cumulative Exergy Consumption (CExC) is a method used to account for the totality of exergy cost through a chain of production processes or the life cycle of a product [22]. It is also considered as a resource use indicator in the life cycle impact assessment. It is described as an input-oriented indicator [63], which is derived from thermodynamic analysis [64], and comes under the same category as other indicators such as the Cumulative Energy Demand (CED), Solar Energy Demand (SED) and Cumulative Exergy Extraction from the Natural Environment (CEENE) [62]. The added value of the CExC, when compared to energy-based derivatives is that it can account for both energy and non-energy resources under one unit, so it is a more robust indicator than the CED, for example [65]. An extensive review of the methodologies used to evaluate the exergy consumed in resource depletion is undertaken in [8].
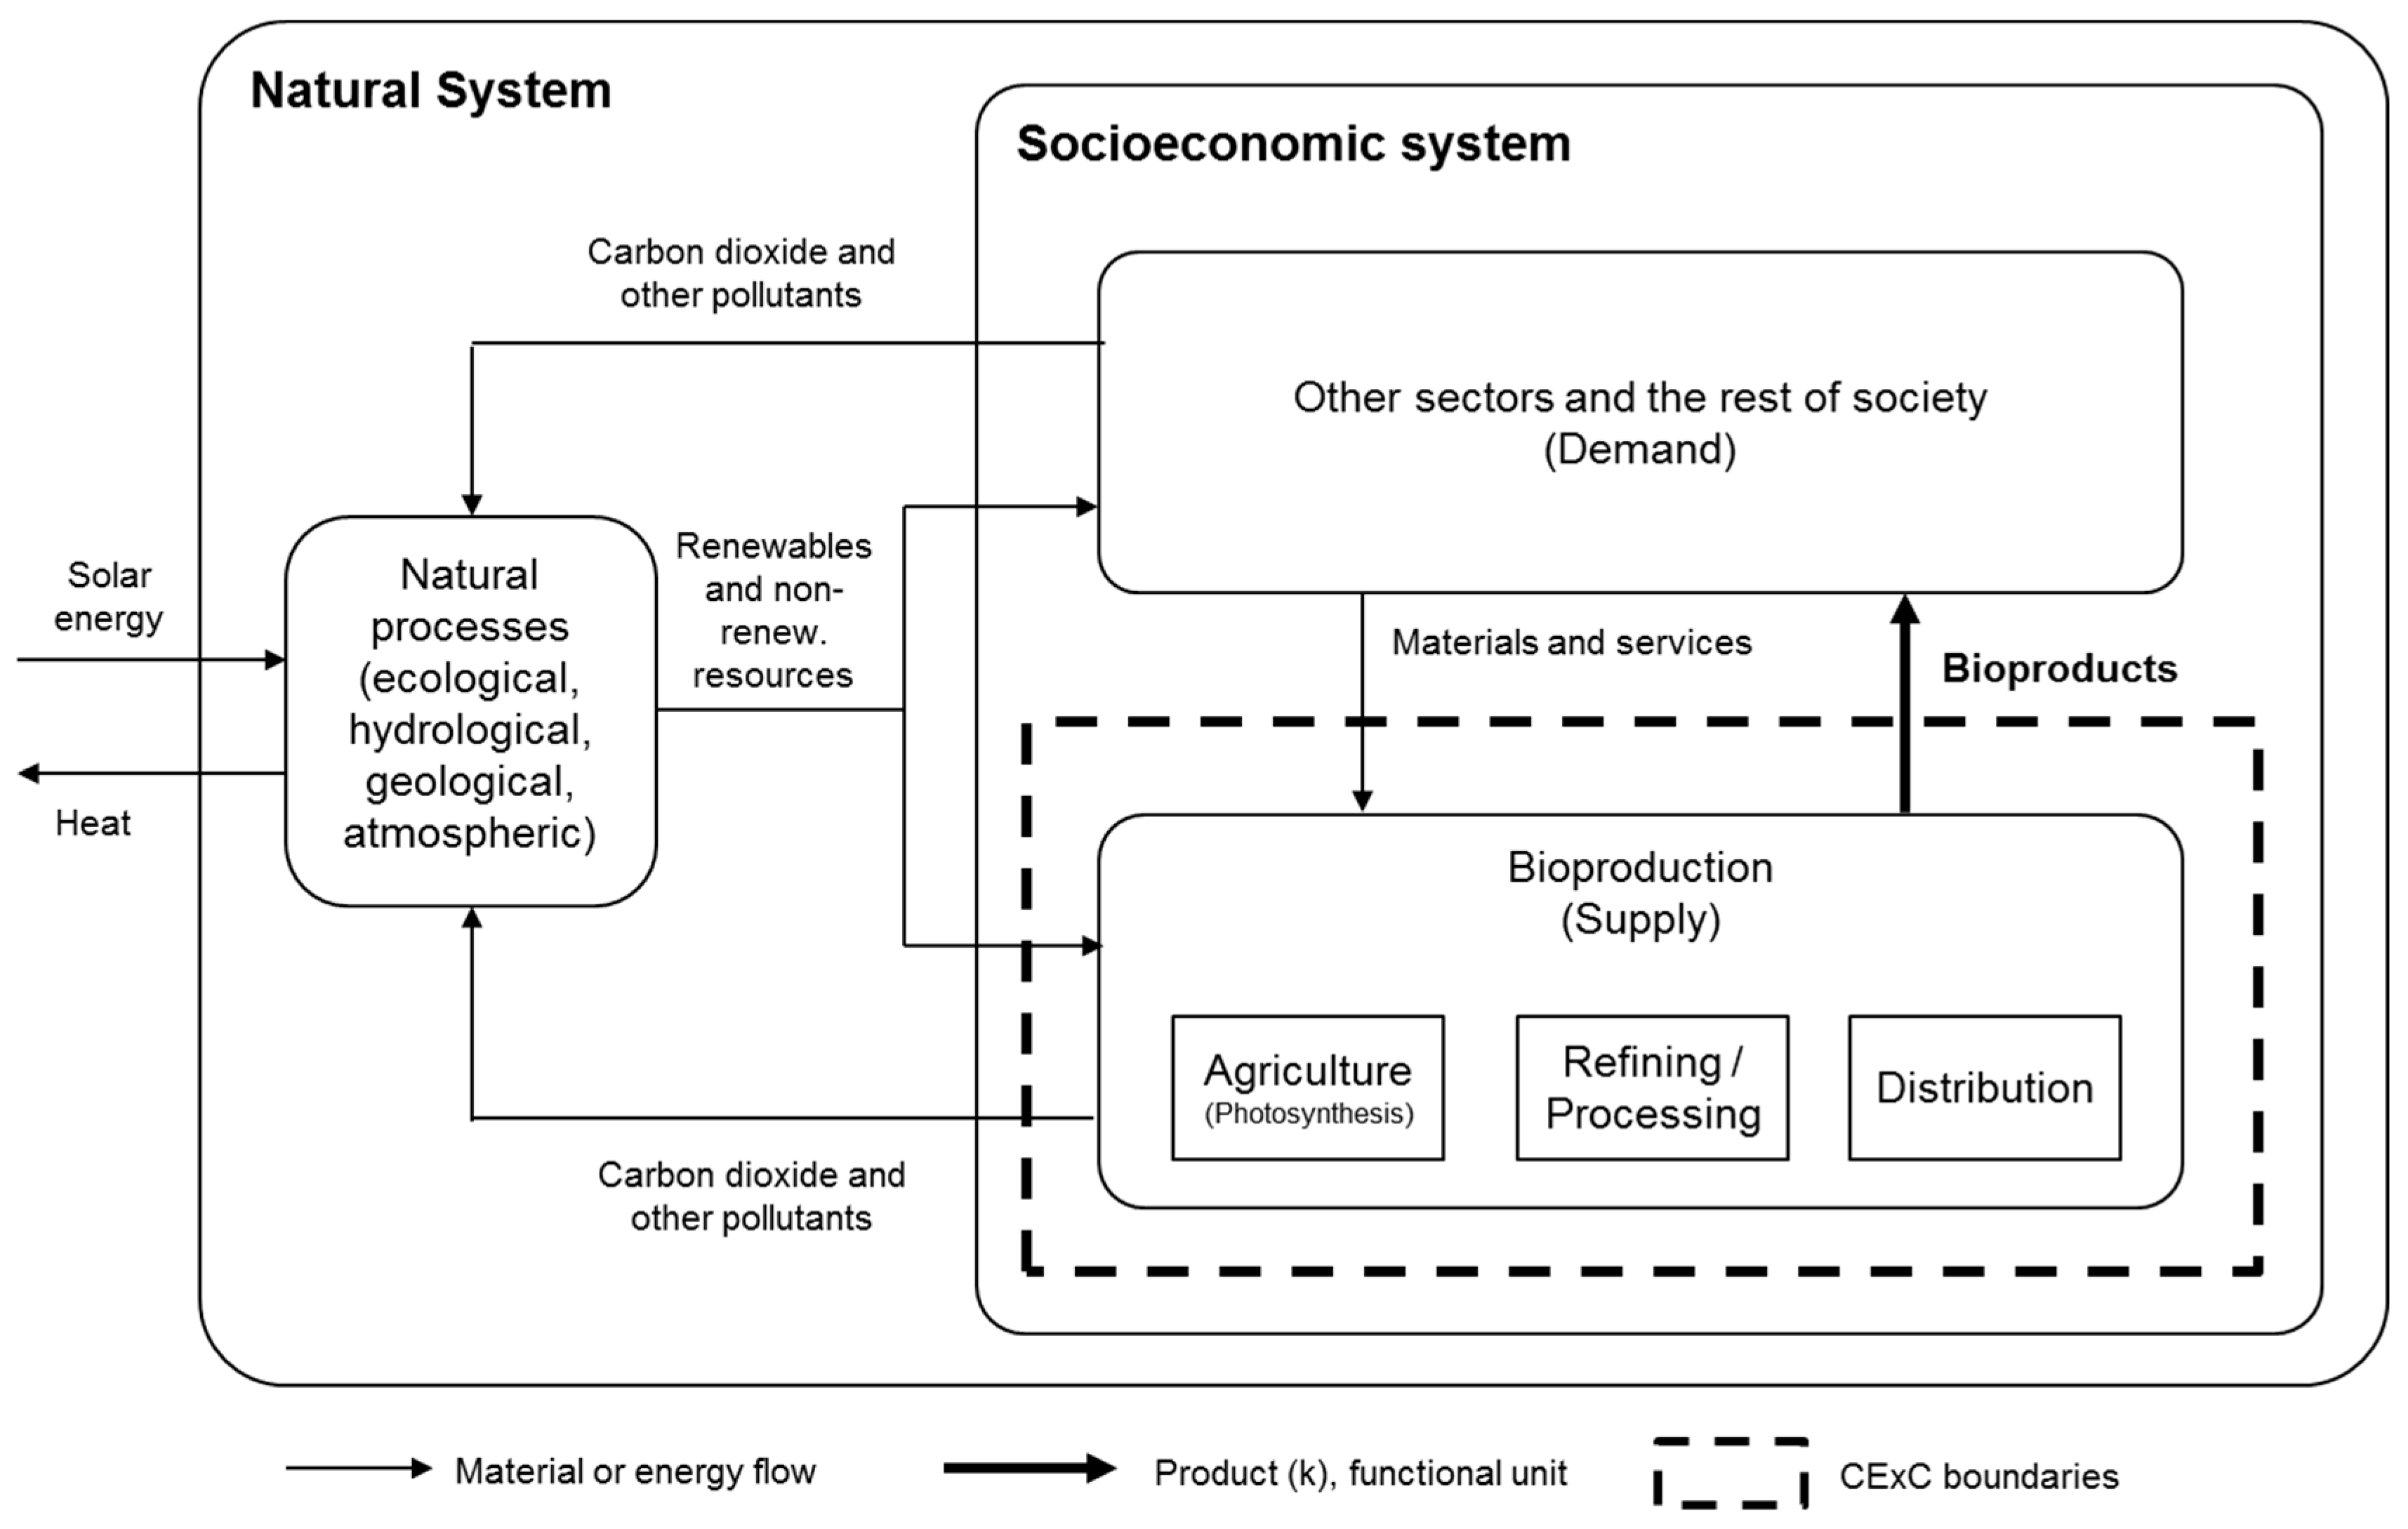
To calculate the ERC of a given fossil fuel the authors first need to obtain the CExC, via an LCA, of its bioproduct equivalents from “solar radiation to fuel”. Consequently, the system under analysis includes photosynthesis (“solar radiation to crop”) and all the other relevant processes of first generation bioproduction (“crop to fuel” which consists of agriculture, refining, manufacturing and distribution to end consumer or other economic sectors, as intermediate products—Figure 4). Our alternative pathway draws parallels with the conventional ERC non-fuel mineral route proposed by [6] and shown in Equation (1). The exergy required to form biomass, so from “sun to crop”, is equivalent to the ERC of a given compound’s chemical formation (kch). The “crop to fuel” stage represents the ERC concentration of compounds into viable deposits (kc).
We also include second generation biofuels/biomass within the “solar radiation to crop” + “waste to fuel” scope. This means that we do not account for the exergy cost acquired in a primary function (e.g., we ignore the resources involved in beer manufacturing, as in the case of spent barley used for biogas production) but that we do account for the photosynthetic process. We ignore third generation bioproduction because no exergy cost calculation for algal based biofuel production exists that may be worked into the parameters established within this method. That said, once more algal data becomes available this ERC calculation can be refined. The functional unit is MJ of bioproduct. In all fuel substitutions presented in this paper the neat concentration is assumed, meaning the fuel is one hundred percent biodiesel or bioethanol i.e., B100 or E100.
In the combustion process between 80 to 99 percent of the air emissions is carbon dioxide in mass terms, excluding water vapour [66,67]. Other types of contaminants, principally carbon monoxide, nitrous oxide, sulphur dioxide, volatile organic compounds and particular matter are also released, but it is beyond the scope of this study to calculate how much exergy is required to reincorporate them back into a useful input for the economy. Thus, CO2 is the only input derived from combustion that we feed back into the bioproduction process. The energy and material inputs from supporting sectors (e.g., that used in the raw material extraction of phosphate for fertilizers, electricity, etc.) and in the treatment of emissions released to the environment are also considered.
4.2. Data Entry and Inventory
To complement the CExC calculation, we undertook an extensive literature review of the different CExC values derived from the production of bioproduct substitutes for fuel and non-fuel purposes. This allowed us to identify how different researchers classify inputs and outputs, the characterisation factors applied, and the scope of secondary studies. In total 129 secondary data entries, 82 percent from SimaPro, and the rest from 14 references [37,62,68,69,70,71,72,73,74,75,76,77] were analysed to give support to the method presented in this paper. Table 1 summarises the key findings. The large number of entries illustrates the difficulty involved in replacing certain fossil fuel products, the variability of exergy efficiencies in bioproduct manufacture, and the research bias towards petroleum and its substitutes.
None of the studies cited consider solar radiation as an input to the bioproduction system and all start at the “crop”, although the final stage may differ (i.e., fuel, tank, wheel etc.). This ignores the role of the sun in producing the crop (which is the main source of light for photosynthesis, given the inefficiency and financial cost of artificial lighting) and the role of the plant to convert such radiation, along with carbon dioxide, into biomass through photosynthetic mechanisms. This overlooks a key energy flow given that 37 TJ of biomass per second is produced on Earth [22], without which life cannot be sustained.
4.3. Cumulative Exergy Consumption as a Resource Indicator
Once the inventory was established the CExC was used as an impact assessment indicator to quantify the resources, in terms of exergy, required for photosynthesis and manmade bioproduction processes. Through this method we could measure both the amount and origin of inputs required from Nature to obtain a certain bioproduct, and the efficiency regarding the use of raw materials in the bioprocessing chain. The CExC of the bioproduct can be expressed as in Equation (2):
where B is the sum of all exergies for all stages within a system, for all natural resources i (both renewable, denoted R and non-renewable, denoted NR), required in all processes j, to generate product x. The chemical exergy is used for all material resources (minerals, biomass, water and fossil fuels) while the kinetic, radiative, nuclear, potential exergies are estimated for other energy carriers [22].
Once the CExC is calculated one can then obtain the “specific exergy cost of a given product” (κ), which is a term Szargut [22] refers to as the “cumulative degree of thermodynamic perfection” (CDP) and which Valero and Valero [6] use as the basis of their ERC.
The κ value is a measure of the exergy efficiency of a given system, meaning that it may decrease if operational efficiency improves, as can be inferred by Equation (3). This can be used to determine the specific exergy cost of any resource, renewable or non-renewable, fuel or non-fuel, and where Bx is the intrinsic exergy of the bio-product:
In this paper, the total κ value is sub-divided into four component parts—biomass, non-biomass derived energy (fossil fuels and renewable resources, excluding biomass), water and minerals. This allows the authors to identify the contribution of each input in the final output, which in this case is a bio-product. It also improves the previous Exergy Replacement Cost method, which only accounts for energy inputs and ignores non-energy inputs (water, non-fuel minerals and non-energy uses of fuels such as plastics).
One important detail to note is that in the case of crude, there is more than one possible bio-equivalent (as depicted in Table 1), given that each oil fraction is employed in different technologies that support the economy and provide services to society. Consequently, a weighted exergy cost, as shown in Equation (4), is applied to account for the sub-products that comprise an average barrel of oil:
where, κj is the weighted exergy cost of fuel j, fn is the fraction of product n that can be obtained from fuel j, and κx is the exergy cost of the bio-equivalent of product n. The mean decomposition of the products obtained from a barrel of oil corresponds to: gasoline 47%, diesel 23%, jet fuel 10%, liquefied petroleum gas (LPG) 4%, asphalt 3% and other products 13% [78].
4.4. Case Studies
Our results are compared with two case studies present in the state of the art literature on the subject:
- Valero and Valero [6], who measured the decline of the natural exergy stock as the result of global mineral extraction from 1900 to 2008. Their data set comprised of fossil fuels and 54 non-fuel minerals.
- Calvo et al. [14], who studied the trade directions in 2011 of material and exergy flows for the European Union (EU-28). Their dataset considered fossil fuels, and a total of 40 non-fuel minerals.
5. Results
5.1. Exergy Cost of Bioproducts
In general, resources consumed in agricultural processes are the highest contributors to the exergy cost (κ value). For first generation bio-energies 7 to 45 percent of the exergy input is captured in the final product. For second generation the exergy efficiency increases to 76 percent.
Table 2 presents the average κ value of the different bio-products evaluated from “crop-to-fuel“, expressed in MJ of natural resources consumed (CExC) per MJ bioproduct. It also presents the variability of the average results when more than one study has been considered. There is a large variation among the κ values for specific types of primary and secondary bio-energy carriers as they depend on the type of crop, or waste, used in the production. The lowest values are those related to bioproducts derived from waste, since the exergy consumed prior to disposal was allocated to the crop’s primary use. The largest value is that of methanol, derived from wood, because of the complexities involved in the refining process.
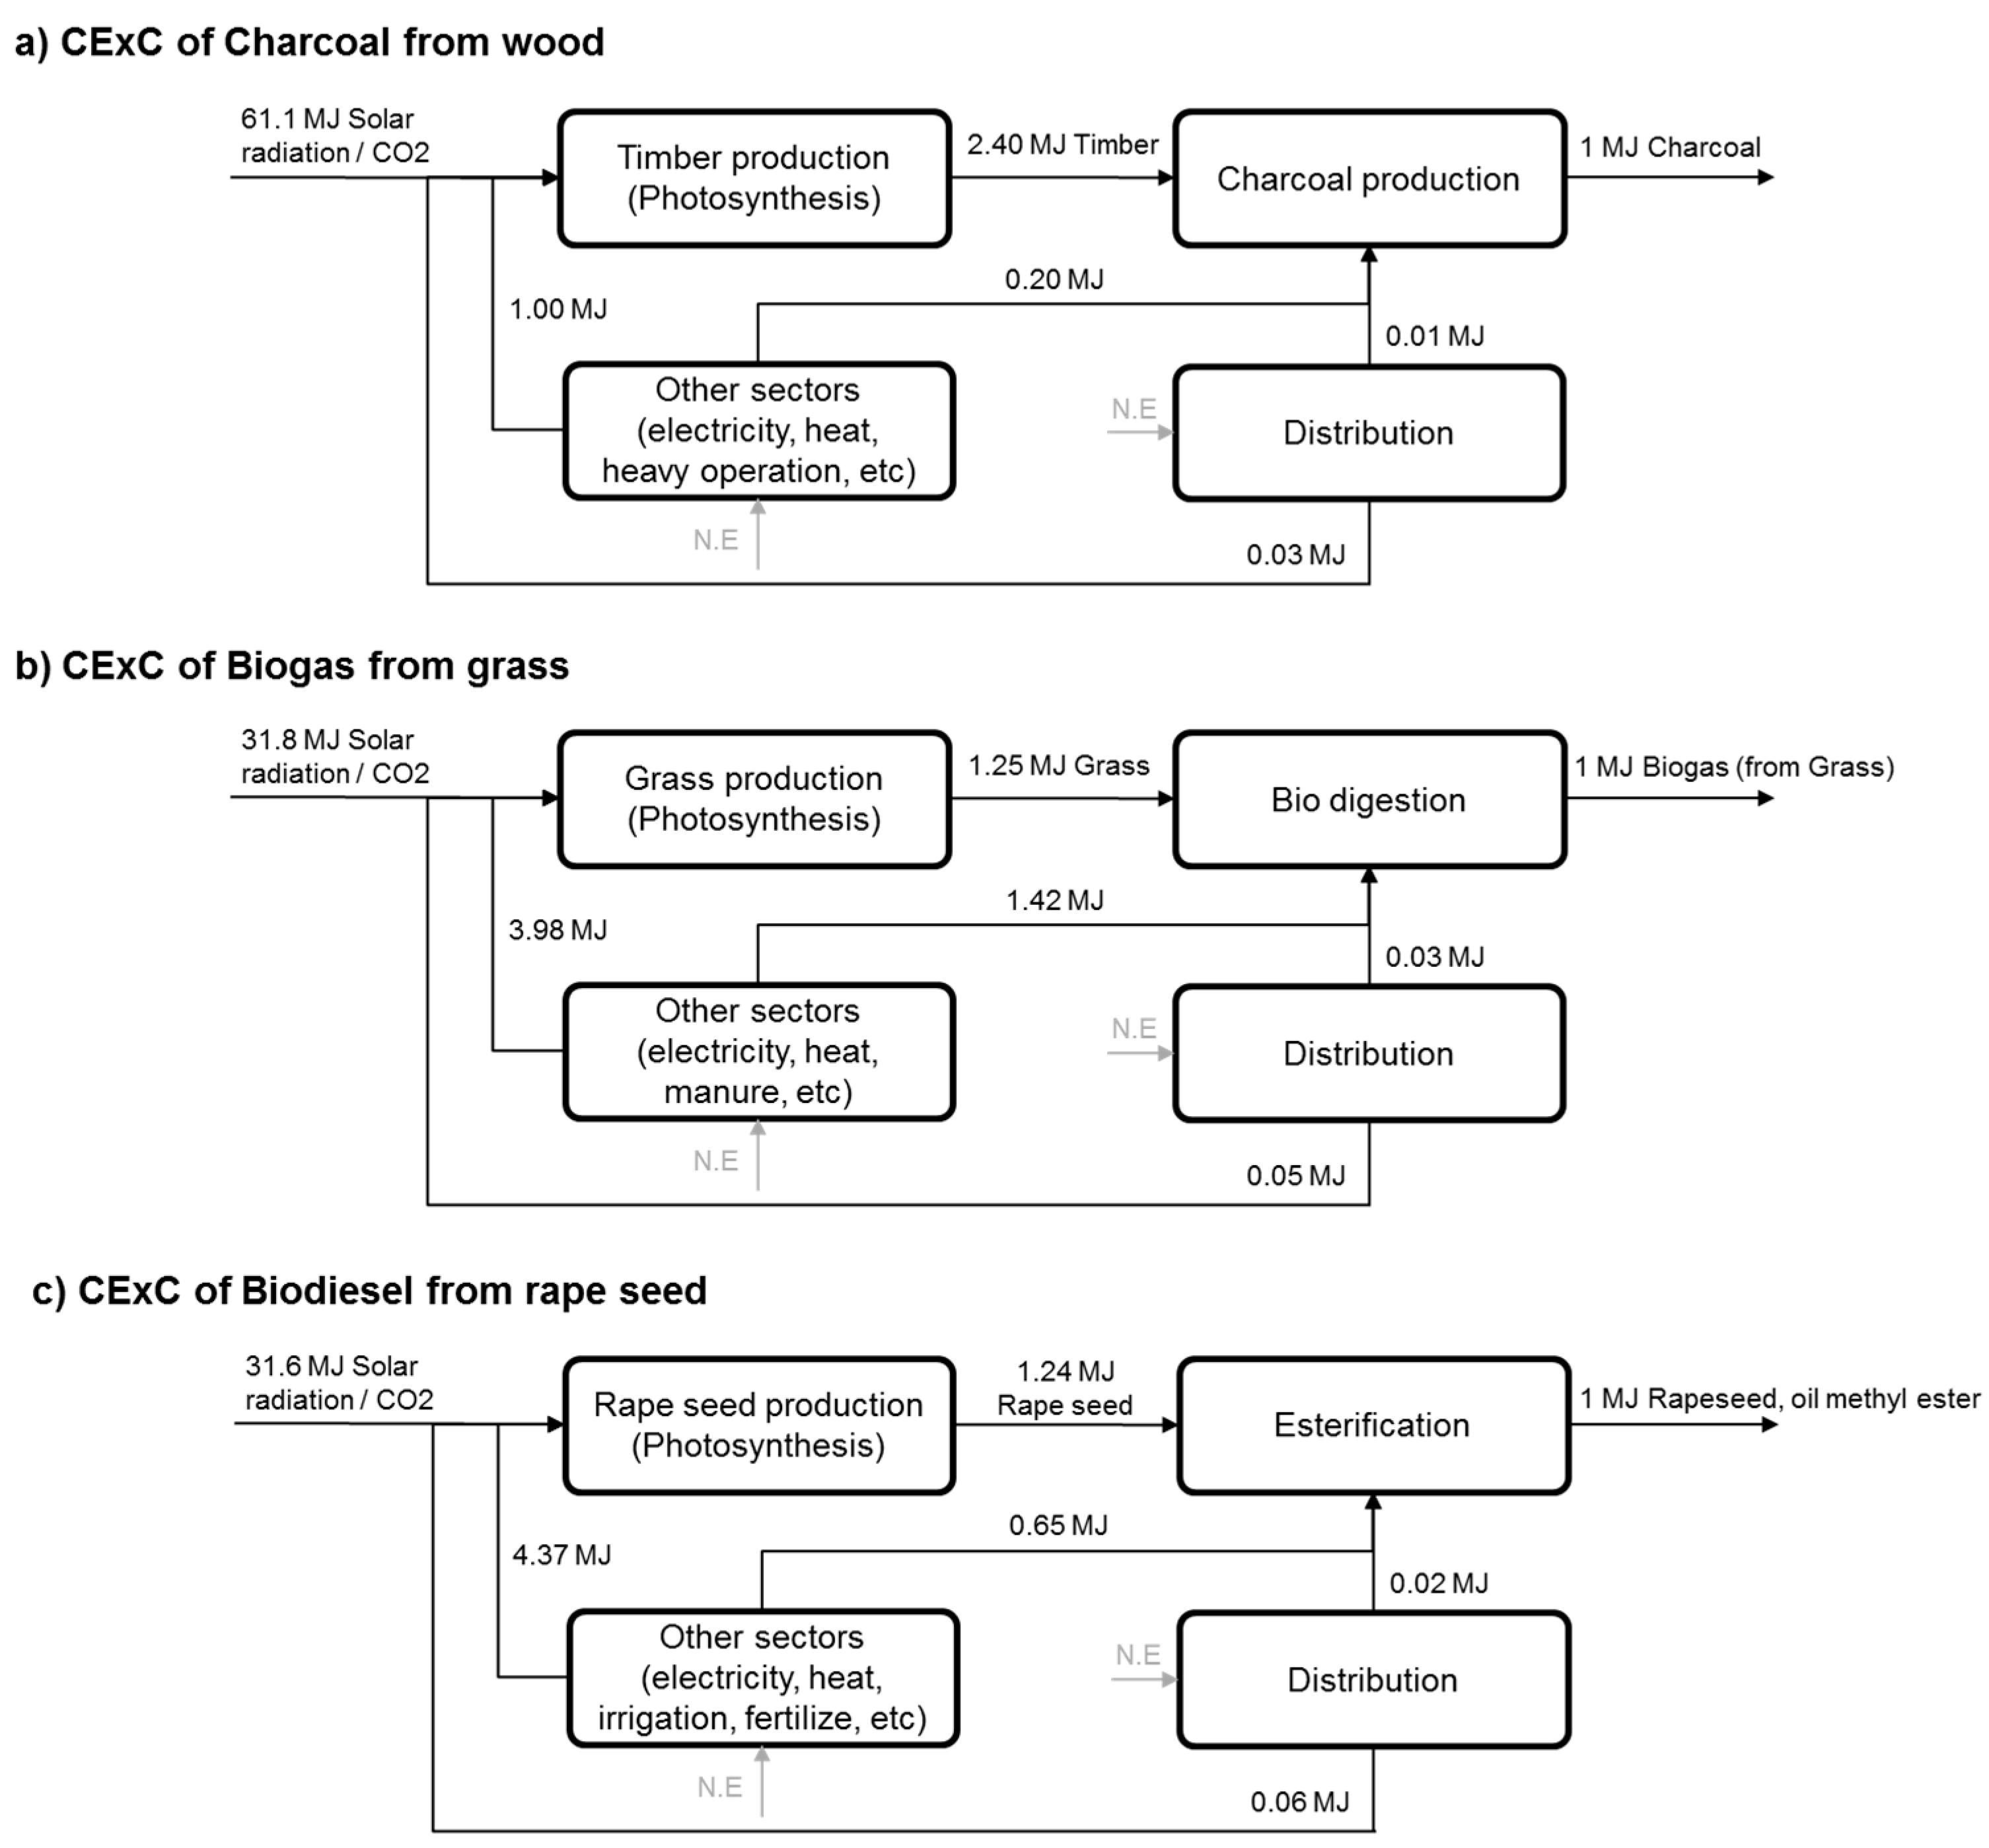
Likewise, the minimum and maximum exergy cost value for each individual fuel type occurs because of the different crops involved in the process. For bioethanol, the lowest exergy cost is derived from corn and the highest from potatoes. For biodiesel, the minimum value corresponds to soybeans and the maximum to rapeseed. For biogas, the minimum value is that derived from biowaste and the highest from grass. For other types of bio-product the difference is insignificant. Figure 5 shows examples of CExC flows for each fossil fuel substitute from “solar radiation to fuel”.
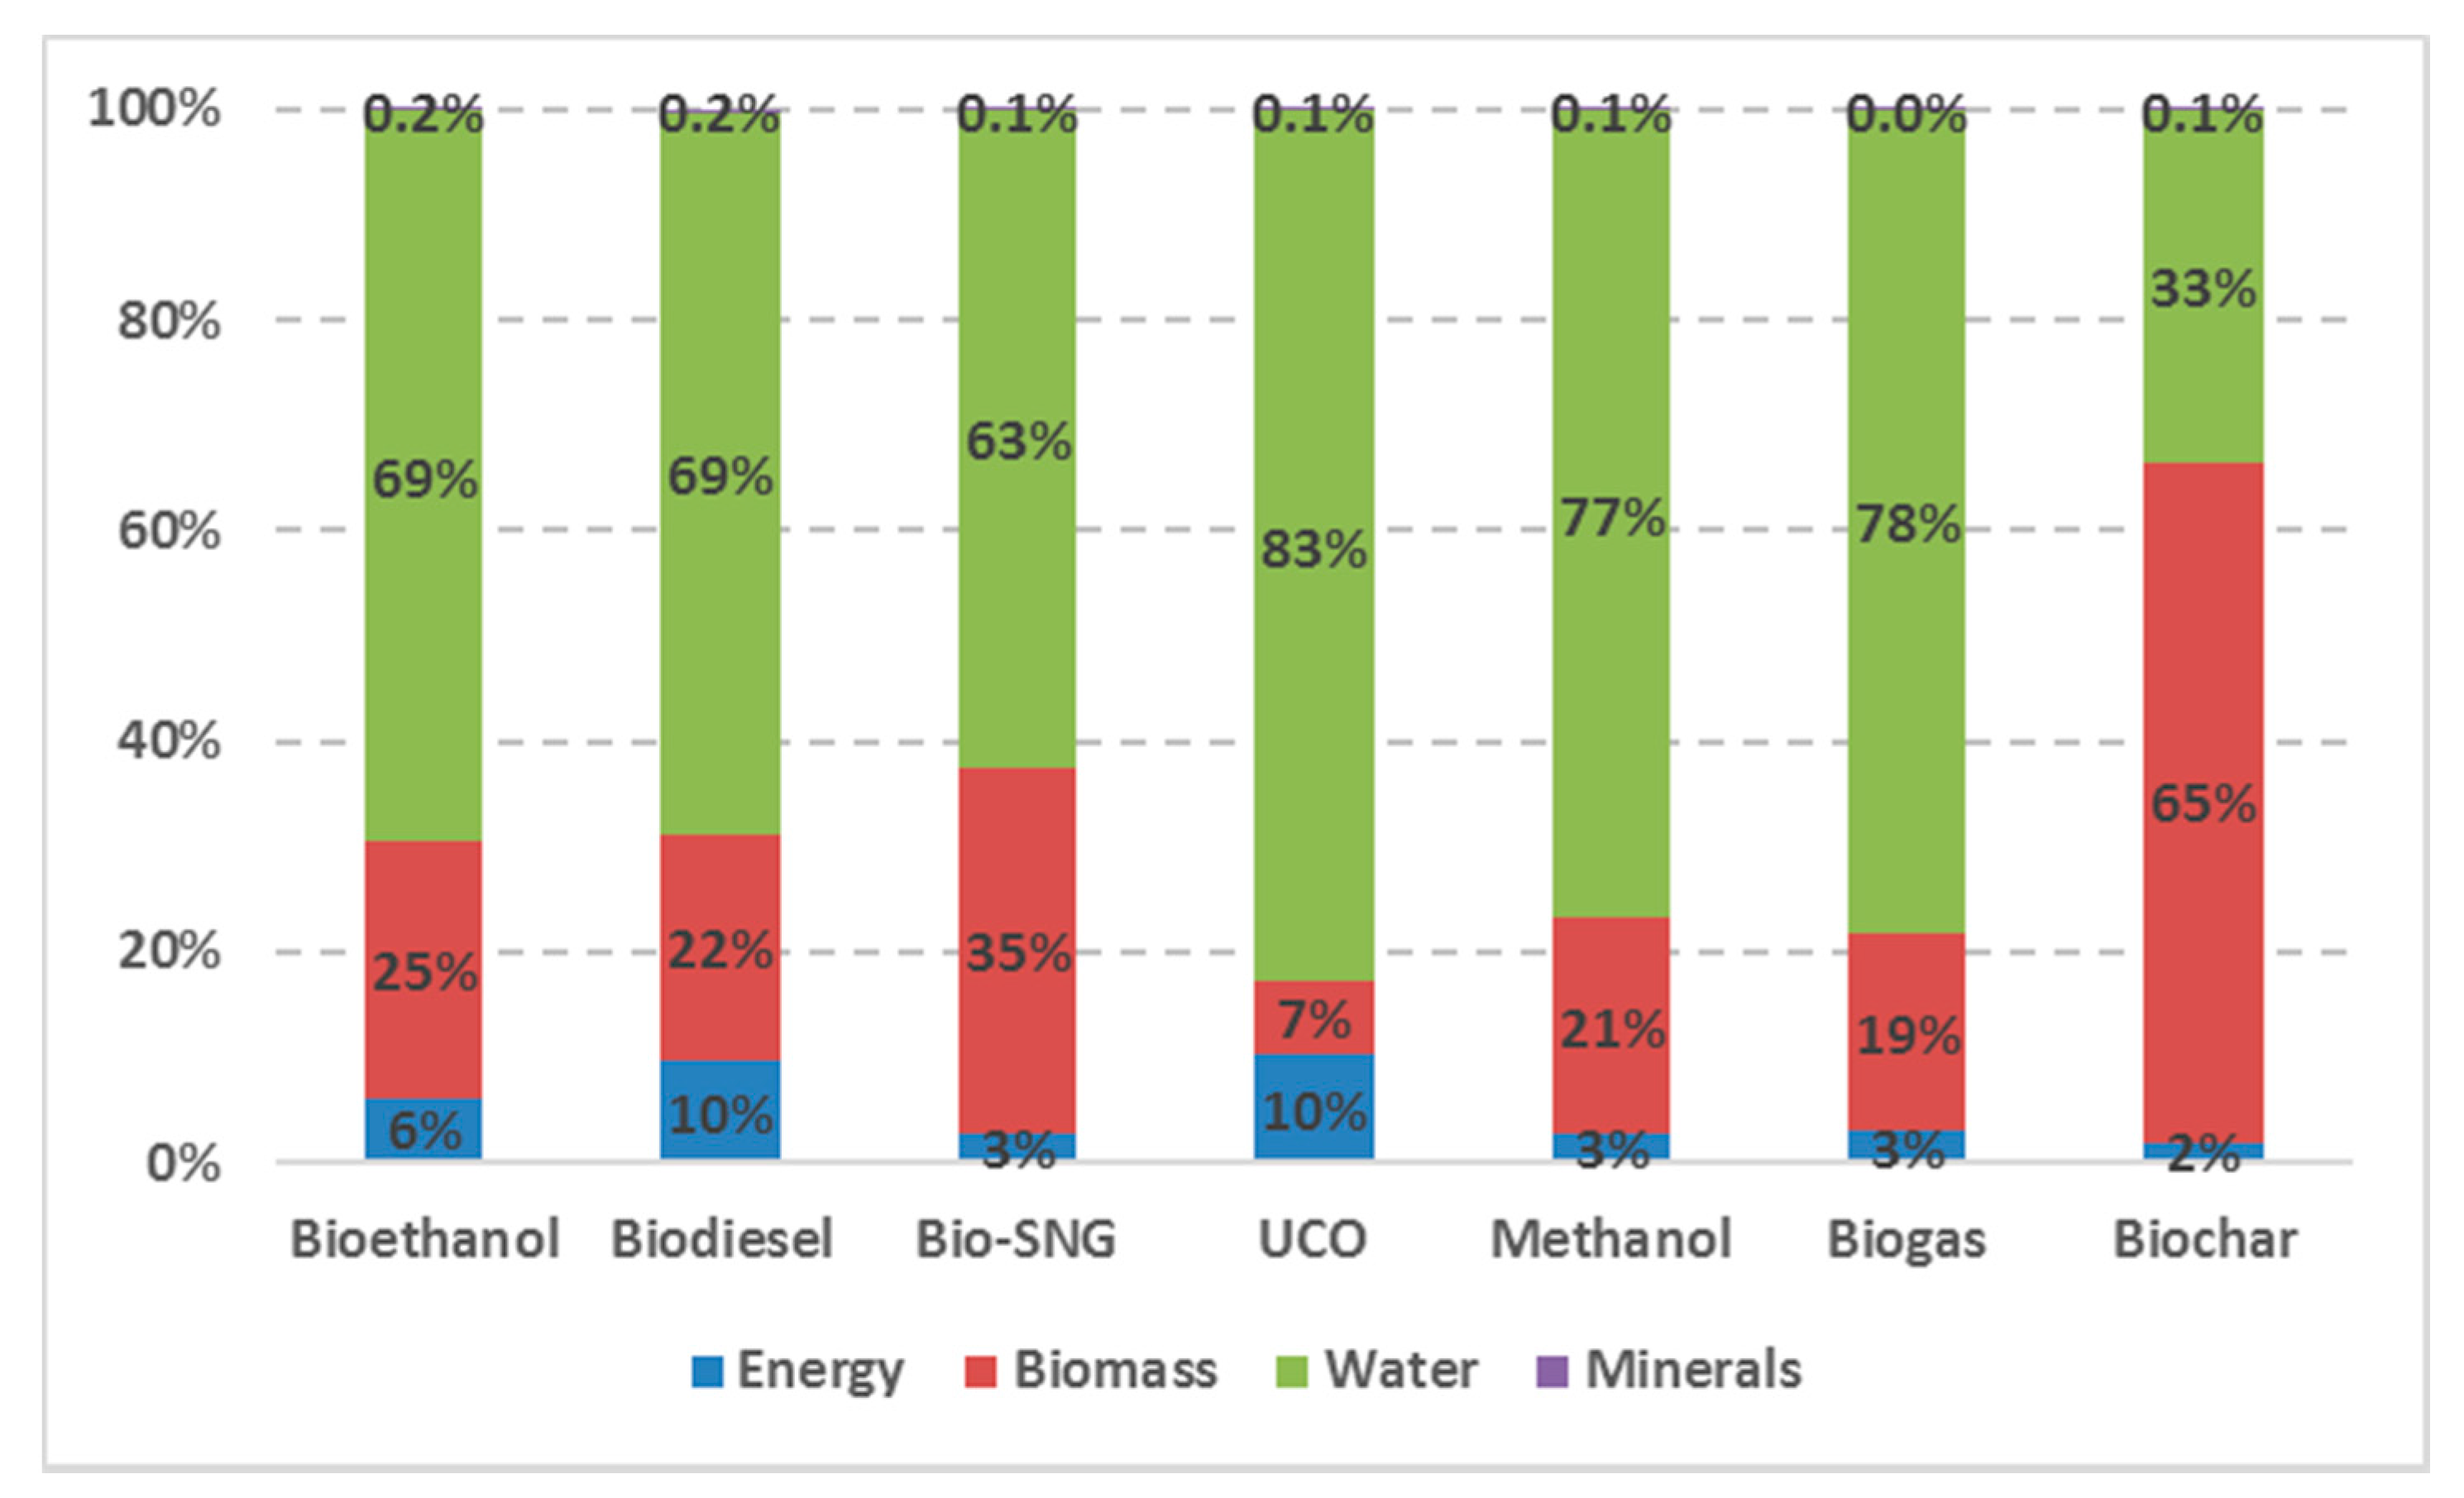
Figure 6 summarises the origin of the environmental resources consumed in the bioproduction processes into four categories. The calculation of the exergy cost for each category takes into consideration the following: fertilizer and pesticide production and application, the manufacture of farm machinery and the fuels used to power them, water irrigation, and the various steps involved in bio-refinery, amongst others.
With the exception of biochar, irrigation needs calculated under the “water” category make up the majority of the exergy cost. UCO (used cooking oil), with the lowest overall exergy cost, still has a high proportion of its exergy cost linked to water. This is not because of irrigation but rather the washing of biodiesel as part of the alkali-catalysed transesterification process. It should be noted that solar radiation captured in photosynthesis (“crop to fuel”) is included in the calculations that come under the “biomass” category.
5.2. ERC of Fossil Fuels
Table 3 shows the exergy consumed by Nature and society to obtain 1 MJ equivalent of fuel. This exergy cost takes into account the entire life cycle from “solar radiation to fuel”. From solar radiation to biomass is the “photosynthesis” stage, while from biomass to fuel is the “bioproduction” stage (Figure 7). The ERC of oil expresses the weighted exergy cost of all the bioproducts that correspond to the fractions that constitute a barrel of oil. Natural gas’ ERC is associated with the exergy cost of biogas. Coal’s ERC corresponds to that of biochar. The total ERC value presented in Table 3 is the sum of the exergy cost of photosynthesis with the exergy cost of energy, minerals and water (Figure 7).
The values in Table 3 are much higher than values presented in Table 2 because 81 to 94 percent of the total ERC for bio-products is incurred at the “photosynthesis” stage, due to the low efficiency of converting solar radiation to biomass (3.9 percent). In the last column of Table 3 the unit MJ/MJ is transformed into GJ/tonne, using the higher heating value (HHV) of each conventional fossil fuel. This allows for a comparison between the 54 non-fuel minerals calculated by Valero and Valero [6] with the fossil fuel calculations presented here. In their book [6], they stated the respective average HHVs of coal, oil and natural gas as 22,692 kJ/kg, 45,664 kJ/kg and 39,394 kJ/Nm3 (35,533 kJ/kg).
The method presented is an improvement and more detailed version of the preliminary calculations presented in Whiting et al. [8,21]. The most significant difference is that the simplified assumption that 1 MJ of biofuel, would require 1 MJ of biomass has been removed and replaced with a more specific calculation, according to the exact bio-product manufactured. A comparison of this paper with [8] shows that the ERC of coal and oil increased significantly, whilst that of gas has reduced.
5.3. Case Studies
Valero and Valero [6] evaluated world mineral depletion from 1900 to 2008. The total amount was 5.11 × 10⁵ Mtoe. The latter is shown in column 1 of Figure 8, where the non-fuel minerals constitute 19.8 percent of the total ERC. Fuels, calculated via the HHV, composed 80.2 percent. Figure 8 indicates that their method, compared to our alternative, sub-estimates the ERC forty-seven-fold, on average (obtained by dividing total of column 3 by 1). Figure 8 also shows that the ERC of non-fuel minerals, when calculated with our alternative method, accounts for only 0.5 percent of the new total (1.93 × 10⁷ Mtoe). This is because the HHV does not consider the exergy required by Nature to create what society uses as resources, something which Valero and Valero [6] refer to as the “exergy bounty”, or “exergy bonus”.
Even if one does not consider photosynthesis, our results show that the ERC of fuels is still underestimated by 4.57 times if the HHV is used (obtained by dividing total of column 2 by 1). It is also worth stating that whilst the specific ERC (MJ/MJ) for some non-fuel minerals, such as gold (583,668 GJ/tonne) is higher than coal, gas and oil, the exergy required to replace all the fossil fuels consumed globally is higher than that for all non-fuels, due to the quantities involved.
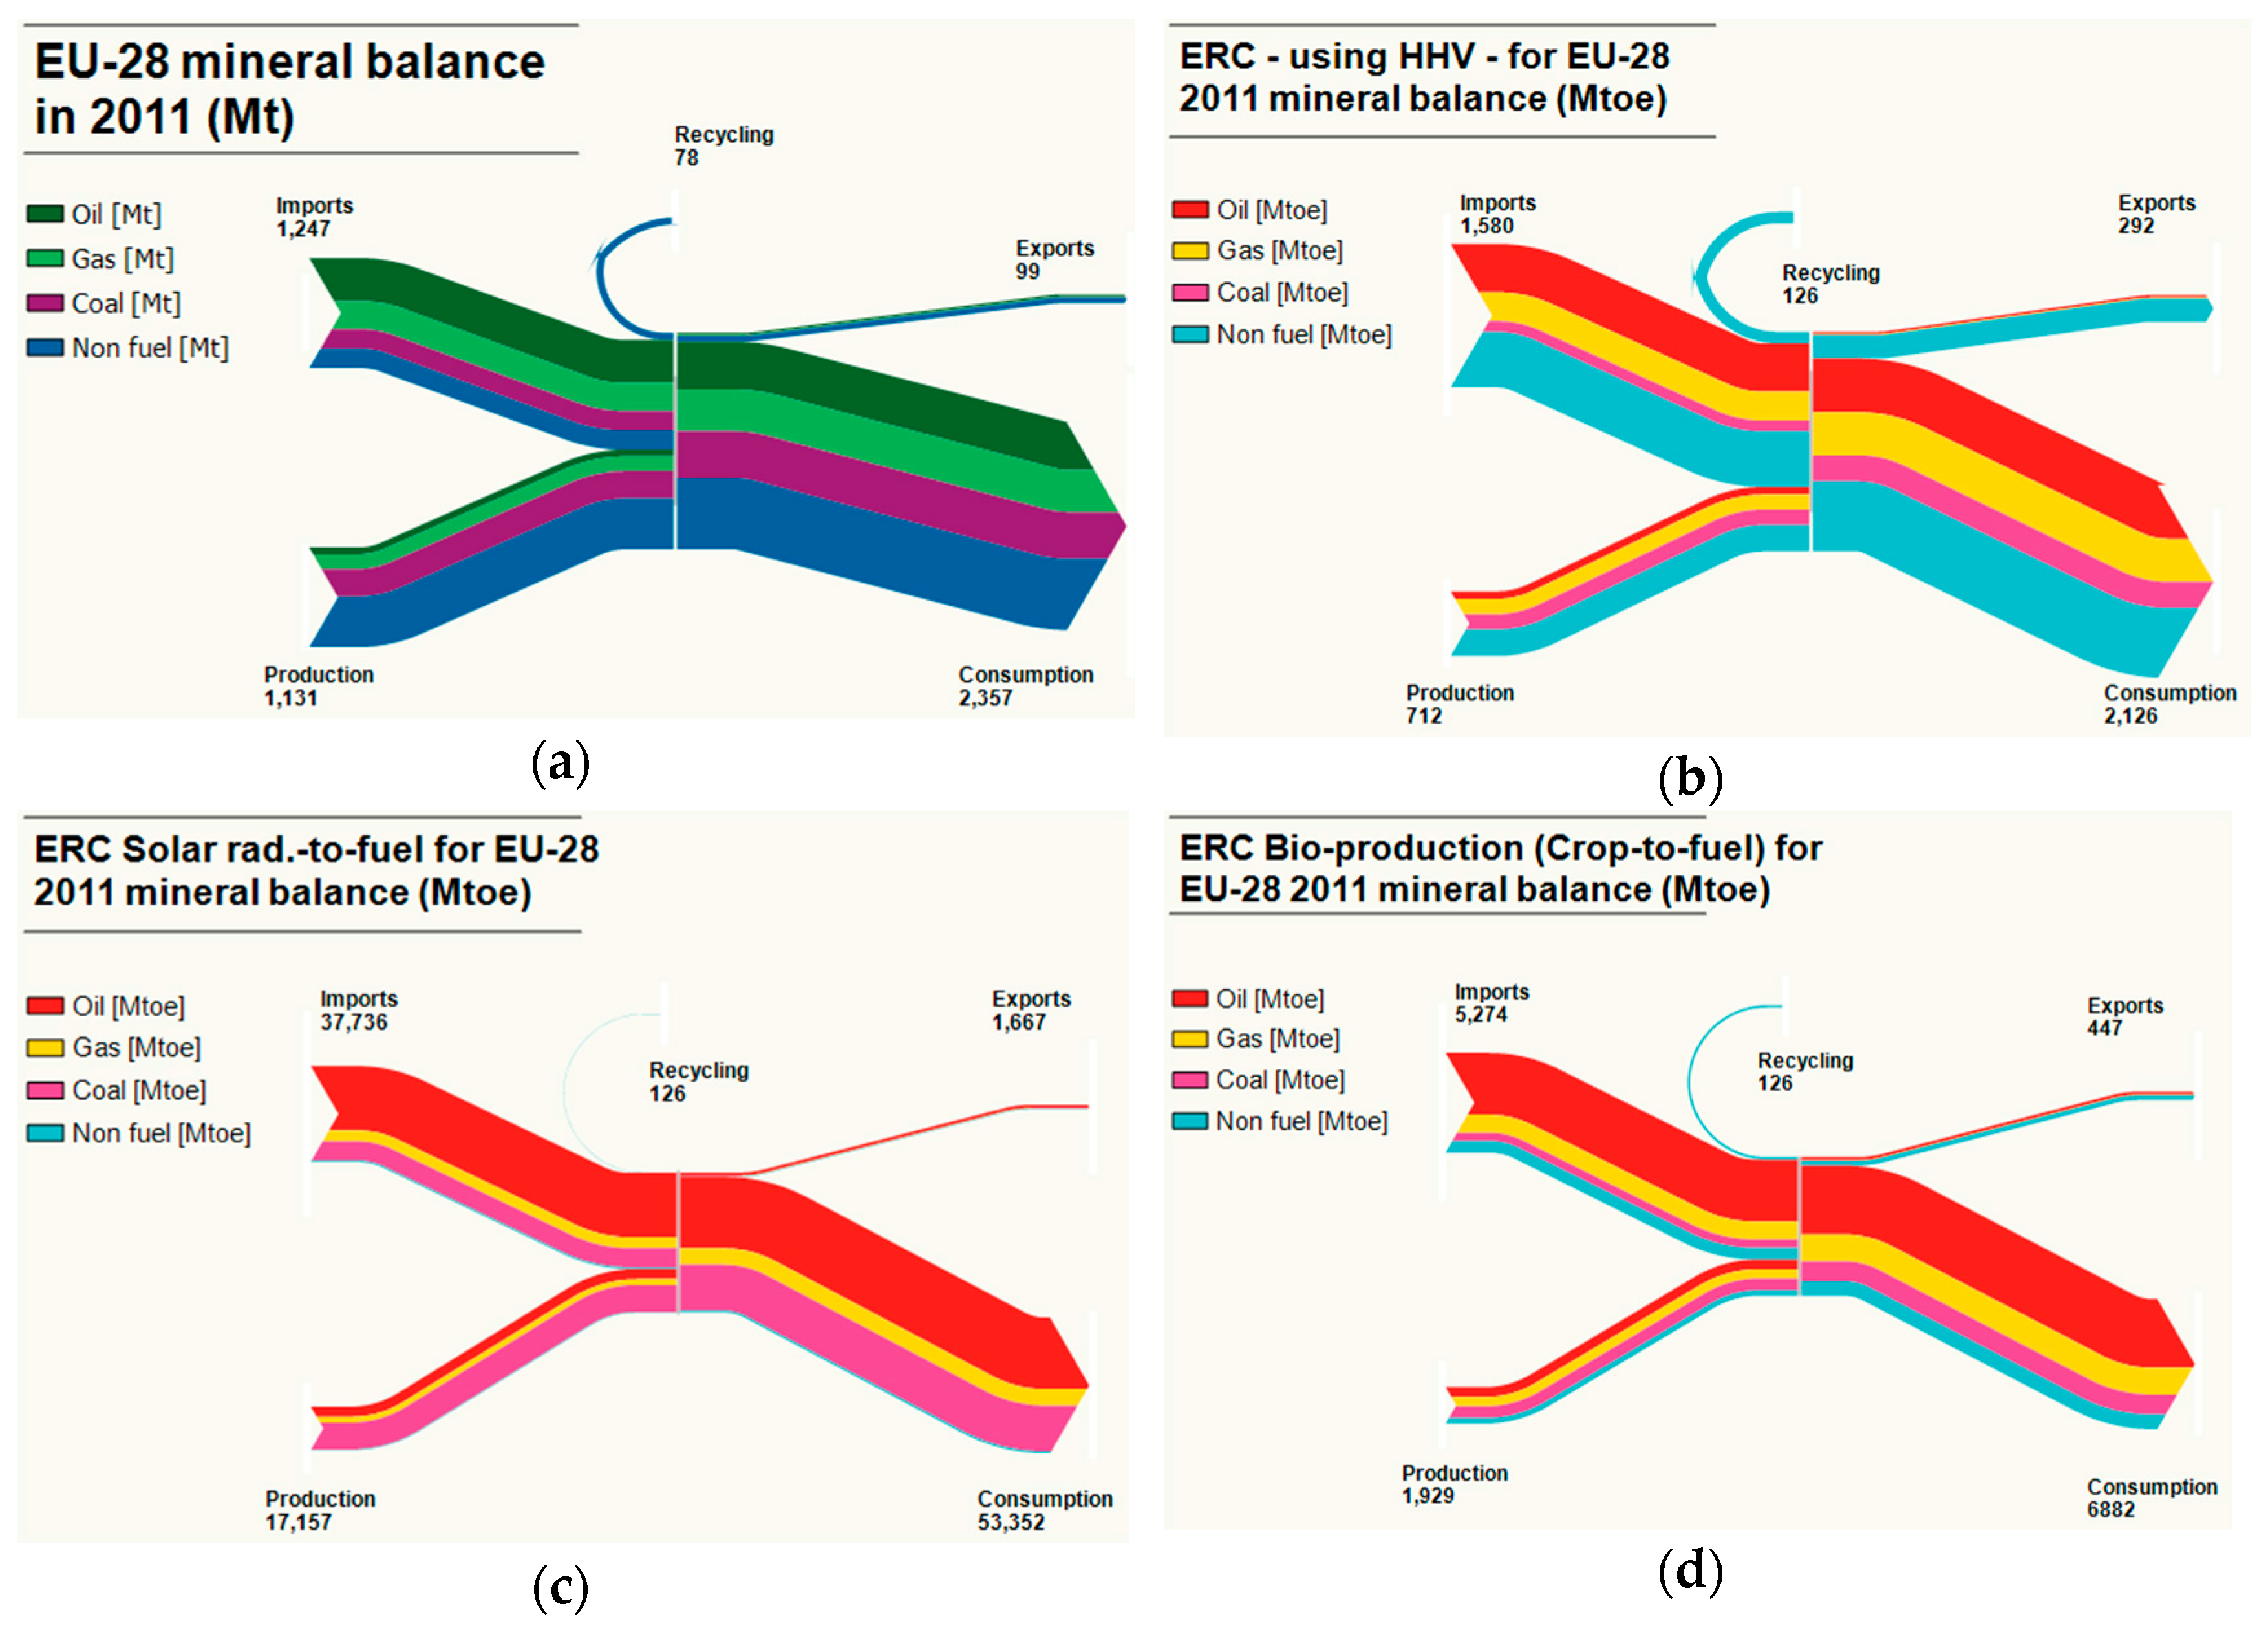
Calvo et al.’s. [14] European Union (EU-28) case study results are presented in the form of a Sankey diagram (Figure 9a,b). In their paper, the ERC is approximated using the HHV because fuel minerals, under the original theory, are non-substitutable. The problem is that under this assumption the real exergy cost of fuels would be infinite and not 0.76, as they suggest.
Consequently, any mineral policy drawn up would, in downplaying the weight of fossil fuels, gravely miss the significance of investing in alternative technologies and innovative practices that cut fuel use. Once again, when the ERC of fuel minerals is calculated via the alternative pathway, any exergy costs of non-fuels are shown to be negligible (Figure 9c,d). That is of course not to say that non-fuel minerals are not important as difficulties in substitutability make their demand relatively inelastic [79]. Phosphate rock, for example, has one of the lowest replacement costs of all elements considered (0.4 GJ/tonne) but is very difficult to substitute. However, the ERC is a measure of depletion, and not substitutability [8].
6. Discussion
6.1. The Need for a Paradigm Shift in the ERC Concept
As an indicator to measure the sustainability of resource depletion, the ERC states the physical and economic costs of making a fuel and non-fuel resource available to society, not just from a natural deposit, but from our waste streams and our Earth’s sinks (landfills, atmosphere, and polluted oceans), relative to a depleted Earth (Figure 3). But does this go far enough? Is this what we want to evaluate if the point of measuring resource depletion is to achieve the Brundtland definition of sustainable development?
For one thing, the ERC does not consider the potential detrimental impact that mining and hydrocarbon operations have on human health, biodiversity or ecosystem services. Contrast that to the water footprint developed by Hoekstra and Chapagain [81,82] and Pfister et al. [83] as a policy tool used to look at how abiotic depletion reduces ecosystem productivity and societal wellbeing (with regards to health and access to potable water). This raises the question as to the purpose of the ERC and its contribution to the sustainability discourse.
The exact nature of an LCA, for example, will depend on the practitioner’s stance relative to the problem of depletion. In order to defend the inventory, functional unit, scope and assumptions, the researcher should first define their priorities and purpose (they cannot measure infinite variables). In other words, and with regards to the ERC’s use, should society worry about the depletion of the intrinsic value of a mineral and geological patrimony? Or should one merely regard depletion as a concern when there are insufficient resources to cover an actual, or potential, socioeconomic function or preference? The nature of the question will change the midpoint and end point indicators of interest. These in turn will depend on whether the study is focused on the availability of a particular resource in a given time period or geographical location, or the consequences of not having a resource, in terms of societal wellbeing and consumer choice, rather than the absence of a given mineral per se.
The original ERC stated the cost, in a non-arbitrary way, that the current generation would have to pay in order to reverse the mining and beneficiation process and effectively place a mineral back into its original deposit, using current best available technology [15] (p. 860). However, as alluded to earlier, this is not the cost current generations should pay to ensure that future generations have access to resources. Firstly, unless we are trying to preserve geological/mineral heritage the chemical composition of a resource is irrelevant to a meaningful discussion on sustainability. Current generations do not have to fulfil the tenants of sustainable development by providing future generations with oil. Oil is only as useful as the services that it provides. For current generations to leave future ones with at least the same quality of life they must ultimately leave them with a healthy natural environment along with the technological developments and the technical capabilities required to obtain a resource that enables them to experience the privileges enjoyed today because of fossil fuels [84]. Secondly, there is no benefit to placing oil back into a deposit as society neither wants nor needs to return oil to its original geological formation. Rather society requires easy access to oil in a useable deposit (its storage conditions beyond health, safety and economics are neither here nor there). Thirdly, there is no reason to reverse the mining and beneficiation process, for reasons linked to the second point and as the case of biofuels demonstrates. These issues point to the need to reframe the ERC so that one looks at the services that materials provide, rather than the materials themselves.
Using biofuels to create an alternate pathway within the ERC concept forces a paradigm shift towards looking at function. If ERC is a measure of sustainability, and an indicator to be used by politicians and industry to take hard line decisions, it is important that sustainability is seen in those terms. The ERC has an important contribution because, by calculating the replacement cost, it is asking society to take a cautious approach to extraction, to minimise material use and close energy and material cycles, in a way that provides future generations with the resources they need to prosper. However, this does not answer ethical tension points such as is it reasonable to expect future generations to sacrifice land to plant palm oil once current generations have burnt all the fossil fuels?
6.2. The Sustainability of Replacing Fossil Fuels with Biological Equivalents
We would like to make clear that this paper is not stating that fossil fuel burning and any subsequent replacement with biological equivalents is a sustainable or desirable end point. The use of biomass and biofuels, particularly, is already linked to notable drawbacks and uncertainties [85]. These include threats to biodiversity, water scarcity and contamination and the utilisation of fertile soils currently sustaining food production [86,87,88]. And as the World Resources Institute points out, even if all the world’s harvested biomass was used for energy, this would provide just 20 percent of the world’s energy needs in 2050 [89]. In other words, there is not enough fertile land to sustain current energy demand, and even if only five percent were met there would be severe implications on food production and societal equity. This is just one of the ethical issues surrounding first, and some second generation, biomass and biofuels that are already being raised and discussed in the mainstream media and at policy level [90]. This may change if algae are able to produce commercial quantities of biodiesel. Second generation biofuels derived from cooking oil and agro-waste should also be promoted to meet energy needs without affecting food supply [91]. Substituting fossils fuels with bio-alternatives does have its positive side in that it enables economic growth to continue by reducing their consumption. This allows more time for technological innovation to lead humanity towards a long term solution to meet their energy needs (fission technology could be one example), until no substitute is found for a different critical resource (that may or may not be related to energy needs). Furthermore, if upon exhaustion of commercially viable fossil fuel deposits alga could generate biodiesel on a commercial scale (current tests are at trial stages), issues such as land space, competition with food production and freshwater scarcity may become less critical. In addition, alga could mean that the mass utilisation of private electric vehicles, which demand rare earth elements, may be avoided. Such elements would then be diverted to other applications such as telecommunications and IT, thus reducing, although not removing, rare earth resource depletion. Any further discussion of these issues is beyond the scope of demonstrating the physical feasibility of bio-equivalents fulfilling of fossil fuel function as a technical issue within the exergy replacement cost calculation.
7. Conclusions
The ERC approach highlights the physical cost of re-capturing and re-concentrating a resource that has been used and subsequently dispersed by anthropogenic activity. It was originally only applied to non-fuel minerals because of the assumption that in order to calculate a fuel’s ERC one would need to re-convert the carbon dioxide released, on fossil fuel combustion, back into a fuel of the same chemical composition. This then led to fossil fuels either being ignored within the ERC calculation or a fuel’s HHV being used as a proxy, which is not a consistent method.
In this paper, we sought to rectify the theoretical tensions present in the ERC theory by reframing the depletion problem and standardising the methodological steps and calculations for both fuel and non-fuel minerals. Under the assumption that planting fuel crops combined with bio-energy production is the best technology available, we showed how the ERC approach may be used to estimate the cost of closing the carbon loop, via photosynthetic capture of atmospheric CO2 and its conversion into a biomass, which can then be directly burnt or converted into a different form, such as biofuel.
The use of, say biofuels, as a measure of a fuel’s ERC instead of other technologies (such as solar panels) tied the cradle to grave LCA to the grave to cradle ERC. Furthermore, the resulting LCA boundary expansion from “solar radiation to fuel” took into consideration a huge exergy source that had been previously ignored. Employing this new method, we discovered that using the HHV as a proxy caused, on average, a forty-seven-fold underestimation of the physical cost of fossil fuel depletion when considering solar radiation to fuel and approximately a fivefold sub-estimation when going from crop to fuel. The new method also led to a paradigm shift towards an ERC approach focused on function instead of chemical composition. The idea of preserving a chemical composition is not relevant and is a redundant barrier to the further development of the ERC calculation and its role in shaping environmental debates.
Supplementary Materials
The following are available online at www.mdpi.com/1996-1944/10/7/979/s1.
Acknowledgments
We acknowledge the support of Fundação para a Ciência e a Tecnologia (FCT) and MIT Portugal Program through the grants PD/BP/113742/2015 and PD/BD/128038/2016; and the support of Universidad Castilla-La Mancha (UCLM) in making this research possible. We thank Hanife Moumin for her editorial skills and advice.
Author Contributions
Kai Whiting and Luis Gabriel Carmona conceived this study, led the narrative framing for the paper and coordinated its writing. All co-authors provided substantial inputs to writing and significant feedback on numerous drafts.
Conflicts of Interest
The authors declare no conflict of interest.
References
- Krausmann, F.; Wiedenhofer, D.; Lauk, C.; Haas, W.; Tanikawa, H.; Fishman, T.; Haberl, H. Global socioeconomic material stocks rise 23-fold over the 20th century and require half of annual resource use. Proc. Natl. Acad. Sci. USA 2017, 114, 1880–1885. [Google Scholar] [CrossRef] [PubMed]
- Raworth, K. Doughnut Economics: Seven Ways to Think Like a 21st-Century Economist; Chelsea Green Publishing: Chelsea, VT, USA, 2017. [Google Scholar]
- Valero, A.; Valero, A. From grave to cradle. J. Ind. Ecol. 2013, 17, 43–52. [Google Scholar] [CrossRef]
- Valero, A.; Botero, E.; Valero, A. Global Exergy Accounting of Natural Resources. In Exergy, Energy System Analysis, and Optimization, 1st ed.; Frangopoulos, C.A., Ed.; Eolss Publishers Co. Ltd: Oxford, UK, 2009; Volume 1, pp. 409–420. [Google Scholar]
- Valero, A.; Valero, A. Thermodynamic rarity and the loss of mineral wealth. Energies 2015, 8, 821–836. [Google Scholar] [CrossRef]
- Capilla, A.V.; Delgado, A.V. Thanatia: The Destiny of the Earth’s Mineral Resources: A Thermodynamic Cradle-to-Cradle Assessment, 1st ed.; World Scientific Publishing: Toh Tuck Link, Singapore, 2014; p. 628. ISBN 978-9814273930. [Google Scholar]
- Brundtland, G.H. Report of the World Commission on Environment and Development: “Our Common Future”. Available online: http://www.un-documents.net/our-common-future.pdf (accessed on 10 July 2017).
- Whiting, K.; Carmona, L.G.; Sousa, T. A review of the use of exergy to evaluate the sustainability of fossil fuels and non-fuel mineral depletion. Renew. Sustain. Energy Rev. 2017, 76, 202–211. [Google Scholar] [CrossRef]
- Cleveland, C.J.; Costanza, R.; Hall, C.A.; Kaufman, R. We approach macroeconomics from a thermodynamic perspective that emphasizes the production of goods, rather than the neoclassical perspective that emphasizes the exchange of goods according to. Science 1984, 225, 890. [Google Scholar] [CrossRef] [PubMed]
- Carmona, L.G.; Whiting, K. Pandora y Thanatia: Una visión termodinámica del agotamiento de los recursos minerales. Gestión y Ambiente 2014, 17, 119–127. [Google Scholar]
- Carmona, L.G.; Whiting, K.; Valero, A.; Valero, A. Colombian mineral resources: An analysis from a Thermodynamic Second Law perspective. Resour. Policy 2015, 45, 23–28. [Google Scholar] [CrossRef]
- Valero, A.; Valero, A. Physical geonomics: Combining the exergy and Hubbert peak analysis for predicting mineral resources depletion. Resour. Conserv. Recycl. 2010, 54, 1074–1083. [Google Scholar] [CrossRef]
- Valero, A.; Valero, A. A prediction of the exergy loss of the world’s mineral reserves in the 21st century. Energy 2011, 36, 1848–1854. [Google Scholar] [CrossRef]
- Calvo, G.; Valero, A.; Valero, A. Material flow analysis for Europe: An exergoecological approach. Ecol. Indic. 2016, 60, 603–610. [Google Scholar] [CrossRef]
- Calvo, G.; Valero, A.; Carmona, L.G.; Whiting, K. Physical Assessment of the Mineral Capital of a Nation: The Case of an Importing and an Exporting Country. Resources 2015, 4, 857–870. [Google Scholar] [CrossRef]
- Calvo, G.; Valero, A.; Valero, A.; Carpintero, Ó. An exergoecological analysis of the mineral economy in Spain. Energy 2015, 88, 2–8. [Google Scholar] [CrossRef]
- Valero, A.; Valero, A.; Arauzo, I. Evolution of the decrease in mineral exergy throughout the 20th century. The case of copper in the US. Energy 2008, 33, 107–115. [Google Scholar] [CrossRef]
- Valero, A.; Carpintero, Ó.; Valero, A.; Calvo, G. How to account for mineral depletion. The exergy and economic mineral balance of Spain as a case study. Ecol. Indic. 2014, 46, 548–559. [Google Scholar] [CrossRef]
- Valero, A.; Valero, A.; Calvo, G. Using thermodynamics to improve the resource efficiency indicator GDP/DMC. Resour. Conserv. Recycl. 2015, 94, 110–117. [Google Scholar] [CrossRef]
- Valero, A.; Valero, A.; von Gries, N. “Composed thermodynamic rarity” of the materials in electric and electronic equipment. In Proceedings of the 29th International Conference on Efficiency, Cost, Optimization, Simulation and Environmental Impact of Energy Systems, Portorož, Slovenia, 19–23 June 2016. [Google Scholar]
- Whiting, K.; Carmona, L.G.; Sousa, T. Bio-products: A new way to calculate fossil fuels in the grave to cradle exergy assessment. In Proceedings of the 29th International Conference on Efficiency, Cost, Optimization, Simulation and Environmental Impact of Energy Systems ECOS 2016, Portorož, Slovenia, 19–23 June 2016. [Google Scholar]
- Szargut, J. Exergy Method: Technical and Ecological Applications; WIT Press: Southampton, UK, 2005; Volume 18. [Google Scholar]
- Gaudreau, K.; Fraser, R.A.; Murphy, S. The characteristics of the exergy reference environment and its implications for sustainability-based decision-making. Energies 2012, 5, 2197–2213. [Google Scholar] [CrossRef]
- Zhou, J.; Ma, S.; Hinman, G.W. Ecological exergy analysis: A new method for ecological energetics research. Ecol. Model. 1996, 84, 291–303. [Google Scholar] [CrossRef]
- Lems, S.; Van Der Kooi, H.J.; De Swaan Arons, J. Exergy analyses of the biochemical processes of photosynthesis. Int. J. Exergy 2010, 7, 333–351. [Google Scholar] [CrossRef]
- Beal, C.M.; Hebner, R.E.; Webber, M.E. Thermodynamic analysis of algal biocrude production. Energy 2012, 44, 925–943. [Google Scholar] [CrossRef]
- Silva, C.S.; Seider, W.D.; Lior, N. Exergy efficiency of plant photosynthesis. Chem. Eng. Sci. 2015, 130, 151–171. [Google Scholar] [CrossRef]
- Keller, J.U. Thermodynamic Analysis of Photosynthesis. Available online: http://www.mb.uni-siegen.de/tts/personen/juk/biothermodynamik/photosynthese_neu.pdf (accessed on 7 July 2017).
- Albarrán-Zavala, E.; Angulo-Brown, F. A simple thermodynamic analysis of photosynthesis. Entropy 2007, 9, 152–168. [Google Scholar] [CrossRef]
- Sorgüven, E.; Özilgen, M. Thermodynamic efficiency of synthesis, storage and breakdown of the high-energy metabolites by photosynthetic microalgae. Energy 2013, 58, 679–687. [Google Scholar] [CrossRef]
- SourceOECD (Online Service). World Energy Outlook. International Energy Agency. Available online: http://www.worldenergyoutlook.org/weo2013/ (accessed on 7 July 2017).
- BP. BP Energy Outlook 2035. January 2014. Tech. Rep.. Available online: http://www.bp.com/content/dam/bp/pdf/energy-economics/energy-outlook-2016/bp-energy-outlook-2014.pdf (accessed on 10 July 2017).
- Stocker, T.F.; Qin, D.; Plattner, G.K.; Tignor, M.; Allen, S.K.; Boschung, J.; Midgley, B.M. IPCC, 2013: Climate Change 2013: The Physical Science Basis. Contribution of Working Group I to the Fifth Assessment Report of the Intergovernmental Panel on Climate Change. Available online: http://www.ipcc.ch/report/ar5/wg1/ (accessed on 7 July 2017).
- Mohr, S.H.; Evans, G.M. Long term forecasting of natural gas production. Energy Policy 2011, 39, 5550–5560. [Google Scholar] [CrossRef]
- Mohr, S.H.; Wang, J.; Ellem, G.; Ward, J.; Giurco, D. Projection of world fossil fuels by country. Fuel 2015, 141, 120–135. [Google Scholar] [CrossRef]
- Court, V.; Fizaine, F. Long-Term Estimates of the Energy-Return-on-Investment (EROI) of Coal, Oil, and Gas Global Productions. Ecol. Econ. 2017, 138, 145–159. [Google Scholar] [CrossRef]
- Piekarczyk, W.; Czarnowska, L.; Ptasiński, K.; Stanek, W. Thermodynamic evaluation of biomass-to-biofuels production systems. Energy 2013, 62, 95–104. [Google Scholar] [CrossRef]
- Fick, G.; Mirgaux, O.; Neau, P.; Patisson, F. Using biomass for pig iron production: A technical, environmental and economical assessment. Waste Biomass Valoriz. 2014, 5, 43–55. [Google Scholar] [CrossRef]
- Jahanshahi, S.; Somerville, M.; Deev, A.; Mathieson, J. Biomass: Providing a Low Capital Route to Low Net CO2. Available online: http://www.ieaghg.org/docs/General_Docs/Iron%20and%20Steel%202%20Secured%20presentations/3_1420%20John%20Mathieson.pdf (accessed on 7 July 2017).
- Reichel, T.; Demus, T.; Echterhof, T.; Pfeifer, H. Increasing the sustainability of the steel production in the electric arc furnace by substituting fossil coal with biochar. In Proceedings of the 4th Central European Biomass Conference, Graz, Austria, 16 January 2014. [Google Scholar]
- European Commision (2014) Green Fuel for Steel Furnaces. Available online: https://ec.europa.eu/programmes/horizon2020/en/news/green-fuel-steel-furnaces (accessed on 7 July 2017).
- Hari, T.K.; Yaakob, Z.; Binitha, N.N. Aviation biofuel from renewable resources: Routes, opportunities and challenges. Renew. Sustain. Energy Rev. 2015, 42, 1234–1244. [Google Scholar] [CrossRef]
- Deutsche Welle (2012) Lufthansa Suspends Biofuel Test Flights 12th January 2012. Available online: https://pdfs.semanticscholar.org/a67f/53a767b0585f5d844db5477d2b45df8ec7c4.pdf (accessed on 7 July 2017).
- Kick, T.; Herbst, J.; Kathrotia, T.; Marquetand, J.; Braun-Unkhoff, M.; Naumann, C.; Riedel, U. An experimental and modeling study of burning velocities of possible future synthetic jet fuels. Energy 2012, 43, 111–123. [Google Scholar] [CrossRef]
- Gegg, P.; Budd, L.; Ison, S. The market development of aviation biofuel: Drivers and constraints. J. Air Trans. Manag. 2014, 39, 34–40. [Google Scholar] [CrossRef]
- Osayi, J.I.; Iyuke, S.; Ogbeide, S.E. Biocrude production through pyrolysis of used tyres. J. Catal. 2014, 2014, 386371. [Google Scholar] [CrossRef]
- Marsh, G. Biofuels: Aviation alternative? Renew. Energy Focus 2008, 9, 48–51. [Google Scholar] [CrossRef]
- Zhao, S.; Huang, B.; Ye, X.P.; Shu, X.; Jia, X. Utilizing bio-char as a bio-modifier for asphalt cement: A sustainable application of bio-fuel by-product. Fuel 2014, 133, 52–62. [Google Scholar] [CrossRef]
- Kolokolova, O. Biomass Pyrolysis and Optimisation for Bio-Bitumen. Master’s Thesis, University of Canterbury, Christchurch, New Zealand, 2013. [Google Scholar]
- Guarin, A.; Khan, A.; Butt, A.A.; Birgisson, B.; Kringos, N. An extensive laboratory investigation of the use of bio-oil modified bitumen in road construction. Constr. Build. Mater. 2016, 106, 133–139. [Google Scholar] [CrossRef]
- Ribeiro, L.A.; da Silva, P.P.; Mata, T.M.; Martins, A.A. Prospects of using microalgae for biofuels production: Results of a Delphi study. Renew. Energy 2015, 75, 799–804. [Google Scholar] [CrossRef]
- Pate, R.; Klise, G.; Wu, B. Resource demand implications for US algae biofuels production scale-up. Appl. Energy 2011, 88, 3377–3388. [Google Scholar] [CrossRef]
- Ho, S.H.; Chen, C.Y.; Lee, D.J.; Chang, J.S. Perspectives on microalgal CO2-emission mitigation systems—A review. Biotechnol. Adv. 2011, 29, 189–198. [Google Scholar] [CrossRef] [PubMed]
- Wang, B.; Li, Y.; Wu, N.; Lan, C.Q. CO2 bio-mitigation using microalgae. Appl. Microbiol. Biotechnol. 2008, 79, 707–718. [Google Scholar] [CrossRef] [PubMed]
- Gouveia, L.; Marques, A.E.; Da Silva, T.L.; Reis, A. Neochloris oleabundans UTEX# 1185: A suitable renewable lipid source for biofuel production. J. Ind. Microbiol. Biotechnol. 2009, 36, 821–826. [Google Scholar] [PubMed]
- Gouveia, L.; Oliveira, A.C. Microalgae as a raw material for biofuels production. J. Ind. Microbiol. Biotechnol. 2009, 36, 269–274. [Google Scholar] [CrossRef] [PubMed]
- Li, Y.; Horsman, M.; Wang, B.; Wu, N.; Lan, C.Q. Effects of nitrogen sources on cell growth and lipid accumulation of green alga Neochloris oleoabundans. Appl. Microb. Biotechnol. 2008, 81, 629–636. [Google Scholar] [CrossRef] [PubMed]
- Pruvost, J.; Van Vooren, G.; Cogne, G.; Legrand, J. Investigation of biomass and lipids production with Neochloris oleoabundans in photobioreactor. Bioresour. Technol. 2009, 100, 5988–5995. [Google Scholar] [CrossRef] [PubMed]
- Tornabene, T.G.; Holzer, G.; Lien, S.; Burris, N. Lipid composition of the nitrogen starved green alga Neochloris oleoabundans. Enzym. Microb. Technol. 1983, 5, 435–440. [Google Scholar] [CrossRef]
- Baldisserotto, C.; Popovich, C.; Giovanardi, M.; Sabia, A.; Ferroni, L.; Constenla, D.; Pancaldi, S. Photosynthetic aspects and lipid profiles in the mixotrophic alga Neochloris oleoabundans as useful parameters for biodiesel production. Algal Res. 2016, 16, 255–265. [Google Scholar] [CrossRef]
- Giovanardi, M.; Ferroni, L.; Baldisserotto, C.; Tedeschi, P.; Maietti, A.; Pantaleoni, L.; Pancaldi, S. Morphophysiological analyses of Neochloris oleoabundans (Chlorophyta) grown mixotrophically in a carbon-rich waste product. Protoplasma 2013, 250, 161–174. [Google Scholar] [CrossRef] [PubMed]
- Liao, W.; Heijungs, R.; Huppes, G. Is bioethanol a sustainable energy source? An energy-, exergy-, and emergy-based thermodynamic system analysis. Renew. Energy 2011, 36, 3479–3487. [Google Scholar] [CrossRef]
- Giljum, S.; Burger, E.; Hinterberger, F.; Lutter, S.; Bruckner, M. A comprehensive set of resource use indicators from the micro to the macro level. Resour. Conserv. Recycl. 2011, 55, 300–308. [Google Scholar] [CrossRef]
- Liao, W.; Heijungs, R.; Huppes, G. Thermodynamic resource indicators in LCA: A case study on the titania produced in Panzhihua city, southwest China. Int. J. Life Cycle Assess. 2012, 17, 951–961. [Google Scholar] [CrossRef]
- Bösch, M.E.; Hellweg, S.; Huijbregts, M.A.; Frischknecht, R. Applying cumulative exergy demand (CExD) indicators to the ecoinvent database. Int. J. Life Cycle Assess. 2007, 12, 181–190. [Google Scholar] [CrossRef]
- Dincer, I.; Rosen, M.A. Exergy: Energy, Environment and Sustainable Development, 2nd ed.; Elsevier: Kidlington, UK, 2013; p. 424. [Google Scholar]
- Duprey, R.L. Compilation of Air Pollutant Emission Factors; National Center for Air Pollution Control: Cincinnati, OH, USA, 1968. [Google Scholar]
- Berthiaume, R.; Bouchard, C.; Rosen, M.A. Exergetic evaluation of the renewability of a biofuel. Exergy Int. J. 2001, 1, 256–268. [Google Scholar] [CrossRef]
- Font de Mora, E.; Torres, C.; Valero, A. Assessment of biodiesel energy sustainability using the exergy return on investment concept. Energy 2012, 45, 474–480. [Google Scholar] [CrossRef]
- Font de Mora, E.; Torres, C.; Valero, A. Thermoeconomic Analysis of Biodiesel Production from Used Cooking Oils. Sustainability 2015, 7, 6321–6335. [Google Scholar] [CrossRef]
- Frenzel, P.; Hillerbrand, R.; Pfennig, A. Exergetical evaluation of biobased synthesis pathways. Polymer 2014, 6, 327–345. [Google Scholar] [CrossRef]
- Frenzel, P.; Hillerbrand, R.; Pfennig, A. Increase in energy and land use by a bio-based chemical industry. Chem. Eng. Res. Des. 2014, 92, 2006–2015. [Google Scholar] [CrossRef]
- Jungbluth, N.; Chudacoff, M.; Dauriat, A.; Dinkel, F.; Doka, G.; Faist Emmenegger, M.; Gnansounou, E.; Kljun, N.; Schleiss, K.; Spielmann, M.; et al. Life Cycle Inventories of Bioenergy. Available online: https://scholar.google.co.uk/scholar?q=Life+Cycle+Inventories+of+Bioenergy&btnG=&hl=en&as_sdt=0%2C5 (accessed on 10 July 2017).
- Martin, M.; Parsapour, A. Upcycling wastes with biogas production: An exergy and economic analysis. In Proceedings of the International Symposium on Energy from Biomass and Waste, Venice, Italy, 5 December 2012. [Google Scholar]
- Patzek, T.W. Thermodynamics of the corn-ethanol biofuel cycle. Crit. Rev. Plant Sci. 2014, 23, 519–567. [Google Scholar] [CrossRef]
- Sorguven, E.; Özilgen, M. Thermodynamic assessment of algal biodiesel utilization. Renew. Energy 2010, 35, 1956–1966. [Google Scholar] [CrossRef]
- Talens-Peiró, L.; Méndez, G.V.; Sciubba, E.; Durany, X.G. Extended exergy accounting applied to biodiesel production. Energy 2010, 35, 2861–2869. [Google Scholar] [CrossRef]
- EIA (2017) Workbook Contents U.S. Refinery Yield. Available online: https://www.eia.gov/dnav/pet/xls/PET_PNP_PCT_DC_NUS_PCT_A.xls (accessed on 10 July 2017).
- Ekvall, T.; Hirschnitz-Garbers, M.; Eboli, F.; Śniegocki, A. A systemic and systematic approach to the development of a policy mix for material resource efficiency. Sustainability 2016, 8, 373. [Google Scholar] [CrossRef]
- Eurostat European Commission. Energy Balance Sheets 2011–2012, 2014 Edition. Available online: http://ec.europa.eu/eurostat/web/products-statistical-books/-/KS-EN-14-001 (accessed on 10 July 2017).
- Hoekstra, A.Y.; Chapagain, A.K. Water Footprints of Nations, Value of Water Research Report Series No. 16; UNESCO-IHE: Delft, The Netherlands, 2004. [Google Scholar]
- Hoekstra, A.Y.; Chapagain, A.K. Water footprints of nations: Water use by people as a function of their consumption pattern. In Integrated Assessment of Water Resources and Global Change, 1st ed.; Springer: Dordrecht, The Netherlands, 2006; pp. 35–48. [Google Scholar]
- Pfister, S.; Koehler, A.; Hellweg, S. Assessing the environmental impacts of freshwater consumption in LCA. Environ. Sci. Technol. 2009, 43, 4098–4104. [Google Scholar] [CrossRef] [PubMed]
- Lomborg, B. The Skeptical Environmentalist: Measuring the Real State of the World, 2nd ed.; Cambridge University Press: Cambridge, UK, 2003; pp. 94–97. [Google Scholar]
- Arodudu, O.; Helming, K.; Wiggering, H.; Voinov, A. Bioenergy from Low-Intensity Agricultural Systems: An Energy Efficiency Analysis. Energies 2016, 10, 29. [Google Scholar] [CrossRef]
- Ajanovic, A. Biofuels versus food production: Does biofuels production increase food prices? Energy 2011, 36, 2070–2076. [Google Scholar] [CrossRef]
- Pedroli, B.; Elbersen, B.; Frederiksen, P.; Grandin, U.; Heikkilä, R.; Krogh, P.H.; Izakovičová, Z.; Johansen, A.; Meiresonne, L.; Spijker, J. Is energy cropping in Europe compatible with biodiversity?–Opportunities and threats to biodiversity from land-based production of biomass for bioenergy purposes. Biomass Bioenergy 2013, 55, 73–86. [Google Scholar] [CrossRef]
- Rathmann, R.; Szklo, A.; Schaeffer, R. Land use competition for production of food and liquid biofuels: An analysis of the arguments in the current debate. Renew. Energy 2010, 35, 14–22. [Google Scholar] [CrossRef]
- Searchinger, T.; Heimlich, R. Avoiding Bioenergy Competition for Food Crops and Land. World Resources Institute. Available online: http://www.wri.org/publication/avoiding-bioenergycompetition-food-crops-and-land (accessed on 10 July 2017).
- Steer, A.; Hanson, C. Biofuels Are Not a Green Alternative to Fossil Fuels. Available online: http://www.theguardian.com/environment/2015/jan/29/biofuels-are-not-the-green-alternative-to-fossil-fuels-they-are-sold-as (accessed on 10 July 2017).
- Ackrill, R.; Kay, A. The Growth of Biofuels in the 21st Century: Policy Drivers and Market Challenges, 1st ed.; Palgrave Macmillan: London, UK, 2014; p. 250. [Google Scholar]
Figure 1.
(a) The open cycle cradle to grave economy; (b) Reduction of resource stock quality due to open cycles; (c) The cost of extracting successive units of stock in line with the law of diminishing returns.
Figure 1.
(a) The open cycle cradle to grave economy; (b) Reduction of resource stock quality due to open cycles; (c) The cost of extracting successive units of stock in line with the law of diminishing returns.

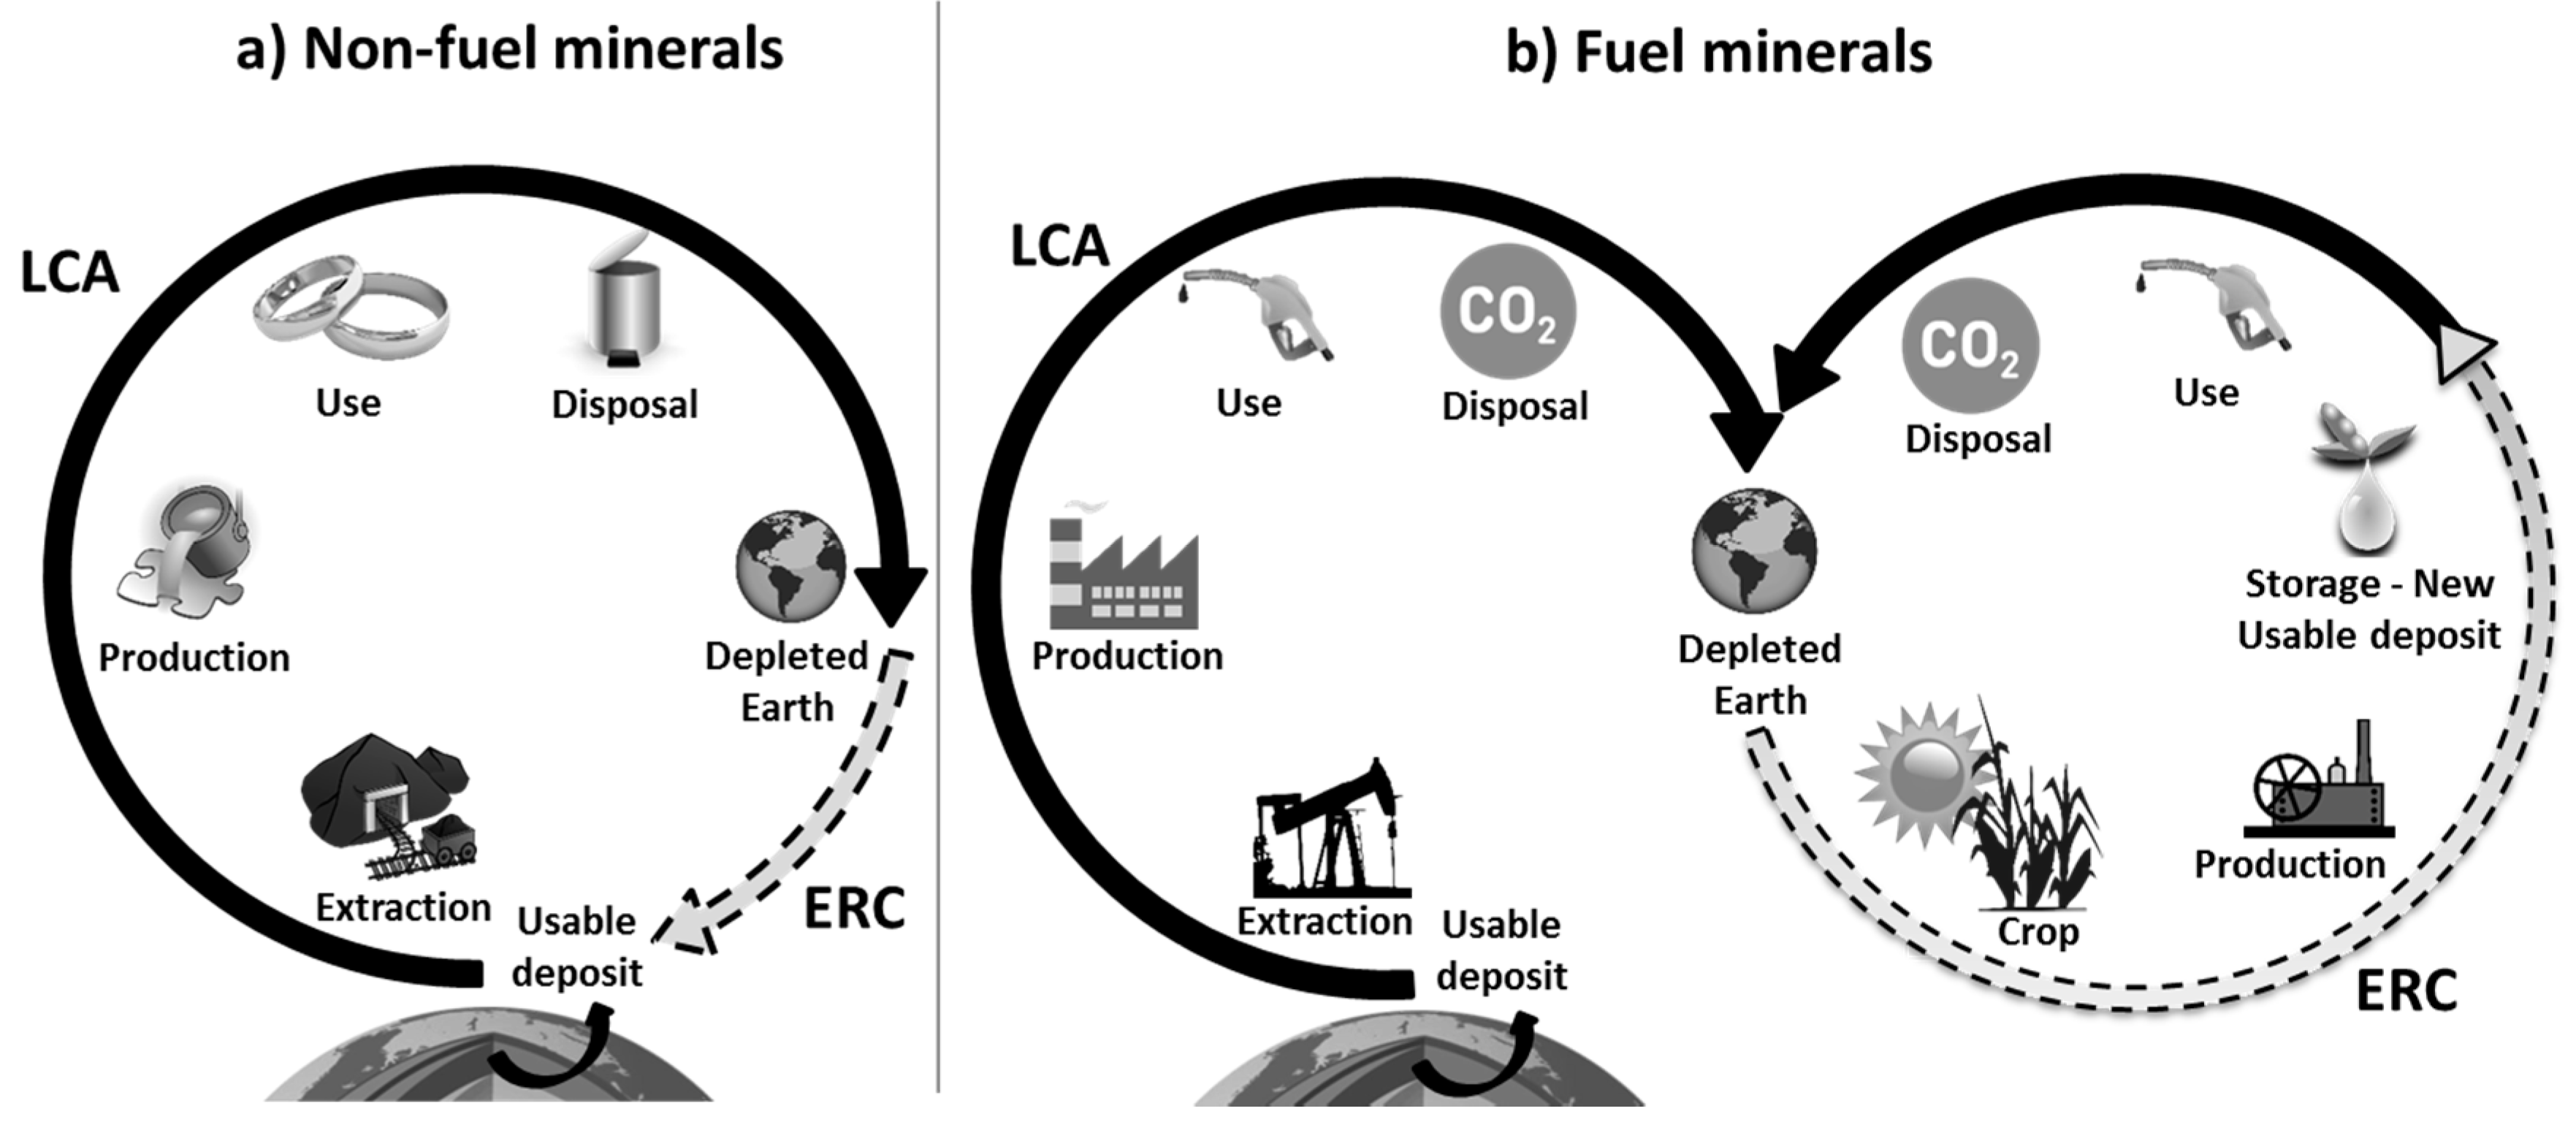
Figure 2.
ERC scope of non-fuel minerals (based on the theory presented in [6]) and fossil fuels minerals. Note: Using the non-fuel mineral method for fuels does not permit the closure of the energy and material cycle, and so the ERC cannot be calculated unless the alternative (bio-energy) pathway is employed. Adapted from [8]

Figure 3.
Evolution of the exergy of Earth’s resources.
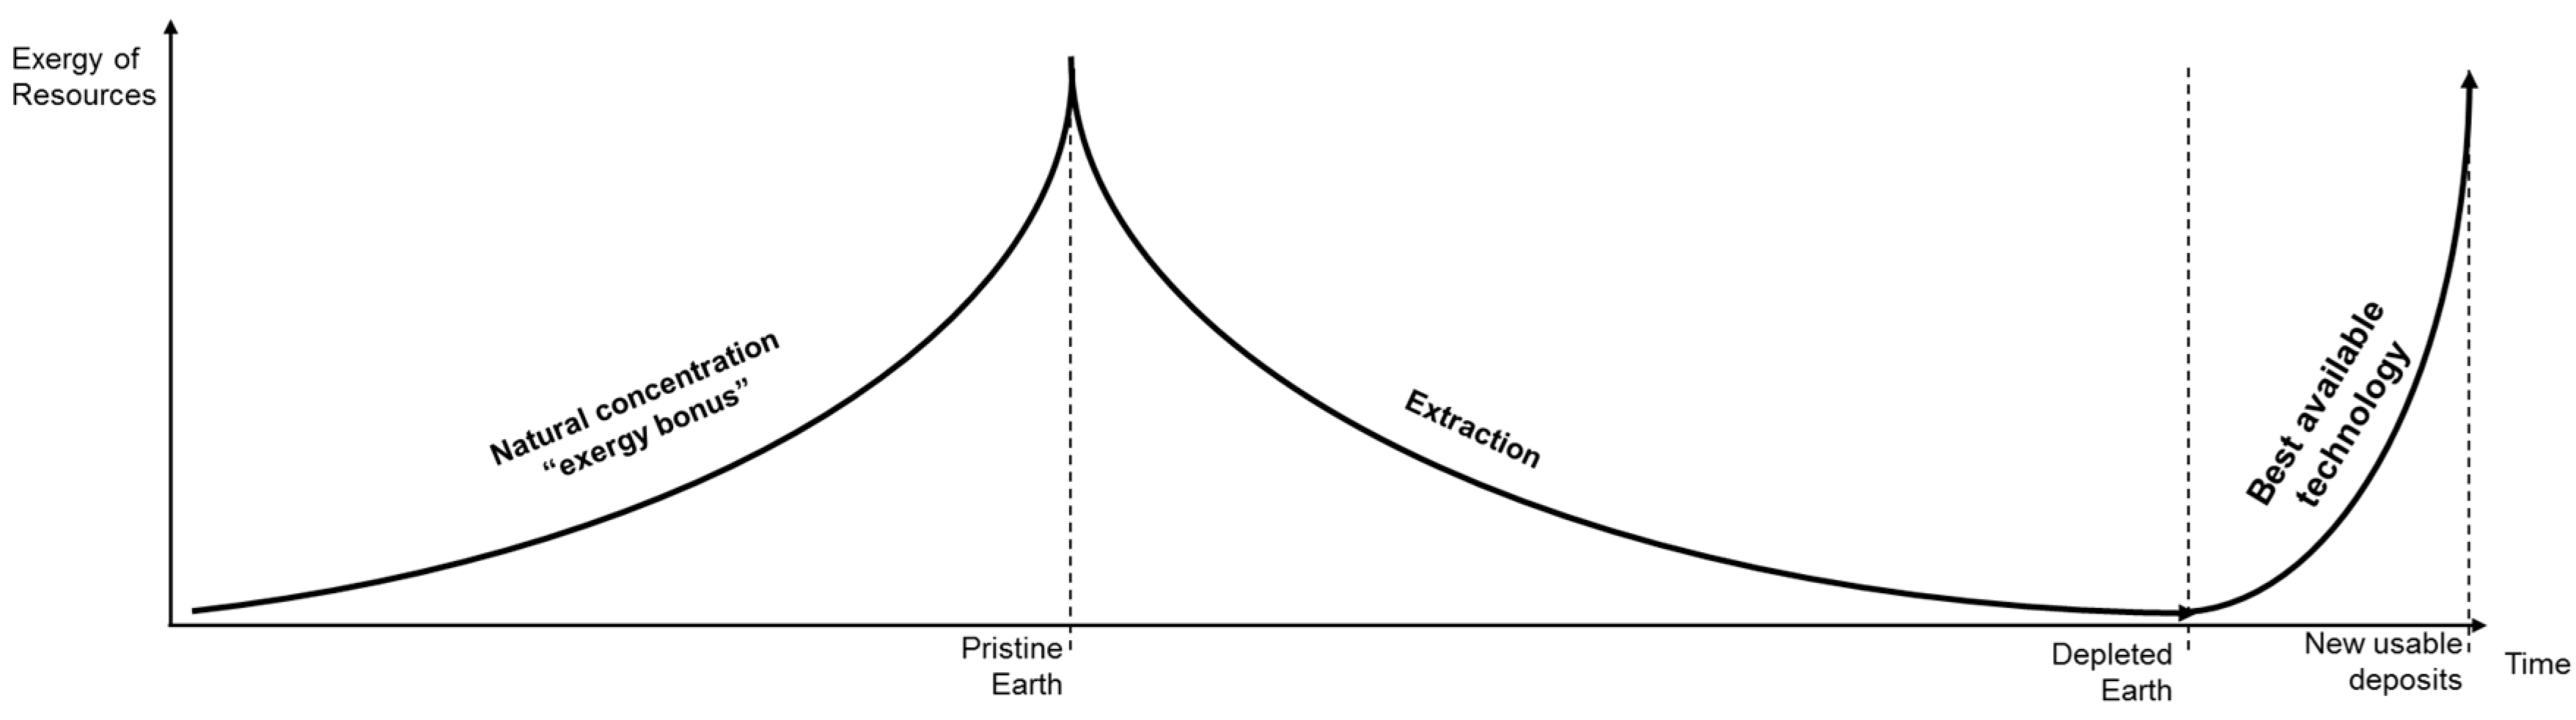
Figure 4.
System definition for the LCA/CExC of bioproducts.

Figure 5.
Example of CExC calculations for charcoal, biogas from grass and biodiesel from rapeseed.

Figure 6.
Resource contributions to the exergy cost of bioproducts (crop to fuel). Note: For biogas production only biomass derived from crops (and not waste, for example) were taken into consideration.
Figure 6.
Resource contributions to the exergy cost of bioproducts (crop to fuel). Note: For biogas production only biomass derived from crops (and not waste, for example) were taken into consideration.

Figure 7.
ERC of fossil fuels from solar radiation to fuel.
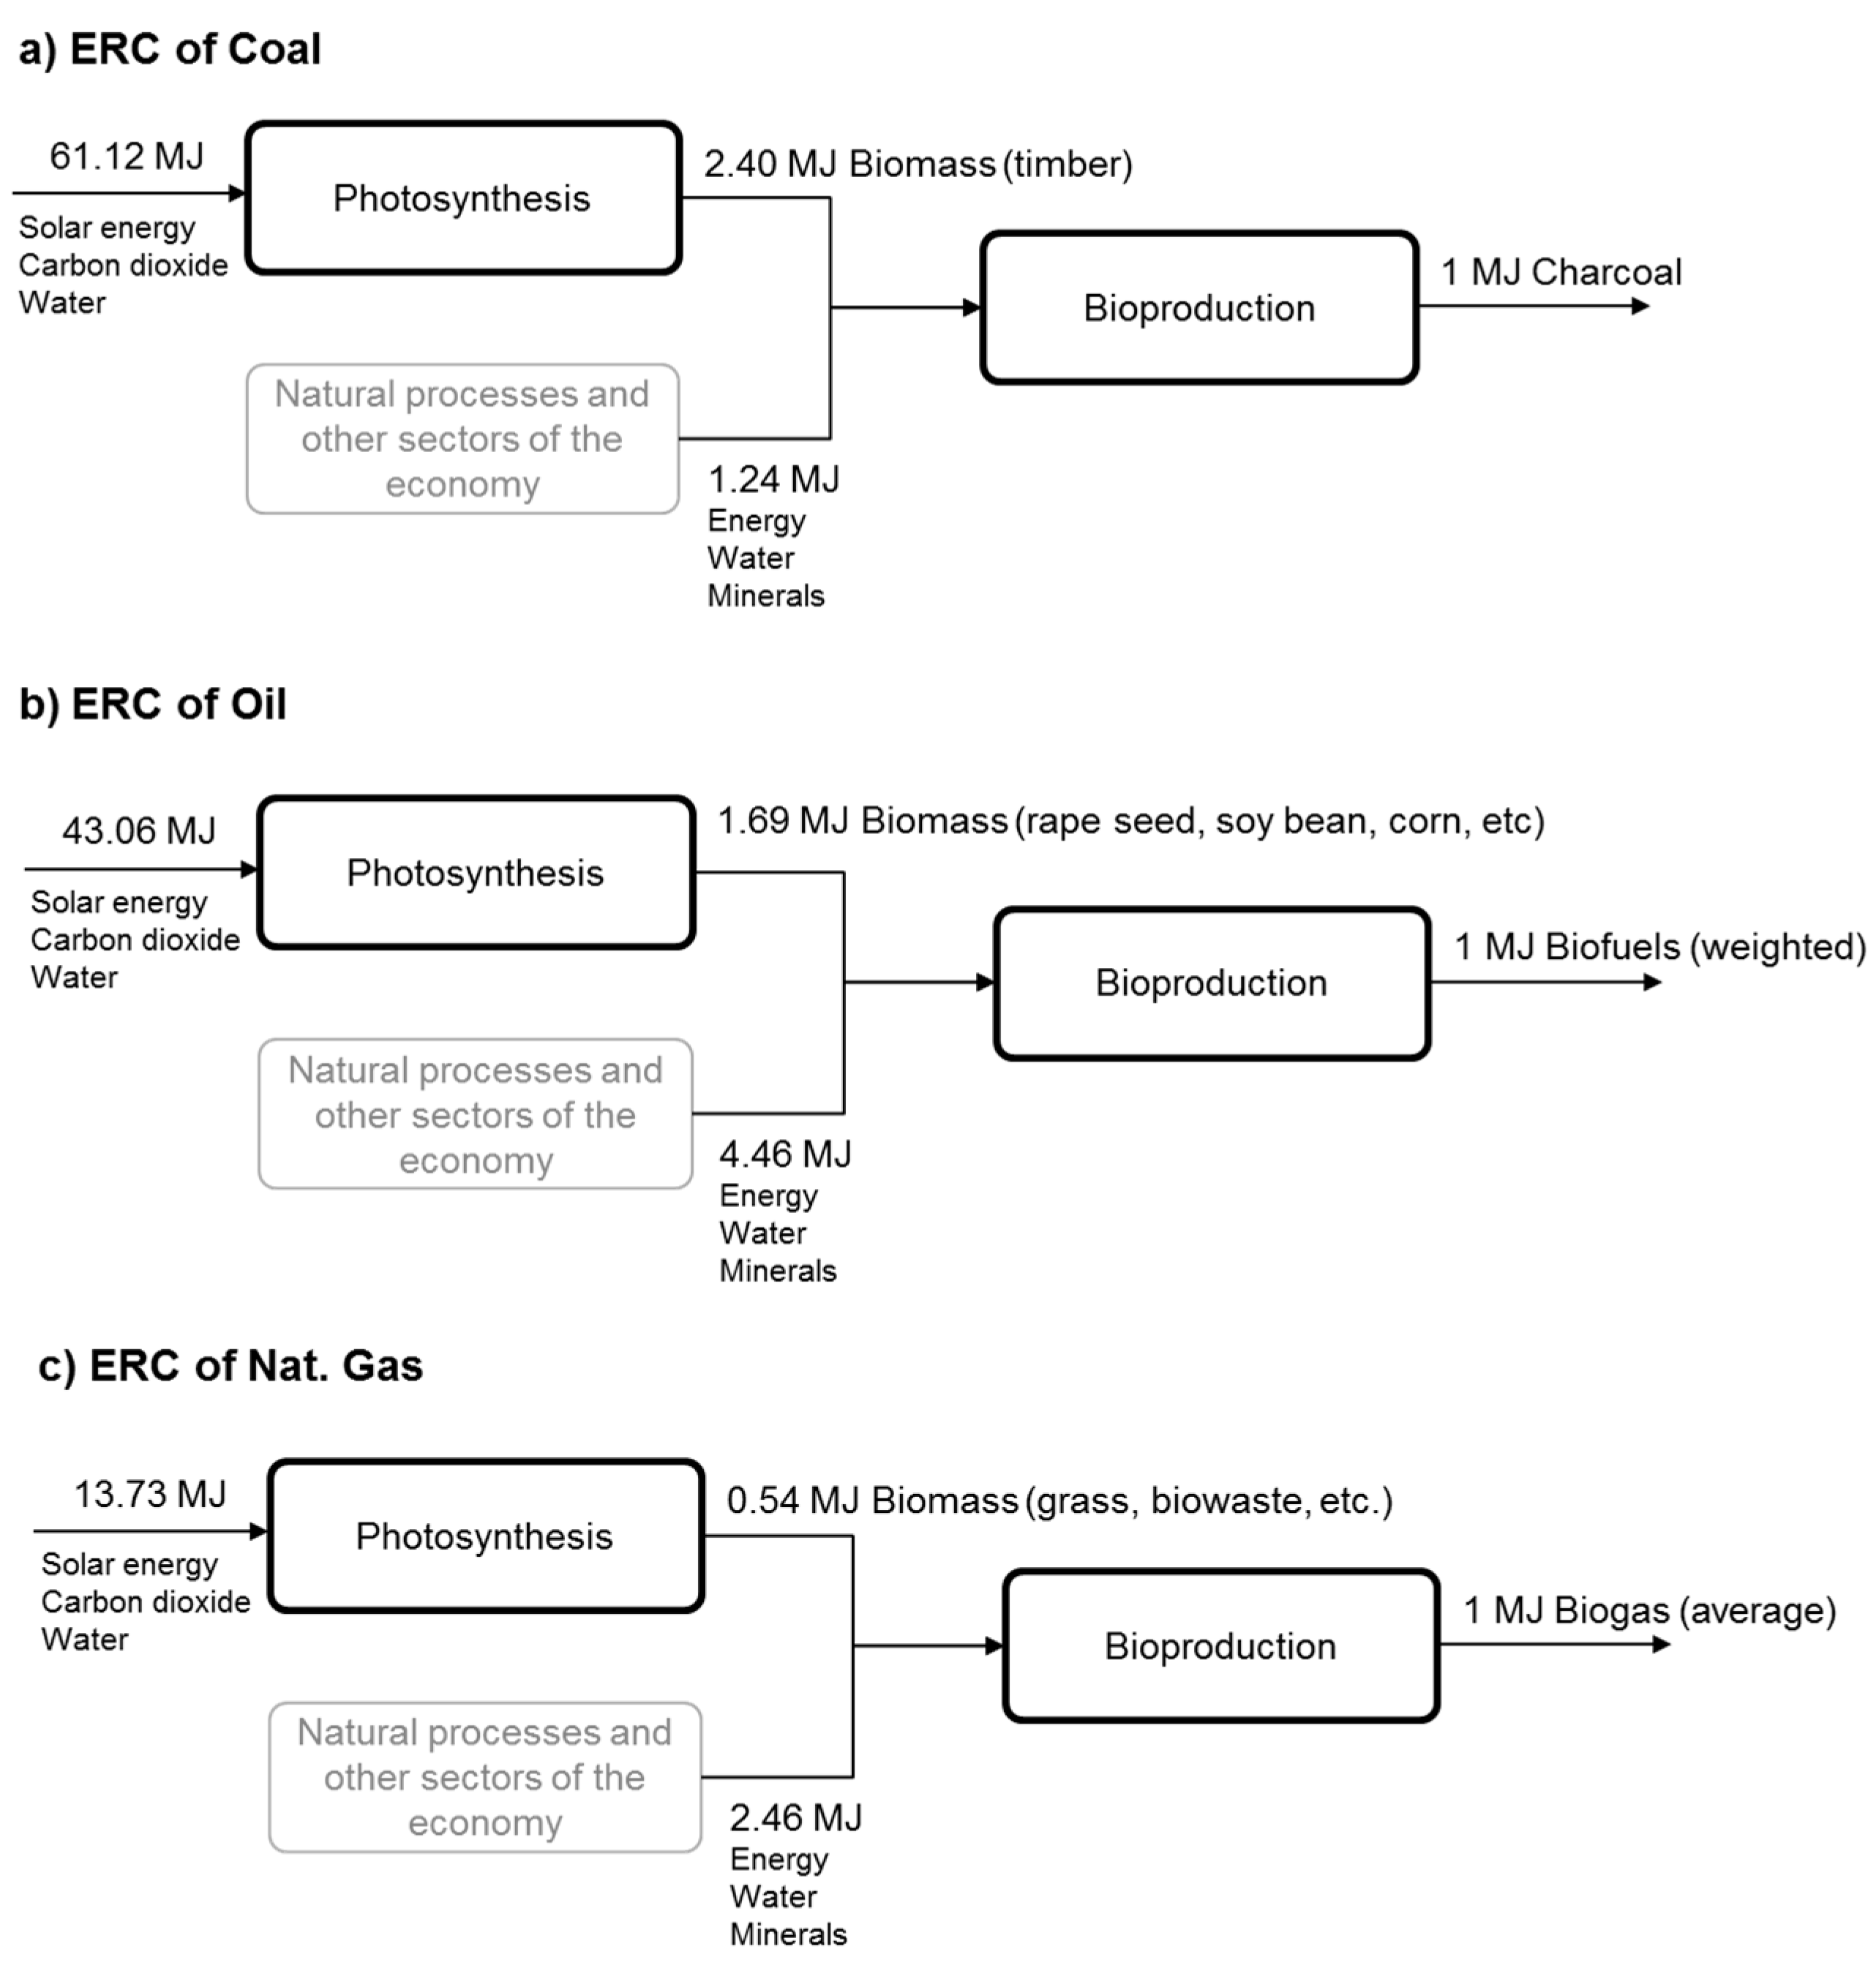
Figure 8.
Comparison of methods for world’s mineral capital depletion 1900 to 2008 (Value in Mtoe). ERC: Exergy replacement cost, NFM: non-fuel minerals, Bch: chemical exergy, FF: fossil fuels.
Figure 8.
Comparison of methods for world’s mineral capital depletion 1900 to 2008 (Value in Mtoe). ERC: Exergy replacement cost, NFM: non-fuel minerals, Bch: chemical exergy, FF: fossil fuels.
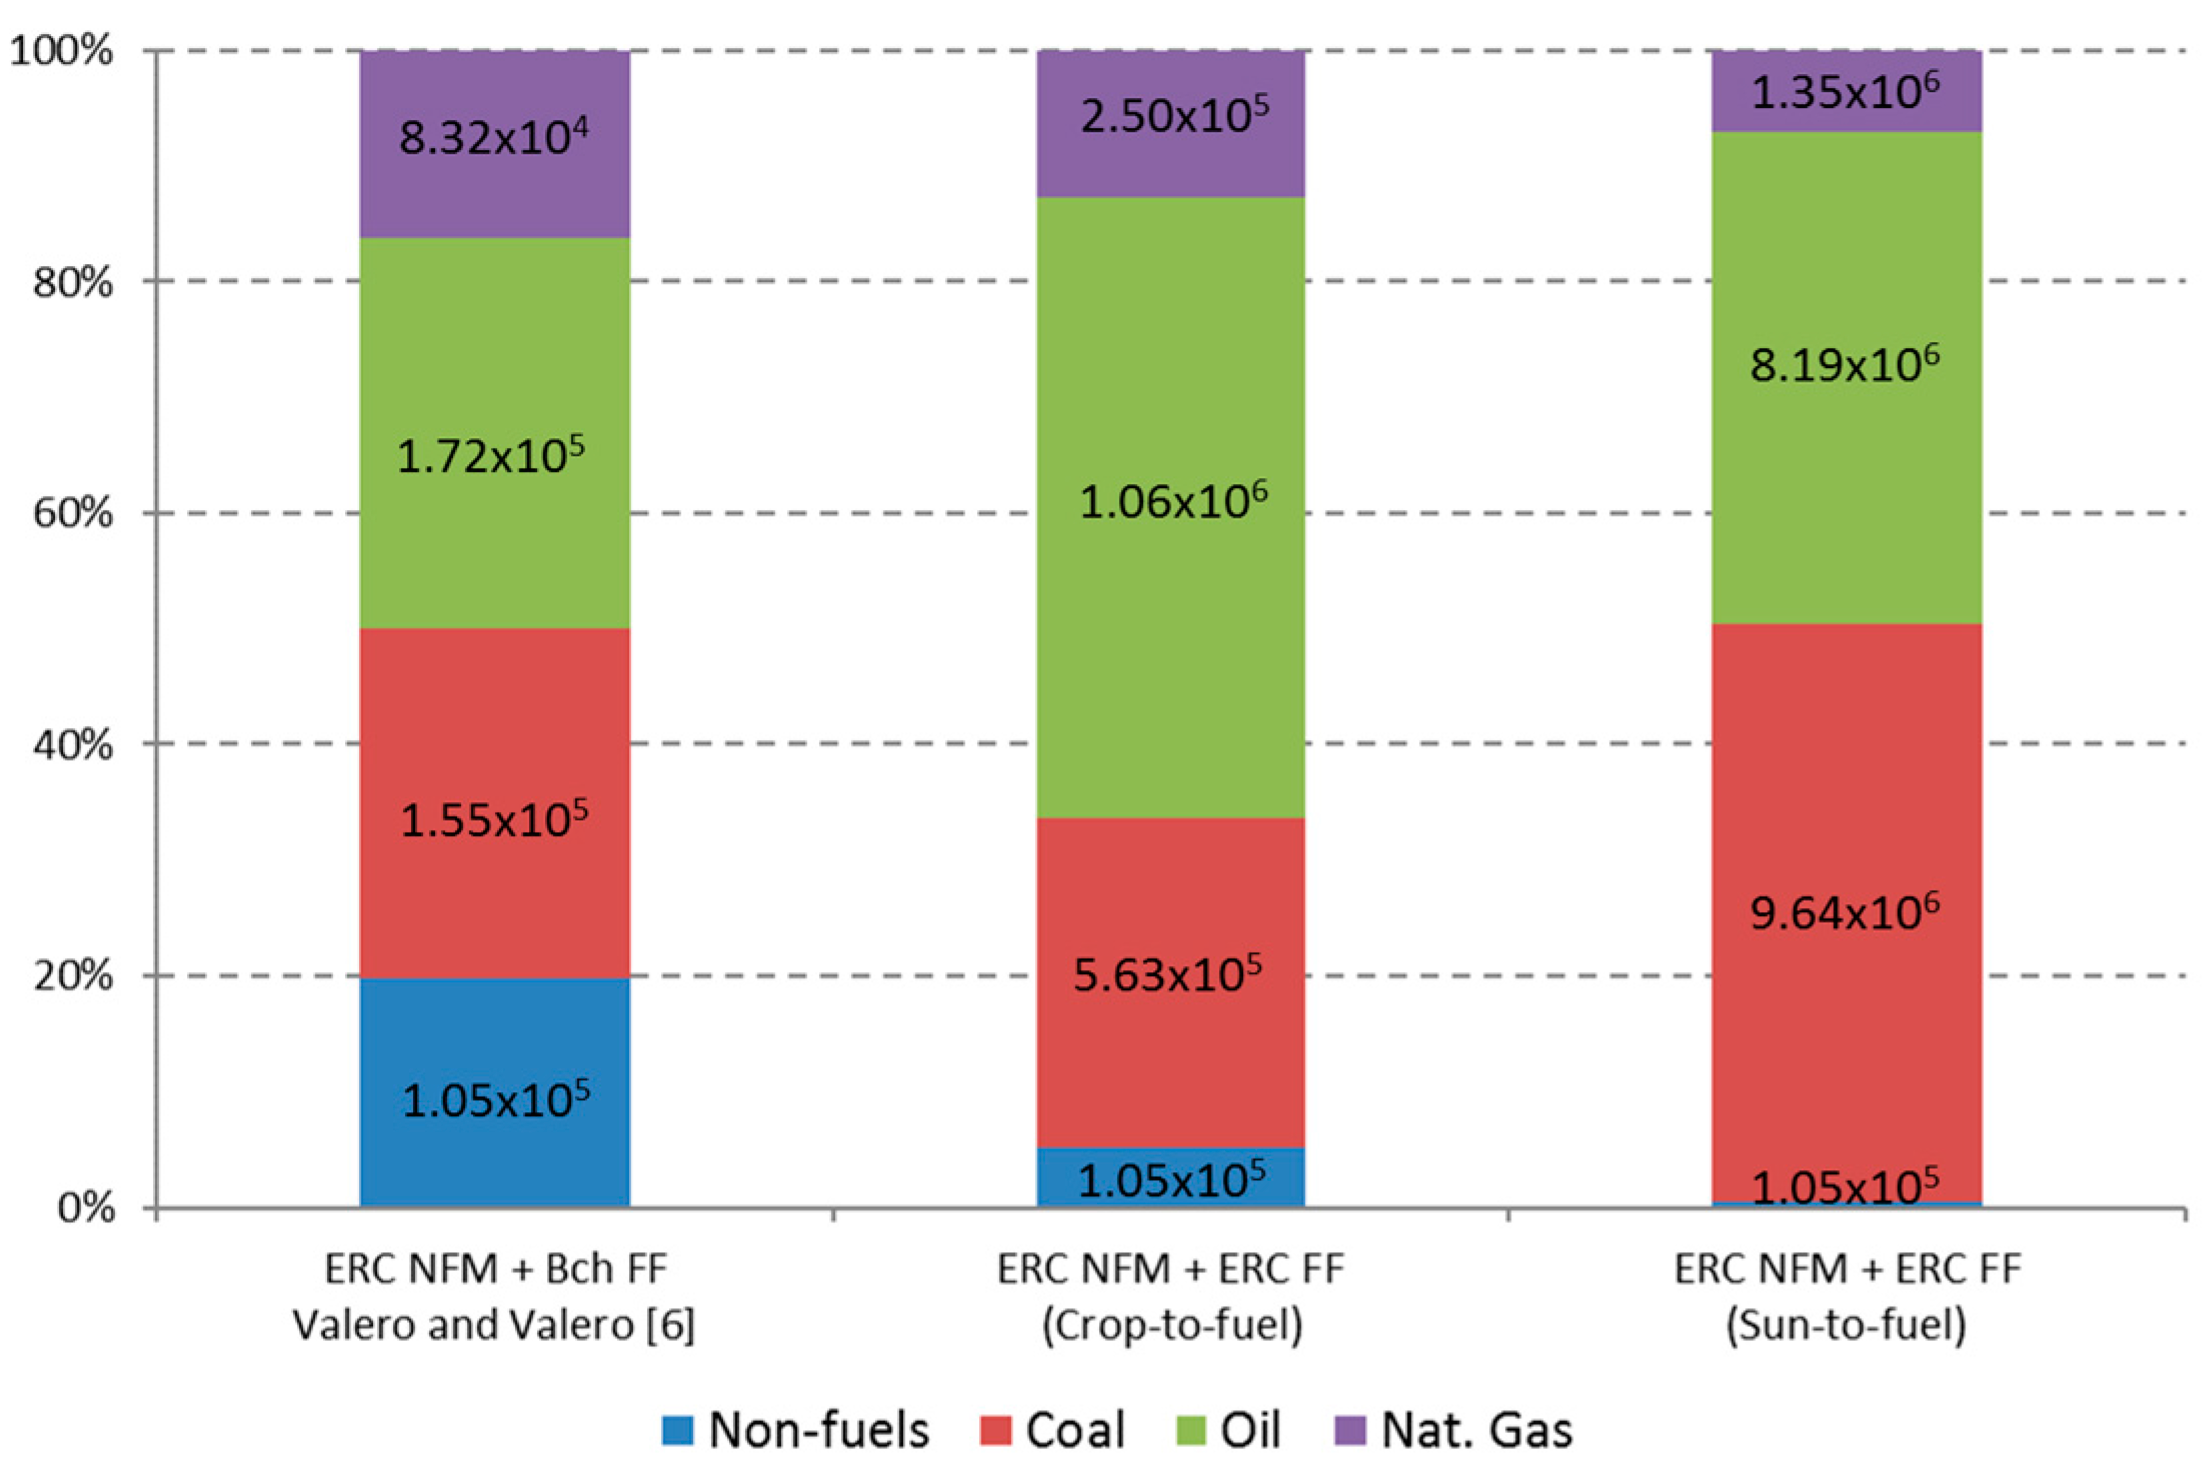
Figure 9.
Mineral balance of EU-28 for 2011. Comparison between mass (Tonnes) and ERC (Mtoe) value. Note: Mass and ERC value of non-fuel minerals from [14] and fossil fuels from [80]: (a) Mass; (b) HHV; (c) Solar radiation to fuel; (d) Crop to fuel.

Table 1.
Summary of data identified in literature review per fuel product. Adapted from [8]
Table 1.
Summary of data identified in literature review per fuel product. Adapted from [8]
| Fossil Fuel | Product | Reference Information | ||
|---|---|---|---|---|
| Bio-Equivalent | Bio-Sources | Number of Studies | ||
| Oil | Gasoline | Bioethanol | Corn, spent barley, sweet sorghum, sugarcane, sugar beets, rye, whey, potatoes, grass, non-specified biomass | 22 |
| Diesel and Jet Fuel | Biodiesel | Rapeseed, sunflower, palm oil, microalgae, soy bean | 14 | |
| LPG | Bio-SNG | Wood, non-specified biomass | 3 | |
| Kerosene | Used cooking oil (UCO) | Cooking oil | 2 | |
| Polymers | Bio-PET | Wheat, rapeseed | 0 * | |
| Asphalt and Coke | Biochar | Wood | 1 | |
| Others | Methanol, FT, Oil | Sawdust, sewage sludge biomass, wheat | 2 | |
| Natural gas | Natural gas | Biogas | Agro-waste, slurry, sewage sludge, grass, biowaste | 13 |
| Coal | Charcoal | Biochar | Wood | 1 |
* There was only one (1) study that calculated the exergy consumption to produce Bio-PET. It only accounted for from the gate-gate scope and for non-renewable resources.
Table 2.
Exergy cost of bioproducts from crop to fuel.
| Fuel | Product | Bio-Equivalent | Average κ | St Dev | Min | Max |
|---|---|---|---|---|---|---|
| Oil | Gasoline | Bioethanol | 6.93 | 2.92 | 1.91 | 12.56 |
| Diesel and Jet Fuel | Biodiesel | 5.75 | 3.61 | 1.94 | 11.97 | |
| LPG | Bio-SNG | 2.24 | 0.05 | 2.19 | 2.29 | |
| Kerosene | Used cooking oil (UCO) | 1.32 | 0.92 | 0.67 | 1.97 | |
| Asphalt/Coke | Biochar | 3.64 | - | - | - | |
| Others | Methanol | 14.08 | 0.42 | 13.78 | 14.38 | |
| Natural gas | Natural gas | Biogas | 3.00 | 2.15 | 0.87 | 6.73 |
| Coal | Charcoal | Biochar | 3.64 | - | - | - |
Table 3.
ERC of fossil fuels and comparison with other non- fuel minerals ERC.
| Mineral | κ or ERC Photosynthesis (MJ/MJ) | κ or ERC Bioproduction (MJ/MJ) | κ or Total ERC (MJ/MJ) | Total ERC (GJ/Tonne) |
|---|---|---|---|---|
| Coal | 61.12 | 3.64 | 62.35 | 1414.7 |
| Oil | 43.06 | 6.15 | 47.52 | 2170.0 |
| Natural Gas | 13.73 | 3.00 | 16.19 | 575.3 |
| Phosphate Rock | (Lowest value of 36 minerals analysed in [6]) | 0.4 | ||
| Gold | (Highest value of 36 minerals analysed in [6]) | 583,668.0 | ||
© 2017 by the authors. Licensee MDPI, Basel, Switzerland. This article is an open access article distributed under the terms and conditions of the Creative Commons Attribution (CC BY) license (http://creativecommons.org/licenses/by/4.0/).
Share and Cite
MDPI and ACS Style
Whiting, K.; Carmona, L.G.; Carrasco, A.; Sousa, T. Exergy Replacement Cost of Fossil Fuels: Closing the Carbon Cycle. Energies 2017, 10, 979. https://doi.org/10.3390/en10070979
AMA Style
Whiting K, Carmona LG, Carrasco A, Sousa T. Exergy Replacement Cost of Fossil Fuels: Closing the Carbon Cycle. Energies. 2017; 10(7):979. https://doi.org/10.3390/en10070979
Chicago/Turabian StyleWhiting, Kai, Luis Gabriel Carmona, Angeles Carrasco, and Tânia Sousa. 2017. "Exergy Replacement Cost of Fossil Fuels: Closing the Carbon Cycle" Energies 10, no. 7: 979. https://doi.org/10.3390/en10070979
Note that from the first issue of 2016, this journal uses article numbers instead of page numbers. See further details here.