Article

Trends in CO2 Emissions from China-Oriented International Marine Transportation Activities and Policy Implications

Collaborative Innovation Center for Transport Studies, Dalian Maritime University, Dalian 116026, China
*
Author to whom correspondence should be addressed.
Energies 2017, 10(7), 980; https://doi.org/10.3390/en10070980
Submission received: 3 May 2017 / Revised: 29 June 2017 / Accepted: 5 July 2017 / Published: 12 July 2017

Abstract

:
The demand for marine transportation and its associated CO2 emissions are growing rapidly as a result of increasing international trade and economic growth. An activity-based approach is developed for forecasting CO2 emissions from the China-oriented international seaborne trade sector. To accurately estimate the aggregated emissions, CO2 emissions are calculated individually for five categories of vessels: crude oil tanker, product tanker, chemical tanker, bulk carrier, and container. A business-as-usual (BAU) scenario was developed to describe the current situation without additional mitigation policies, whilst three alternative scenarios were developed to describe scenarios with various accelerated improvements of the key factors. The aggregated CO2 emissions are predicted to reach 419.97 Mt under the BAU scenario, and 258.47 Mt under the optimal case, AD3. These predictions are 4.5 times and 2.8 times that of the aggregated emissions in 2007. Our analysis suggests that regulations for monitoring, reporting, and verifying the activities of vessels should be proposed, in order to quantify the CO2 emissions of marine transportation activities in Chinese territorial waters. In the long-term future, mitigation policies should be employed to reduce CO2 emissions from the marine trade sector and to address the climatic impact of shipping.

1. Introduction

Economic development in the past few decades has caused an increasing demand for international marine transport. The past seven years saw annual increases in global seaborne trade of greater than 3%, reaching 10,837 million tonnes in total [1]. The increasing international marine transport demand will lead to acceleration in energy consumption and CO2 emissions. In the period from 2007 to 2012, on average, shipping accounted for approximately 3.1% of annual global CO2 emissions. Within this 3.1%, approximately 84% of total emissions originated from international marine transportation, namely trips between two or more countries [2].
Driven largely by the booming global economy, the demand for marine transportation in China has been growing rapidly since adoption of the reform and opening policy. As a developing region, China accounts for the largest share of marine transportation demand in the import of oil, iron ore, coal, and chemicals [1]. The latest report suggests that, in 2015, the marine transport demand for international shipping to and from China contributed approximately 25% of the total global trade to stand at 2682 million tonnes [3]. This kind of growth in marine transportation caused significant increases in energy consumption and greenhouse gas (GHG) emissions [4]. GHG emissions are extremely likely to have been the dominant cause of observed global warming since the mid-20th century [5]. Of all GHG emissions, CO2 is considered to be the most significant contributor to climate change [6]. In addition to the climate deterioration, these kinds of air pollutants are proven to be directly harmful to human health [7]. Approximately 230 million people are directly exposed to these harmful emissions in the world’s top 100 container ports [8]. Of the top twenty ports, nine of these are in China [9].
China is one of the region’s signatories of the Kyoto Protocol international climate change agreement of 1997, which aims to adapt and mitigate the negative impact of climate change. Shipping has thus far escaped from being included in the reduction targets of the Kyoto Protocol, but it is very likely that the era without corresponding regulations is ending and that measures are coming [10]. Moreover, China has ratified the Paris Agreement of 2016, which is a global action plan against global warming. Regarding this latest agreement on climate change, China has a mandatory obligation to reduce GHG emissions to address international patterns of future climate change. Meanwhile, on the 70th session of the Marine Environment Protection Committee (MEPC) in October 2016, the roadmap for developing a comprehensive International Maritime Organization (IMO) strategy to reduce GHG emissions from shipping was improved, which foresees an initial GHG reduction strategy to be adopted in 2018. The roadmap contains a list of activities with a three-step approach, paving the way for a revised strategy in 2023 [11]. Under these circumstances, energy policies to monitor and reduce CO2 emissions in the marine transport sector are crucial for the environmental well-being of domestic China as well as globally. However, policy-making tends to be difficult if the impacts of various measures are not properly quantified [12]. Hence, a prediction for the CO2 emissions of China-oriented international marine transportation is likely to be the first and essential approach to provide a meaningful reference to policy makers for China.
The objective of this study is to analyse the current status and future trends of CO2 emissions from China-oriented international marine trading operations. China-oriented international maritime transportation refers to international seaborne operations that have their origin or destination in China. A bottom-up approach was used to estimate CO2 emissions based on the activities of vessels. CO2 is produced by fuel consumption, which can be divided into transport demand and energy intensity. Considering their various energy intensities, vessels were classified into five categories according to their commodities. Log-linear regression models were developed to individually project the transport demands of the five categories. Four alternative scenarios were designed based on different assumptions with regard to improving the uncertainty of their inputs.
This paper is organized as follows: Section 2 presents a brief literature review. Section 3 describes the methodologies used, scenarios developed and relevant data collection. Section 4 presents and discusses the main findings. Section 5 attempts to draw some policy implications. The final section of the paper summarizes the conclusions.

2. Literature Review

Many previous studies concentrated on CO2 emissions and the future growth of gases from general aspects of the transport sector: vehicles, railways, waterways, aviation [13,14,15,16,17]. In terms of research on specific modes of transport, the road and railway transport sectors have been more popular owing to their significant roles in daily life [18,19,20,21,22,23].
To the authors’ knowledge, only two previous research works have attempted to estimate the CO2 emissions of water transportation specifically associated with China. Wei and Zhao [24] used the historical data to project the shipping CO2 emissions for the long-term in Wanzhou, China, through a top-down method. This studied the specific area in domestic China and concentrated on inland shipping. Han et al. [25] employed three approaches to estimate CO2 emissions from China’s freight shipping including inland, coastal, and international shipping from 2006 to 2012. The international shipping involved in the previous studies was confined to activities operated by Chinese shipping companies, but identification of the carbon emissions produced by all international seaborne trade operations to and from China is still missing.
The international marine transport studied in this paper is defined in accordance with the clarification from the Intergovernmental Panel on Climate Change (IPCC) [26] and IMO [27], namely shipping between ports of different countries irrespective of the vessel’s flag, excluding military and fishing vessels. This paper focuses on the carbon emissions of China-oriented international seaborne trade by fleets not confined to Chinese shipping companies, which is normally referred to the imports and exports marine transport activities of China conducted by vessels regardless of the ownership or flag state. Moreover, the previous studies considered the international shipping sector from a general perspective, ignoring specificity in the classification of vessel categories. There are significant differences in the energy intensity of various types of vessels, which may induce variances in the final results. Predicting the breakdown of the turnover volumes of transport vessels is very likely to draw a more reliable conclusion. This study depends on the Chinese import and export records of marine transport, establishing Log-linear regression models in various categories of vessel to obtain their fuel consumption and the CO2 emissions of the international seaborne transportation. The different categories of fleets are taken into account depending on their various transport demands and energy intensities. It is desirable for policy makers to develop future mitigation policies according to the calculated results obtained by the model we established.

3. Methodology and Data

3.1. Methodology

Based on the IPCC [26], calculation of CO2 emissions is based on the amount of fuel combusted, which can be estimated by two methodologies: a top-down approach based on fuel statistics, and an activity-based bottom-up approach [24]. Sources for the top-down approach mainly originate from the surveys of fuel suppliers or the monitoring system. Allocating top-down fuel consumption to international shipping can produce precise results, however, discrepancies in the data provided are considered to be a serious problem that can’t be ignored [2]. With regard to China, it is not realistic to obtain data of the fuel consumption of the whole year from fuel suppliers depending on the current situation. International navigation fuel sales data were available for only 29 countries, not including China [2]. Due to the outlined obstacles in adopting the top-down method, the activity-based approach is preferable, which tries to estimate fleet emissions by calculating emissions for all possible ship types.
The activity-based approach has many variants, mainly depending on how the set of inputs is obtained, and what models or other assumptions are used [28]. Equations (1)–(3) show the principal methodology of this study. Equation (1) is provided by IPCC [26], and is used to determine the CO2 produced by fuel consumption. Equation (2) indicates that the fuel consumption can be divided into freight transport volume and energy intensity. This kind of approach is widely used in the estimation of transport fuel consumption [19,25]:
E i = j F C i , j × C F i
F C i , j = T i , j × E I i , j
T i , j = V i , j × D i , j
where, V i , j means the trade volume by vessel type j in year i , D i , j indicates the distance of commodity shipping j in year i , T i , j represents the freight transport turnover volume by vessel type j in year i , E I i , j represents the energy intensity of vessel type j in year i , F C i , j is the fuel consumption of vessel type j , C F i refers to the CO2 emissions factor of fuel in year i , E i refers to the CO2 emissions in year i , subscripts i and j in the equations represent the year and the vessel type, respectively.
Based on the historical data for the factors, it is reasonable to assume the future trend of these inputs and to use this assumption to calculate the emissions in the BAU scenarios, as most previous studies have. The BAU scenario is considered under the current situation based on these conditions with no new policy or changes involved. However, uncertainty regarding the future can’t be ignored when we evaluate development trends, which lead to various alternative scenarios. The alternative scenarios are based on technologies, policies, and measures that encourage shifts in the patterns of both energy consumption and carbon emissions compared to past trends [29]. According to the IMO report [26], transport demand, transport efficiency and marine fuel were identified as the key factors that affect future emissions. As a result, a variety of scenarios could be developed concerning the different trends in the key factors, which can be compared with the conventional BAU scenario [30].

3.2. Data Collection and Scenarios Design

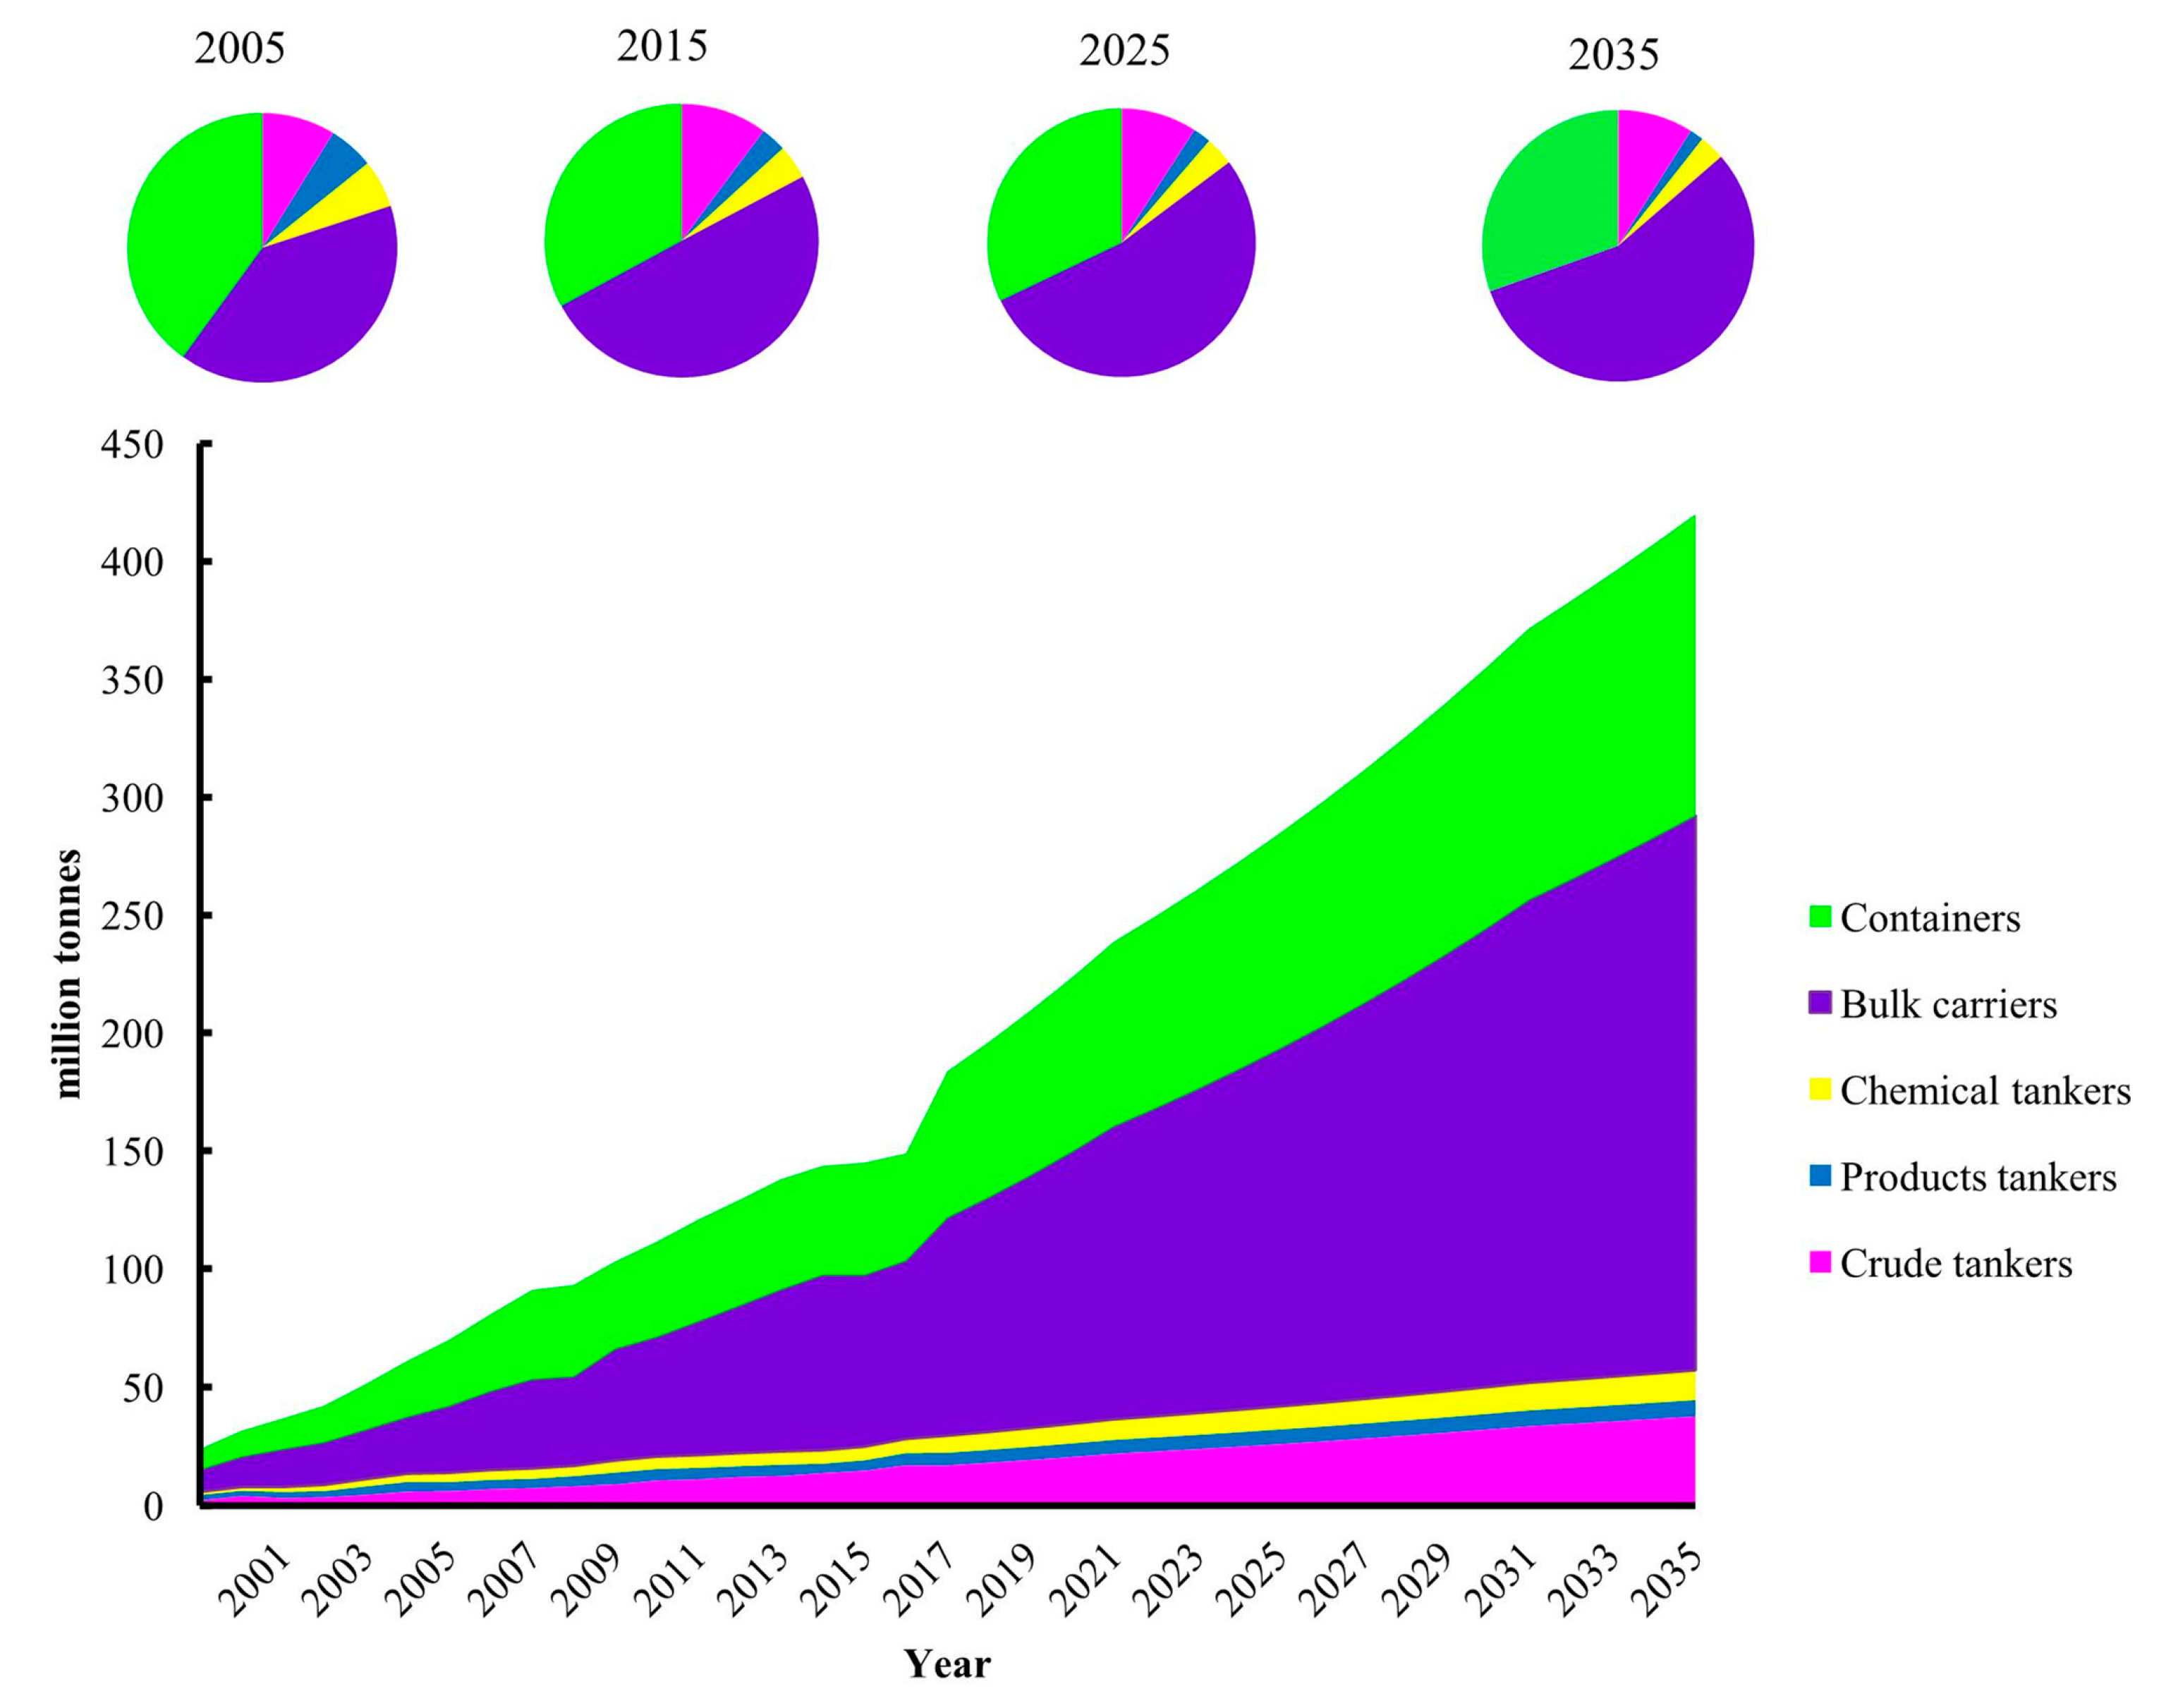
3.2.1. Marine Transport Turnover

With regard to Equation (2), forecasting the freight transport turnover volume is the key factor that has a significant impact on fuel consumption and the CO2 emissions produced by international marine transport. The multiple regression model is an effective statistical technique used for exploring the relationship between a dependent variable and a series of independent variables, so that the response of one variable can be predicted from changes to the others [31]. Many studies have adopted regression models to make forecasts for transport demand and energy demands in the transportation sector, since it is considered to be an accurate approach used to identify the relationships between transport demand or fuel consumption and their relative inputs [17,32,33]. The Log-linear regression model generally describes the dependent and the independent variables in logarithm form. The general formula can be written as follows:
ln ( Y ) = β 0 + β 1 ln ( X 1 ) + β 2 ln ( X 2 ) + + β n ln ( X n ) + ε
where Y is a dependent variable, and X 1 , X 2 ,…, X n are independent variables. In this study, the dependent variable to be predicted is the international marine turnover volume of different vessel types. In terms of independent variables, we initially considered China’s gross domestic product (GDP), values of imports and exports as economic indicators, and the size of the population as social indicators.
This study combined up-to-date data with data collected 18 years ago (from 1999 to 2016). The imports and exports marine transport volume statistics data of China can be obtained from Clarksons Research [34,35,36,37,38]. In terms of the cargo utility, the statistics data contains nine different categories of vessels, including crude oil tanker, oil product tanker, chemical tanker, other liquids cargo, gas liquids cargo, dry bulk carrier, container, non-container cargo, and reefer trades cargo [27]. According to the calculation, four of these: other liquids cargo, gas liquids cargo, non-container cargo, and reefer trades cargo only accounted for an extremely small average percentage of emissions over 18 years by 0.7%, 0.9%, 0.6% and 1.3% of the total volume, respectively. Due to their small contribution to the aggregated marine transport volume, these four categories are excluded in this study. The shipping distances of commodity trade routes can’t be captured from Chinese official statistics. Thus, we considered the world average shipping distances segmented by commodity abstracted from Clarksons Research [39] as our estimation. The historical data of GDP (2000 constant price), value of China’s imports and exports, and the population size of China were obtained from the China Statistics Yearbook 2016 [40].
The Log-linear regression models were computed using SPSS software. The independent variable of GDP showed highly correlation to the other two variables: the value of imports and exports, and population size, with a high correlation of over 0.97 and 0.70, respectively. Keeping all these three variables as inputs in the same model is likely to produce a multicollinearity problem, which would result in biased coefficient estimates. Thus, GDP was the only input used in the Log-linear regression models in order to avoid the multicollinearity problem.
For future projection of the inputs, we made detailed assumptions for the trends in future characteristics of the input variables based on the literature. Under the BAU scenario, previous studies all believe that the GDP of China will increase constantly, with the growth rate declining over time. From 2017 to 2020, the growth rate is projected to be at a high level of 6.5%, followed by a moderate decline to 4.6% from 2020 to 2030 [41]. Between 2030 and 2035, we extracted our data from the study of Zhou et al. [42], considering an average growth rate of 3.4%. As mentioned above, the BAU scenario is considered as a continuation of the current situation based on the anticipated conditions without new policy or changes involved. An alternative scenario was developed for comparison to the baseline scenario. Due to optimization of shipping routes, it is very likely that the distances travelled will be shorter, which results in a reduction of the transport turnover volume. A recent development with potentially significant implications for Chinese trade is China’s “One Belt, One Road”, which was initiated in 2015. This initiative is likely to optimize transport infrastructure and services, including shipping and logistics, and is required to support connectivity between China and foreign countries. This program offers alternative logistics options for international trade such as pipelines and high-speed railways, which relieves the high pressure on shipping [9]. Considering optimization of routes and modal shifts, the S1 scenario was established to describe another optimized scenario. The total transport turnover volumes are projected to reduce by 2.5%, 5% and 10% every five years in 2025, 2030, 2030 and 2035, respectively.

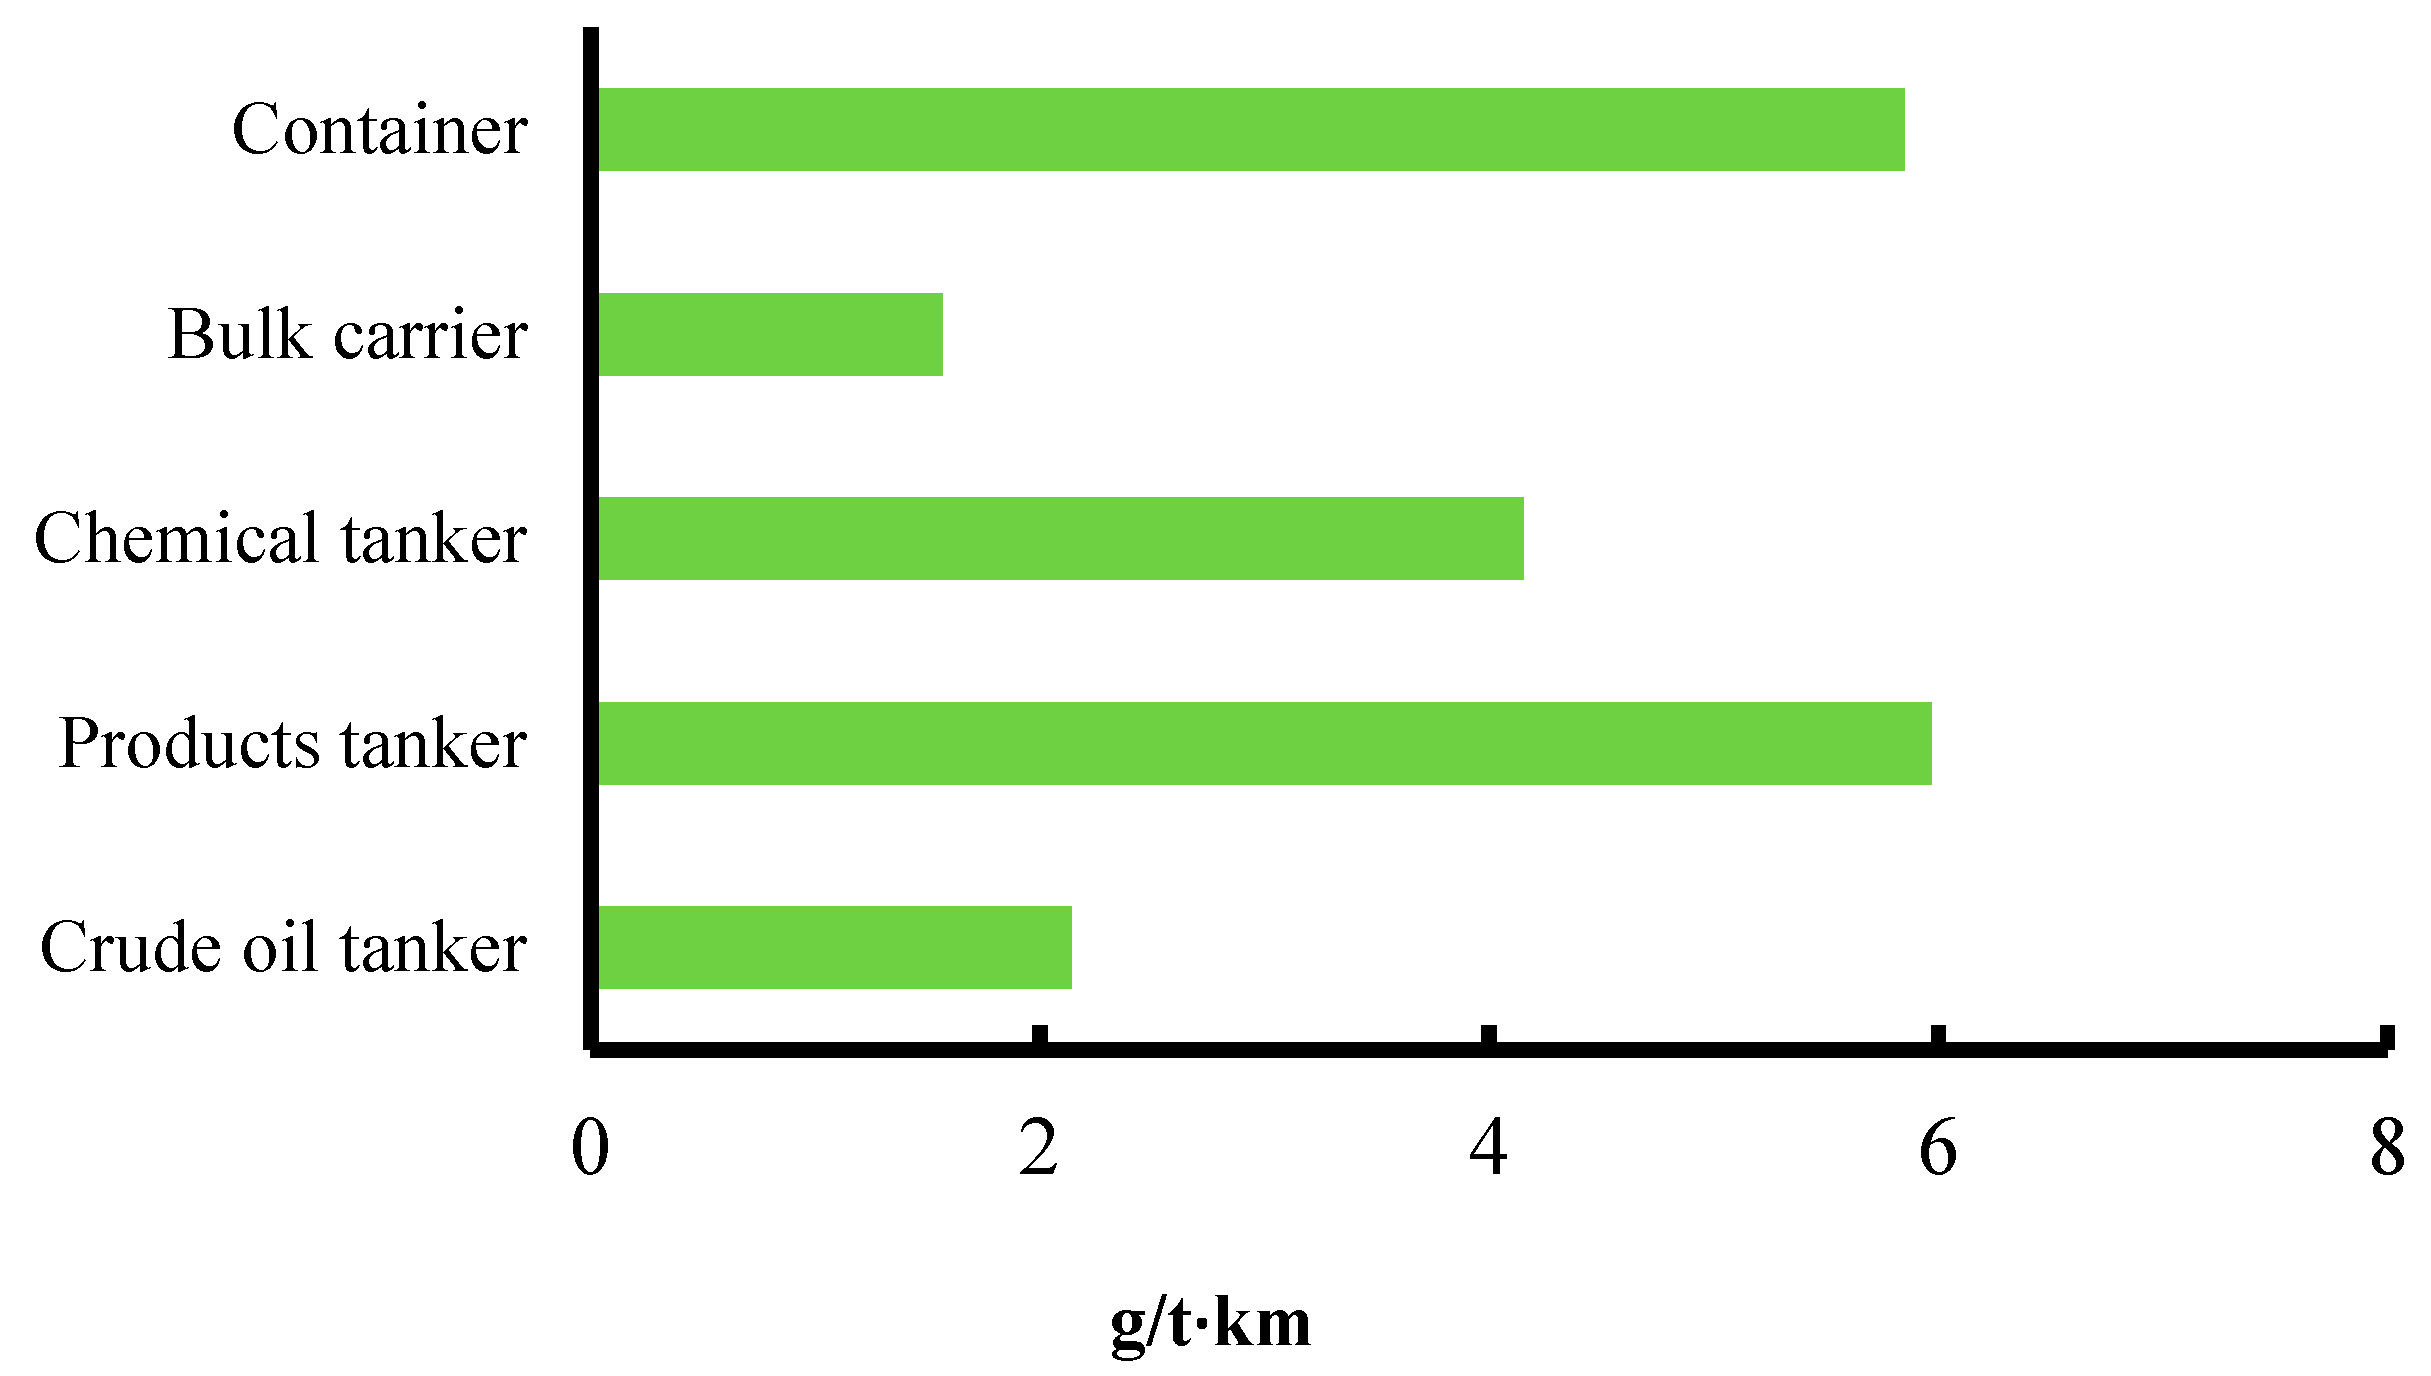
3.2.2. Energy Intensity

Energy intensity is used to measure the energy consumed per unit of activity, which is converted from the fuel consumption using the load capacity and load capacity usage rate [15]. According to the ship types and the CO2 emissions factor given in IMO [17] and Lee et al. [43], the classifications of five categories of vessels focused on ocean-going shipping are presented in Figure 1, which are considered as the baseline for the energy intensity in 2007.
Figure 1 shows the significant variances among the energy efficiencies of the major vessel types. Due to their high average speed and load capacity but smaller average size, the energy intensities of products tanker and container vessels are expected to approach 6 g/tonne·km, which is around three times and four times of that of crude oil tanker and bulk carrier vessels, respectively. When the energy efficiency development is assessed, it is expected to take into account improvements in technology, changes in the size of the ships, and market-driven reductions in fleet speed [44].
For future projection of energy intensity, it is believed that there will be a constantly declining trend of energy intensity in the future as technology improves [45]. Two scenarios were developed by IMO [27] describing the BAU scenario and an accelerated development scenario considering the energy intensity in 2007 as the base year. Under the BAU scenario with no new mitigation policy, we assumed the average rate of the efficiency of the vessels will decline by 12% and 25% compared to the base year (2007) by 2020 and 2035, respectively. Under the accelerated improvement scenario of S2, the decrease is estimated more aggressively, as shown in Table 1

3.2.3. CO2 Emissions Factor

The emission factors depend on the types of fuel, where we distinguish between residual fuel oil (HFO), low sulphur fuel oil (LSFO), marine gas oil (MGO, a distillate fuel) and Liquefied Natural Gas (LNG) [2]. According to the report of the IPCC [26], the ocean-going fleet are all expected to use HFO, the emission factor of which was estimated to be 3130 kg/tonne from 1999 to 2007, and decreased to 3114 kg/tonne from 2008 [2]. Under the BAU scenario, in the following decades the ocean-going vessels will all continue to be driven by HFO regardless of other possible new energy sources.
Based on the latest news from IMO in October 2016, there will be strict regulations focused on controlling the sulphur content in vessel fuels, which may propel development of a cleaner fuel, namely LNG fuel, which has a low carbon emissions factor of 2750 kg/tonne [2]. Compared to conventional fuel, the transition to LNG offers substantial advantages over petroleum fuels in 25% of the CO2 emissions reduction [46]. Another attractive advantage that can’t be ignored is the lower price of this cleaner energy. Switching to LNG fuel meets the stricter pollution regulations of the IMO, controlling the air quality and reducing harmful air pollutants below all current and proposed emissions standards [47]. Therefore, we also design a more environmentally friendly scenario, S3, to describe a fuel mix scenario based on the report of the IMO [2]. Under the S3 scenario, LNG infrastructure and LNG fuelled vessels are projected to accelerate development, as presented in Table 2.

4. Results and Discussion

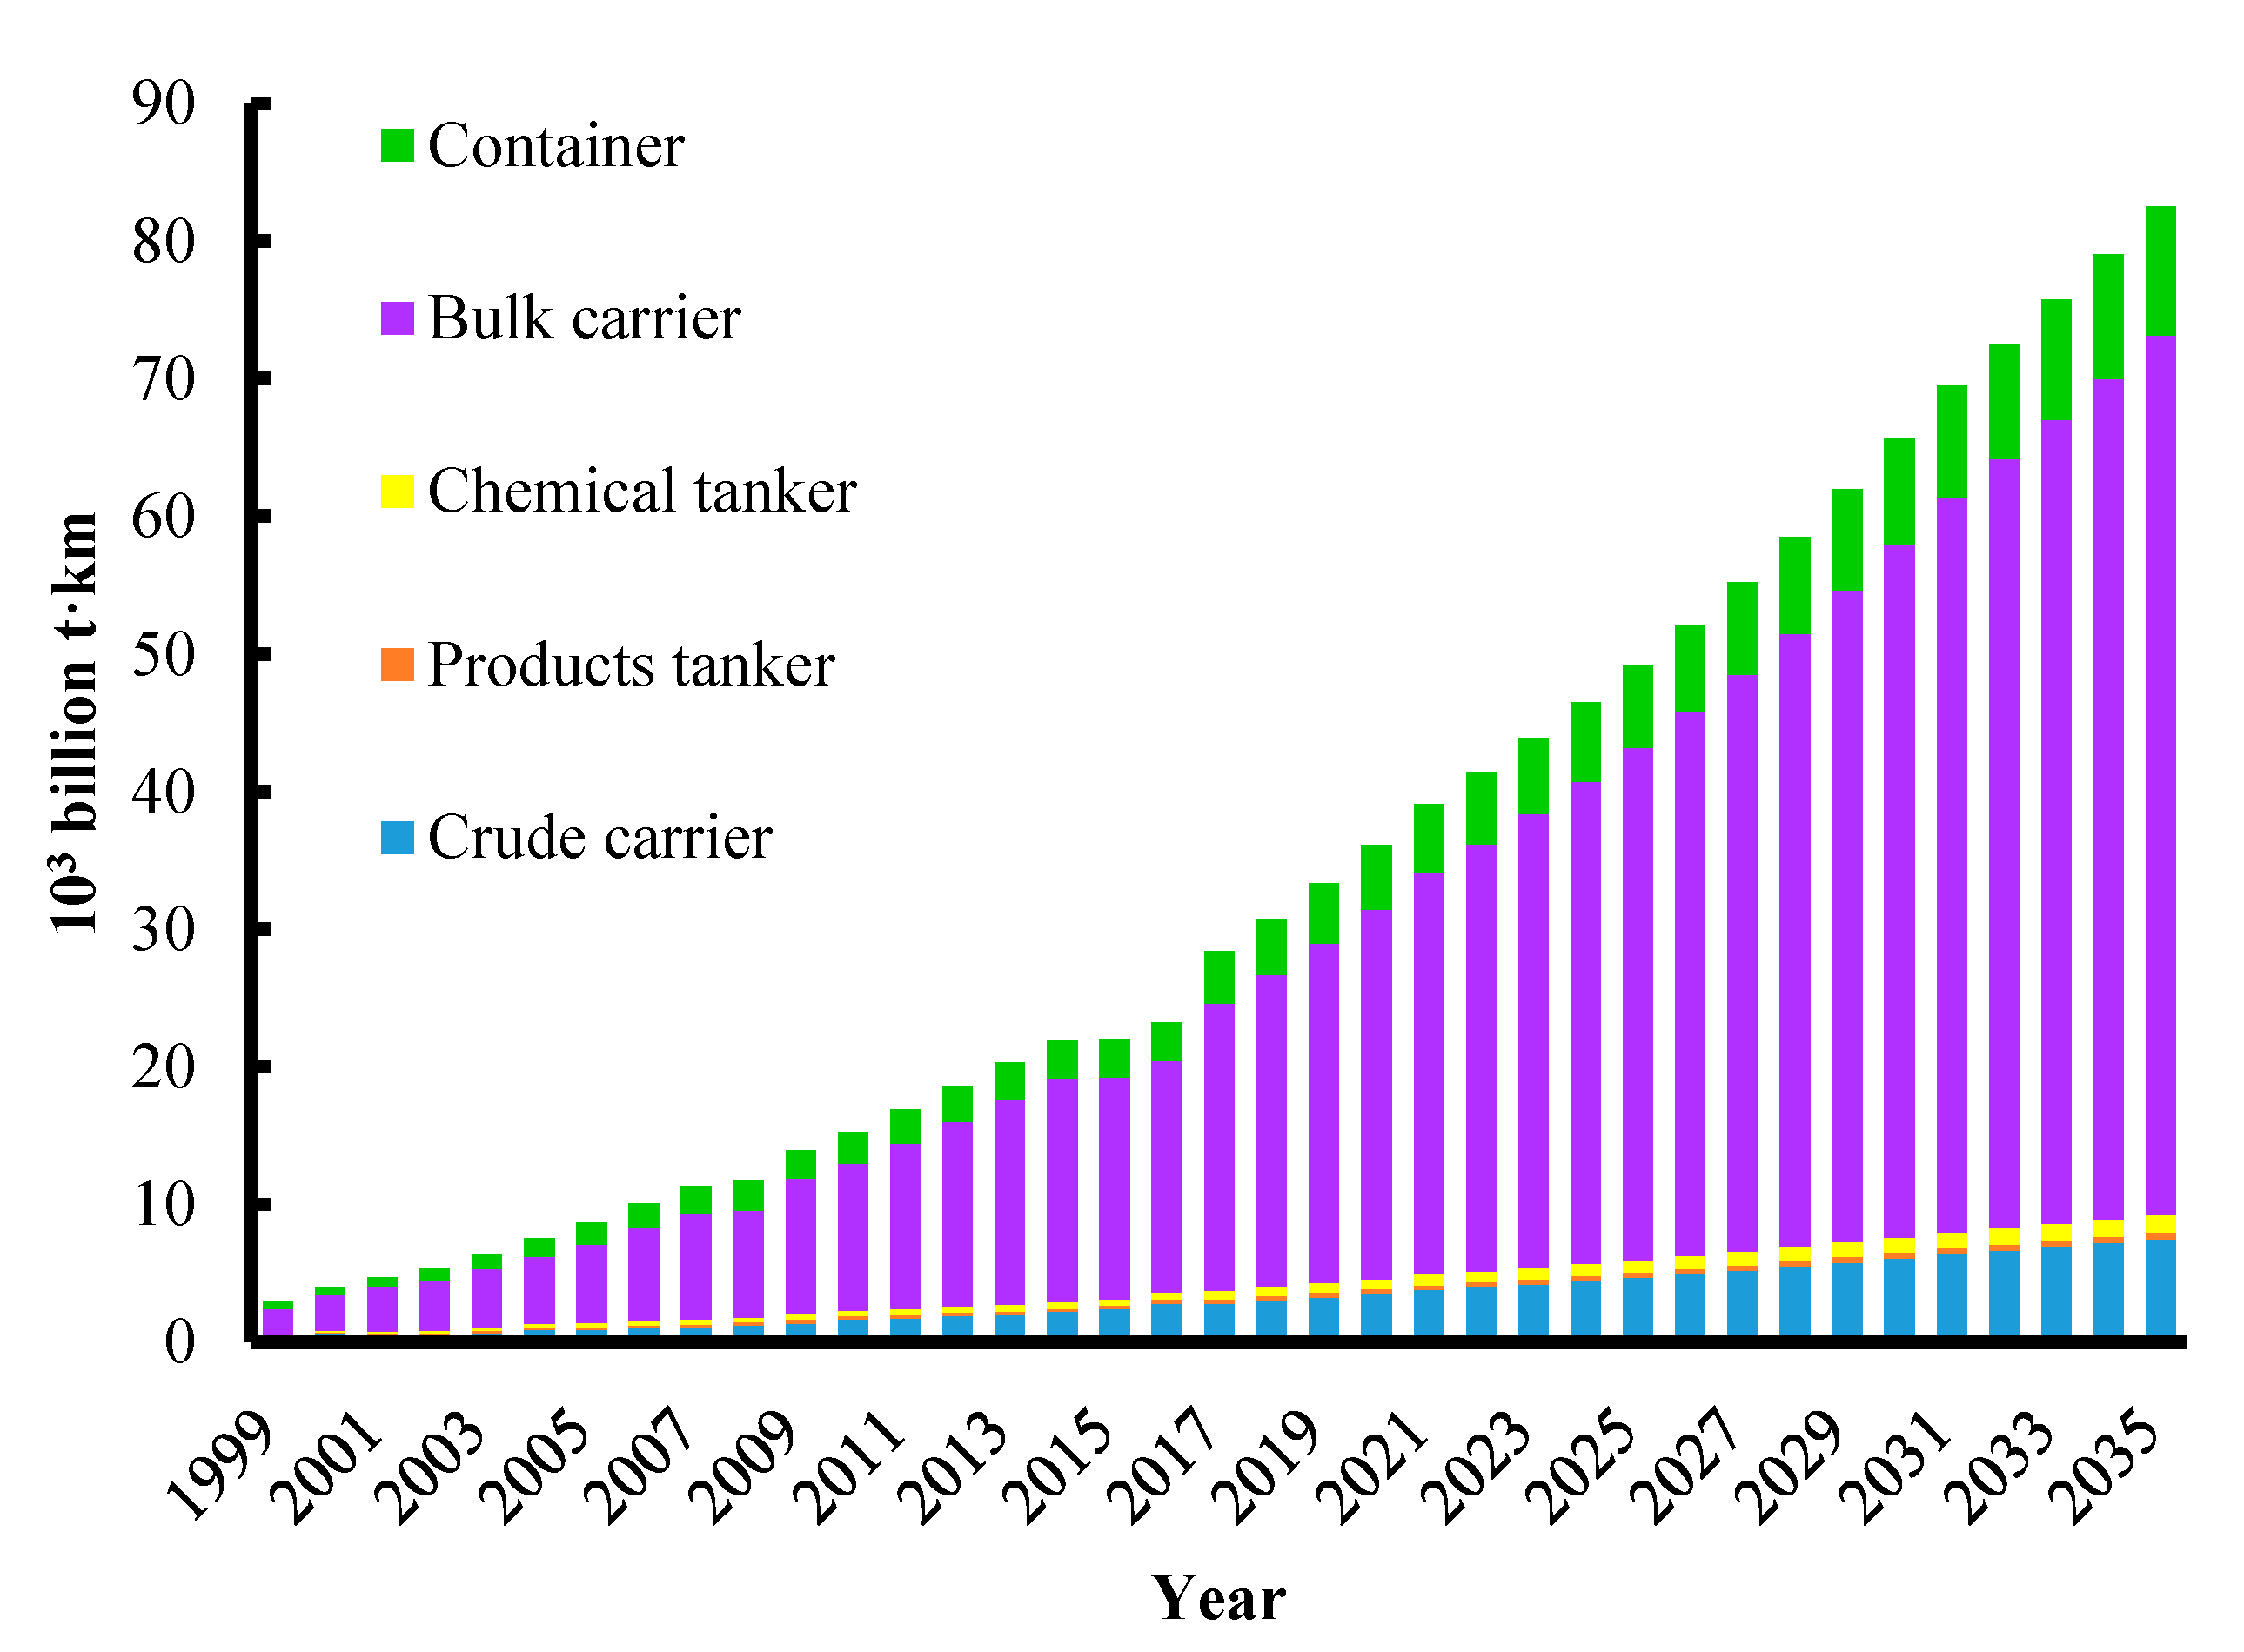
4.1. Trend of Transport Demand

Based on Equation (4), the Log-linear regressions of each scenario were calculated using the SPSS software. All of the five categories: crude oil tanker, products tanker, chemical tanker, bulk carrier, container, and their dependent variables of transport turnover volumes were described as linking closely to variable of GDP. The coefficients of correlation (r2) of the five models are 0.967, 0.802, 0.895, 0.980 and 0.907, respectively. Taking the model of the crude oil tanker as an example, the result implies that from 1999 to 2016, the GDP of China can explain the relative majority (96.7%) of the variability in the transport demands of crude tankers. The relationship between the transport demand of the product tanker and GDP is not as strong as the other four categories, since it has the lowest coefficient (0.802), which can be considered to be a rational result greater than 0.8. Figure 2 presents the historical transport turnover volume from 1999 to 2016, as well as the projection through 2035 based on Equation (4).
Generally speaking, all of the turnover volumes will grow steadily over the long-term future through 2035 under the BAU scenario. Due to the close relationship with the people’s livelihood and economic growth, bulk carriers are estimated to perform best over the decades because they are responsible for carrying grains and coals. The share of bulk carrier transport has grown rapidly over recent years from 1870 billion tonne km in 1999 to 63,850 billion tonne km in 2035, occupying over 77% of the overall transport demand. Conversely, the proportions of other four categories are projected to decline. In 2035, container vessels have the second largest transportation demand, with its share maintaining at around 11% of the total transport turnover volume, following by crude oil tankers at 9%. Transport demands by product tankers and chemical tankers are relatively low, together accounting for around 2% of the total turnover volume in 2035.

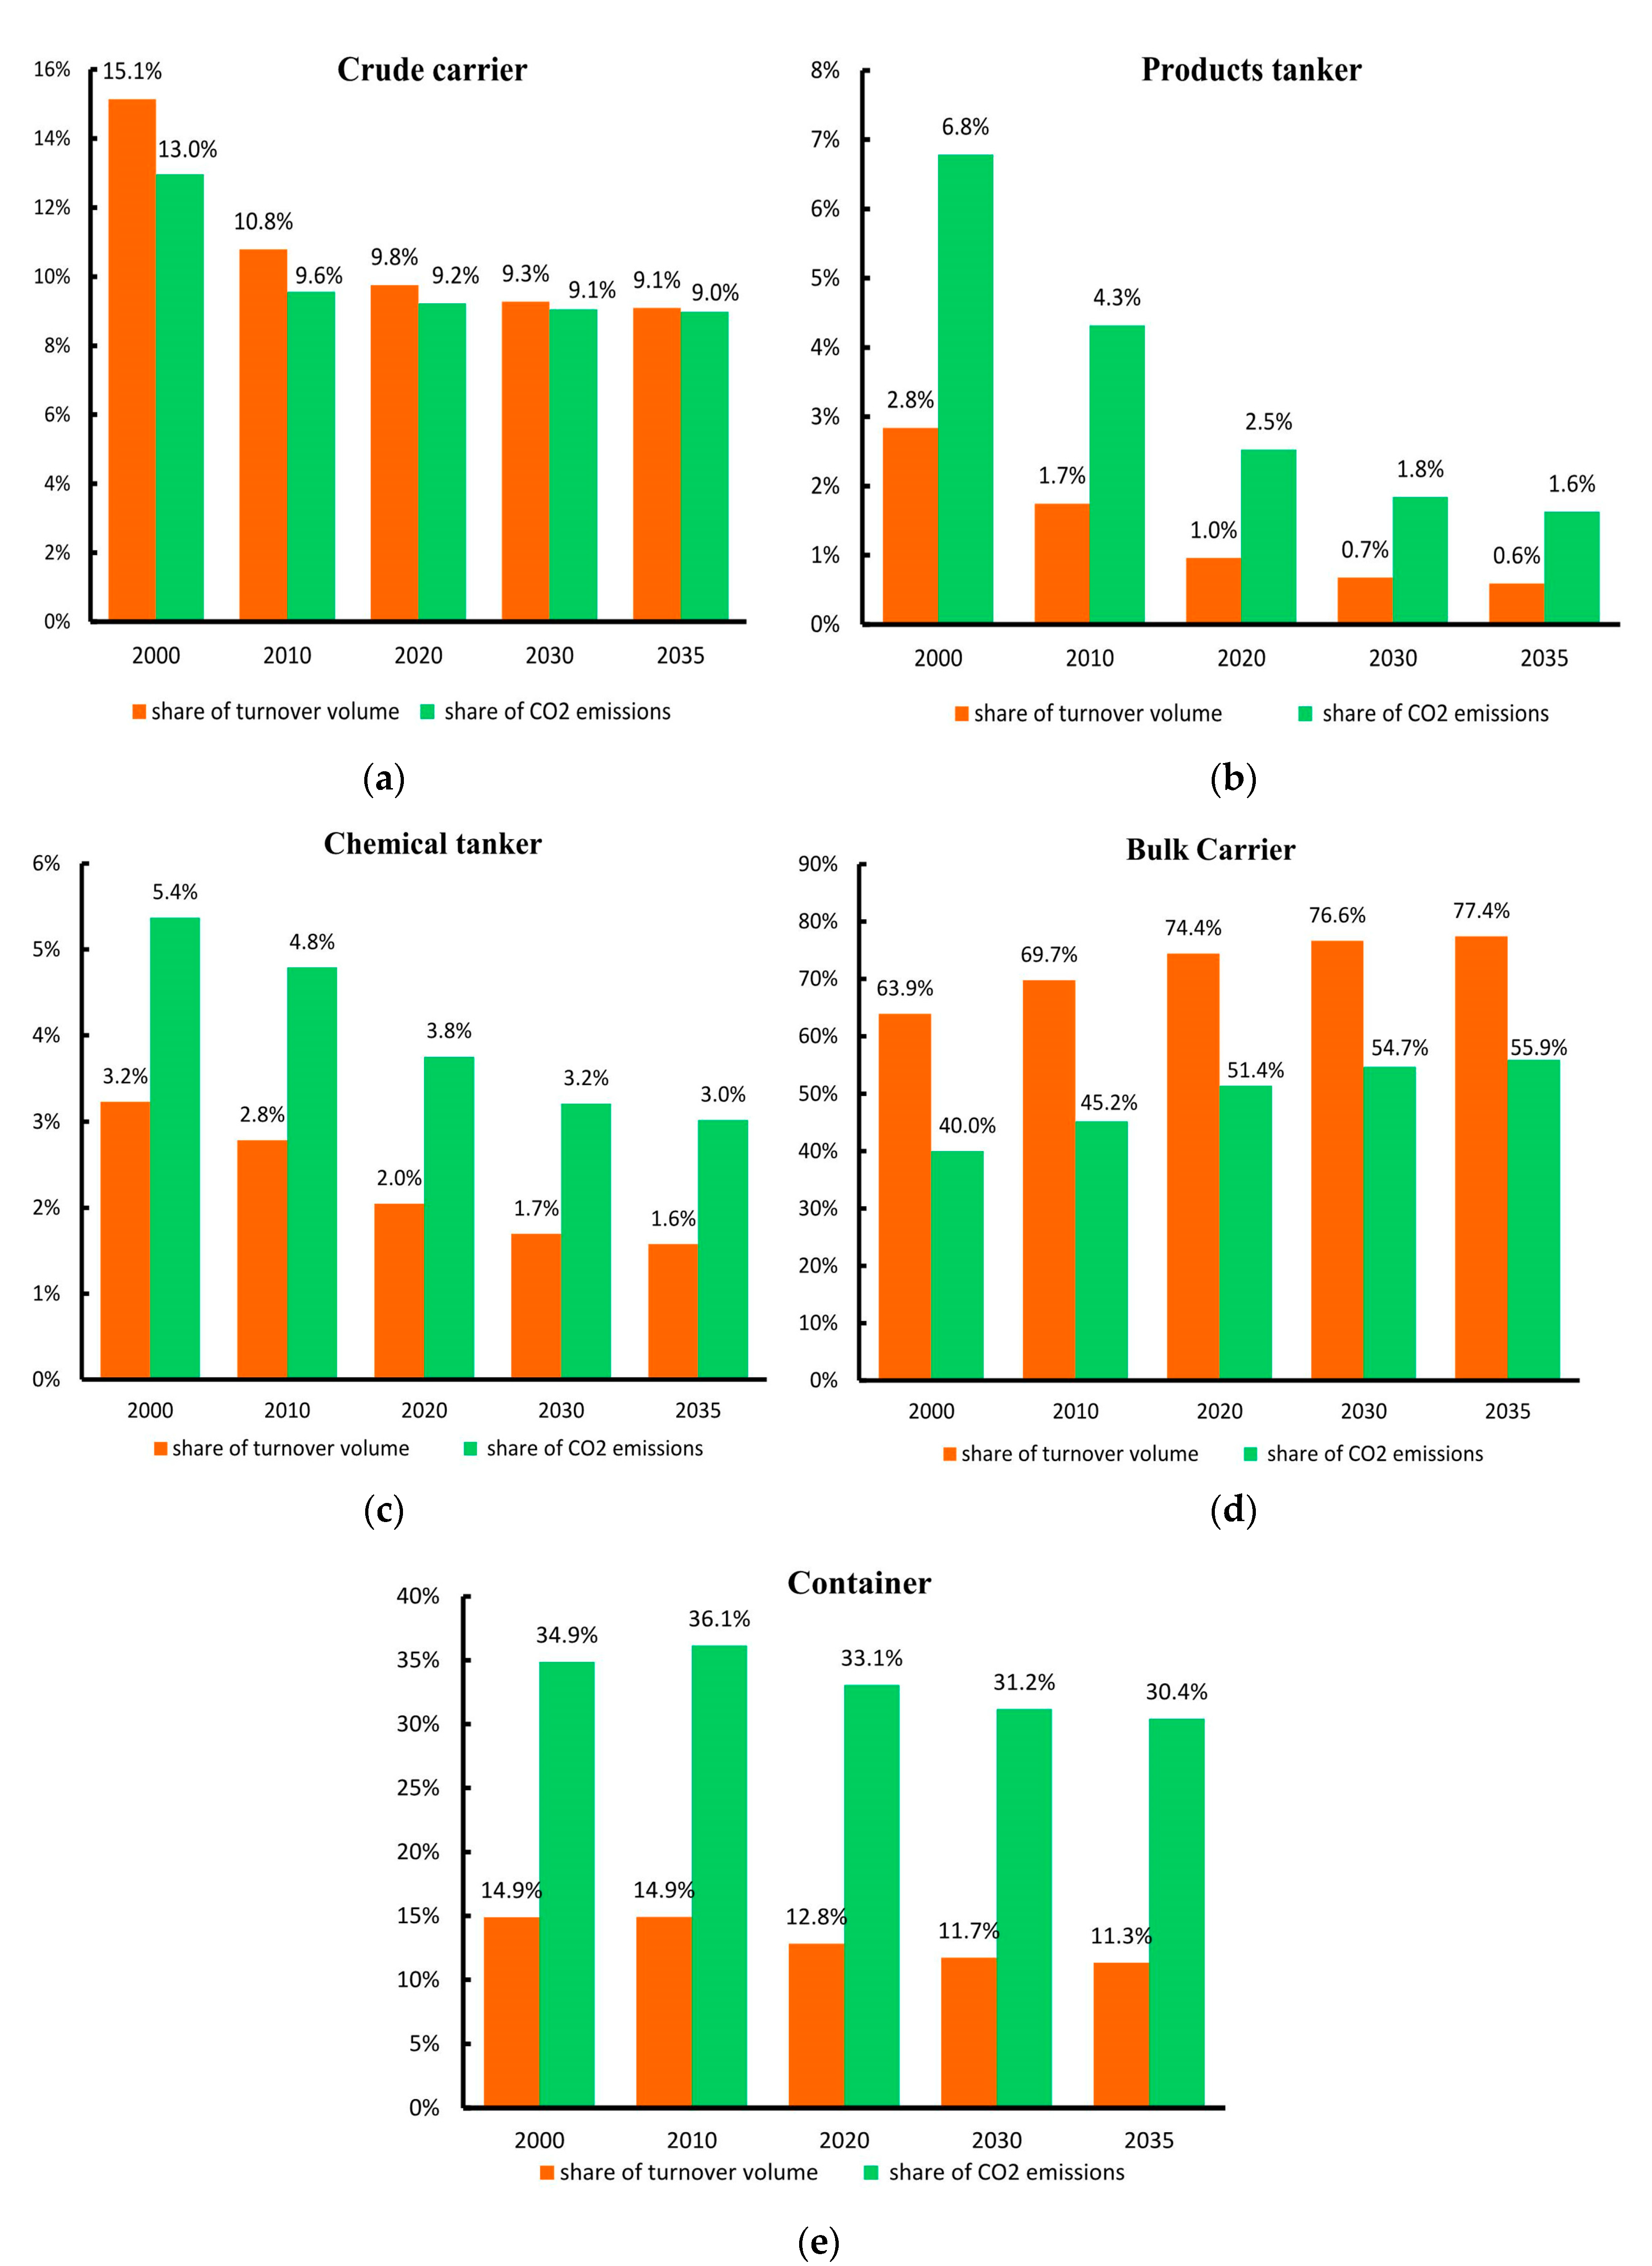
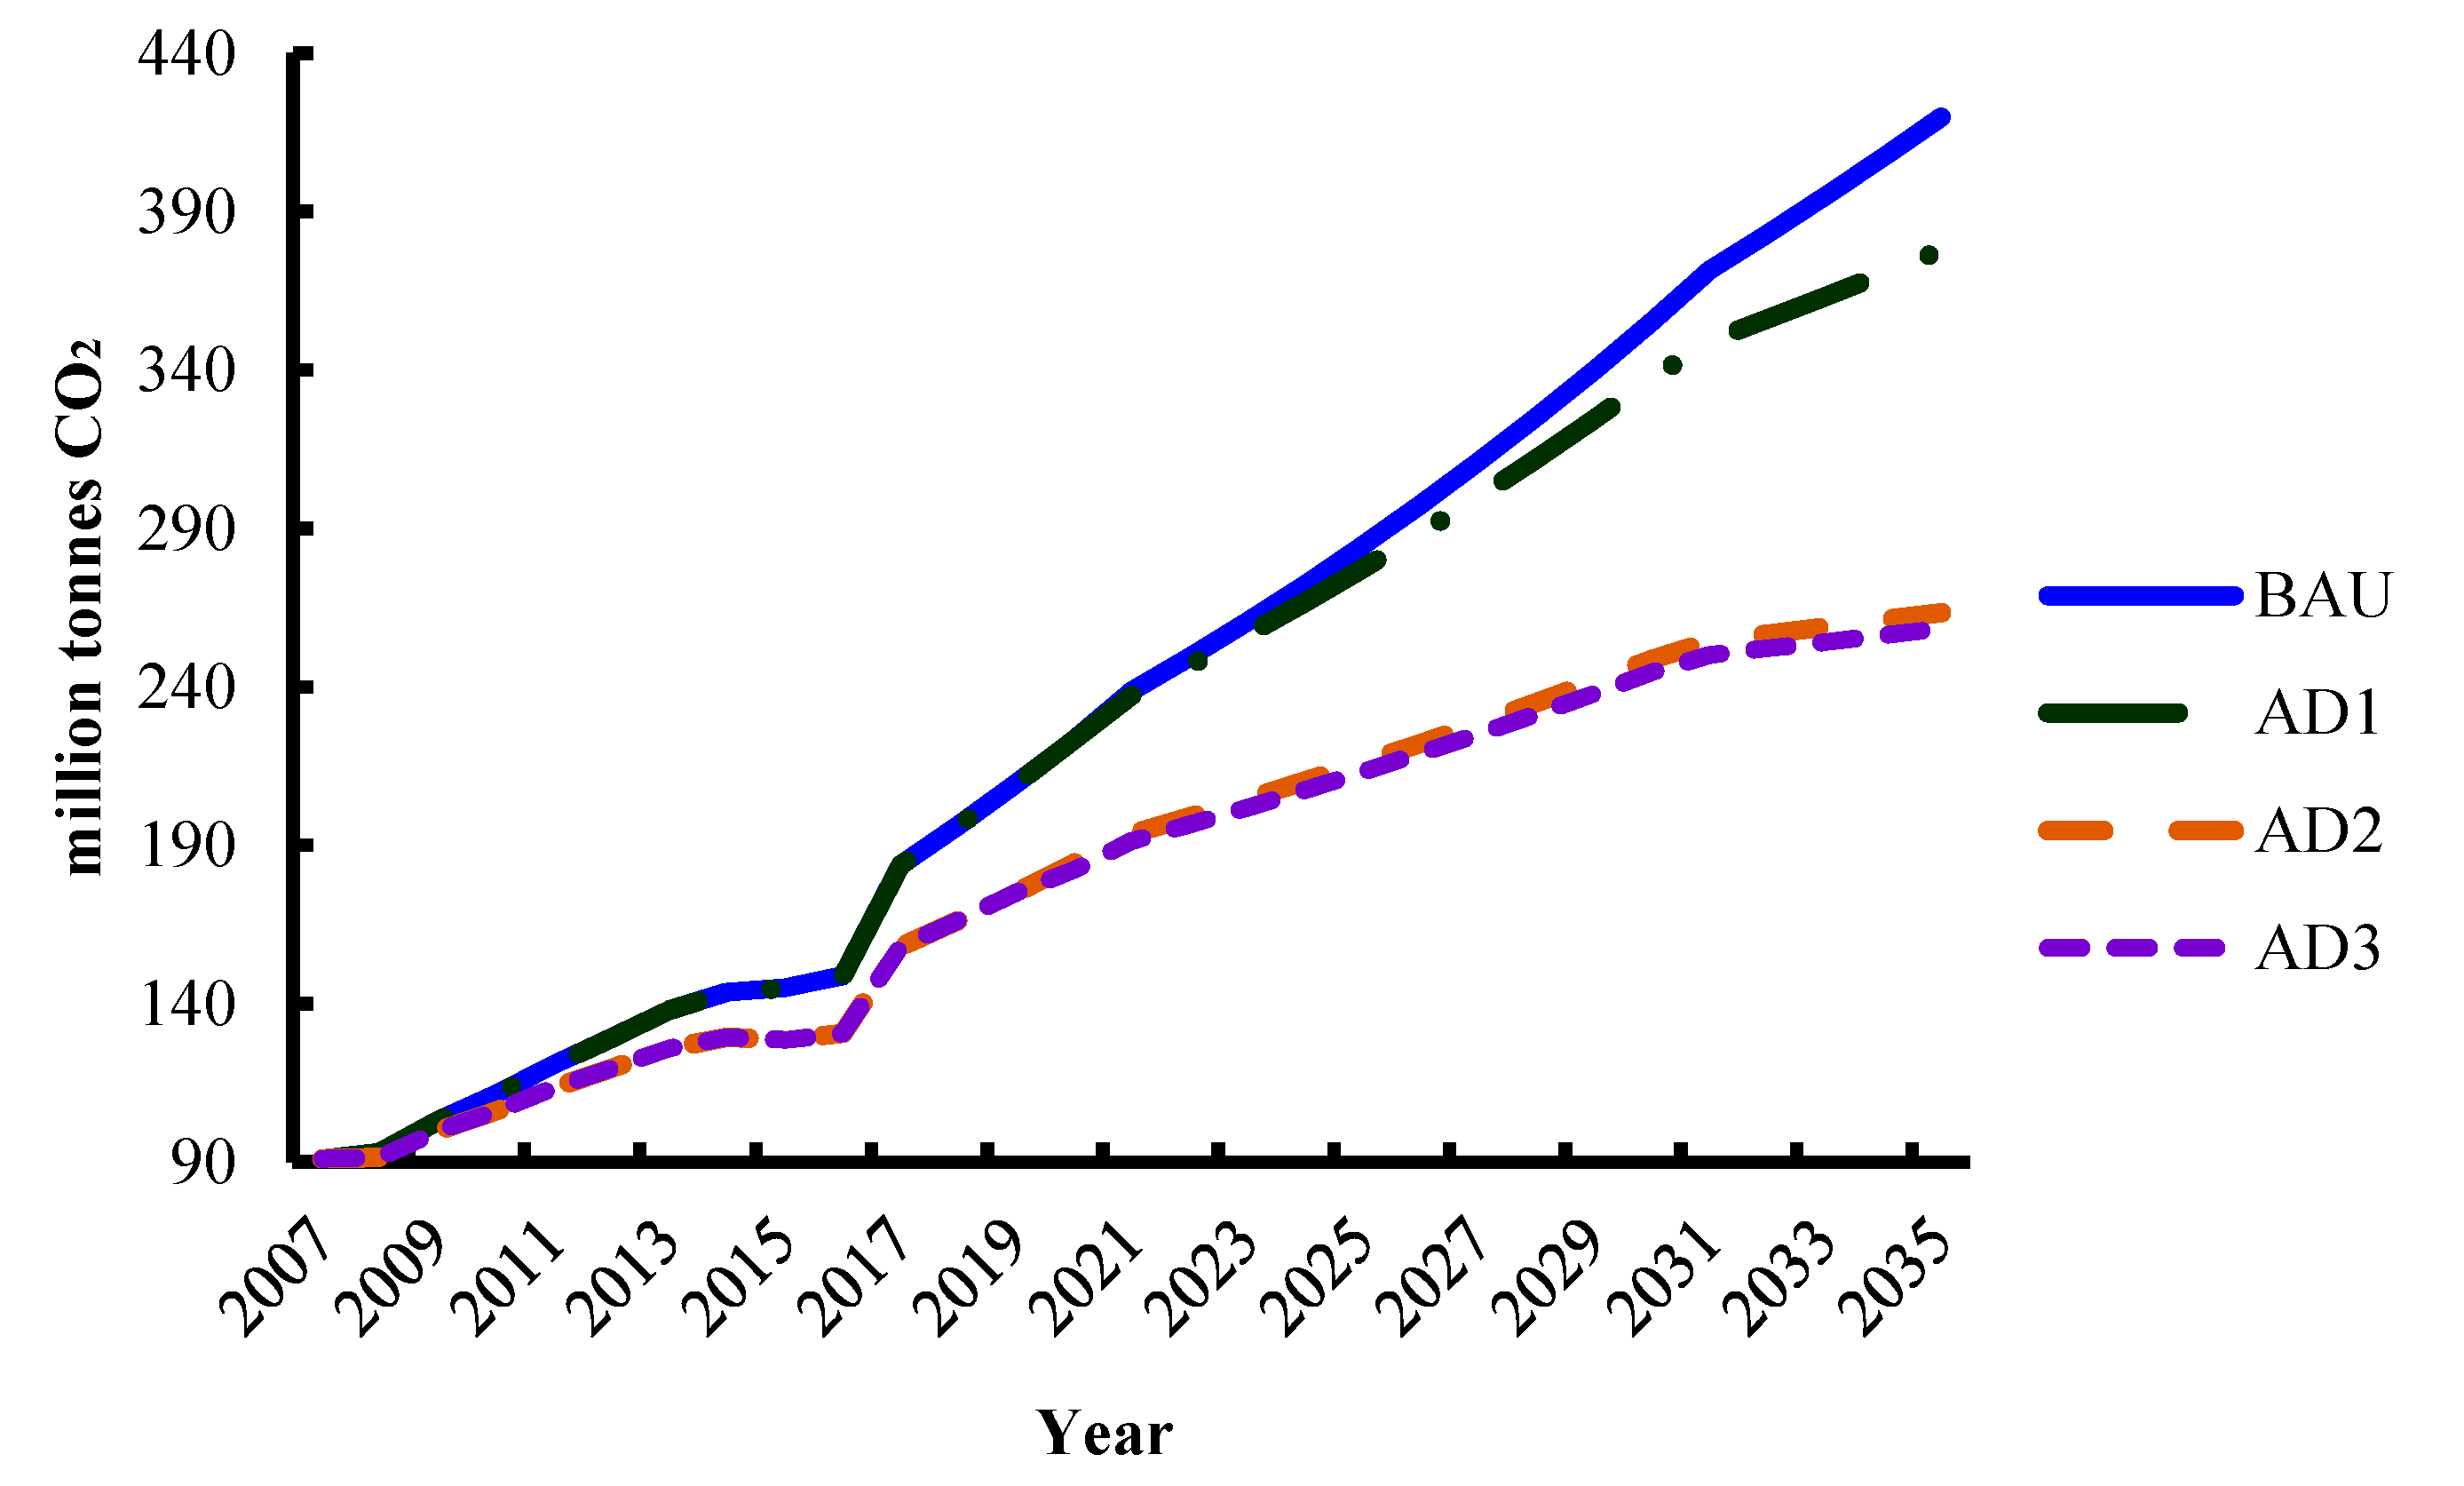
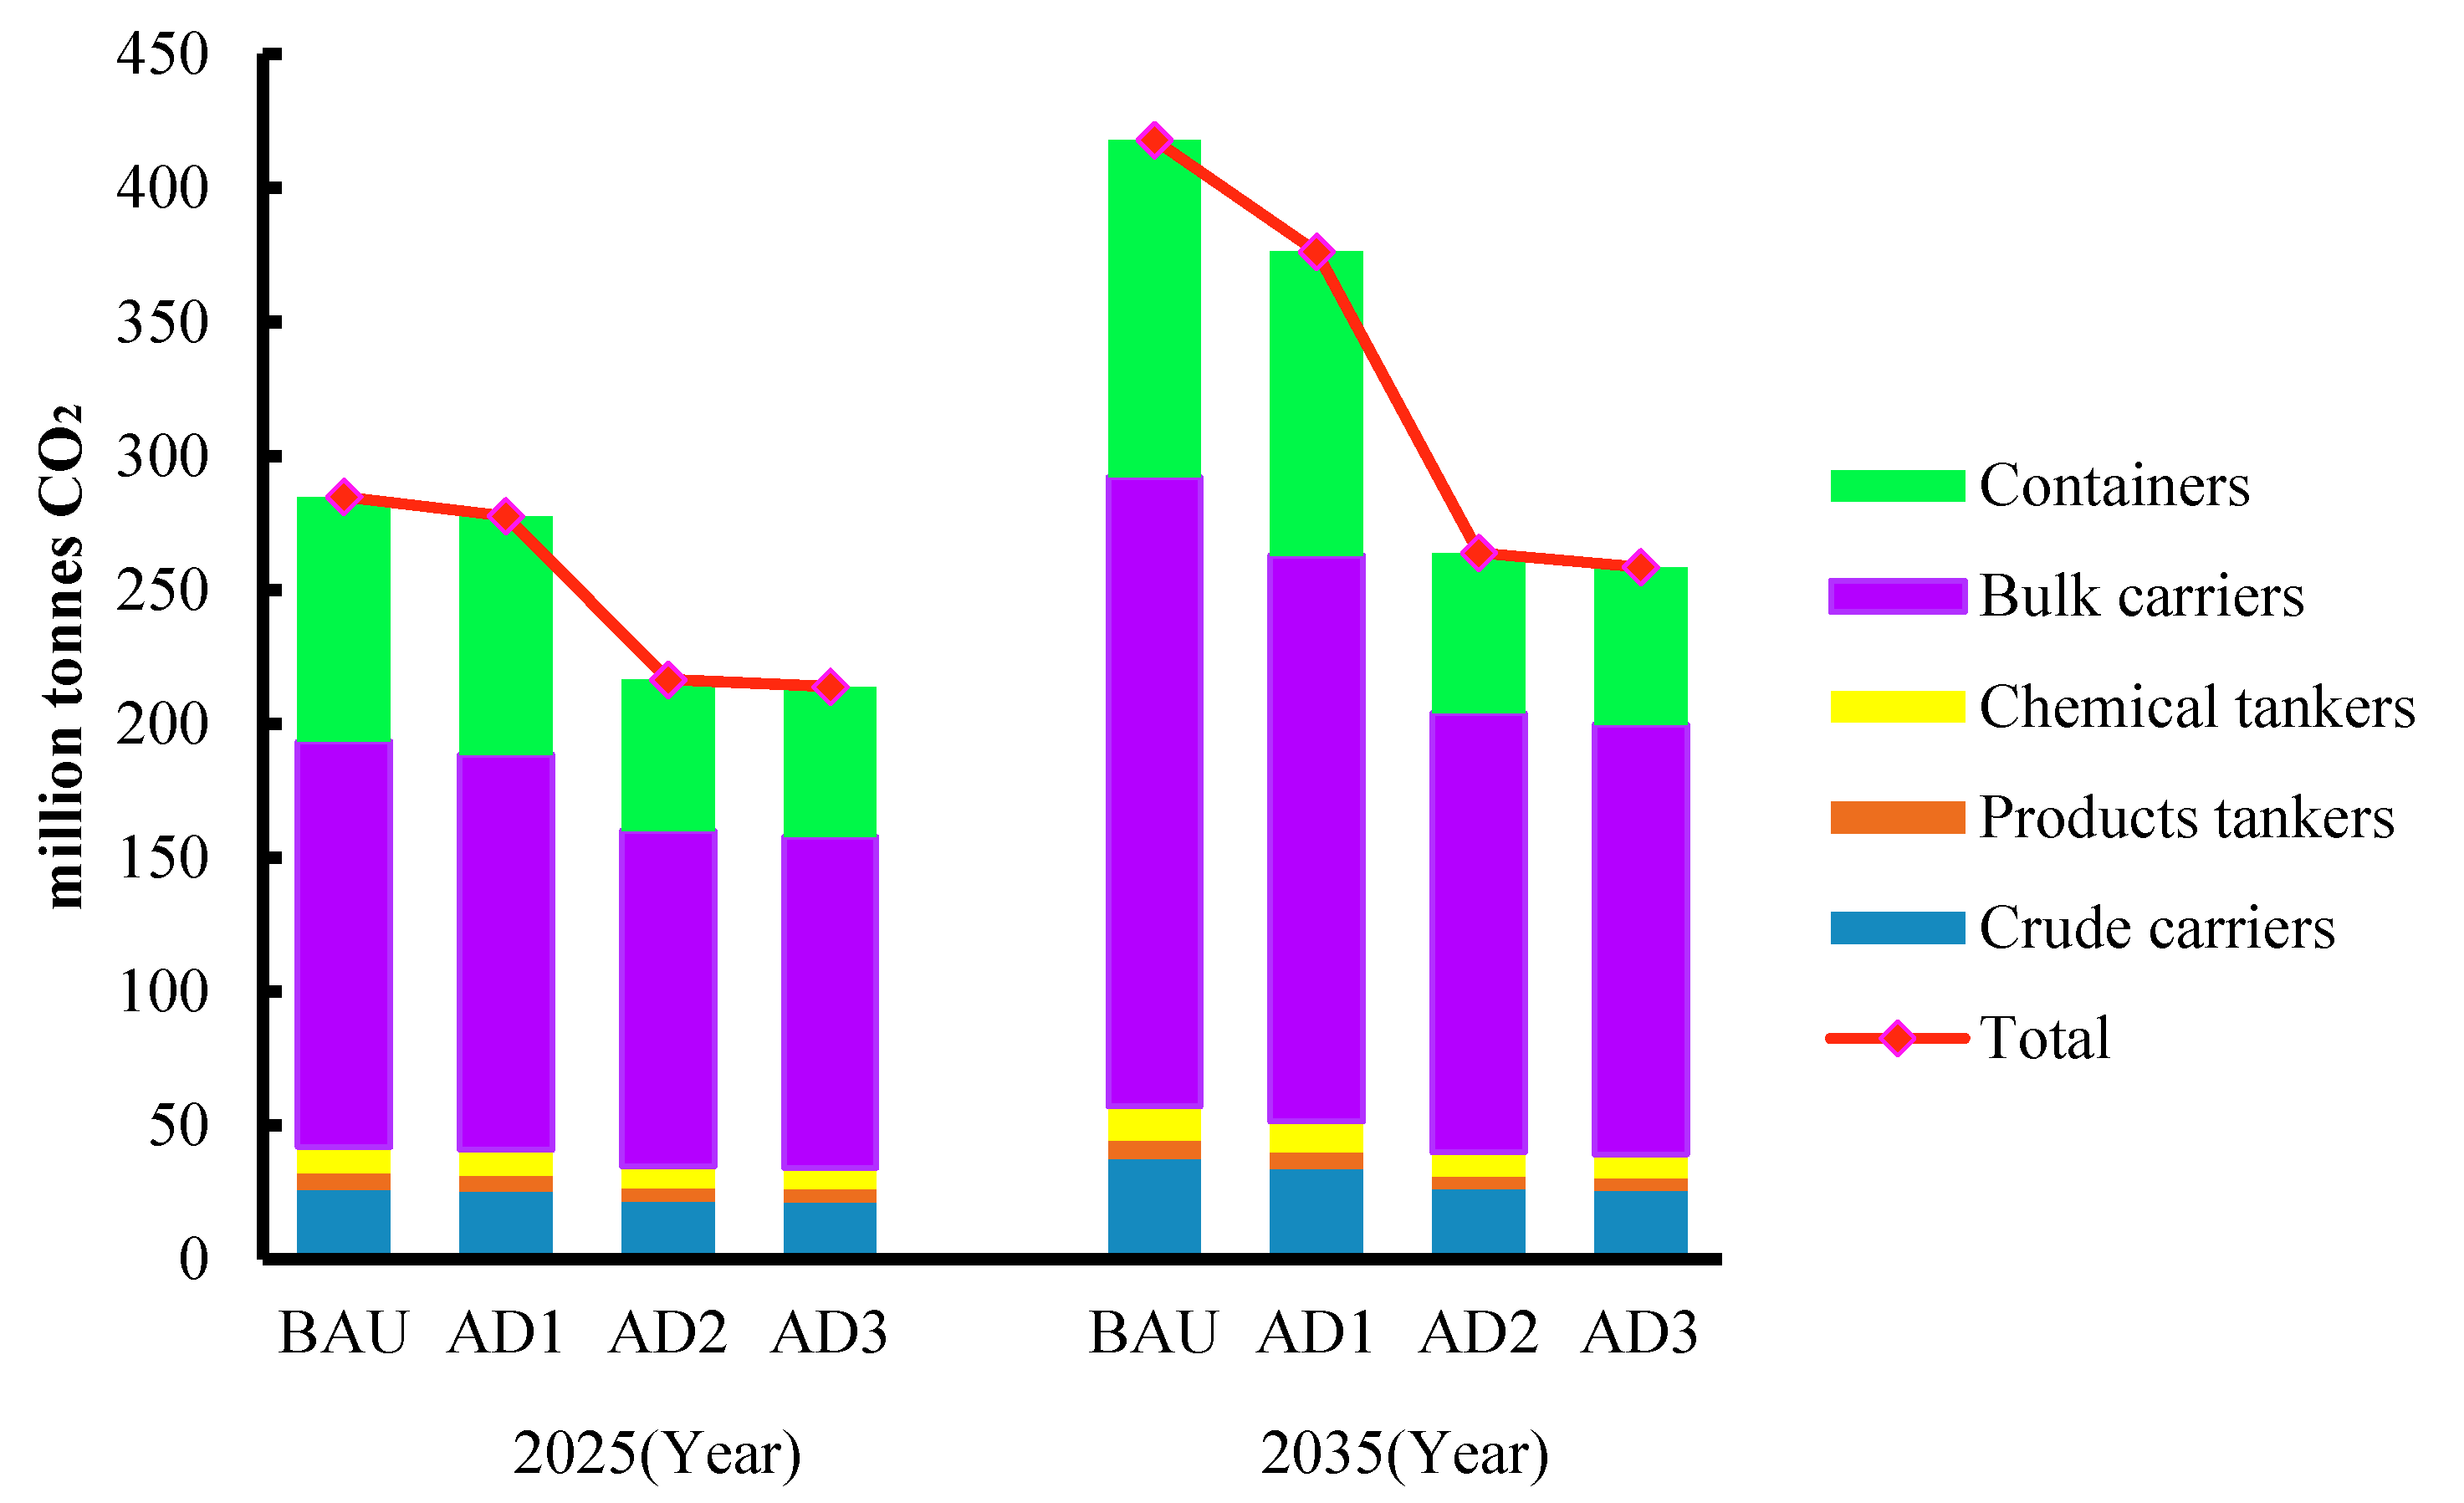
4.2. Trends of CO2 Emissions in Various Scenarios
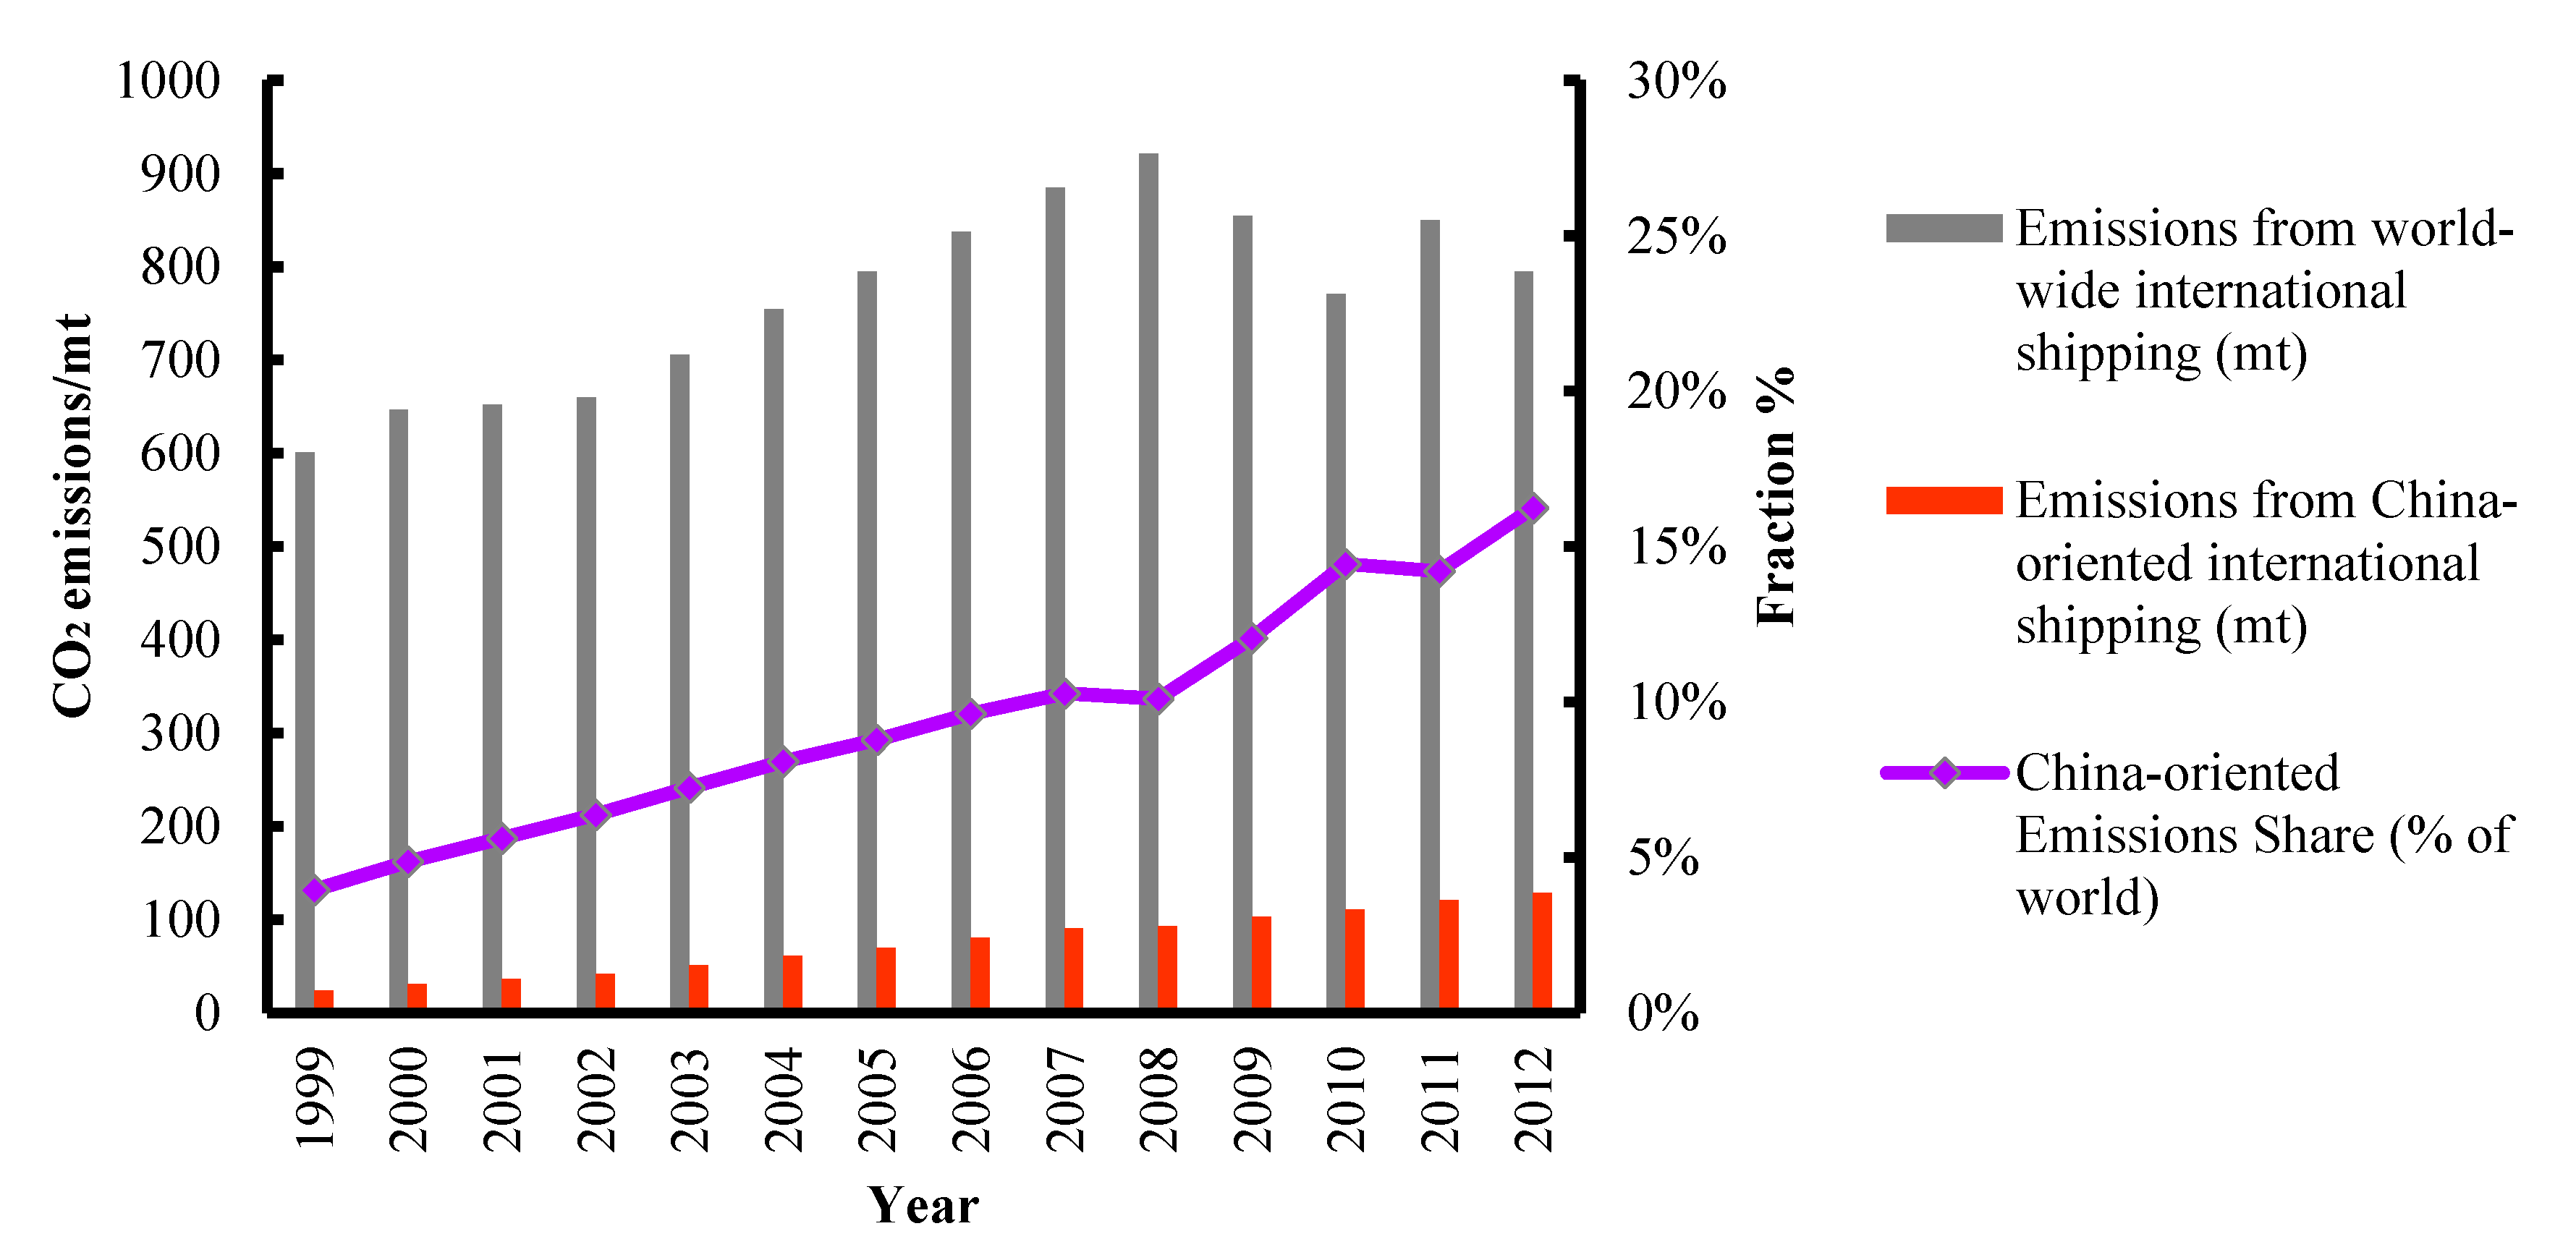
As shown in Table 3, four alternative scenarios were developed in this study, based on the multiple projections of scenarios for key factors presented in Section 3. When all of the inputs and policies continue their current development trends, these inputs constitute the BAU scenario of the CO2 emissions trend. Three alternative scenarios were also established considering convergence and mitigation. Accelerated development scenarios (AD) describe worlds that have the advantages of rapid improvement in transport infrastructure, technology and cleaner energy, as presented in Table 3. In this study, AD1, AD2 and AD3 present accelerated development situations to varying degrees.

4.2.1. BAU Scenario

Based on the calculation of the turnover volume using Equation (3), the CO2 emissions of marine transport can be estimated using the activity-based methodology of Equation (1) and Equation (2), as shown in Figure 3.
Figure 3 presents the future projection of CO2 emissions in the China-oriented international seaborne trade sector. Generally, aggregated CO2 emissions are predicted to increase at an average annual growth rate of 8.3% and to reach 419.97 Mt in 2035, which is nearly 4.5 times that of 2007. Specifically, the increasing rate of the aggregated CO2 emissions is projected to be 13.4%, 7.2% and 4.7% during each decade after 2000, respectively. Due to the estimated slowdown in economic growth after 2030, the growth rate of the CO2 emissions is projected to decrease to 3.4% from 2030 to 2035. As shown in Figure 3, CO2 emissions from China-oriented international seaborne trade had higher growth rates according to the historical data, and they might increase considerably over the long term, driven largely by a booming economy and globalization of trade.
The breakdown of CO2 emissions by each category every decade from 2005 to 2035 are shown in pie charts in Figure 3. In 2005, CO2 emissions from bulk carrier and container vessels were estimated to contribute equally to overall emissions with the same share of about 40%.Emissions by bulk carriers were likely to expand greatly with a pace notably faster than the historical basis, which can be attributed to the accelerated urbanization of China in recent years. The building of infrastructure in cities is the force driving the increased demand for iron ore, coal, and other kinds of energy by seaborne imports. It is predicted that bulk carrier vessels will be responsible for more than half of the aggregate emissions, which is likely to result in a decline in the shares of the other four categories in 2025. According to our forecasting, the proportion of bulker vessels will increase constantly in the following years, standing at 56% in 2035. Container vessels will still be the second largest emitter, though their proportion is estimated to show a downward trend from 40% in 2005 to 30% in 2035. By contrast, the increasing rate of CO2 emissions created by the crude tanker sector seems to be fairly constant at around 10%, fluctuating little over the long-term. Products tanker and chemical tanker vessels were projected to contribute 11% of the overall CO2 emissions together in 2005. Quantities of CO2 emissions from these two sectors are projected to increase constantly over the long-term, due to the slower growth in demand. Both of these two categories are likely to experience a decrease in share, only accounting for 5% together in 2035. The CO2 emissions produced by each category are estimated to grow in the coming decades, though the rates of increase paces are diverse. The average annual growth rate of CO2 emissions from the bulk carrier sector stays at around 9.4%, followed by the crude oil tanker sector with a rate of 8.2%. Container and product tankers are predicted to have a slower pace than the two categories mentioned above, at around 7.7% and 6.2%, respectively.
It is noted that on two occasions the quantity of the emissions barely changes from the previous year, as shown in Figure 3. The first fluctuation appeared between 2007 and 2009. During that period of time, the world was suffering from the financial crisis, which was likely to have a negative impact on marine transport. The CO2 emissions from China-oriented seaborne trade remained almost constant because of the economic recession at that time. Regarding the fluctuation from 2014 to 2016, one of the factors contributing to the small change in the CO2 emissions of the bulkers may relate to the slowdown in the China’s steel industry from 2014. Due to the market downturn of Chinese steel manufacturing, the demand for marine transport for imported iron weakened, contributing to a certain degree of decline in the CO2 emissions in the bulker carrier sector. The decrease of turnover volume in Chinese seaborne coal imports is considered to be another significant factor. A series of policies was implemented by the Chinese government to curb the rise in domestic coal prices and ease the tight domestic supply. The authority also took other measures to boost China’s domestic coal supply and raise coal production, in order to reduce coal imports [3].
A comparison of the proportions of the transport turnover volume and the CO2 emissions in the five vessel categories is shown in Figure 4. Energy efficiency plays a significant role in the CO2 emissions produced by marine transport. As Figure 4d,e show, the turnover volume of the bulk carrier sector accounted for 63.9%, over four times that of container vessels in 2000. However, in terms of the CO2 emissions produced by these two categories, bulk carrier and container vessels accounted for 40.0% and 34.9% of the turnover volume, respectively. It is the high energy efficiency of bulk carrier vessels that contributes to reducing the gap in the CO2 emissions between bulker vessels and the other categories. With regard to container vessels, the turnover volumes of the container and crude oil tanker sectors contributed equally in the year of 2000 with similar shares of around 15%, as shown in Figure 4a,e. The energy intensity of container vessels was much higher, at approximately 2.5 times that of crude oil tankers, which propelled the container ships to occupy the second largest part of total greenhouse gas emissions instead of crude oil tankers. In 2035, bulk carrier vessels are projected to dominate the total turnover volume, accounting for over 77%, while emissions from bulk carrier vessels represent 56% of the aggregated CO2 emissions. Due to the significant variances in the energy efficiency of the different categories of vessel, the contributions of the five categories toward CO2 emissions turned out to be considerably different from their respective transport turnover volumes.
According to estimations of the world-wide international shipping CO2 emissions provided by IMO [2,27], during from 1999 to 2012, a comparison of CO2 emissions by international shipping and China-oriented international shipping is presented in Figure 5.
Generally speaking, the proportion of China-oriented CO2 emissions shows a considerable increasing trend during 1999 to 2012, with moderate fluctuation. In 1999, CO2 emissions from world-wide international shipping were estimated to be 601 Mt [27]. According to our analysis, China-oriented international seaborne trade reached 23.82 Mt, only accounting for 4% of the total emissions. As presented in Figure 5, the annual growth of CO2 emissions created by China-oriented seaborne transport was significantly faster than the increasing rate of the worldwide CO2 emissions. The China-oriented marine trade was responsible for 16.6%, approximately one-sixth of the overall international shipping CO2 emissions in 2012.

4.2.2. AD Scenarios

Figure 6 describes the trend in the aggregated CO2 emissions in the China-oriented international marine trade sector in the long-term future from 2007 to 2035. BAU is the baseline scenario, which reflects all the factors continuing their current trends and avoiding consideration of newly emerging policies. The AD1, AD2 and AD3 scenarios were designed to reflect possible projections of energy consumption and CO2 emissions from China-oriented international seaborne trade, as described in Table 3. The figures between 1999 and 2006 are omitted due to their having same input origin. As shown in Figure 6, in 2035, the CO2 emissions are likely to have a relatively extended range from 258.47 Mt to 419.97 Mt, which is 2.8 times to 4.5 times that in 2007. Under the most optimal case, AD3, which benefits from superior mitigating conditions including a decline in transport demand, advanced technology innovation and alterations to the fuel mix, the CO2 emissions show an upward trend approximately approaching three times that of 2007.
In 2035, CO2 emissions will be reduced by 10%, 37% and 39% under the AD1, AD2 and AD3 scenarios, respectively. This means that mitigation of the transport turnover volume, technology improvement and clean energy usage contribute to 10%, 30% and 2% of the overall CO2 emissions mitigation, respectively, converting the BAU scenario to the AD3 scenario. Energy intensity is the only input that differs between the two scenarios of AD1 and AD2. Therefore, technology improvement has a significant positive impact on CO2 mitigation (30%). As shown in Figure 6, there is no obvious gap between the AD2 and AD3 scenarios with the introduction of LNG fuel. To some extent, the assumption of the small proportion of LNG powered ships in this study is responsible for the small gap.
A breakdown of CO2 emissions of each category in 2025 and 2035 under the various scenarios is presented in Figure 7. In the short-term future of 2025, the CO2 emissions of the five categories under the ADs scenarios will not decrease significantly due to moderate mitigation of the specific inputs. In the long-term future of 2035, bulk carrier vessels will contribute the most to the overall CO2 emissions reduction. From the BAU scenario to the AD3 scenario, CO2 emissions produced by bulk carrier vessels are reduced by 74.23 Mt, accounting for 46% of the overall reduction.
According to our analysis, the designed scenarios vary significantly in their projections of aggregated CO2 and breakdown of each category. The variation is mainly attributed to their different assumptions concerning turnover volume, technology conditions and fuel usage. There is considerable uncertainty concerning the forecasting of CO2 emissions from international ocean shipping, as has been mentioned in previous studies [25]. In terms of the historical data collection, voyages of the international seaborne trade will always involve China and various countries, making moving distance data collection more difficult. Additionally, the forecasting in this study is based on the BAU scenario and three other designed scenarios according to the official historical data. All the scenarios we developed are based on current trends and specific assumptions for the input factors. We can’t predict unforeseen issues, such as a further financial crisis or the emergence of new policies, which might contribute to change the aggregated CO2 emissions significantly.

5. Policy Implications in China

The China-oriented CO2 emissions we focused on are composed of three parts, including the emissions in Chinese territorial waters, international bodies of water, and the territorial waters of destination (origination) countries. Doubtless, increasing CO2 emissions from the international marine trade will bring about negative environmental impacts to China, which can’t be ignored by authorities. Based on our estimation, the aggregated CO2 emissions are predicted to reach 419.97 Mt under the BAU scenario, and 258.47 Mt in the best scenario, 4.5 times and 2.8 times that of 2007, respectively. However, CO2 emissions will not be reduced under the current situation with no new mitigation policy, because international commercial trade is not expected to decline. Therefore, our estimation of the CO2 emissions in the China-oriented international seaborne sector is likely to provide a significant reference for authorities to take necessary measures to identify and mitigate CO2 emissions produced by the international marine trade in Chinese territorial waters. Specific policies for mitigation are expected to be introduced progressively.

5.1. Monitoring and Identifying Measures

The foundation of formulating a policy is to acquire accurate information for CO2 emissions from the portion of China-oriented marine trade produced in China. Quantifying CO2 emissions is an urgent affair that is required to define objectives for carbon reduction. As a developing country, China is not equipped with an effective monitoring system to collect and verify the activities of China-oriented international shipping, such as their shipping routes and energy consumption. To identify CO2 emissions, reliable energy consumption information of all fleets in and out of the Chinese ports is required. The European Commission (EC), a pioneer in putting a limit on GHG emissions, provides a significant reference for China. In June 2013, the EC issued a legislative proposal to establish a system for monitoring, reporting and verifying (MRV) CO2 emissions from large ships using European Union (EU) ports, which came into force in July 2015 [48]. Ships would thereby be obliged to monitor some parameters on a voyage basis, including fuel consumption and distance travelled. Similar regulations are expected to apply to merchant ships conducting their voyages using Chinese ports. Fundamental information should be reported by shipping companies including the distance travelled, shipping routes, time spent at sea, and berth, etc. Moreover, third parties specified by the government play a significant role in verifying the accuracy of the data provided by shipping companies. According to the latest regulation of the IMO, the new requirements for collecting the consumption data for each type of fuel oil used for transport were adopted by the IMO’s Marine Environment Protection Committee (MEPC) meeting during its 70th session in October 2016. Based on this new regulation, all ships of 5000 gross tonnage and above have the obligation to monitor fuel consumption during their voyages from 2019. This new IMO policy improves the feasibility for China to propose a regulation of reporting and verifying energy consumption [10]. Establishment of the MRV regulation of China is the fundamental prerequisite before the introduction of measures or policies for mitigation.

5.2. Potential Mitigation Policies

After quantifying CO2 emissions, it is suggested that decision-makers for China consider mitigation measures to address the increasing emissions from marine trade in Chinese territorial waters. There are two main effective operational mitigation policy instruments available: a cap-and-trade programme, and carbon taxes [49,50]. The majority of pioneers involved in policy control instruments are developed countries and regions, such as the EU Emissions Trading System (ETS) [51]. The previous literature contains much debate regarding which particular form is better [51,52]. In reality, each of these two policy instruments will make a contribution to the reduction in CO2 emissions if they are designed properly. China has prepared for the national trading system through seven pilot exchanges from 2014 to 2016, and a new carbon trading system is expected to commence in the latter half of 2017. The first phase (2017–2020) covers eight main sectors that produce CO2 intensively, including aviation. The marine transport sector is not included in the emissions coverage of the initial phase of the Chinese national trading system. The Chinese national trading system is likely to focus on the Chinese domestic companies involved in the eight specified industries. Marine transportation activities of the China-oriented international seaborne trade involve fleets from all over the world, which are not confined to Chinese shipping companies. The coverage audience for the mitigation policy should not be limited to shipping companies in China, but must also include foreign vessels. Under such circumstances, a carbon tax seems to be more flexible as it avoids two major obstacles of the cap-and-trade programme: unreliable emissions baselines and the allocation of emissions from international bunker fuel to countries [53]. It should be noted that the EC considered possible action in 2012 with regards to including maritime transport emissions into the EU’s GHG reduction commitment (EU ETS) [54,55]. However, this proposal encountered resistance from global countries and then faded away, prompting the introduction of MRV regulation instead. Finally, four years after the implementation of the MRV regulation, in February 2017, the European Parliament (EP) plenary voted to include the shipping sector’s carbon emissions in the EU ETS from 2023 if the IMO fails to agree on a global measure to reduce shipping emissions. The proposal will now be discussed in the “trialogue” negotiations between the EP, the EC and European Council representing EU governments [56,57]. The attempts at mitigation policy by the EC are gradual and even cautious. The policy instrument proposed by the decision-makers of China is suggested to be implemented progressively. It is necessary for the Chinese government to keep a close watch on the actions of the EU concerning carbon mitigation. Furthermore, establishment of the policy requires various deliberations and discussions by decision-makers, to ensure that the practices are consistent with international regulations.
In addition, some supplementary strategies should be taken into consideration to mitigate CO2 emissions in the international marine trade sector. First, it is crucial for the Chinese government to propel the construction of transport infrastructure to address the pressure of shipping transport. The accelerated development of alternative logistics options may promote a mode shift from water transport to pipelines or high speed rail. Second, according to our analysis, the improvements in technology play a vital role in the reduction of CO2 emissions. Therefore, some financial incentives by policy makers are expected to be taken into account in order to encourage technical improvement and cleaner energy, such as low carbon technology and eco-friendly vessels. Third, regulatory instruments of the Chinese trading ports are suggested which focus on controlling ship speed in the process of entering and leaving the ports [58]. The existing studies indicate that this speed reduction has a substantial potential for reducing CO2 emissions in shipping [59,60]. Hence, the instrument would impose speeds limits on ships at any point when they are calling at the ports. All of the ships arriving and leaving Chinese ports would have the obligation to sail slower than the upper speed limit.

6. Conclusions

In this paper, four scenarios concerning different conditions were designed using a bottom-up approach, to project CO2 emissions based on vessel activities over the long-term. CO2 emissions are produced by fuel consumption that can be divided into freight transport turnover volume and energy intensity. Log-linear regression analyses were developed to define the relationship between the transport demands of five vessel categories and an economic indicator (GDP). Unlike previous studies, this paper emphases estimation of CO2 emissions from China-oriented international seaborne transport, including Chinese domestic shipping companies as well as foreign ones. The classifications of the vessels were distinguished due to their significant variance in energy intensities, thus achieve more reliable prediction of total CO2 emissions.
Under the BAU scenario, the aggregated CO2 emissions are predicted to reach 419.97 Mt in 2035, from 23.83 Mt in 1999, following an annual growth rate of 8.3%. Based on analysis of the three alternative scenarios, reduction in the transport demand, energy intensity mitigation and clean energy usage is estimated to contribute to 10%, 30% and 2% of the overall CO2 emissions mitigation in 2035, respectively, converting the BAU scenario to the AD3 scenario. Under the BAU scenario, bulk carrier vessels are expected to be the largest emitters of CO2, accounting for 56% of overall emissions, whilst containers, crude oil tankers, chemical tankers and product tankers would account for 30%, 9%, 3% and 2%, respectively.
The forecasting results in this paper suggest that emissions from international marine trading operations in China are an issue of major concern. In order to define reduction objectives, a regulation for monitoring, reporting and verifying the activity of vessels is suggested to quantify CO2 emissions from international marine trade in Chinese territorial waters. Over the long-term future, it is necessary for the policy makers of China to put great emphasis on reduction instruments, including a maritime carbon tax and a cap-and-trade scheme. A carbon tax seems to be a more flexible approach, as such a tax would require no emissions baseline, thereby avoiding the problem of distributing allowances. Some supplementary regulations, such as the construction of transport infrastructure, fiscal incentives for technical improvements, and speed limit regulations, are also recommended.
According to the calculation, China-oriented seaborne trade activities are expanding with the development of economic growth, and it is very likely that the proportion of CO2 emissions in the China-oriented international seaborne trade sector will rise. The data we used to draw comparisons with worldwide international shipping was updated in IMO 2014, which provided previous estimations until 2012. Thus, in the future, further research can be expected to deliver if a new edition of the IMO report is published.
Finally, it should be pointed out that the modelling is based on the historical data, under the assumption that future development will resemble previous conditions. The world remains in a transitional phase, in which it is possible that there will be significant differences between past and the future circumstances, especially in the economic growth sector. Therefore, constant monitoring of developments by researchers is necessary to adjust the demand projection. Policy makers are suggested to regularly monitor the transition and respond quickly to the changes.

Acknowledgments

This research is supported by the National Natural Science Foundation of China (Grant No. 71372088) and Higher Education Development Fund (for Collaborative Innovation Center) of Liaoning (Grant No. 20110116102).

Author Contributions

Xuefei Ma and Hualong Yang proposed the research topic and the structure of the paper; Xuefei Ma designed this research and wrote this paper; Hualong Yang provided professional guidance; Yuwei Xing collected took part in collecting the data and revising the paper.

Conflicts of Interest

The authors declare no conflict of interest.

References

  1. Clarksons Research. August 2015 Seaborne Trade Monitor; Clarksons Research: London, UK, 2015. [Google Scholar]
  2. International Maritime Organization (IMO). Third IMO GHG Study 2014; IMO: London, UK, June 2014. [Google Scholar]
  3. Clarksons Research. December 2016 China Intelligence Monthly; Clarksons Research: London, UK, 2016. [Google Scholar]
  4. Guo, B.; Geng, Y.; Franke, B.; Han, H.; Liu, Y.; Chiu, A. Uncovering China’s transport CO2 emission patterns at the regional level. Energy Policy 2014, 74, 134–146. [Google Scholar] [CrossRef]
  5. Intergovernmental Panel on Climate Change (IPCC). Climate Change 2014 Synthesis Report; IPCC: Geneva, Switzerland, 2014. [Google Scholar]
  6. Cioca, L.I.; Ivascu, L.; Rada, E.C.; Torretta, V.; Ionescu, G. Sustainable Development and Technological Impact on CO2 Reducing Conditions in Romania. Sustainability 2015, 7, 1637–1650. [Google Scholar] [CrossRef]
  7. Dodić, S.N.; Popov, S.D.; Dodić, J.M.; Ranković, J.A.; Zavargo, Z.Z. Potential contribution of bioethanol fuel to the transport sector of Vojvodina. Renew. Sustain. Energy Rev. 2009, 13, 2197–2200. [Google Scholar] [CrossRef]
  8. Merk, O. Shipping Emissions in Ports. International Transport Forum Discussion Papers; OECD Publishing: Paris, France, 2014. [Google Scholar]
  9. United Nations Conference on Trade and Development (UNCTAD). Review of Maritime Transport 2016; United Nations: Geneva, Switzerland, 2016. [Google Scholar]
  10. Guo, J.; Zou, L.L.; Wei, Y.M. Impact of inter-sectoral trade on national and global CO2 emissions: An empirical analysis of China and Us. Energy Policy 2010, 38, 1389–1397. [Google Scholar] [CrossRef]
  11. IMO. Marine Environment Protection Committee (MEPC), 70th Session, 24–28 October 2016. Available online: http://www.imo.org/en/MediaCentre/SecretaryGeneral/Secretary-GeneralsSpeechesToMeetings/Pages/MEPC-70-opening.aspx (accessed on 27 June 2017).
  12. Yan, X. Life Cycle Energy Demand and Greenhouse Gas Emissions in Chinas Road Transport Sector: Future Trends and Policy Implications. Ph.D. Thesis, Queen Mary University of London, London, UK, 2008. [Google Scholar]
  13. Wang, W.W.; Zhang, M.; Zhou, M. Using LMDI method to analyze transport sector CO2, emissions in China. Energy 2011, 36, 5909–5915. [Google Scholar] [CrossRef]
  14. Cai, B.; Yang, W.; Cao, D.; Liu, L.; Zhou, Y.; Zhang, Z. Estimates of China’s national and regional transport sector CO2 emissions in 2007. Energy Policy 2012, 41, 474–483. [Google Scholar] [CrossRef]
  15. Wang, Y.F.; Li, K.P.; Xu, X.M.; Zhang, Y.R. Transport energy consumption and saving in China. Renew. Sustain. Energy Rev. 2014, 29, 641–655. [Google Scholar] [CrossRef]
  16. Liu, Z.; Li, L.; Zhang, Y.J. Investigating the CO2 emission differences among China’s transport sectors and their influencing factors. Nat. Hazards 2015, 77, 1323–1343. [Google Scholar] [CrossRef]
  17. Hao, H.; Geng, Y.; Li, W.; Guo, B. Energy consumption and GHG emissions from China’s freight transport sector: Scenarios through 2050. Energy Policy 2015, 85, 94–101. [Google Scholar] [CrossRef]
  18. Hao, H.; Wang, H.; Ouyang, M. Fuel consumption and life cycle GHG emissions by China’s on-road trucks: Future trends through 2050 and evaluation of mitigation measures. Energy Policy 2012, 43, 244–251. [Google Scholar] [CrossRef]
  19. Hao, H.; Liu, Z.; Zhao, F.; Li, W.; Hang, W. Scenario analysis of energy consumption and greenhouse gas emissions from China’s passenger vehicles. Energy 2015, 91, 151–159. [Google Scholar] [CrossRef]
  20. Zheng, B.; Zhang, Q.; Borken-Kleefeld, J.; Hong, H.; Guan, D.; Klimont, Z.; Peters, G.P.; He, K. How will greenhouse gas emissions from motor vehicles be constrained in China around 2030? Appl. Energy 2015, 156, 230–240. [Google Scholar] [CrossRef]
  21. Hao, H.; Mu, Z.; Jiang, S.; Liu, Z.; Zhao, F. GHG Emissions from the Production of Lithium-Ion Batteries for Electric Vehicles in China. Sustainability 2017, 9, 504. [Google Scholar] [CrossRef]
  22. Lang, J.; Cheng, S.; Zhou, Y.; Zhao, B.; Wang, H.; Zhang, S. Energy and Environmental Implications of Hybrid and Electric Vehicles in China. Energies 2013, 6, 2663–2685. [Google Scholar] [CrossRef]
  23. Takeshita, T. Global Scenarios of Air Pollutant Emissions from Road Transport through to 2050. Int. J. Environ. Res. Public Health 2011, 8, 3032–3062. [Google Scholar] [CrossRef] [PubMed]
  24. Wei, Q.; Zhao, S. Estimating CO2 Emission and Mitigation Opportunities of Wanzhou Shipping in Chongqing Municipality, China. In Proceedings of the International Conference on Logistics Engineering and Intelligent Transportation Systems, Miami, FL, USA, 26–28 November 2010; pp. 1–4. [Google Scholar]
  25. Hao, H.; Geng, Y.; Ou, X. Estimating CO2 emissions from water transportation of freight in China. Int. J. Shipp. Transp. Logist. 2015, 7, 676–694. [Google Scholar] [CrossRef]
  26. Intergovernmental Panel on Climate Change (IPCC). 2006 IPCC Guidelines for National Greenhouse Gas Inventories; Intergovernmental Panel on Climate Change: Hayama, Japan, 2006. [Google Scholar]
  27. International Maritime Organization (IMO). Second IMO GHG Study 2009; IMO: London, UK, June 2009. [Google Scholar]
  28. Psaraftis, H.N.; Kontovas, C.A. CO2 emission statistics for the world commercial fleet. WMU J. Marit. Aff. 2009, 8, 1–25. [Google Scholar] [CrossRef]
  29. Liu, Q.; Gu, A.; Teng, F.; Song, R.; Chen, Y. Peaking China’s CO2 Emissions: Trends to 2030 and Mitigation Potential. Energies 2017, 10, 209. [Google Scholar] [CrossRef]
  30. Hatzopoulou, M.; Hao, J.Y.; Miller, E.J. Simulating the impacts of household travel on greenhouse gas emissions, urban air quality, and population exposure. Transportation 2011, 38, 871. [Google Scholar] [CrossRef]
  31. Kutner, M.H.; Nachtsheim, C.J.; Neter, J. Applied Linear Regression Models, 5th ed.; Technometrics: Alexandria, VA, USA, 2004; Volume 26. [Google Scholar]
  32. Limanond, T.; Jomnonkwao, S.; Srikaew, A. Projection of future transport energy demand of Thailand. Energy Policy 2011, 39, 2754–2763. [Google Scholar] [CrossRef]
  33. Ratanavaraha, V.; Jomnonkwao, S. Trends in Thailand CO2 emissions in the transportation sector and policy mitigation. Transp. Policy 2015, 41, 136–146. [Google Scholar] [CrossRef]
  34. Clarksons Research. March 2017 China Intelligence Monthly; Clarksons Research: London, UK, 2017. [Google Scholar]
  35. Clarksons Research. September 2013 China Intelligence Monthly; Clarksons Research: London, UK, 2013. [Google Scholar]
  36. Clarksons Research. December 2011 China Intelligence Monthly; Clarksons Research: London, UK, 2011. [Google Scholar]
  37. Clarksons Research. June 2008 China Intelligence Monthly; Clarksons Research: London, UK, 2008. [Google Scholar]
  38. Clarksons Research. Shipping Intelligence Network Time Series; Clarksons Research: London, UK, 2017. [Google Scholar]
  39. Clarksons Research. January 2017 Seaborne Trade Monitor; Clarksons Research: London, UK, 2017. [Google Scholar]
  40. National Bureau of Statistics of China (NBSC). China Statistical Yearbook 2016; China Statistics Press: Beijing, China, 2016. [Google Scholar]
  41. Yin, X.; Chen, W.; Eom, J.; Clarke, L.E.; Kim, S.H.; Patel, P.L.; Yu, S.; Kyle, G.P. China’s transportation energy consumption and CO2 emissions from a global perspective. Energy Policy 2015, 82, 233–248. [Google Scholar] [CrossRef]
  42. Zhou, N.; Fridley, D.; Khanna, N.Z.; Ke, J.; Mcneil, M.; Levine, M. China’s energy and emissions outlook to 2050: Perspectives from bottom-up energy end-use model. Energy Policy 2013, 53, 51–62. [Google Scholar] [CrossRef]
  43. Lee, T.C.; Lam, J.S.L.; Lee, T.W. Asian economic integration and maritime CO2 emissions. Transp. Res. D Transp. Environ. 2016, 43, 226–237. [Google Scholar] [CrossRef]
  44. Harvey, L.D.D. Global climate-oriented transportation scenarios. Energy Policy 2013, 54, 87–103. [Google Scholar] [CrossRef]
  45. Ruzzenenti, F.; Basosi, R. Evaluation of the energy efficiency evolution in the European road freight transport sector. Energy Policy 2009, 37, 4079–4085. [Google Scholar] [CrossRef]
  46. Burel, F.; Taccani, R.; Zuliani, N. Improving sustainability of maritime transport through utilization of Liquefied Natural Gas (LNG) for propulsion. Energy 2013, 57, 412–420. [Google Scholar] [CrossRef]
  47. International Gas Union (IGU). Enabling Clean Maine Transport; IGU: Barcelona, Spain, 2017. [Google Scholar]
  48. Nelissen, D.; Faber, J.F. Economic Impacts of MRV of Fuel and Emissions in Maritime Transport; CE Delft: Delft, The Netherlands, 2014. [Google Scholar]
  49. Aldy, J.E.; Pizer, W.A. The Competitiveness Impacts of Climate Change Mitigation Policies; Discussion Paper 2015-73; Harvard Project on Climate Agreements: Cambridge, MA, USA, 2015. [Google Scholar]
  50. Carl, J.; Fedor, D. Tracking global carbon revenues: A survey of carbon taxes versus cap-and-trade in the real world. Energy Policy 2016, 96, 50–77. [Google Scholar] [CrossRef]
  51. Goulder, L.H.; Schein, A.R. Carbon taxes versus cap and trade: A critical review. Clim. Chang. Econ. 2013, 4, 1350010. [Google Scholar] [CrossRef]
  52. Strand, J. Strategic climate policy with offsets and incomplete abatement: Carbon taxes versus cap-and-trade. J. Environ. Econ. Manag. 2013, 66, 202–218. [Google Scholar] [CrossRef]
  53. Stochniol, A. A New Market-Based CO2 Emission Reduction Scheme; Supporting Document for Discussion of MEPC: London, UK, 2007. [Google Scholar]
  54. EU Looks to Extend Emissions Tax to International Shipping. Available online: http://dailycaller.com/2012/10/03/eu-looks-to-extend-emissions-tax-to-international-shipping.html (accessed on 15 June 2017).
  55. Including Maritime Transport Emissions in the EU’s Greenhouse Gas Reduction Commitment. Available online: https://ec.europa.eu/clima/consultations/articles/0014_en (accessed on 14 June 2017).
  56. Shipping EU ETS Proposal Should Be a Wake-Up Call for IMO? Available online: http://worldmaritimenews.com/archives/214619/shipping-eu-ets-proposal-should-be-a-wake-up-call-for-imo/ (accessed on 18 June 2017).
  57. Governments Carefully Weigh up Shipping EU ETS. Available online: http://www.green4sea.com/governments-carefully-weigh-up-shipping-eu-ets/ (accessed on 27 June 2017).
  58. Lin, C.B.; Zhao, D.Q.; Cai, G.T.; Kai-Hon, L.; Ka-Wing, N.G. Greenhouse Gas emissions from cargo vessels and low-carbon shipping strategies in Guangdong province. Res. Environ. Sci. 2013, 26, 1340–1348. (In Chinese) [Google Scholar]
  59. Lindstad, H.; Asbjørnslett, B.E.; Strømman, A.H. Reductions in greenhouse gas emissions and cost by shipping at lower speeds. Energy Policy 2013, 39, 3456–3464. [Google Scholar] [CrossRef]
  60. Corbett, J.J.; Wang, H.; Winebrake, J.J. The effectiveness and costs of speed reductions on emissions from international shipping. Transp. Res. D Transp. Environ. 2009, 14, 593–598. [Google Scholar] [CrossRef]
Figure 1. Comparison of energy intensities of different vessels in 2007.
Energies 10 00980 g001
Figure 2. Transport turnover volumes from 1999 to 2035.
Energies 10 00980 g002
Figure 3. CO2 emissions under the BAU scenario from 1999 to 2035.
Energies 10 00980 g003
Figure 4. A comparison of the proportions of the transport turnover volume and CO2 emissions between 2000 and 2035. (a) Crude oil carrier; (b) Products tanker; (c) Chemical tanker; (d) Bulk carrier; (e) Container.
Energies 10 00980 g004
Figure 5. Comparison of the trends between China-oriented and international shipping.
Energies 10 00980 g005
Figure 6. The trend in aggregated CO2 emissions of alternative scenarios.
Energies 10 00980 g006
Figure 7. The breakdown of the each category in 2025 and 2035.
Energies 10 00980 g007
Table 1. Technology improvements in energy intensity (2007 as base year).
ScenarioCategoriesEnergy Intensity Improvements
2020 (%)2035 (%)
BAUCrude oil carrier−12%−25%
Products tanker−12%−25%
Chemical tanker−12%−25%
Bulk carrier−12%−25%
Container−12%−25%
S2Crude oil carrier−22%−41%
Products tanker−22%−41%
Chemical tanker−22%−41%
Bulk carrier−22%−41%
Container−39%−61%
Table 2. Fuel type usage of two scenarios.
ScenarioHFOLNG
2020 (%)2030 (%)2035 (%)2020 (%)2030 (%)2035 (%)
BAU100%100%100%0%0%0%
S390%85%82.5%10%15%17.5%
Table 3. Scenario design.
ScenarioTransport DemandEnergy EfficiencyFuel Use
BAUBAUBAUBAU
AD1S1BAUBAU
AD2S1S2BAU
AD3S1S2S3

