Energy-Based Design of Powertrain for a Re-Engineered Post-Transmission Hybrid Electric Vehicle


Department of Engineering, Niccolò Cusano University, via Don Carlo Gnocchi 3, 00166 Rome, Italy
Energies 2017, 10(7), 918; https://doi.org/10.3390/en10070918
Submission received: 15 May 2017
/
Revised: 22 June 2017
/
Accepted: 24 June 2017
/
Published: 3 July 2017
(This article belongs to the Special Issue Advances in Electric Vehicles and Plug-in Hybrid Vehicles 2017)
Abstract
:This paper presents a systematic approach for the design of post-transmission hybrid electric vehicle powertrains, as an instrument aiding the designer in making the right decision. In particular, a post-transmission series/parallel hybrid electric powertrain is considered, and all of the possible energy paths are taken into account, in order to automatically select the configuration that gives the lowest fuel consumption, thus better fitting to the considered mission. The optimization problem is solved with the Dijkstra algorithm, which is more computationally efficient than other optimization algorithms in the case of massive design spaces. In this way, it is possible to design a vehicle in terms of architecture and component sizes, without making any a priori choices, which are usually based on common sense, likely compromising the overall system efficiency. In order to demonstrate the effectiveness of the methodology, different driving cycles have been simulated, and some results are presented. The methodology is particularly applied to re-engineered vehicles, aimed at maximizing the benefits of the vehicle hybridization process. Results show how the introduction, in the optimization algorithm, of the engine load factor and sharing factor, for the engine torque split between the generator and the wheels, is crucial. For example, a 10% reduction of the original engine size, suggested by a low load factor, is able to allow for a 24% reduction in the fuel consumption. On the other hand, the sharing factor is of particular importance in suggesting if the vehicle architecture should be series, parallel or rather combined.
1. Introduction
In recent years, the growing concern regarding global warming and the rising of oil prices have forced the automotive industry to strongly focus on topics like fuel economy and the reduction of emissions. Together with improvements of existing technologies, which are by now reaching a plateau, “non traditional”solutions, such as Electric Vehicles (EVs), Hybrid Electric Vehicles (HEVs) and Fuel Cell Vehicles (FCVs), have been largely proposed to deal with these problems [1,2]. Even having zero local emissions, EVs still have to pay for high initial investments and limited range, and thus, the usage is still confined to urban realities [3]. At the same time, FCVs are still strongly affected by the lack of infrastructures and high costs, and most of all, the fuel cell technology is still in an early development phase, leading to low reliability and hurdles in customer acceptability [3,4]. On the contrary, HEVs could represent a good short-term solution, having low fuel consumptions and pollutant emissions, with the advantages of an extended range, existing infrastructures, mature technology and the high reliability of the Internal Combustion Engine (ICE). Nonetheless, costs are still the major issue related to these kinds of cars [5], and the majority of new vehicles worldwide remains powered by fossil fuels, such as gasoline or diesel. In 2013, diesel cars accounted for 53% of the new registrations in Europe, slightly decreasing with respect to 2012, and for 50% in India. On the other hand, markets in the USA, China and Japan are still dominated by gasoline-powered vehicles [6]. These data show that it is unlikely that, in the next few years, the scenario will drastically shift towards alternative powertrains. Hence, the possibility of repowering conventional vehicles so as to become hybrid electric vehicles is of great interest [7].
Being equipped with more than one propulsion device, HEVs’ layouts can be thought as having a number of different configurations, and in general, it is possible to recognize three main groups: series, parallel and combined HEV architectures [8]. Combined architecture refers both to the so-called power-split hybrid, in which the electric motor can add or subtract torque to the engine, thus making the vehicle work as parallel or series, depending on the energy management choice, as well as the so-called series/parallel hybrid, in which the physical engagement/disengagement of one or more clutches allows changing the powertrain architecture from parallel to series or vice versa [8,9]. Among these architecture types, the power-split one has currently the highest market share, and these vehicles are usually equipped by a planetary gear set [10]. Nonetheless, this configuration requires the solution of a nonlinear constrained optimization problem, which is far from being straightforward, in order to exploit the full potential of this configuration [11]. Moreover, for re-engineered powertrains, a post-transmission architecture is simpler to implement and requires a lower investment. The analysis of a system equipped by a planetary gear set is thus out of scope for this paper and left to future studies.
Hence, involving several a priori choices, the propulsion system design is a delicate and crucial phase in the vehicle realization process. In fact, the vehicle and mission features highly affect the architecture choice, and each of these configurations better fits a certain kind of mission that the vehicle is demanded to satisfy [12]. In particular, a parallel architecture, having a more flexible layout and providing higher traction power, by using both the ICE and the Electric Motor (EM), is more suitable when high speeds and high range are required, while the series architecture better adapts to urban cycles, characterized by lower speeds. The combined architecture is in general considered a good choice, fitting all kind of paths, but it has the main drawback of the series architecture of having three machines, which can lead to higher fuel consumption because of the higher weight [8].
During the design phase, the fuel consumption as a function of the driving path/powertrain architecture combination is not considered, but [13] has demonstrated that even only one wrong choice in the vehicle design can avoid achieving a performing vehicle, in terms of global efficiency. In terms of components’ sizing, some approaches have been recently proposed to simultaneously optimize component sizes and energy management. These studies have been approached based on particle swarm optimization in [14], implementing a bilevel optimization framework solved with dynamic programming [15] or using convex optimization [16]. Among the heuristic methods, in [17], the genetic algorithm has been chosen for its robustness for the design phase, where a multi-objective optimization is performed in order to take into account a number of performance parameters. Nonetheless, the topology of the hybrid powertrain is seldom or never involved in the optimization process, and most of the studies available in literature apply to HEVs with the planetary gear set, both single [18], double [19] or even multiple [20].
On the energy storage system side, lithium batteries offer attractive opportunities for improvements in performance and costs, over the other commonly-employed technology, i.e., NiMH [21]. When compared to NiMH, they show higher specific power and energy density content and can withstand a wider range of temperatures [22]. Moreover, lithium batteries can offer 40–50% weight reduction, 20–30% volume reduction and efficiency improvements with respect to NiMH batteries [10].
For these reasons, in the present study, a comprehensive methodology is proposed for the architecture topology choice during the design process of a re-powered HEV powertrain, equipped with a lithium battery pack. A brief explanation of the solving algorithm is provided in Section 2, with attention to the system definition, the description of the approach and an explanation of the optimization framework. Section 3 provides a discussion of the main results, while in Section 4, the main conclusions are provided. Obviously, once the final architecture of the vehicle is defined, a second phase is required in the realization of the eventual vehicle, which lies in the design and implementation of the best energy management strategy. Nonetheless, this second phase is not explained here, since the procedure proposed in the present paper only aims at finding the best solution for the vehicle powertrain layout, setting as the optimization target the minimization of the fuel consumption.
2. Methodology Description
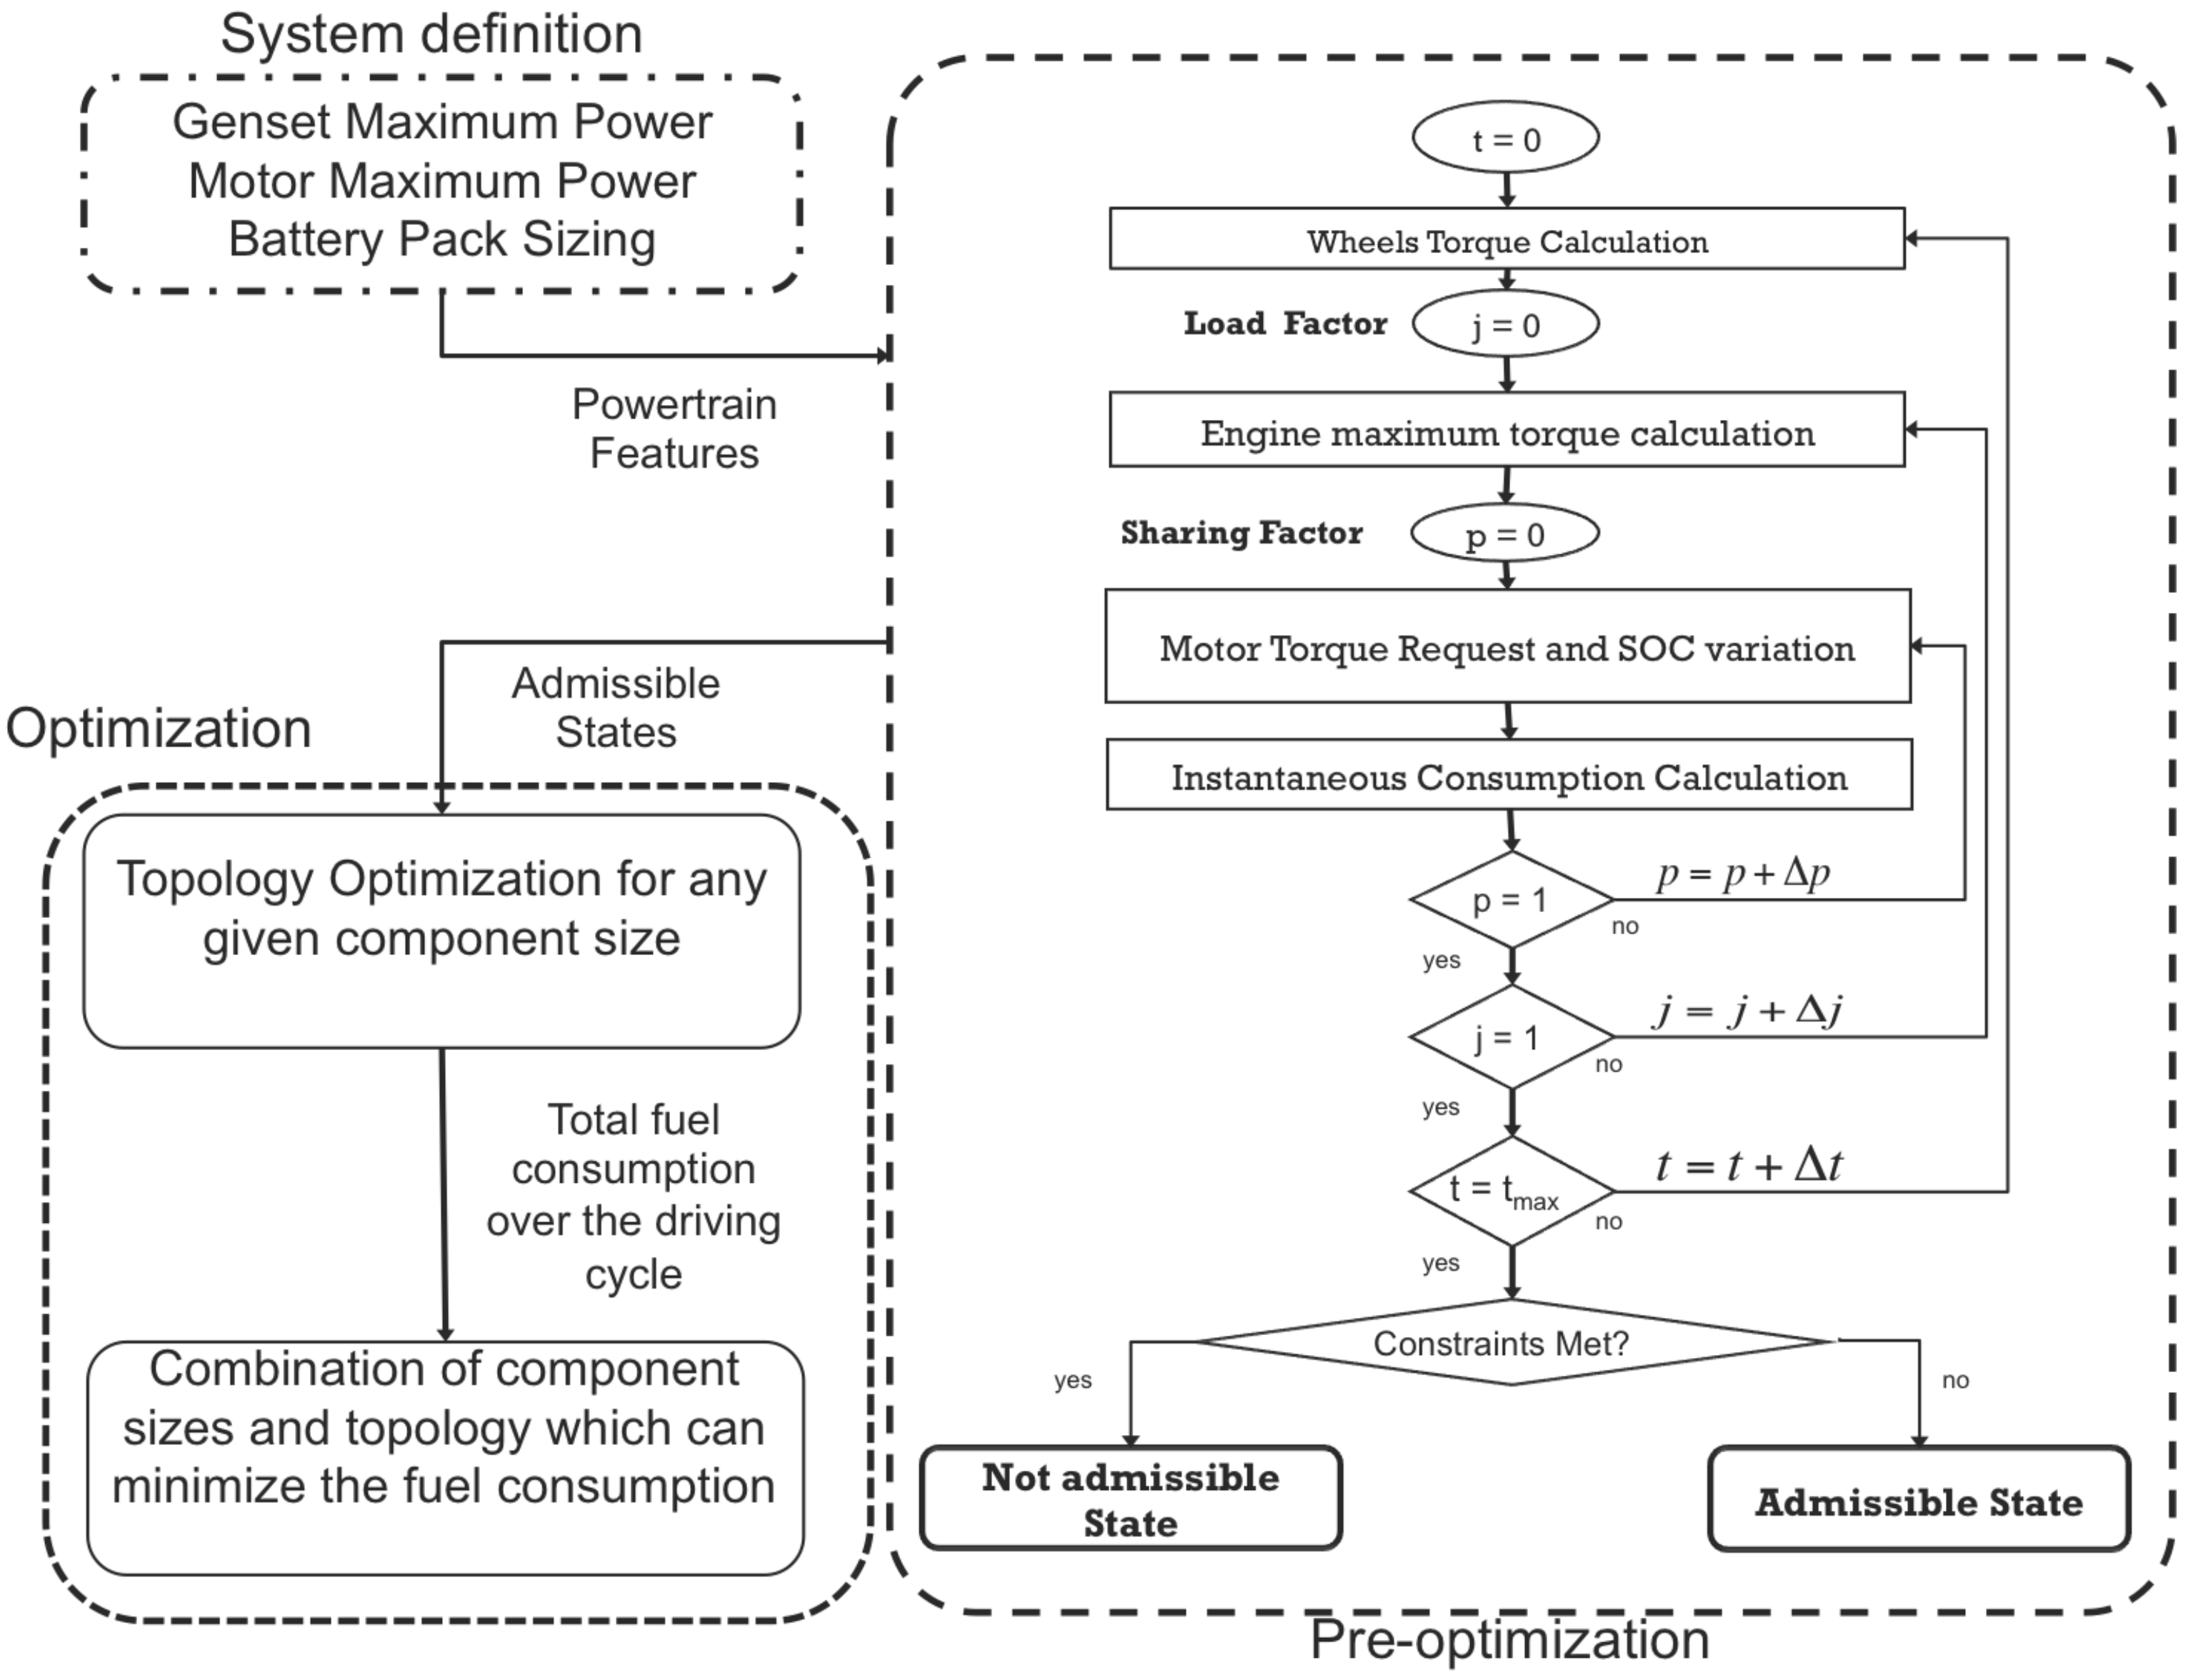
The methodology is based on the algorithm shown in Figure 1 and implemented in MATLAB® (R2015b).
It consists of three main phases, listed below:
- -
- System definition,
- -
- Pre-optimization,
- -
- Design optimization.
2.1. System Definition
In the system definition phase, all of the preliminary vehicle specifications must be provided, in terms of vehicle geometry, drivetrain and components’ characteristics. By choosing the vehicle category, it is possible to enter this into a database where information are collected for each of the following main classes: economy vehicles, sport vehicles, SUV, trucks, buses. In particular, for each of these classes, an initial curb weight for the vehicle is considered, together with tire rolling resistance coefficients, vehicle geometry (height, width), drag coefficient, fuel type (density and lower heating value) and the final drive ratio. Moreover, also the gear ratios and a plausible gear shifting strategy are identified [23,24].
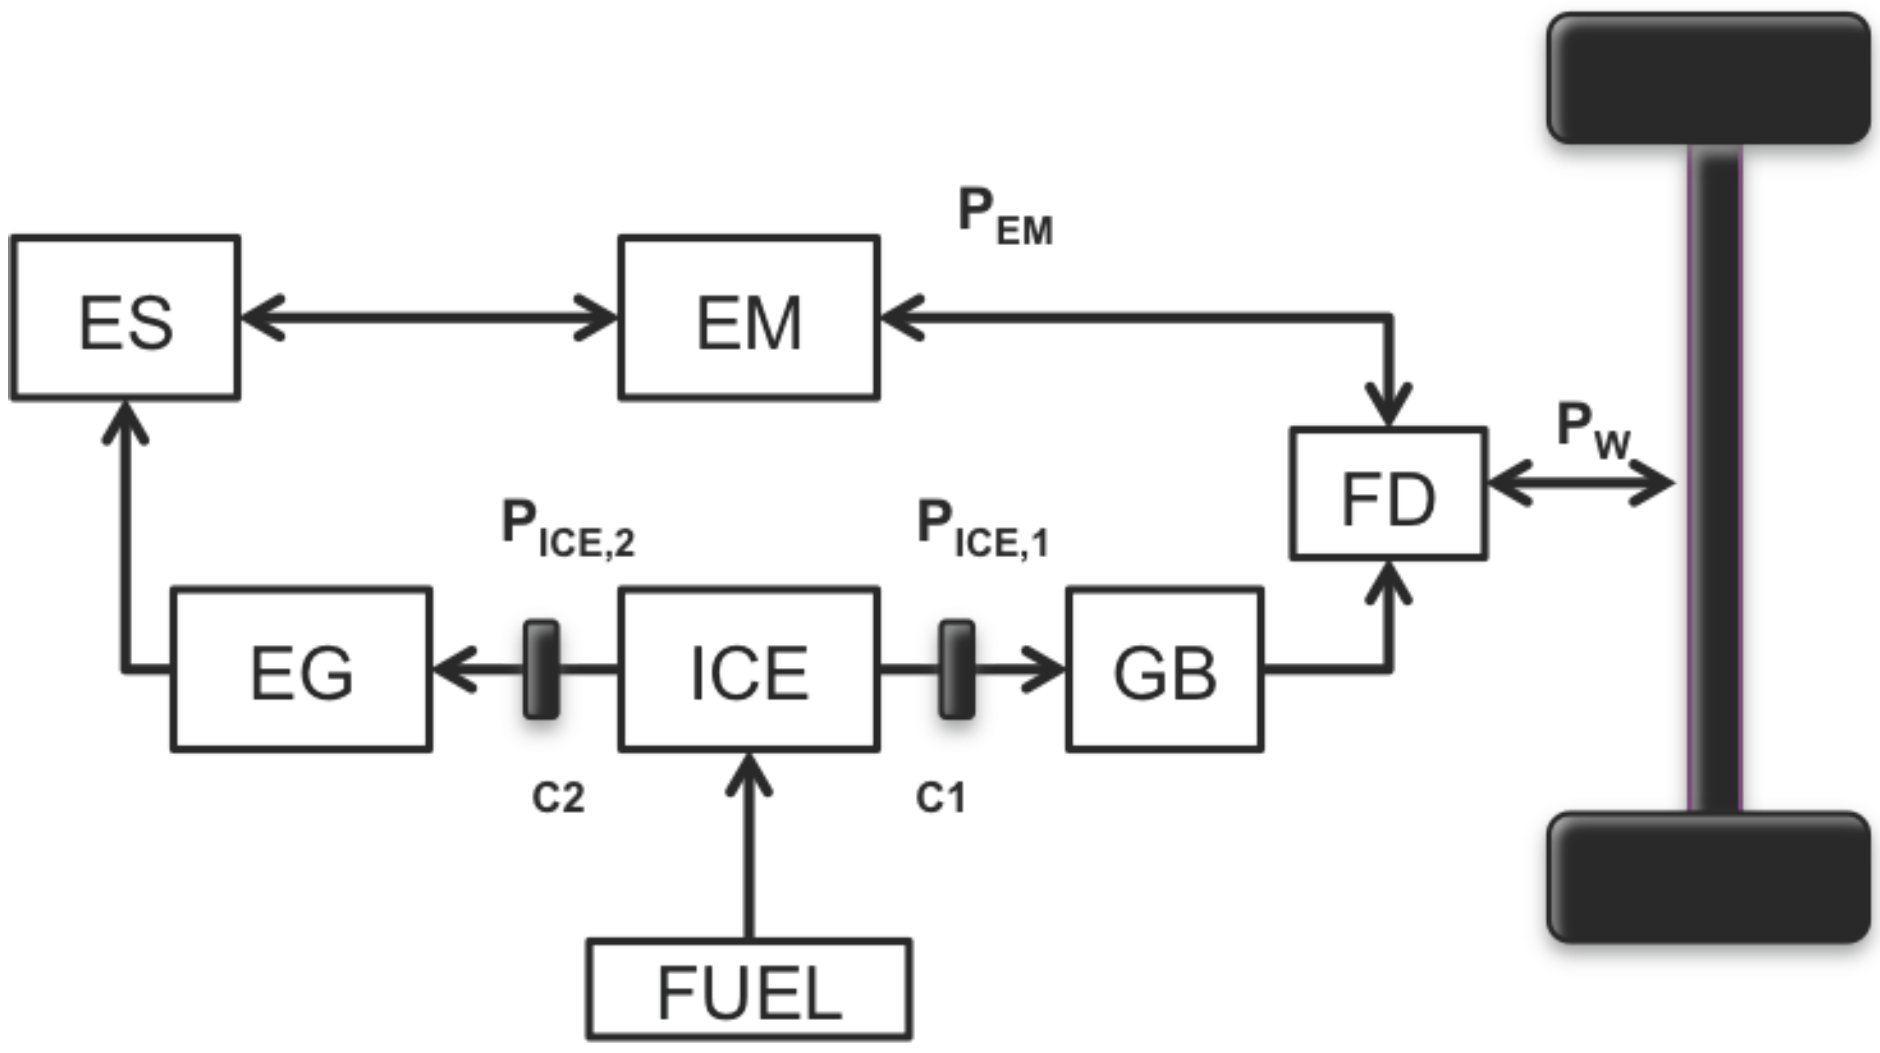
A general scheme of a post-transmission series/parallel hybrid powertrain is then considered and all of the possible energy paths are modeled in the powertrain, in order to take into account the three different architectures, i.e., series, parallel and combined. The energy flow diagram of this generic hybrid powertrain can be depicted as in Figure 2, where ES (Energy Storage) is the battery, EM the Electric Machine, EG the Electric Generator, ICE the Internal Combustion Engine, GB stands for Gear Box and FD (Final Drive) represents the differential. Regenerative braking is implemented. The inclusion of all of these devices allows considering all of the possible topologies with one unique approach, but the final output of the optimization could be a pure parallel powertrain, characterized by just the EM and the ICE, without the EG.
The genset is connected to a gear box, while the electric motor is directly connected to the differential. In the genset, the ICE and the EG are directly connected one to the other, with no reduction ratio, which, in hybrid electric vehicles, is a common choice for reducing losses. Being an energy-based analysis, the transmission system accounts for an efficiency to be considered in the overall efficiency chain.
For modeling purposes, two clutches ( and ) can be located as in Figure 2, and the different architectures can be defined by the proper combination of their setting:
- -
- if and are both closed, the energy flow can be such that the power of the engine is provided both to the generator and to the wheels’ shaft, while the EM supplies power to the wheels, so that the vehicle powertrain has both series and parallel characteristics (i.e., combined architecture);
- -
- if is closed and is opened, the vehicle works as a parallel HEV;
- -
- if is opened and is closed, the vehicle works as a series HEV.
As shown in Table 1, the clutches and can be replaced by binary values: the value 1 means that the clutch is closed, and therefore, the axle is connected; the value 0 means that the clutch is opened, so the axle is disconnected (no torque provided). In such a way, all of the possible energy paths within the powertrain can be condensed as in Equation (1):
where and are the efficiencies of the gear box and the differential, respectively; is the net power to the wheels; is the ICE power to be split between the wheels and the EG; is the EM power to the differential; is the power supplied by the EG to the battery, while is the EG efficiency.
Equation (1) shows that the problem is characterized by two degrees of freedom, which can be identified with two factors to be used to describe the power split between the internal combustion engine and the electric machine and, for the engine itself, between the wheels and the generator. In particular, represents a load factor for the ICE, and represents the sharing factor of the ICE power between the wheels and the EG. Therefore, the power of the engine responds to the following equations:
where is the maximum torque the engine can supply at the current angular speed, , which is a function of the vehicle speed and the transmission ratio coefficients; is the ICE power amount supplied to the wheels and is the ICE power amount supplied to the EG (see Figure 2).
Looking at Equations (1) and (2), one can note that the power of the generator, as well as the power of the electric motor can be expressed as a function of p and j, as shown in the following:
It is worth underlining that these parameters completely replace the role of the clutches in Equation (1), having no longer the meaning of a switch equal to 1 or 0 (i.e., open or close), but being rather variable in the range with a discrete step (i.e., and ). In particular, these discretization steps depend on the accuracy required, and a sensitivity analysis was carried out to assess a satisfying trade off between accuracy and computational effort. Nonetheless, this analysis is not presented here, as it is considered outside of the aim of the present paper.
The replacement of the binary values of the clutches with these parameters is the core of the proposed methodology, since it allows for a comprehensive analysis of the powertrain behavior. In particular, the sharing factor of the ICE torque between the wheels and the EG (i.e., p) has a particular importance in terms of average value, since it suggests if the vehicle mostly behaves as a series, parallel or rather combined vehicle and is strongly related to the components physical limits. On the other hand, the average load factor of the ICE (i.e., j) is mainly a result of the efficiency map of the engine.
For all of the power converters, map-based scalable models are implemented to allow for an iterative procedure, which can change the size of each device, at each iteration, with a discrete step. To this aim, the implemented maps are dimensionless with respect to the load, and component sizes are a function of the vehicle category. To ensure scalability for all of the propulsion systems, Willan’s line model has been implemented [25]. This model evaluates the mean effective pressure as an affine function of the mean available pressure, by using coefficients that depend on the mean piston speed. This assumption is based on the property of engines of the same family, produced by the same manufacturer, which are usually characterized by the same correlation between these three variables. Therefore, the operating maps, when expressed as a function of these parameters, appear to be the same, if multiplied by a proper scaling factor, i.e., displacement, piston stroke, number of cylinders, which typically depends on the vehicle category. Despite that this model may appear simplistic, it is usually capable of fitting with acceptable accuracy efficiency maps derived from experimental tests and, most of all, can be used for engines, as well as for electric machines [26]. Moreover, based on [27,28], it was assumed that the efficiency map shape for each component is not affected by the variation in size of the component itself.
With regard to the battery pack, an ad hoc iterative sizing procedure is implemented to evaluate the number of cells needed in series and parallel, as a function of the vehicle category and maximum power of the electric motor. It is worth underlining that the final curb weight of the vehicle is related to the size of the components, which is an affine function of the rated power, and to the number of cells in the battery pack. This is the reason why the component sizing is part of the system definition step.
At the beginning, all of the specifications for a single cell are provided. In this study, lithium polymer cells are considered, since they are promising technologies for HEVs for the trade off they offer between high power and energy density, safety in the typical SoC operating range of an HEV and ease in fabrication [29]. For each cell, the nominal, maximum and minimum voltage and current are known, as much as the weight and energy capacity.
For the first sizing, the maximum voltage of the battery pack is imposed equal to 400 V, as dictated by the majority of the vehicle electric drive systems (i.e., inverter and motors).
Since the maximum voltage of the single cell, , is known, the number of cells in series, , can be evaluated:
On the other hand, the number of strings in parallel, , is evaluated as the greatest value between and :
where is the lowest number of parallels, which guarantees that the minimum battery power, , is equal to the rated EM power, :
with an average value for the battery efficiency, minimum cell voltage and nominal continuous current; while is the number of strings in parallel, which guarantees a battery energy capacity able to satisfy a certain mission, which demands for an average energy and is given by:
where is the nominal capacity of the single cell in , while is the above-mentioned desired battery capacity, given by the following equation:
considering an average operating voltage, over the entire mission, equal to the nominal voltage, , and assuming a maximum variation for the state of charge, , equal to , the vehicle being a non-plug-in HEV.
Ultimately, the actual battery energy capacity, , is given by:
with as per Equation (5).
At this point, a second check on the battery power is required in order to decrease the number of cells in series, if possible. In particular, if the nominal power of the battery pack is greater than the rated power of the electric motor, , multiplied by a certain tolerance factor (i.e., the motor power is incremented by a ), which takes into account losses and inefficiencies, is decreased, by means of the while-then loop shown in (10):
Here, 350 V is considered the minimum value for the voltage, imposed by the linkage with the other electric drive systems; is the cell nominal power; and is the total number of cells in the battery pack.
The pack sizing is thus completed, and the dynamics of the state of charge is taken into account by introducing a zero order equivalent circuit model, shown in Figure 3, where is the open-circuit voltage source, represents the equivalent internal resistance, is the load voltage at the battery terminals and is the current flow across the battery. LiPo batteries are characterized by an open-circuit voltage with a typical trend illustrated in Figure 4 [29]. This parameter is, in general, a function of the battery state of charge (SoC), but one can see that a constant value (dotted grey line, Figure 4) can well approximate the curve within the typical operating range of the battery, especially for an HEV. The same reasoning can apply to the equivalent resistance, which for this kind of battery has a trend with a horizontal asymptote within the SoC operating range typical of an HEV.
Therefore, the battery voltage output equation, from the Kirchhoff law, is given by:
thus, the battery power results:
and the battery current can be expressed as a function of the battery power, , by solving Equations (11) and (12) for the current:
The variation of the battery SoC results as follows:
where is the battery charge capacity as per Equation (9).
2.2. Pre-Optimization
For each component size, defined in the previous step, a pre-optimization phase follows, which is used to define all of the states that will make up the final graph to be used in the optimization.
First, at every time step, the system physical constraints of the system are calculated, in terms of maximum and minimum available torques for each component at the current vehicle speed; namely at the current shafts’ speeds.
Secondly, the ICE torque request is imposed as a function of the load factor, as given by the first equation in (2); for each ICE output-shaft torque, the sharing factor splits the ICE torque between the EG and the wheels, as given by the second and the third equations of (2).
At this point, by using Equation (3), the corresponding EG and EM powers are calculated.
The variation of the state of charge () is finally evaluated by integrating Equation (14) with considering Equation (13), where the battery power results as follows:
with:
The EG efficiency, , as much as the EM efficiency, , can be obtained from the corresponding steady-state efficiency maps.
All of the powertrain components must satisfy the following physical constraints:
where and are the minimum and maximum allowable values for the battery power; similarly, , , , , and are the minimum and maximum allowable values for the ICE, EM and EG torques, respectively.
In conclusion, for each time step, by varying both j and p, all of the possible torque splits are evaluated thanks to Equations (2) and (3), within the system physical constraints, by following the logic shown in Figure 1. The output of the pre-optimization phase is thus a set of these admissible states.
2.3. Design Optimization
The architecture design optimization is cast into a constrained optimization problem aimed at minimizing the fuel consumed by the vehicle over a given driving cycle while fulfilling the driver’s torque request. Formally, the problem consists of the minimization, over the optimization horizon , of a cost function, , which corresponds to the total fuel consumption, :
To this aim, the cost function is inherited from the well-known Equivalent Consumption Minimization Strategy (ECMS), [30], and thus, is given by:
where is the actual ICE fuel consumption, measured in liters, function of ICE torque, and thus of ICE load factor, and speed, ; is the equivalent fuel consumption over a given driving event, which can be calculated considering the energy the engine should provide, over the cycle, to produce the net amount of energy supplied by the battery for traction purposes, , corrected with the fuel lower heating value , the fuel density and all of the efficiencies of the efficiency chain:
In Equation (20), is a sigmoid-like penalty function, which allows guaranteeing the charge-sustaining mode of operation [30]. This penalty function can be expressed with the following general form:
where the inflection point is given by , here set equal to the initial value of the state of charge, and with defining the curvature. A very high value of this parameter guarantees the achievement of the desired final state of charge, but preventing variations in the SoC that can be instantaneously desirable to further minimize the fuel consumption. It has been observed in [31] that, for a charge-sustaining HEV, this parameter depends on the driving conditions and the lowest value of , which guarantees the charge sustainability, is different for each driving cycle. Thus, a trade off is required between robustness and performance. Since what is proposed here is a designing procedure and not the vehicle energy management control strategy, a unique value of this parameter has been chosen that allows for every driving cycle to obtain a final value of the SoC within a maximum variation of 10% with respect to the reference value.
One can immediately note that the combination of Equations (19) and (20) represents the so-called ECMS, if one considers as the equivalence factor, [8], the following expression:
so that Equation (19) becomes:
Hence, the equivalence factor converts the battery energy into an equivalent fuel consumption that gives a positive contribution when the electric motor is subtracting from the batteries more energy than the energy supplied by the generator (discharge phase) and a negative contribution when both the motor and the generator are charging the battery.
2.3.1. Dijkstra Algorithm
The optimization problem was solved by using the Dijkstra optimal algorithm, which gives the exact optimal solution to a large class of shortest path problems [32]. This algorithm is strongly inspired by Bellman’s principle of optimality and can be considered a less demanding dynamic programming push-type successive approximation procedure.
In particular, it works by constructing a shortest-path tree from the initial vertex to every other linked vertex in the graph, assigning a value to the vertex equal to the sum of the previous arcs that allows going through the minimum path. Hence, an initial approximation is successively improved (best first), with the means of the functional equation or others related to it. The process ends when no further improvement is possible.
The Dijkstra optimal algorithm is particularly used with graphs in which the edge weights are non-negative, while the Bellman–Ford algorithm should be used otherwise. Nonetheless, the Bellman–Ford algorithm is slower than the Dijkstra algorithm, which results in being effective with a complexity of , with n number of edges. Therefore, the Dijkstra algorithm was the preferred choice, and the issue of negative weights was solved by adding an arbitrary large constant to the obtained weighted graph with negative edges, in order to make all of the the weights become positive.
During the pre-optimization phase, a set of admissible states is identified for every time step. In fact, for each instant of time, the driver’s torque demand can be satisfied thanks to different combinations of j and p (i.e., thanks to different power splits and energy paths across the powertrain). Since the following dynamic constraints must be met:
only some of the admissible states of time t can be reached from at least one of the admissible states of time . In fact, the set of equations in (24) controls the variation of torques and battery state of charge from one time step to the next, since the subscripts ICE, EM and EG stand for engine, electric motor and generator, respectively, while and stand for minimum and maximum. This way, a number of possible paths is identified, linking the reachable states over the entire optimization horizon, as shown in the example in Figure 5. The Dijkstra algorithm is then used to find the shortest path between the entire number of paths.
3. Simulation Results
In this section, we show simulation results obtained for a diesel-fueled hybrid electric vehicle with the characteristics shown in Table 2.
The EM to ICE speed ratio shown in Table 2 is chosen thanks to an optimization made for a similar vehicle in a past work [33], while the EG to ICE speed ratio is a function of the vehicle category. For the gear box, in Table 3, the speed ratios used for an economy car are provided together with the gear shifting schedule.
Table 4 shows the powertrain first-attempt components’ characteristics, while Table 5 shows the battery cell characteristics [34]. For the thermal engine, the initial size is the same as the engine available from the original vehicle, the proposed application being a re-powering of an existing car. The efficiency map of the engine is provided in Figure 6, evaluated by applying Willan’s line method to data available from [25].
For the sharing factor, some thresholds have been defined as shown in Table 6:
Defining similar thresholds for the load factor would be trivial, since that parameter can only suggest the need of re-sizing the engine, but an iterative procedure is mandatory to confirm if the use of the engine at partial loads is due to a real need of re-sizing, rather than to a choice of the optimizer. In fact, it is known that the efficiency of a thermal engine, unlike electric motors, is highly affected by the engine operating point, in terms of torque and speed, and the highest efficiency is typical of medium to high torque areas.
Several different scenarios have been simulated, but for the sake of fluency, results are only provided for the standard Federal Urban Driving Schedule (FUDS) and Federal Highway Driving Schedule (FHDS) driving cycles, Figure 7. The chosen initial state of charge is 70%.
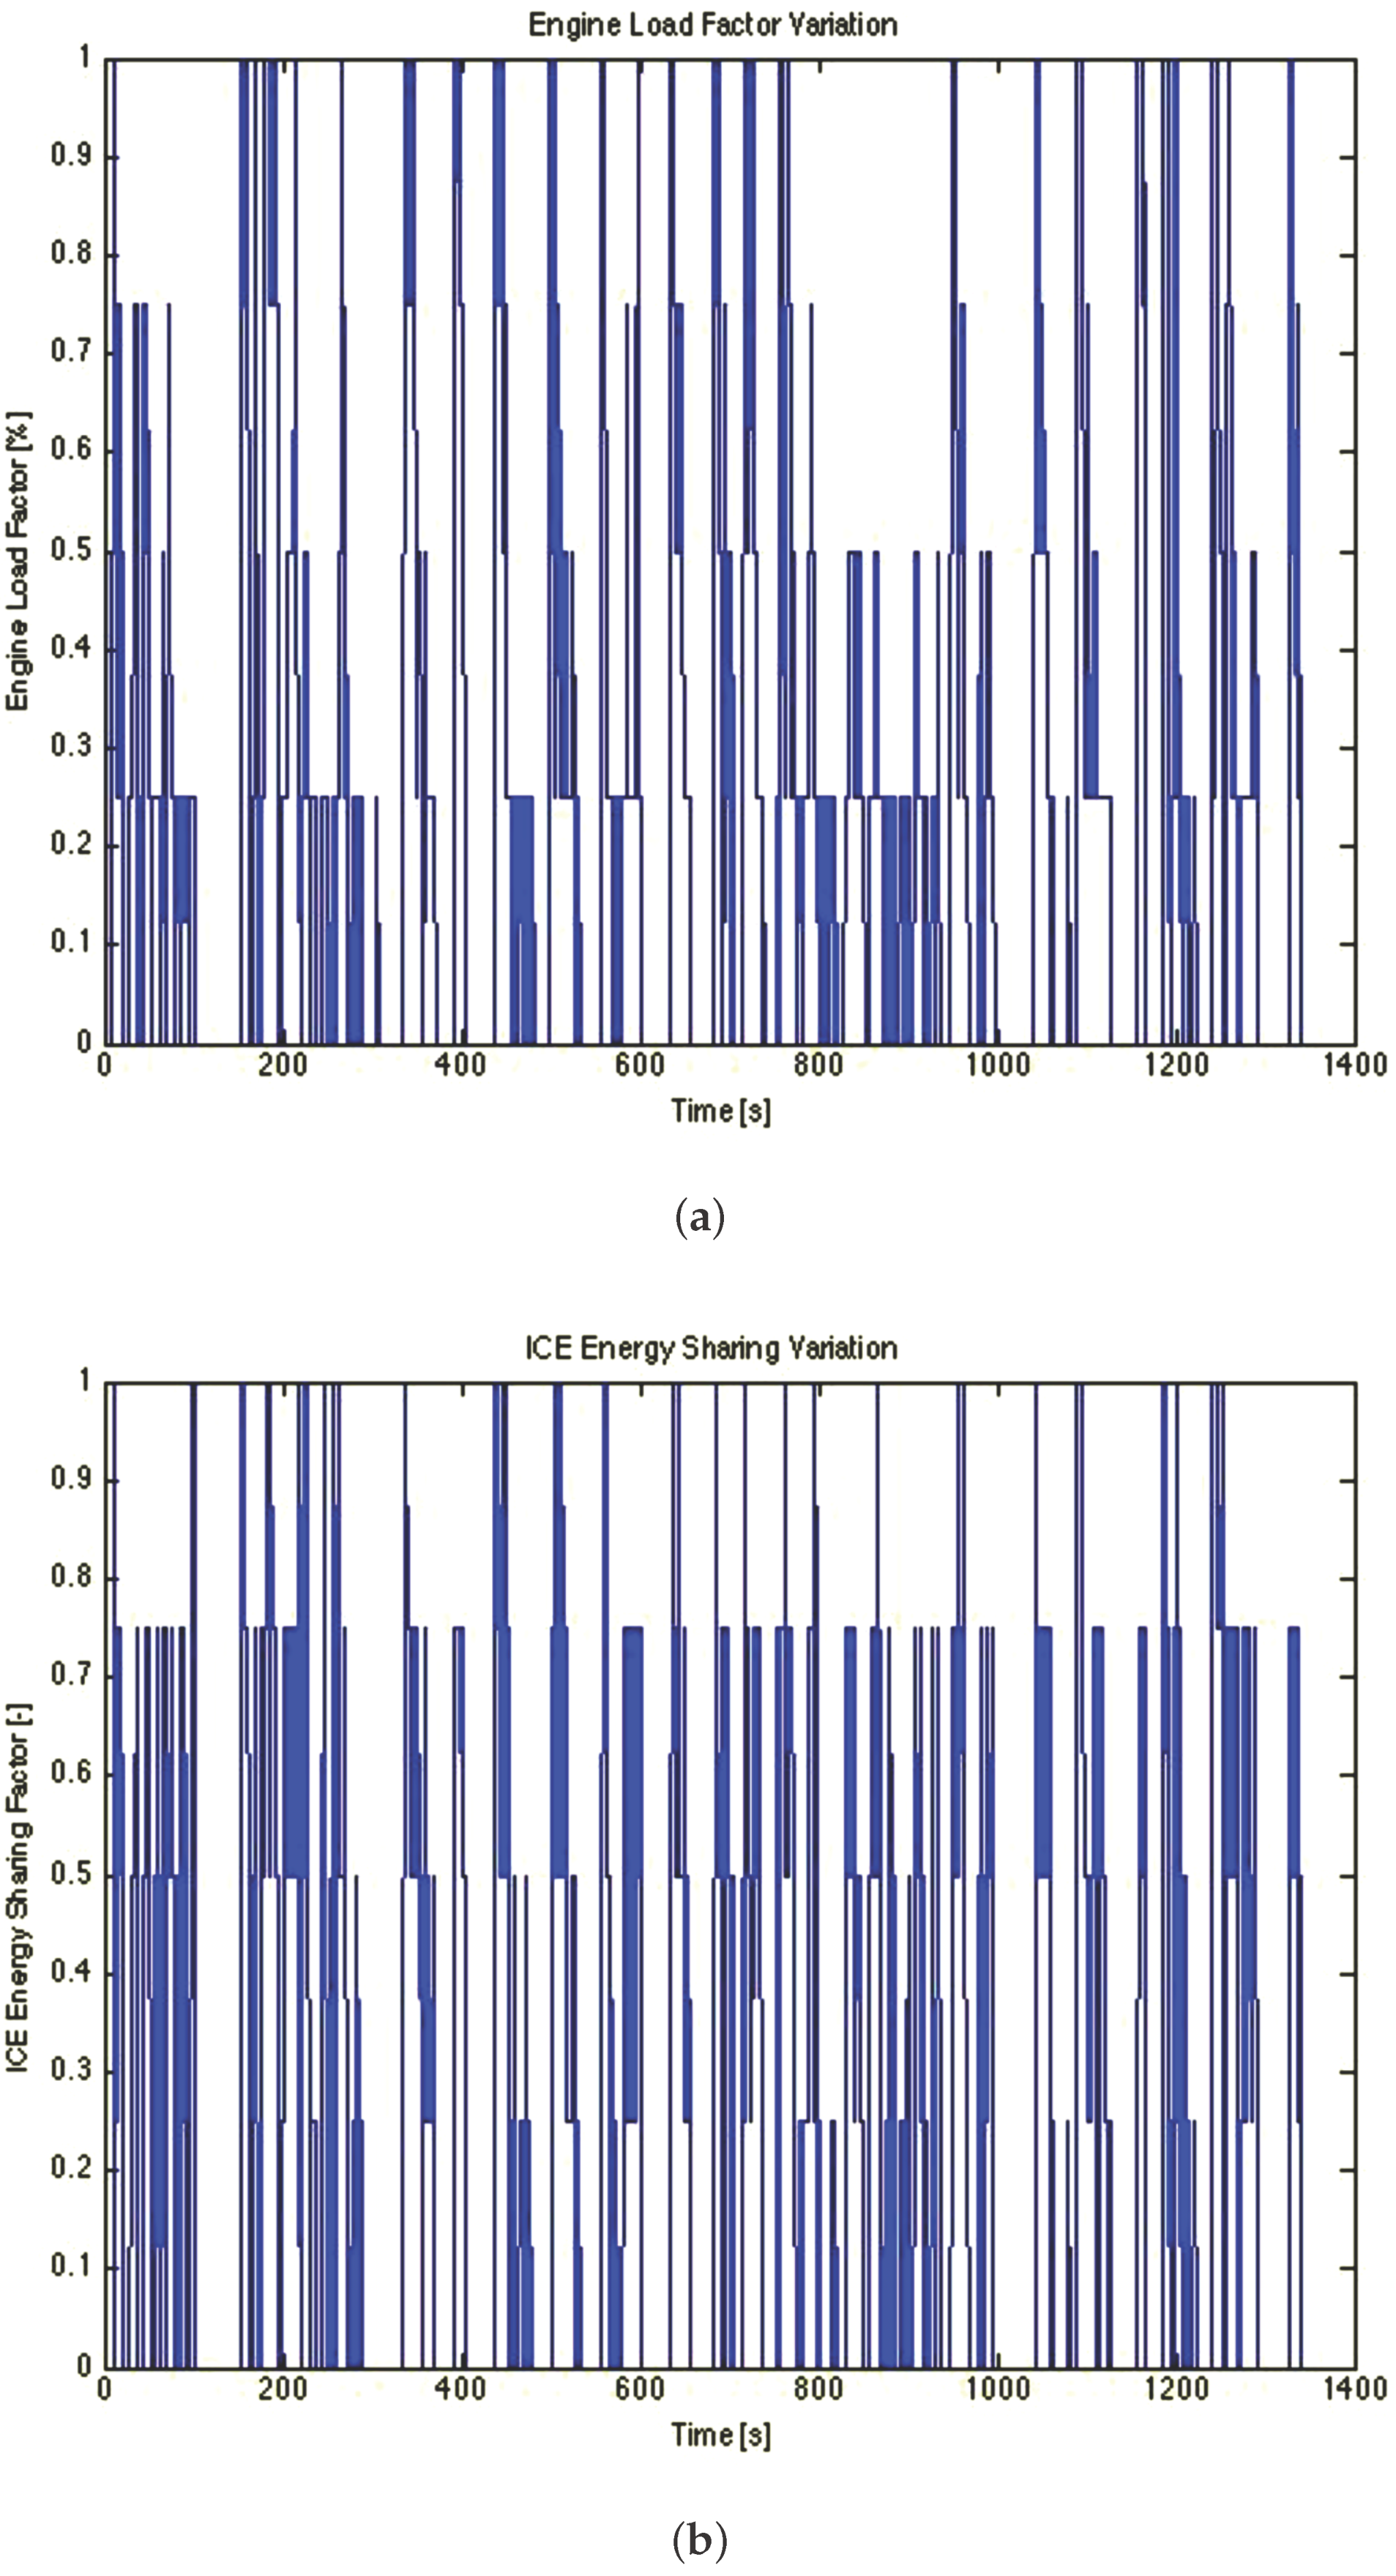
Figure 8 portrays the engine load and sharing factors for the FUDS cycle, which is a low demanding driving cycle, with a maximum speed of around 42 km/h. The average value of the load factor j results in being 12%. This result suggests that the ICE may be oversized, which is confirmed by Figure 8a, which shows how the ICE is mostly run at the partial load of 25%. An average sharing factor of 20%, instead, suggests that the ICE power is preferably used to charge the batteries than to run the wheels, and the vehicle optimal powertrain architecture should be a series one, according to Table 6. This could depend on the excessive size of the engine, which forces using it in low load areas, characterized by low efficiencies. Therefore, the optimizer could prefer to disconnect the engine operation from the torque demand at the wheels and use it with a fixed operating point.
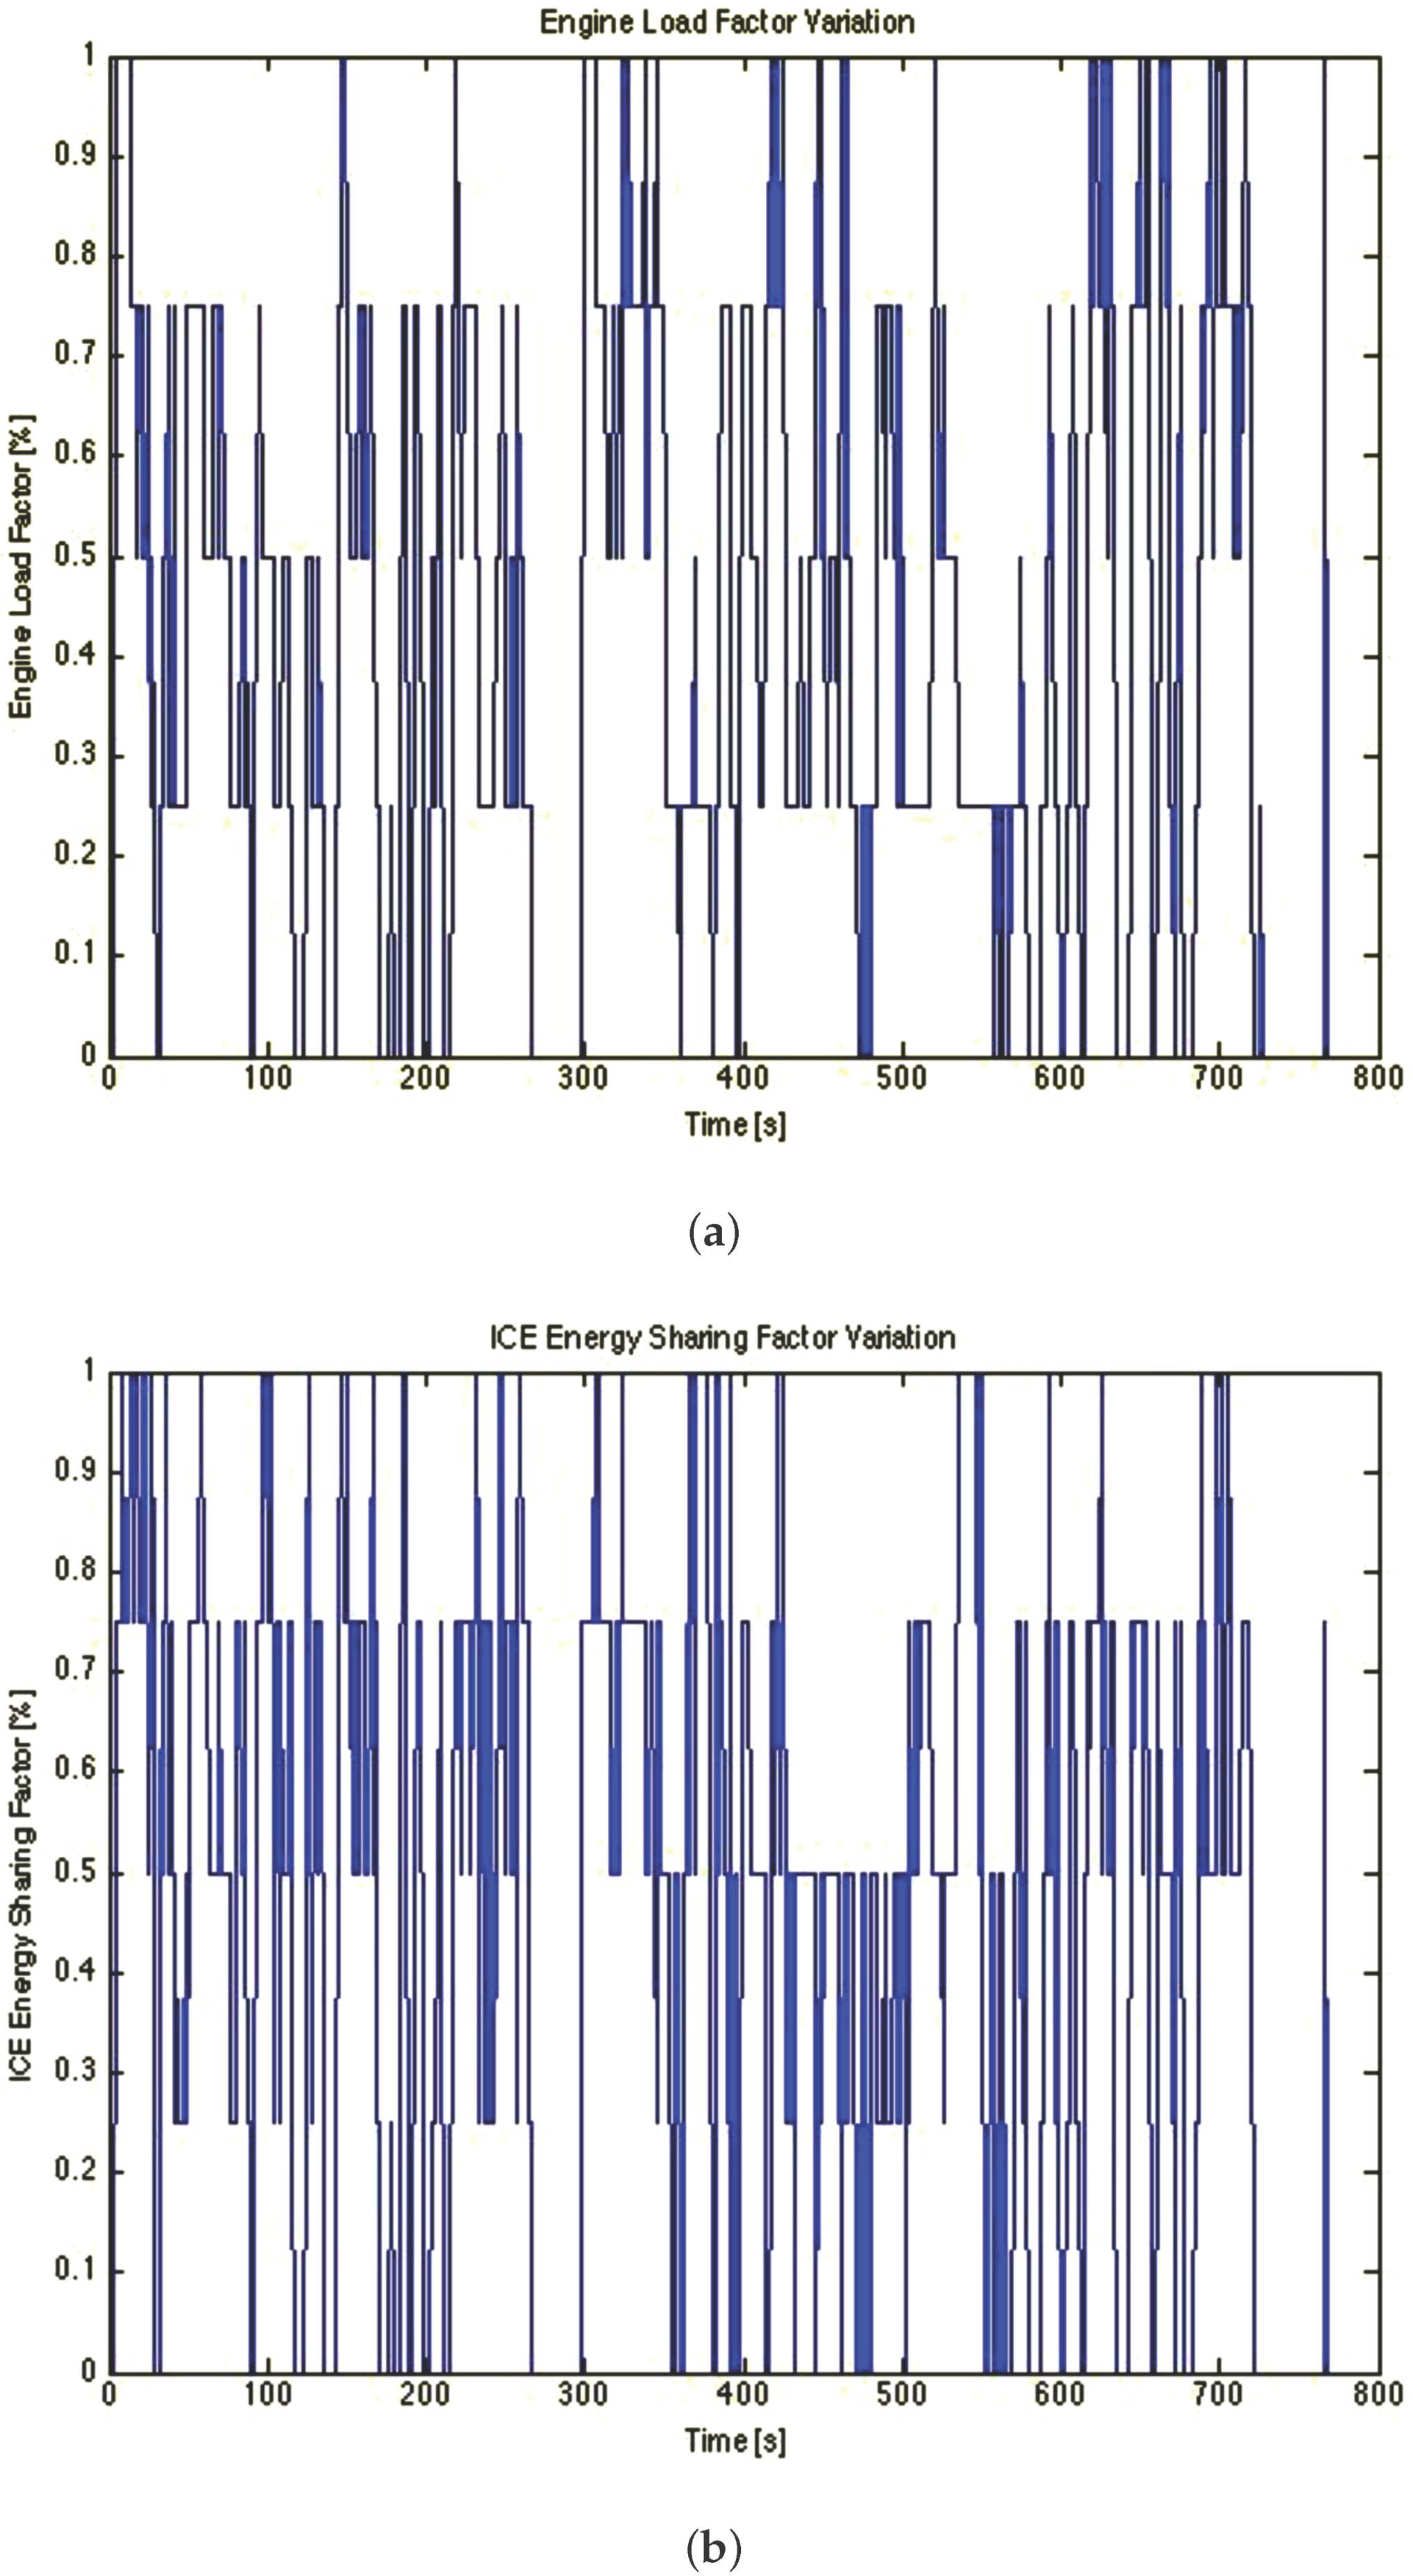
Therefore, Figure 9 portrays the engine load and sharing factors for the FUDS cycle, with an ICE size reduction of 10%. One can immediately observe that the mean value of the ICE load factor is increased to a value of 24%, with an extended operation in the medium load area, which has a higher efficiency, and the average sharing factor is also increased to a value of 26%, which still suggests a series architecture.
Future studies are aimed at improving the present procedure so that this iterative engine size correction could be automatically implemented and solved by an adequate optimization. The benefit derived from the reduction of the engine size is also proven by the 24% reduction of the fuel consumption, which was 24.63 km/L in the first case (full size) and becomes 30.58 km/L in the second case (10% reduction).
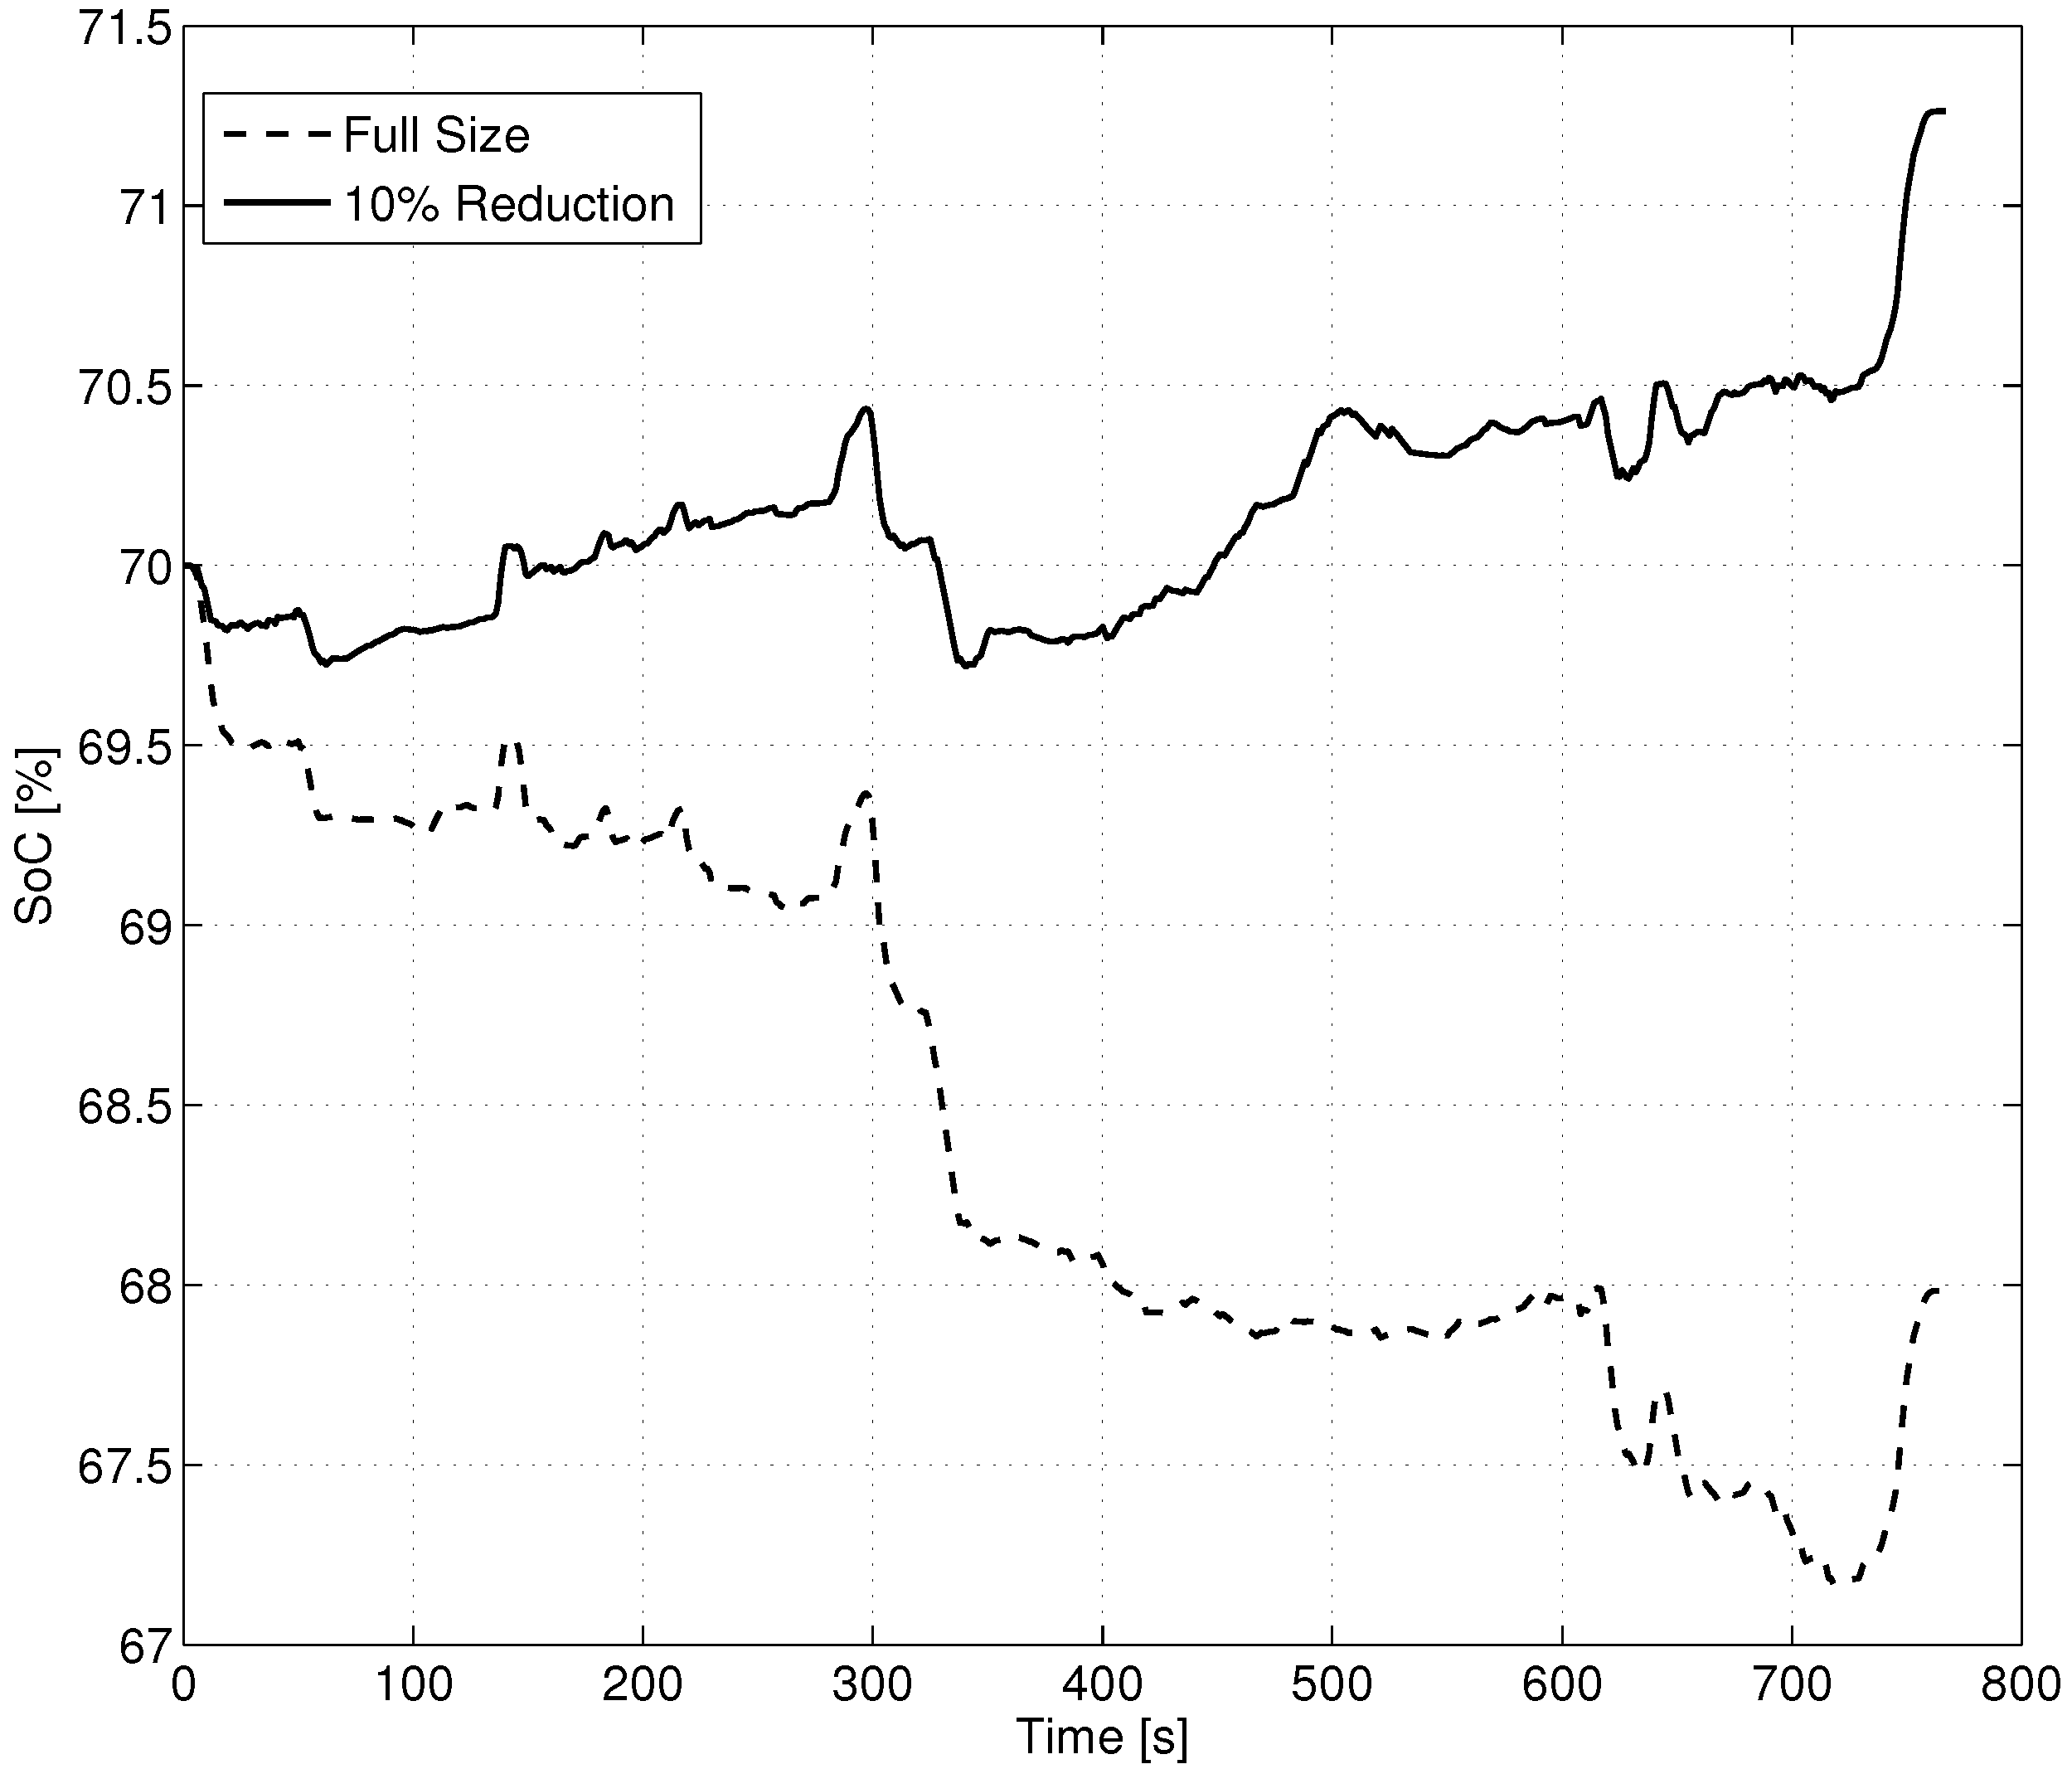
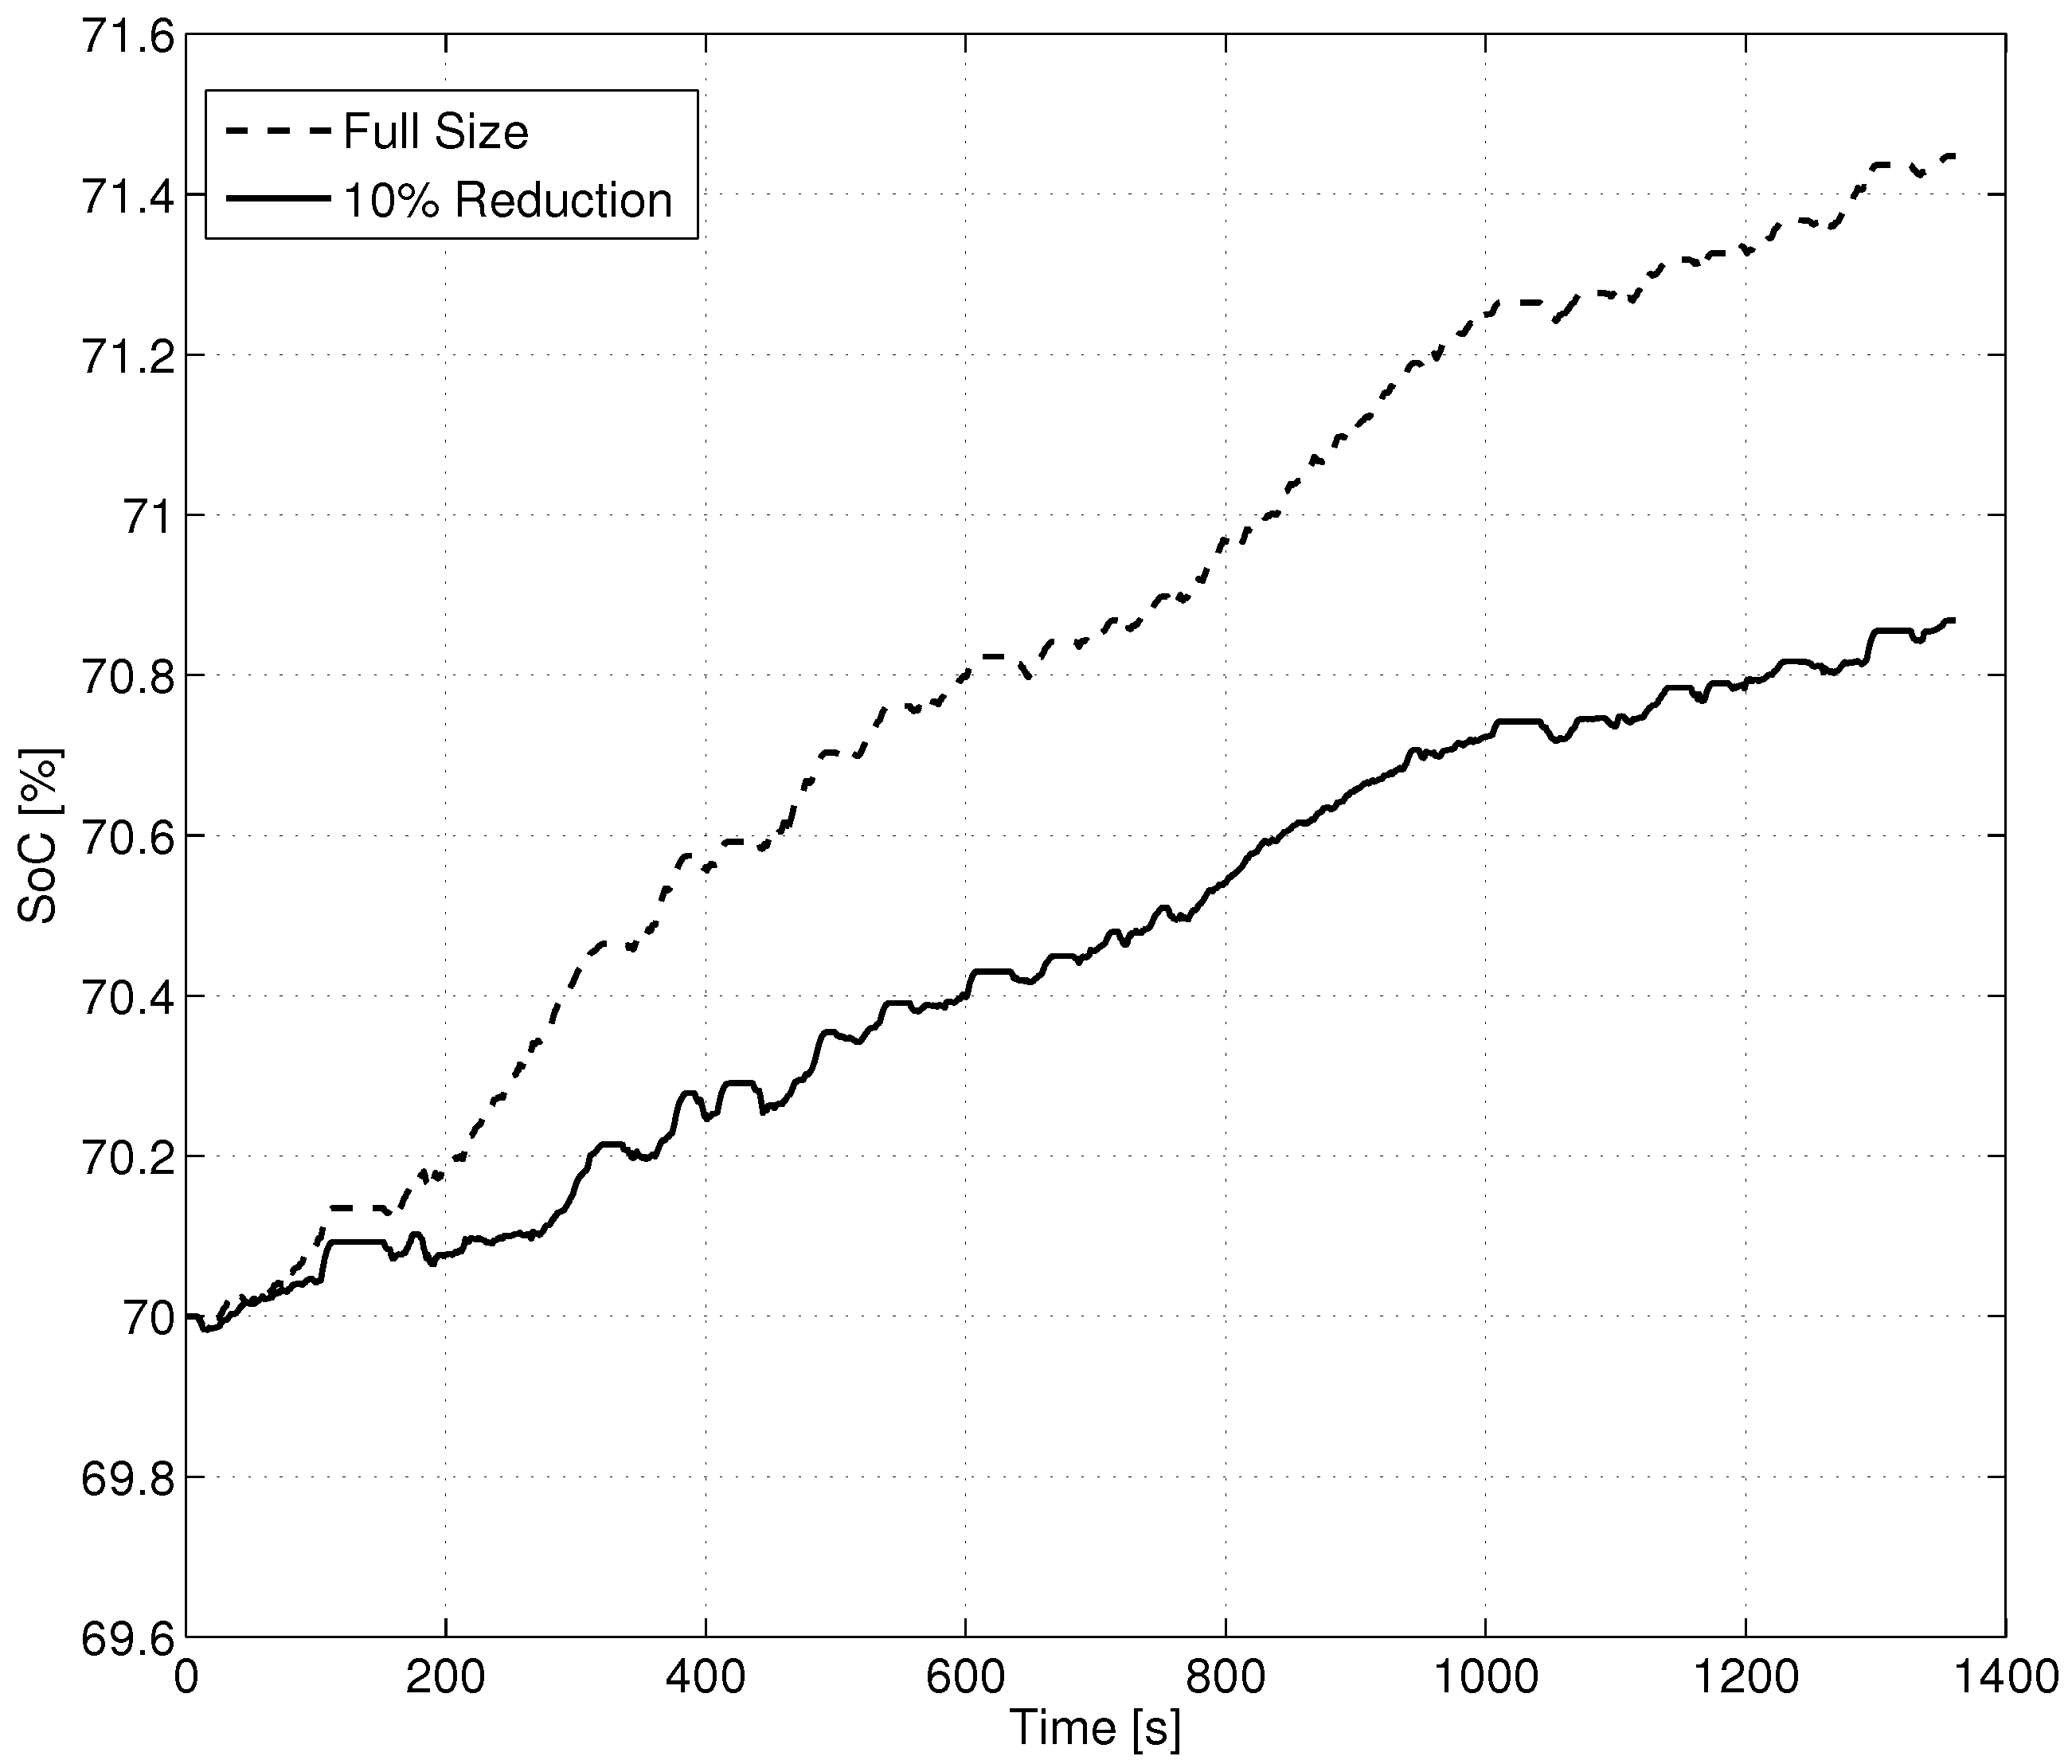
Moreover, Figure 10 shows that in the full size case, the optimal solution tends to overcharge the battery, within the constraints, unlike the 10% reduction case, where the final SoC is lower. This implies that, in the first case, during the driving mission, the engine was employed to charge the battery, with the result of a certain amount of energy stored at the end of the mission and not exploited, which is not desirable, and a reduction in the engine size is thus necessary. It is worth noting that, in general, the solution of such a problem is optimal only if the charge sustenance is guaranteed. Nonetheless, since the aim of the proposed procedure is to provide suggestions for an effective powertrain design, the state of charge is considered sustained if the final value of the SoC stays within a maximum variation of with respect to the initial SoC. The precise fulfillment of the requirement on the charge sustenance is afterwards left to the energy management strategy definition.
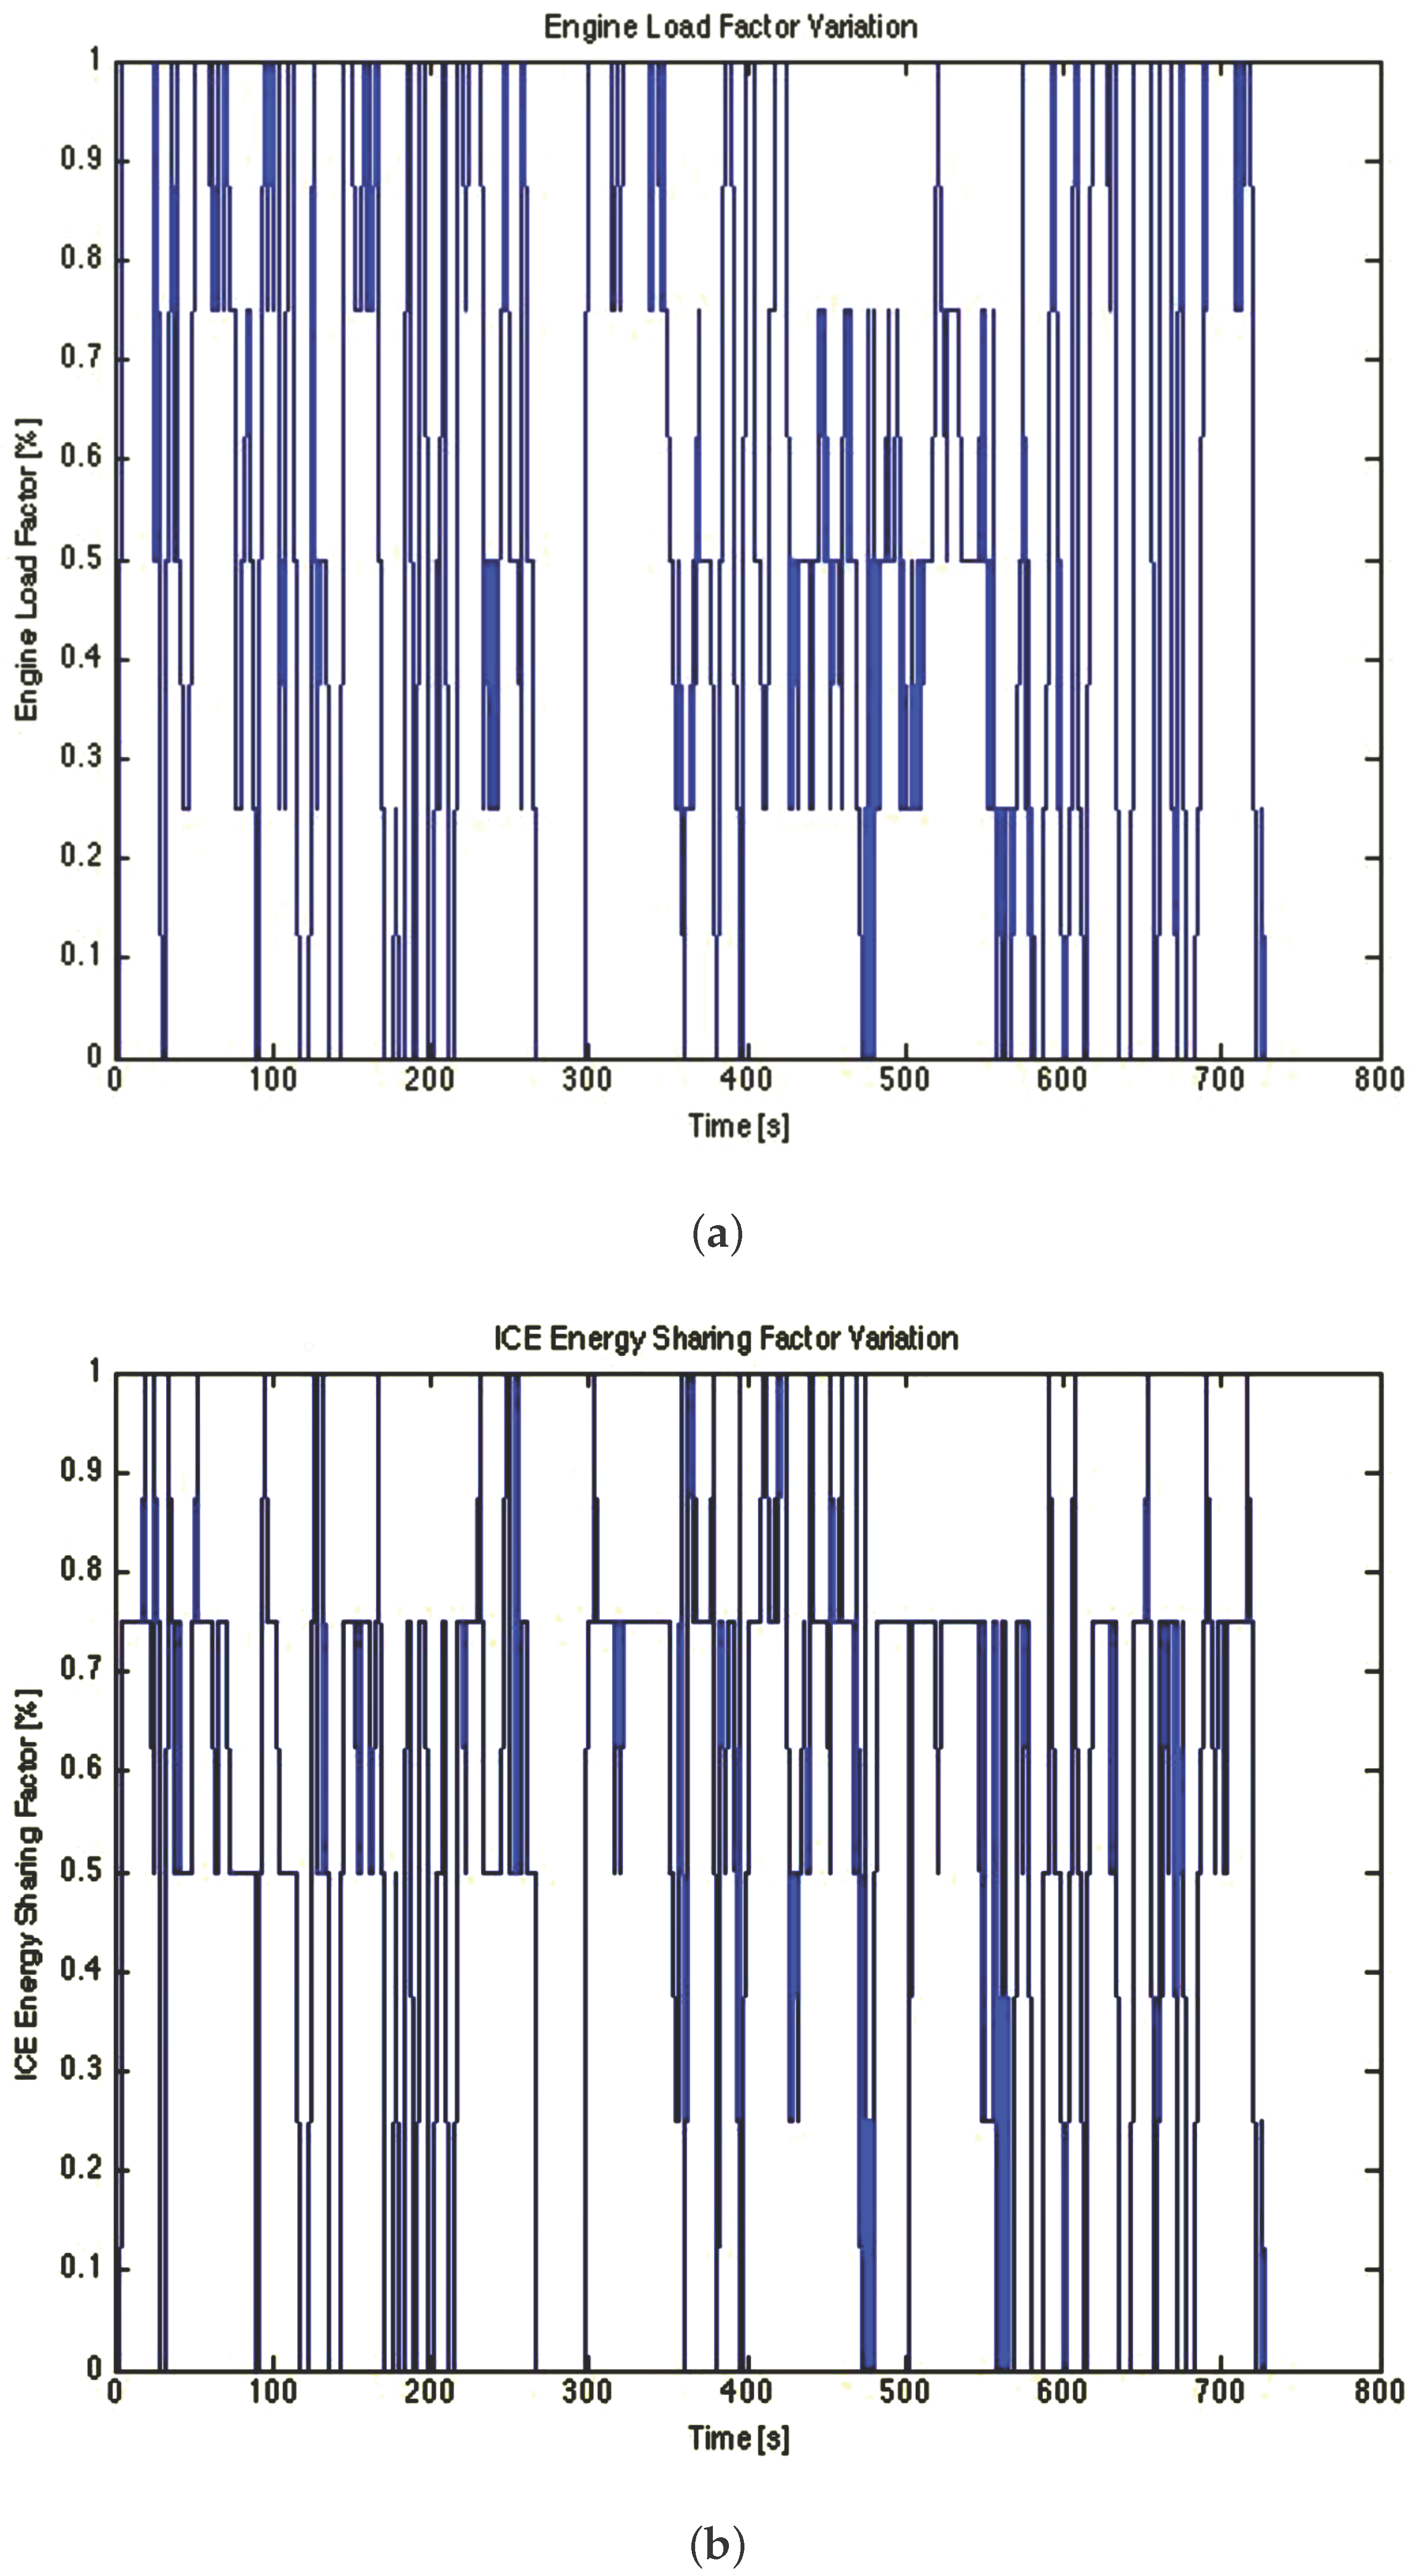
Figure 11 portrays the engine load and sharing factors for the FHDS cycle, which is a high demanding driving cycle, with a maximum speed of around 95 km/h. The average value of the load factor j results in being 41%. This result suggests that the ICE size could be reduced. An average sharing factor of 45%, instead, suggests that the ICE power is preferably used for traction purposes, and thus, the vehicle behaves as a combined HEV. This is for sure related to the kind of driving cycle, which is high demanding. Nonetheless, Figure 12 shows that a reduction of 10% in the engine size increases the load factor to a value of 53%, extending the operation in the medium/high load area, while the average sharing factor reaches a value of 52%, which still suggests a combined architecture, according to Table 6. The reduction of the engine size is again confirmed by the comparison of the fuel consumption in the full size and 10% reduction scenarios. In the first case, the consumption is 28.25 km/L, becoming 28.49 km/L in the second case. The small benefit derived from the size reduction can be explained considering that the engine already had an extended operation in the medium load area, characterized by high efficiencies. Moreover, a further reduction of the engine size likely results in a decrease of the overall efficiency, forcing the engine to work in low efficiency areas.
Nevertheless, Figure 13 shows that in the full size case, the optimal solution tends to use the engine to charge the battery, unlike the 10% reduction case, where the maximum SoC deviation is higher and the overall vehicle efficiency is increased thanks to the use of the electric motor for traction purposes.
4. Conclusions
A comprehensive methodology, based on the Dijkstra algorithm, has been presented in this paper. This methodology aims at supporting the designer during an HEV propulsion system design process. A generic scheme of a hybrid powertrain and all of the different energy paths are considered in a single simulation, in order to take into account all of the existing architectures of a hybrid vehicle. Over a driving mission, some feasible paths, linking a set of different states, are identified, which have to satisfy the system static and dynamic constraints. The optimal powertrain configuration is the one that corresponds to the shortest path, thus allowing for the minimum fuel consumption.
In order to prove the benefits of the procedure, some results are provided, which show how the size of the components and the driving mission highly affect the powertrain configuration. Nonetheless, the results provided in the paper are not general, but particular for the vehicle considered.
The results show how, for the economy car taken into account, in a low demanding driving cycle, not only the vehicle should be a series one, but a 24% reduction of the fuel consumption can be obtained with a 10% reduction of the engine size with respect to the original one. This improvement is suggested by the low value of the load factor for the given driving cycle and the original engine size. On the other hand, for high demanding driving cycles, a reduction of the engine size of 10% has small benefits in terms of fuel consumption, but increases the use of the battery and the electric motor for traction purposes, with a positive effect on the overall vehicle efficiency.
In this study, only the battery size is automatically changed during the optimization procedure, while the size of the engine is changed manually, starting from the size of the system already available in the original vehicle. Nevertheless, future improvements will consider the engine size variable in the optimization process. Other improvements will be aimed at comparing the results obtained for different vehicle categories, different gear ratios for the same vehicle category and different transmission systems (i.e., continuously variable transmission (CVT), planetary gear set, etc.).
Conflicts of Interest
The authors declare no conflict of interest.
References
- Friedman, D. A New Road: The Technology and Potential of Hybrid Vehicles; UCS Publications: Cambridge, MA, USA, 2003. [Google Scholar]
- Smokers, R. Annex VI: Hybrid Vehicles Overview Report; International Energy Agency: Paris, France, 2000. [Google Scholar]
- Chan, C.C. The state of the art of electric, hybrid and fuel cell vehicles. Proc. IEEE 2007, 95, 704–718. [Google Scholar] [CrossRef]
- Zegers, P. Fuel cell commercialization: The key to a hydrogen economy. J. Power Sour. 2006, 154, 497–502. [Google Scholar] [CrossRef]
- Bayindir, K.C.; Gözüküçük, M.A.; Teke, A. A Comprehensive Overview of Hybrid Electric Vehicle: Powertrain Configuration, Powertrain Control Techniques and Electronic Control Units. Energy Convers. Manag. 2011, 52, 1305–1313. [Google Scholar] [CrossRef]
- Mock, P. European Vehicle Market Statistics; Pocketbook: Lugano, Switzerland, 2014. [Google Scholar]
- Marano, V.; Medina, H.; Sorrentino, M.; Rizzo, G. A model to assess the benefits of an after-market hybridization kit based on realistic driving habits and charging infrastructure. SAE Int. J. Altern. Powertrains 2013, 2, 471–481. [Google Scholar] [CrossRef]
- Sciaretta, A.; Guzzella, L. Vehicle Propulsion Systems: Introduction to Modeling and Optimization; Springer: Berlin, Germany, 2005. [Google Scholar]
- Serrao, L. A Comparative Analysis of Energy Management Strategies for Hybrid Electric Vehicles. Ph.D. Thesis, The Ohio State University, Columbus, OH, USA, 2009. [Google Scholar]
- Miller, T. Advances in NiMH and Li-Ion Batteries for Full Hybrids. In Proceedings of the Advanced Automotive Batteries Conference, Baltimore, MD, USA, 15–19 May 2006. [Google Scholar]
- Lacandia, F.; Tribioli, L.; Onori, S.; Rizzoni, G. Adaptive energy management strategy calibration in PHEVs based on a sensitivity study. SAE Int. J. Altern. Power. 2013, 2, 443–455. [Google Scholar] [CrossRef]
- Nuesch, T.; Ott, T.; Ebbesen, S.; Guzzella, L. Cost and Fuel-Optimal Selection of HEV Topologies Using Particle Swarm Optimization and Dynamic Programming. In Proceedings of the American Control Conference, Montreal, QC, Canada, 27–29 June 2012; pp. 1302–1307. [Google Scholar]
- Feola, M.; Ubertini, S.; Martini, F. An analytical model for hybrid vehicles design. In Proceedings of the International Conference on Engine for Automobile, SAE Conference, Naples, Italy, 11–16 September 2005. [Google Scholar]
- Ebbesen, S.; Dönitz, C.; Guzzella, L. Particle swarm optimisation for hybrid electric drive-train sizing. Int. J. Veh. Des. 2012, 58, 181–199. [Google Scholar] [CrossRef]
- Zou, Y.; Li, D.-G.; Hu, X.-S. Optimal Sizing and Control Strategy Design for Heavy Hybrid Electric Truck. Math. Prob. Eng. 2013, 2012, 404073. [Google Scholar] [CrossRef]
- Murgovski, N.; Johannesson, L.; Sjöberg, J.; Egardt, B. Component sizing of a plug-in hybrid electric powertrain via convex optimization. Mechatronics 2012, 22, 106–120. [Google Scholar] [CrossRef]
- Donateo, T.; Serrao, L.; Rizzoni, G. A Two-step Optimization Method for the Preliminary Design of a Hybrid Electric Vehicle. Int. J. Electr. Hybrid Veh. 2008, 1. [Google Scholar] [CrossRef]
- Zhang, X.; Li, C.T.; Kum, D.; Peng, H. Prius(+) and Volt(-): Configuration Analysis of Power-Split Hybrid Vehicles With a Single Planetary Gear. IEEE Trans. Veh. Technol. 2012, 61, 3544–3552. [Google Scholar] [CrossRef]
- Zhuang, W.; Zhang, X.; Peng, H.; Wang, L. Simultaneous Optimization of Topology and Component Sizes for Double Planetary Gear Hybrid Powertrains. Energies 2016, 9, 411. [Google Scholar] [CrossRef]
- Zhuang, W.; Zhang, X.; Ding, Y.; Wang, L.; Hu, X. Comparison of multi-mode hybrid powertrains with multiple planetary gears. Appl. Energy 2016, 178, 624–632. [Google Scholar] [CrossRef]
- Karden, E.; Ploumen, S.; Fricke, B.; Miller, T.; Snyder, K. Energy storage devices for future hybrid electric vehicles. J. Power Sour. 2007, 168, 2–11. [Google Scholar] [CrossRef]
- Onori, S.; Spagnol, P.; Marano, V.; Guezennec, Y.; Rizzoni, G. A new life estimation method for Lithium-ion batteries in Plug-in Hybrid Electric Vehicle applications. Power Electron. Int. J. 2012, 4, 302–319. [Google Scholar] [CrossRef]
- Siddall, D.E.; Day, D.D. Updating the Vehicle Class Categories. SAE Technical Paper 960897. In Proceedings of the International Congress and Exposition, Detroit, MI, USA, 22–29 February 1996. [Google Scholar]
- Naunheimer, H.; Bertsche, B.; Ryborz, J.; Novak, W. Automotive Transmissions—Fundamentals, Selection, Design and Application, 2nd ed.; Springer: Berlin, Germany, 2011. [Google Scholar]
- Zuurendonk, B. Advanced Fuel Consumption and Emission Modeling Using Willans Line Scaling Techniques for Engines; Technical Report; Technische Universiteit Eindhoven: Eindhoven, The Netherlands, 2005. [Google Scholar]
- Rizzoni, G.; Guzzella, L.; Baumann, B.M. Unified modeling of hybrid electric vehicle drivetrains. IEEE/ASME Trans. Mech. 1999, 4, 246–257. [Google Scholar] [CrossRef]
- Sundström, O. Optimal Control and Design of Hybrid-Electric Vehicles. Ph.D. Thesis, Institute for Dynamic Systems and Control, ETH Zurich, Zürich, Switzerland, 2009. [Google Scholar]
- Murgovski, N. Optimal Powertrain Dimensioning and Potential Assessment of Hybrid Electric Vehicles, Ph.D. Thesis, Chalmers University of Technology, Göteborg, Sweden, 2012. [Google Scholar]
- Li, Q.; Itoh, Y.; Imanishi, N.; Hirano, A.; Takeda, Y.; Yamamoto, O. All solid lithium polymer batteries with a novel composite polymer electrolyte. Solid State Ion. 2003, 159, 97–109. [Google Scholar] [CrossRef]
- Paganelli, G.; Ercole, G.; Brahma, A.; Guezennec, Y.; Rizzoni, G. General supervisory control policy for energy optimization of charge-sustaining hybrid electric vehicles. JSAE Rev. 2001, 22, 511–518. [Google Scholar] [CrossRef]
- Bianchi, D.; Rolando, L.; Serrao, L.; Onori, S.; Rizzoni, G. Layered control strategies for hybrid electric vehicles based on optimal control. Int. J. Electr. Hybrid Veh. 2011, 3, 191–217. [Google Scholar] [CrossRef]
- Cormen, T.H.; Leiserson, C.E.; Rivest, R.L.; Stein, C. Introduction to Algorithms, 2nd ed.; MIT Press: Cambridge, MA, USA; McGraw-Hill: New York, NY, USA, 2001; pp. 595–601. [Google Scholar]
- Barbieri, M.; Bella, G.; Martini, F.; Tribioli, L. Dimensionamento di un veicolo microcar ibrido termico-elettrico di tipo parallelo. In Proceedings of the 65th Conference of the Italian Thermal Machines Engineering Association—ATI2010, Cagliari, Italy, 14–17 September 2010. [Google Scholar]
- Kokam Battery Catalogue. Available online: http://www.kokam.com/product/ (accessed on 29 June 2017).
Figure 1.
Algorithm flowchart.

Figure 2.
Powertrain architecture of a generic post-transmission series/parallel HEV. EM, Electric Machine; EG, Electric Generator; GB, Gear Box.
Figure 2.
Powertrain architecture of a generic post-transmission series/parallel HEV. EM, Electric Machine; EG, Electric Generator; GB, Gear Box.

Figure 3.
Zeroth order electrical circuit model of the battery.
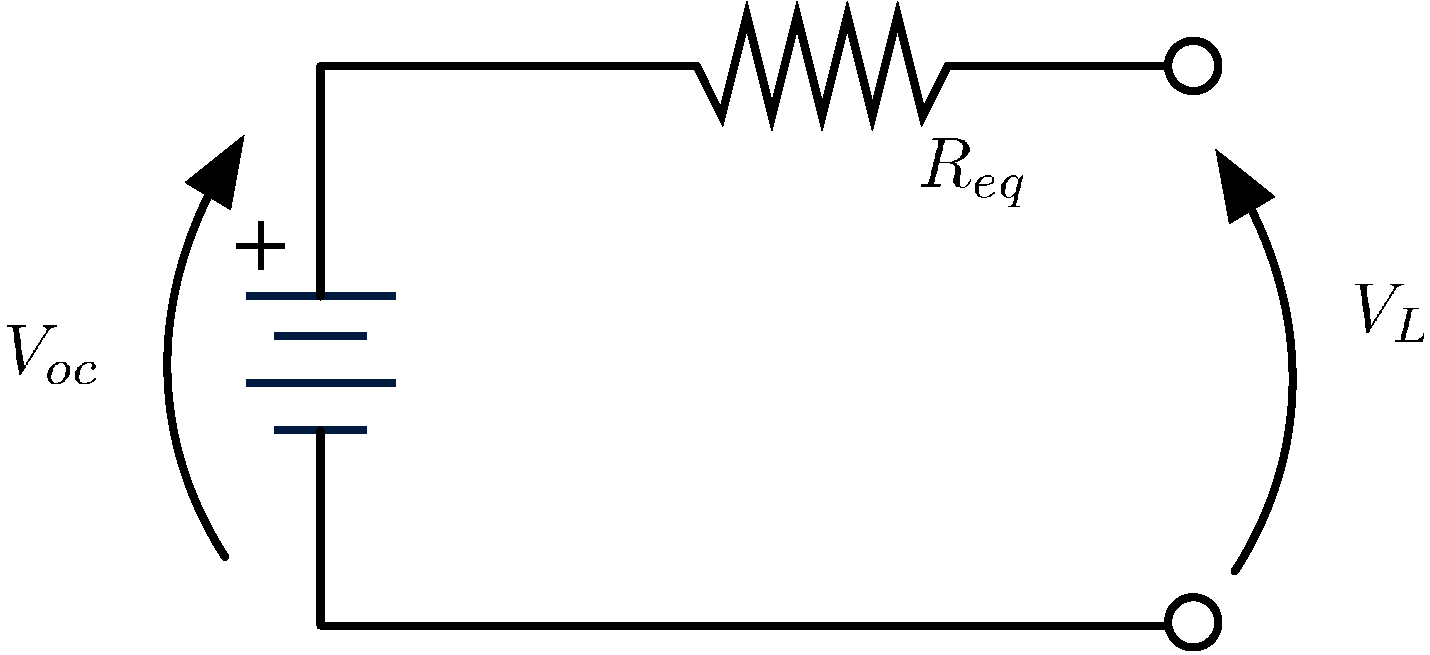
Figure 4.
Battery open circuit voltage.
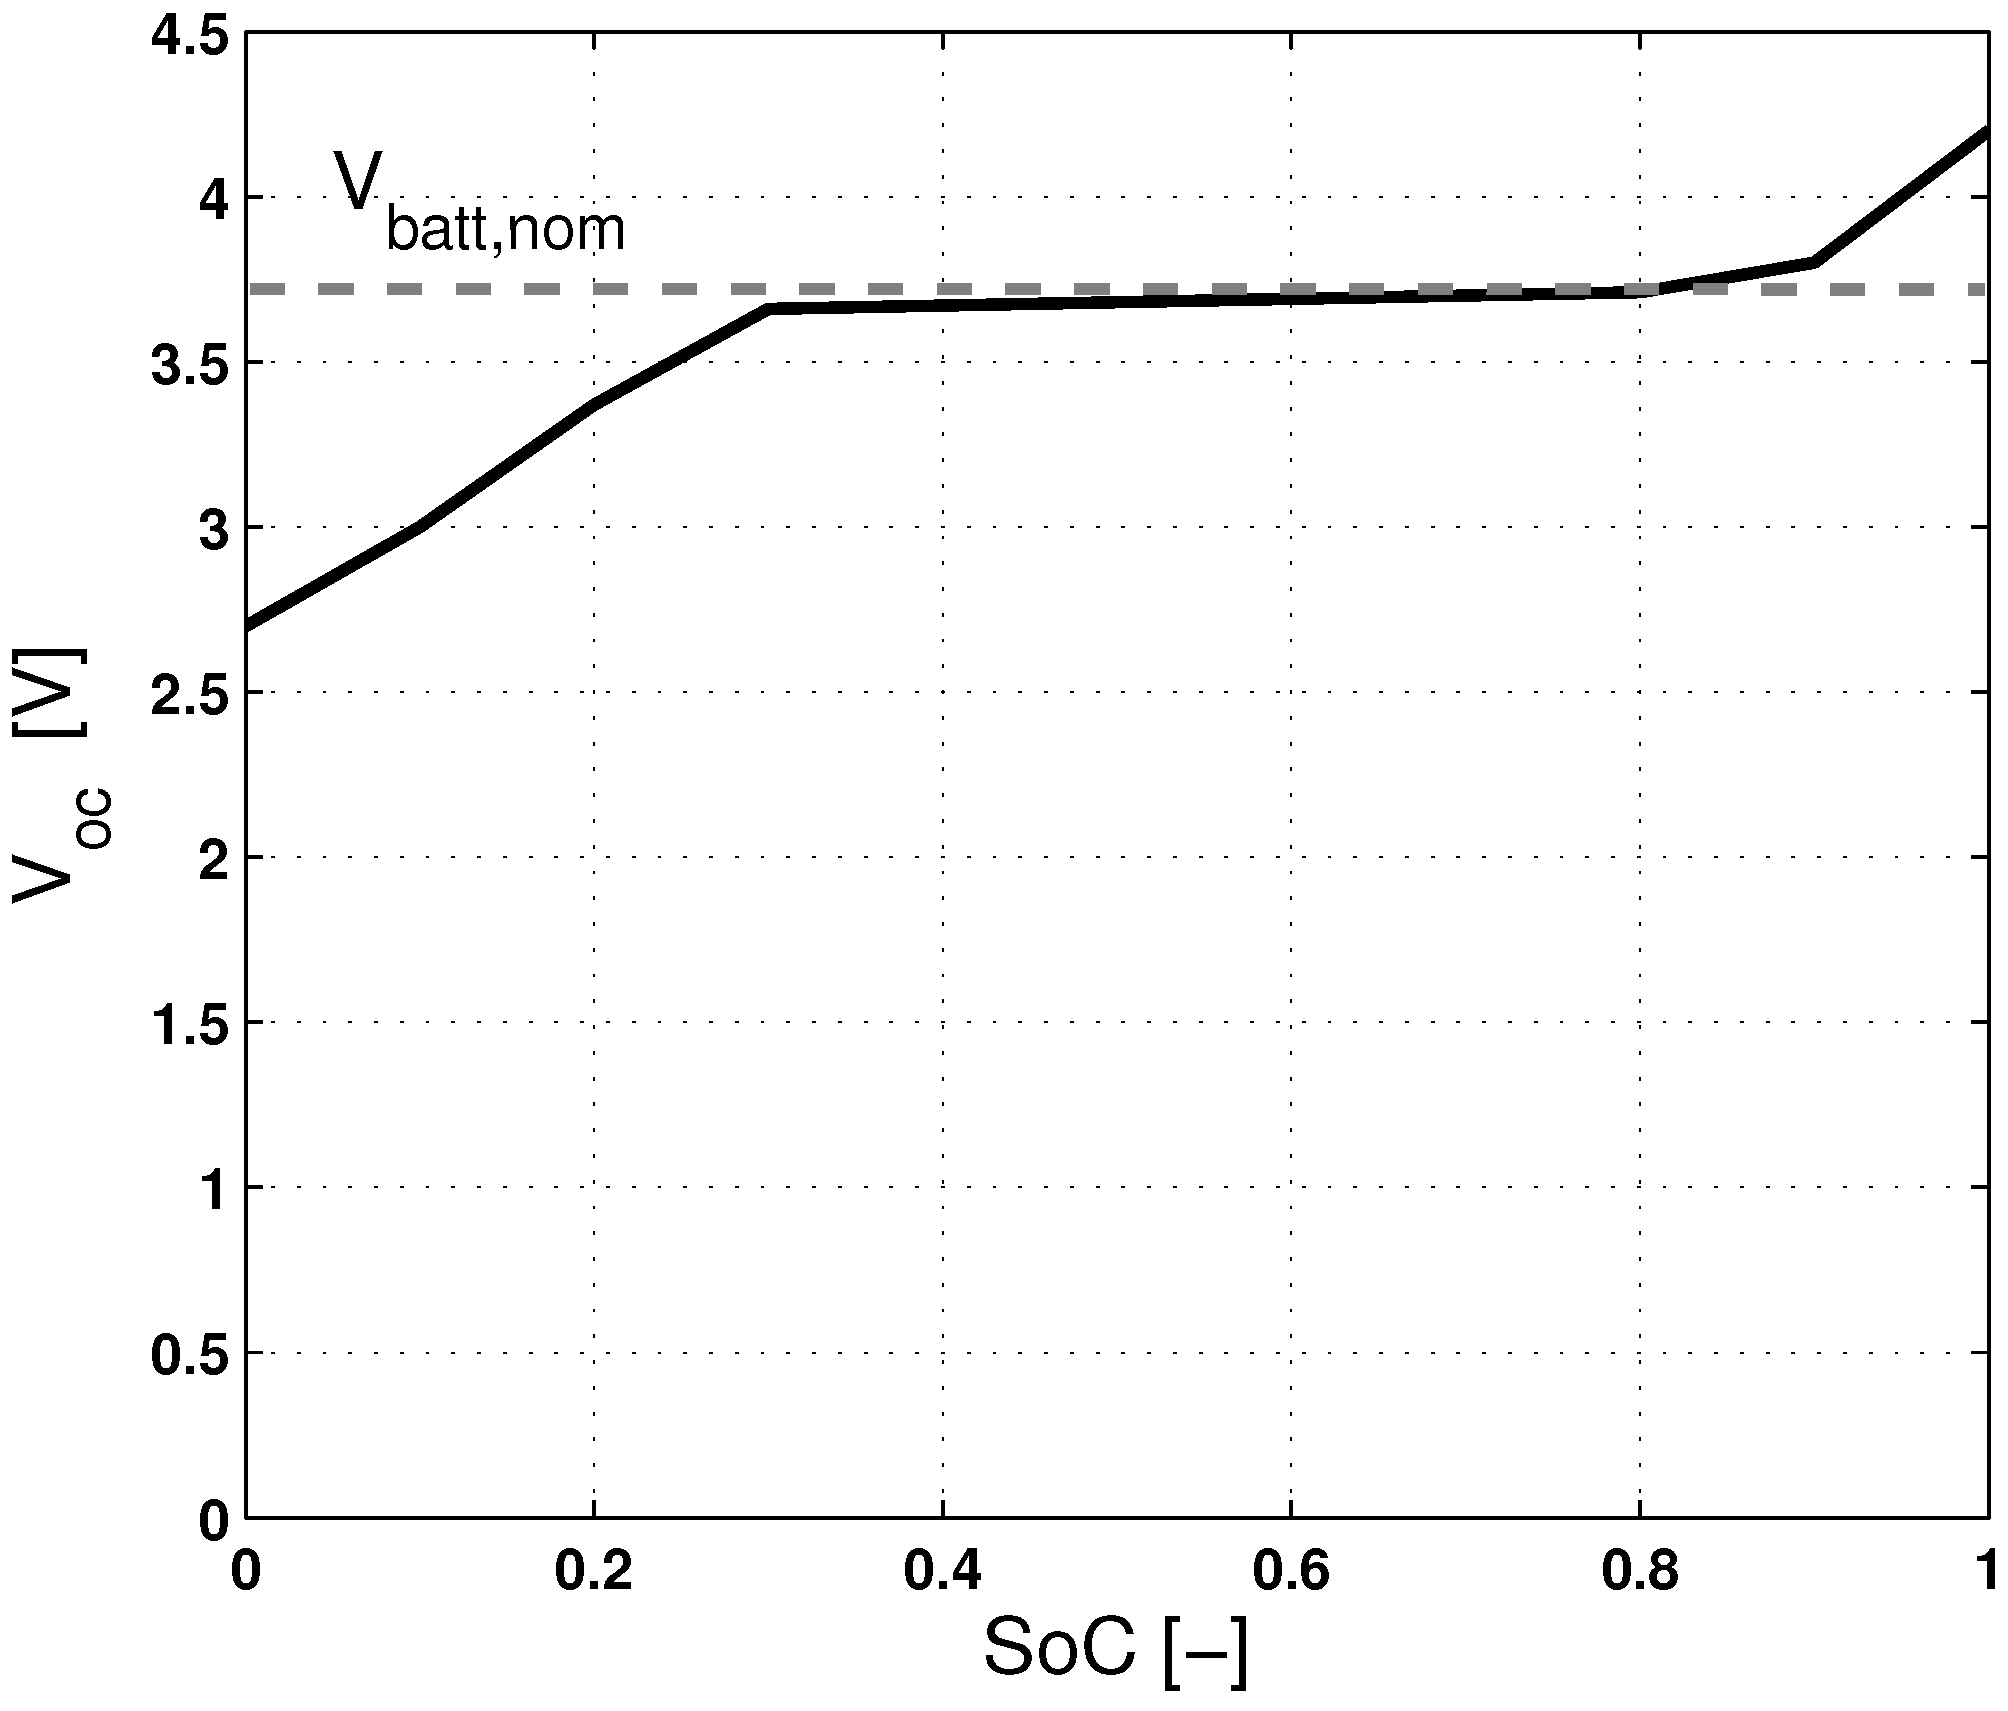
Figure 5.
Graph definition.

Figure 6.
Thermal engine efficiency map.
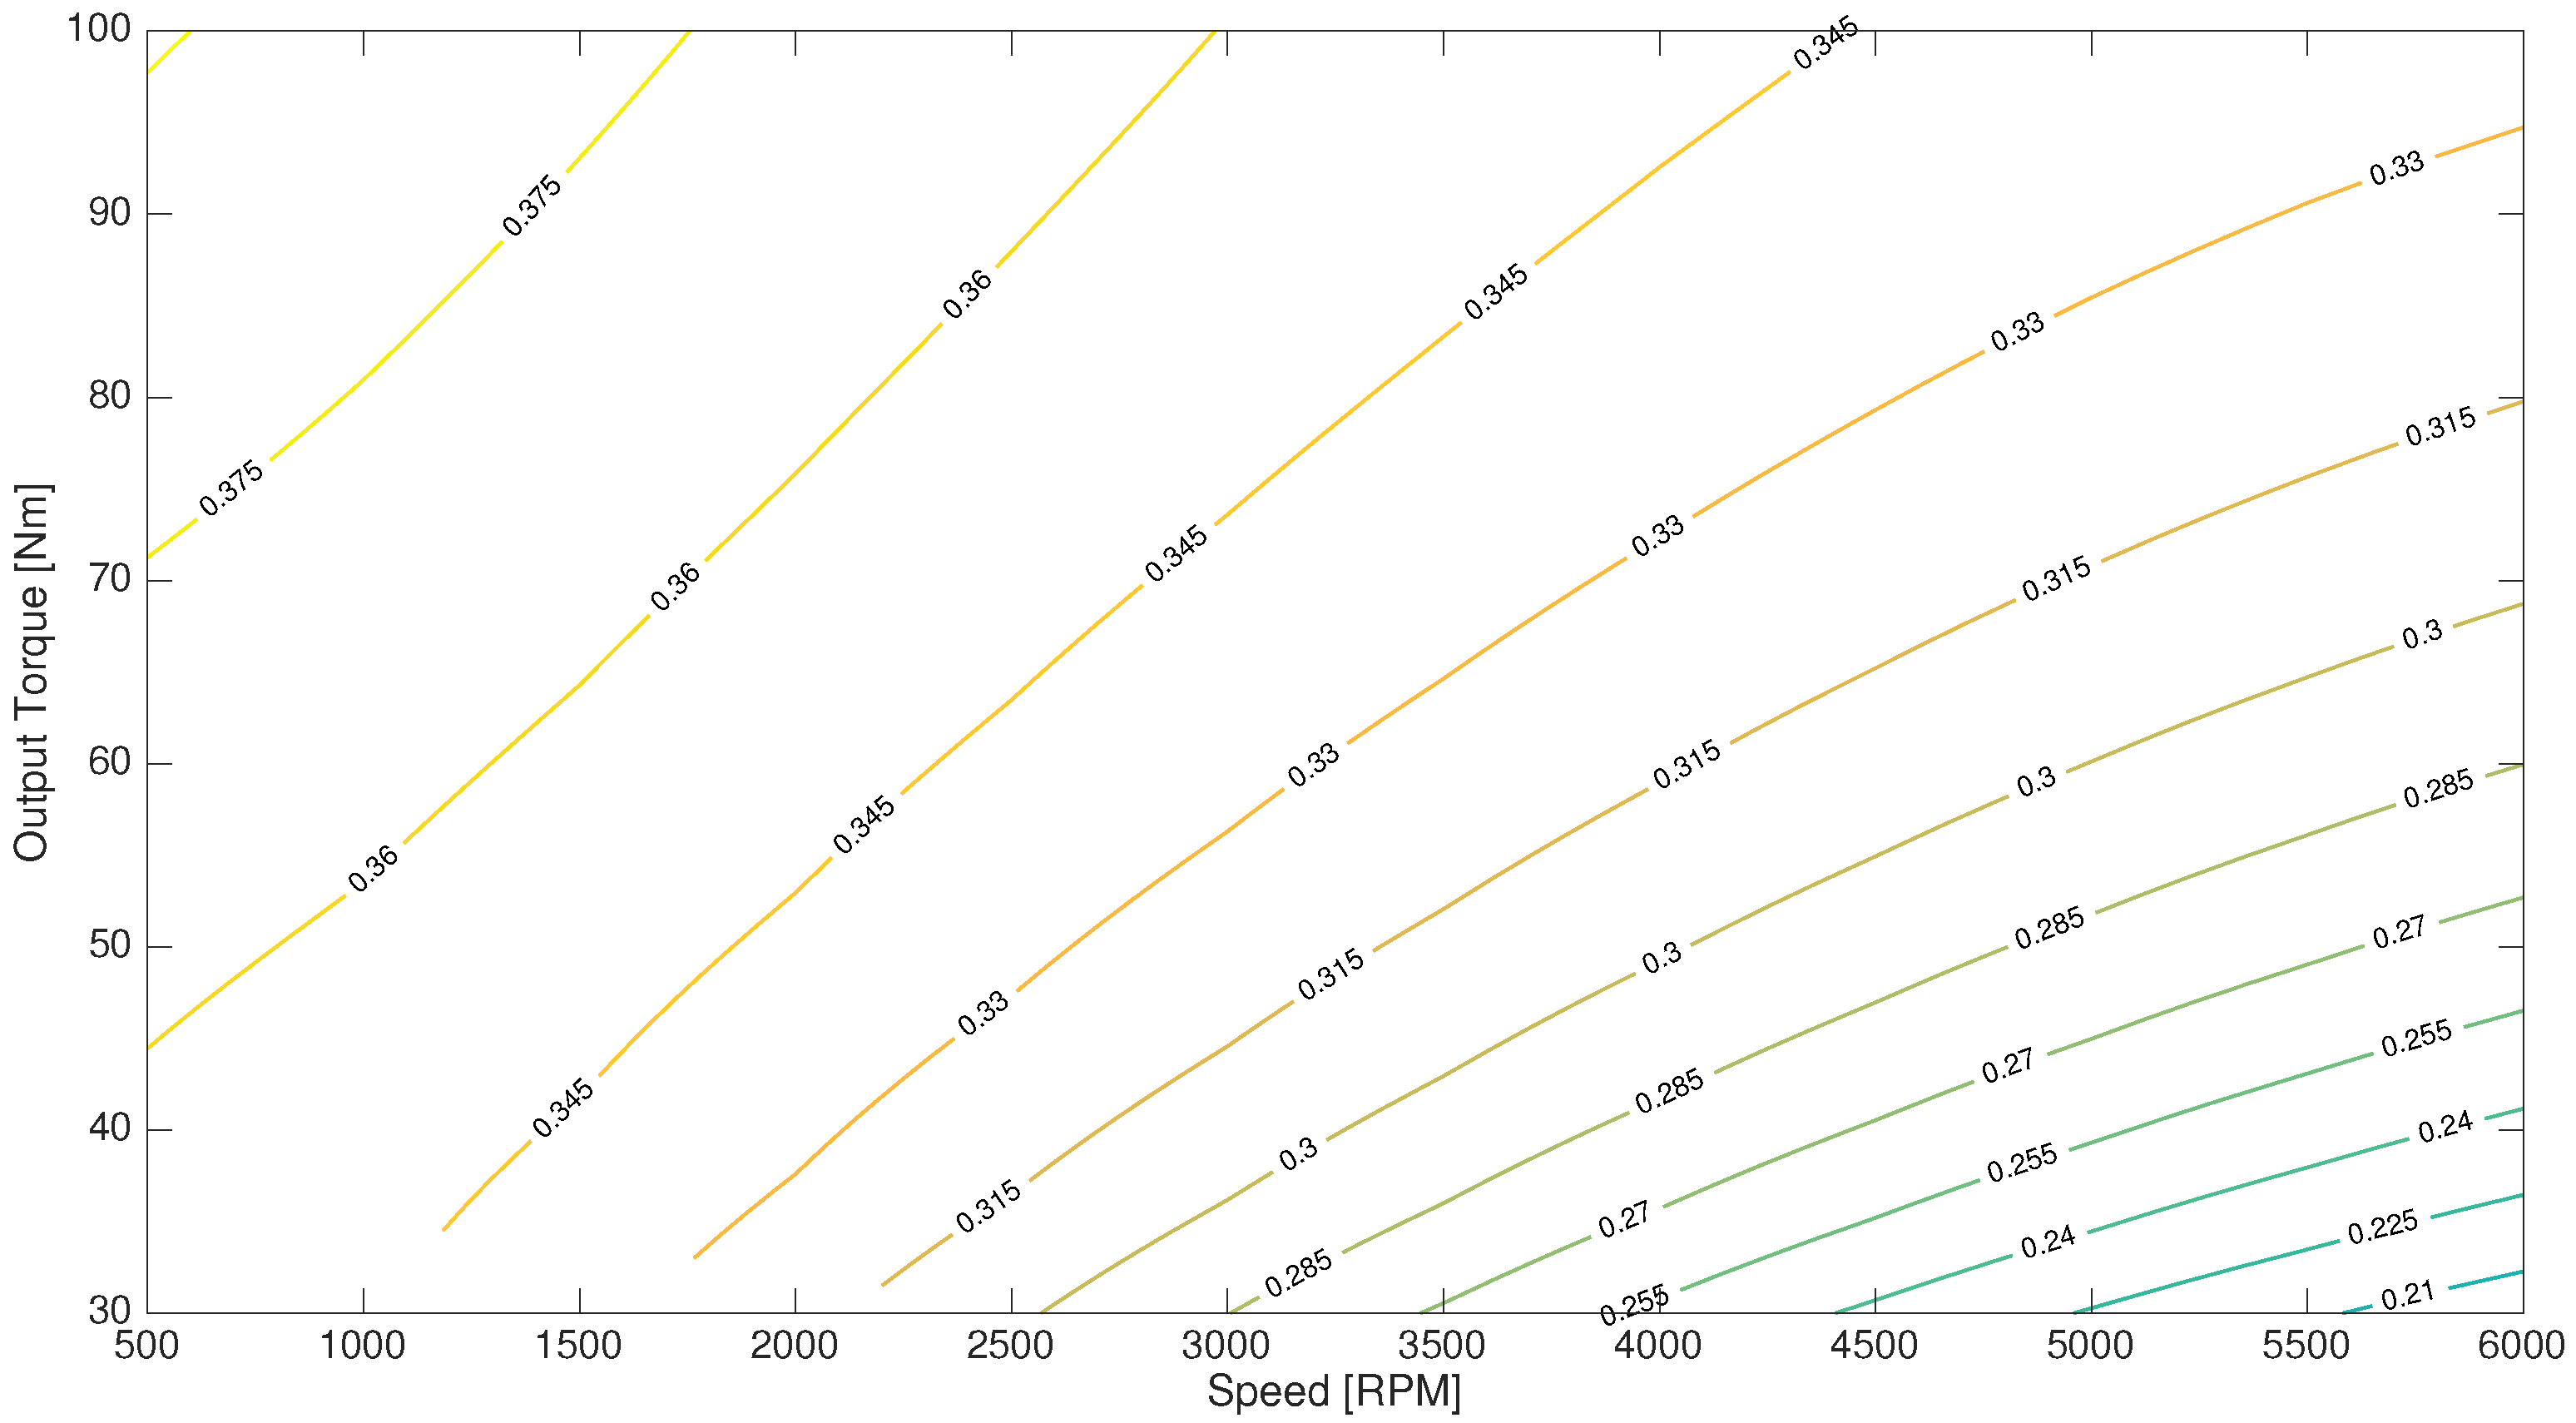
Figure 7.
Driving speed profiles. (a) FUDS speed profile; (b) FHDS speed profile.
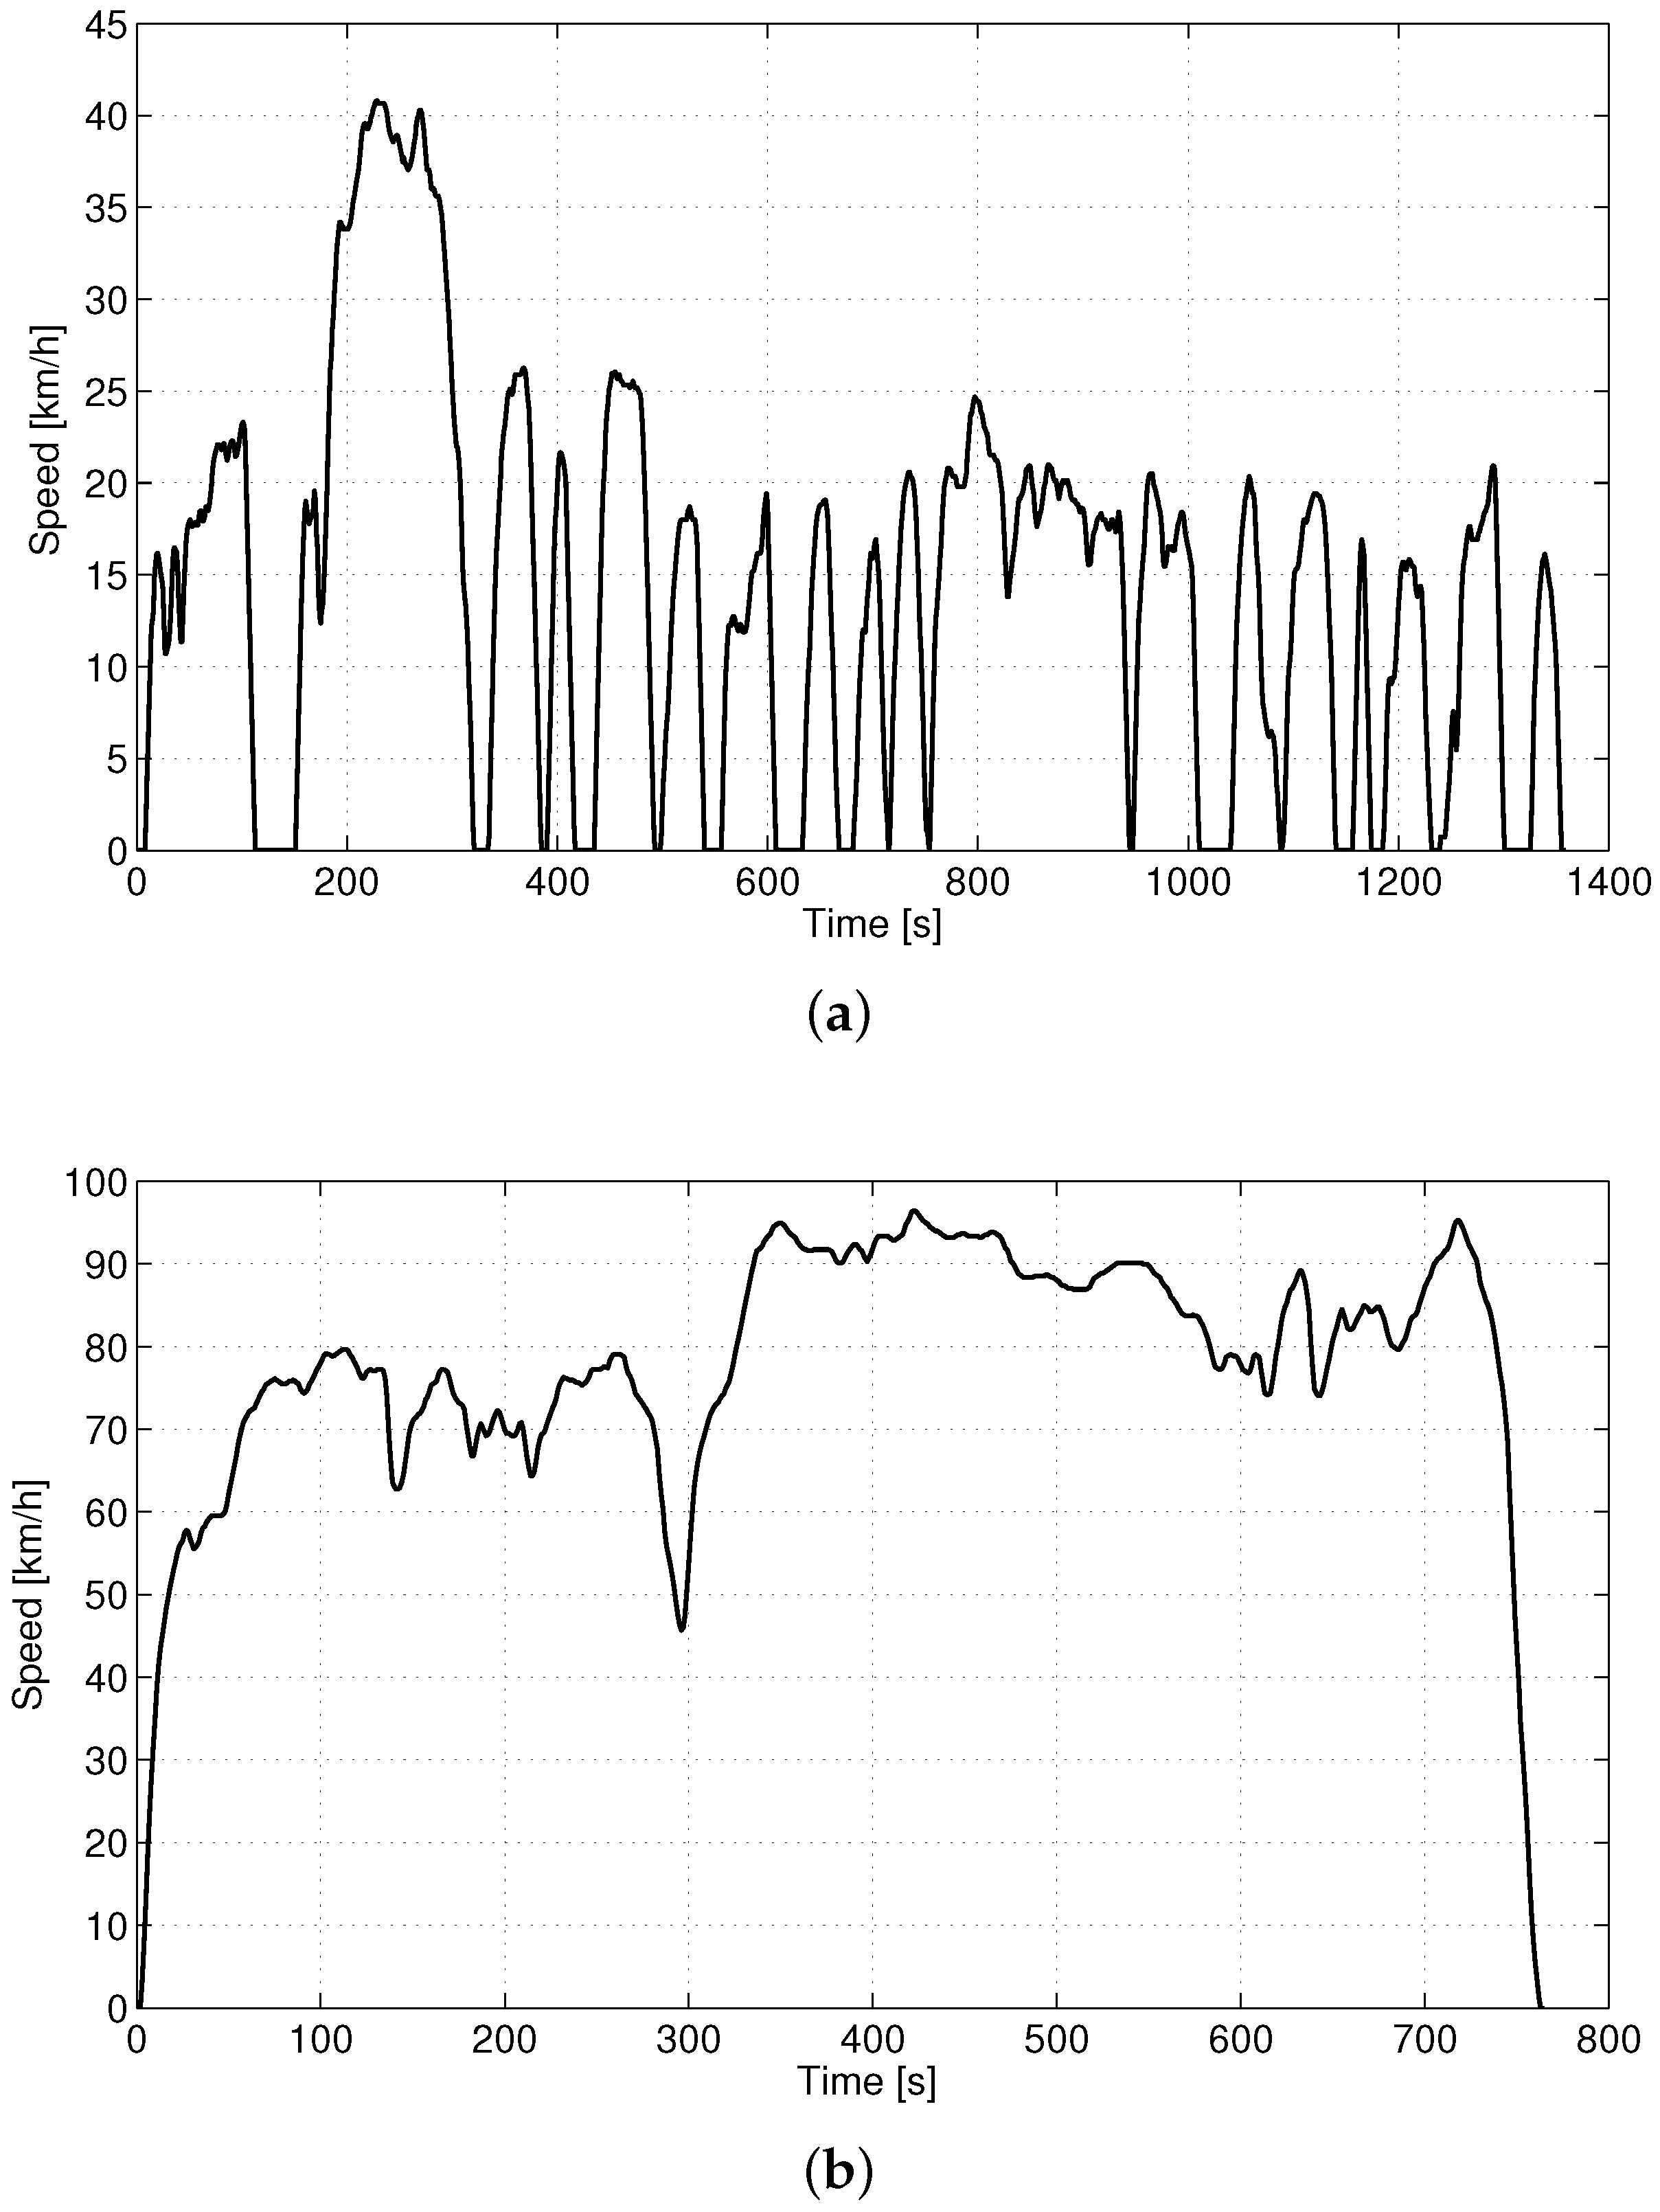
Figure 8.
FUDS driving cycle. (a) ICE load factor; (b) ICE energy sharing factor.
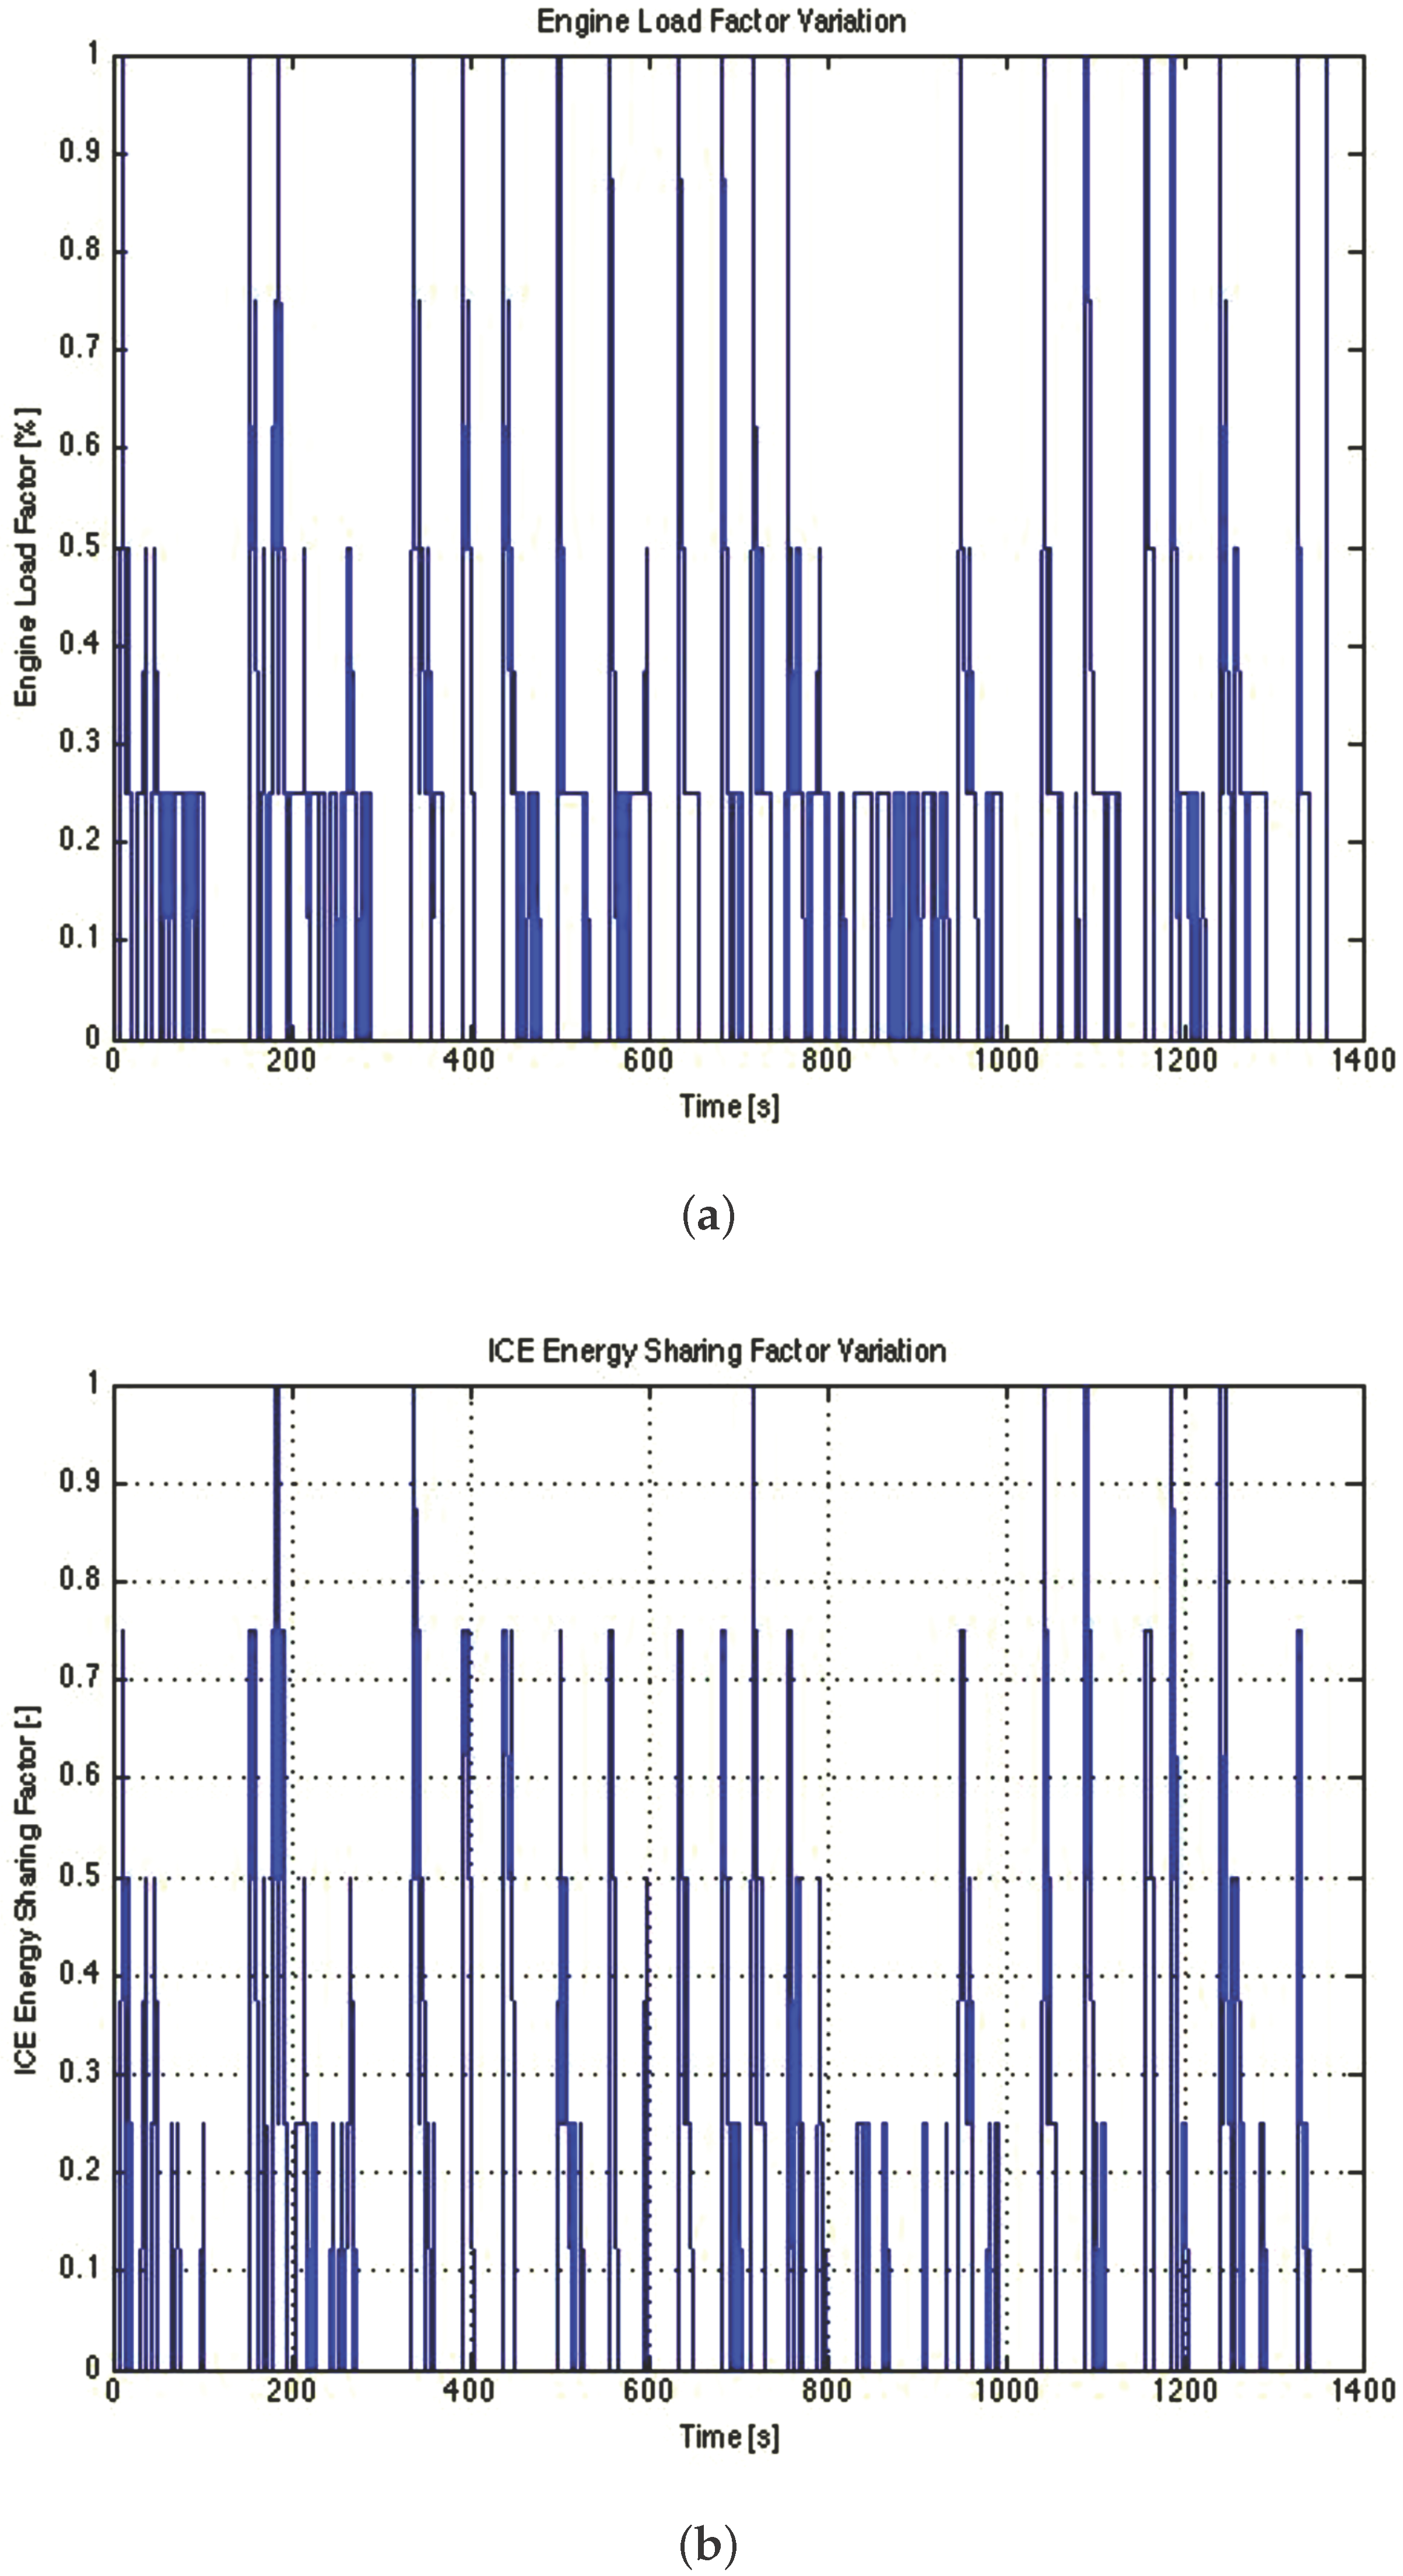
Figure 9.
FUDS driving cycle with a 10% reduction of the thermal engine size w.r.t. Figure 8. (a) ICE load factor; (b) ICE energy sharing factor.
Figure 9.
FUDS driving cycle with a 10% reduction of the thermal engine size w.r.t. Figure 8. (a) ICE load factor; (b) ICE energy sharing factor.

Figure 10.
State of charge comparison for the FUDS.

Figure 11.
FHDS driving cycle. (a) ICE load factor; (b) ICE energy sharing factor.

Figure 12.
FHDS driving cycle with a 10% reduction of the thermal engine size w.r.t. Figure 11. (a) ICE load factor; (b) ICE energy sharing factor.
Figure 12.
FHDS driving cycle with a 10% reduction of the thermal engine size w.r.t. Figure 11. (a) ICE load factor; (b) ICE energy sharing factor.

Figure 13.
State of charge comparison for the FHDS.

Table 1.
Vehicle architectures.
| Mode | ||
|---|---|---|
| Parallel | 1 | 0 |
| Series | 0 | 1 |
| Combined | 1 | 1 |
Table 2.
Vehicle/drivetrain characteristics.
| Vehicle | |
| Mass | 600 kg |
| Tire Rolling Coefficient, a | 0.013 |
| Tire Rolling Coefficient, b | 6.5 × s2/m2 |
| Drag Coefficient | 0.35 |
| Drivetrain | |
| EM to ICE Speed Ratio | 1.2 |
| EG to ICE Speed Ratio | 0.55 |
Table 3.
Gear ratios and shifting schedule.
| Gear Number | Gear Ratio | Shifting Speed |
|---|---|---|
| 1 | 3.7 | 15 km/h |
| 2 | 2.3 | 27 km/h |
| 3 | 1.6 | 43 km/h |
| 4 | 1.24 | 63 km/h |
| 5 | 0.83 | 85 km/h |
Table 4.
Powertrain components.
| Component feature | Value |
|---|---|
| Engine maximum power | 50 kW@5500 rpm |
| Engine maximum torque | 92 Nm@3450 rpm |
| Electric Motor maximum power | 30 kW@6800 rpm |
| Generator maximum power | 30 kW@6800 rpm |
Table 5.
Cell specification.
| Parameter | Value |
|---|---|
| Capacity | 5 Ah |
| Weight | 0.164 kg |
| Peak Current | 50 A |
| Nominal Voltage | 3.7 V |
| Minimum Voltage | 2.7 V |
| Maximum Voltage | 4.2 V |
| SoC Range | 0.65–0.75 |
Table 6.
Sharing factor ranges.
| Mode | Sharing Factor Range |
|---|---|
| Parallel | 0.8 < p ≤ 1 |
| Combined | 0.3 ≤ p ≤ 0.8 |
| Series | 0 ≤ p < 0.3 |
© 2017 by the author. Licensee MDPI, Basel, Switzerland. This article is an open access article distributed under the terms and conditions of the Creative Commons Attribution (CC BY) license (http://creativecommons.org/licenses/by/4.0/).
Share and Cite
MDPI and ACS Style
Tribioli, L. Energy-Based Design of Powertrain for a Re-Engineered Post-Transmission Hybrid Electric Vehicle. Energies 2017, 10, 918. https://doi.org/10.3390/en10070918
AMA Style
Tribioli L. Energy-Based Design of Powertrain for a Re-Engineered Post-Transmission Hybrid Electric Vehicle. Energies. 2017; 10(7):918. https://doi.org/10.3390/en10070918
Chicago/Turabian StyleTribioli, Laura. 2017. "Energy-Based Design of Powertrain for a Re-Engineered Post-Transmission Hybrid Electric Vehicle" Energies 10, no. 7: 918. https://doi.org/10.3390/en10070918
Note that from the first issue of 2016, this journal uses article numbers instead of page numbers. See further details here.