Performance Evaluation of a Modular Design of Wind Tower with Wetted Surfaces


Abstract
:1. Introduction
- −
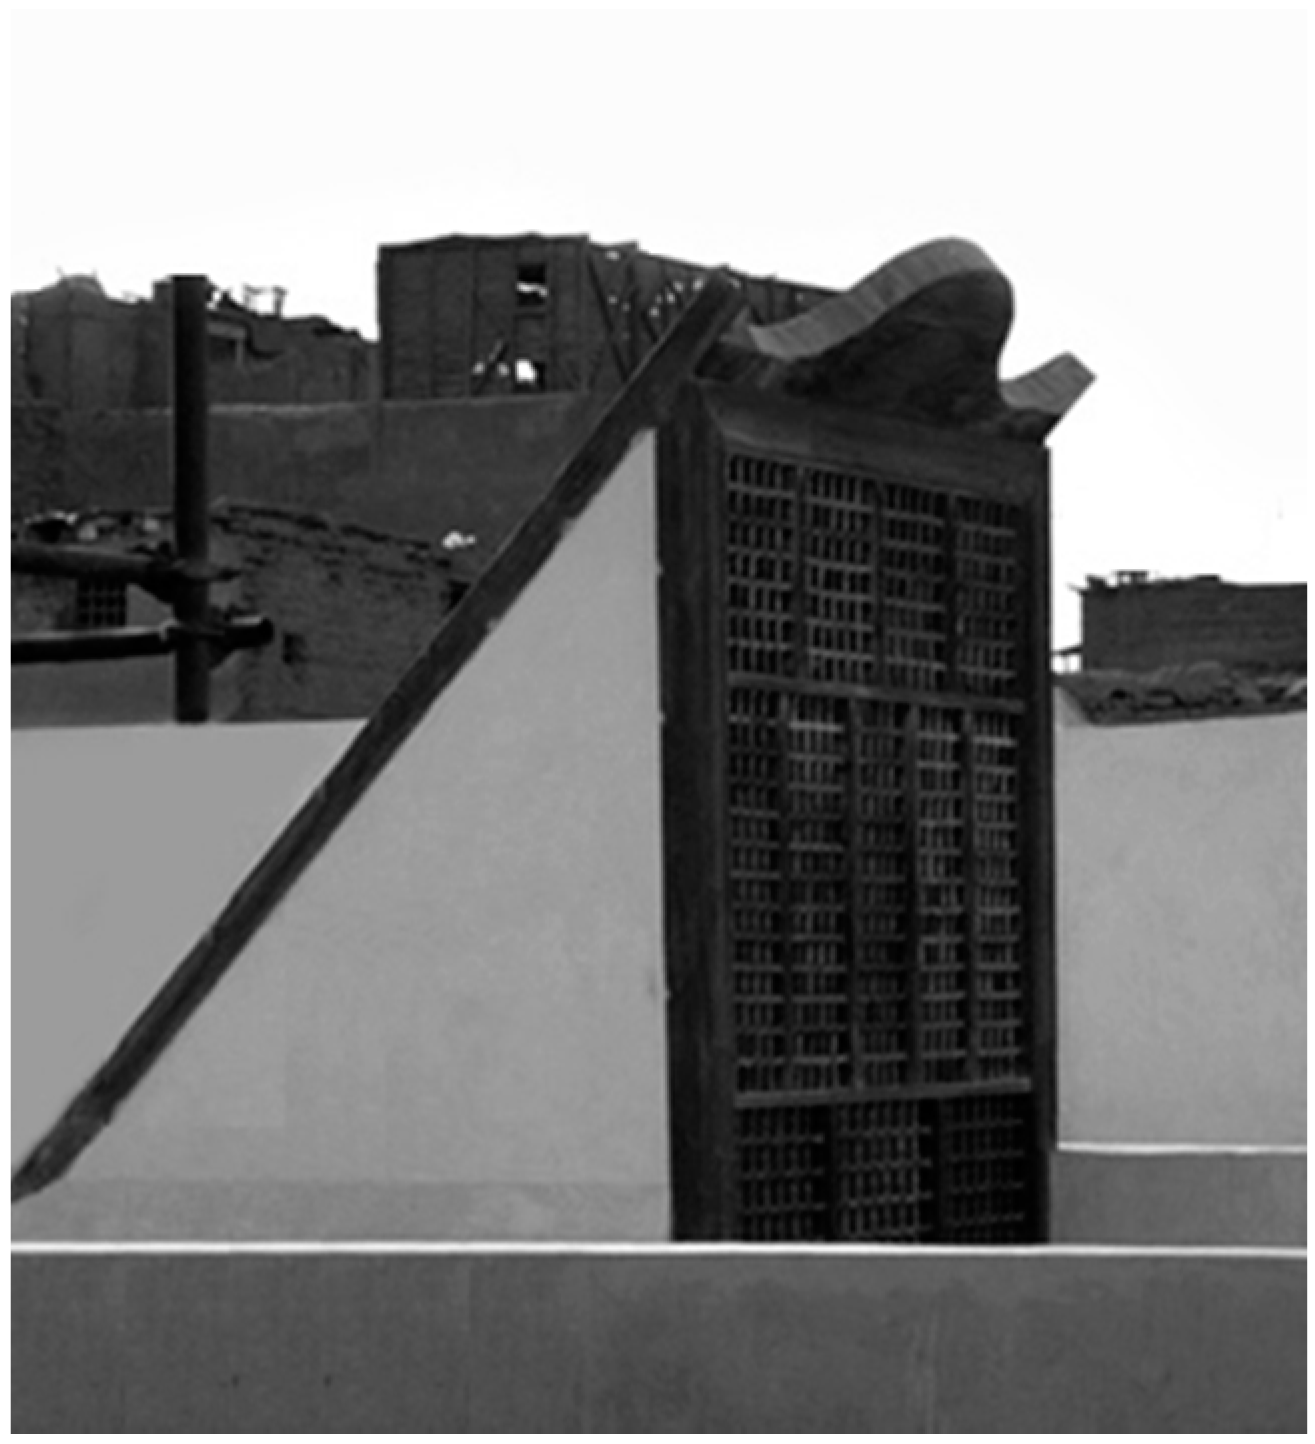
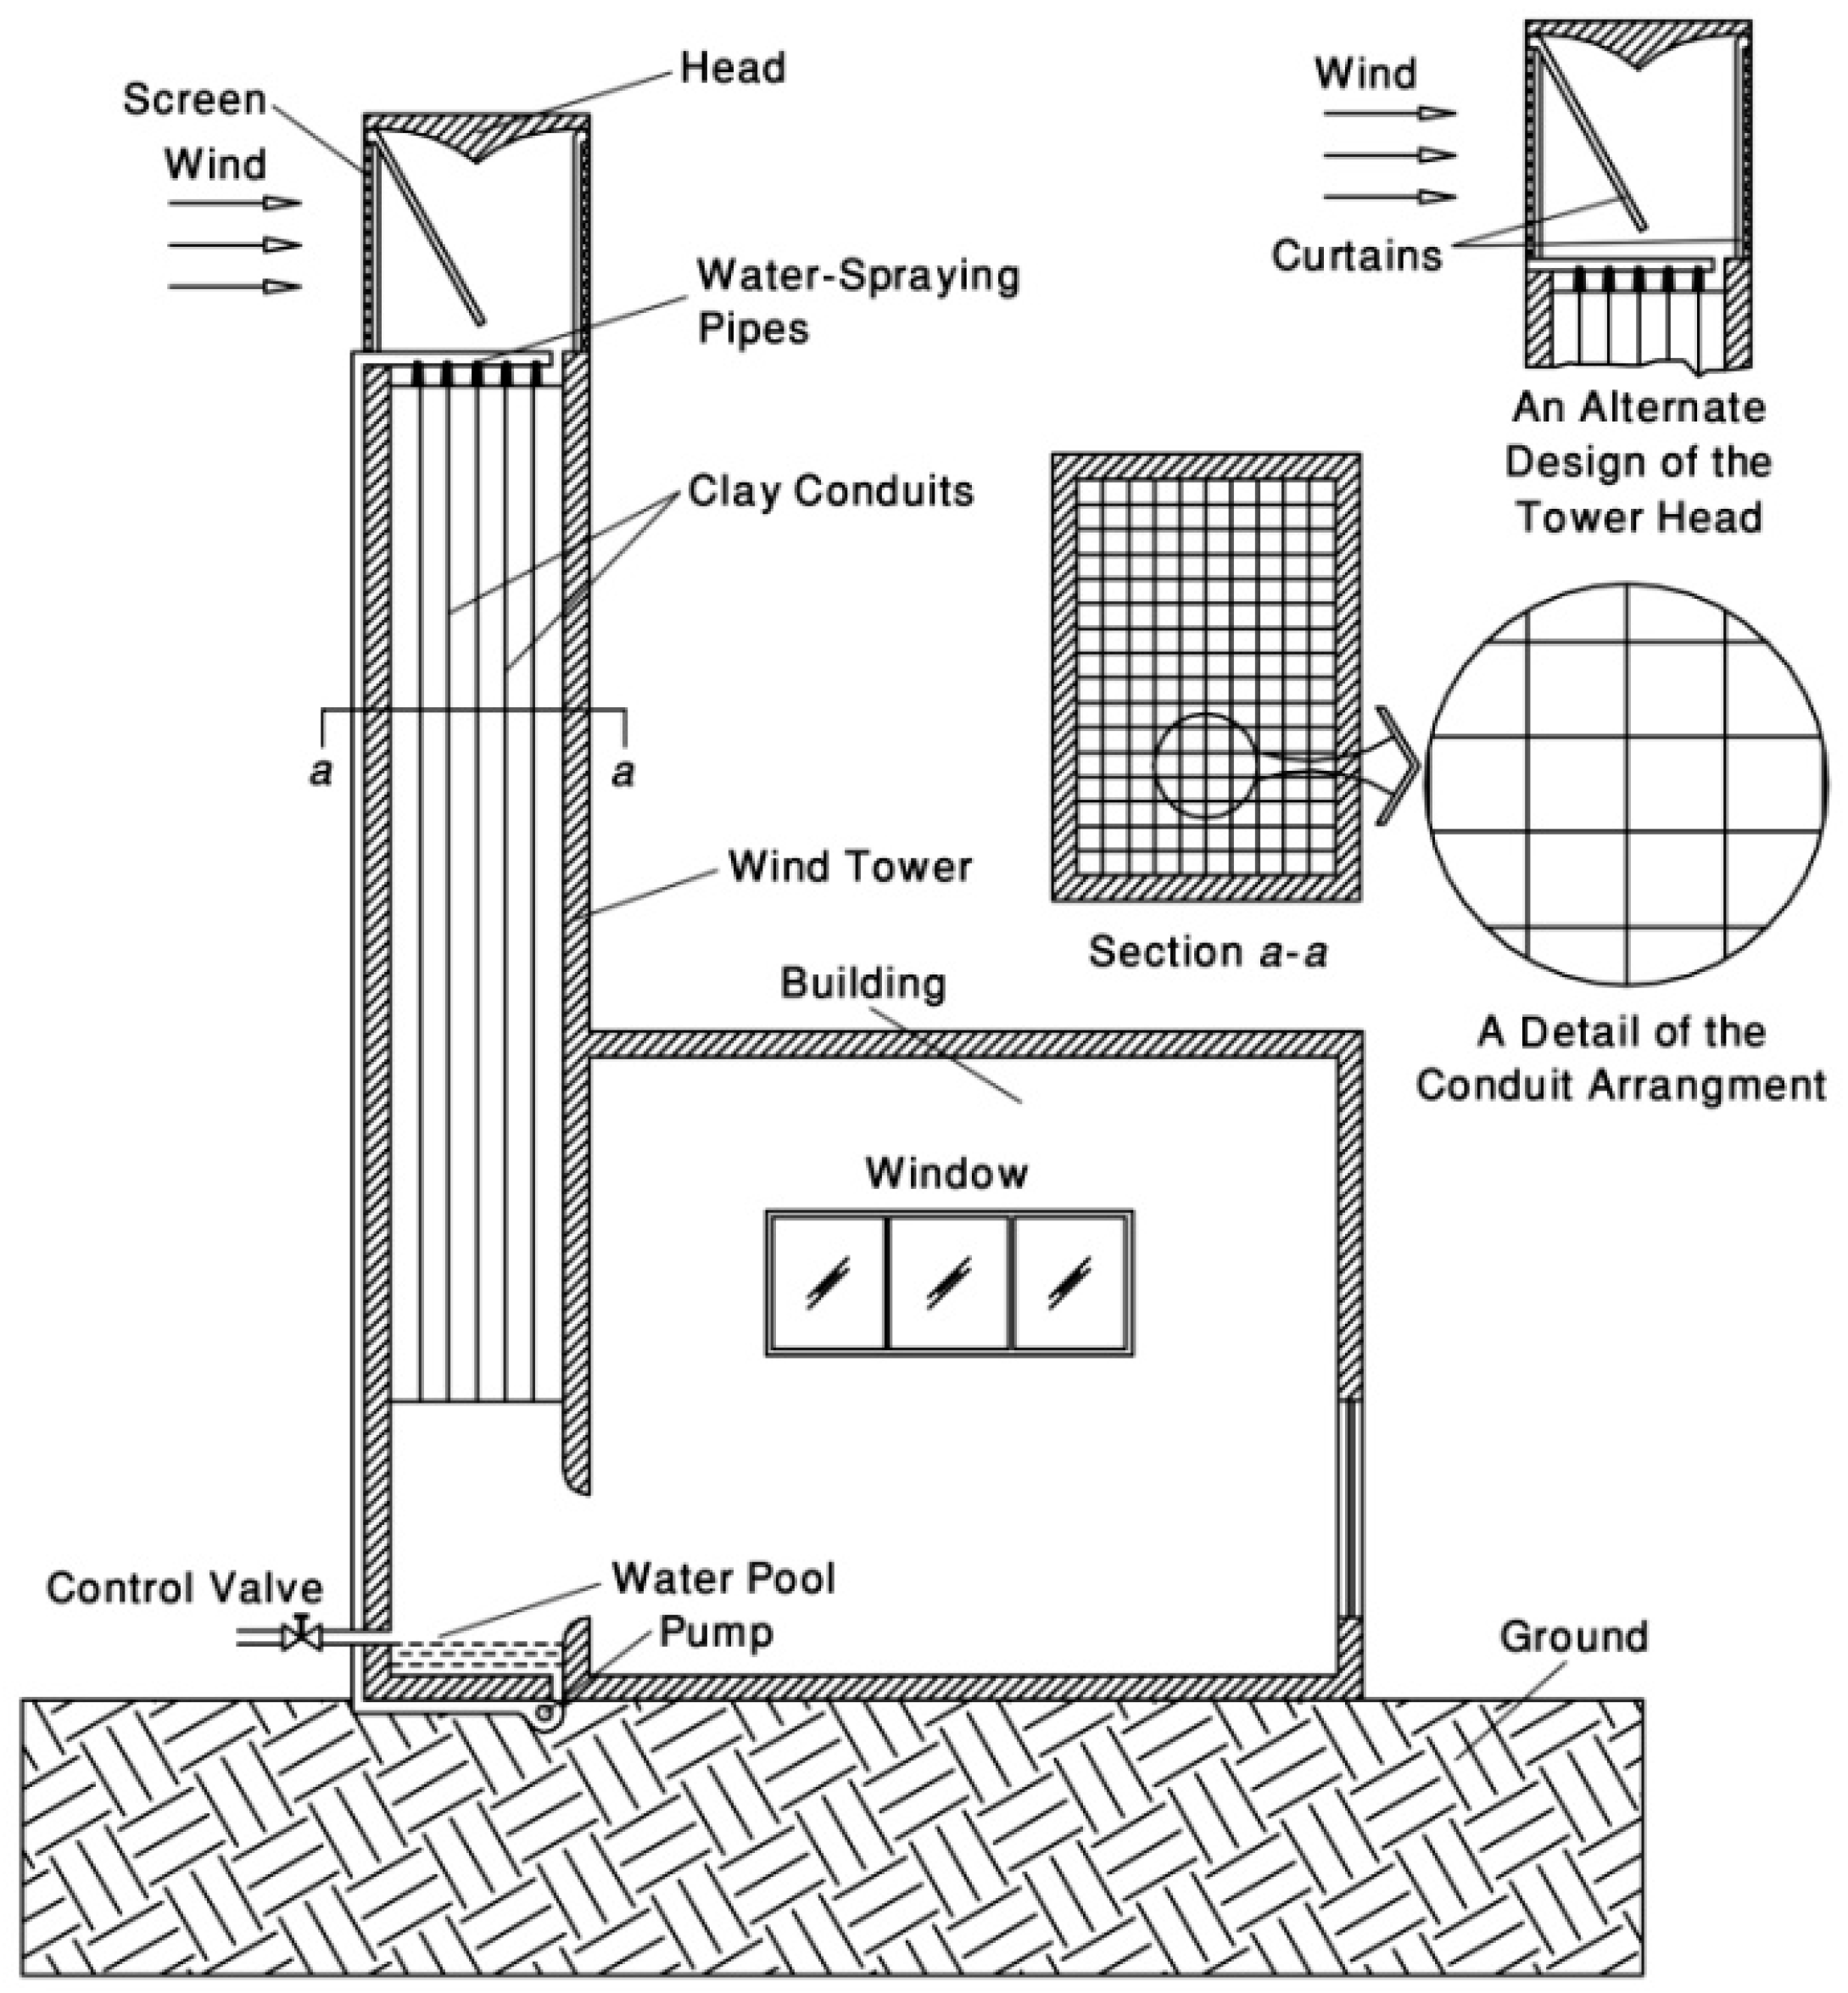
- Wind tower with wetted columns: This type of wind tower has thick curtains or clay conduits, which are installed in the wind tower column [3,19,28,29]. Water is sprayed on the curtains or clay conduits and wets them. Then, the water, which is collected in a pool at the bottom of the wind tower, is recirculated by pumping it up. Therefore, warm and dry air that passes from the wind tower column is evaporatively cooled, and finally, the air that is both high in moisture and low in temperature enters the room from the wind tower outlet [3,19,28,29]. Figure 4 shows a wind tower with wetted columns. The flow density increases along the channel; the air density inside is higher than that of the outside. Accordingly, the downward airflow is enhanced due to buoyancy [3,19,28].
- −
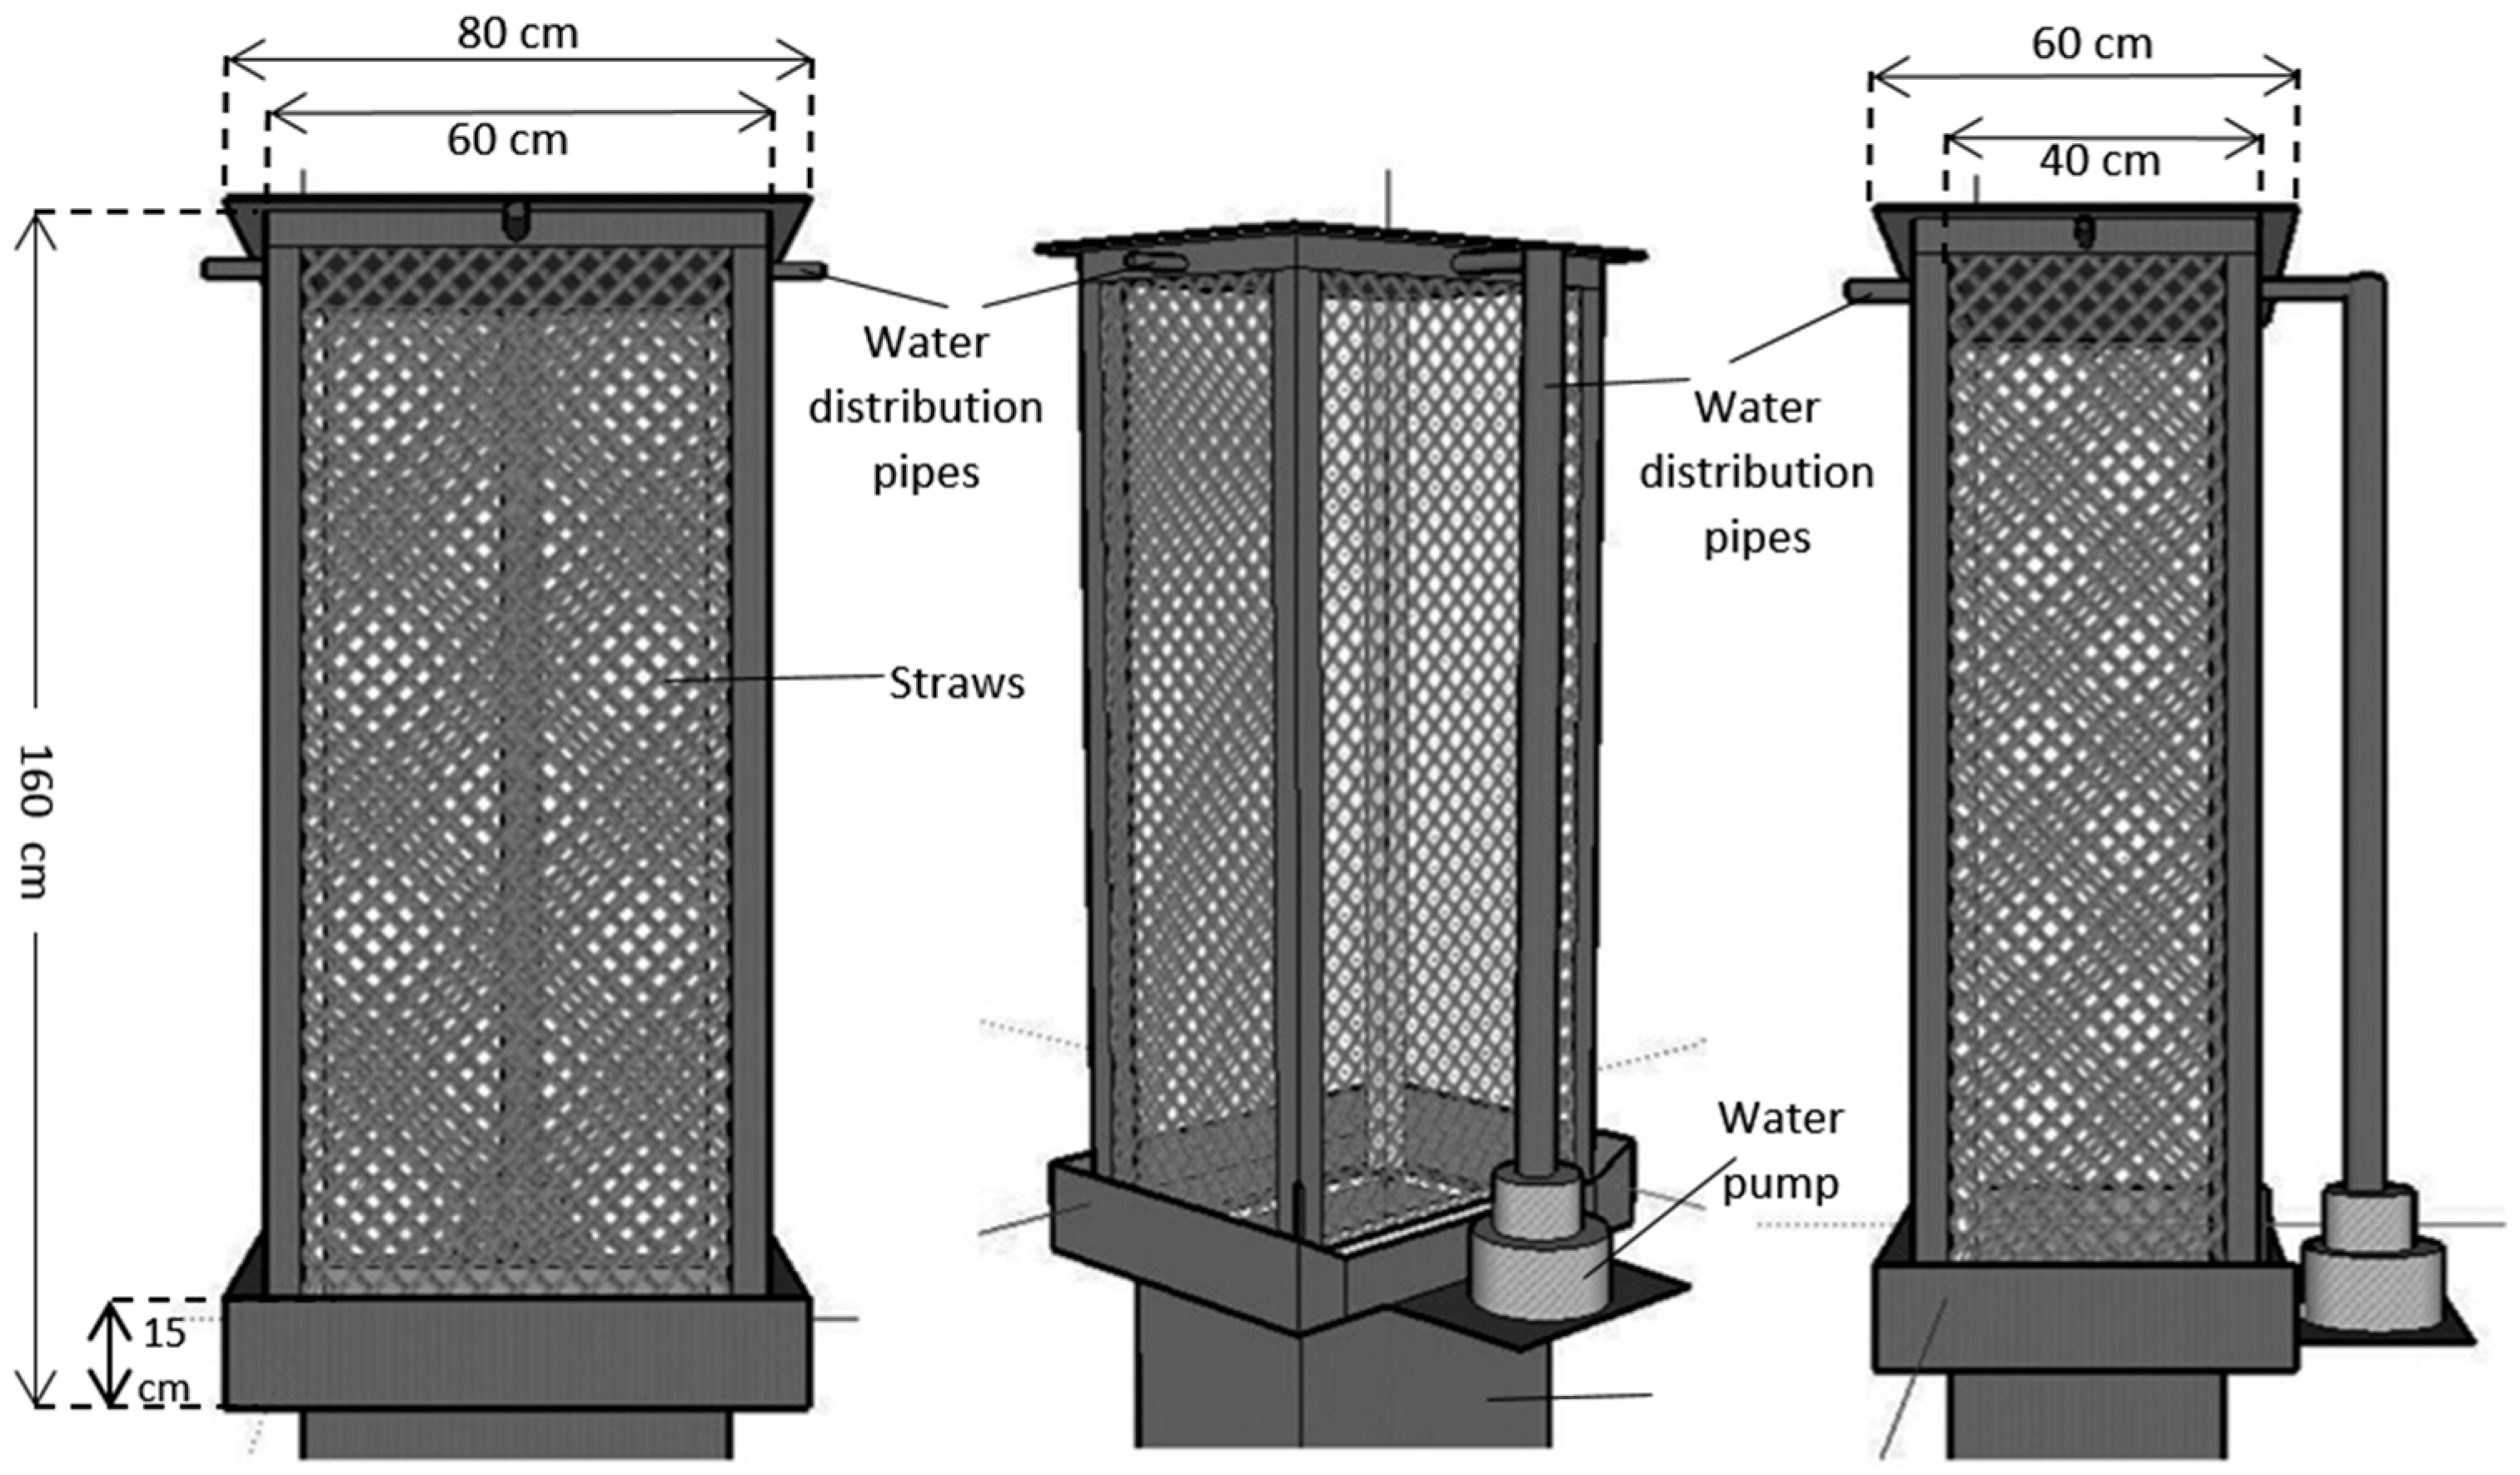
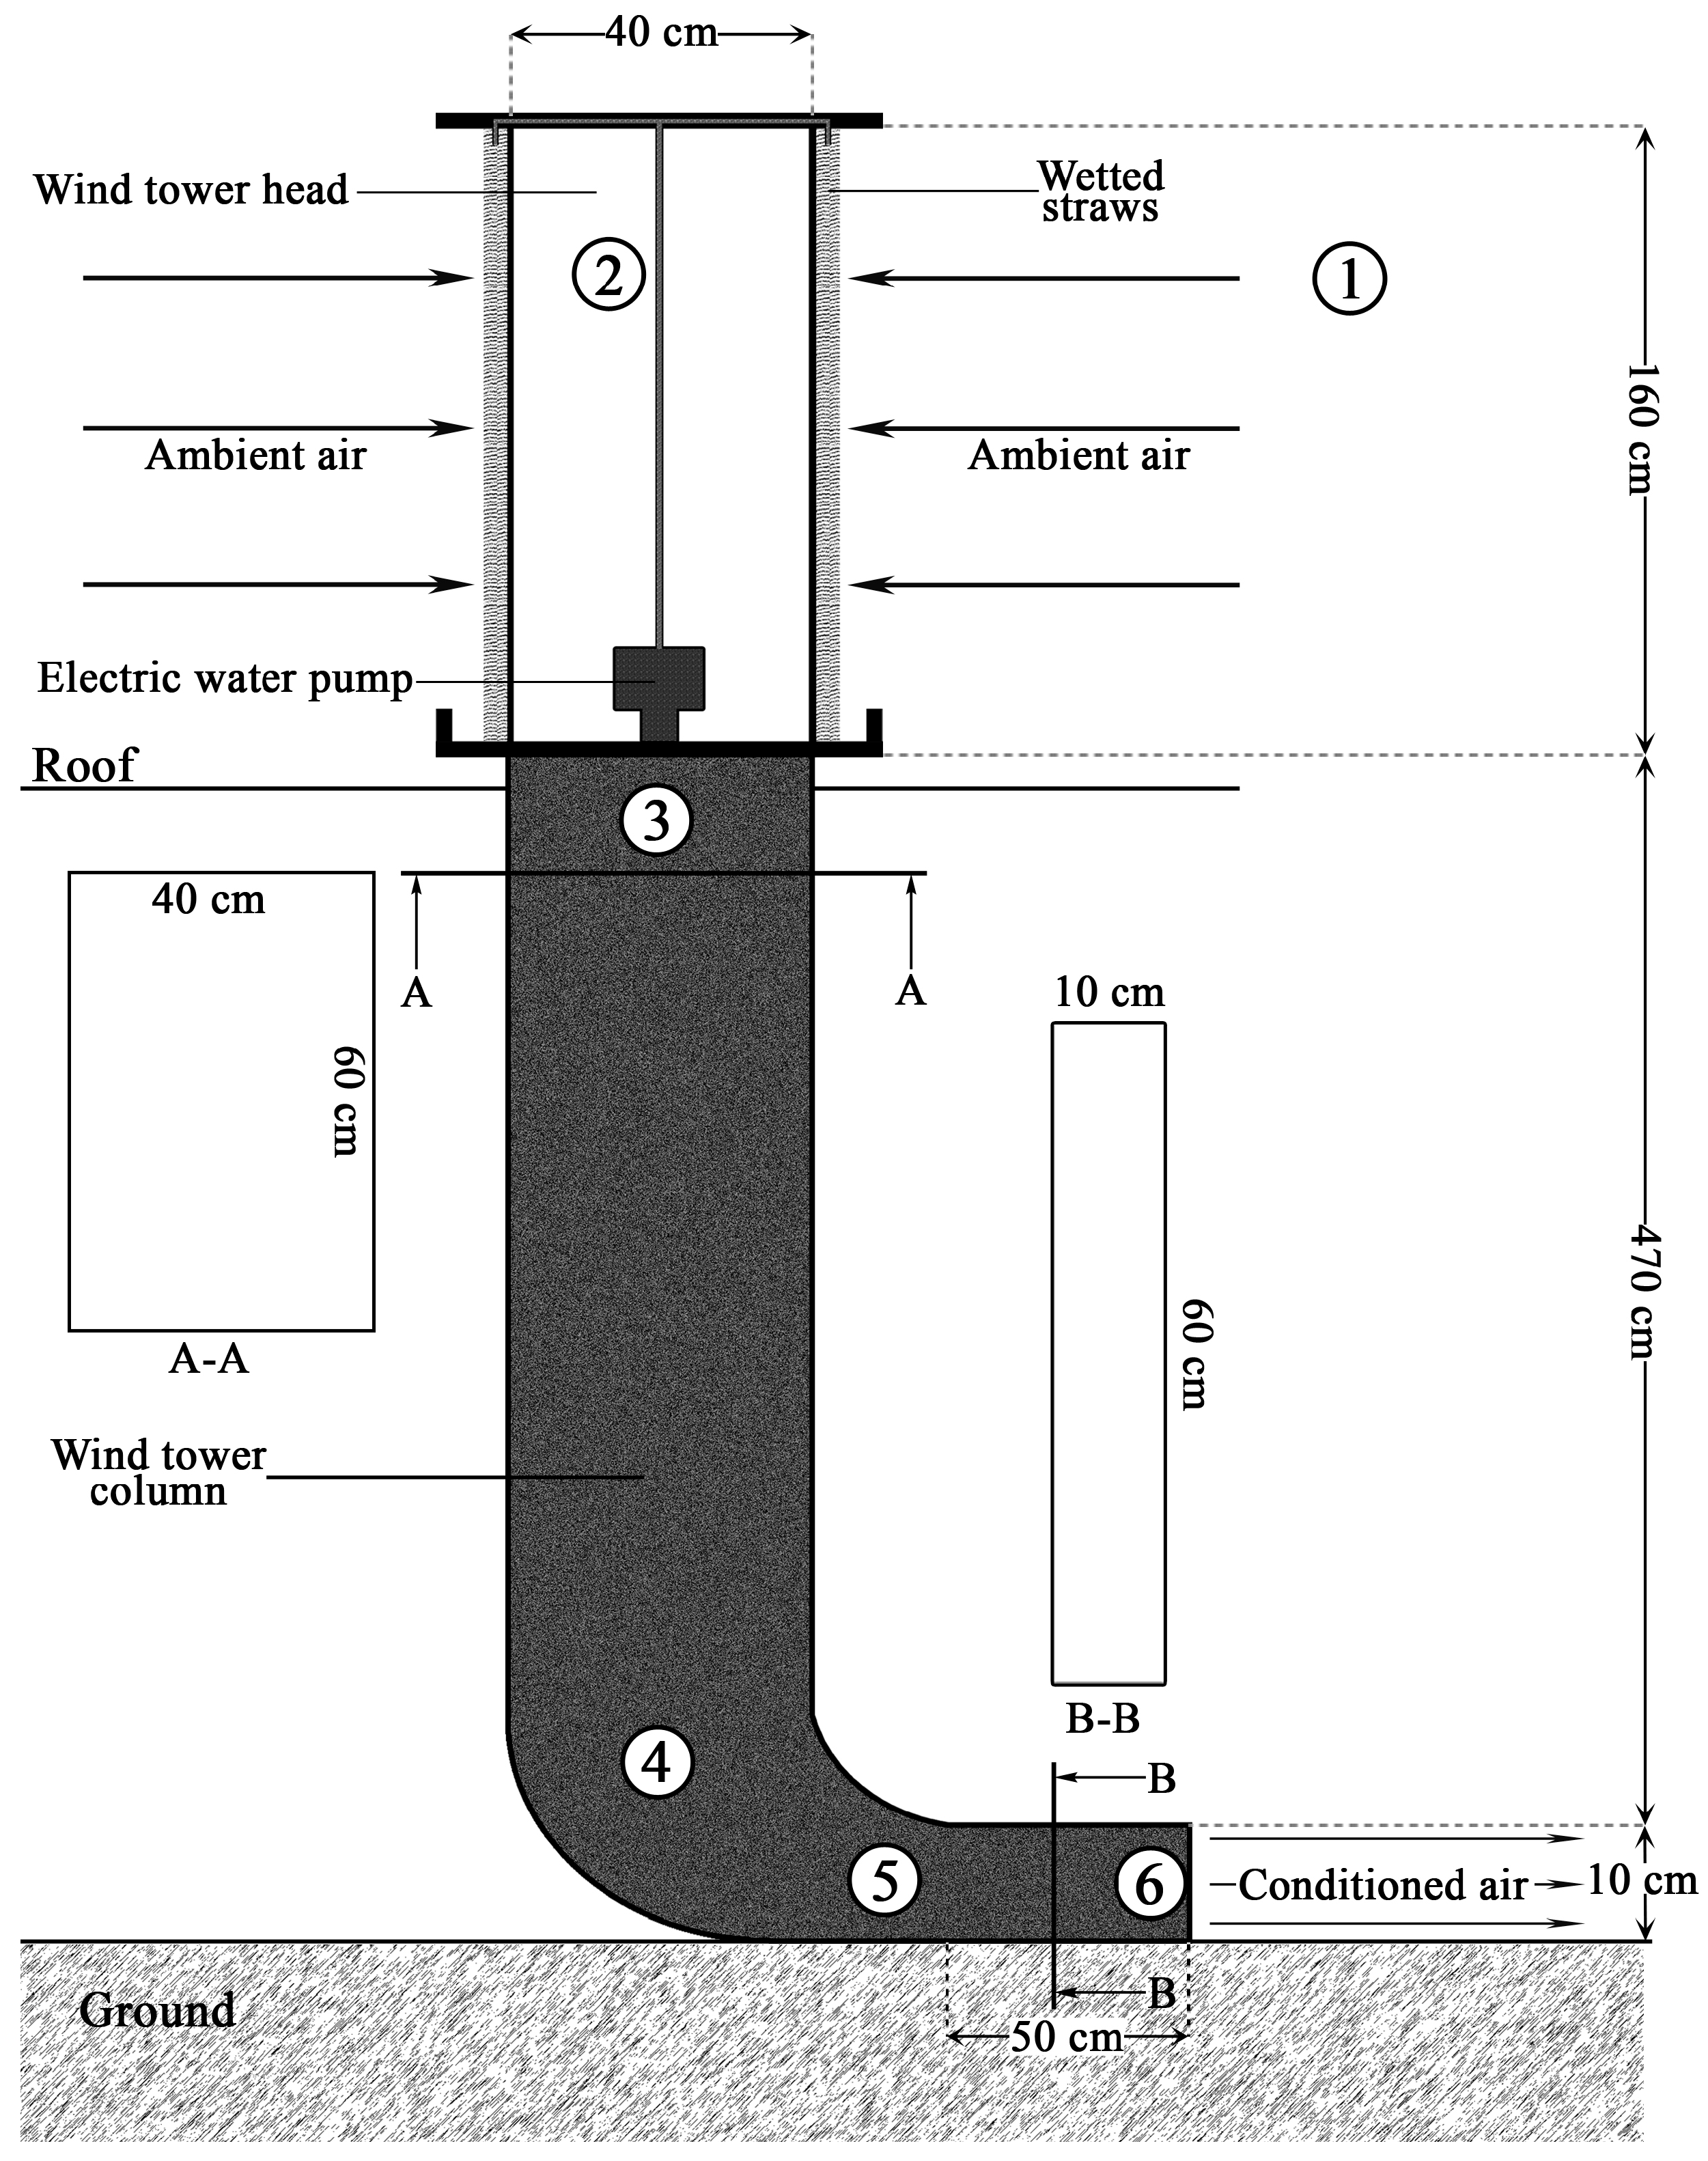
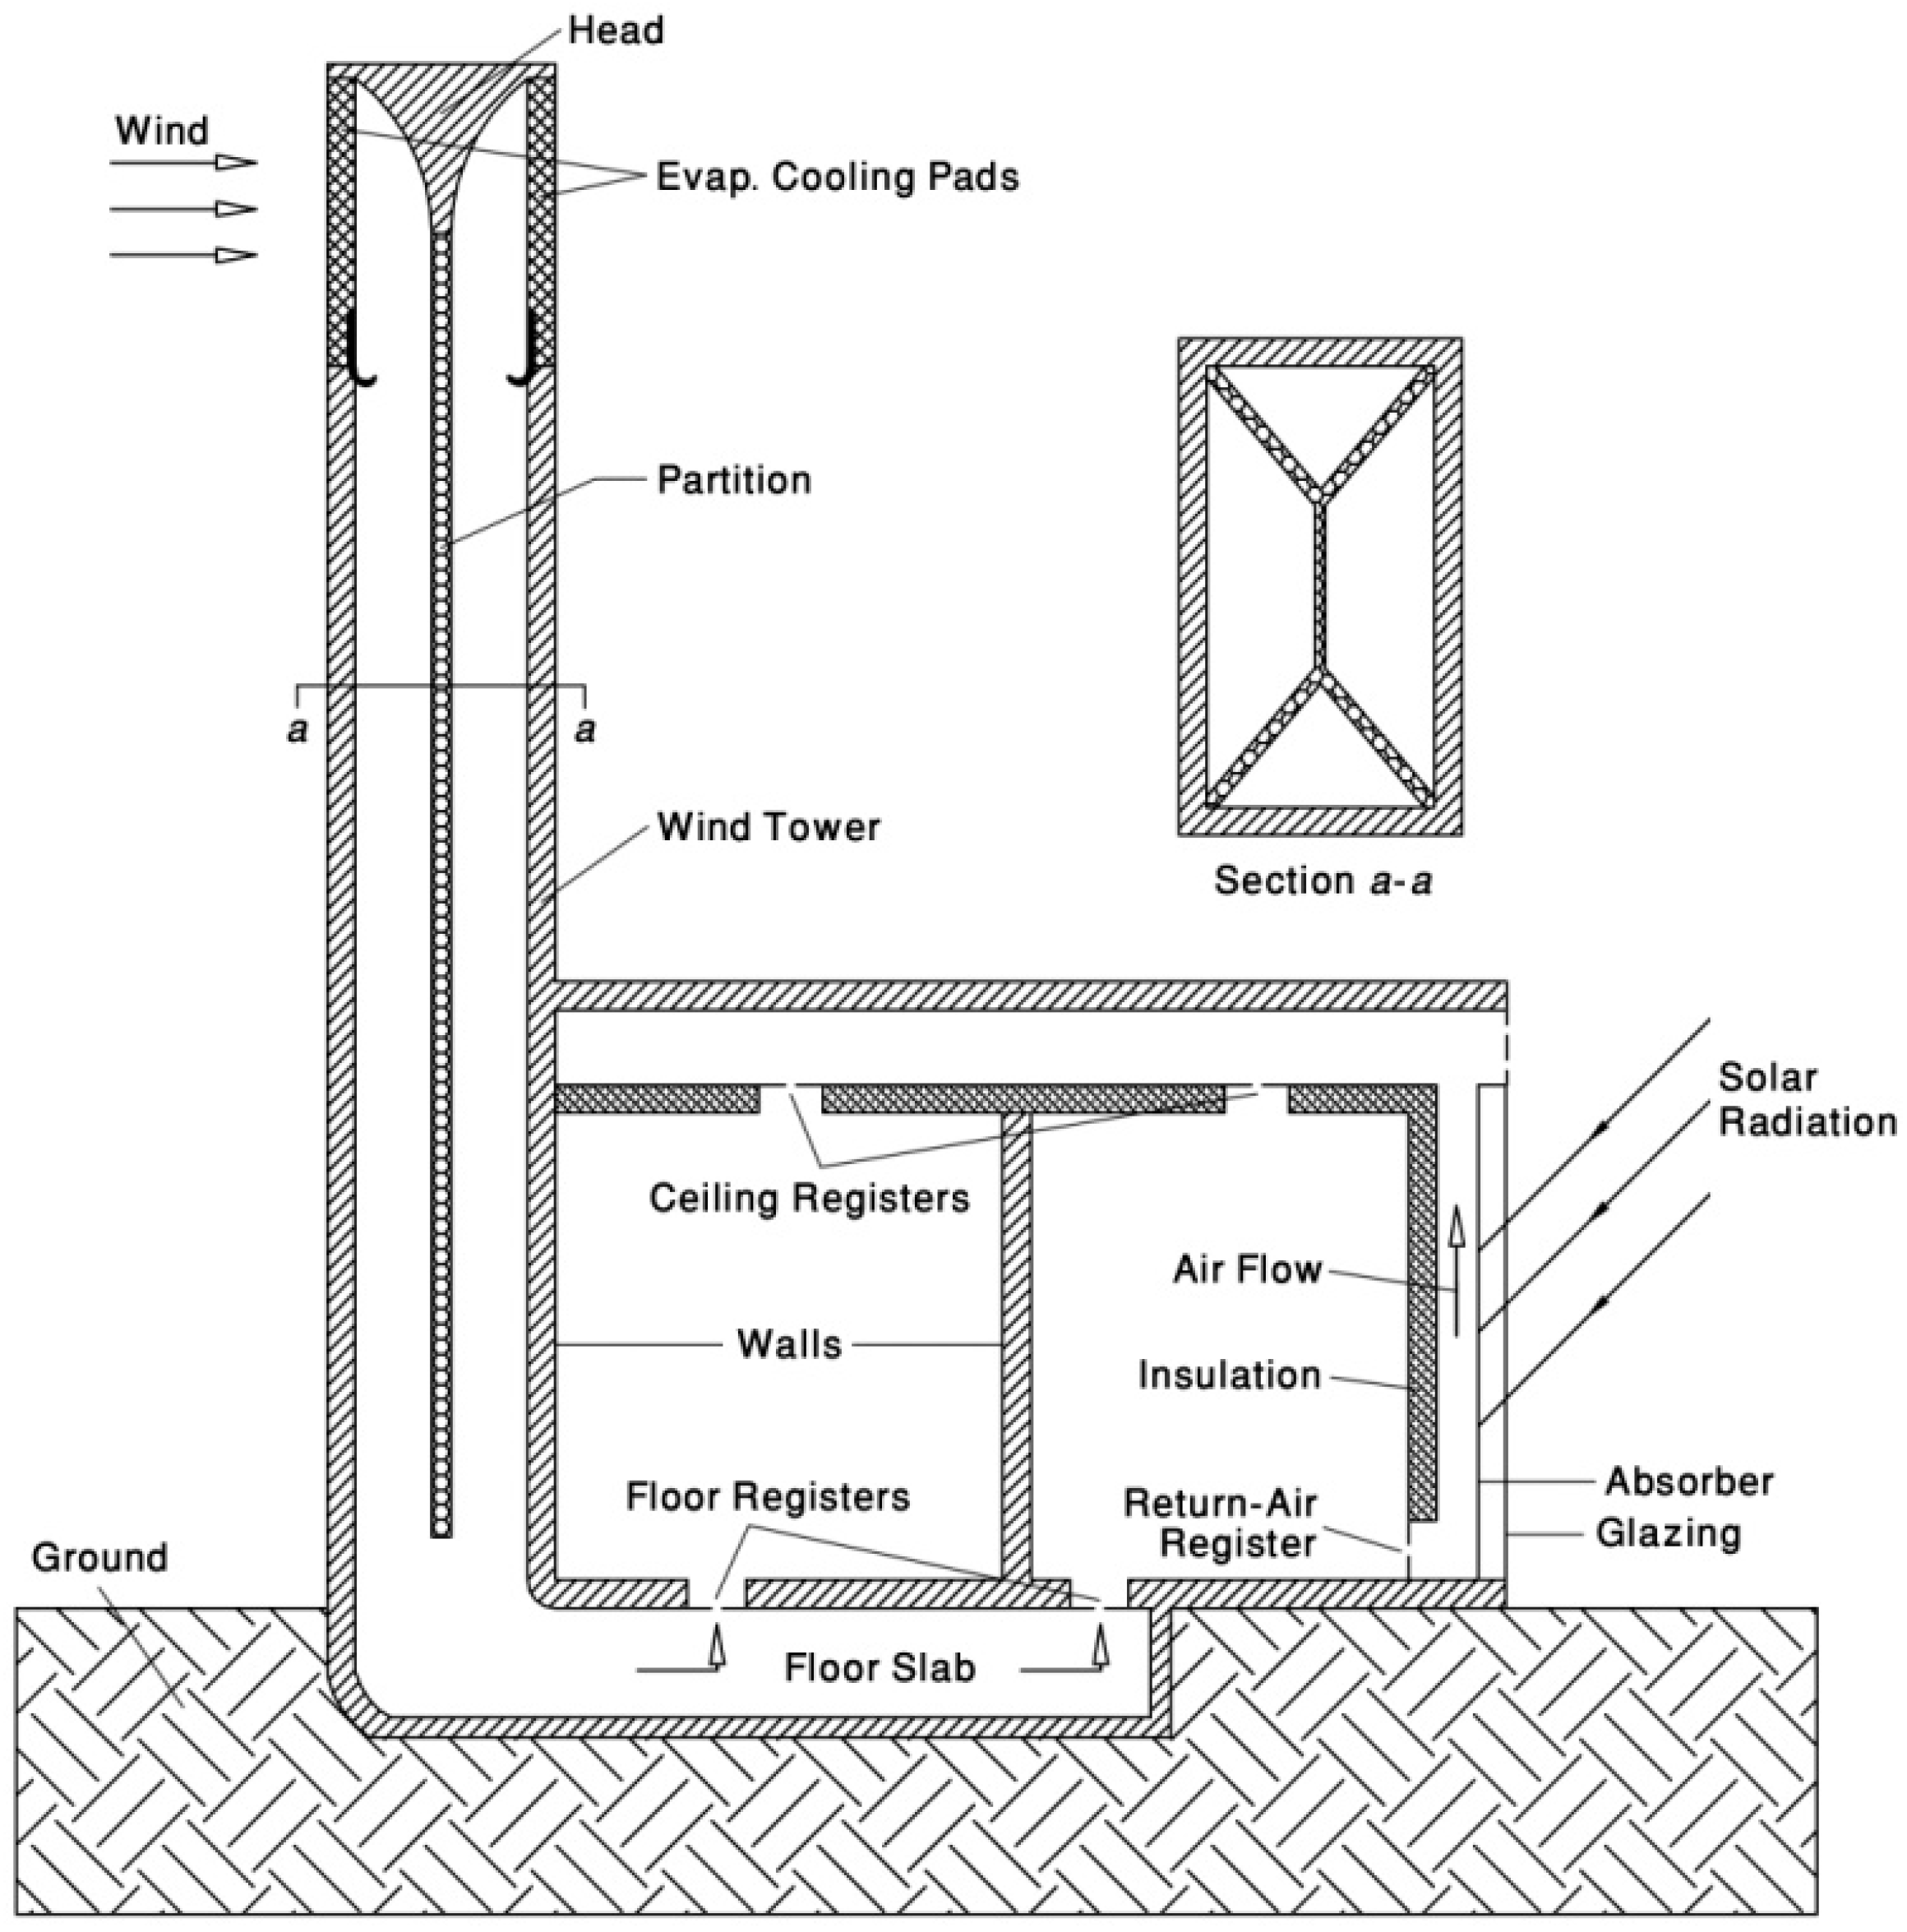
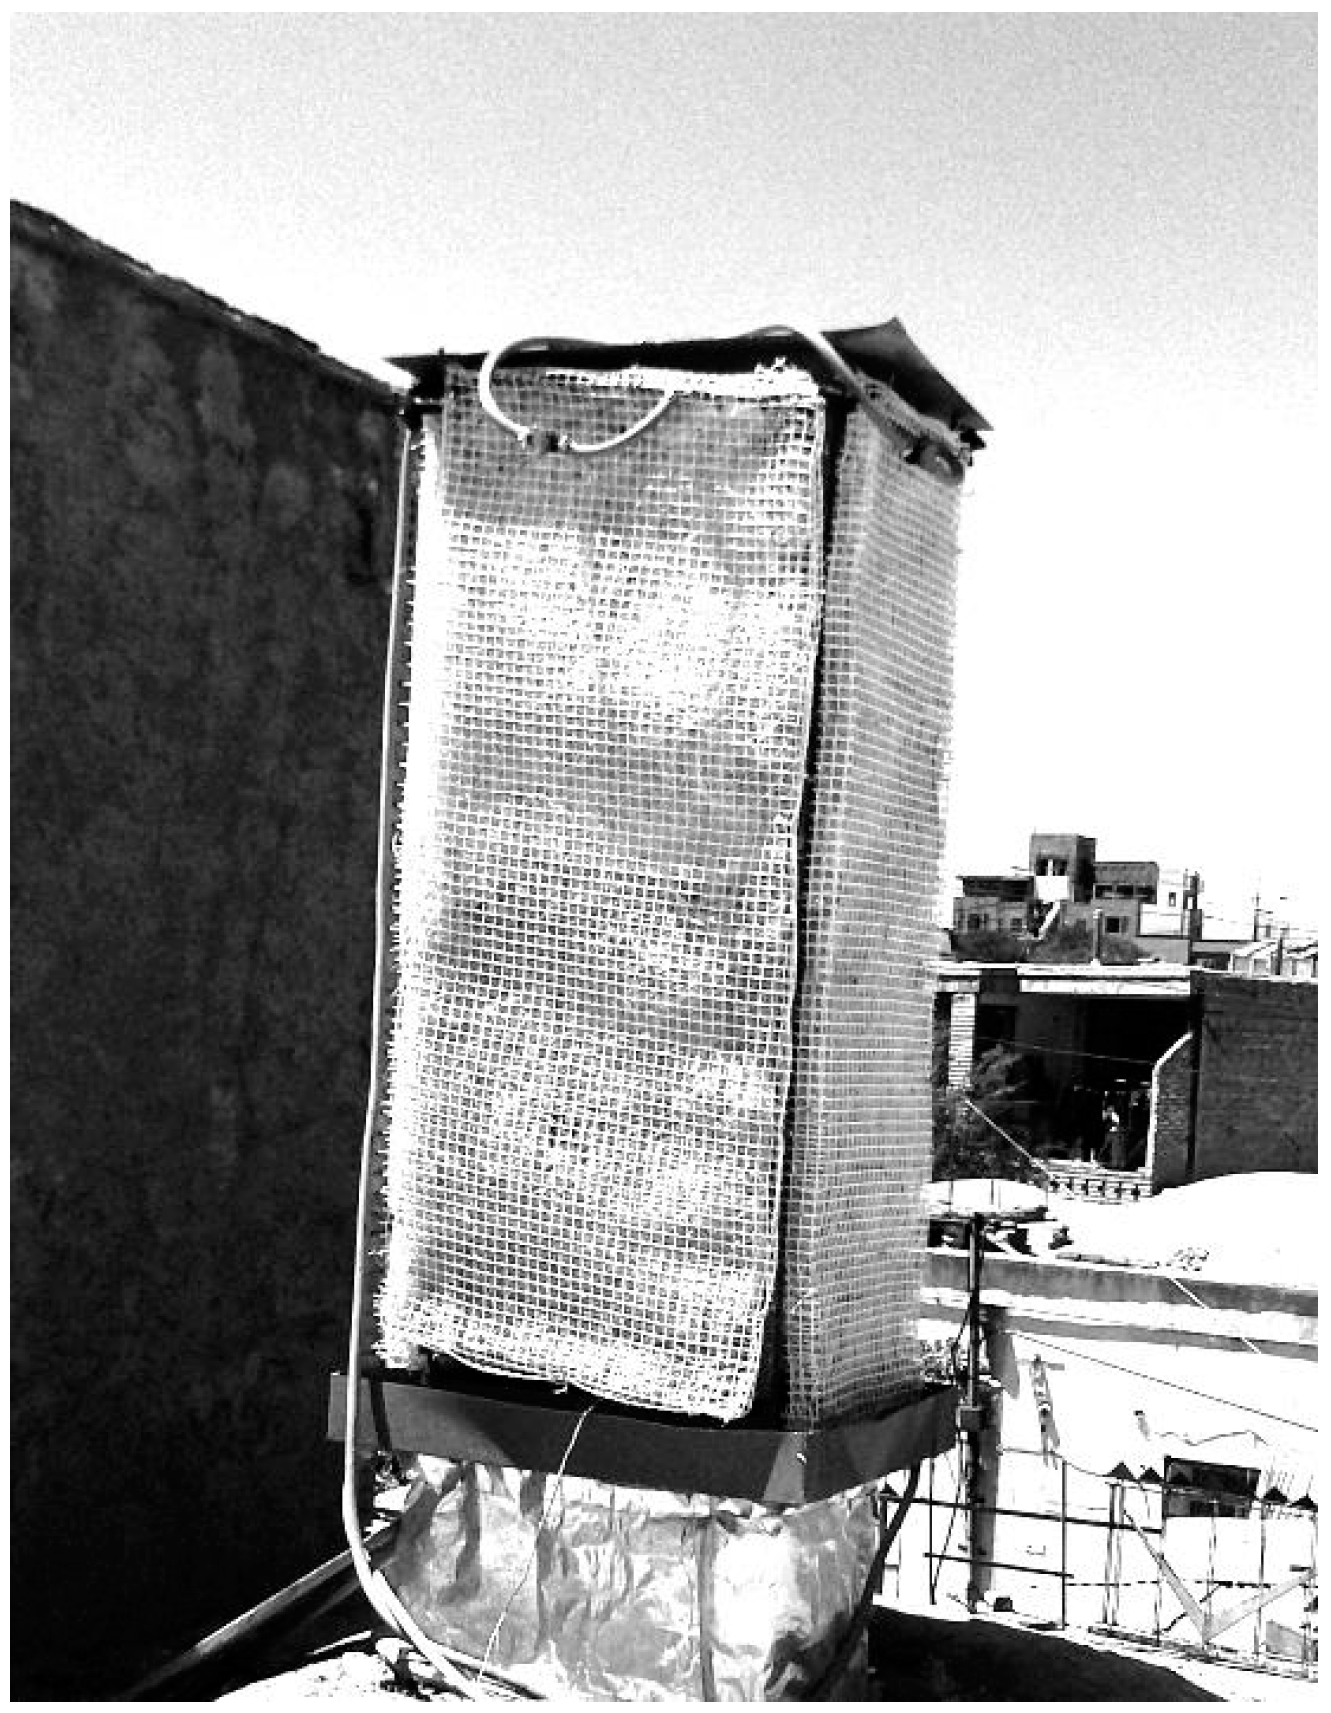
- Wind tower with wetted surfaces: In this type of wind tower, pads or straw are placed at the top of the wind tower column (wind tower head). They are wetted by means of an electric water pump (Figure 5) [3,36]. The water in wetted pads or straw is evaporated by the air at the wind tower head (the highest part of the wind tower column where air inlets are located) and decreases the air temperature (similar to the evaporative cooling process in evaporative coolers) [3,28,36]. Since the contact surface between the air and wetted straw is extremely large, the moisture in the air will increase. The difference of density between ambient air and the air inside the head of the wind tower, as well as the height of the wind tower column, produce a pressure dissimilarity, causing a downward airflow inside the column. The difference of density at the topmost point of the column (wind tower head) and the ambient air increases the buoyancy effect [3,28,36]. Therefore, it is expected that in places where the wind speed is low, or the ambient air is still, this type of wind tower will be more effective.
2. The Proposed Wind Tower Design
- Building materials have changed nowadays, and above all, finding a professional who can build a conventional wind tower is very difficult.
- To revive wind towers as an ancient system of natural cooling, it was necessary to present a product that could be built easily in a factory. On the other hand, the transportation and installation should be as easy as the evaporative coolers used extensively in Iran.
- To install wind towers in existing buildings, there needs to be minor changes in the structure of the buildings. Additional costs and major changes should be avoided or minimized.
- People who live in hot, arid zones pay high costs for air conditioning and cooling. Consequently, this type of wind tower could be an acceptable alternative for natural ventilation and cooling of buildings in these zones.
3. The Experimental Arrangement
3.1. Measuring Instruments
3.2. Experimental Measurements
- (1)
- (2)
- Dry bulb temperature at the head of the wind tower (Point 2 in Figure 8);
- (3)
- Dry bulb temperature and RH in the room where the wind tower outlet was installed;
- (4)
- Dry bulb temperature and RH in another sample room beside the wind tower room.
- Test No. 1: Data recording at 10:00 a.m. for ten continuous days, from 21 to 30 August 2013,
- Test No. 2: Data recording at 12:00 p.m. for ten continuous days, from 21 to 30 August 2013,
- Test No. 3: Data recording at 4:00 p.m. for ten continuous days, from 21 to 30 August 2013,
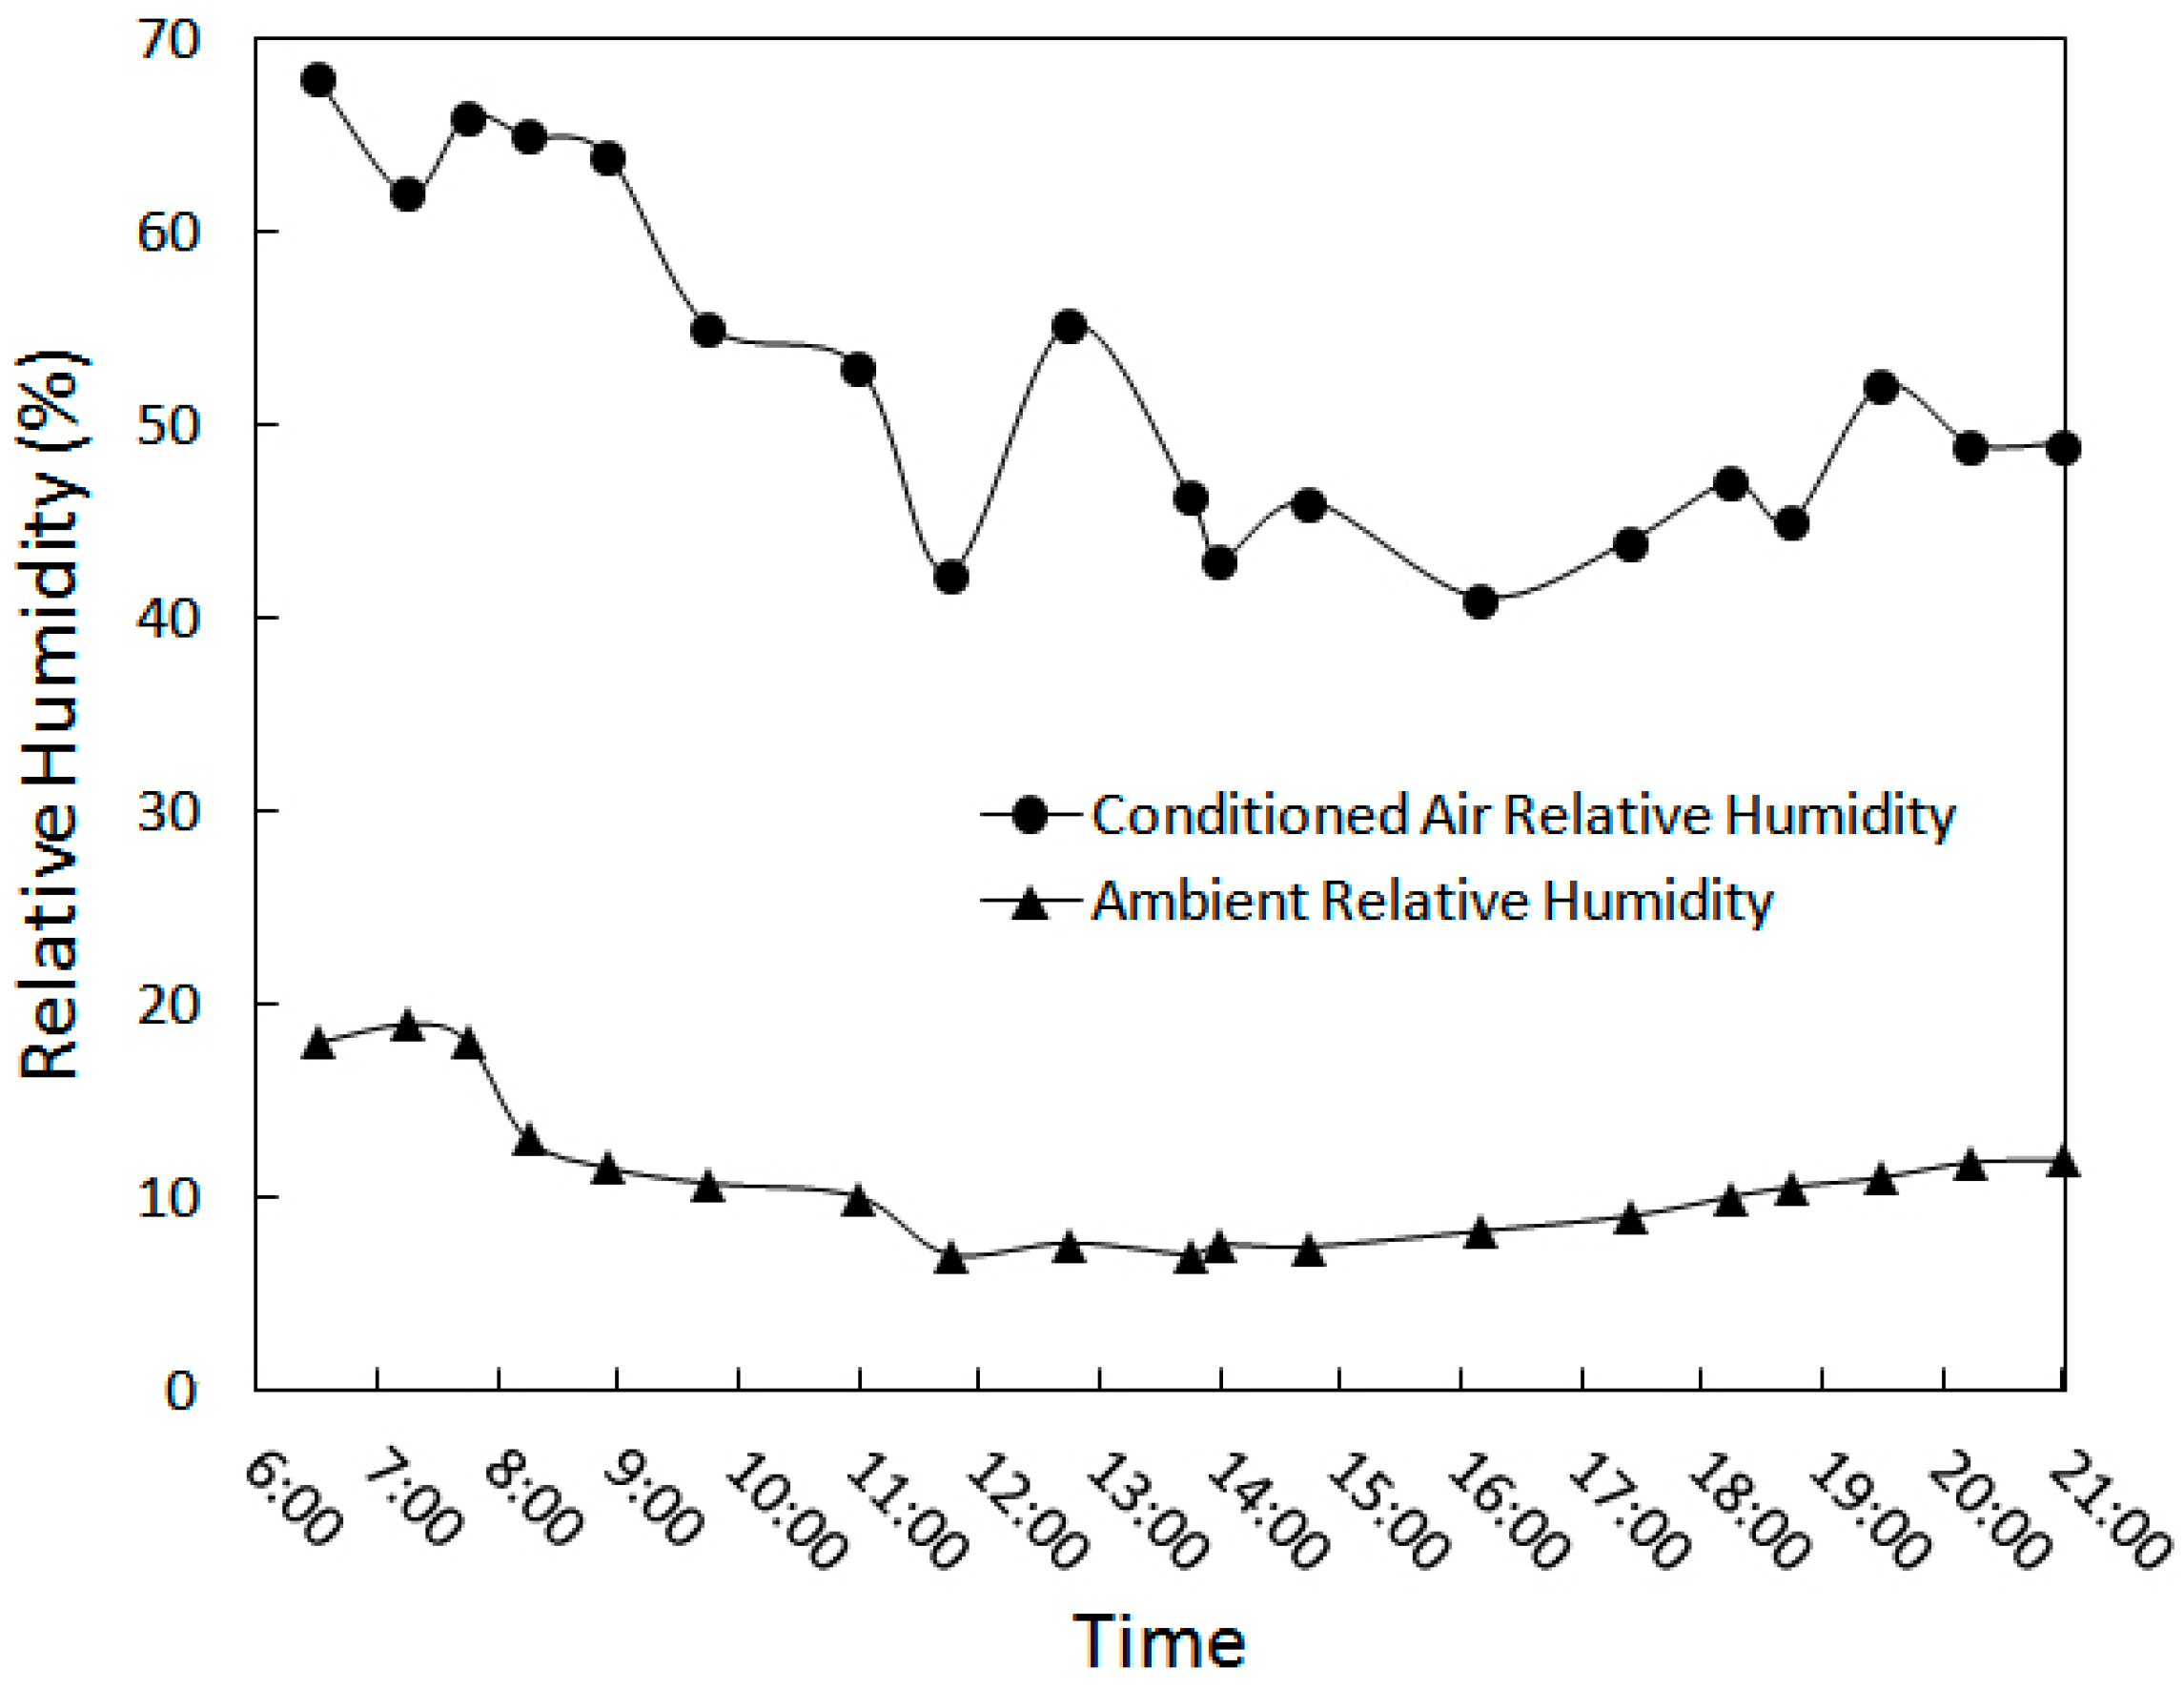
- Test No. 4: A one-day data recording on 24 August 2013, from 6:30 a.m. to 9:00 p.m., and
- Test No. 5: A 24-h data recording from 5:15 p.m. on 22 August 2013.
4. Analytical and Experimental Results
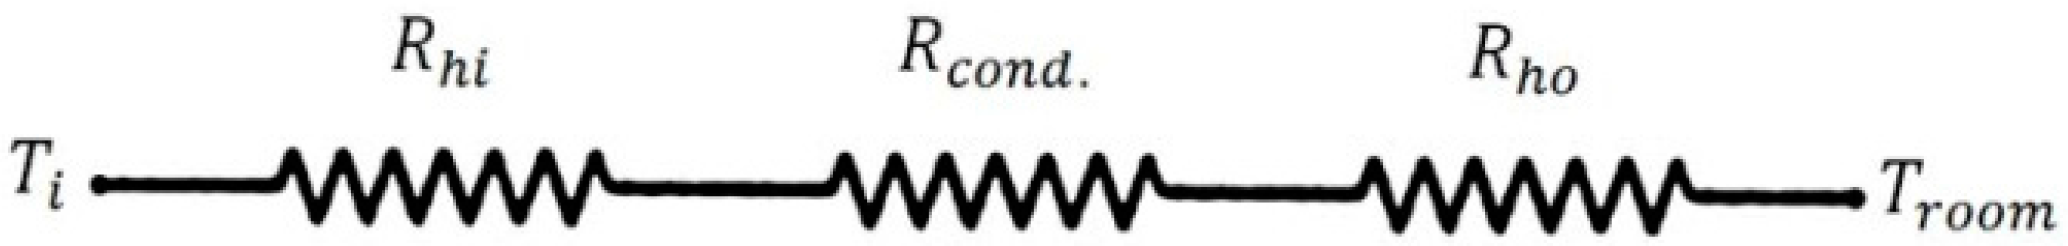
4.1. Analytical Results
4.2. Experimental Results
4.2.1. Test Nos. 1, 2 and 3
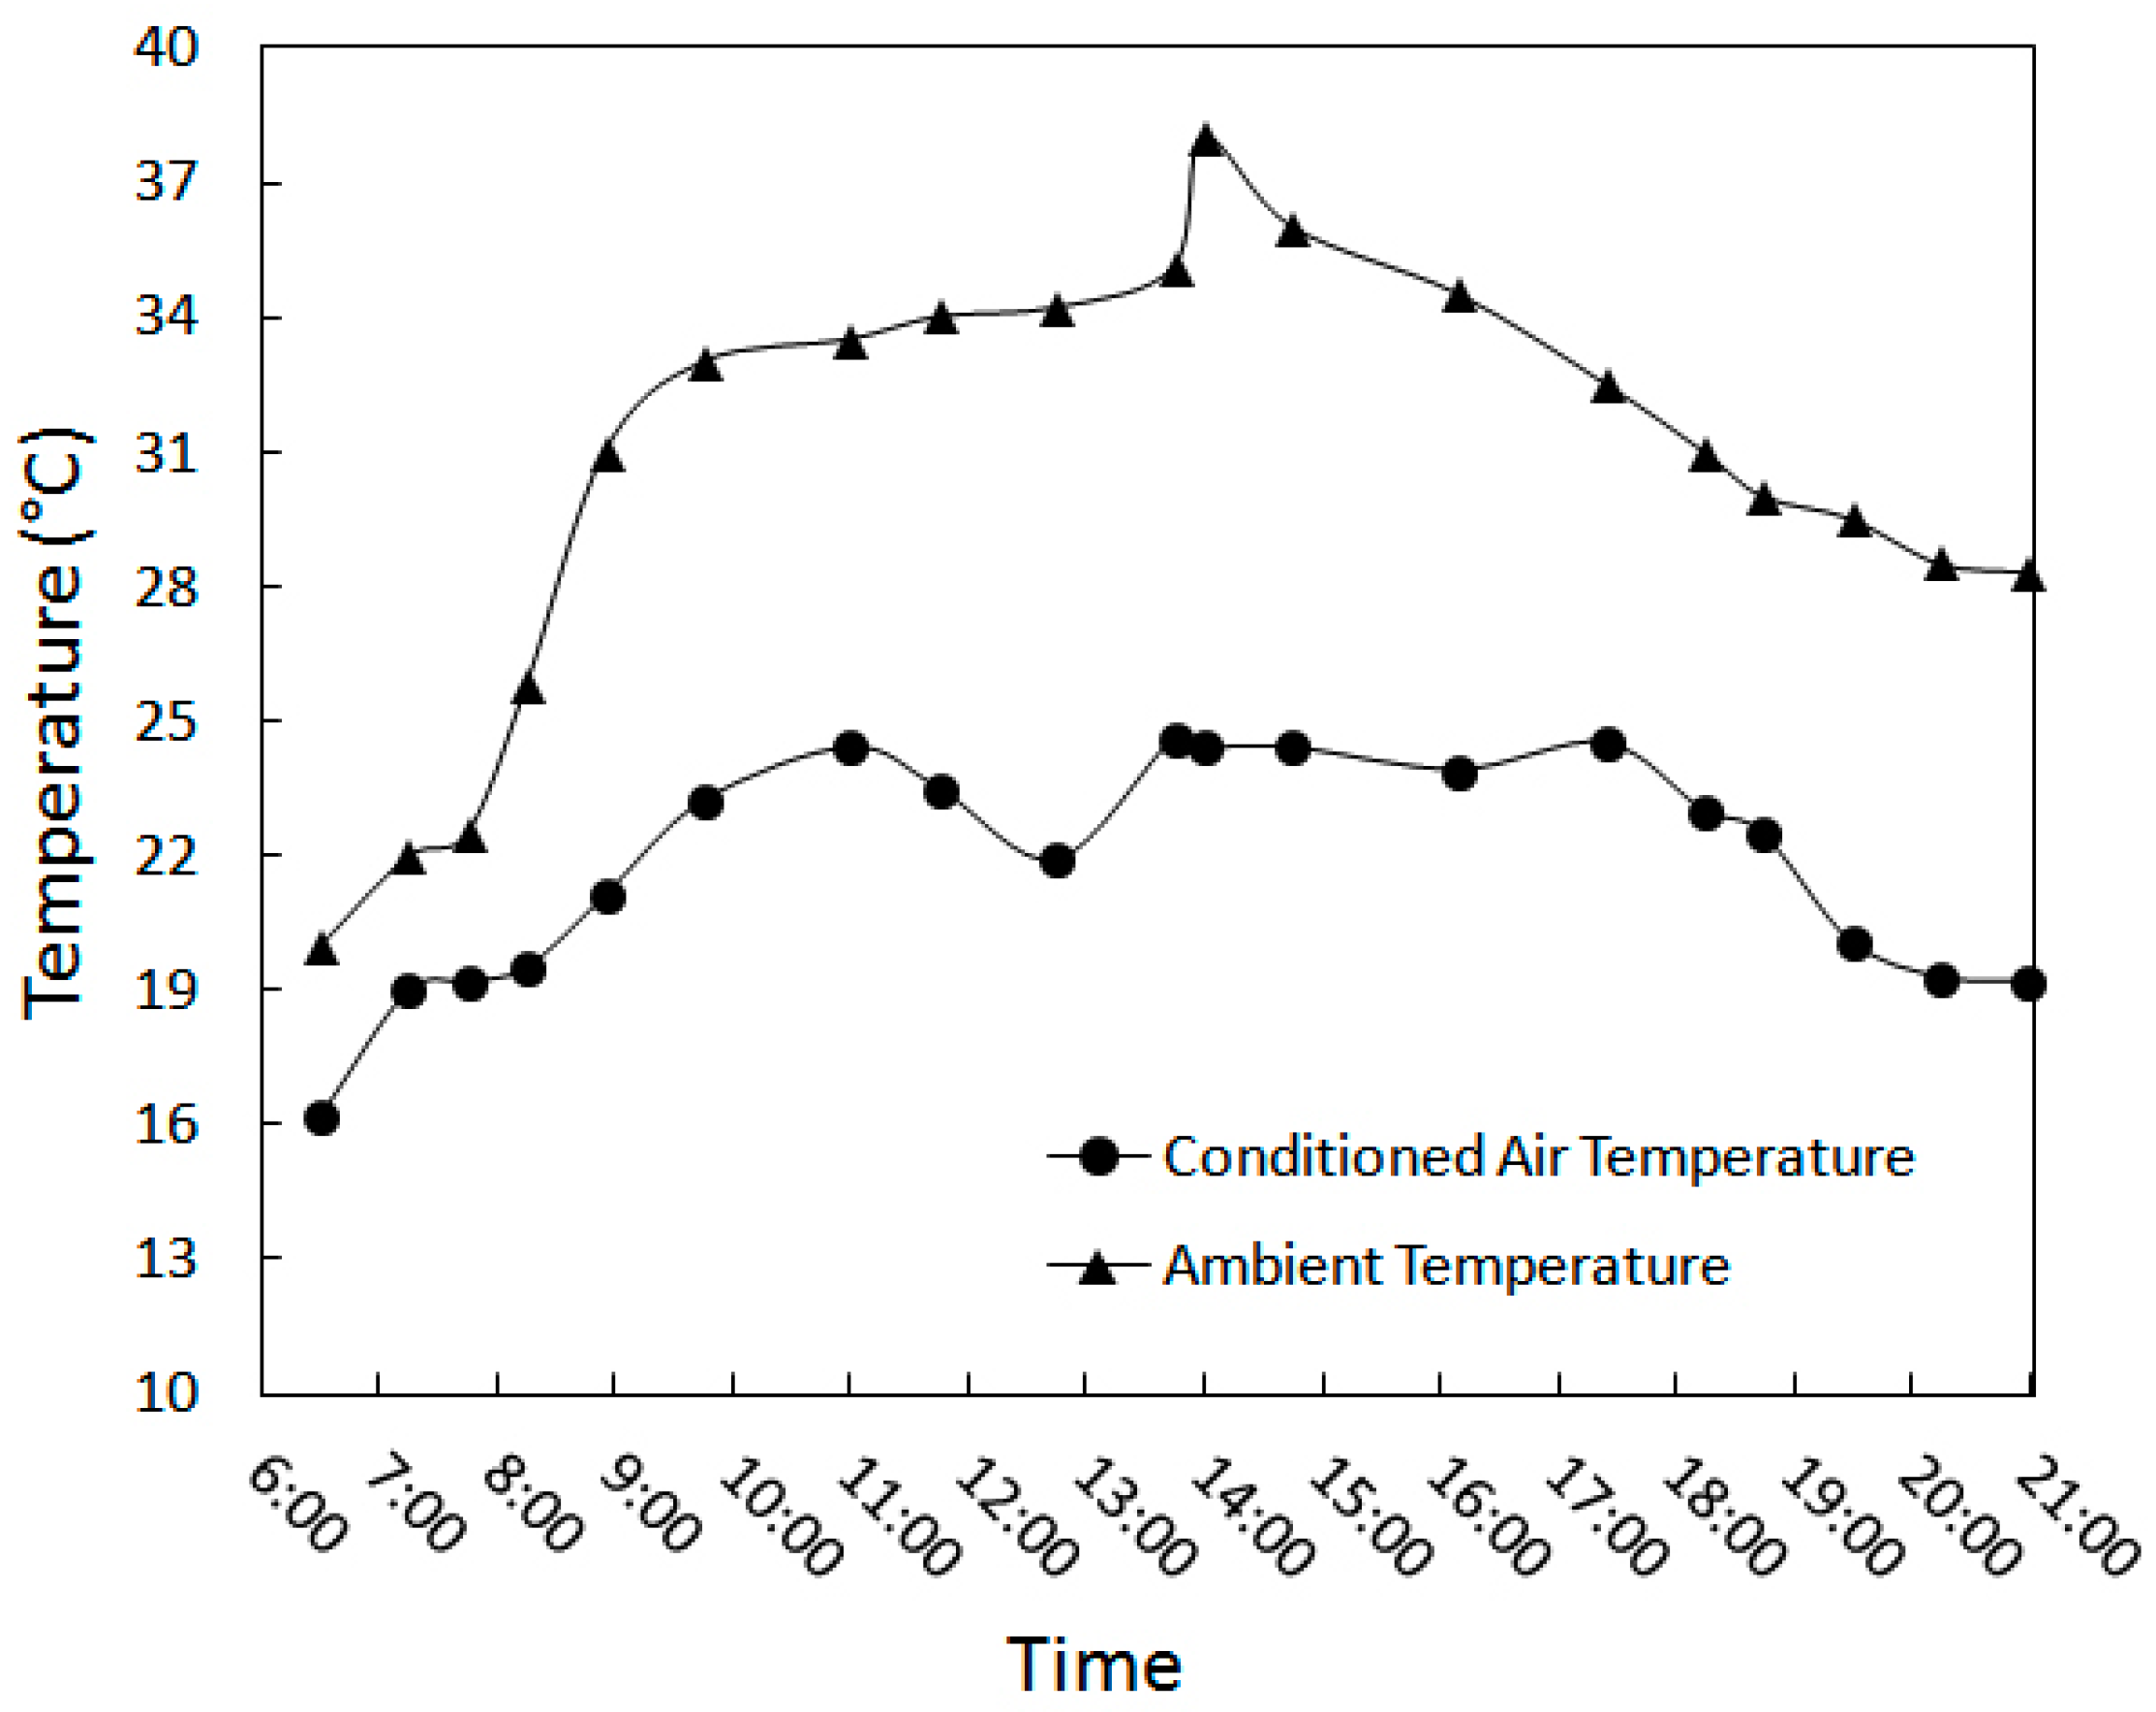
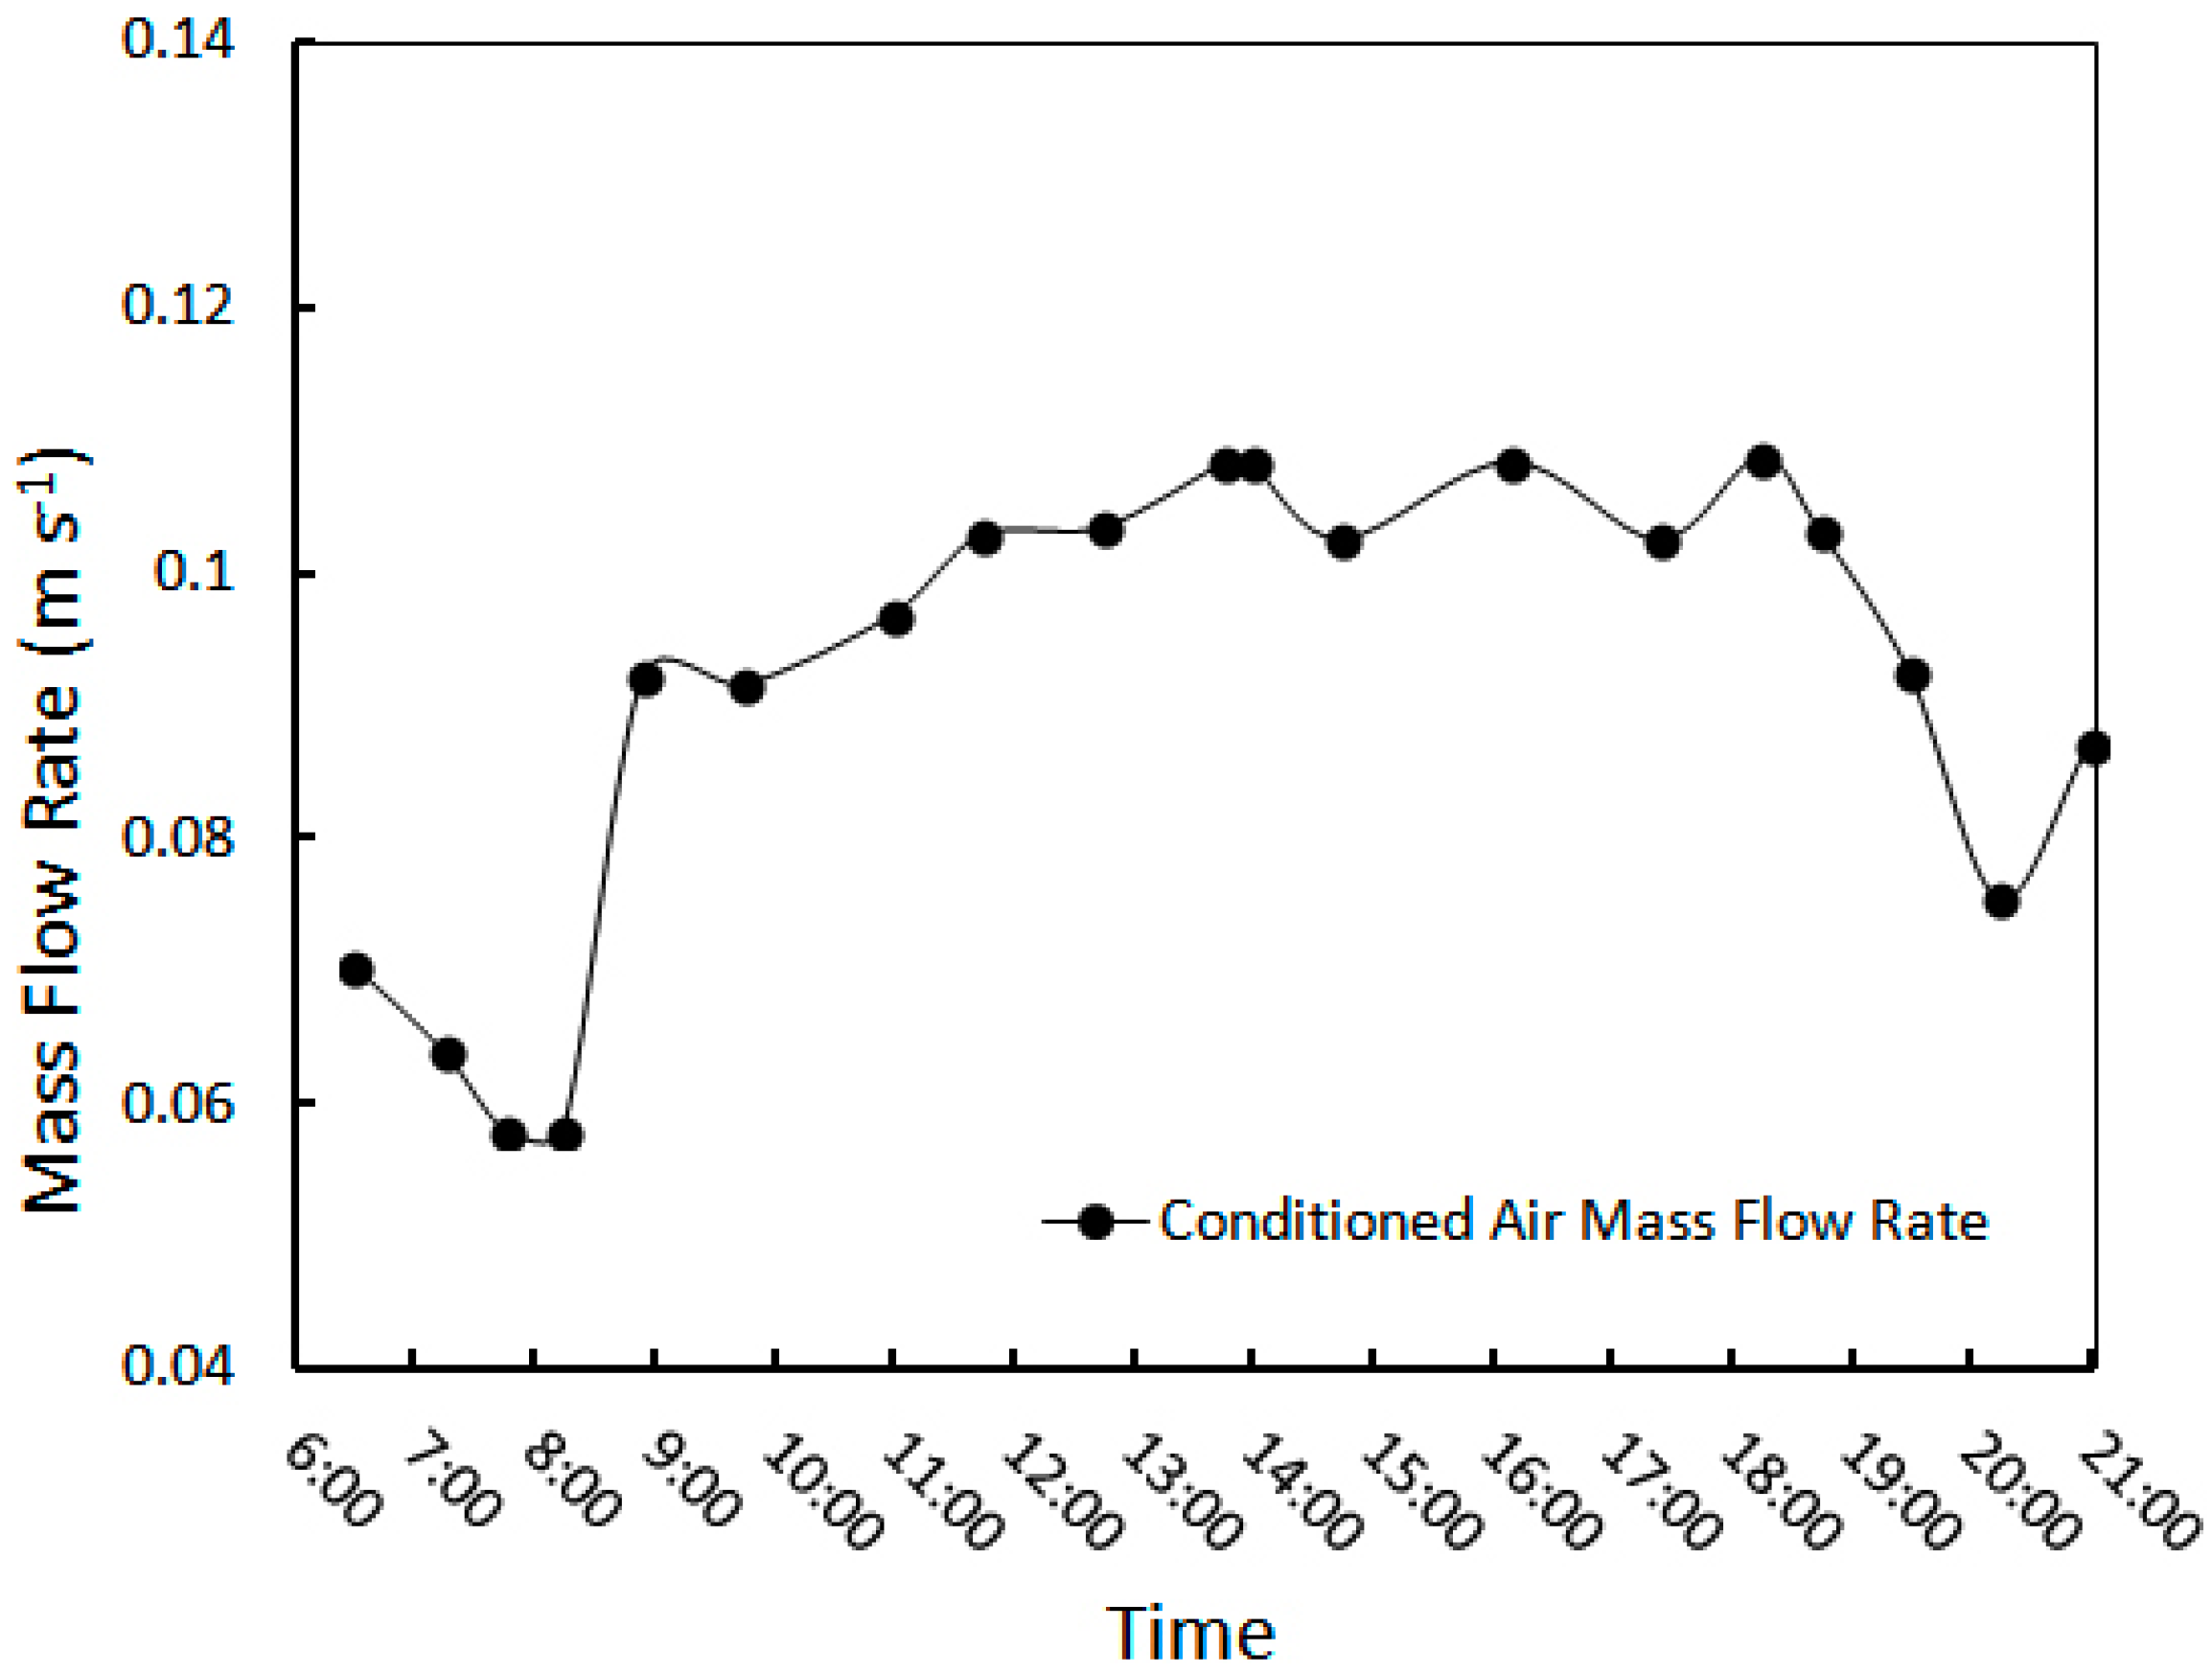
4.2.2. Test No. 4
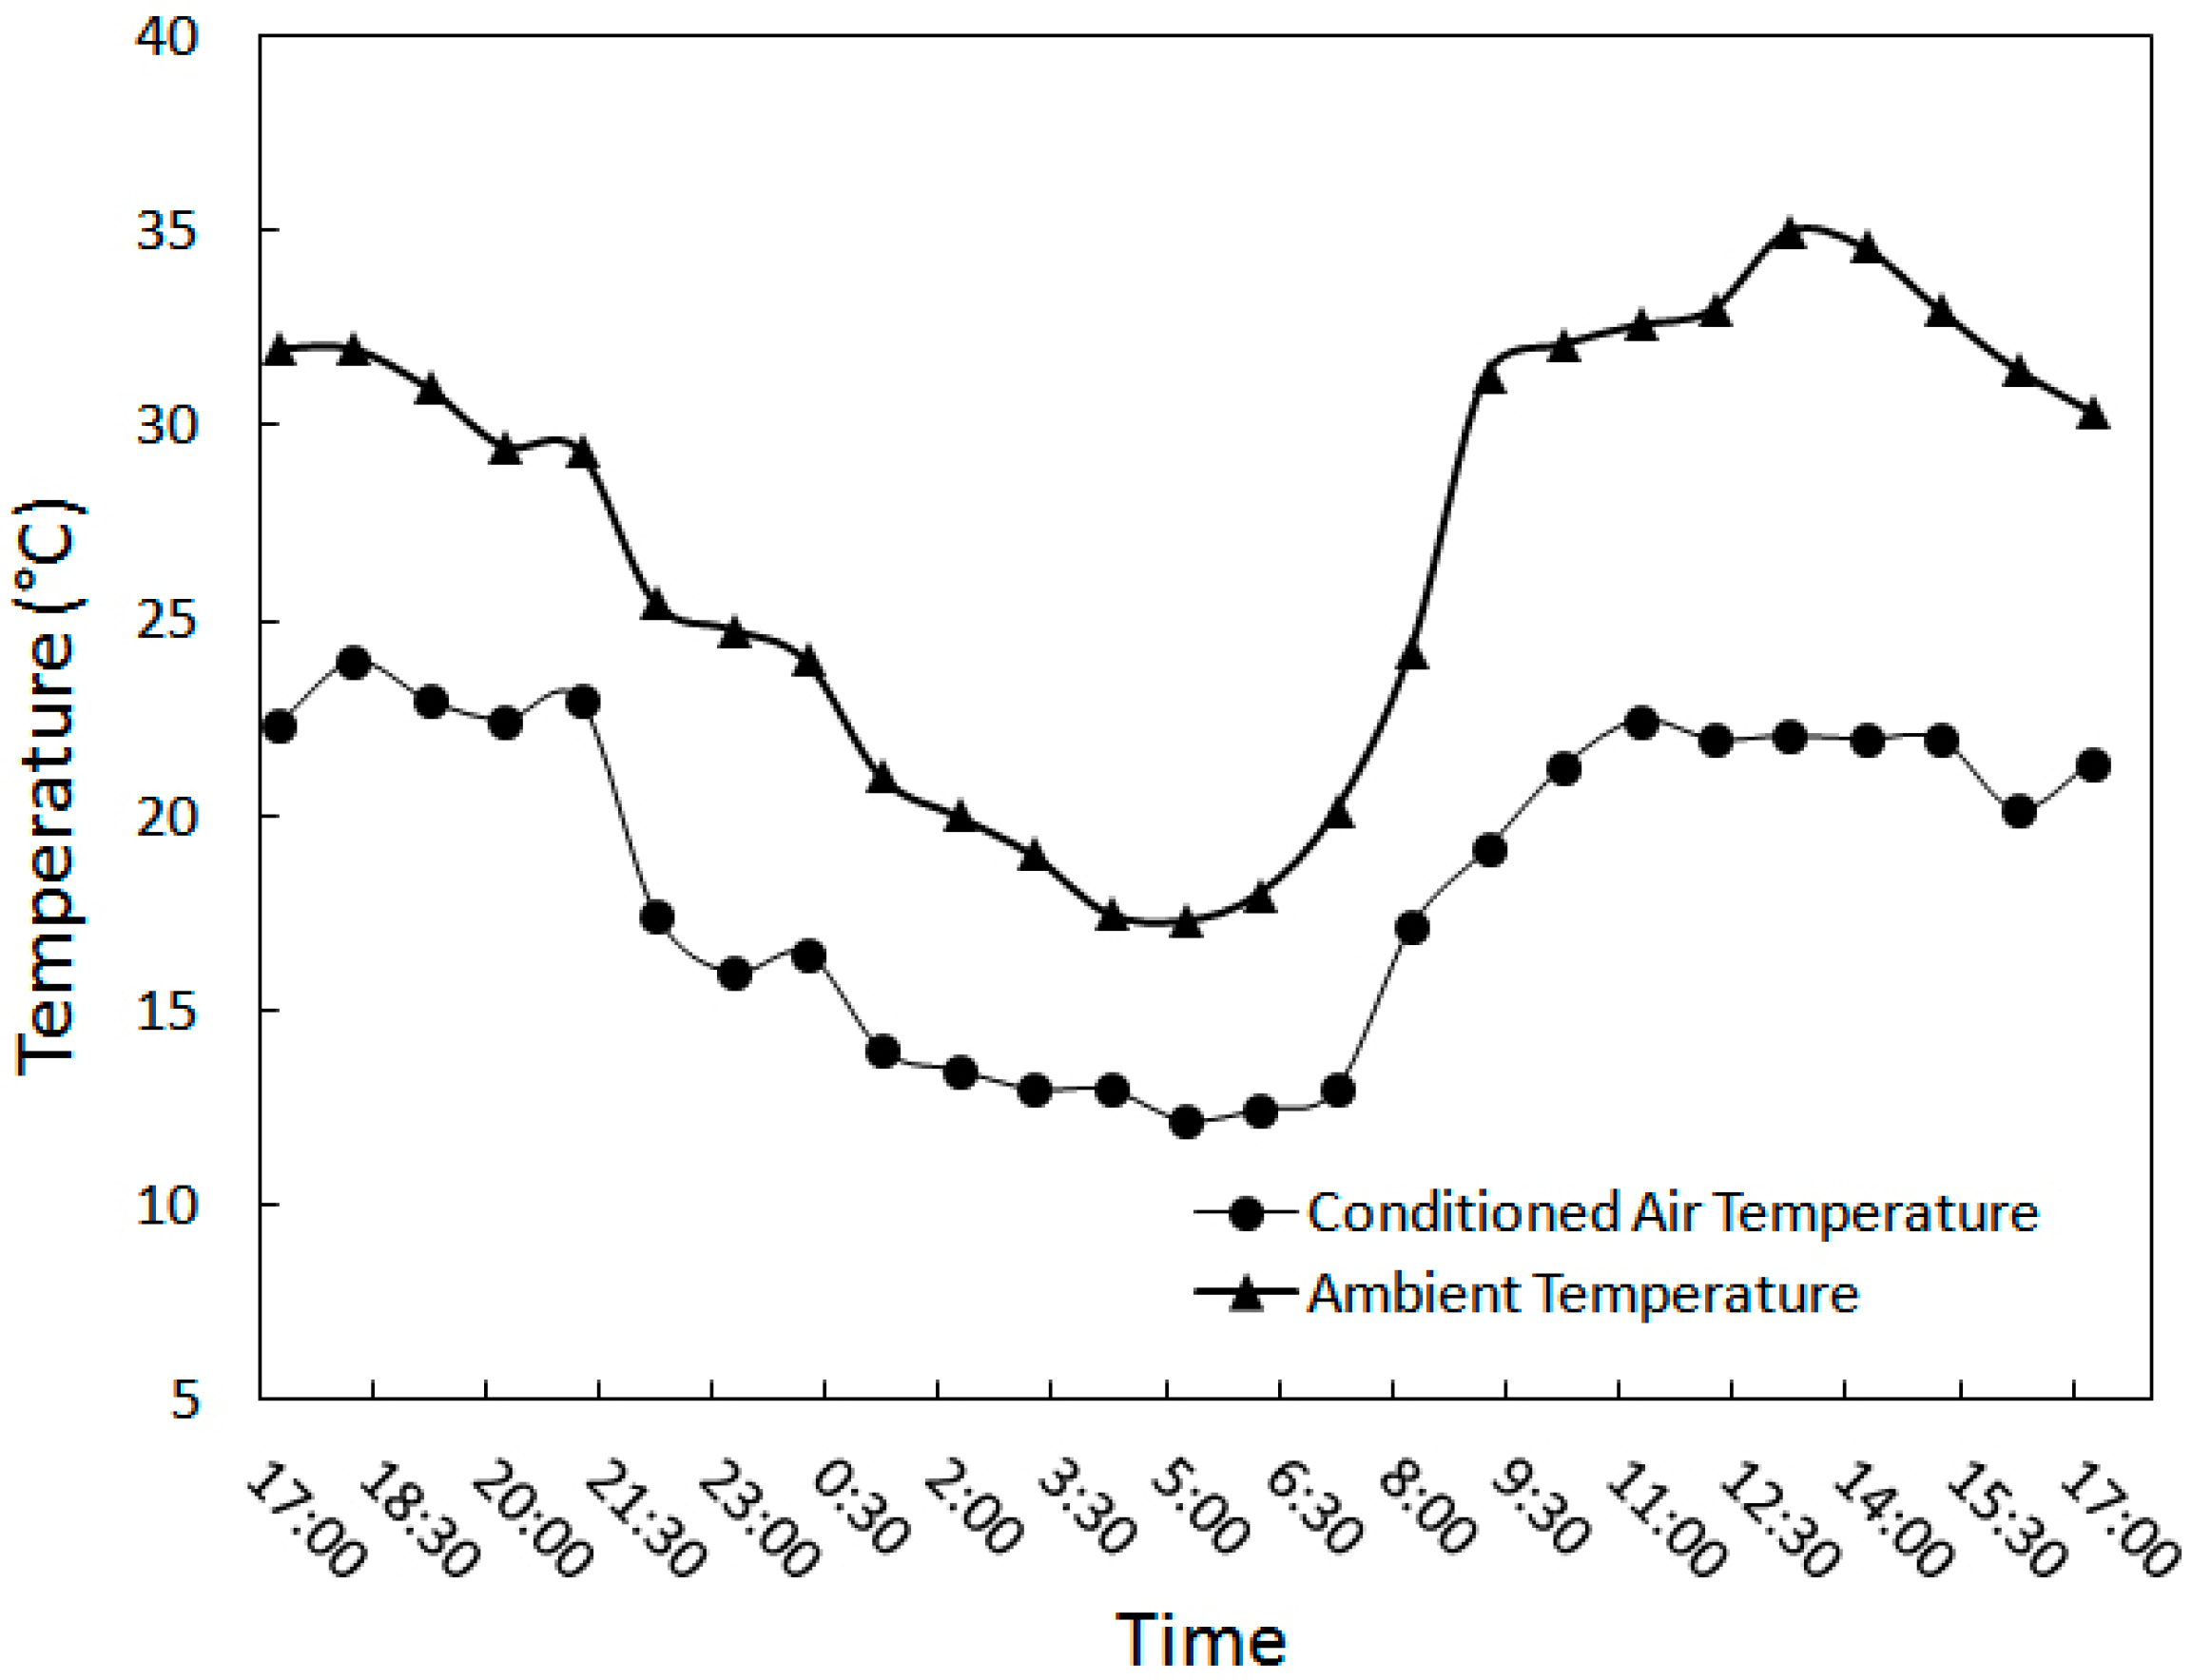
4.2.3. Test No. 5
5. Discussions
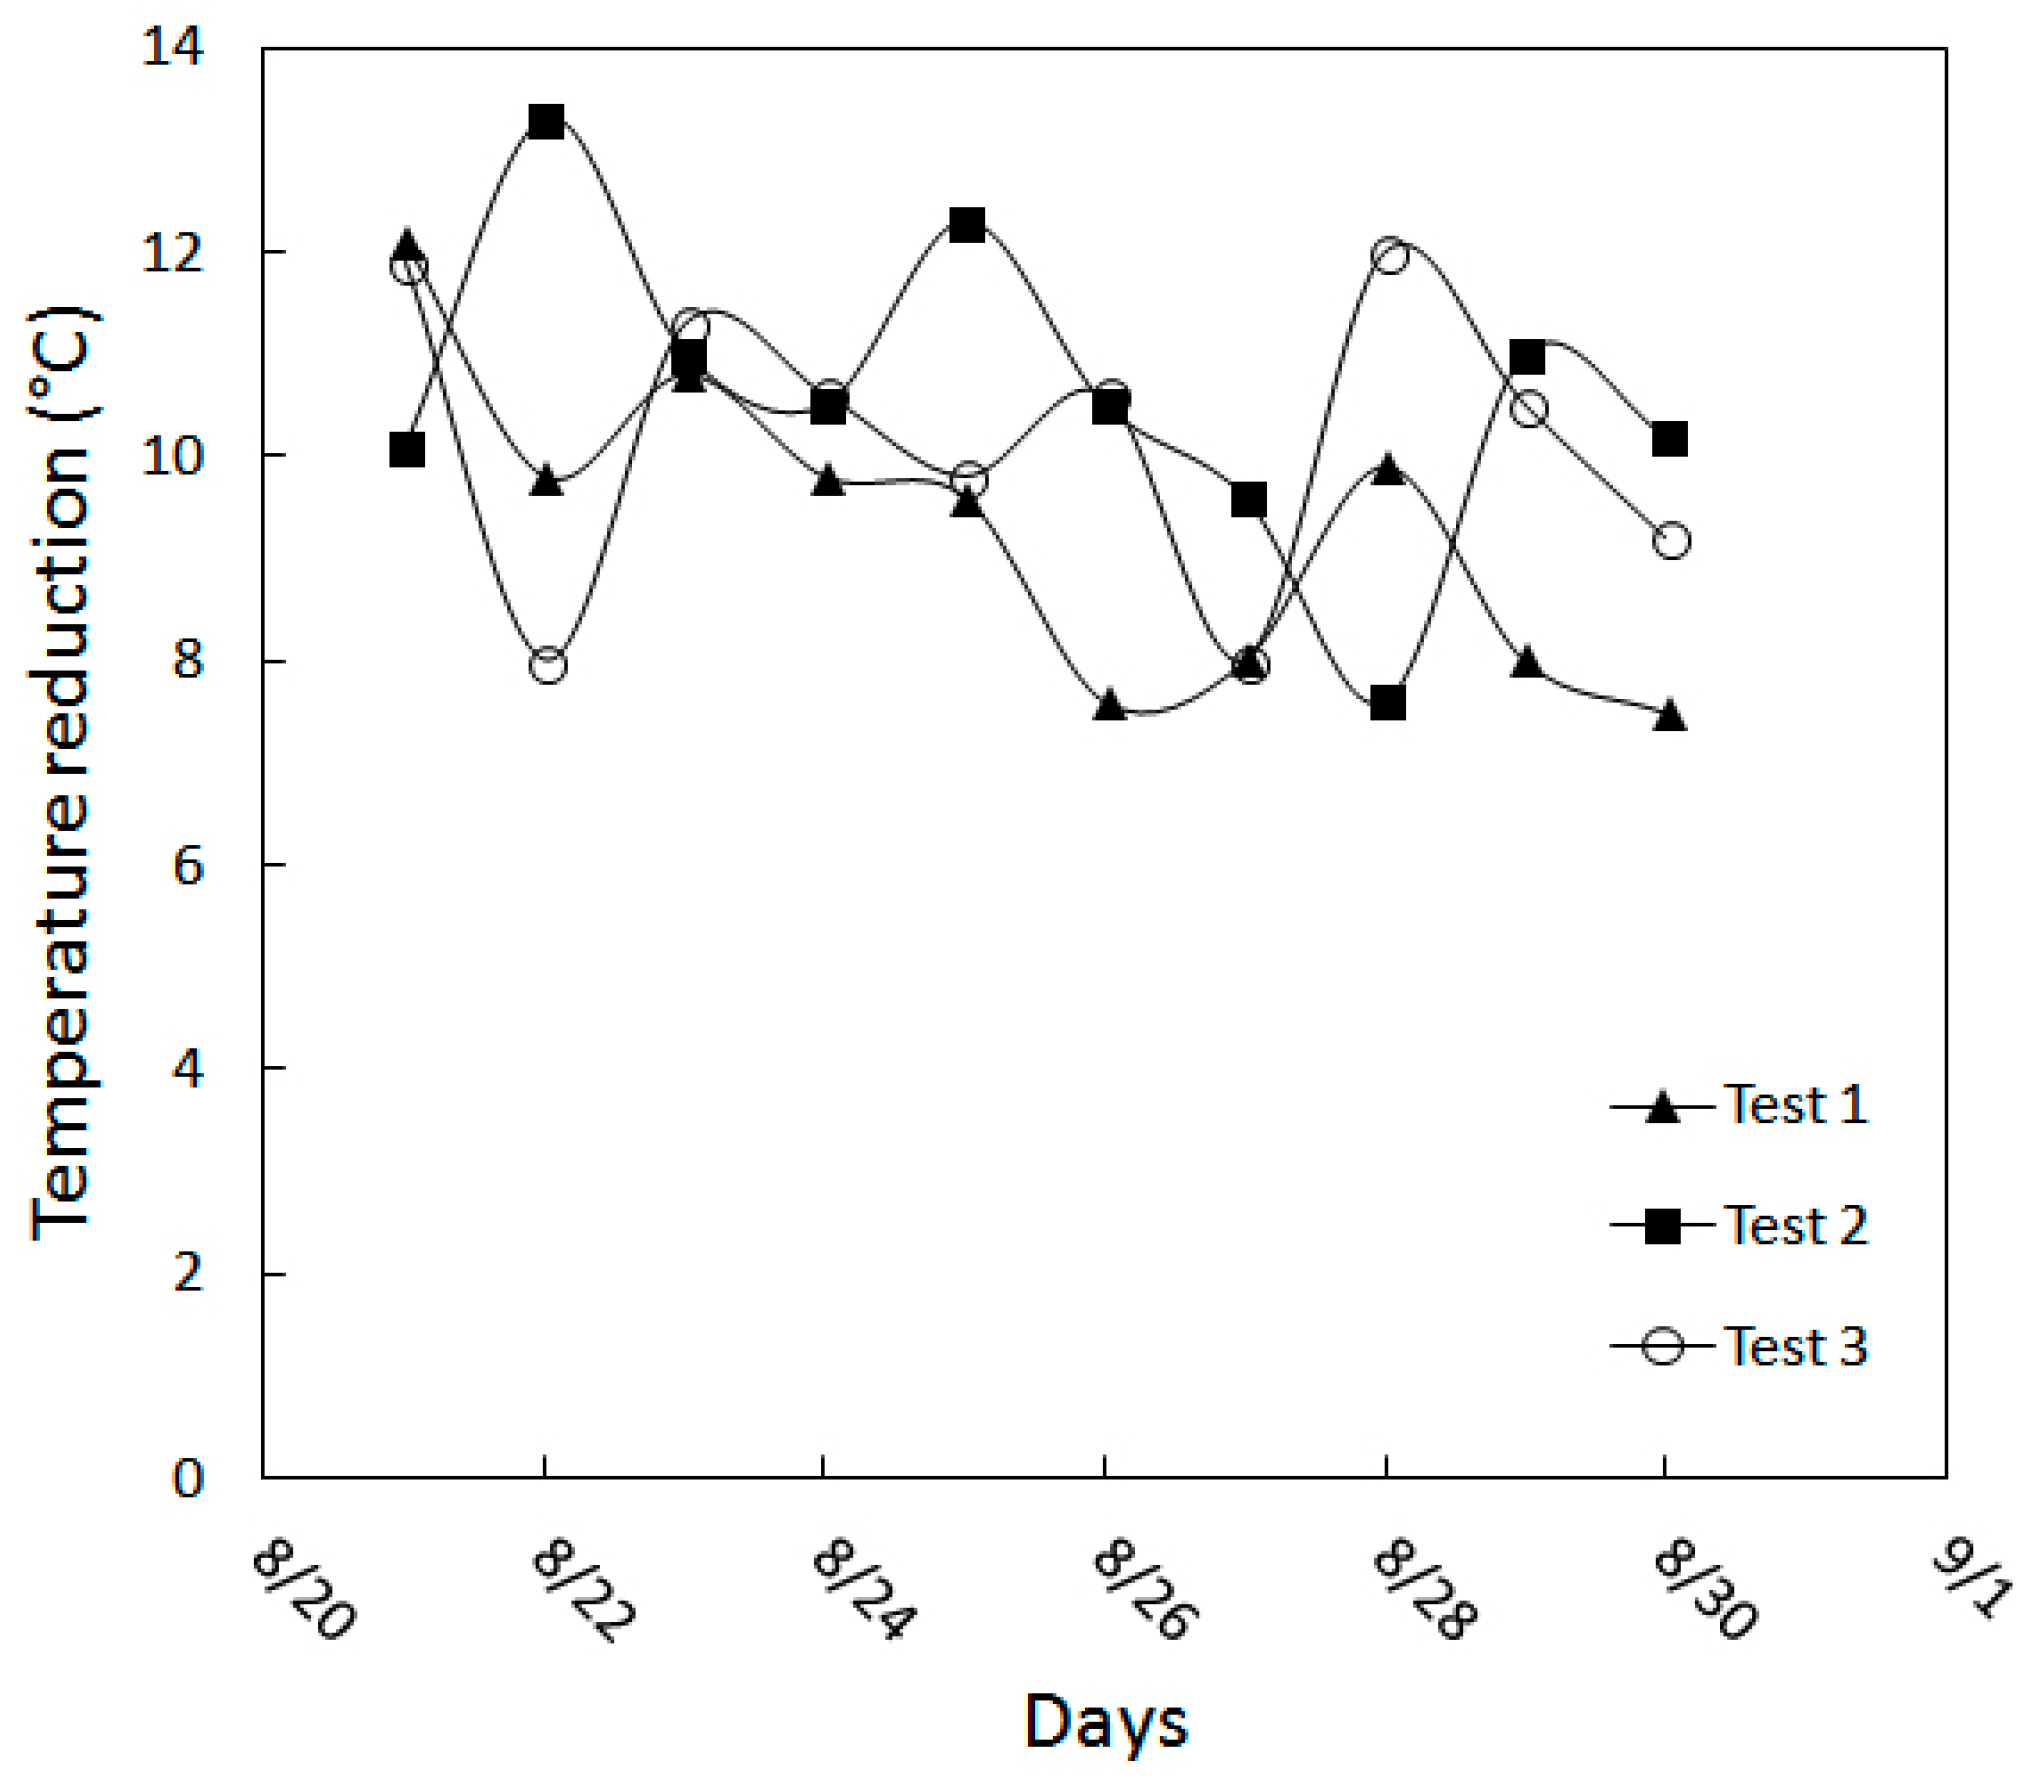
5.1. Temperature Reduction
- Maximum ambient air temperature = T1-max = 38.0 °C
- Minimum ambient air temperature = T1-min = 17.3 °C
- Average ambient air temperature = T1-ave = 30.3 °C
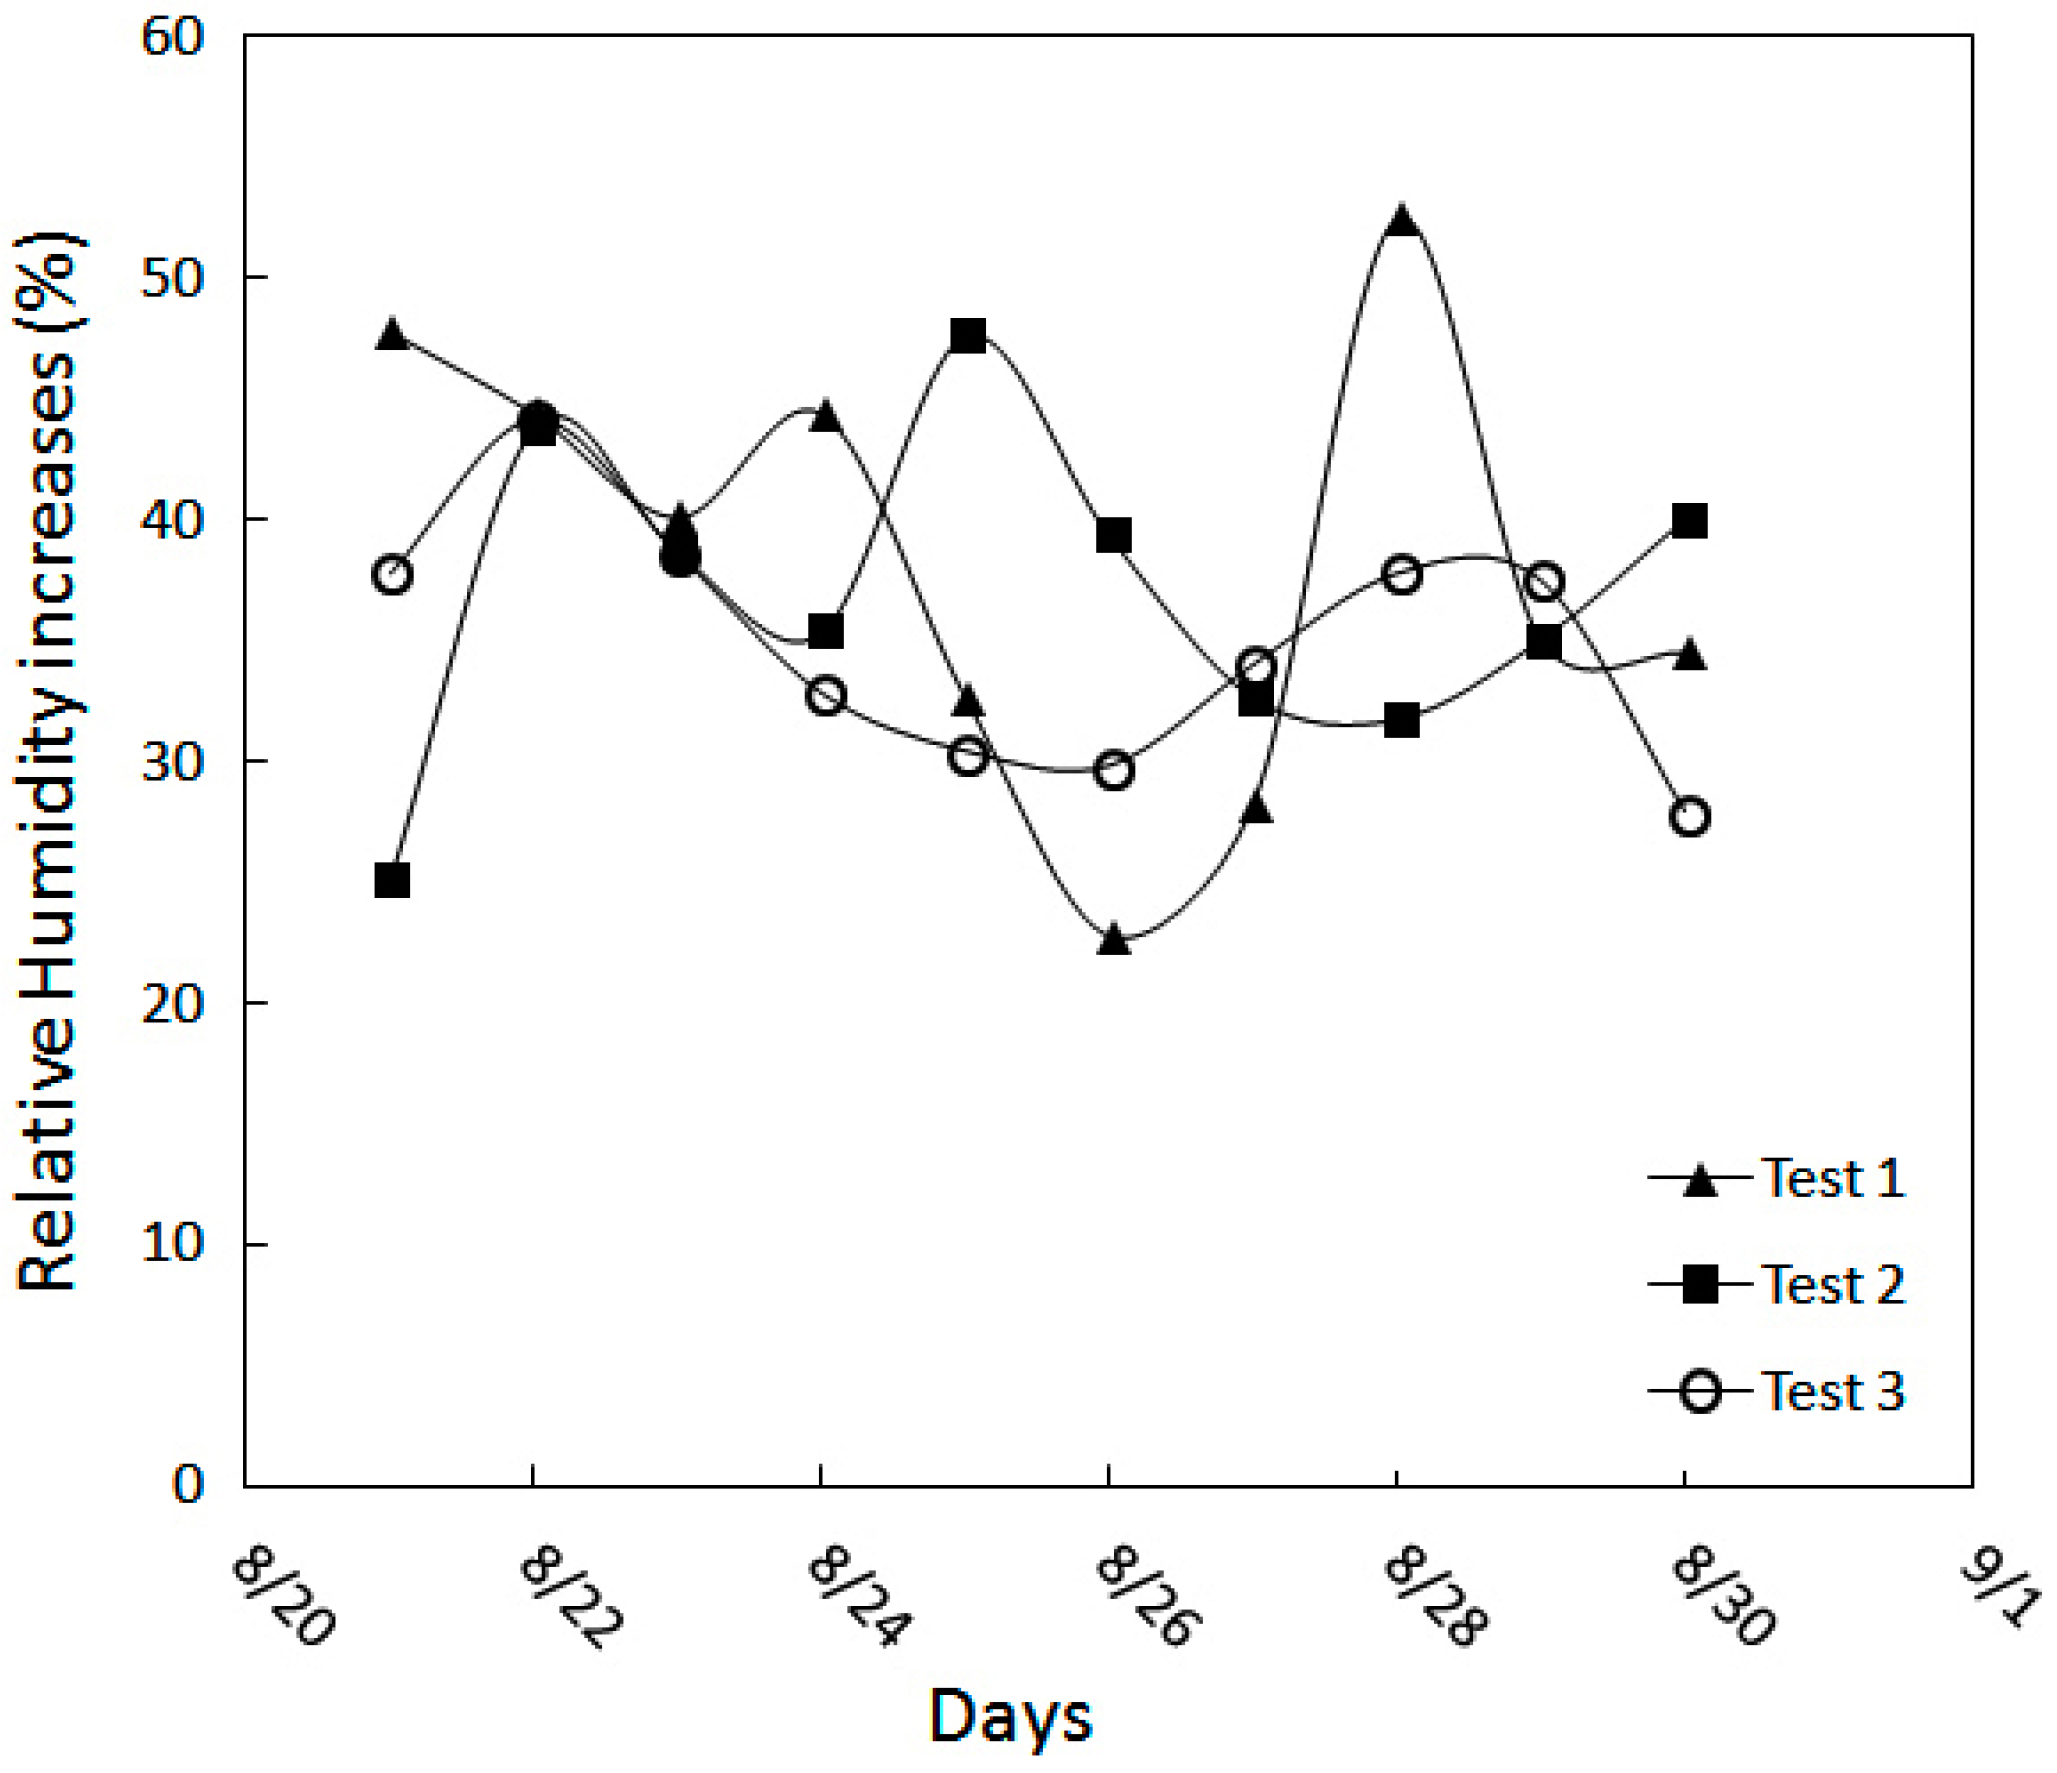
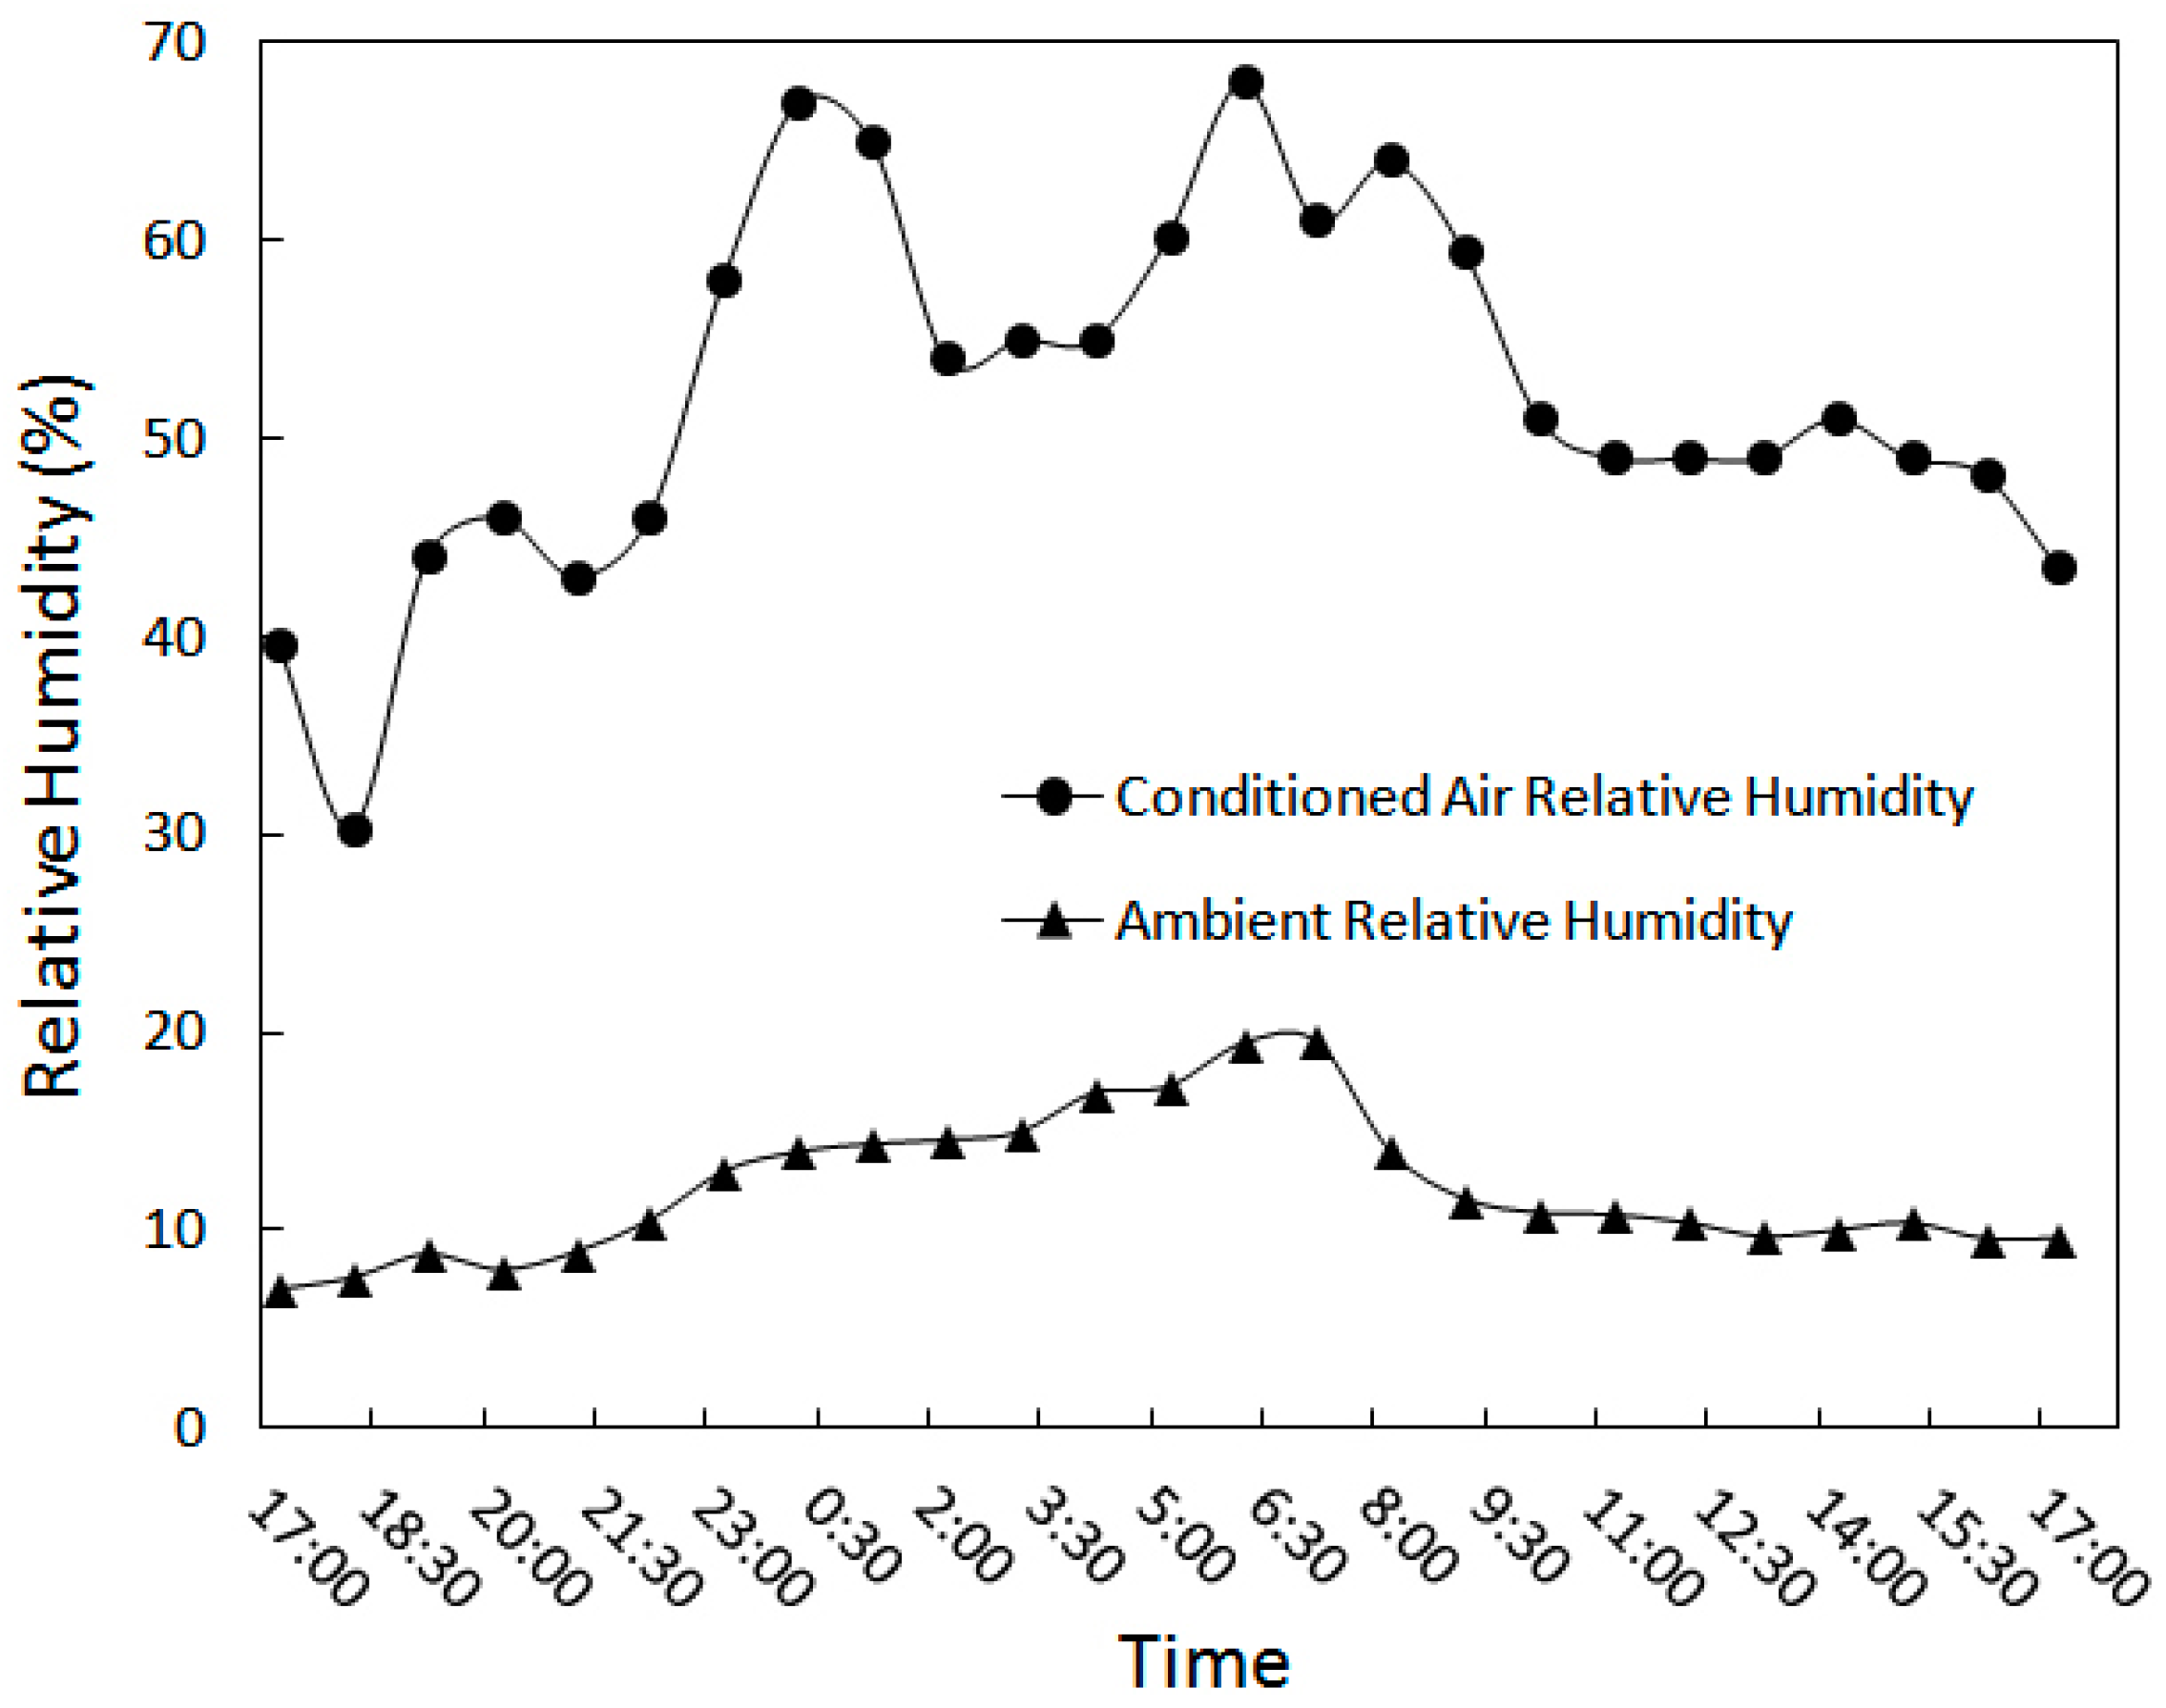
5.2. Increase in Relative Humidity
- Maximum air ambient RH = ϕ1-max = 19.6%
- Minimum air ambient RH = ϕ1-min = 6%
- Average air ambient RH = ϕ1-ave = 10%
- Maximum exit RH = ϕ6-max = 68%
- Minimum exit RH = ϕ6-min = 30%
- Average exit RH = ϕ6-ave = 49%
- Maximum increase in RH = ∆ϕmax = 53%
- Minimum increase in RH = ∆ϕmin = 23%
- Average increase in RH = ∆ϕave = 39%
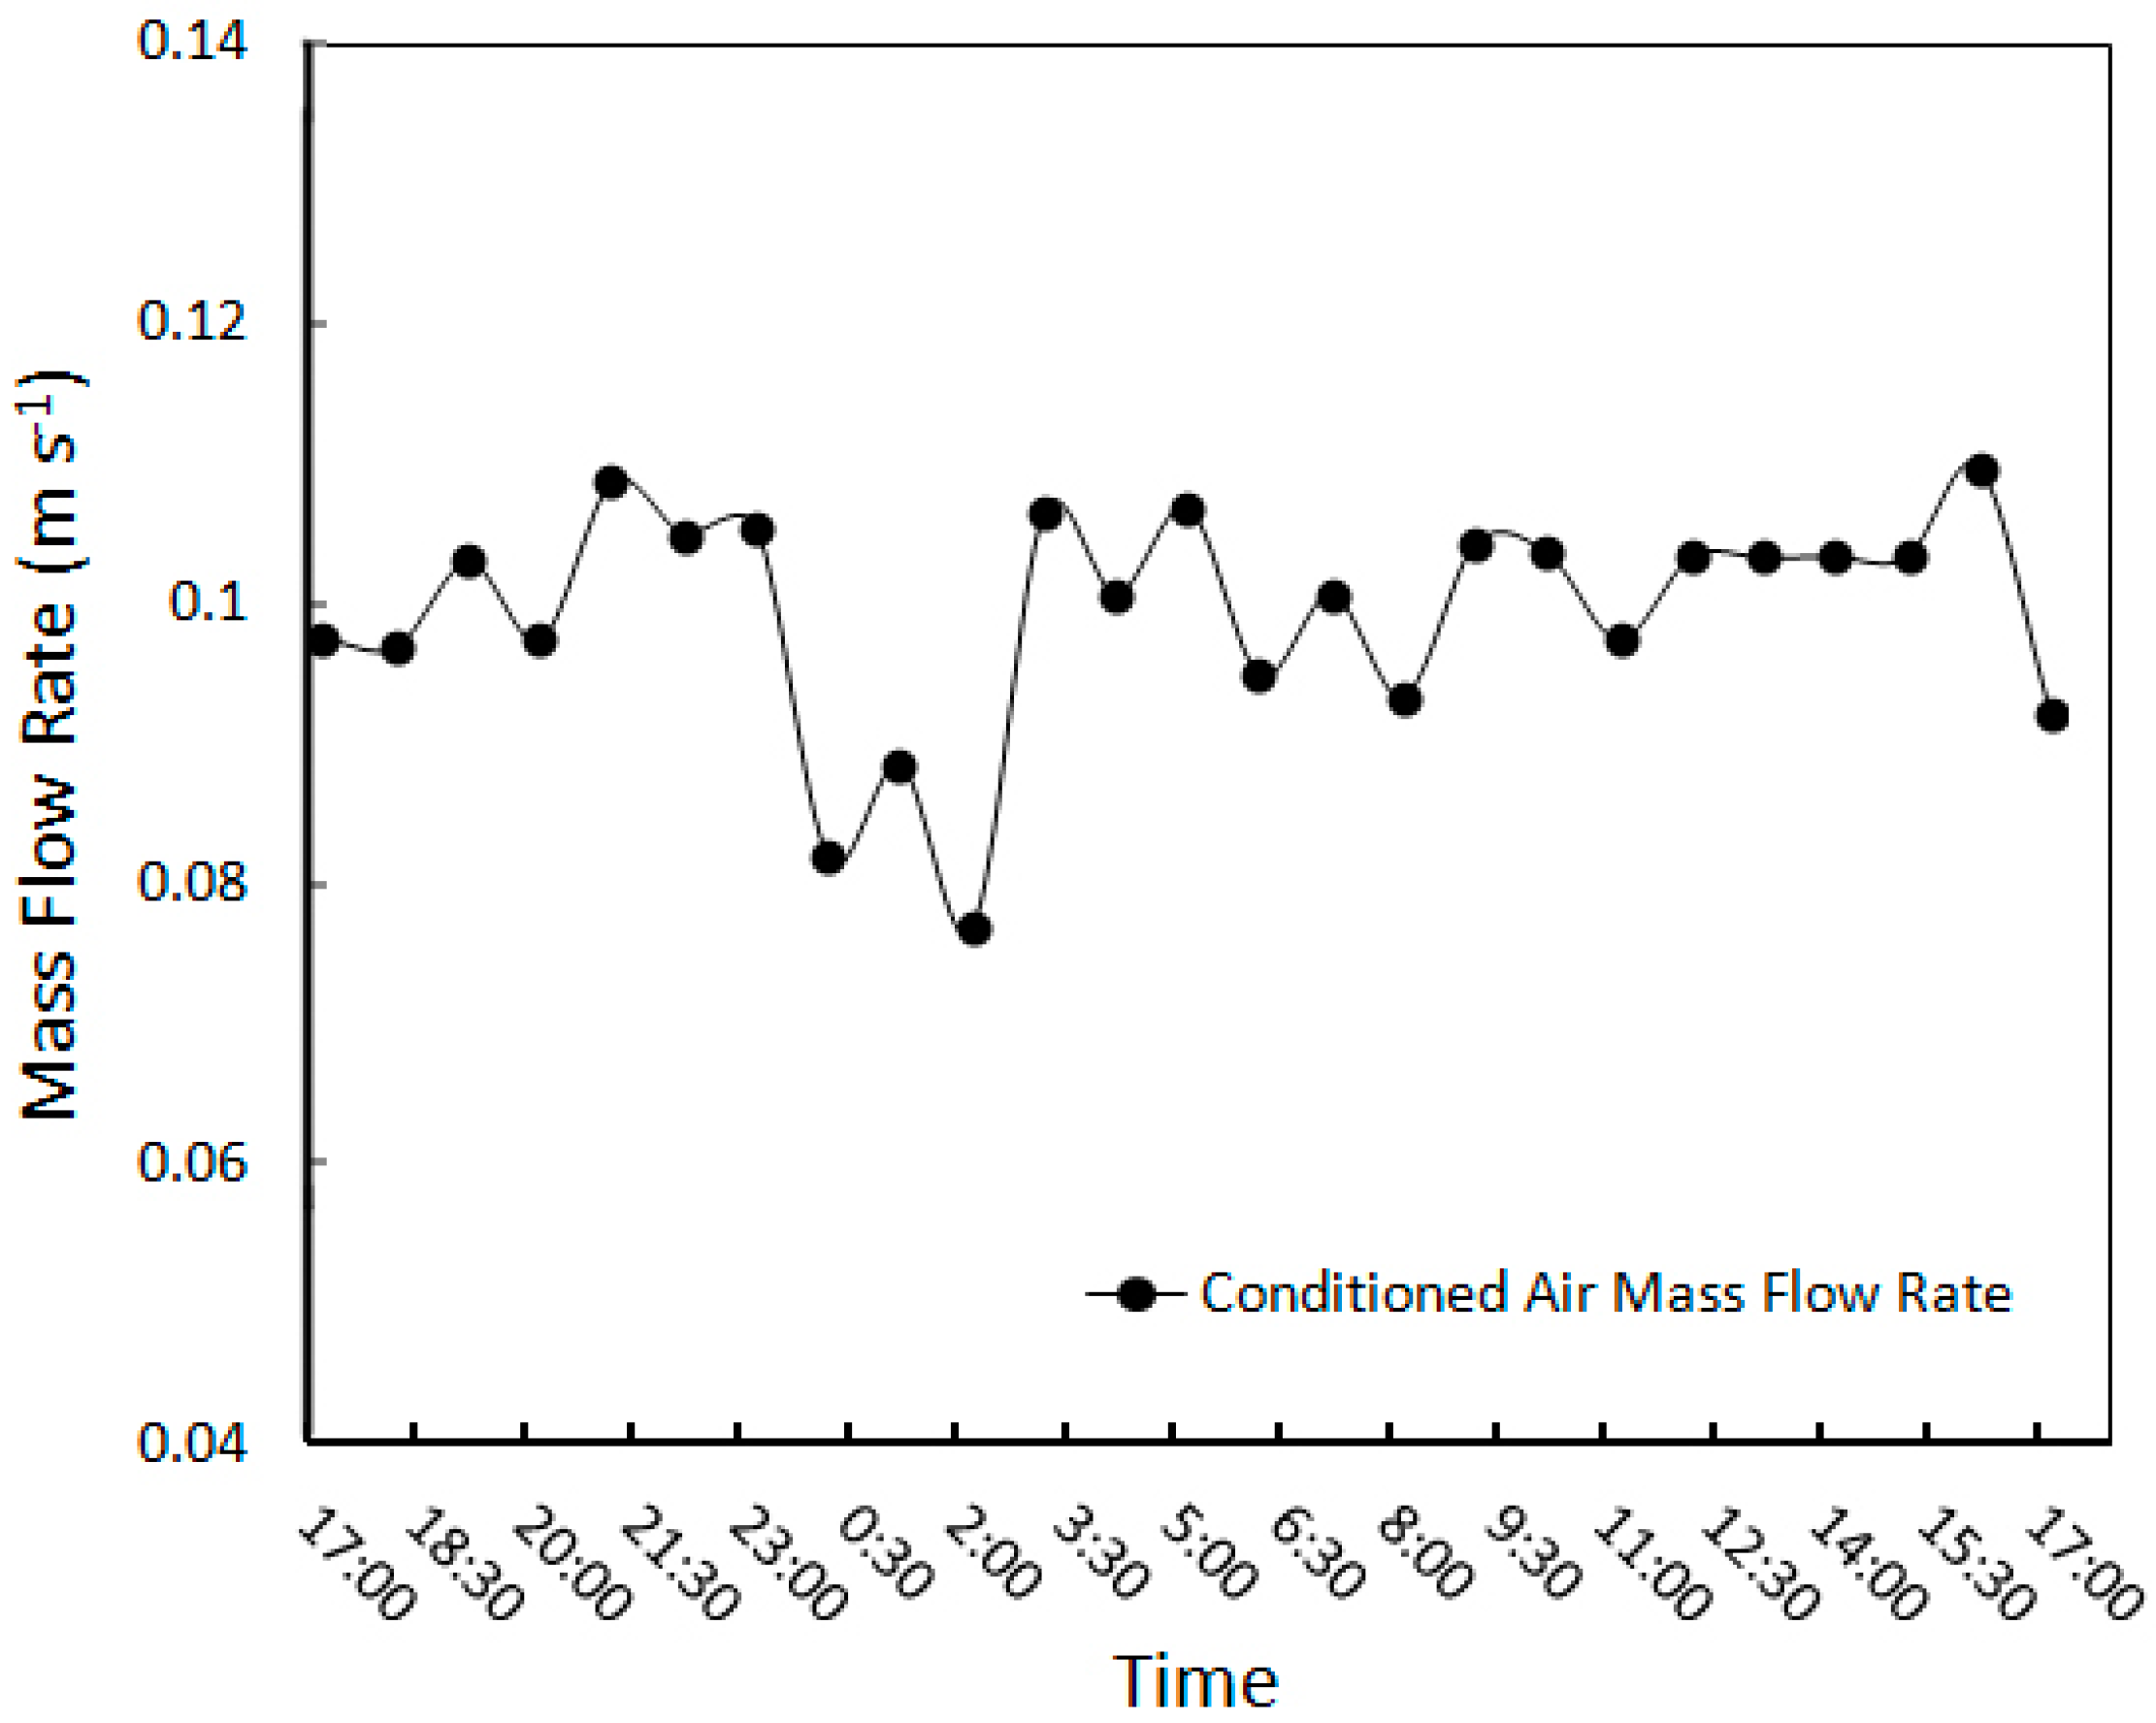
5.3. Mass Flow Rate
- Maximum mass flow rate = = 0.1149 kg·s−1
- Minimum mass flow rate = = 0.0580 kg·s−1
- Average mass flow rate = = 0.0982 kg·s−1
6. Conclusions
Acknowledgments
Author Contributions
Conflicts of Interest
References
- Bahadori, M.N. Passive Cooling Systems in Iranian Architecture. Sci. Am. 1978, 238, 144–145. [Google Scholar] [CrossRef]
- Bahadori, M.N. Natural Cooling in Hot Arid Regions. In Solar Energy Application in Buildings; Sayigh, A.A.M., Ed.; Academic Press Inc.: New York, NY, USA, 1977; pp. 195–225. [Google Scholar]
- Bahadori, M.N.; Dehghani-Sanij, A.R. Wind Towers: Architecture, Climate and Sustainability; Sayigh, A.A.M., Ed.; Springer: Basel, Switzerland, 2014. [Google Scholar]
- Mazidi, M.; Dehghani, A.R.; Aghanajafi, C. Wind Towers’ Role in Natural Air Conditioning and Passive Cooling of Buildings in Hot, Arid Regions. WSEAS Trans. Fluid Mech. 2006, 1, 959–966. [Google Scholar]
- Dehghani, A.R.; Aghanajafi, C. Experimental Study of Performance of Two New Wind Tower Designs and Their Comparison with Traditional Wind Towers. Iran. J. Energy 2005, 9, 14–26. [Google Scholar]
- Dehghani-Sanij, A.R. Cisterns: Sustainable Development, Architecture and Energy; Sayigh, A.A.M., Ed.; River Publishers: Aalborg, Denmark, 2016. [Google Scholar]
- Razavi, M.; Dehghani-Sanij, A.R.; Khani, M.R.; Dehghani, M.R. Comparing Meshless Local Petrov- Galerkin and Artificial Neural Networks Methods for Modeling Heat Transfer in Cisterns. Renew. Sustain. Energy Rev. 2015, 43, 521–529. [Google Scholar] [CrossRef]
- Dehghan, A.A.; Dehghani, A.R. Experimental and Theoretical Investigation of Thermal Performance of Underground Cold-water Reservoirs. Int. J. Therm. Sci. 2011, 50, 816–824. [Google Scholar] [CrossRef]
- Siahoui, H.A.; Dehghani, A.R.; Razavi, M.; Khani, M.R. Investigation of Thermal Stratification in Cisterns Using Analytical and Artificial Neural Networks Methods. J. Energy Conver. Manag. 2011, 52, 505–511. [Google Scholar] [CrossRef]
- Arefmanesh, A.; Dehghan, A.A.; Dehghani, A.R. Thermal Characteristics of an Underground Cold Water Reservoir: Analytical and Experimental Studies. Appl. Therm. Eng. 2009, 29, 3261–3265. [Google Scholar] [CrossRef]
- Razavi, M.; Dehghani, A.R.; Khanmohammadi, M. Simulation of Thermal Stratification in Cisterns Using Artificial Neural Networks. J. Energy Heat Mass Transf. 2009, 31, 201–210. [Google Scholar]
- Madoliat, R.; Razavi, M.; Dehghani, A.R. Modeling of Heat Transfer in Cisterns Using Artificial Neural Networks. J. Thermophys. Heat Transf. 2009, 23, 411–416. [Google Scholar] [CrossRef]
- Dehghani-Sanij, A.R.; Khani, M.R.; Zhang, B.; Narimannejad, S.; Mohammadni, M. Water Quality Analysis of Underground Reservoirs in Hot and Arid Regions. J. Appl. Environ. Biol. Sci. 2016, 6, 149–161. [Google Scholar]
- Dehghani-Sanij, A.R.; Khani, M.R.; Jalali, A.; Khani, M.; Narimannejad, S. Evaluation of Water Quality of Cisterns. Int. J. Environ. Resour. 2015, 4, 1–8. [Google Scholar] [CrossRef]
- Khani, M.R.; Yaghmaeian, K.; Dehghani, A.R. An Experimental Study in Passive Cooling Systems and Investigation of Their Role in Diminish Usage Energy and Environmental Pollutants. Int. J. Appl. Eng. Res. 2009, 4, 519–528. [Google Scholar]
- Masoso, O.T.; Grobler, L.J. The Dark Side of Occupants’ Behavior on Building Energy Use. Energy Build. 2010, 42, 173–177. [Google Scholar] [CrossRef]
- Saadatian, O.; Chin, H.L.; Sopian, K.; Sulaiman, M.Y. Review of Wind Catcher Technologies. Renew. Sustain. Energy Rev. 2012, 12, 1477–1495. [Google Scholar] [CrossRef]
- Chan, H.Y.; Riffat, S.B.; Zhu, J. Review of Passive Solar Heating and Cooling Technologies. Renew. Sustain. Energy Rev. 2010, 14, 781–789. [Google Scholar] [CrossRef]
- Bahadori, M.N. An Improved Design of Wind Towers for Natural Ventilation and Passive Cooling. Sol. Energy 1985, 36, 119–129. [Google Scholar] [CrossRef]
- Dehghani-Sanij, A.R.; Soltani, M.; Raahemifar, K. A New Design of Wind Tower for Passive Ventilation in Buildings to Reduce Energy Consumption in Windy Regions. Renew. Sustain. Energy Rev. 2015, 42, 182–195. [Google Scholar] [CrossRef]
- Archnet Website. Available online: http://archnet.org/library/dictionary/entry.jsp?entry_id=DIA0483 (accessed on 23 June 2017).
- The Toynbee Convector. Available online: https://davidderrick.wordpress.com/2007/12/19/hyderabad-sindh/ (accessed on 23 June 2017).
- Bahadori, M.N. Pressure Coefficients to Evaluate Air Flow Patterns in Wind Towers. In Proceedings of the International Passive and Hybrid Cooling Conference, Miami Beach, FL, USA, 6–16 November 1981; American Section of the International Solar Energy Society: Newark, DE, USA, 1981; pp. 206–210. [Google Scholar]
- Karakasanis, C.; Bahadori, M.N.; Vickery, B.J. A Study of the External Wind Pressure Distribution and the Estimation of Internal Ventilation Flows in Buildings Employing Wind Towers; Research Report BLWT-ss; University of Western Ontario: London, ON, Canada, 1984; Volume 25. [Google Scholar]
- Karakasanis, C.; Bahadori, M.N.; Vickery, B.J. Evaluation of Air Flow Rates in Employing Wind Towers. Sol. Energy 1986, 37, 363–374. [Google Scholar] [CrossRef]
- Bahadori, M.N. A Passive Cooling/Heating System for Hot, Arid Regions. In Proceedings of the 13th National Passive Solar Conference, Cambridge, MA, USA, 20–24 June 1988; pp. 364–367. [Google Scholar]
- Bahadori, M.N. Viability of Wind Towers in Achieving Summer Comfort in the Hot, Arid Regions of the Middle East. In Proceedings of the Third World Renewable Energy Congress, Reading, UK, 11–16 September 1994; pp. 879–892. [Google Scholar]
- Bahadori, M.N.; Pakzad, A.R. Performance Evaluation of New Designs of Wind Towers. Paper No. FEDSM 2002–31247. In Proceedings of the ASME FEDSM02, ASME 2002 Fluids Engineering Division Summer Meeting, Montreal, QC, Canada, 14–18 July 2002. [Google Scholar]
- Bahadori, M.N.; Mazidi, M.; Dehghani, A.R. Experimental Investigation of New Designs of Wind Towers. Renew. Energy 2008, 33, 2273–2281. [Google Scholar]
- Amoli, F.J. An Analytic Survey of Two Types of Modern Wind Towers. Bachelor’s Thesis, School of Mechanical Engineering, Sharif University, Tehran, Iran, 1990. [Google Scholar]
- Memarie, G.H. An Analysis of the Performance and Comparison of Two Modern Designs of Wind Towers. Bachelor’s Thesis, School of Mechanical Engineering, Sharif University, Tehran, Iran, 1991. [Google Scholar]
- Pakzad, A.R. Analysis of Two New Designs of Wind Towers. Master’s Thesis, School of Mechanical Engineering, Sharif University of Technology, Tehran, Iran, September 1997. [Google Scholar]
- Dehghani, A.R. An Experimental Evaluation of Two New Designs of Wind Towers and a Comparison with a Conventional Wind Tower. Bachelor’s Thesis, Yazd University, Yazd, Iran, 2001. [Google Scholar]
- Mosavi Davar, S. An Empirical Study and Performance Analysis of Wind Towers and Their Feasibility for Use in the Buildings. Bachelor’s Thesis, Department of Mechanical Engineering, Faculty of Polytechnic, Gillan University, Gillan, Iran, 2002. [Google Scholar]
- Mazidi, M. Assessment of the Efficiency of the Wind Tower of Yazd University Mosque through Analytical and Empirical Methods. Master’s Thesis, Department of Power-Plant, Shahid Abbaspour Water and Electricity University, Tehran, Iran, 2005. [Google Scholar]
- Khani, S.M.R. Industrial Production of Wind Towers to Replace Evaporative Coolers. Master’s Thesis, School of Mechanical Engineering, University of Tehran, Tehran, Iran, 2014. [Google Scholar]
- Aliabadi, A.A.; Krayenhoff, E.S.; Nazarian, N.; Chew, L.-W.; Armstrong, P.R.; Afshari, A.; Norford, L.K. Effects of Roof-Edge Roughness on Air Temperature and Pollutant Concentration in Urban Canyons. Bound. Layer Meteorol. 2017. [Google Scholar] [CrossRef]
- Khani, S.M.R.; Bahadori, M.N.; Nourbakhsh, A. Modular Wind Tower with Wetted Surfaces. Industrial Property General Office of Iran. Patent Registration No. 83,449, 2 August 2014. [Google Scholar]
- Khani, S.M.R.; Bahadori, M.N.; Dehghani-Sanij, A.R. Experimental Investigation of a Modular Wind Tower in Hot and Dry Regions. Energy Sustain. Dev. 2017, 39, 21–28. [Google Scholar] [CrossRef]
- Sonntag, R.; Borgnakke, C.; Van Wylen, J. Fundamentals of Thermodynamics, 6th ed.; John Wiley and Sons: New York, NY, USA, 2002. [Google Scholar]
- ASHRAE Handbook, Fundamentals; American Society of Heating Refrigerating and Air Conditioning Engineers Inc.: Atlanta, GA, USA, 2009.
- ANSI/ASHRAE Standard 55-2013. Thermal Environmental Conditions for Human Occupancy; Approved by ASHRAE on 18 November 2014, and by the American National Standards Institute on 1 December 2014; ASHRAE: Atlanta, GA, USA.


| Measuring Instrument | Used to Measure | Accuracy |
|---|---|---|
| Testo 452 with high accuracy velocity probe | Velocity of air | ±0.7 m·s−1 |
| Testo 615 | Relative humidity of air Temperature of air | ±3% ±0.7 °C |
| LUTRON TM-947 SD 4 Channels Thermometer data logger | Temperature of air | ±[(4×10⁻⁴)T + 0.5)] °C |
| Location | Sign | Description | Measuring Instrument | |
|---|---|---|---|---|
| Ambient | T1 | Dry bulb temperature of ambient | LUTRON TM-947 | Testo 615 |
| ϕ1 | RH of ambient | Testo 615 | ||
| V1 | Air velocity (wind velocity) | Testo 452 | ||
| Room where wind tower outlet was located | Tr | Dry bulb temperature of room | LUTRON TM-947 | Testo 615 |
| ϕr | RH of room | Testo 615 | ||
| After wetted surfaces (in the head of wind tower) | T2 | Dry bulb temperature at wind tower head | LUTRON TM-947 | |
| Wind tower outlet | T6 | Dry bulb temperature at wind tower outlet | LUTRON TM-947 | Testo 615 |
| ϕ6 | RH of wind tower outlet | Testo 615 | ||
| V6 | Velocity of conditioned air from wind tower to room | Testo 452 | ||
| Date | Time | T1 (°C) | ϕ1 (%) | V1 (m·s−1) | Tr (°C) | ϕr (%) | T2 (°C) | T6 (°C) | ϕ6 (%) | V6 (m·s−1) |
|---|---|---|---|---|---|---|---|---|---|---|
| 21 August | 10:00 | 31.3 | 11.60 | 0 | 25.0 | 36.70 | 18.5 | 19.2 | 59.40 | 1.8 |
| 12:00 | 32.6 | 10.80 | 0 | 25.5 | 29.00 | 21.1 | 22.5 | 35.90 | 1.7 | |
| 16:00 | 33.5 | 7.30 | 0 | 24.7 | 23.00 | 21.0 | 21.6 | 45.10 | 1.6 | |
| 22 August | 9:45 | 33.0 | 10.70 | 0 | 26.0 | 30.60 | 22.2 | 23.2 | 55.10 | 1.6 |
| 12:15 | 35.3 | 6.20 | 0 | 26.0 | 26.10 | 21.0 | 22.0 | 50.00 | 2.0 | |
| 16:00 | 32.0 | 6.80 | 0 | 27.0 | 20.50 | 23.0 | 24.0 | 51.00 | 1.5 | |
| 23 August | 10:15 | 32.1 | 10.90 | 0 | 25.4 | 34.00 | 20.0 | 21.3 | 51.00 | 1.8 |
| 12:15 | 33.0 | 10.40 | 0 | 26.0 | 32.00 | 21.0 | 22.0 | 49.00 | 1.8 | |
| 16:15 | 32.0 | 9.60 | 0 | 25.9 | 35.00 | 20.0 | 20.7 | 48.20 | 1.9 | |
| 24 August | 9:45 | 33.0 | 10.70 | 0 | 26.0 | 30.60 | 22.2 | 23.2 | 55.10 | 1.6 |
| 11:45 | 34.0 | 7.00 | 0 | 26.4 | 26.90 | 22.8 | 23.5 | 42.30 | 1.8 | |
| 16:10 | 34.5 | 8.20 | 0 | 26.5 | 25.50 | 23.2 | 23.9 | 41.00 | 1.9 | |
| 25 August | 10:15 | 32.0 | 7.00 | 0 | 27.0 | 24.70 | 22.0 | 22.4 | 39.60 | 1.7 |
| 12:15 | 34.2 | 7.60 | 0 | 26.8 | 27.90 | 20.8 | 21.9 | 55.20 | 1.8 | |
| 16:15 | 34.2 | 7.60 | 0 | 26.3 | 22.60 | 23.3 | 24.4 | 38.00 | 1.8 | |
| 26 August | 10:00 | 32.0 | 7.60 | 0 | 26.3 | 22.60 | 23.3 | 24.4 | 30.30 | 1.8 |
| 12:20 | 35.1 | 7.00 | 0 | 25.0 | 35.30 | 23.5 | 24.6 | 46.30 | 1.9 | |
| 15:55 | 34.5 | 8.20 | 0 | 26.5 | 25.50 | 23.2 | 23.9 | 38.00 | 1.9 | |
| 27 August | 9:50 | 31.0 | 8.80 | 0 | 27.5 | 19.00 | 21.6 | 23.0 | 37.00 | 1.8 |
| 12:00 | 32.0 | 7.00 | 0 | 27.0 | 24.70 | 22.0 | 22.4 | 39.60 | 1.7 | |
| 16:10 | 32.5 | 9.00 | 0 | 27.5 | 19.00 | 23.5 | 24.5 | 43.00 | 1.8 | |
| 28 August | 10:00 | 31.0 | 11.50 | 0 | 23.5 | 42.00 | 20.0 | 21.1 | 64.00 | 1.6 |
| 12:10 | 32.0 | 7.60 | 0 | 26.3 | 22.60 | 23.3 | 24.4 | 39.30 | 1.8 | |
| 16:00 | 33.5 | 7.50 | 0 | 24.9 | 23.50 | 21.2 | 21.5 | 45.30 | 1.6 | |
| 29 August | 10:15 | 31.0 | 12.00 | 0 | 26.0 | 29.50 | 22.4 | 23.0 | 47.00 | 1.9 |
| 12:10 | 32.0 | 7.60 | 0 | 26.3 | 22.60 | 23.3 | 24.4 | 39.30 | 1.8 | |
| 16:00 | 32.5 | 6.50 | 0 | 26.5 | 25.70 | 20.7 | 22.0 | 44.00 | 1.8 | |
| 30 August | 9:50 | 30.0 | 10.50 | 0 | 26.5 | 25.50 | 21.7 | 22.5 | 45.00 | 1.8 |
| 12:00 | 33.3 | 7.20 | 0 | 26.5 | 25.60 | 22.1 | 23.1 | 47.20 | 1.9 | |
| 16:10 | 32.0 | 8.00 | 0 | 26.1 | 26.90 | 21.9 | 22.8 | 35.90 | 1.5 |
| Time | T1 (°C) | ϕ1 (%) | V1 (m·s−1) | Tr (°C) | ϕr (%) | T2 (°C) | T6 (°C) | ϕ6 (%) | V6 (m·s−1) |
|---|---|---|---|---|---|---|---|---|---|
| 6:30 | 20.0 | 18.00 | 0 | 25.0 | 29.00 | 15.8 | 16.2 | 68.00 | 1.2 |
| 7:15 | 22.0 | 19.00 | 0 | 23.0 | 42.00 | 18.5 | 19.0 | 62.00 | 1.1 |
| 7:45 | 22.5 | 18.10 | 0 | 24.5 | 38.60 | 18.4 | 19.2 | 66.00 | 1.0 |
| 8:15 | 25.8 | 13.00 | 0 | 25.0 | 38.00 | 19.0 | 19.5 | 65.00 | 1.0 |
| 8:55 | 31.0 | 11.50 | 0 | 23.5 | 42.00 | 20.0 | 21.1 | 64.00 | 1.6 |
| 9:45 | 33.0 | 10.70 | 0 | 26.0 | 30.60 | 22.2 | 23.2 | 55.10 | 1.6 |
| 11:00 | 33.5 | 10.00 | 0 | 26.1 | 33.00 | 23.0 | 24.4 | 53.00 | 1.7 |
| 11:45 | 34.0 | 7.00 | 0 | 26.4 | 26.90 | 22.8 | 23.5 | 42.30 | 1.8 |
| 12:45 | 34.2 | 7.60 | 0 | 26.8 | 27.90 | 20.8 | 21.9 | 55.20 | 1.8 |
| 13:45 | 35.1 | 7.00 | 0 | 25.0 | 35.30 | 23.5 | 24.6 | 46.30 | 1.9 |
| 14:00 | 38.0 | 7.50 | 0 | 25.0 | 27.00 | 23.3 | 24.4 | 43.00 | 1.9 |
| 14:45 | 36.0 | 7.40 | 0 | 26.5 | 24.00 | 23.5 | 24.4 | 46.00 | 1.8 |
| 16:10 | 34.5 | 8.20 | 0 | 26.5 | 25.50 | 23.2 | 23.9 | 41.00 | 1.9 |
| 17:25 | 32.5 | 9.00 | 0 | 27.5 | 19.00 | 23.5 | 24.5 | 44.00 | 1.8 |
| 18:15 | 31.0 | 10.00 | 0 | 26.0 | 29.50 | 22.4 | 23.0 | 47.00 | 1.9 |
| 18:45 | 30.0 | 10.50 | 0 | 26.5 | 25.50 | 21.7 | 22.5 | 45.00 | 1.8 |
| 19:30 | 29.5 | 11.00 | 0 | 25.3 | 37.00 | 19.8 | 20.1 | 52.00 | 1.6 |
| 20:15 | 28.5 | 11.80 | 0 | 26.5 | 24.00 | 18.5 | 19.3 | 49.00 | 1.3 |
| 21:00 | 28.3 | 11.90 | 0 | 25.1 | 25.30 | 18.7 | 19.2 | 49.00 | 1.5 |
| Date | Time | T1 (°C) | ϕ1 (%) | V1 (m·s−1) | Tr (°C) | ϕr (%) | T2 (°C) | T6 (°C) | ϕ6 (%) | V6 (m·s−1) |
|---|---|---|---|---|---|---|---|---|---|---|
| 22 August | 17:15 | 32.0 | 7.00 | 0 | 27.0 | 24.70 | 22.0 | 22.4 | 39.60 | 1.7 |
| 22 August | 18:15 | 32.0 | 7.60 | 0 | 26.3 | 22.60 | 23.1 | 24.0 | 30.30 | 1.7 |
| 22 August | 19:15 | 31.0 | 8.80 | 0 | 27.5 | 19.00 | 21.6 | 23.0 | 44.00 | 1.8 |
| 22 August | 20:15 | 29.5 | 8.00 | 0 | 26.5 | 24.00 | 21.5 | 22.5 | 46.00 | 1.7 |
| 22 August | 21:15 | 29.4 | 8.90 | 0 | 25.3 | 28.90 | 21.5 | 23.0 | 43.00 | 1.9 |
| 22 August | 22:15 | 25.5 | 10.50 | 0 | 24.5 | 30.70 | 15.5 | 17.5 | 46.00 | 1.8 |
| 22 August | 23:15 | 24.8 | 13.00 | 0 | 22.0 | 31.50 | 15.0 | 16.0 | 58.00 | 1.8 |
| 23 August | 0:15 | 24.0 | 14.00 | 0 | 23.9 | 33.00 | 16.0 | 16.5 | 67.00 | 1.4 |
| 23 August | 1:15 | 21.0 | 14.40 | 0 | 22.0 | 38.00 | 13.0 | 14.0 | 65.00 | 1.5 |
| 23 August | 2:15 | 20.0 | 14.60 | 0 | 22.5 | 34.00 | 13.0 | 13.5 | 54.00 | 1.3 |
| 23 August | 3:15 | 19.0 | 15.00 | 0 | 22.5 | 24.00 | 12.2 | 13.0 | 55.00 | 1.8 |
| 23 August | 4:15 | 17.5 | 17.00 | 0 | 22.0 | 32.00 | 12.0 | 13.0 | 55.00 | 1.7 |
| 23 August | 5:15 | 17.3 | 17.00 | 0 | 22.5 | 33.00 | 11.5 | 12.2 | 60.00 | 1.8 |
| 23 August | 6:15 | 18.0 | 19.50 | 0 | 22.8 | 38.00 | 11.0 | 12.5 | 68.00 | 1.6 |
| 23 August | 7:15 | 20.1 | 19.60 | 0 | 23.0 | 35.00 | 12.2 | 13.0 | 61.00 | 1.7 |
| 23 August | 8:15 | 24.2 | 14.00 | 0 | 25.0 | 37.00 | 16.0 | 17.2 | 64.00 | 1.6 |
| 23 August | 9:15 | 31.3 | 11.60 | 0 | 25.0 | 36.70 | 18.5 | 19.2 | 59.40 | 1.8 |
| 23 August | 10:15 | 32.1 | 10.90 | 0 | 25.4 | 34.00 | 20.0 | 21.3 | 51.00 | 1.8 |
| 23 August | 11:15 | 32.6 | 10.80 | 0 | 25.5 | 29.00 | 20.1 | 22.5 | 49.00 | 1.7 |
| 23 August | 12:15 | 33.0 | 10.40 | 0 | 26.0 | 32.00 | 21.0 | 22.0 | 49.00 | 1.8 |
| 23 August | 13:15 | 35.0 | 9.70 | 0 | 25.8 | 33.00 | 21.5 | 22.1 | 49.00 | 1.8 |
| 23 August | 14:15 | 34.6 | 10.00 | 0 | 25.8 | 33.00 | 21.6 | 22.0 | 51.00 | 1.8 |
| 23 August | 15:15 | 33.0 | 10.40 | 0 | 26.0 | 32.00 | 21.0 | 22.0 | 49.00 | 1.8 |
| 23 August | 16:15 | 31.5 | 9.60 | 0 | 25.9 | 35.00 | 20.0 | 20.2 | 48.20 | 1.9 |
| 23 August | 17:15 | 30.4 | 9.60 | 0 | 25.8 | 30.40 | 20.0 | 21.4 | 43.50 | 1.6 |
| Parameter | Experimental Results | Analytical Results |
|---|---|---|
| Maximum air temperature (T6-max) | 24.6 °C | 23.9 °C |
| Minimum air temperature (T6-min) | 12.2 °C | 12.4 °C |
| Average air temperature (T6-ave) | 21.1 °C | 20.7 °C |
| Parameter | Experimental Results | Analytical Results |
|---|---|---|
| Maximum decrease in air temperature (∆Tmax) | 13.6 °C | 14.6 °C |
| Minimum decrease in air temperature (∆Tmin) | 3.0 °C | 2.9 °C |
| Average decrease in air temperature (∆Tave) | 9.2 °C | 10.0 °C |
| Parameter | Experimental Results | Analytical Results |
|---|---|---|
| Maximum exit velocity (V6-max) | 2.0 m·s−1 | 2.10 m·s−1 |
| Maximum volumetric flow rate | 0.120 m3·s−1 | 0.126 m3·s−1 |
| Minimum exit velocity (V6-min) | 1.0 m·s−1 | 1.02 m·s−1 |
| Minimum volumetric flow rate | 0.060 m3·s−1 | 0.061 m3·s−1 |
| Average exit velocity (V6-ave) | 1.7 m·s−1 | 1.74 m·s−1 |
| Average volumetric flow rate | 0.102 m3·s−1 | 0.104 m3·s−1 |
© 2017 by the authors. Licensee MDPI, Basel, Switzerland. This article is an open access article distributed under the terms and conditions of the Creative Commons Attribution (CC BY) license (http://creativecommons.org/licenses/by/4.0/).
Share and Cite
Khani, S.M.R.; Bahadori, M.N.; Dehghani-Sanij, A.; Nourbakhsh, A. Performance Evaluation of a Modular Design of Wind Tower with Wetted Surfaces. Energies 2017, 10, 845. https://doi.org/10.3390/en10070845
Khani SMR, Bahadori MN, Dehghani-Sanij A, Nourbakhsh A. Performance Evaluation of a Modular Design of Wind Tower with Wetted Surfaces. Energies. 2017; 10(7):845. https://doi.org/10.3390/en10070845
Chicago/Turabian StyleKhani, Sajad M.R., Mehdi N. Bahadori, Alireza Dehghani-Sanij, and Ahmad Nourbakhsh. 2017. "Performance Evaluation of a Modular Design of Wind Tower with Wetted Surfaces" Energies 10, no. 7: 845. https://doi.org/10.3390/en10070845