Optimization of a Solar-Driven Trigeneration System with Nanofluid-Based Parabolic Trough Collectors


Solar Energy Laboratory, Thermal Department, School of Mechanical Engineering, National Technical University of Athens, Zografou, Heroon Polytechniou 9, Athens 15780, Greece
*
Author to whom correspondence should be addressed.
Energies 2017, 10(7), 848; https://doi.org/10.3390/en10070848
Submission received: 18 May 2017
/
Revised: 21 June 2017
/
Accepted: 23 June 2017
/
Published: 25 June 2017
Abstract
:The objective of this work was to optimize and to evaluate a solar-driven trigeneration system which operates with nanofluid-based parabolic trough collectors. The trigeneration system includes an organic Rankine cycle (ORC) and an absorption heat pump operating with LiBr-H2O which is powered by the rejected heat of the ORC. Toluene, n-octane, Octamethyltrisiloxane (MDM) and cyclohexane are the examined working fluids in the ORC. The use of CuO and Al2O3 nanoparticles in the Syltherm 800 (base fluid) is investigated in the solar field loop. The analysis is performed with Engineering Equation Solver (EES) under steady state conditions in order to give the emphasis in the exergetic optimization of the system. Except for the different working fluid investigation, the system is optimized by examining three basic operating parameters in all the cases. The pressure in the turbine inlet, the temperature in the ORC condenser and the nanofluid concentration are the optimization variables. According to the final results, the combination of toluene in the ORC with the CuO nanofluid is the optimum choice. The global maximum exergetic efficiency is 24.66% with pressure ratio is equal to 0.7605, heat rejection temperature 113.7 °C and CuO concentration 4.35%.
1. Introduction
In recent years, a lot of research has been focused on the design of efficient and renewable energy technologies [1]. The main reasons for this trend are the fossil fuel depletion, the climate change, the increasing price of electricity and the increasing energy demand [2,3,4]. The use of renewable and sustainable energy sources, as solar energy, wind energy, geothermal energy, and biomass as well as the waste heat utilization are the main ways for facing the energy problems. Solar energy is one of the most abundant energy sources [5] and it can be converted either to heat with solar thermal collectors or to electricity with photovoltaic panels [6,7]. Thus, this energy source is the most easily exploited among the renewable energy sources [8].
Moreover, the design of innovative and high efficient systems is also a crucial issue which concentrates a lot of interest. Cogeneration, trigeneration and multi-generation systems are promising candidates for designing sustainable and high efficient energy systems. The basic idea in these systems is the exploitation of the possible rejected energy amounts in order to produce more useful energy outputs. One of the most usual techniques is the utilization of the rejected heat amounts in the condensers in order to produce useful heat or to feed bottoming energy systems.
Combining solar energy and poly-generation systems seem to be an ideal coupling which exploits an abundant renewable energy source a high efficiency technology. A critical issue in these systems is the kind of solar collector which can be selected. The use of concentrating technologies is the best choice in order to operate in medium or high-temperature levels and to achieve higher thermodynamic efficiencies. The parabolic trough collector (PTC) is the most mature technology among the concentrating solar thermal collectors [9] and it is more often selected than Fresnel reflectors, dish collectors and solar towers. In this direction, a lot of research has been focused on the performance improvement of PTCs in order to achieve higher thermal performance and to establish them as the most suitable technology for temperature up to 400 °C. The use of nanofluids, as working fluids inside the PTC, is an innovative way to increase the thermal performance [10]. Nanofluids are mixtures of usual heat transfer fluids, for example thermal oils, with metallic nanoparticles such as Cu, CuO, Al2O3, Fe, TiO2 and SiO2 [11].
In the literature, there are plenty of studies which examine polygeneration systems driven by solar energy technologies or/and other renewable energy sources. Khalid et al. [12] investigated the utilization of solar, geothermal and wind energy in a trigeneration system. Solar energy was used for feeding an organic Rankine cycle (ORC) for electricity production and an absorption chiller for cooling production. The rejected heat from the ORC, as well as geothermal energy, is fed to a heat pump for heating production. Moreover, there are wind turbines for electricity production and finally, the energetic and exergetic efficiencies of the system are found 46.1% and 7.3%, respectively. Al-Ali and Dincer [13] examined the exploitation of solar energy with PTCs and geothermal energy for electricity, cooling, space heating, hot water and industrial heat. The investigated system included ORCs, absorption chiller and heat exchangers. According to their results, the energetic performance of this system reached 78% and the exergetic one 36.6%. A similar configuration is examined by Suleman et al. [14], which includes wet products as useful outputs. This system performed 54.7% energetically and 76.4% exergetically.
Bicer and Dincer [15] investigated the utilization of photovoltaic panels in a system similar to the previous one. The energetic and exergetic efficiencies are found 11% and 28% respectively. Hassoun and Dincer [16] investigated a sole solar driven multi-generation system for electricity, fresh-hot water, seasonal heating and cooling production with final exergetic efficiency close to 14%. This system performed 14% exergetically and it included a system with ORC, absorption chiller, storage tanks and batteries. Al-Sulaiman et al. [17] examined various trigeneration systems and compared them. They examined SOFC (solid oxide fuel cell), biomass and solar energy with PTC (Parabolic trough Collector) for feeding an ORC with and an absorption chiller. The exergetic efficiency of the previous systems is found 37%, 28% and 17% respectively. Buonomano et al. [18] examined a small trigeneration plant supplied by geothermal and solar energies. This system includes ORC and the payback period was calculated at 7.6 years, a small value which indicates its sustainability.
The utilization of nanofluids in solar thermal systems is something that has been examined in recent years by a relatively small number of researchers. The basic idea is to use nanofluids in order to archive higher thermal efficiency in the solar field and to make the total system more sustainable. Alashkar and Gadalla [19] investigated the use of nanofluids in PTC which drive an ORC. Three different nanoparticles (Cu, Al2O3 and SWCNT) were tested in Therminol and in Syltherm. They finally found that the Cu nanoparticle to be the best candidate for both thermal oils. More specifically, the optimum concentration of Cu is found to be 3% in the Therminol and 5% in Syltherm. Toghyani et al. [20] investigated the use of CuO, SiO2, TiO2 and Al2O3 nanoparticles in thermal oil as working fluids in PTCs which feed a water/steam Rankine cycle. They found that CuO is the best candidate with an optimum concentration equal to 4.28%. Boyaghchi et al. [21,22] examined the use of CuO/water nanofluid in solar thermal collector which operates in a trigeneration system. This system produces cooling, heating and power and exploits solar energy, geothermal energy while there is also an auxiliary heat source. According to their results, R134a is the best candidate as working fluid in the ORC.
As it is obvious from the preceding literature review, a great number of configurations have been examined in order for a high efficient system to be designed. In this study, a solar driven trigeneration system is analyzed parametrically and it is optimized. Parabolic trough collectors are selected to be used, as the most mature and widespread concentrating technology. Nanofluids are selected to be examined with CuO and Al2O3 inside the Syltherm 800. The trigeneration system includes an ORC and an absorption chiller which is fed by the ORC condenser heat. The absorption chiller acts as a heat pump and produces cooling and heating, while it operates with LiBr-H2O as working pair. Four different working fluids are investigated in the ORC; toluene, n-octane, MDM (Octamethyltrisiloxane) and cyclohexane. In this study, three system parameters are mainly examined in order to determine their optimum values. The heat rejection temperature of the ORC, the pressure ratio in the ORC (pressure in the turbine inlet to the critical pressure) and the nanoparticle concentration are the examined design parameters. In the first part of this study, the system is examined parametrically, while in the second part the system is optimized exergetically for all the combinations between the working fluid in the PTCs and the organic fluid in the ORC. The analysis is performed with engineering equation solver (EES) under steady state conditions in order for the emphasis to be placed on the exergetic optimization of the system.
2. Materials and Methods
2.1. The Examined Configuration
In this subsection, the investigated system is presented in details. Figure 1 illustrates the examined configuration with all the needed energy and mass flow indicators. This system includes parabolic trough collectors which exploit the direct beam solar irradiation (Qsol,t). The Eurotrough PTC module [23,24] is selected as one of the most usual in studies with parabolic collectors. The working fluid is in the solar field loop is a nanofluid with Syltherm 800 as base fluid because this thermal oil can safely operate up to 400 °C under a relatively small pressure (~15 bar) [25]. CuO and Al2O3 in concentrations up to 6% are the examined nanoparticles. It is also important to state that the operation with pure Syltherm was also examined in order to perform suitable comparisons with the respective nanofluid cases. The total useful heat production (Qu,t) is transferred to the storage tank and it is stored as sensible energy. Inside the storage tank, there is pure Syltherm 800 which stores thermal energy and transfers it to the heat recovery system (HRS) of the ORC. More specifically, hot thermal oil from the upper part of the storage tank (Ts,in) goes to the heat recovery system (HRS) and it provides the needed heat input in the ORC (Qin). The cold thermal oil, after the HRS, has temperature equal to (Ts,out) and it is delivered in the down part of the storage tank.
The selected ORC is a regenerative cycle in order to achieve high electricity production. Four different organic working fluids are examined: toluene, n-octane, MDM and cyclohexane. In the heat recovery system, heat is transferred to the organic fluid and it becomes vapor. More specifically, subcooled organic fluid in a liquid phase (state point 3) enters the heat recovery system. In the first part of the HRS, which is called economizer (ECO), the subcooled liquid becomes saturated liquid of high pressure (state point 34). In the second part which is called evaporator (EVAP), the saturated liquid of high pressure becomes saturated steam of high pressure (state point 4). In the present system, there is no superheating and thus the produced saturated steam feeds the turbine. In the turbine, useful work is produced with the steam expansion and thus electricity is produced with the electrical generator (G). The outlet of the turbine (state point 5) is a low-pressure superheated vapor of high temperature. This steam is used in the recuperator in order the colder stream after the condenser to be warmed up, a fact that leads to lower energy input demand in the heat recovery system. More specifically, in the recuperator, the hot stream leaves this device (state point 6) and enters to the condenser where heat is rejected to the absorption heat pump under constant temperature level (Tcon). The saturated organic liquid (state point 1) becomes high-pressure subcooled liquid after the pump (state point 2) and this quantity is driven to the recuperator. In this device, the enthalpy of the inlet stream (state point 1) increases and the warmer stream (state point 3) enter the heat recovery system. It is important to state that the work consumption in the pump (Wp) is significant and it has to be taken into account.
The last device in this system is the absorption heat pump. This device is fed with the rejected heat of the ORC condenser (Qhr) which is provided to its generator. The absorption heat pump produces cooling load (Qe) in the evaporator, while the heating loads are produced in the condenser and in the absorber. These sub-devices (absorber and condenser) operate at 50 °C in order to supply the useful heat in a reasonable temperature level for space heating or domestic hot water production. The evaporator operates at 10 °C in order to supply cooling load. The working pair in this cycle is LiBr-H2O and the refrigerant is water/steam. A weak solution of low pressure (state point 1a) leaves the absorber and enters in the solution pump where its pressure is increased (state point 12a) with a relatively low electricity input which can be neglected [26,27] in the total system investigation. The next device in the system is the solution heat exchanger where the weak solution is warmed to state point 2a, while the strong solution from the generator (state point 4a) is cooled up to state point 45a. The strong solution after the solution heat exchanger continues into the throttling valve where its pressure is reduced isentalpically. The next step is the return of this low-pressure strong solution in the absorber, and so the absorption cycle closes. On the other hand, the produced steam from the generator (state point 3a) goes to the condenser where heat is rejected in the heating system and saturated water is produced (state point 6a). This liquid enters in the throttling valve and it loses pressure with its enthalpy to be conserved (state point 7a). The evaporator is the device where the cooling load is absorbed and the refrigerant becomes saturated steam (state point 8a) which goes to the absorber and the refrigeration cycle closes.
2.2. Working Fluids
2.2.1. Organic Fluids
In the ORC, four different organic fluids are examined. Toluene, n-octane, MDM and cyclohexane are the examined working fluids in this study. Table 1 lists the examined working fluids and their basic properties such as the critical temperature, the critical pressure and the molecular weight. Moreover, Figure 2 depicts the saturation lines of the examined organic fluids in T-s (temperature-specific entropy) figures. It is essential to state that these data are taken from EES libraries [28], as well as the data of Table 1 have taken from the same libraries. All the examined working fluids are dry fluids and they are common in similar studies with ORCs.
The most important parameter for all the working fluids is the critical temperature because it determines the maximum evaporating temperature level in the subcritical cycle. Fluids with critical temperature in the region close to 300 °C are selected to be examined because the heat source temperature levels of this study are close to this region. It is also essential to state that the maximum examined heat source temperatures in this study are close to 300–350 °C.
2.2.2. Nanofluids
In this study, two different nanoparticles (Al2O3 and CuO) are examined inside the base fluid (Syltherm 800, Dow Chemical Co., Midland, MI, USA). The thermal properties of these nanoparticles are given in Table 2 [30]. It is important to state that the thermal properties of Syltherm 800 have been taken by the EES libraries [25,28].
The thermal properties of the nanofluids can be calculated according to Equations (1)–(4), using the properties of the base fluid (bf) and of the nanoparticles (np). The density of the mixture is given by Equation (1) [31]:
The specific heat capacity according to Equation (2) [32]:
The thermal conductivity of the nanofluid is calculated according to the suggested equation by Yu and Choi [33]:
The parameter β is the ratio of the nanolayer thickness to the original particle radius and usually, this parameter is taken equal to 0.1 for calculating the thermal conductivity of the nanofluids [34].
The mixture viscosity is calculated according to Equation (4) [35]:
The thermal properties of the examined nanofluids are presented in Figure 3. In this figure, the specific heat capacity (Figure 3a), the density (Figure 3b), the thermal conductivity (Figure 3c) and the dynamic viscosity (Figure 3d) are given for various nanoparticle concentrations (φ). It is important to state that these thermal properties are given for temperature equal to 300 °C which is a usual operating temperature in this study.
It is obvious that higher concentration leads to higher density, thermal conductivity and dynamic viscosity while to lower specific heat capacity. The thermal conductivity and the dynamic viscosity are approximately the same for both the examined nanofluids. Moreover, it is important to state Al2O3 leads to higher specific heat capacity while CuO to higher density.
It is essential to comment on the higher thermal conductivity of the nanofluids compared to the pure thermal oil (φ = 0%). This observation proves that the utilization of metallic nanoparticles inside the base fluid leads to higher thermal conductivity and consequently to higher heat transfer coefficient inside the flow. This fact makes the absorber temperature lower and the thermal efficiency to be higher.
2.3. Mathematical Modeling
This subsection is devoted to describing the basic mathematical modeling of the examined system. The presented equations concern energy balances, index definitions and other useful modeling assumptions.
2.3.1. Solar Field Modeling
In Section 2.3.1, a detailed thermal modeling for the Eurotrough module is presented. These equations can be combined together and finally, the thermal efficiency of the solar collector can be calculated in every case. Parabolic trough collectors are imaging concentrating collectors with high concentration ratio and they exploit only the direct beam part of the incident solar irradiation [36]. Thus, the available solar energy is calculated as the product of the outer aperture (Aa) and the solar direct beam irradiation (Gb):
The outer absorber area is calculated according to Equation (6), using the outer absorber diameter (Dro) and the length (L) of the evacuated tube. The inner absorber area, as well as the cover areas (inner and outer), can be calculated with similar formulas as Equation (6):
The useful energy that the heat transfer fluid gains are able to be calculated according to the energy balance of its volume, as it is given in Equation (7). It is important to state that this quantity represents the useful heat of one module of the total system. The specific heat capacity (cp) corresponds to the working fluid of the solar collector which is nanofluid in the majority of the cases and pure thermal oil in only some cases:
It is useful to state that the mass flow rate (m) is calculated as the product of the fluid density (ρ) and the volumetric flow rate (V):
The most important index for the evaluation of the solar collector is the thermal efficiency (ηth). This parameter is calculated as the ratio of the useful energy to the available solar energy:
If the solar collector modules are connected in parallel connection, as in the present study, then the thermal efficiency of one module is the same for the entire collector field [37]. So, the total useful energy of the collector field is calculated as:
For “N” PTC modules, the total available solar irradiation (Qsol,t) is calculated as:
The thermal losses of the absorber (Qloss), for one module, are radiation losses, as Equation (12) shows. It is important to state that in the evacuated tube collectors the heat convection losses are neglected due to the vacuum between absorber and cover [9]:
In steady-state conditions, as in the present modeling, the thermal losses of the absorber to the cover are equal to the thermal losses of the cover to the ambient. Cover losses thermal energy due to radiation and to convection, as Equation (14) shows [39]:
The sky temperature is calculated as [40]:
The heat convection coefficient between cover and ambient (hout) is estimated according to Equation (16) [39]:
The wind speed (Vwind) has a low impact on the results due to the evacuated tube. In this study, this parameter is selected to be 1 m/s which leads approximately to hout = 10 W/m2K [39].
The energy balance on the absorber is a basic equation in the presented analysis because this equation correlates the useful energy and the thermal losses, as Equation (17) indicates. More specifically, this equation shows that the absorbed solar energy (Qs·ηopt) is separated to useful heat and to thermal losses:
The optical efficiency (ηopt) is depended on the incidence angle. The indecent angle modifier K is used in order to calculate the optical efficiency of the collector for various incidents angles [41].
In order to correlate the temperature level on the absorber and the fluid operational temperature level, the heat transfer analysis inside the absorber tube has to be investigated. The next equation describes that heat transfer from the absorber to the working fluid.
The mean temperature of the working fluid is approximated as:
An important parameter of this modeling is the heat transfer coefficient (h) between absorber tube and fluid. The tube geometry, the flow rate and the properties of the fluid with the thermal conductivity play a significant role in the determination of the heat transfer coefficient. The following equation gives the way that the heat transfer coefficient can be calculated with the use of the dimensionless Nusselt number (Nu).
Generally, the Nusselt number is determined with experimental analysis and there are many literature equations about this number, for different operating conditions. Usually, some other dimensionless numbers are used in these equations. These numbers are presented below:
Reynolds number (Re) in circular tubes is given below:
Prandtl number (Pr) is presented below:
In this study, the Reynolds number is over 2300 and thus the flow is assumed to be turbulent. Different equations about the Nusselt number have been used for the different working fluids in the PTC.
For the pure thermal oil case, the Dittus-Boelter equation for turbulent flow is used [42]:
For Syltherm 800 and Al2O3, the Equation (25), which is suggested by Pak and Cho [43] is used:
For operation with CuO as nanoparticle inside the thermal oil, the equation of Xuan and Li is applied [44]:
2.3.2. Storage Tank and Heat Recovery System Modeling
In the storage tank of the system, heat is stored in the thermal oil. This storage is as sensible heat and it is based on the increase on the thermal oil temperature increase. In the present study, there is a heat exchanger in order to ensure the nanofluid is not mixed with the thermal oil. The heat exchanger is designed properly in order for high heat amounts to be transferred from the collector loop to the storage tank. The heat transfer from the collector loop to the storage tank is assumed to be equal to the useful energy production every time moment, a reasonable assumption for the steady state model. This assumption practically leads to zero thermal storage on the collector loop, something acceptable because of the low mass quantity in this loop tubes, so the following equation is used in this modeling:
The total heat transfer coefficient (UA)c-st is taken equal to 17 kW/m2K in this study. This parameter can be modified by designing a bigger or smaller heat exchanger, as well as by changing the shape of the heat exchanger area. It is also important to state that the storage tank is assumed to have uniform temperature level equal to Tst. The general energy balance on the storage tank is given below [37]:
In steady state conditions, the stored energy (Qstored) is equal to zero. For the definition of the thermal losses (Qloss), the following equation is used:
The heat transfer coefficient (Ust) includes radiation, convection and conduction losses and it is selected equal to 0.5 × 10⁻³ kW/m2K [4]; a value which corresponds to a well-insulated storage tank. The outer area of the storage tank (Ast) can be calculated according to [4] for a cylindrical storage tank. The volume of the storage tank is selected to be 15 m3. This parameter has a low impact on the system performance, especially in steady state conditions as in this work.
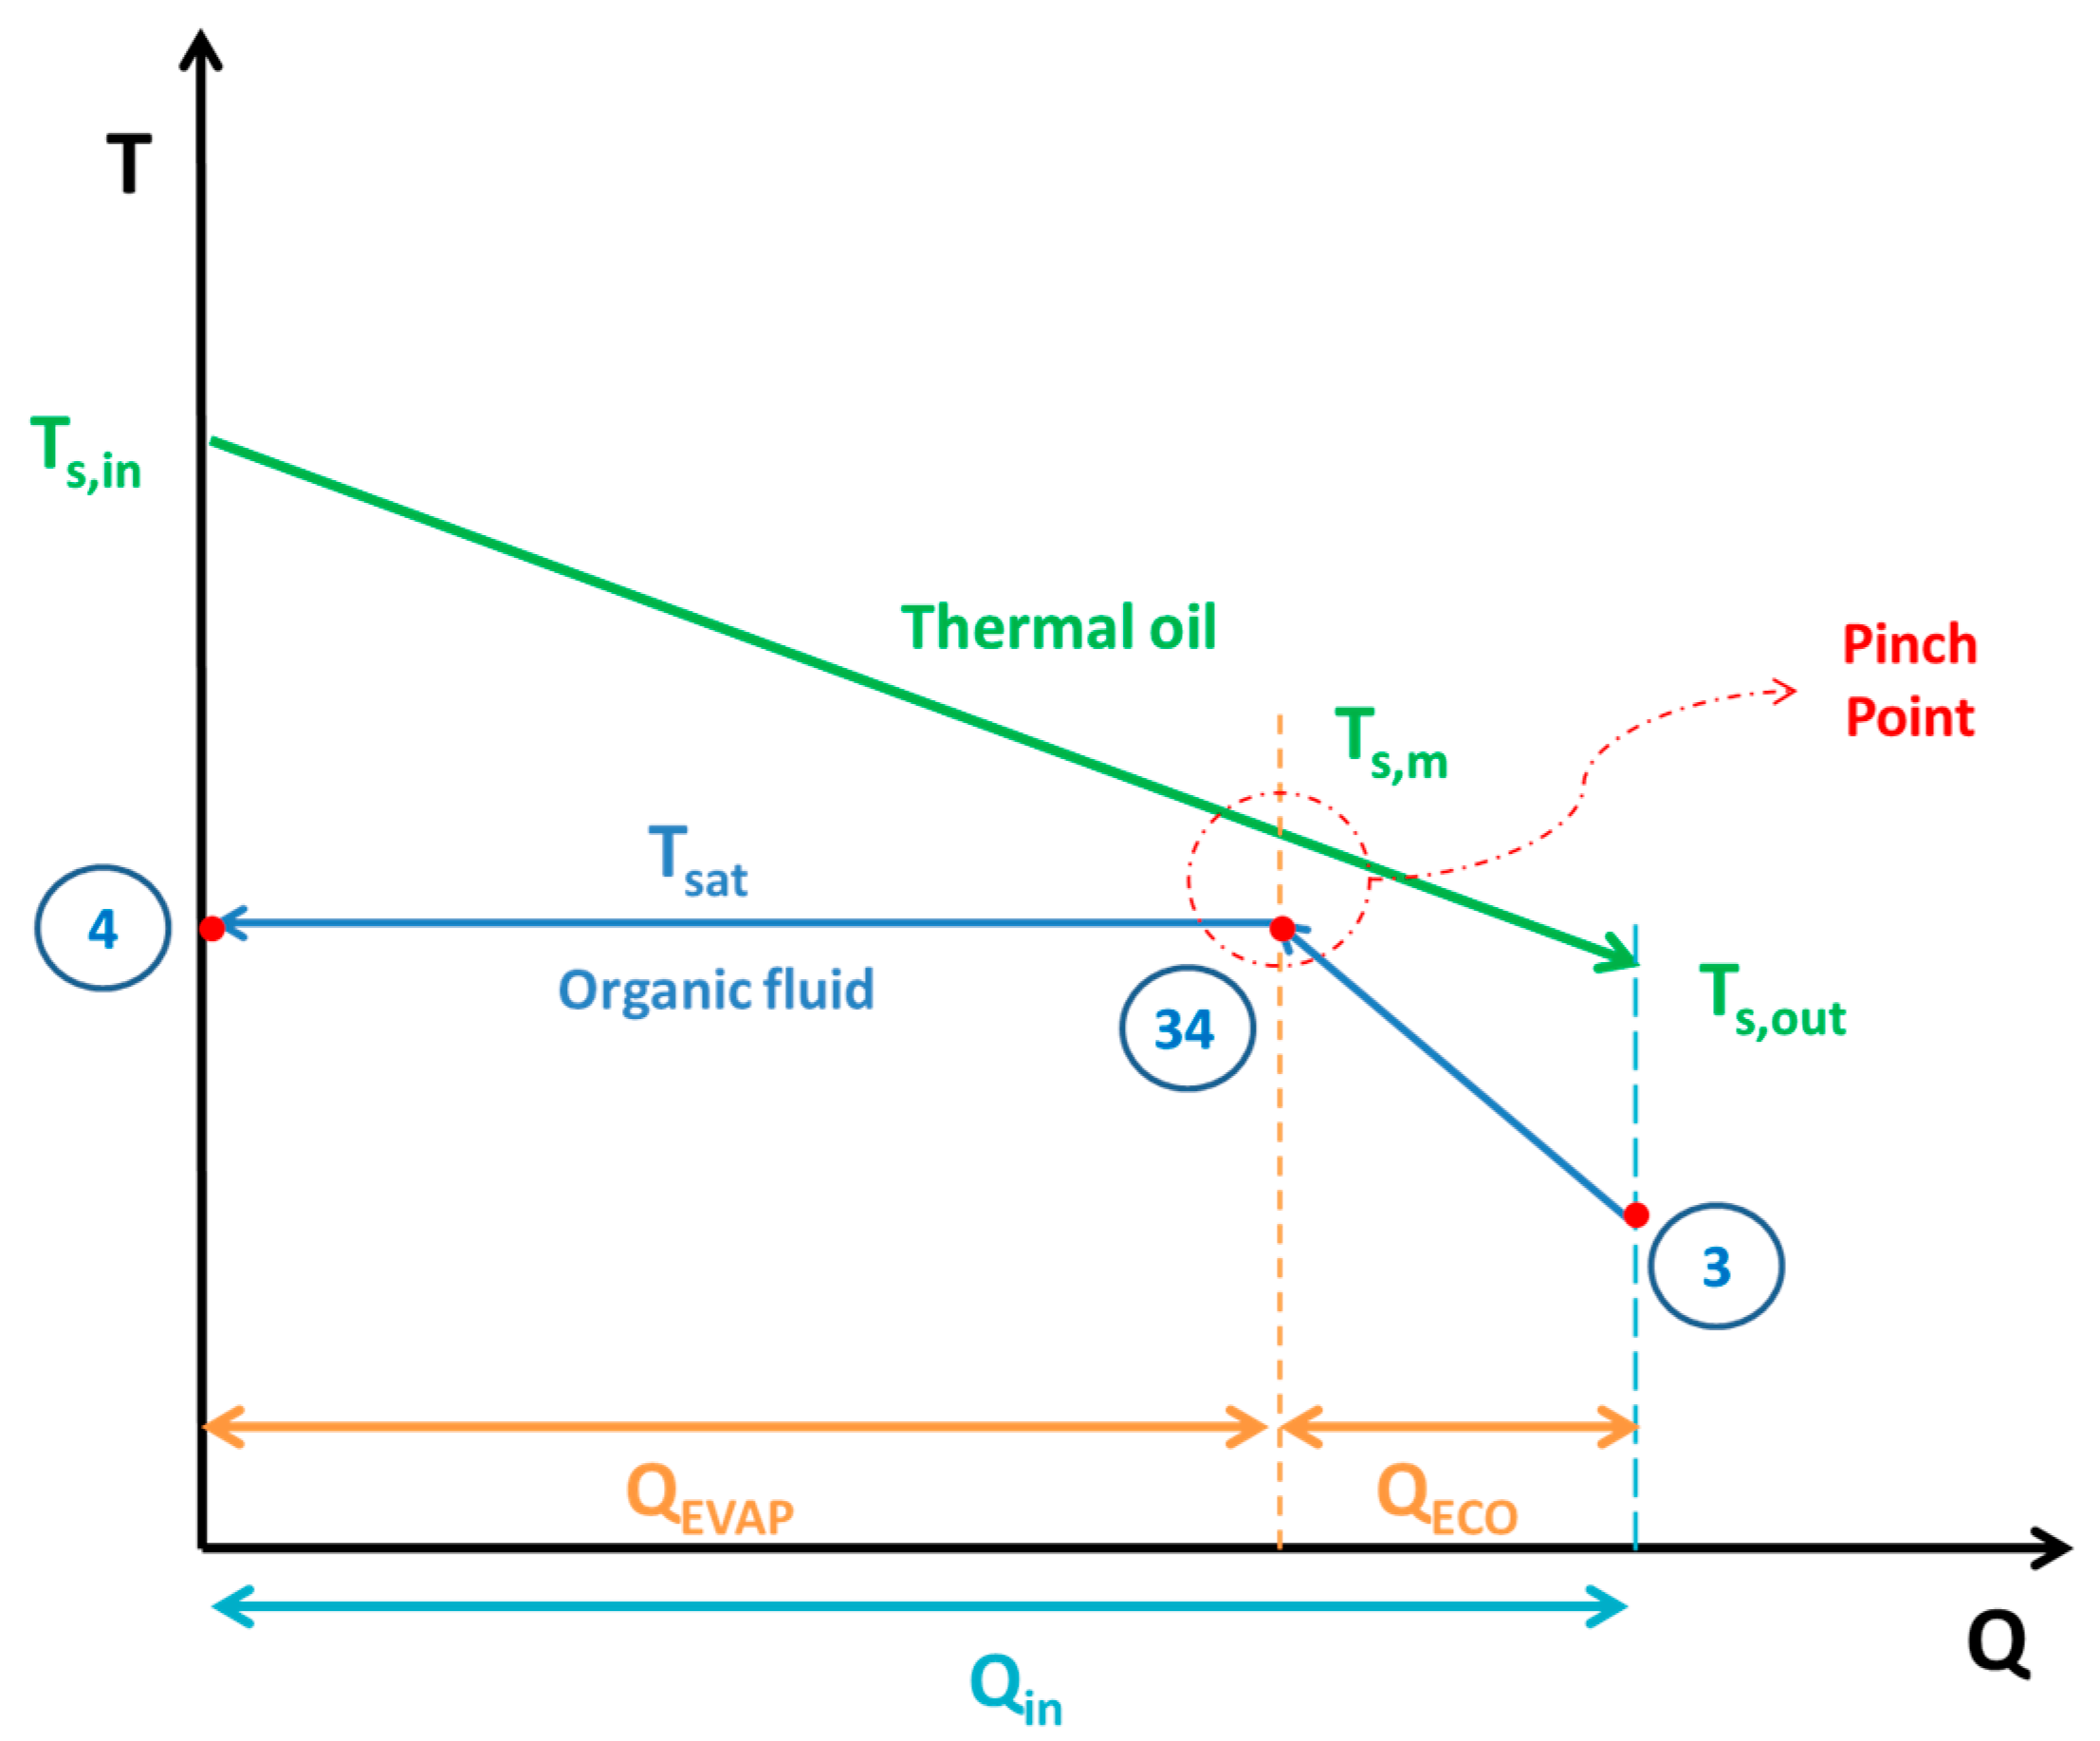
On the other side of the system, heat is transferred to the ORC. Hot thermal oil from the upper part of the storage tank with temperature (Ts,in) goes to the heat recovery system and heat (Qin) is transferred in the ORC. The colder thermal oil, in the outlet of the heat recovery system, has a temperature (Ts,out). Figure 4 depicts the general heat exchange process inside the storage tank. The pinch point is observed at the start of the evaporator and the temperature of the thermal oil at this point is calculated as:
At this study, the pinch point is taken equal to 10 °C, a typical value according to the literature [45].
2.3.3. ORC Modeling
The basic equations which describe the thermodynamic performance and operation of the ORC are given in this subsection. These equations express mainly the energy balances in the devices of the ORC. The expansion in the turbine is modeled with the isentropic efficiency which is defined as:
The state point 5 is has the same entropy as state point 4 and its pressure is equal to plow. This pressure level (plow) is the saturation pressure for heat rejection temperature level (Thr). The produced power (Pel) in the electrical generator is calculated according to Equation (32):
The power consumption (Wp) in the organic fluid heat pump is calculated as:
The net power production (Pnet) of the ORC is the difference between the power production in the electrical generator and the power consumption of the pump.
The high-pressure of the system is an important variable parameter in this study. The pressure ratio (PR) is a dimensionless parameter which expresses the high-pressure. This parameter is defined as the ratio of the high pressure to the critical pressure of the fluid. The maximum value of this parameter is selected equal to 0.9 for safety and stability reasons [46]:
The heat input (Qin) can be calculated by the energy balance on the HRS:
The rejected heat from the condenser to the absorption heat pump (Qhr) is given as:
2.3.4. Absorption Heat Pump Modeling
The simulation of the absorption heat pump is performed by using the energy balances in all the circuit devices and the demanded mass flow rate energy balances. The working pair in the absorption cycle is LiBr-H2O and the refrigerant is water/steam. The following Equations (38)–(41) describe the energy balances in the system devices (generator, evaporator, condenser and absorber):
Generator:
Evaporator:
Condenser:
Absorber:
The total heating (Qh) output of the system is produced both in the condenser and in the absorber:
The mass flow rate balances in the generator are presented by Equations (43)–(44). Equation (43) is the total mass flow rate balance and Equation (44) the mass flow rate energy balance for the LiBr substance. It has been supposed that the outlet of the generator is pure steam without LiBr.
The next important part of the absorption heat pump is the solution heat exchanger. In this device, two are the main equation for its modeling: the energy balance Equation (45) and the heat exchanger effectiveness definition Equation (46):
The throttling valves of the system have been assumed to be adiabatic, fact that makes the enthalpy to be preserved in the expansion in these devices:
Moreover, the work input in the solution pump is neglected as the enthalpy of the state point 12a is calculated as:
Another important point in the present modeling is about the temperature levels in the condenser and in the absorber. These devices reject heat which is utilized for heating proposes. Thus these devices operate under the same temperature levels, in this modeling:
Moreover, the temperature difference between the ORC condenser (heat rejection) and the generator is calculated as:
Also, it is essential to state that all the rejected heat from the ORC condenser is given to the generator of the absorption heat pump:
2.3.5. Definition of System Indexes
In this subsection, various indexes are determined in order to evaluate the performance of the examined system. These indexes concern the subsystems and all the examined system. The electricity efficiency of the ORC (ηorc) is calculated as:
The cooling performance of the absorption heat pump is calculated with the cooling coefficient of performance (COPcool):
The heating performance of the absorption heat pump is calculated with the heating coefficient of performance (COPheat):
The energetic efficiency of the system is the ratio of the useful energy outputs to the energy input in the system. The useful outputs are the net electricity production (Pnet), the cooling (Qe) and the heating (Qh) loads, while the solar energy is the energy inputs. So, the energetic efficiency (ηen) is calculated as [47]:
The energetic index can take values over 100% because of the existence of the absorption heat pump. More specifically, this device acts as a heat transformer and the heat output in the absorber and in the condenser have an adequate temperature in order to be exploited. Thus, the sum of all the useful energetic parameters is greater than the solar energy input in the system. This index is a simple index for evaluating the system performance. On the other hand, the exergetic efficiency (ηex) is a more suitable performance index which takes into consideration the quality of the useful output. This parameter is defined according to Equation (57) [48]:
The exergy of the solar irradiation (Esol,t) is estimated by the Petela model Equation (58). The temperature of the sun (Tsun) is taken equal to 5770 K, a representative value for the outer layer of the sun [49].
2.4. Methodology Followed
The objective of this study is to investigate the trigeneration system of Figure 1 and to optimize it properly. The optimization is performed by maximizing the exergetic efficiency of the system. The selection of this criterion is selected because the exergetic analysis evaluates all the energy/power flows with a suitable way. Different working fluids are examined in the ORC and in the PTCs. More specifically, toluene, n-octane, MDM and cyclohexane are the examined organic fluids in the ORC cycle. In the solar field loop, two different nanofluids are tested: Syltherm 800 with Al2O3 and Syltherm 800 with CuO. Moreover, the case of the pure Syltherm 800 is examined in order to perform suitable comparisons. For every combination of working fluid in the ORC and in the solar field, an optimization procedure is performed with three independent variables. The heat rejection temperature of the ORC (Thr), the pressure ratio in the ORC (PR) and the nanofluid concentration (φ) are the optimization parameters. Table 3 gives the default values of these parameters and the examined range. The examined range is great in order to examine many values of the parameters.
At this point, it is important to be more specific about the methodology followed. The equations of Section 2.2 and Section 2.3 are inserted in EES and the system is examined under steady state conditions. This strategy helps optimize the system exergetically and the emphasis is given in the suitable selection of the examined parameters. The developed model has been validated in previous studies. More specifically, the PTC modeling has been validated in [50], the ORC in [46] and the absorption heat pump in [4].
In the first part of this analysis (Section 3.1), the system is analyzed parametrically in order to show how the variable parameters influence its performance. Generally, the default values of Table 3 are used in this section and each time only one parameter is varied in the proper range. The next part (Section 3.2) includes the optimization of the system. For all the combinations of organic working fluids, an optimization procedure is performed by using the variables of Table 3. The “Conjugate Directions Method” or “Powell's method” is used which is supported by the utilized tool which is the f-chart one in EES [37]. The relative convergence tolerance is selected equal to 10−8 and a maximum number of iterations (function calls) is selected to 5000. The basic parameters of the system which have been kept constant in the simulations are given in Table 4.
The majority of these parameters have typical values in order to perform a representative study of real systems. For the solar collector, the data have been taken from [39,51]. It is essential to state that the solar irradiation has been kept constant during this study. This strategy is followed in order to place emphasis on the selection of the proper working fluids and of the proper system parameters. The selected value of 0.8 kW/m2 is a representative value in real applications and it is a reliable solution for sizing the system under realistic conditions.
3. Results
3.1. Parametric Analysis
In the parametric analysis, the variable parameters are examined separately in order to determine their impact on the system performance. The exergetic efficiency, the energetic efficiency, the electricity production and the cooling production are the main presented results in Section 3.1.1, Section 3.1.2 and Section 3.1.3.
3.1.1. The Impact of Pressure Ratio on the System Performance
In this subsection, the impact of the pressure ratio on the system performance is investigated. The following cases concern the operation with Syltherm 800-CuO in the solar field, while the concentration is equal to 3% and the heat rejection temperature equal to 120 °C (default values according to Table 3).
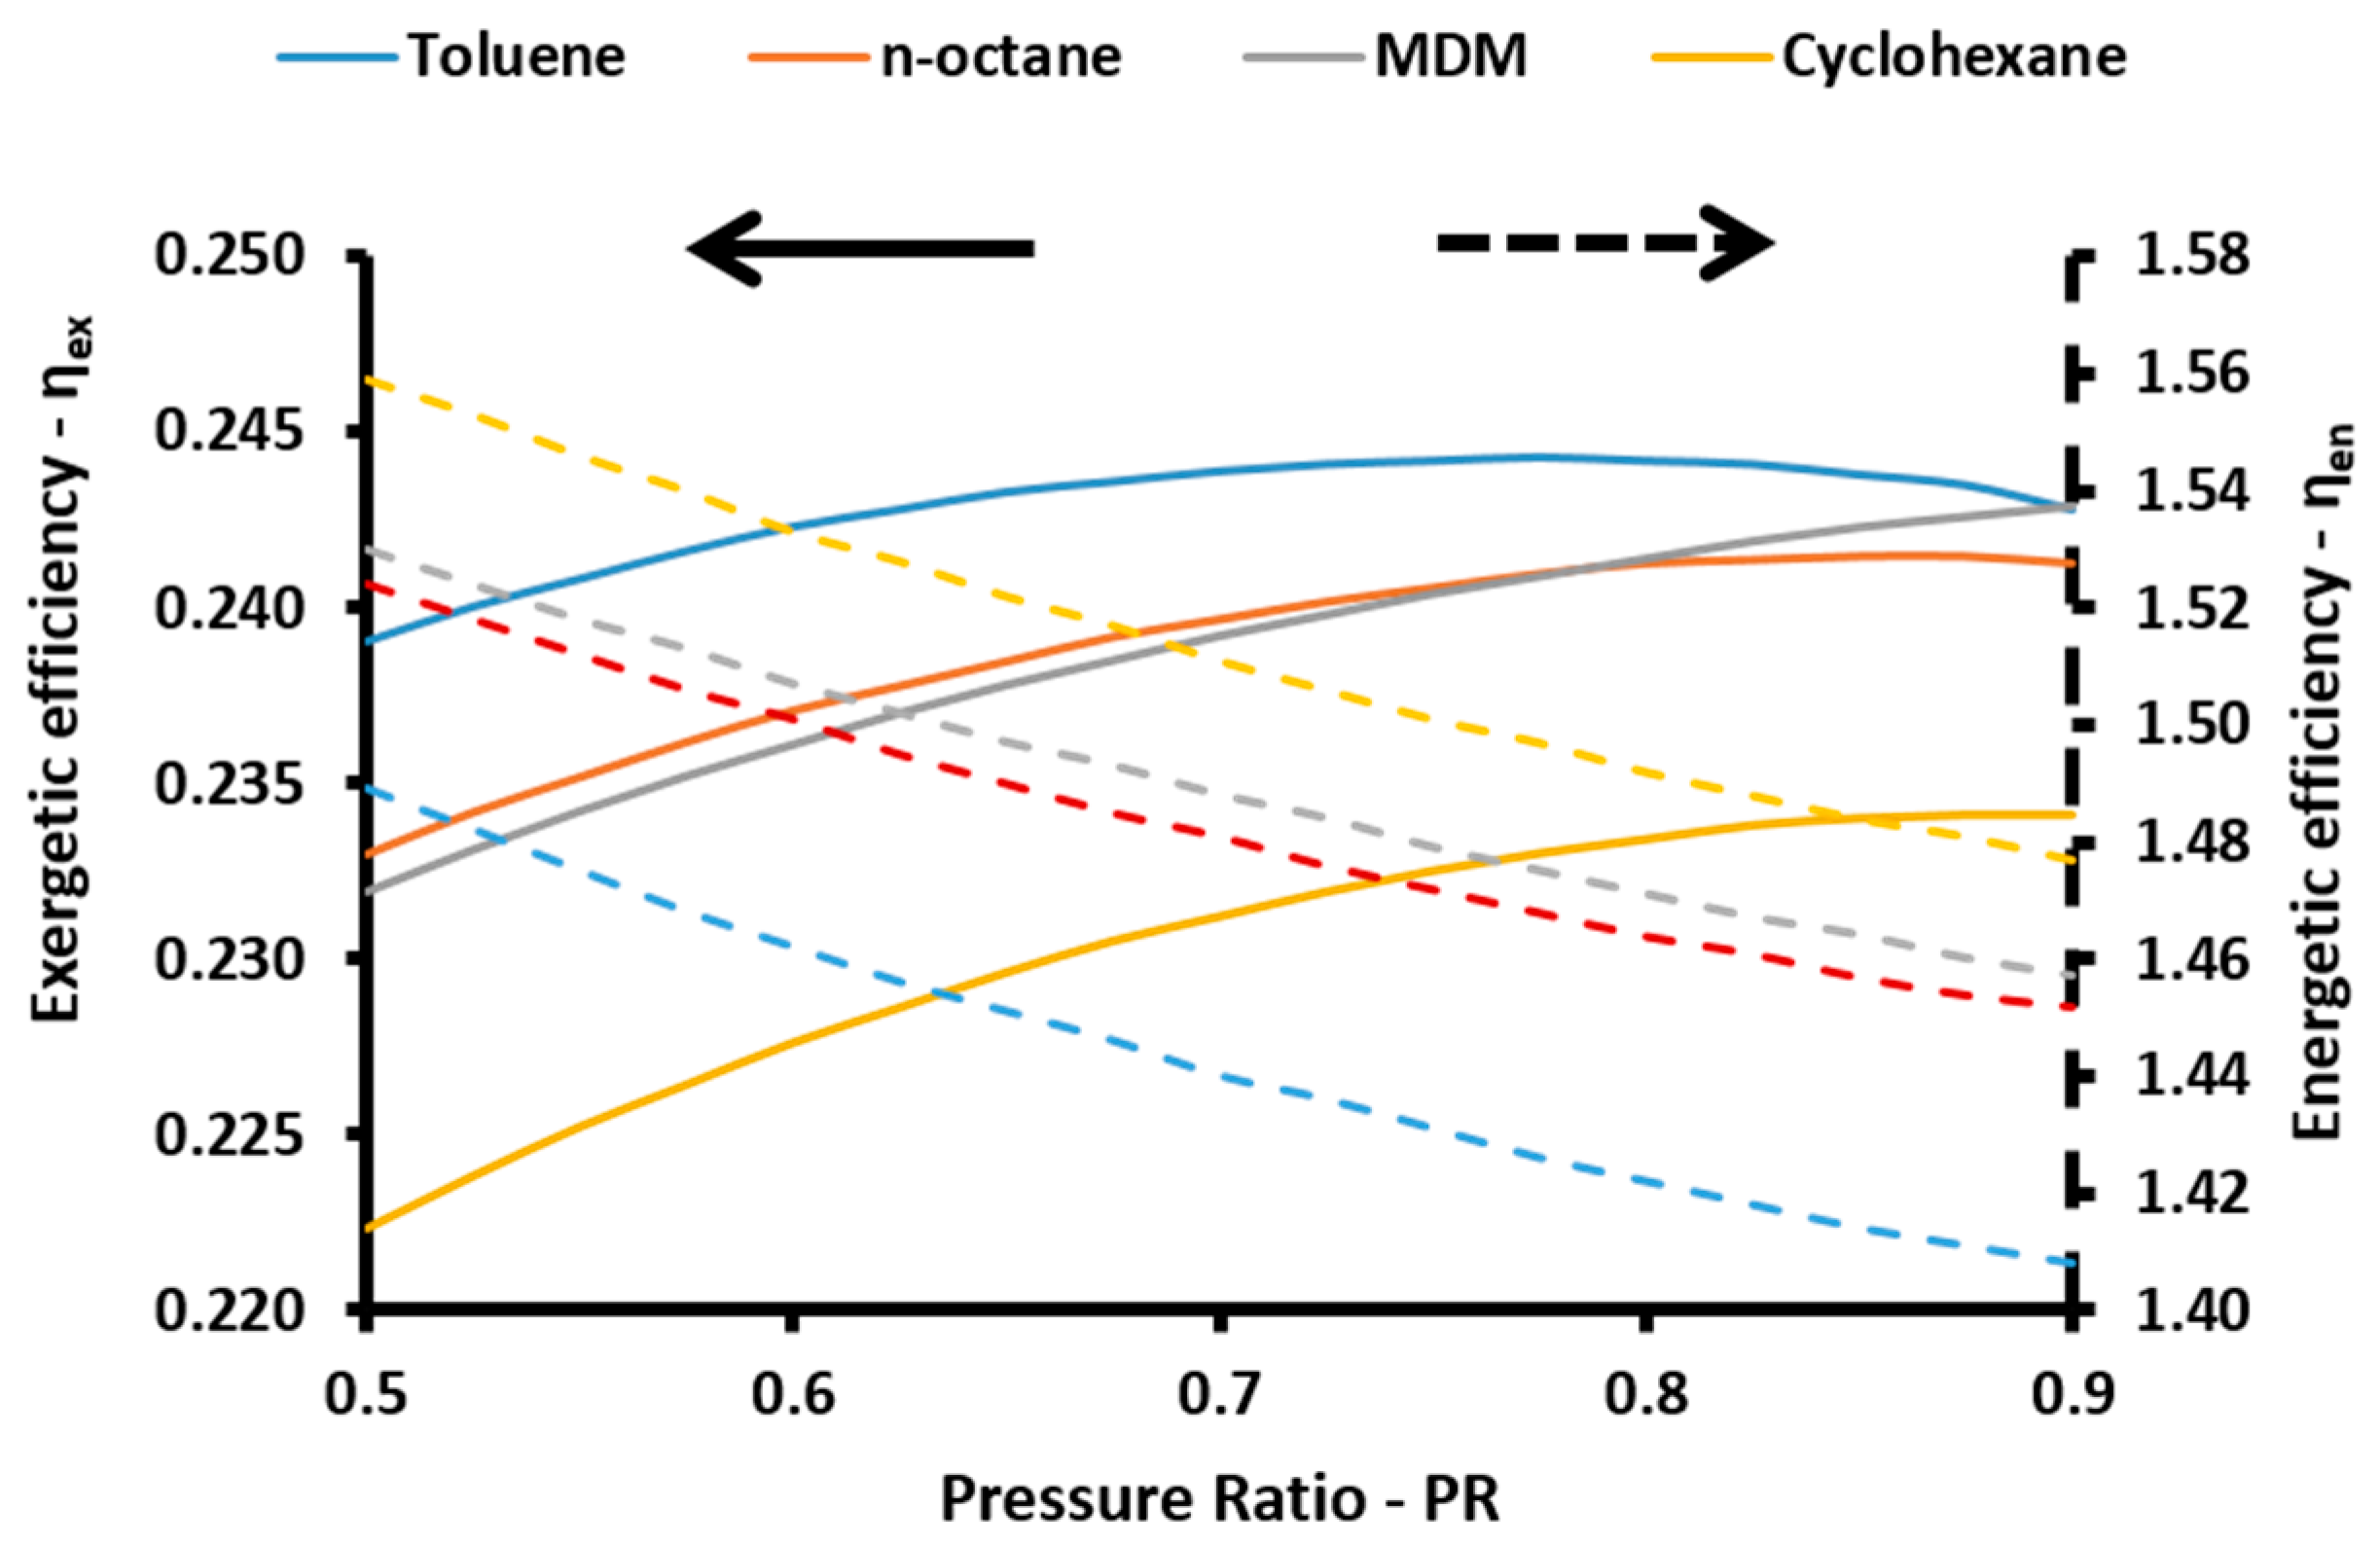
Figure 5 illustrates the exergetic and energetic efficiency of the system for the examined pressure ratios. The exergetic efficiency is getting higher for greater pressure ratios up to a point, where it is maximized, and after it is getting lower. This is observed for the cases with toluene, n-octane and cyclohexane, while the exergetic efficiency has only increasing trends with the pressure ratio for the case with MDM. The highest exergetic efficiency is observed for toluene and it is 24.43% for pressure ratio close to 0.85. MDM and n-octane have similar behavior with n-octane seen to perform better for pressure ratios up to 0.78 and after MDM is a better choice. The less efficient working fluid is cyclohexane.
These results are associated with the critical temperature level of the organic fluids, with the higher critical temperature leading to a higher exergetic performance. Generally, the exergetic efficiency is mainly influenced by the electricity production which needs high-pressure ratios and thus the optimum pressure ratios are relatively high.
The energetic efficiency is also given in this figure and it has a different behavior compared to the exergetic efficiency. Higher pressure ratio leads to lower energetic efficiency for all the cases. The energetic efficiency is mainly influenced by the heating and cooling production. A higher pressure ratio leads to higher electricity production and to lower heat rejection in the absorption heat pump. This fact makes to lower heat input in the absorption heat pump and consequently to lower heating and cooling production. This situation leads to the lower energetic efficiency with the increase of pressure ratio. The energetic efficiency generally varies from 1.40 to 1.56, values which are higher than 100%. This is a reasonable result which is based on the operation of a heat pump in the system. In other words, the reason for this result is based on the absorption heat pump which rejects heat amounts in the absorber and condenser which are useful for heating production. Cyclohexane is the most efficient organic working fluid energetically, followed by MDM, n-octane and toluene. It is obvious that the consequence of the energetic efficiency is approximately the reverse compared to the exergetic efficiency. This result is reasonable because the energetic efficiency is higher for greater cooling and heating products, while the exergetic efficiency is higher for greater electricity production. These energy quantities are competitive, higher electricity leads to lower heating-cooling production and vice-versa, and thus the energetic and exergetic efficiency present different behavior with the pressure ratio.
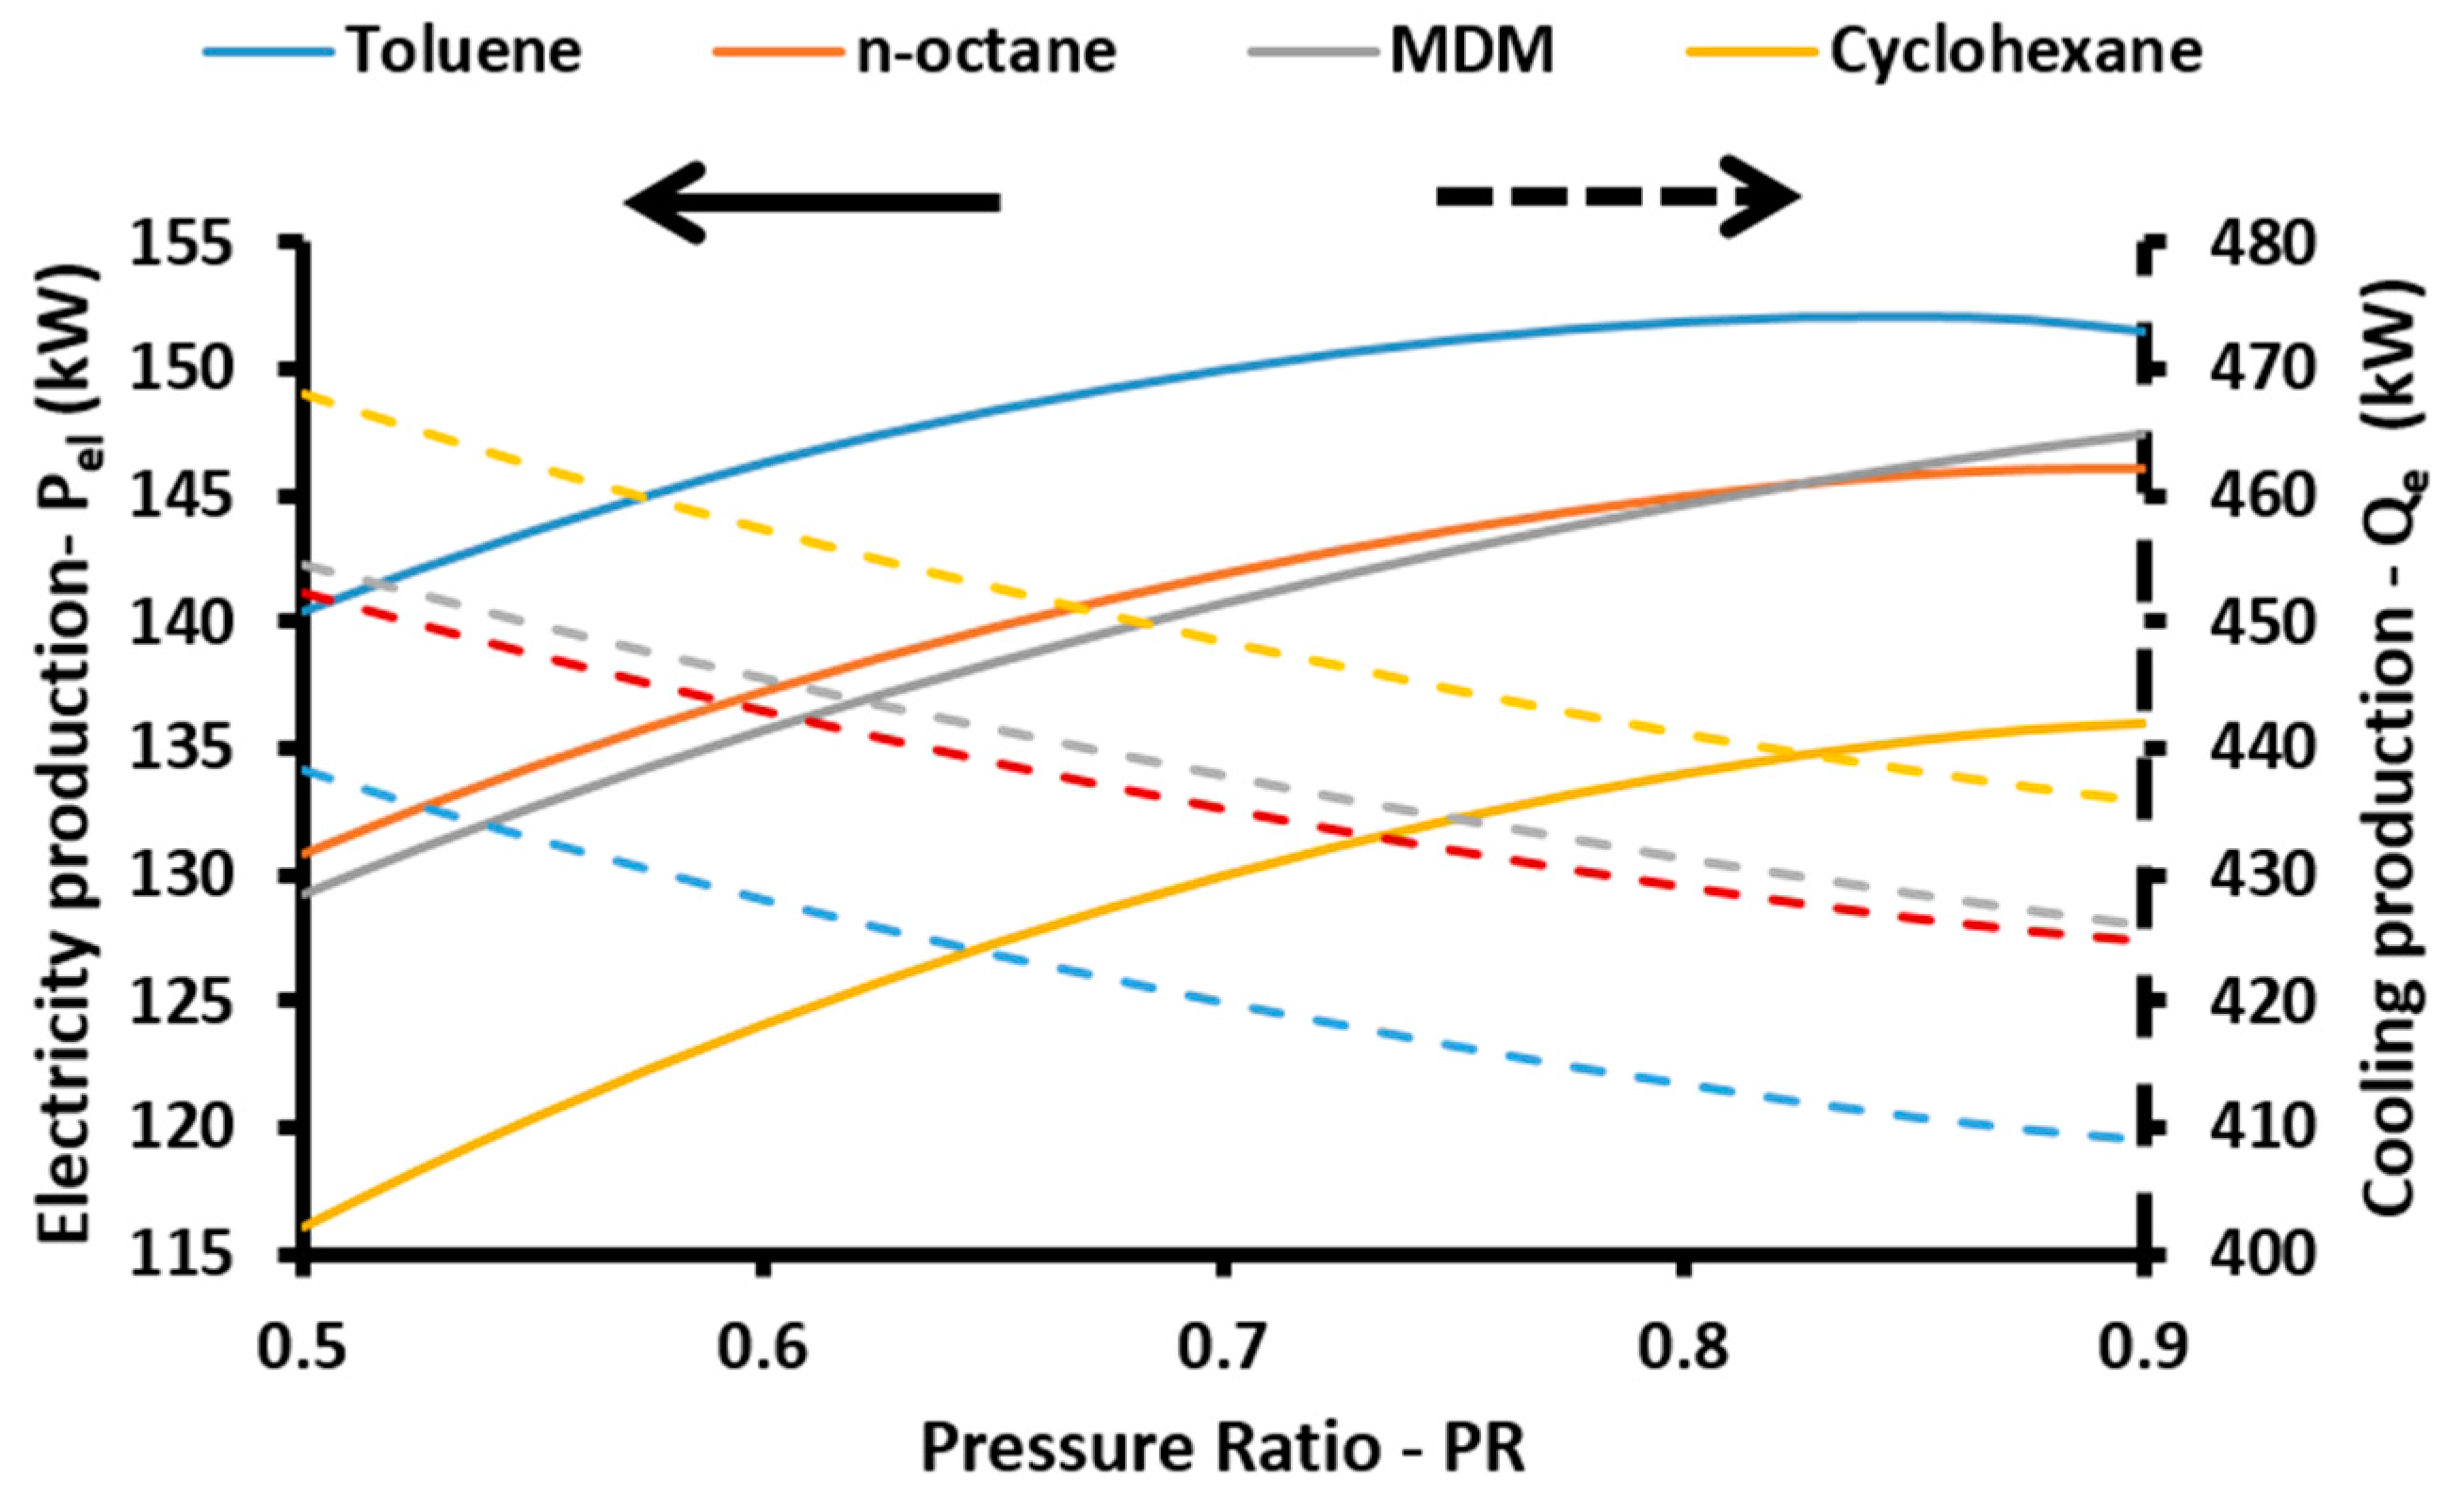
Figure 6 shows the electricity and the cooling production. The heating production is not given in this subsection because it has similar trends as the cooling production. Figure 6 seems to be the same depiction of Figure 5 with the electricity production and cooling production in Figure 6 being similar to the exergetic and energetic efficiencies of Figure 5, respectively. These results verify the previous arguments about the relationship between exergetic efficiency electricity production and energetic efficiency cooling production.
Higher electricity production is observed for the toluene case and it is maximized for a pressure ratio equal to 0.85 at 152.1 kW. The use of n-octane can lead up to 147.42 kW for 0.85 pressure ratio, while the use of MDM up to 146.17 kW for pressure ratio equal to 0.9. The operation with cyclohexane leads to lower electricity production of close to 136 kW for a pressure ratio roughly lower than 0.9. The cooling production is maximized for cyclohexane case and ranges from 465.2 kW to 439.9 kW. The variation region for MDM and n-octane is from 426 kW to 455 kW with MDM leading to a bit higher cooling production. The lowest cooling production is observed for toluene, from 409.1 kW to 438.2 kW.
3.1.2. The impact of Heat Rejection Temperature on the System Performance
In this subsection, the impact of the heat rejection temperature on the system performance is investigated. The following cases concern the operation with Syltherm 800-CuO in the solar field, while the concentration is equal to 3% and the heat pressure ratio equal to 0.7 (default values according to Table 3).
Figure 7 illustrates the exergetic and energetic efficiency of the system for various heat rejection temperatures and for all the examined organic fluids. First of all, it is important to explain the impact of the heat rejection temperature in the useful outputs. Higher heat rejection temperature leads to lower electricity production and to greater cooling and heating production. These facts maximize the exergetic efficiency for a heat rejection temperature equal to 113.7 °C for all the organic working fluids. Toluene is the most efficient working fluids, with maximum exergetic efficiency equal to 24.61%, while n-octane, MDM and cyclohexane follow with 24.22%, 24.17% and 23.38%, respectively. The energetic efficiency presents increasing trends with higher heat rejection temperature. After the limit of 115 °C (approximately), the increasing rate of energetic efficiency is getting lower and this result proves that higher heat rejection temperature has a small impact on the cooling and heating production. Generally, the energetic efficiency varies from 1.30 to 1.55, with cyclohexane shown to be the best working fluid energetically. MDM, n-octane and toluene follow and this consequence is the reverse compared to the exergetic analysis.
Figure 8 gives the electricity production and the cooling production for the respective cases. A higher heat rejection temperature leads to a linear reduction of the electricity production. Moreover, it leads to increase in cooling production, but the rate of increase is getting lower for heat rejection temperatures over 115 °C approximately. The shape of the curves for the cooling production in Figure 8 is similar with the one of the energetic efficiency curves of Figure 7. This result proves the direct relationship between these quantities. Figure 9 depicts the cooling and heating coefficient of performances for the absorption heat pump. It is obvious that the heating COP is greater than the cooling COP and their numerical difference is equal to 1. The trends of the COP curves (Figure 9) are similar to the cooling load curves (Figure 8) and energetic efficiency curves (Figure 7), as it has been commented before.
3.1.3. The Impact of Nanoparticle Concentration on the System Performance
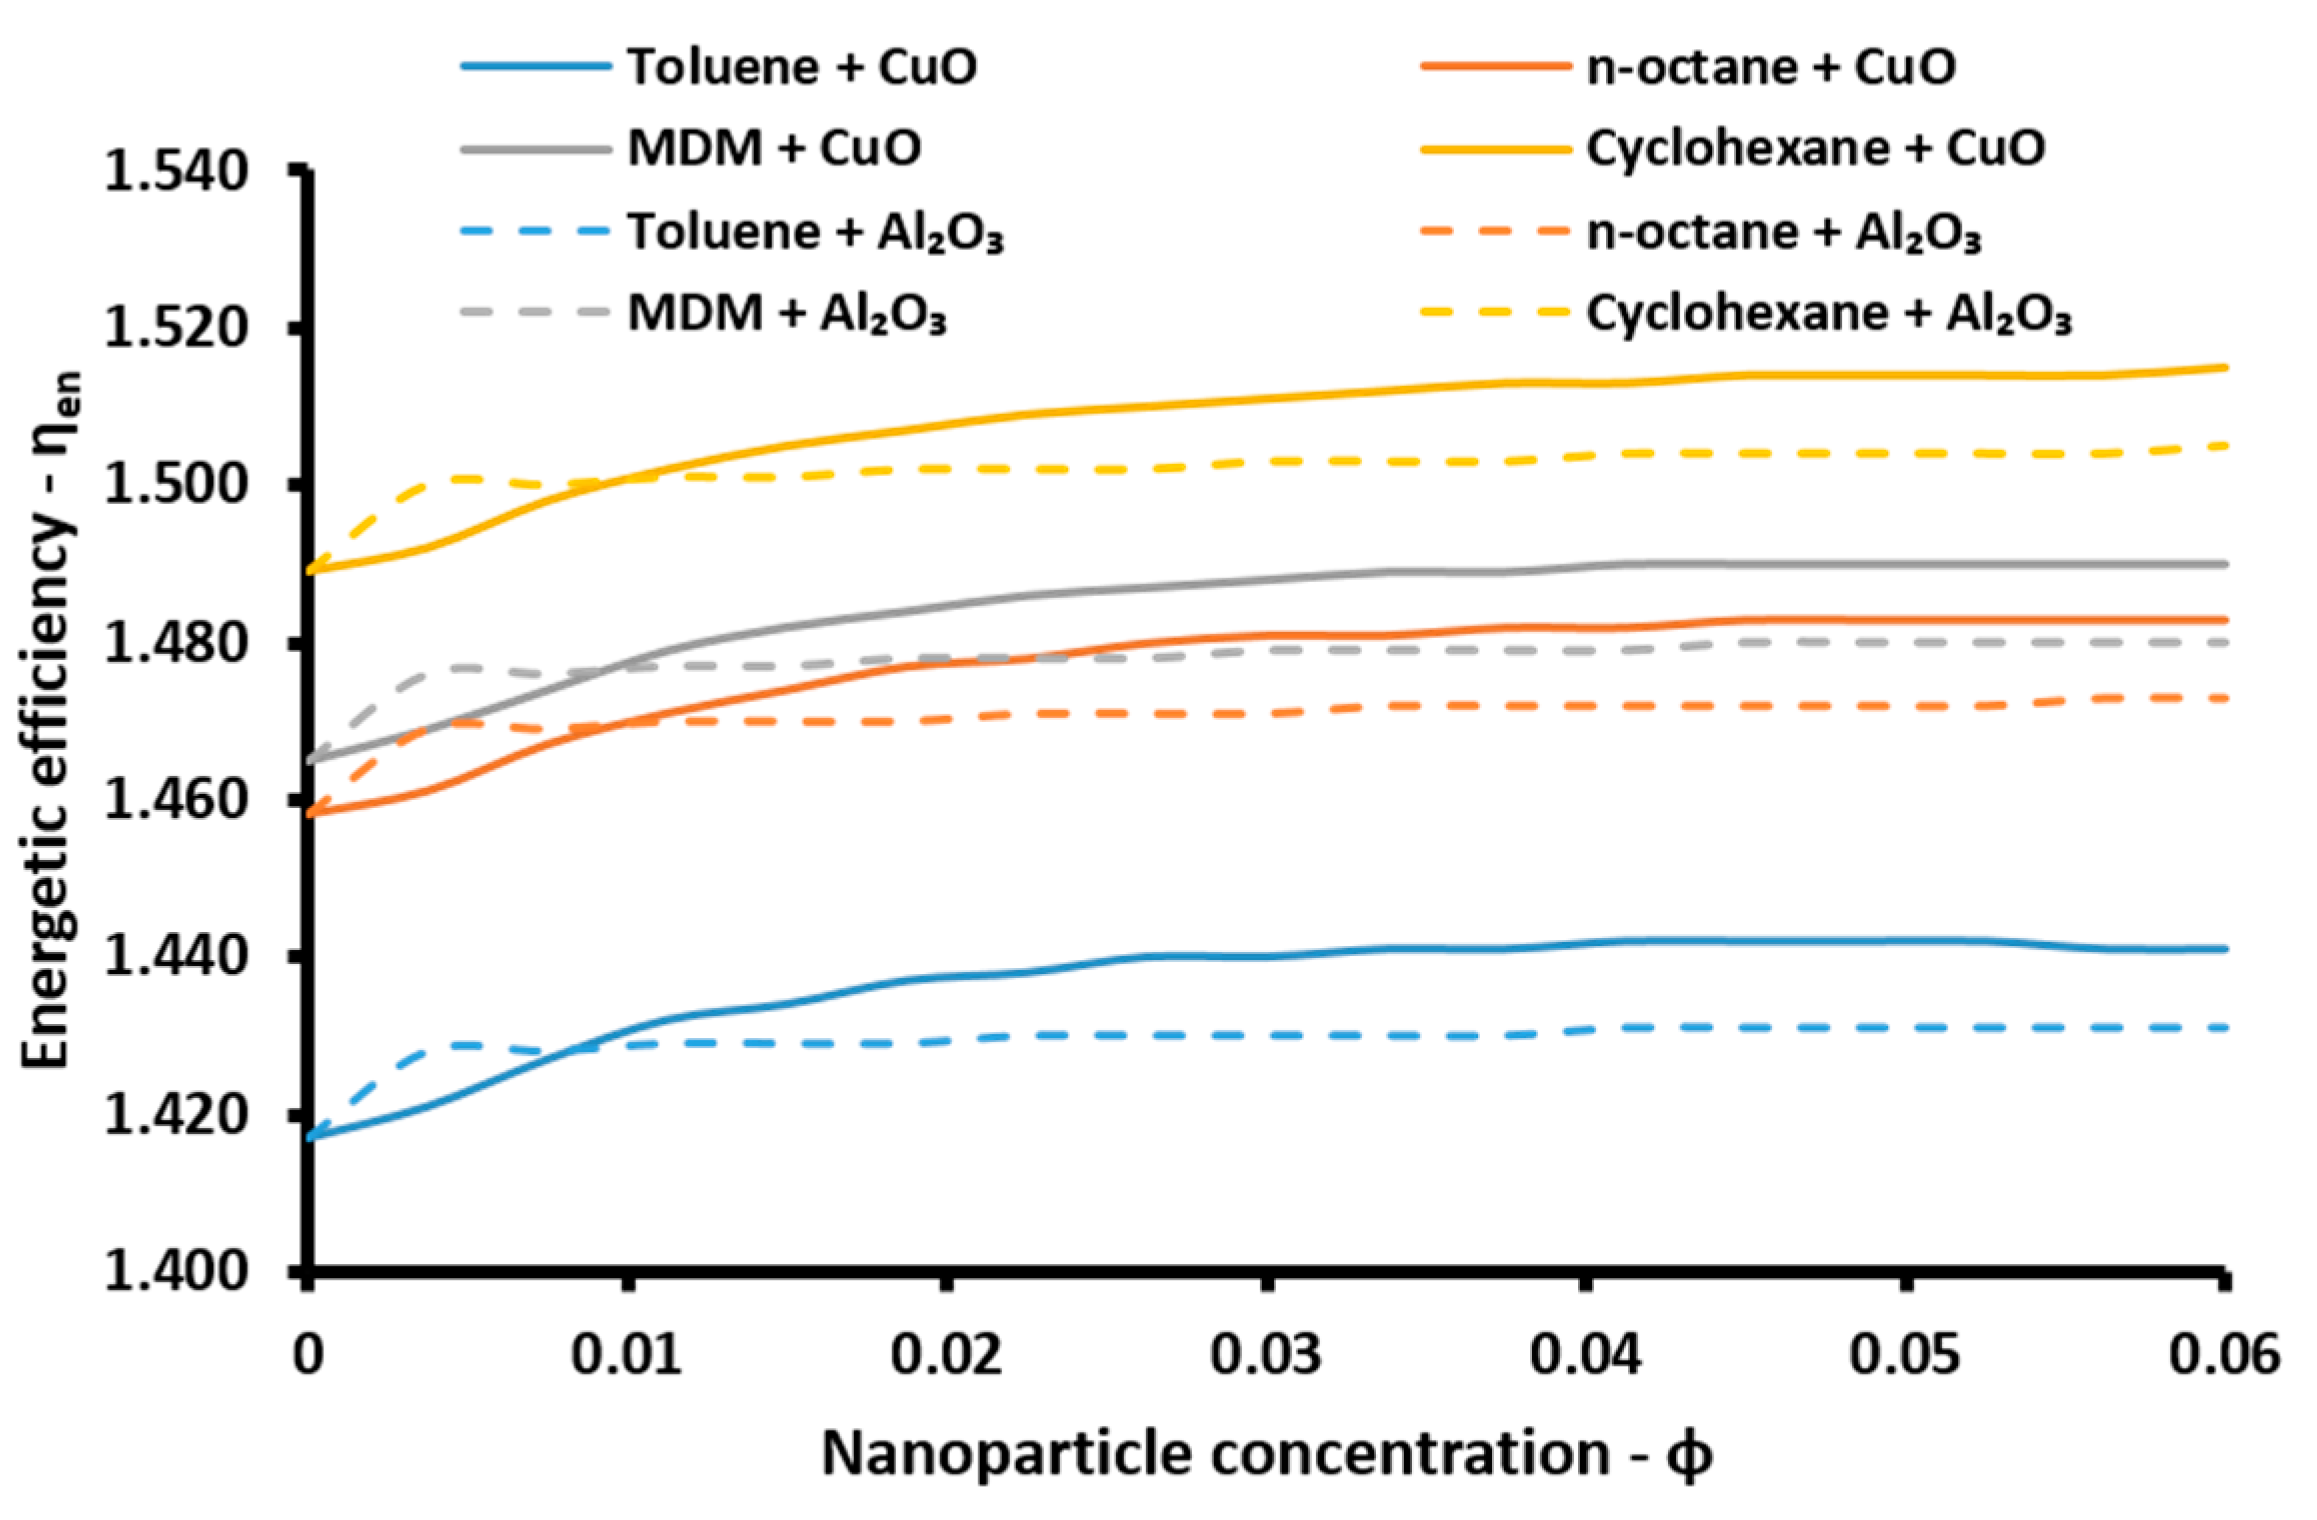
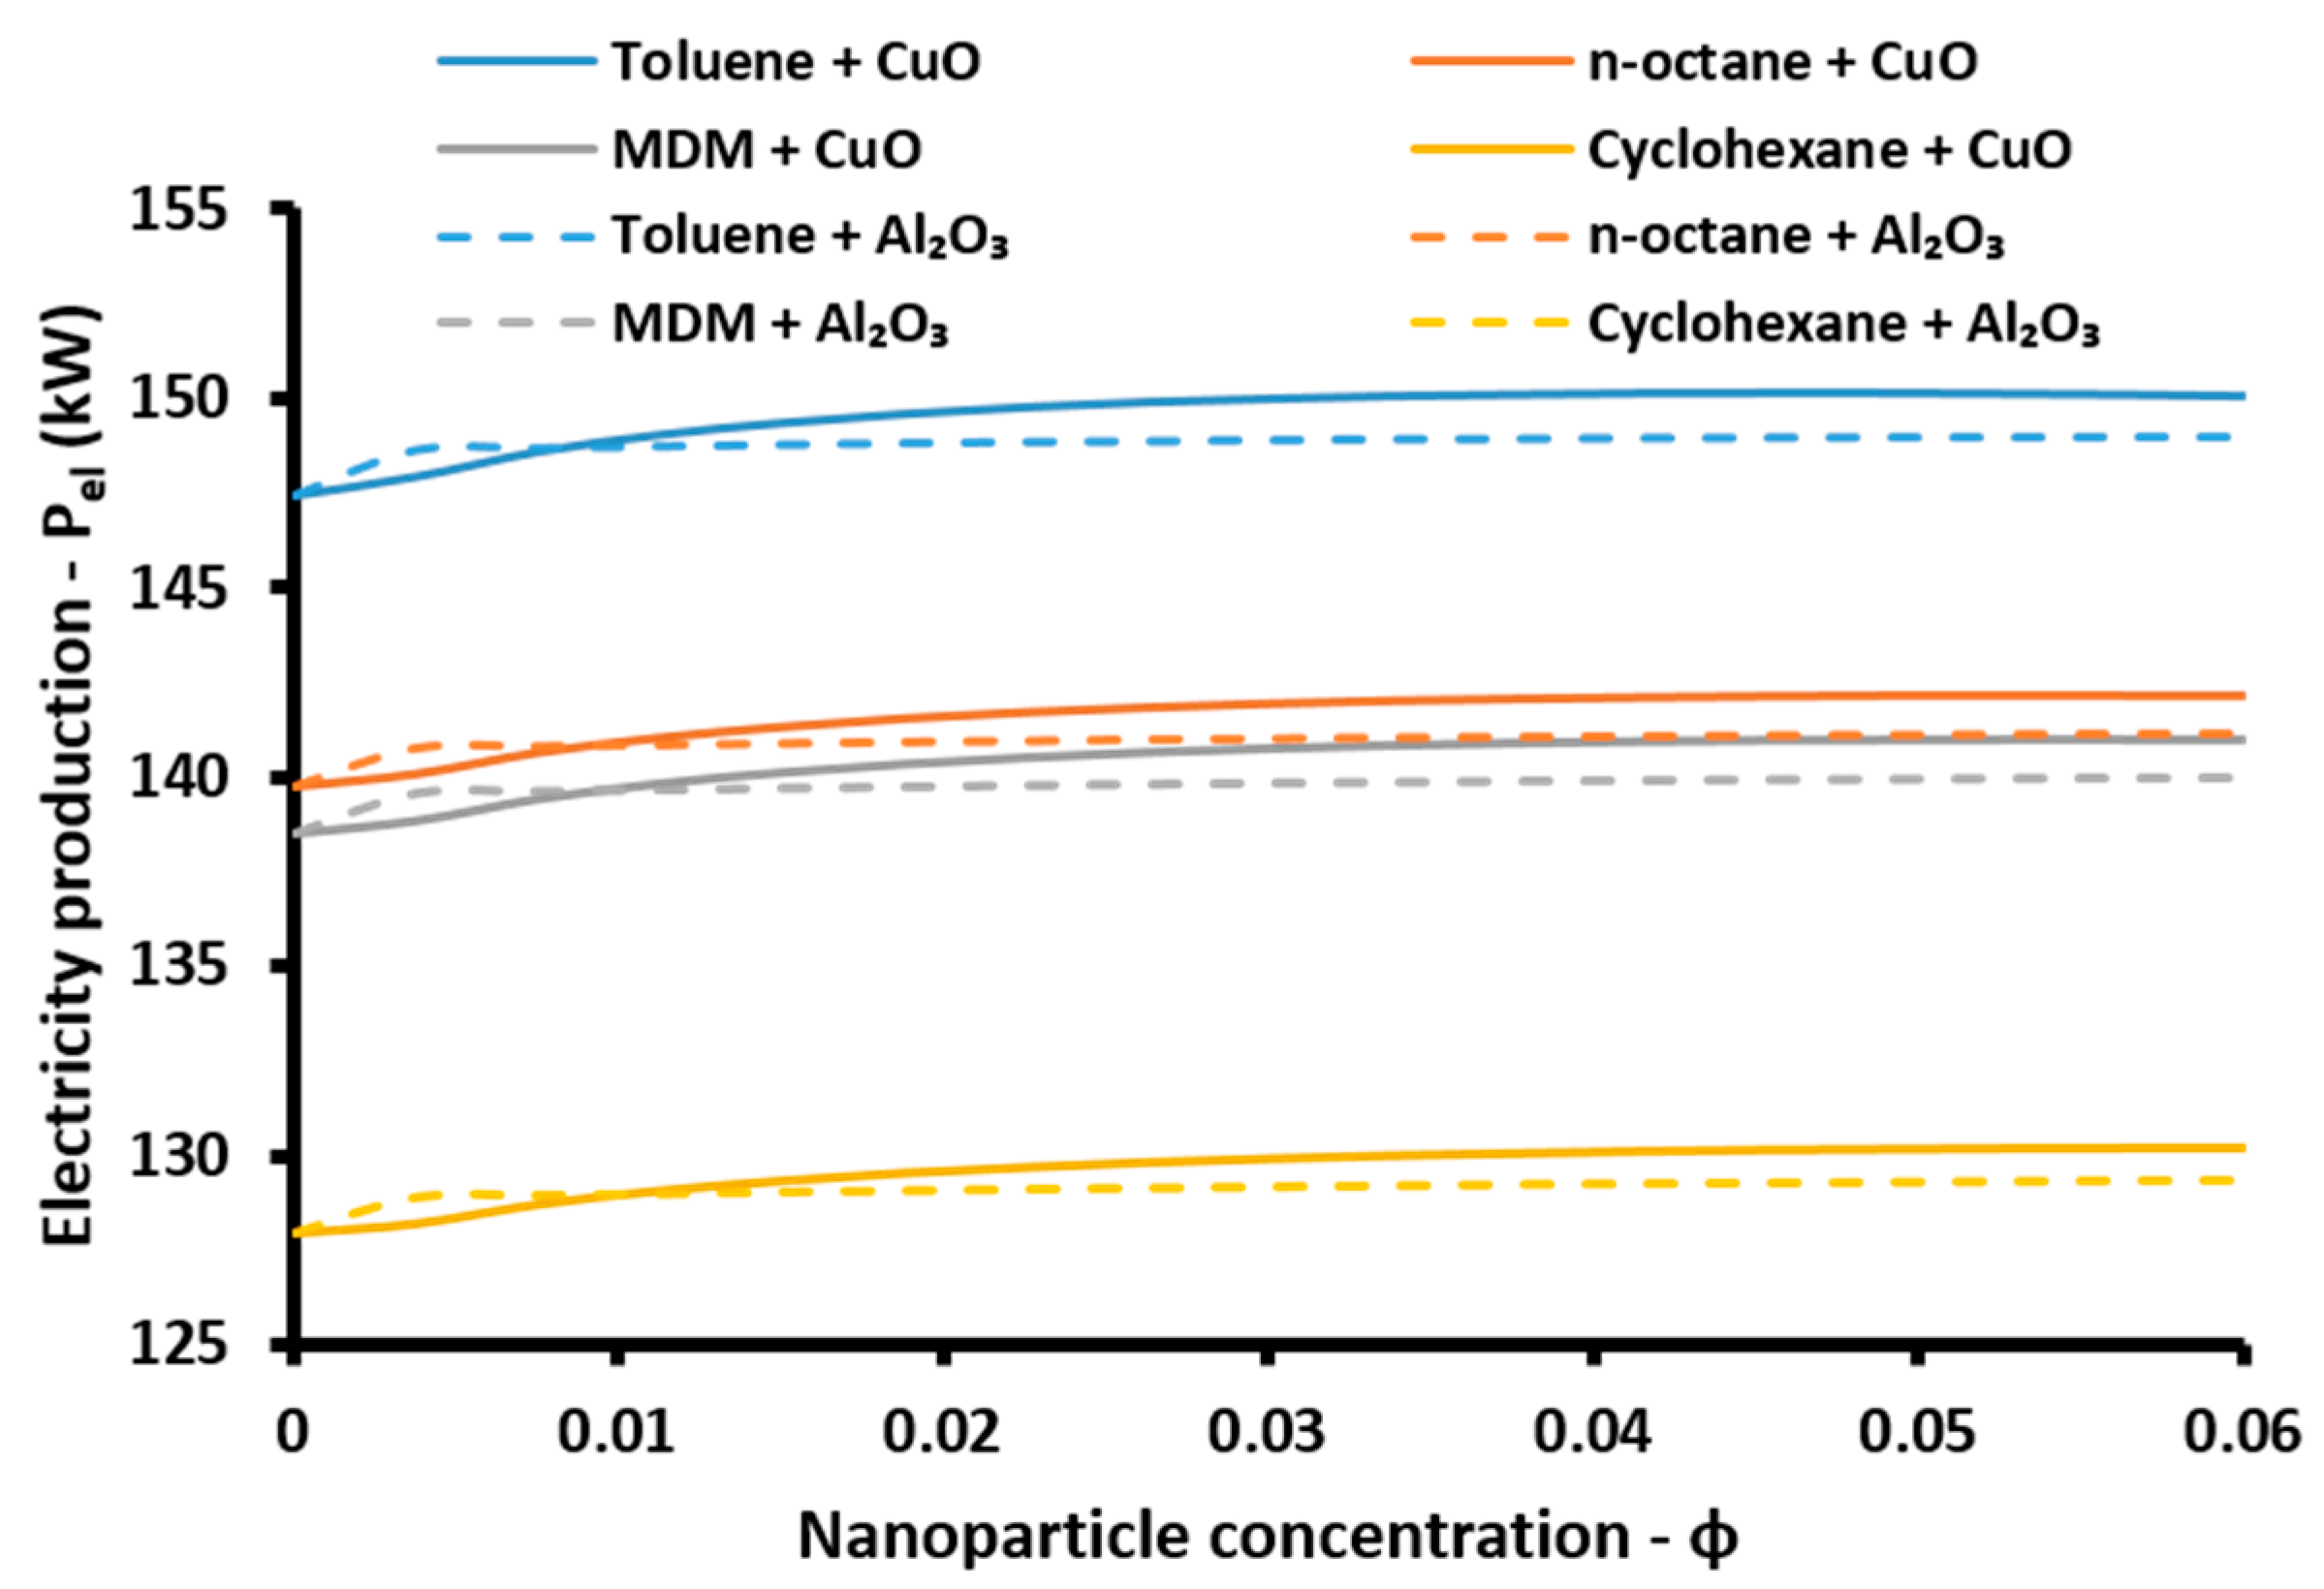
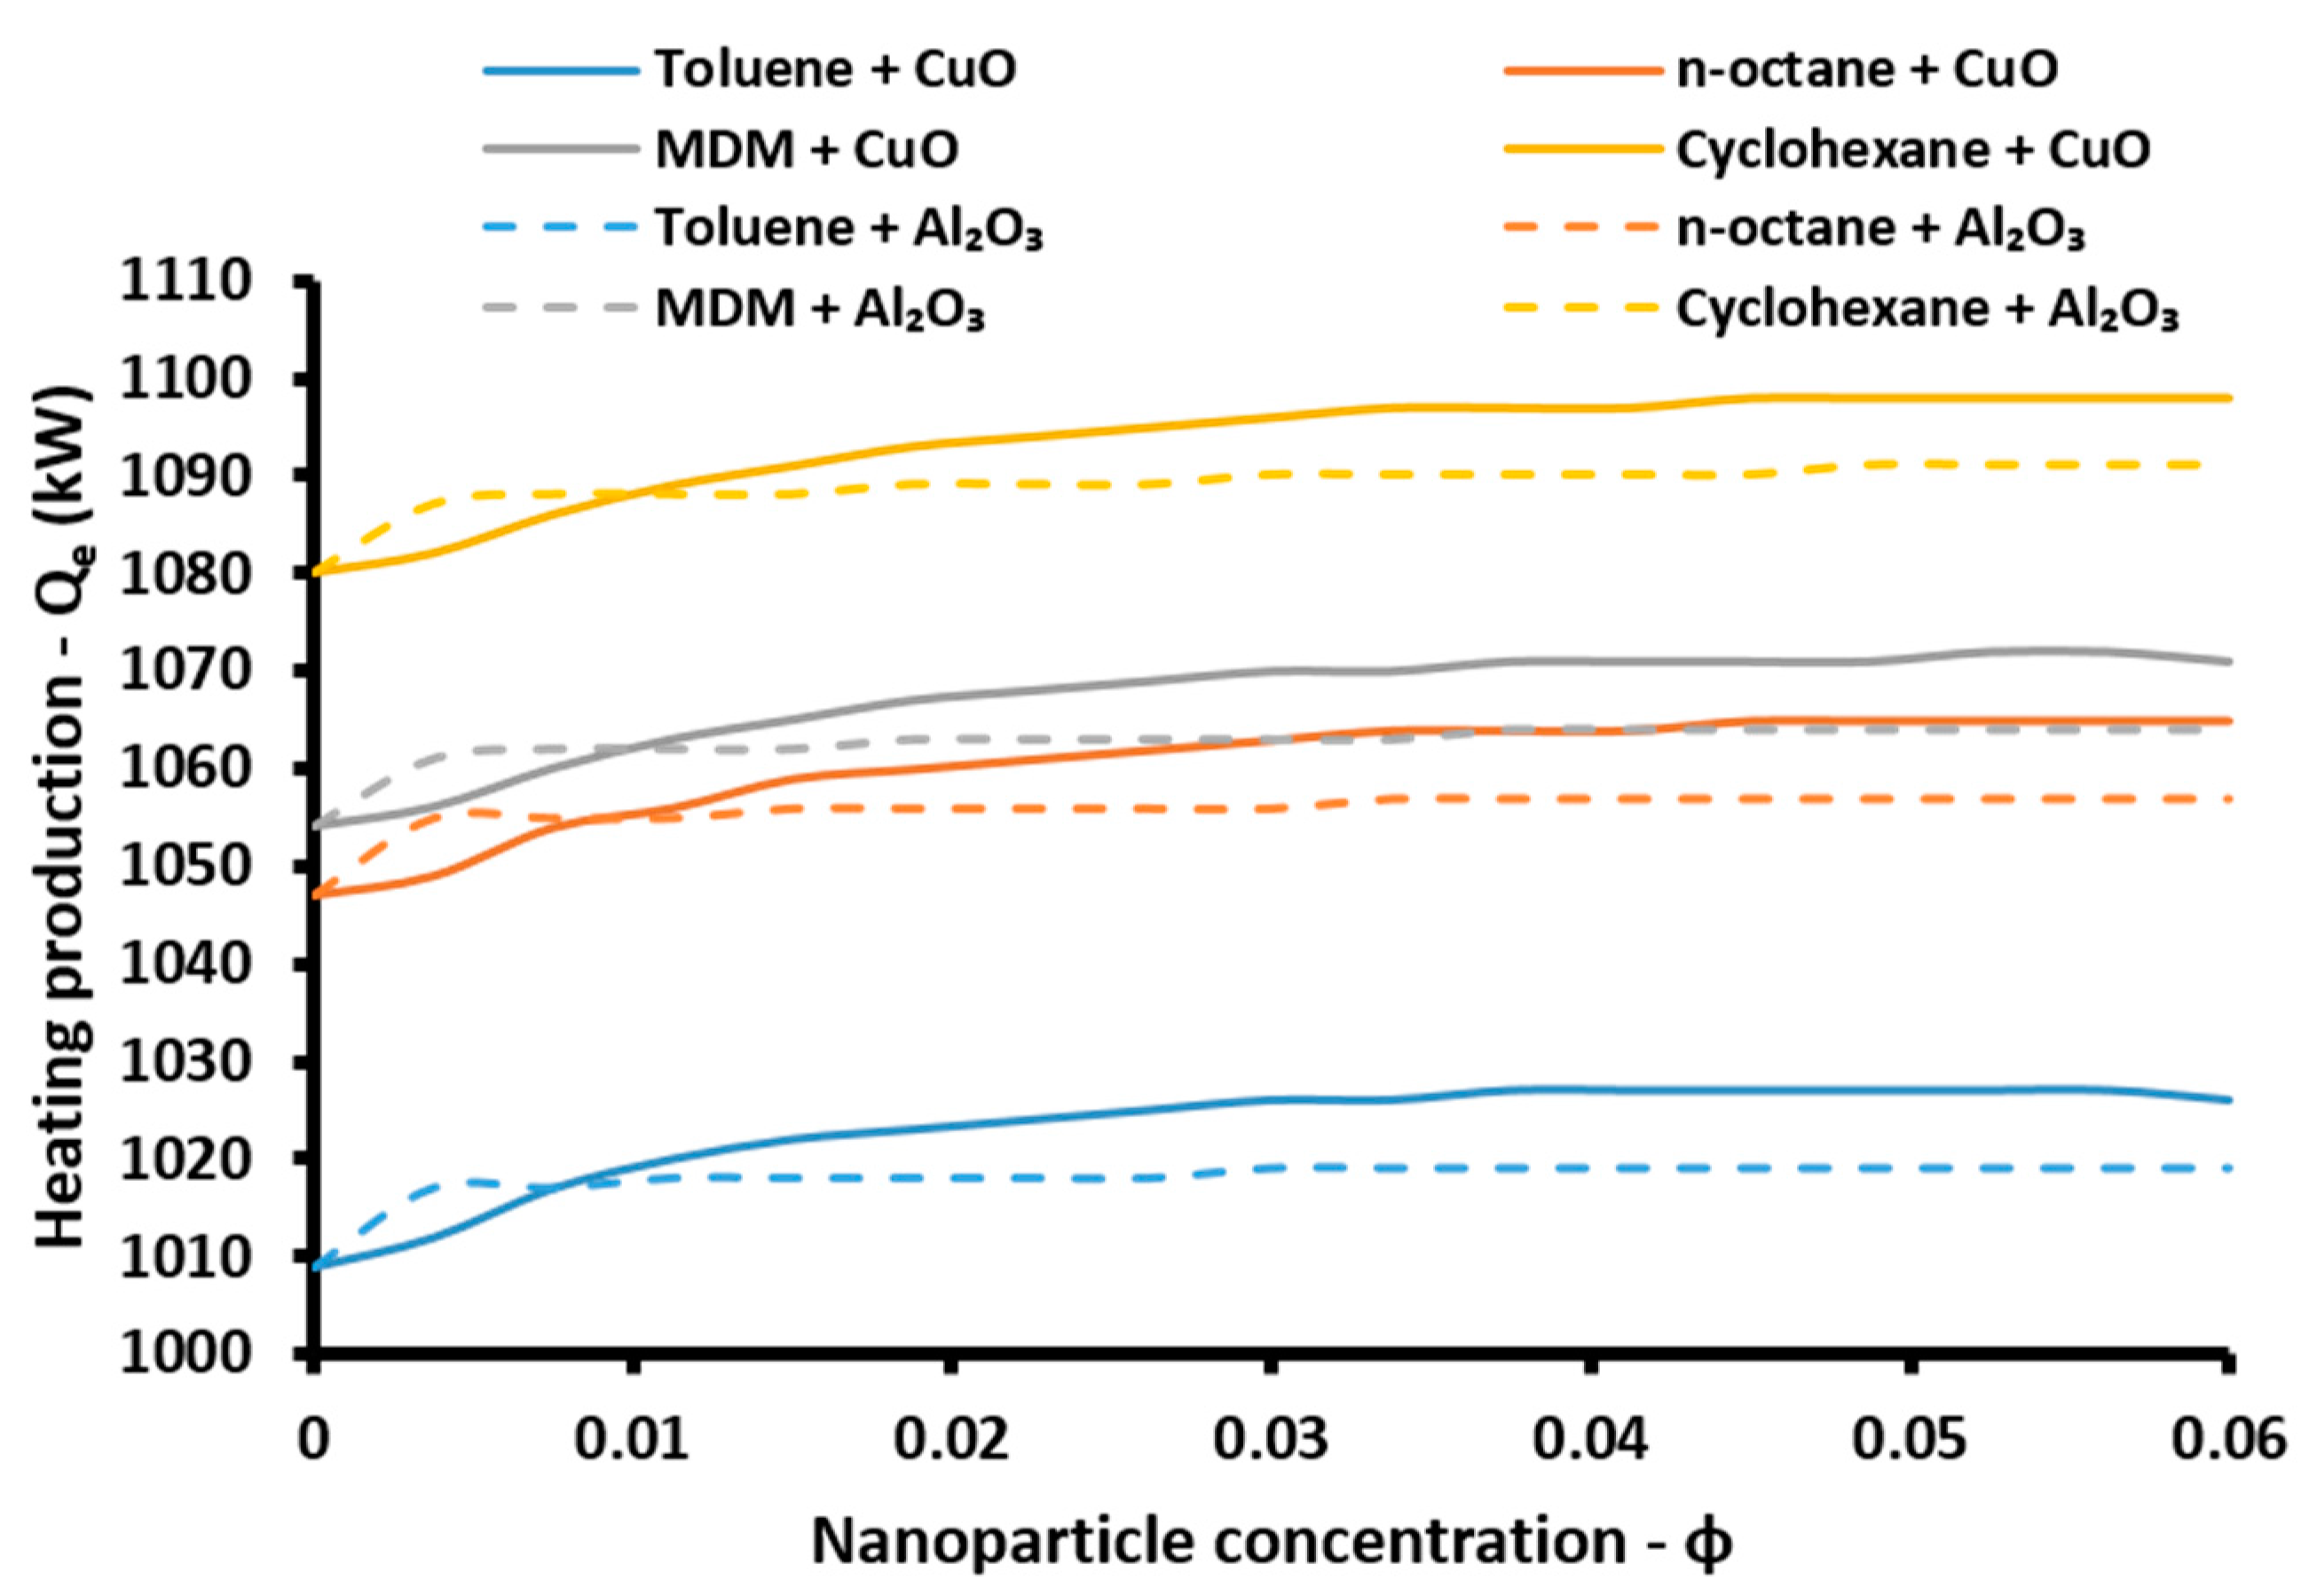
This subsection is devoted to presenting the impact of the nanoparticle concentration on the various system performance indexes as well as in the useful outputs. Both the cases of CuO and Al2O3 are examined for all the organic working fluids for concentrations between zero and 6%. The zero concentration means operation with pure thermal oil (Syltherm 800). The curves of Figure 10, Figure 11, Figure 12, Figure 13 and Figure 14 present similarities and thus they can be commented on together. These figures give the exergetic efficiency, the energetic efficiency, the electricity production, the cooling production and the heating production, respectively.
It is noticeable that for all the cases with a concentration greater than 1% (φ > 1%), the utilization of CuO nanoparticle leads to higher performance than the Al2O3, while for lower concentrations, the adoption of Al2O3 as the optimum nanoparticle is suggested. Moreover, the curves for the two nanofluids and the same organic fluids start from the same point (for φ = 0%) because these cases represent the operation with pure thermal oil. Comparing the operation with nanofluids (φ > 0%) and pure thermal oil (for φ = 0%), the use of nanofluids improves all the indexes.
Moreover, it is important to state that the exergetic efficiency (Figure 10) and the electricity production (Figure 12) have similar behavior, with toluene indicated to be the best organic working fluids followed by n-octane, MDM and cyclohexane. On the other hand, the energetic efficiency (Figure 11), the cooling production (Figure 13) and the heating production (Figure 14) have similar behavior with cyclohexane, MDM, n-octane and toluene being the organic working fluid sequence (from the most to the least efficient case).
3.2. Optimization
Section 3.2 gives a detailed optimization of the suggested system. For all the combinations of organic working fluid and working fluid in the solar field, an optimization procedure with three independent variables is applied. The pressure ratio, the heat rejection temperature and the nanofluid concentration are the optimization parameters. The examined ranges of these parameters are given in Table 3, as well as the default values of the optimization procedure. The objective function of the optimization is the exergetic efficiency of the system Equation (57) and the goal is to achieve maximum exergetic efficiency. This goal includes all the useful outputs and it evaluates them with a suitable way. Practically the exergetic efficiency tries to evaluate all the useful outputs as possible useful works. The “Conjugate Directions Method” is followed which is supported by EES. The results of this optimization, as well as their analysis, are present in Figure 15, Figure 16, Figure 17, Figure 18, Figure 19, Figure 20, Figure 21, Figure 22 and Figure 23 and in Table 5, Table 6 and Table 7. More specifically, Figure 15, Figure 16 and Figure 17 give the results of the optimization procedure, while Figure 18, Figure 19, Figure 20, Figure 21 and Figure 22 show the comparisons between the nanofluid cases with the respective cases with pure thermal oil. The comparison in Figure 18, Figure 19, Figure 20, Figure 21 and Figure 22 concerns the optimized cases in order the comparison to be proper. In the end of the Section 3.2, Table 5, Table 6 and Table 7 gives the optimization results with details for all the examined cases in order to present with a clear way the most important results of this study. Moreover, Figure 23 gives the final comparison between the optimized cases.
Figure 15 depicts the exergetic efficiency enhancement of all the optimized cases, compared to the initial results. The initial results have been taken by using the default values of Table 3. It is obvious that for all the case, the optimization leads to exergetic efficiency enhancement from 1.03% up to 2.63%. This result indicates that the optimization of the system is something important in order to design a high efficient system. This enhancement is not so great because the initial values of Table 3 (default values) are selected to have reasonable values in order for the optimization method to converge easily. The first and most important result from Figure 15 is that the highest enhancement is found for CuO-Syltherm nanofluid with 2.63% in the MDM case, 2.47% in the cyclohexane case, 1.88% in the n-octane case and 1.11% in the toluene case. The enhancements for Al2O3-Syltherm and pure Syltherm are similar and lower than the respective CuO-Syltherm cases.
Figure 16 gives the optimum pressure ratios for all the cases. Generally, high values are optimum in order for great electricity amounts to be captured. The shape of the saturation line in the temperature-entropy diagram (Figure 2) is important for the optimum pressure ratio in every case. MDM is the fluid which needs the highest possible pressure for achieving the highest exergetic efficiency with the pressure ratio equal to 90% in all the case (CuO, Al2O3 nanofluids and pure Syltherm). Cyclohexane needs a pressure ratio close to 0.88 and n-octane close to 0.85. On the other hand, toluene presents an optimum exergetic performance for a relatively lower pressure ratio close to 0.76. This result can be justified by the higher critical temperature of this working fluid (see Table 1).
Figure 17 gives the optimum nanoparticle concentration for the cases with nanofluids. The cases with pure Syltherm has the concentration equal to zero (φ = 0%). The Al2O3 has to be used in high concentrations, with 5.49% for toluene case and 6.00% for the other cases. On the other hand, lower concentrations are optimum for the CuO nanofluid. More specifically the optimum concentrations of the CuO for toluene, n-octane, MDM and cyclohexane are 4.35%, 4.64%, 4.61% and 5.22% respectively.
At this point, it is essential to state that the optimum heat rejection temperature is found to be 113.7 °C for all the examined cases and thus it is not given in a separate figure. This result is given in Table 5, Table 6 and Table 7 and it is reasonable according to the parametric analysis results. More specifically, Figure 7 has proved that this heat rejection temperature is optimum for the cases of Section 3.1.
The next important goal of this study is to present the enhancement by the use of nanofluids compared to the cases with pure Syltherm in the solar field. Figure 18, Figure 19, Figure 20, Figure 21 and Figure 22 exhibit this comparison with details. It is essential to state that the compared cases are all optimized cases in order to perform a suitable comparison.
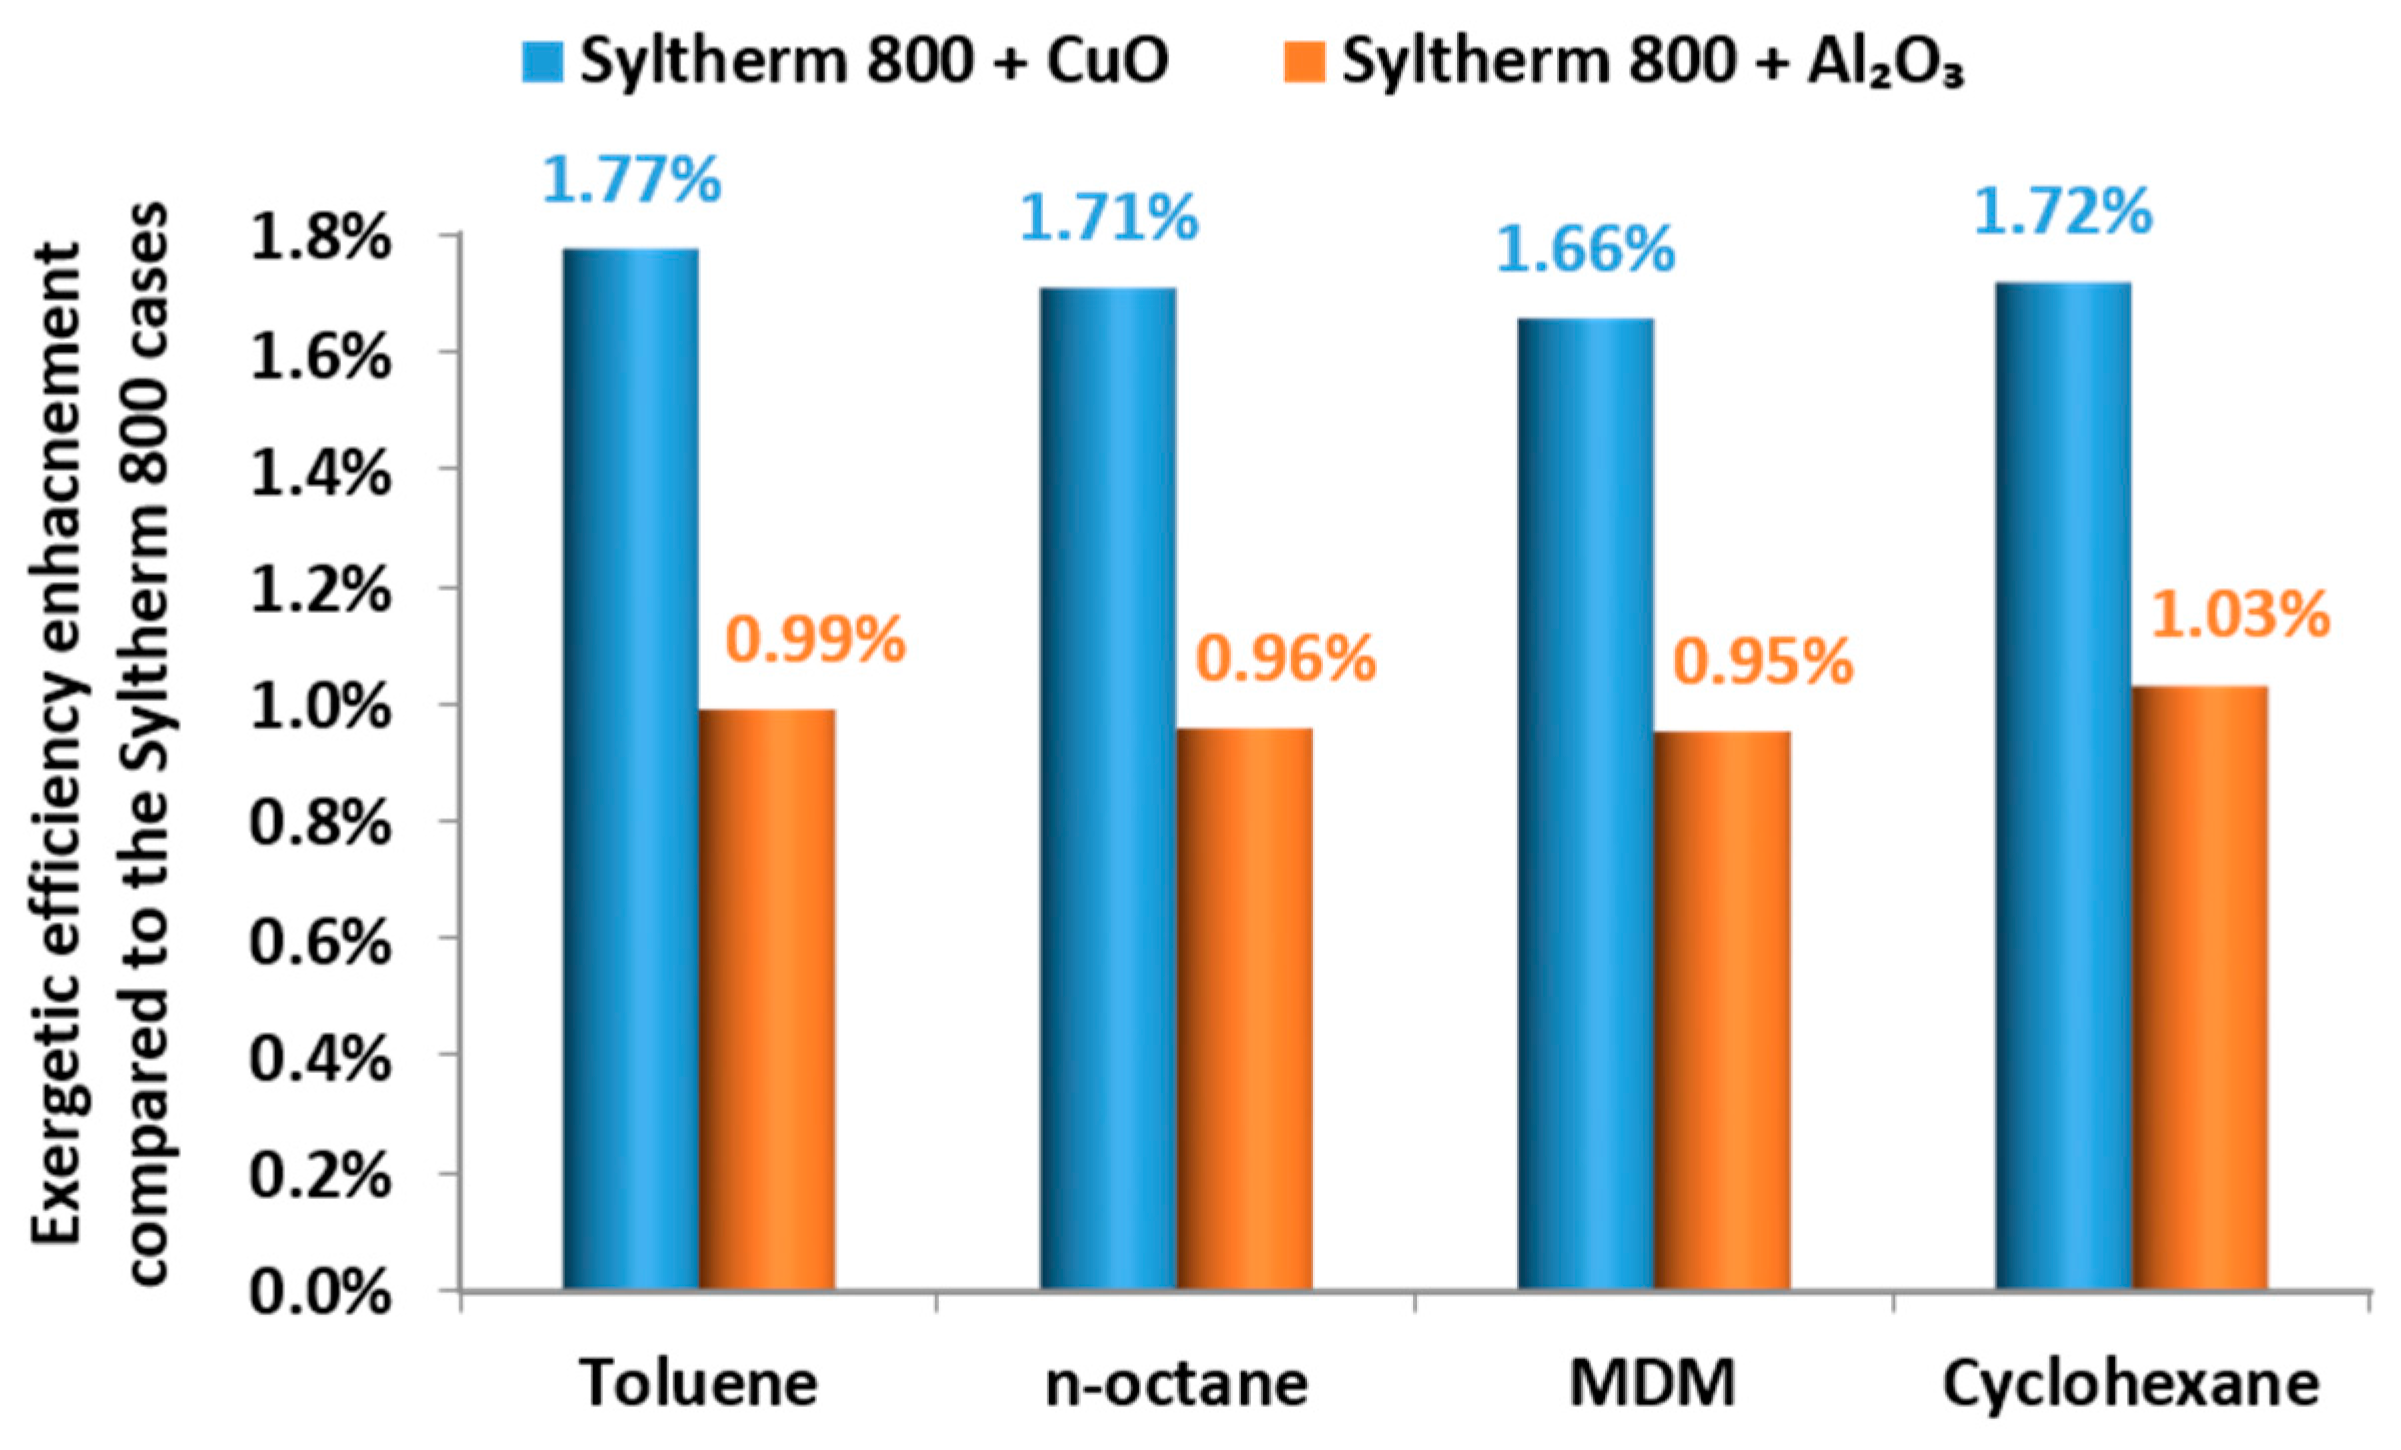
Figure 18 illustrates the enhancement in the exergetic compared to the pure thermal oil cases and it is obvious that there is an enhancement in all the cases. The utilization of CuO leads to 1.7% enhancements approximately, while the use of Al2O3 to 1% enhancement. This result indicates the adoption of CuO as the best nanoparticle. The greater exergetic enhancement for CuO is observed for toluene, with 1.77%. For Al2O3, the greater enhancement is observed for cyclohexane and it is 1.03%.
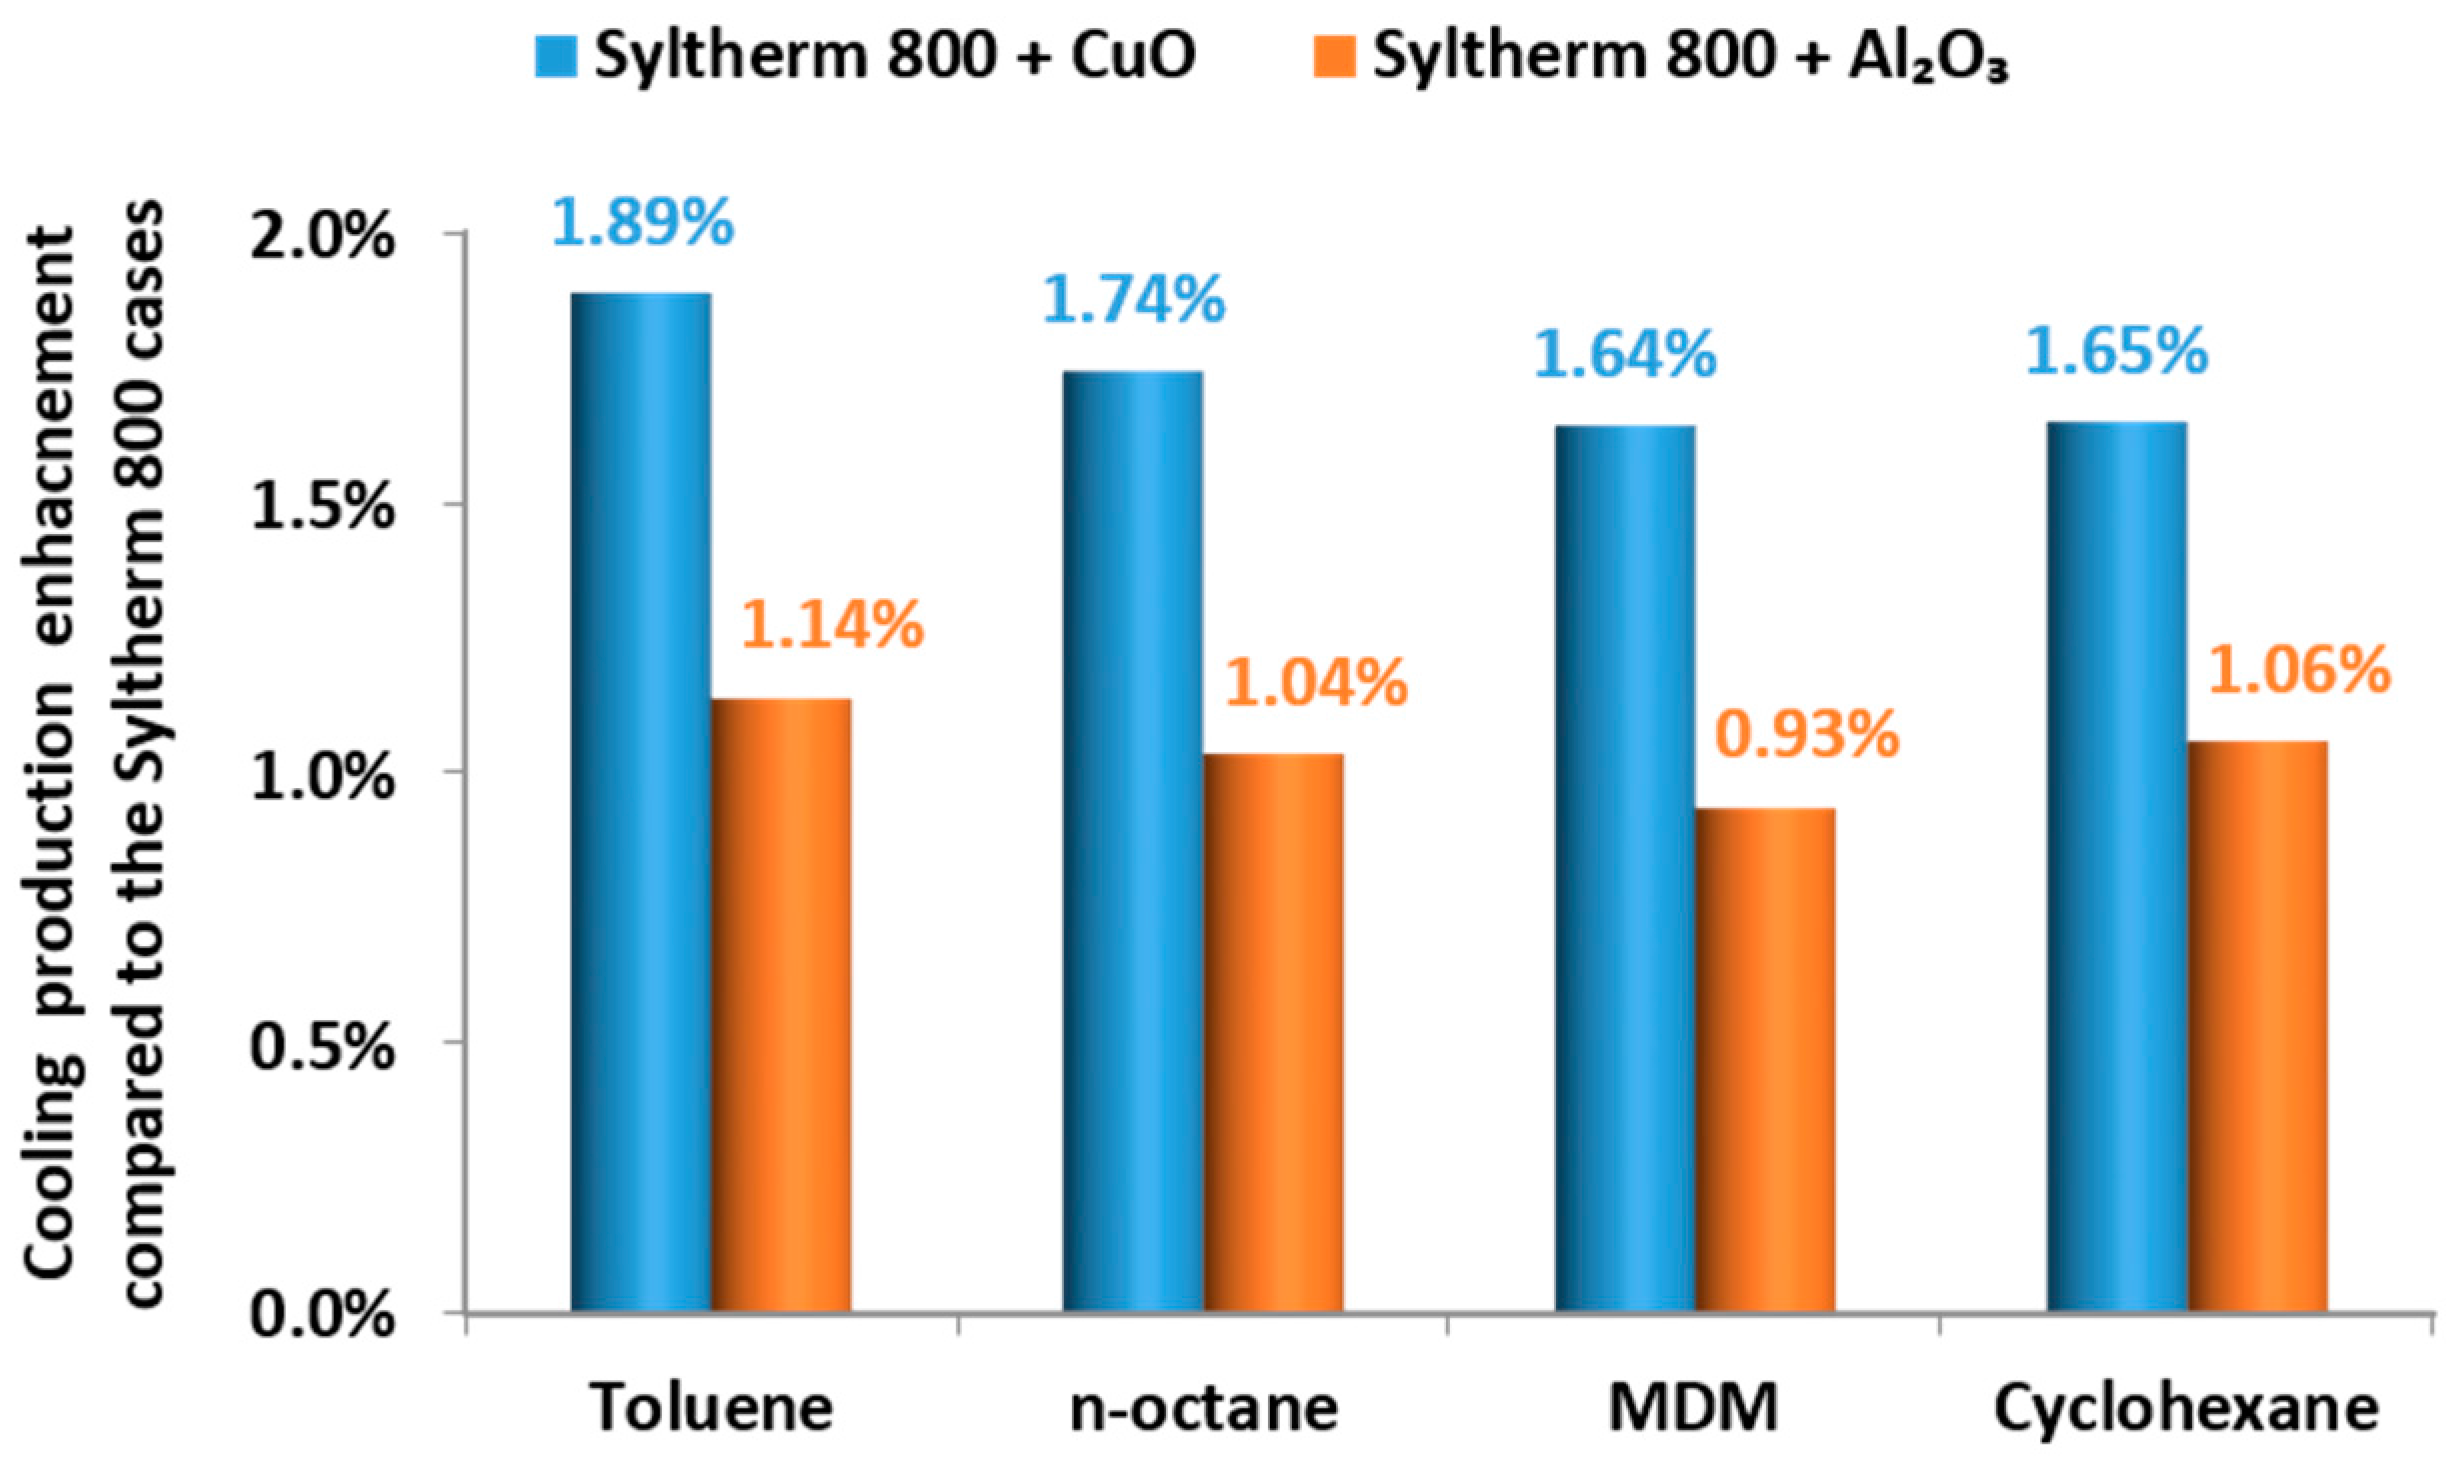
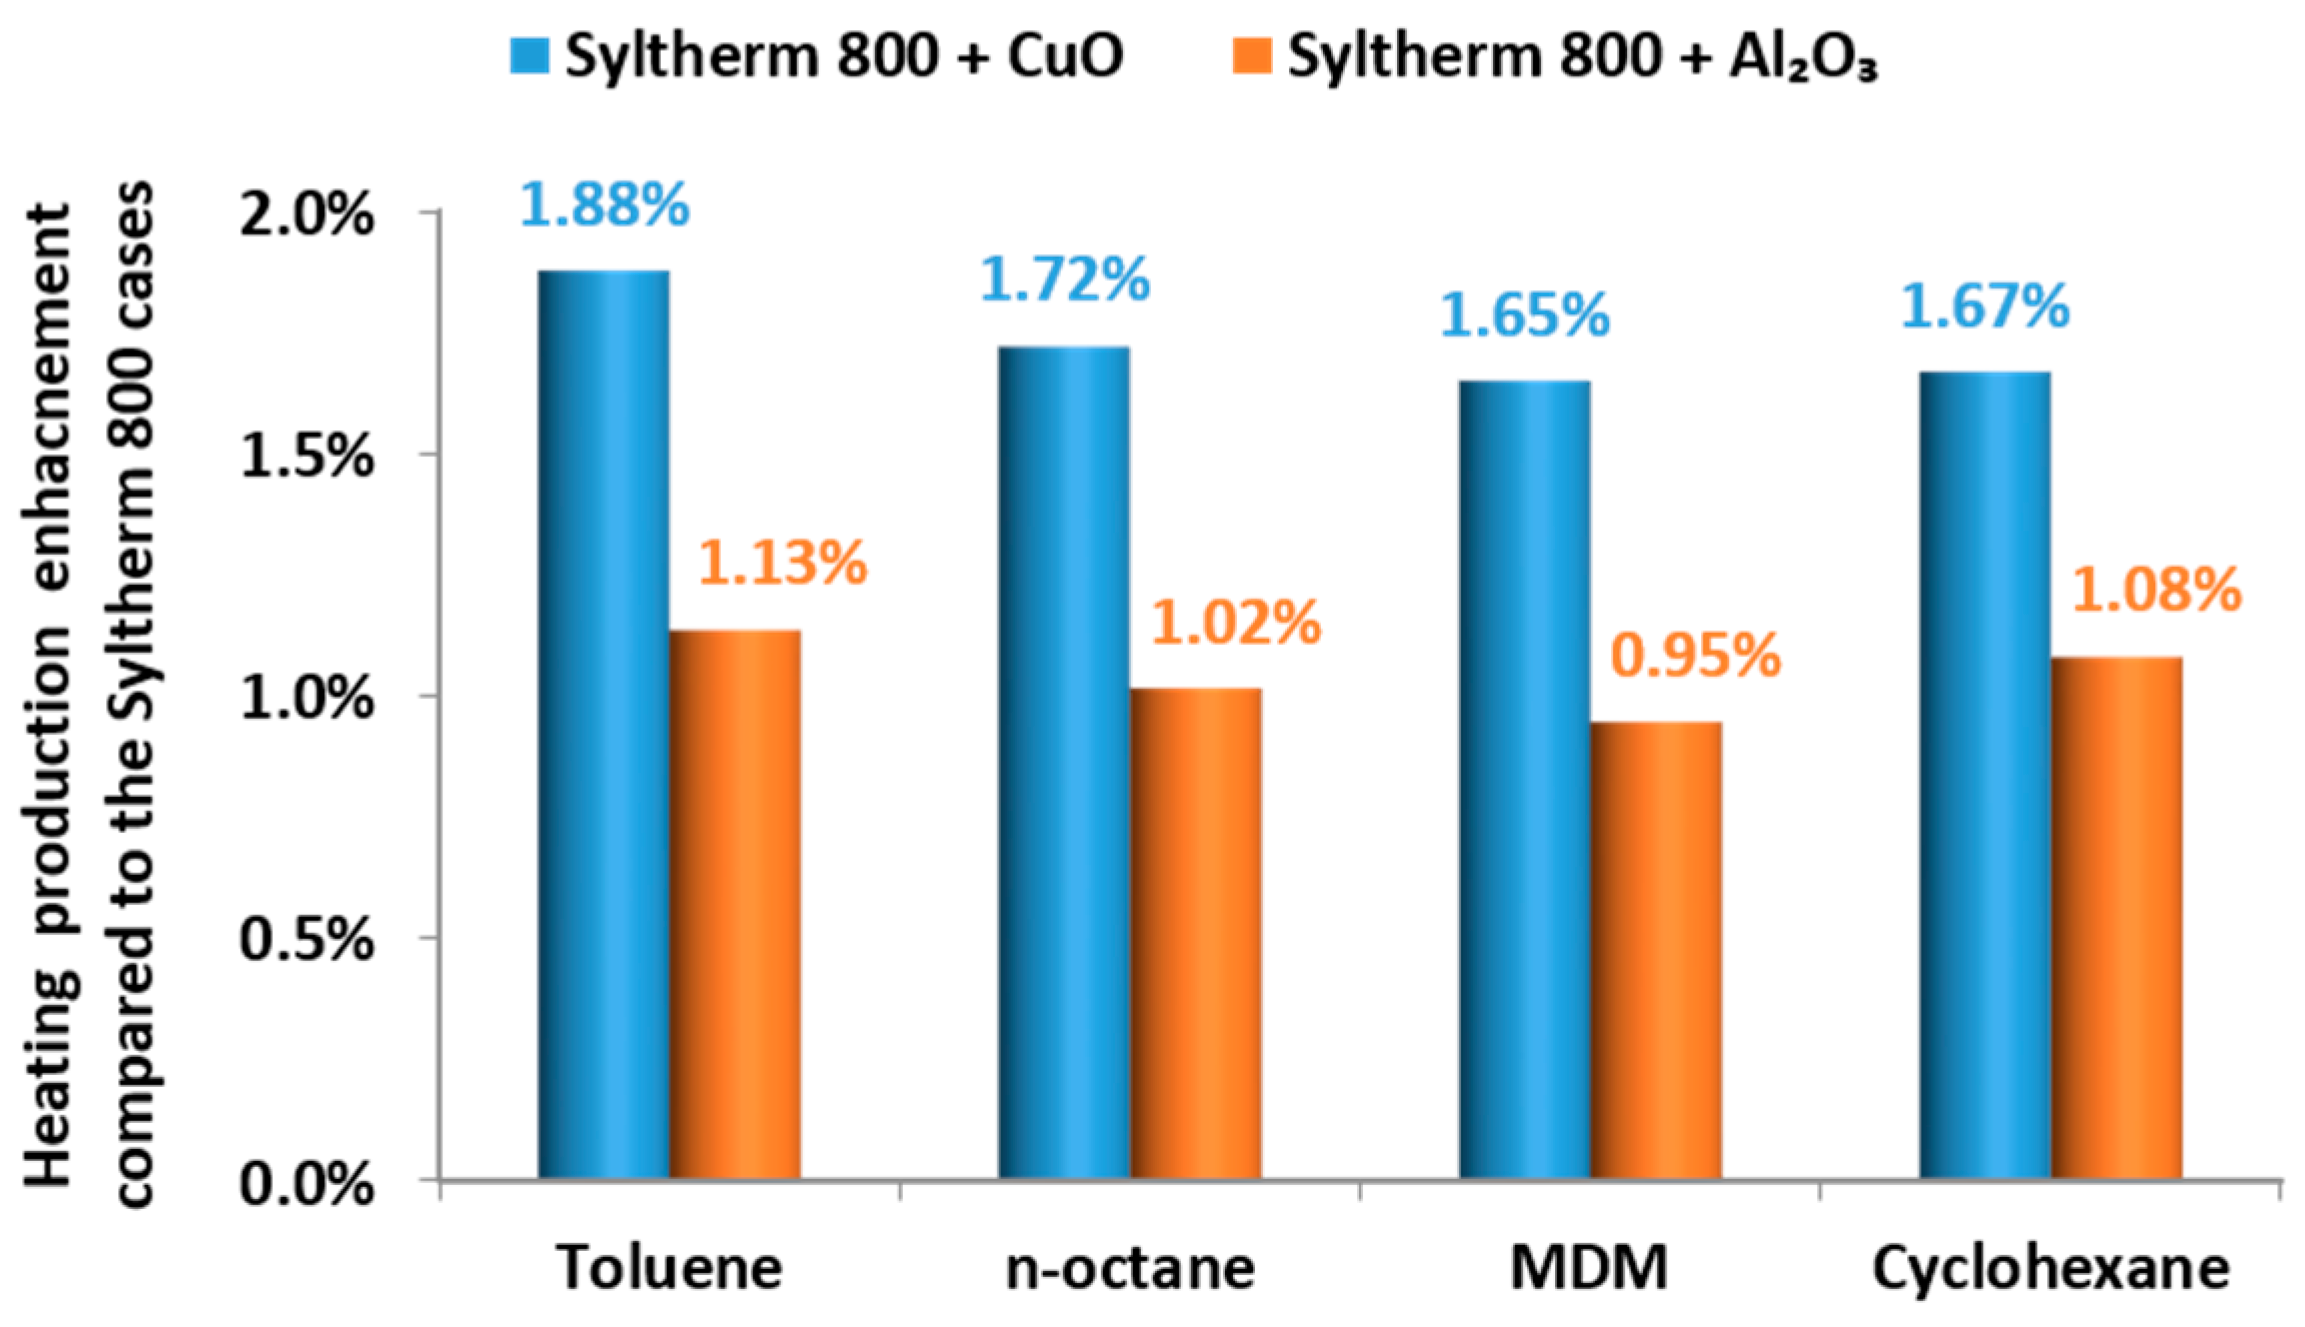
Figure 19 shows the energetic efficiency enhancements compared to the pure thermal oil cases. The highest energetic enhancement is observed for toluene case, with 1.91% for CuO and 1.17% for Al2O3. Figure 20 gives the electricity production enhancement which has many similarities with Figure 18 about exergetic efficiency. The maximum electricity production enhancement is given for toluene with CuO and it is 1.74%. Cooling and heating production enhancements are illustrated in Figure 21 and Figure 22 respectively. These two figures are similar with Figure 20 for energy efficient enhancement. It can be stated that the maximum cooling and heating enhancements are observed for toluene with CuO and they are 1.89% and 1.88% respectively.
Figure 18, Figure 19, Figure 20, Figure 21 and Figure 22 proved that the exergetic efficiency is associated with the electricity production enhancement, while the energetic efficiency is associated with the cooling and the heating production enhancements. Moreover, it is found that the cooling and heating enhancements are approximately the same because these are outputs of the same device (heat absorption heat pump). As a final comment for these figures, it is clear that CuO is a better choice than Al2O3 and all the depicted indexes and useful output present similar enhancements compared to the thermal oil cases. These results indicate the utilization of nanofluids in applications as the examined.
In the last part of the results section, the final results are summarized in Table 5, Table 6 and Table 7 and in Figure 23. Table 5, Table 6 and Table 7 give all the optimization results for the cases with CuO, Al2O3 and pure Syltherm respectively. The exergetic, energetic, ORC efficiencies are given, as well as the coefficient of performance for the absorption heat pump. Moreover, the optimum values for the variable parameters are given for all the cases. Furthermore, the values of the energy/power streams are included in Table 5, Table 6 and Table 7.
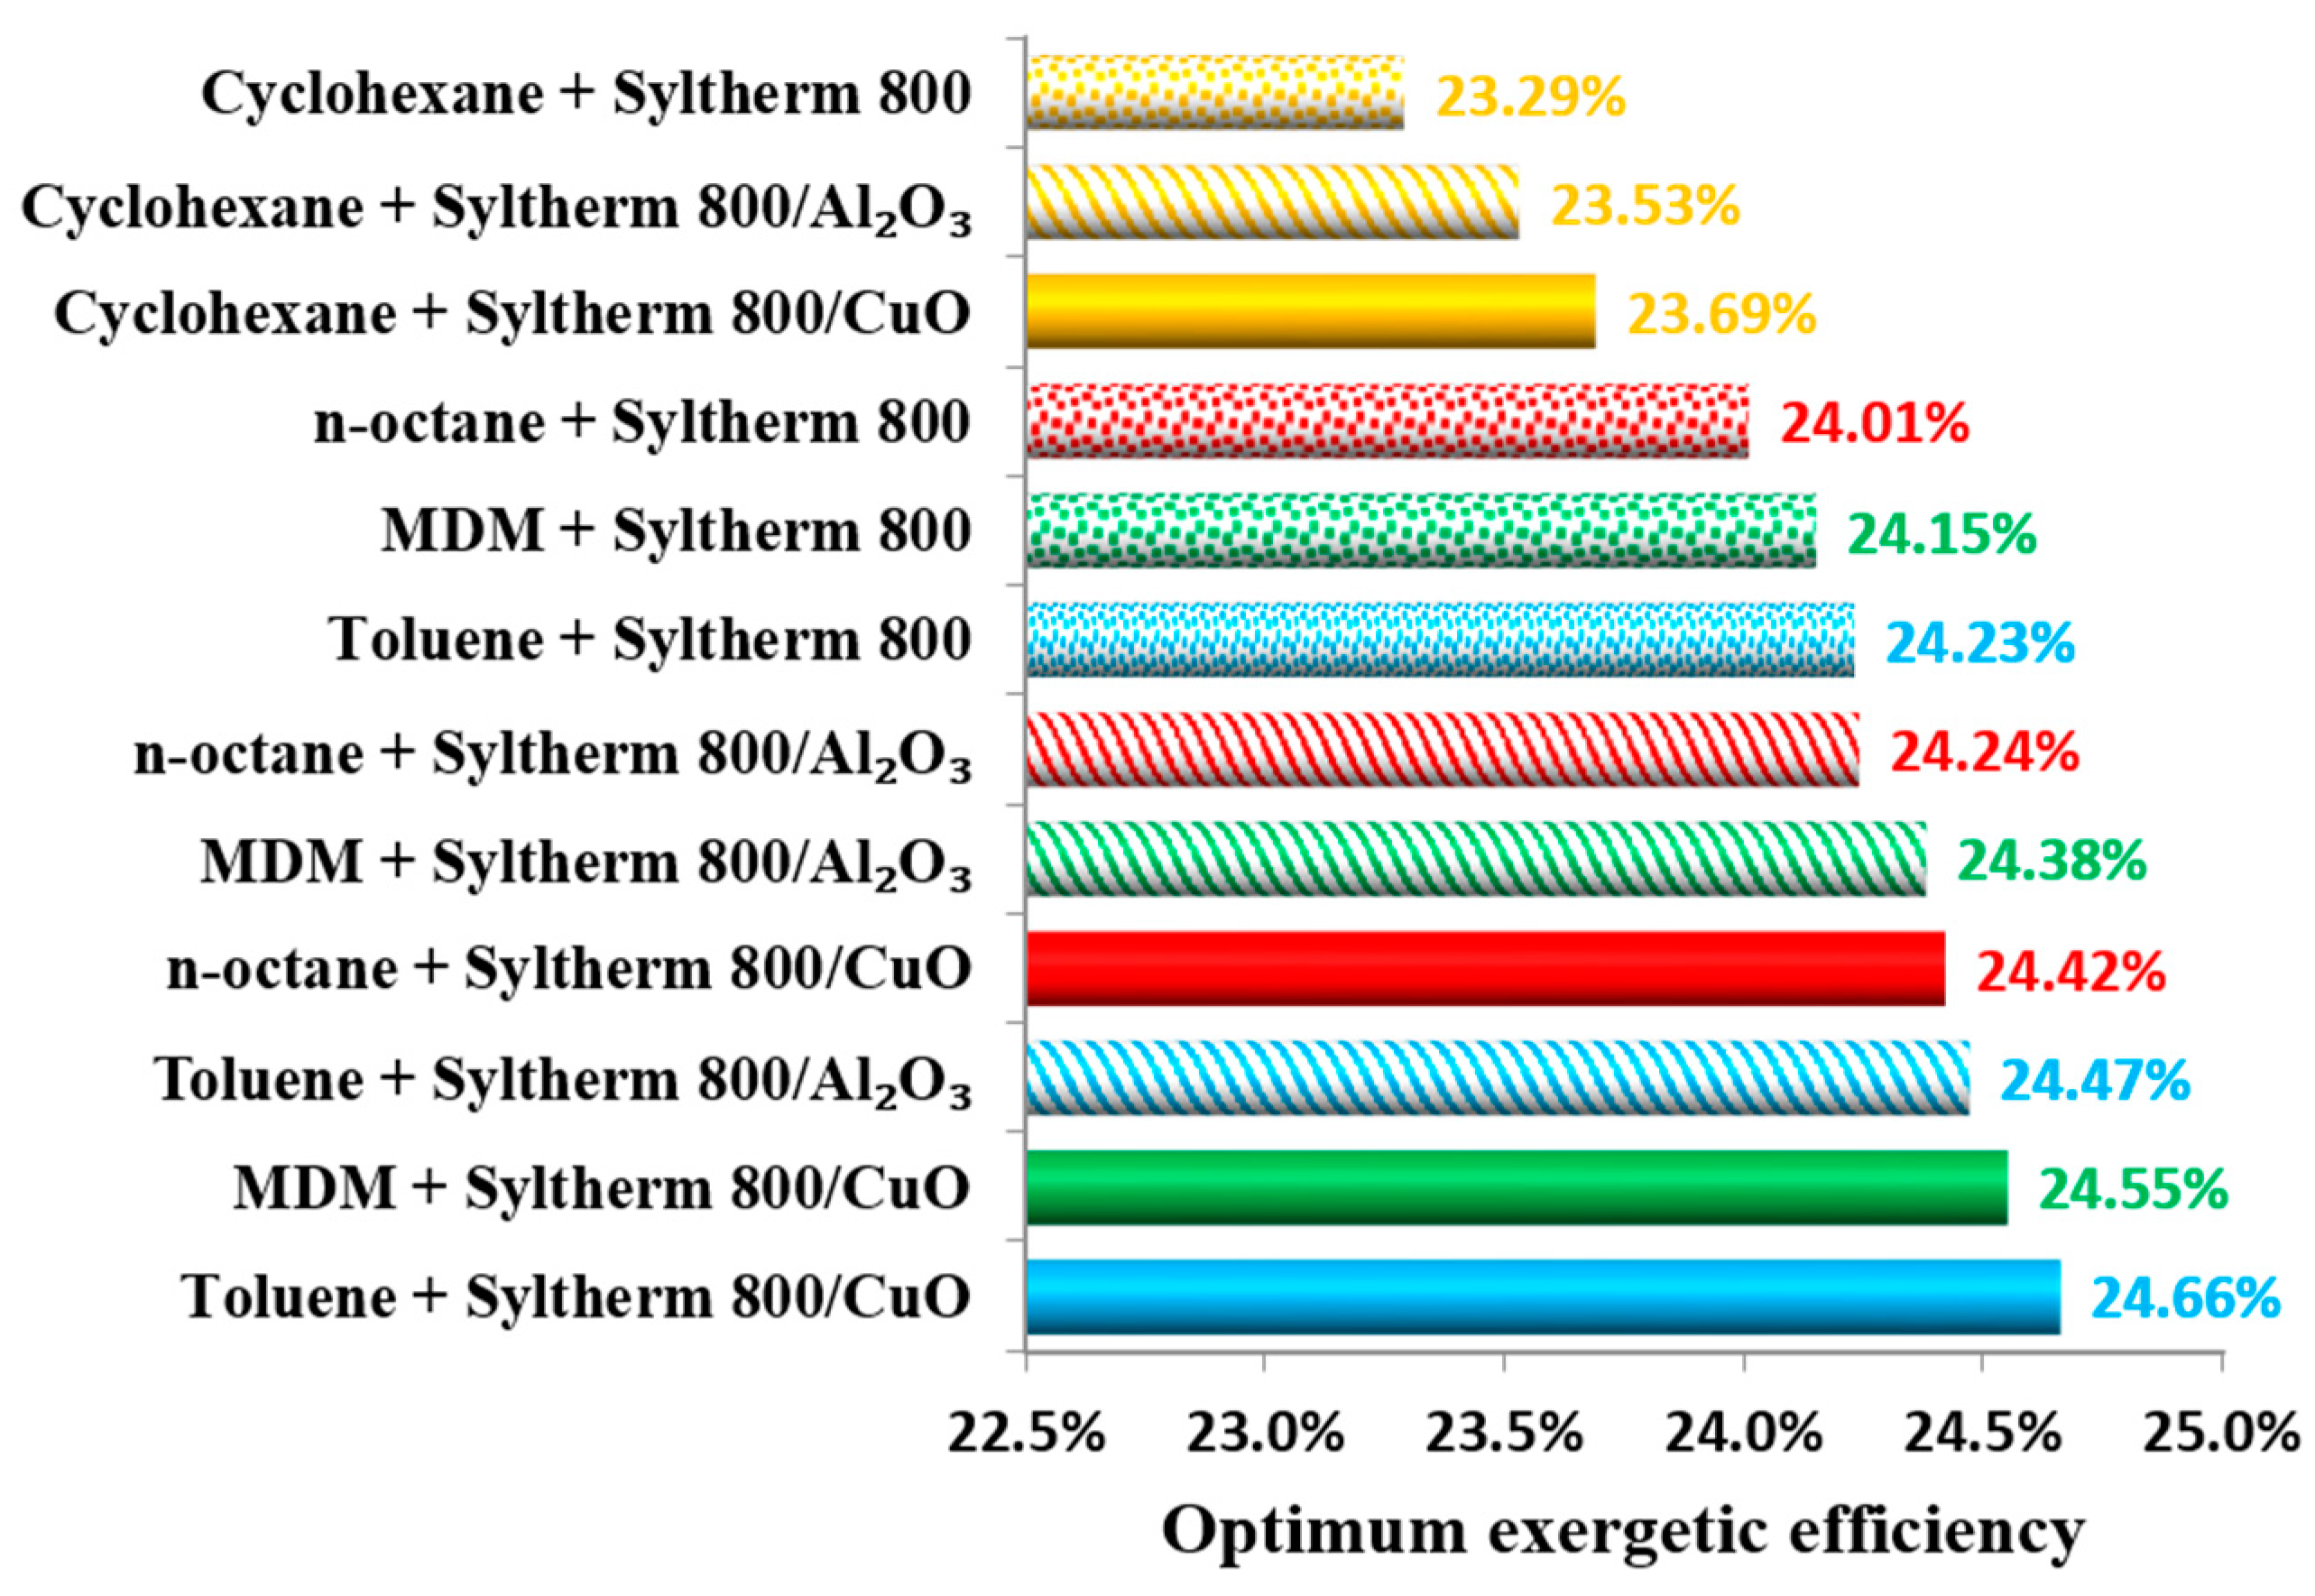
Figure 23 depicts the final comparison of all the cases, according to their optimum exergetic efficiency. The global maximum exergetic efficiency is 24.66% and it concerns the case of toluene with CuO nanofluid. The next case is with MDM and CuO nanofluid with 24.55%. The next case is shown in Figure 23. It would be important to state that cyclohexane is the less suitable organic working fluid which is at the end of the examined cases. On the other hand, toluene and CuO nanofluid are the best candidates. Moreover, MDM seems to be a second reliable choice, after toluene. Generally, it can be said that the proper organic working fluid selection is more important than the proper nanofluid (or pure thermal oil) selection.
4. Discussion and Conclusions
This work examines a solar-driven trigeneration system with parabolic trough collectors which includes an ORC and an absorption heat pump. Electricity, cooling and heating are produced and the system is evaluated in energetic and exergetic terms. Moreover, the use of nanofluids in the solar field is examined with CuO and Al2O3 to be the examined nanoparticles inside the Syltherm 800. Four different organic working fluids are examined in the ORC in order to select the most proper. The system is optimized with the maximum exergetic efficiency criterion. For every combination of working fluid in the solar field (nanofluid or pure Syltherm 800) and organic fluid, an optimization procedure is applied. Three are the optimization variables; the pressure ratio (pressure in the turbine inlet to the critical pressure), the heat rejection temperature of the ORC and the nanoparticle concentration.
According to the final results, the global maximum exergetic efficiency is found to be 24.66% for operation with toluene and CuO nanofluid. In this case, the concentration of CuO in Syltherm 800 is 4.35%, the pressure ratio is 0.7605 and the heat rejection temperature in the ORC 113.7 °C. It is important to state that this heat rejection temperature level is the optimum one for all the cases, while the optimum values of the other parameters are varied from case to case. Moreover, it is found that toluene is the best working fluid with MDM shown to be next most suitable. Among the nanoparticles, CuO is found to be better than Al2O3 in all the optimum cases. It is essential to state that both nanofluids lead to exergetic enhancement compared to the pure Syltherm operation, with CuO leading to an enhancement of close to 1.75 and Al2O3 to 1% approximately for the examined cases. The energetic efficiency is found to be close to 1.4 (or 140%) for the optimum cases and its value is higher than 100% due to the existence of the absorption heat pump in the system.
The results of this work clearly indicate that the utilization of nanofluids as working fluids in the solar field can lead to a higher exergetic performance in trigeneration systems like the examined one. The optimization of these installations is critical and it has to be made by taking into account the working fluids in solar field and in the ORC. Using the exergetic efficiency as the optimization criterion leads to a system with relatively high electricity production, something that is beneficial in the usual trigeneration applications.
Author Contributions
Evangelos Bellos and Christos Tzivanidis have worked together in all the steps of this paper. They have the same contribution in all the parts of this work.
Conflicts of Interest
The authors declare no conflict of interest.
Nomenclature
| Aa | Area of the module, m2 |
| Ast | Storage tank outer area, m2 |
| cp | Specific heat capacity under constant pressure, kJ/kg K |
| COP | Coefficient of performance, - |
| D | Diameter, m |
| Gb | Solar beam radiation, kW/m2 |
| h | Heat transfer coefficient, W/m2K |
| hout | Convection coefficient between cover and ambient, W/m2K |
| k | Thermal conductivity, W/mK |
| K | Incident angle modifier, - |
| L | Tube length, m |
| m | Mass flow rate, kg/s |
| MW | Molecular weight, kg/kmol |
| N | Number of modules, - |
| Nu | Mean Nusselt number, - |
| p | Pressure, bar |
| Pel | Electricity production in the generator, kW |
| Pnet | Net electricity production, kW |
| PP | Pinch point, °C |
| Pr | Prandtl number, - |
| PR | Pressure ratio, - |
| Q | Heat flux, kW |
| Re | Reynolds number, - |
| s | Specific entropy, kJ/kgK |
| T | Temperature, °C |
| Ust | Storage tank thermal loss coefficient, kW/m2K |
| (UA)st | Heat exchanger effectiveness, kW/m2K |
| V | Volumetric flow rate, m3/h |
| Vst | Volume of storage tank, m3 |
| Vwind | Ambient wind velocity, m/s |
| Wp | Pump consumption, kW |
| X | LiBr concentration, - |
Greek Symbols
| β | Nanolayer thickness to the original particle radius, - |
| ΔTrc | Temperature difference in the recuperator, °C |
| ΔTcg | Temperature difference between condenser-generator, °C |
| ε | Emittance, - |
| ηHEX | Solution heat exchanger efficiency, |
| ηis | Turbine isentropic efficiency, - |
| ηmg | Electromechanical efficiency of the generator, - |
| ηorc | ORC thermodynamic efficiency, - |
| ηopt | Optical efficiency, - |
| ηpum | Organic fluid pump efficiency, - |
| ηsys | System efficiency, - |
| ηth | Thermal collector efficiency, - |
| θ | Incident angle, - |
| μ | Dynamic viscosity, Pa s |
| ρ | Density, kg/m3 |
| σ | Stefan–Boltzmann constant (=5.67 × 10⁻⁵ kW/m2 K4) |
| φ | Volumetric fraction of nanoparticles, % |
Subscripts and Superscripts
| a | absorber |
| am | ambient |
| bf | base fluid |
| c | cover |
| ci | inner cover |
| co | outer cover |
| col | collector |
| col,in | collector in |
| col,out | collector out |
| con | condenser |
| cool | cooling |
| crit | critical |
| e | evaporator |
| en | energetic |
| ex | exergetic |
| fm | mean fluid |
| g | generator |
| G | generator |
| h | heat |
| heat | heating |
| ha | heat-absorber |
| hc | heat condenser |
| high | high |
| hr | heat rejection |
| in | input |
| is | isentropic |
| loss | losses |
| low | low |
| max | maximum |
| nf | nanofluid |
| np | nanoparticle |
| o | organic |
| opt | optimum |
| r | receiver |
| ri | inner receiver |
| ro | outer receiver |
| s | source-thermal oil |
| sat | saturation |
| sky | sky |
| str | strong |
| sol | solar |
| st | storage |
| stored | stored quantity |
| s,in | source in |
| s,m | source intermediate (in pinch point position) |
| s,out | source out |
| sol,t | solar total |
| sun | sun |
| u | useful |
| u,t | useful total |
| w | weak |
Abbreviations
| ECO | Economizer |
| EES | Engineer equator solver |
| EVAP | Evaporator |
| HRS | Heat recovery system |
| MDM | Octamethyltrisiloxane |
| ORC | Organic Rankine cycle |
| PTC | Parabolic trough collector |
| SOFC | Solid oxide fuel cell |
| SWCNT | Single-walled carbon nanotubes |
References
- Alsharif, M.A. Techno-economic evaluation of a stand-alone power system based on solar/battery for a base station of global system mobile communication. Energies 2017, 10, 392. [Google Scholar] [CrossRef]
- Alsharif, M.A. A solar energy solution for sustainable third generation mobile networks. Energies 2017, 10, 429. [Google Scholar] [CrossRef]
- Lee, H.J.; Kim, S.Y.; Yun, C.Y. Comparison of solar radiation models to estimate direct normal irradiance for Korea. Energies 2017, 10, 594. [Google Scholar] [CrossRef]
- Bellos, E.; Tzivanidis, C.; Antonopoulos, K.A. Exergetic and energetic comparison of LiCl-H2O and LiBr-H2O working pairs in a solar absorption cooling system. Energy Convers. Manag. 2016, 123, 453–461. [Google Scholar] [CrossRef]
- Kumar, N.T.U.; Martin, A.R. Co-production performance evaluation of a novel solar Combi System for simultaneous pure water and hot water supply in urban households of UAE. Energies 2017, 10, 481. [Google Scholar] [CrossRef]
- Calise, F.; d'Accadia, M.D.; Macaluso, A.; Vanoli, L.; Piacentino, A. A novel solar-geothermal trigeneration system integrating water desalination: Design, dynamic simulation and economic assessment. Energy 2016, 115, 1533–1547. [Google Scholar] [CrossRef]
- Bellos, E.; Tzivanidis, C.; Moschos, K.; Antonopoulos, K.A. Energetic and financial evaluation of solar assisted heat pump space heating systems. Energy Convers. Manag. 2016, 120, 306–319. [Google Scholar] [CrossRef]
- Lillo, I.; Perez, E.; Moreno, S.; Silva, M. Concentration technologies in Latin America: The case of Argentina. Energies 2017, 10, 383. [Google Scholar] [CrossRef]
- Bellos, E.; Tzivanidis, C.; Antonopoulos, K.A.; Daniil, I. The use of gas working fluids in parabolic trough collectors—An energetic and exergetic analysis. Appl. Therm. Eng. 2016, 109, 1–14. [Google Scholar] [CrossRef]
- Loni, R.; Asli-ardeh, E.A.; Ghobadian, B.; Kasaeian, A.B.; Gorjian, S. Thermodynamic analysis of a solar dish receiver using different nanofluids. Energy 2017, 133, 749–760. [Google Scholar] [CrossRef]
- Ham, J.; Kim, J.; Cho, H. Theoretical analysis of thermal performance in a plate type liquid heat exchanger using various nanofluids based on LiBr solution. Appl. Therm. Eng. 2016, 108, 1020–1032. [Google Scholar] [CrossRef]
- Khalid, F.; Dincer, I.; Rosen, M.A. Techno-economic assessment of a renewable energy based integrated multigeneration system for green buildings. Appl. Therm. Eng. 2016, 99, 1286–1294. [Google Scholar] [CrossRef]
- Al-Ali, M.; Dincer, I. Energetic and exergetic studies of a multigenerational solar–geothermal system. Appl. Therm. Eng. 2014, 71, 16–23. [Google Scholar] [CrossRef]
- Suleman, F.; Dincer, I.; Agelin-Chaab, M. Development of an integrated renewable energy system for multigeneration. Energy 2014, 78, 196–204. [Google Scholar] [CrossRef]
- Bicer, Y.; Dincer, I. Analysis and performance evaluation of a renewable energy based multigeneration system. Energy 2016, 94, 623–632. [Google Scholar] [CrossRef]
- Hassoun, A.; Dincer, I. Analysis and performance assessment of a multigenerational system powered by organic Rankine cycle for a net zero energy house. Appl. Therm. Eng. 2015, 76, 25–36. [Google Scholar] [CrossRef]
- Al-Sulaiman, F.A.; Dincer, I.; Hamdullahpur, F. Thermoeconomic optimization of three trigeneration systems using organic Rankine cycles: Part I—Formulations. Energy Convers. Manag. 2013, 69, 199–208. [Google Scholar] [CrossRef]
- Buonomano, A.; Calise, F.; Palombo, A.; Vicidomini, M. Energy and economic analysis of geothermal-solar trigeneration systems: A case study for a hotel building in Ischia. Appl. Energy 2015, 138, 224–241. [Google Scholar] [CrossRef]
- Alashkar, A.; Gadalla, M. Thermo-economic analysis of an integrated solar power generation system using nanofluids. Appl. Energy 2017, 191, 469–491. [Google Scholar] [CrossRef]
- Toghyani, S.; Baniasadi, E.; Afshari, E. Thermodynamic analysis and optimization of an integrated Rankine power cycle and nano-fluid based parabolic trough solar collector. Energy Convers. Manag. 2016, 121, 93–104. [Google Scholar] [CrossRef]
- Boyaghchi, F.A.; Chavoshi, M.; Sabeti, V. Optimization of a novel combined cooling, heating and power cycle driven by geothermal and solar energies using the water/CuO (copper oxide) nanofluid. Energy 2015, 91, 685–699. [Google Scholar] [CrossRef]
- Boyaghchi, F.A.; Chavoshi, M. Multi-criteria optimization of a micro solar-geothermal CCHP system applying water/CuO nanofluid based on exergy, exergoeconomic and exergoenvironmental concepts. Appl. Therm. Eng. 2017, 112, 660–675. [Google Scholar] [CrossRef]
- Development of a Low Cost European Parabolic Trough Collector. Available online: http://cordis.europa.eu/documents/documentlibrary/51762451EN6.pdf (access on 24 June 2017).
- Kearney, D.W. Parabolic Trough Collector Overview: Notes on a Bit of History, Development after Luz, and a Recent Surge in Trough Collector Technology Offerings. Available online: http://edge.rit.edu/edge/P15484/public/Detailed%20Design%20Documents/Solar%20Trough%20Preliminary%20analysis%20references/Parabolic%20Trough%20Collector%20Overview.pdf (access on 24 June 2017).
- SYLTHERM 800: Silicone Heat Transfer Fluid. Available online: http://www.loikitsdistribution.com/files/syltherm-800-technical-data-sheet.pdf (access on 24 June 2017).
- Xu, Z.Y.; Wang, R.Z.; Wang, H.B. Experimental evaluation of a variable effect LiBr-water absorption chiller designed for high-efficient solar cooling system. Int. J. Refrig. 2015, 59, 135–143. [Google Scholar] [CrossRef]
- Bellos, E.; Tzivanidis, C.; Antonopoulos, K.A. Exergetic, energetic and financial evaluation of a solar driven absorption cooling system with various collector types. Appl. Therm. Eng. 2016, 102, 749–759. [Google Scholar] [CrossRef]
- F-Chart Software, Engineering Equation Solver (EES), 2015. Available online: http://www. fchart.com/ees (access on 24 June 2017).
- Sotomonte, C.A.R.; Ribeiro, S.; Oliveira, E.; Lora, E.E.S.; Venturini, O.J. Organic Rankine cycle associated with an absorption chiller for biomass applications. Therm. Eng. 2011, 10, 15–22. [Google Scholar]
- Turkyilmazoglu, M. Condensation of laminar film over curved vertical walls using single and two-phase nanofluid models. Eur. J. Mech. B Fluids 2017, 65, 184–191. [Google Scholar] [CrossRef]
- Ayatollahi, M.; Nasiri, S.H.; Kasaeian, A.B. Convection heat transfer modeling of Ag nanofluid using different viscosity theories. IIUM Eng. J. 2012, 13, 1–11. [Google Scholar]
- Khanafer, K.; Vafai, K. A critical synthesis of thermophysical characteristics of nanofluids. Int. J. Heat Mass Transf. 2011, 54, 4410–4428. [Google Scholar] [CrossRef]
- Yu, W.; Choi, S.U.S. The role of interfacial layers in the enhanced thermal conductivity of nanofluids: A renovated Maxwell model. J. Nanopart. Res. 2003, 5, 167. [Google Scholar] [CrossRef]
- Duangthongsuk, W.; Wongwises, S. An experimental study on the heat transfer performance and pressure drop of TiO2-water nanofluids flowing under a turbulent flow regime. Int. J. Heat Mass Transf. 2010, 53, 334–344. [Google Scholar] [CrossRef]
- Batchelor, G.K. The effect of Brownian motion on the bulk stress in a suspension of spherical particles. J. Fluid Mech. 1977, 83, 97–117. [Google Scholar] [CrossRef]
- Said, Z.; Saidur, R.; Sabiha, M.A.; Hepbasli, A.; Rahim, N.A. Energy and exergy efficiency of a flat plate solar collector using pH treated Al2O3 nanofluid. J. Clean. Product. 2016, 112, 3915–3926. [Google Scholar] [CrossRef]
- Duffie, J.A.; Beckman, W.A. Solar Engineering of Thermal Processes, 3rd ed.; Wiley: Hoboken, NJ, USA, 2006. [Google Scholar]
- Forristall, R. Heat Transfer Analysis and Modeling of a Parabolic Trough Solar Receiver Implemented in Engineering Equation Solver; National Renewable Energy Laboratory (NREL): Golden, CO, USA, 2003.
- Qiu, Y.; Li, M.J.; He, Y.-L.; Tao, W.Q. Thermal performance analysis of a parabolic trough solar collector using supercritical CO2 as heat transfer fluid under non-uniform solar flux. Appl. Therm. Eng. 2017, 115, 1255–1265. [Google Scholar] [CrossRef]
- Swinbank, W.C. Long-wave radiation from clear skies. QJR Meteorol. Soc. 1963, 89, 339–340. [Google Scholar] [CrossRef]
- Bellos, E.; Mathioulakis, E.; Tzivanidis, C.; Belessiotis, V.; Antonopoulos, K.A. Experimental and numerical investigation of a linear Fresnel solar collector with flat plate receiver. Energy Convers. Manag. 2016, 130, 44–59. [Google Scholar] [CrossRef]
- Leinhard, J., IV; Leinhard V, J. A Heat Transfer Textbook, 4th ed.; Philogiston Press: Cambridge, MA, USA, 2012; pp. 354–360. [Google Scholar]
- Pak, B.C.; Cho, Y.I. Hydrodynamic and heat transfer study of dispersed fluids with submicron metallic oxide particles. Exp. Heat Transf. 1998, 11, 151–170. [Google Scholar] [CrossRef]
- Xuan, Y.; Li, Q. Investigation on convective heat transfer and flow features of nanofluids. ASME. J. Heat Transf. 2003, 125, 151–155. [Google Scholar] [CrossRef]
- Yu, H.; Feng, X.; Wang, Y. A new pinch based method for simultaneous selection of working fluid and operating conditions in an ORC (organic Rankine cycle) recovering waste heat. Energy 2015, 90, 36–46. [Google Scholar] [CrossRef]
- Tzivanidis, C.; Bellos, E.; Antonopoulos, K.A. Energetic and financial investigation of a stand-alone solar-thermal organic Rankine cycle power plant. Energy Convers. Manag. 2016, 126, 421–433. [Google Scholar] [CrossRef]
- El-Emam, R.S.; Dincer, I.; Zamfirescu, C. Greenization factor as a sustainability measure for energy systems. In Energy Solutions to Combat Global Warming; Zhang, X.-R., Dincer, I., Eds.; Springer International Publishing: Cham, Switzerland, 2017; Volume 33, pp. 735–751. [Google Scholar]
- Bellos, E.; Tzivanidis, C.; Antonopoulos, K.A. Parametric investigation and optimization of an innovative trigeneration system. Energy Convers. Manag. 2016, 127, 515–525. [Google Scholar] [CrossRef]
- Petela, R. Exergy analysis of solar radiation. In Solar Thermal Sciences and Engineering Applications; Enteria, N., Akbarzadeh, A., Eds.; CRC Press, Taylor & Francis Group: Gainesville, FL, USA, 2013. [Google Scholar]
- Bellos, E.; Tzivanidis, C.; Antonopoulos, K.A. A detailed working fluid investigation for solar parabolic trough collectors. Appl. Therm. Eng. 2017, 114, 374–386. [Google Scholar] [CrossRef]
- Behar, O.; Khellaf, A.; Mohammedi, K. A novel parabolic trough solar collector model—Validation with experimental data and comparison to Engineering Equation Solver (EES). Energy Convers. Manag. 2015, 106, 268–281. [Google Scholar] [CrossRef]
Figure 1.
The examined solar driven trigeneration system.
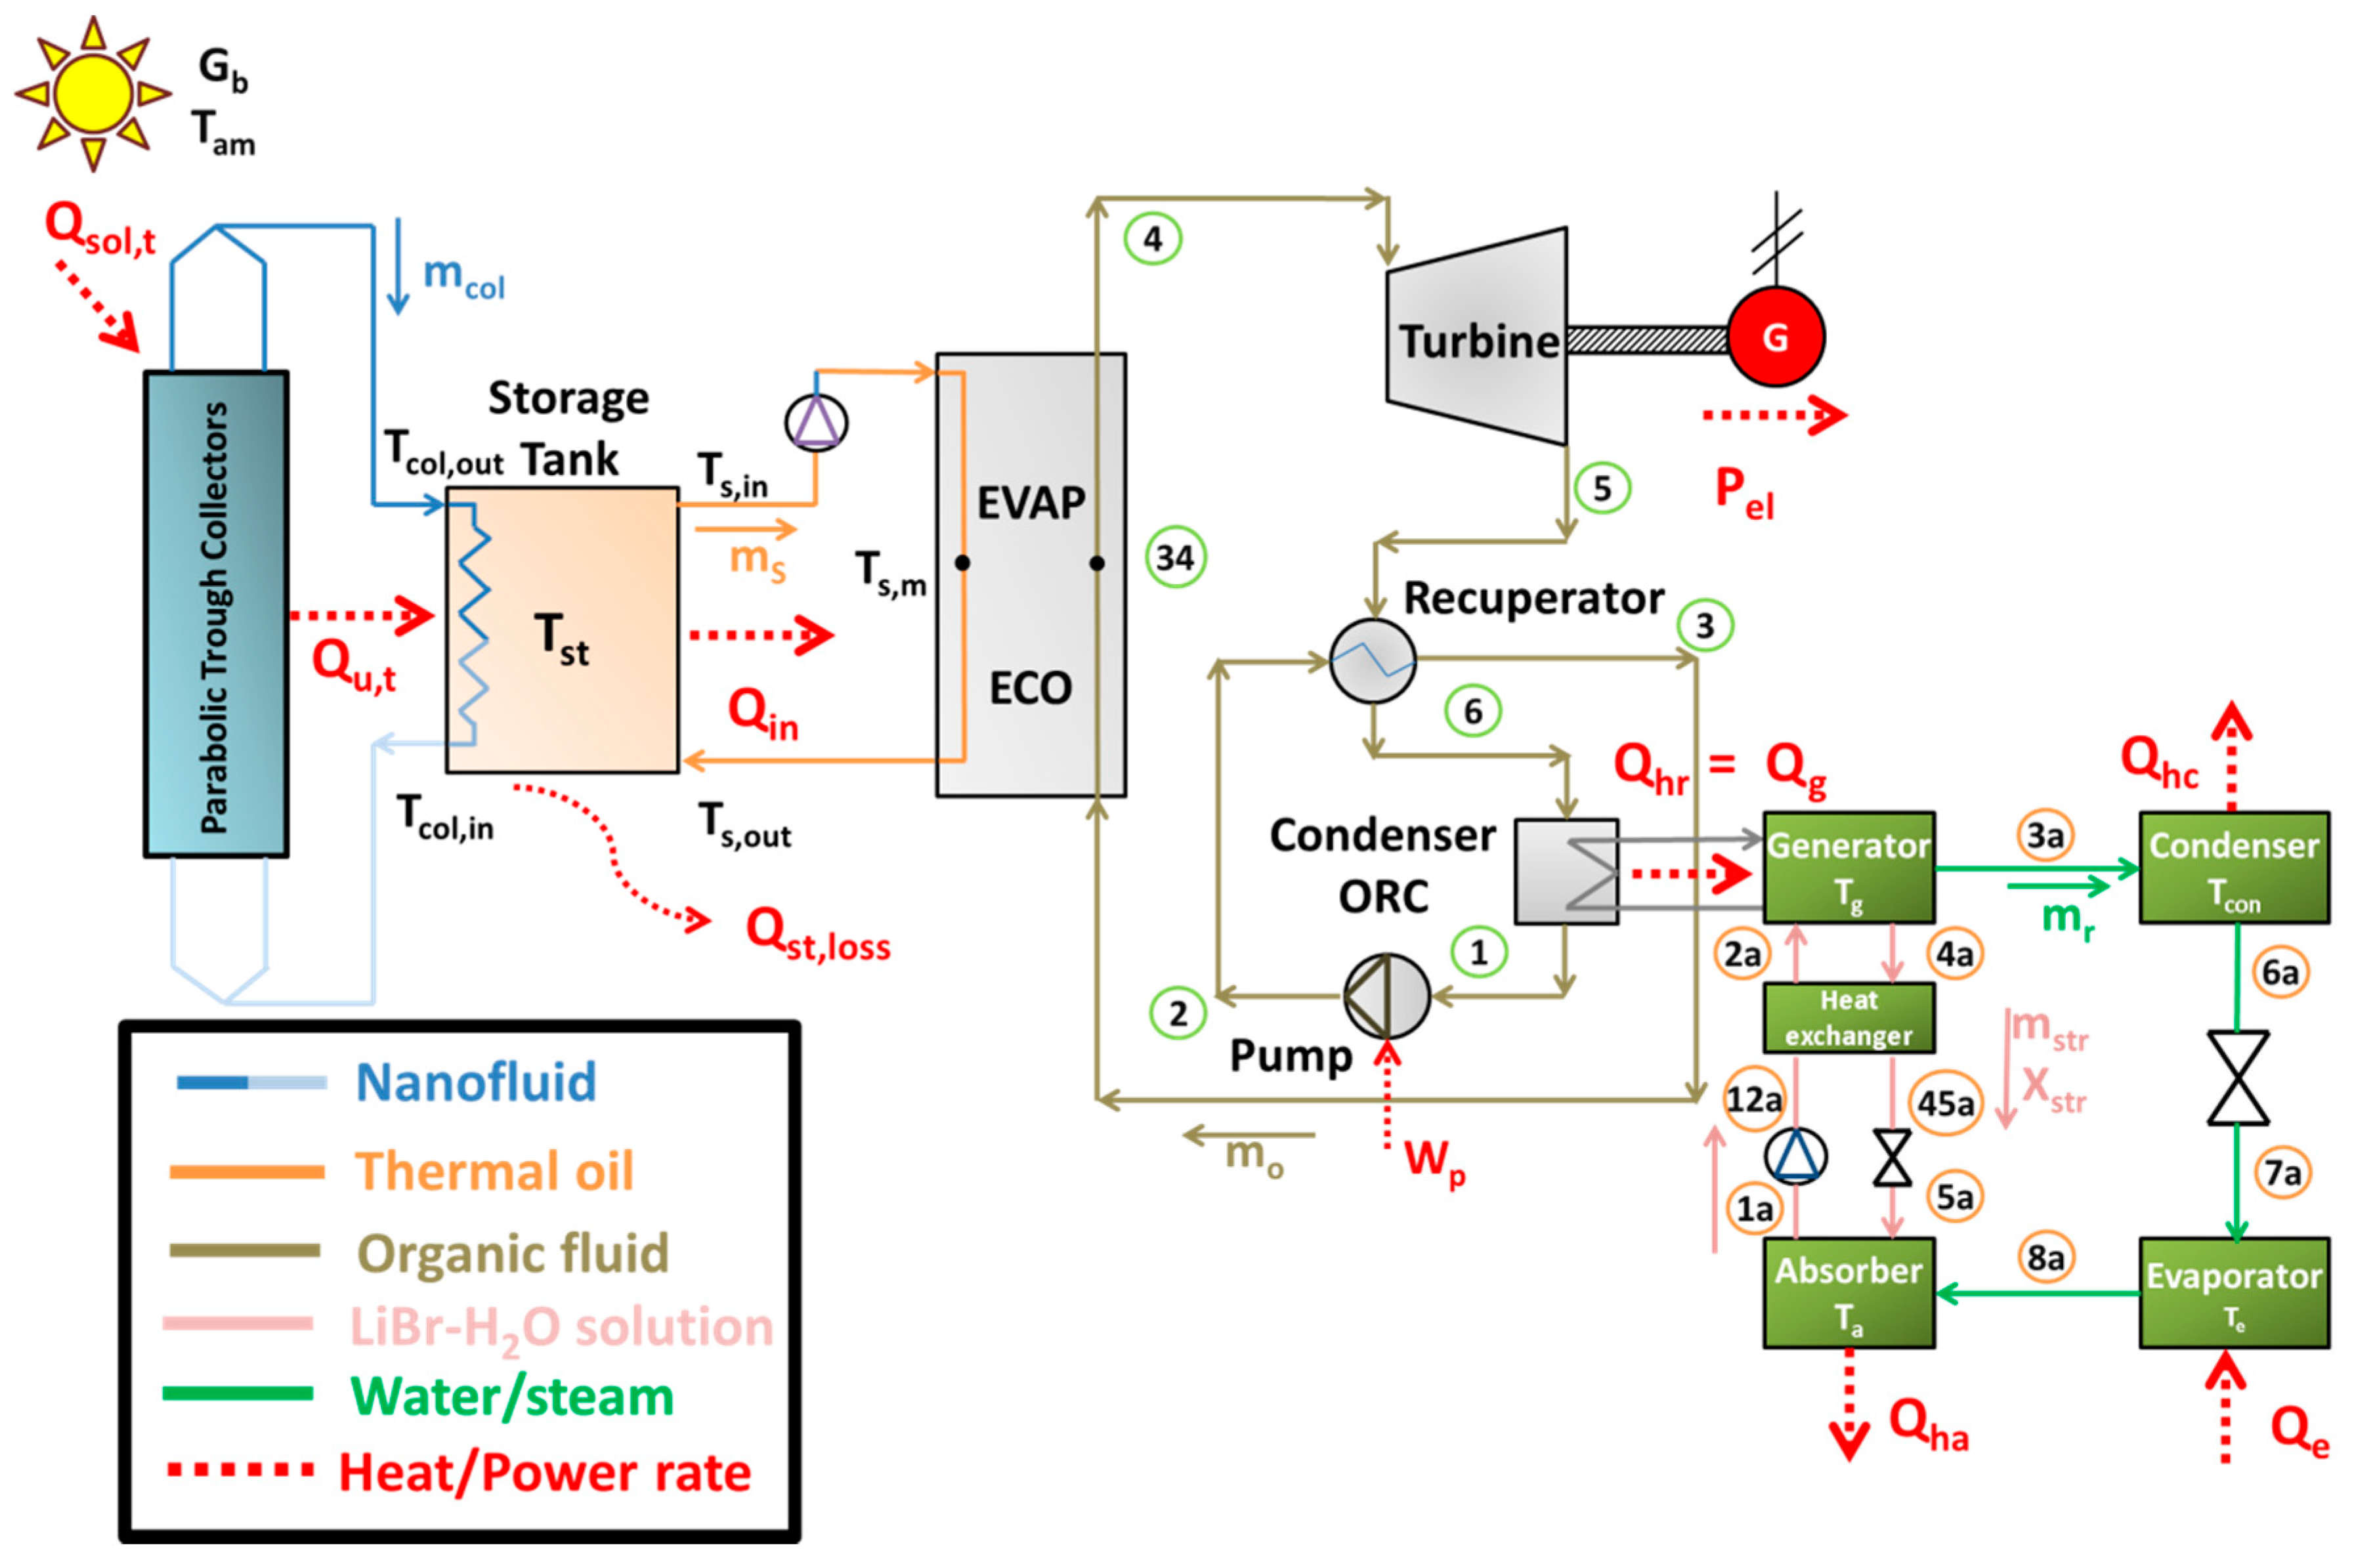
Figure 2.
The saturation lines of the examined organic fluids in T-s diagram.
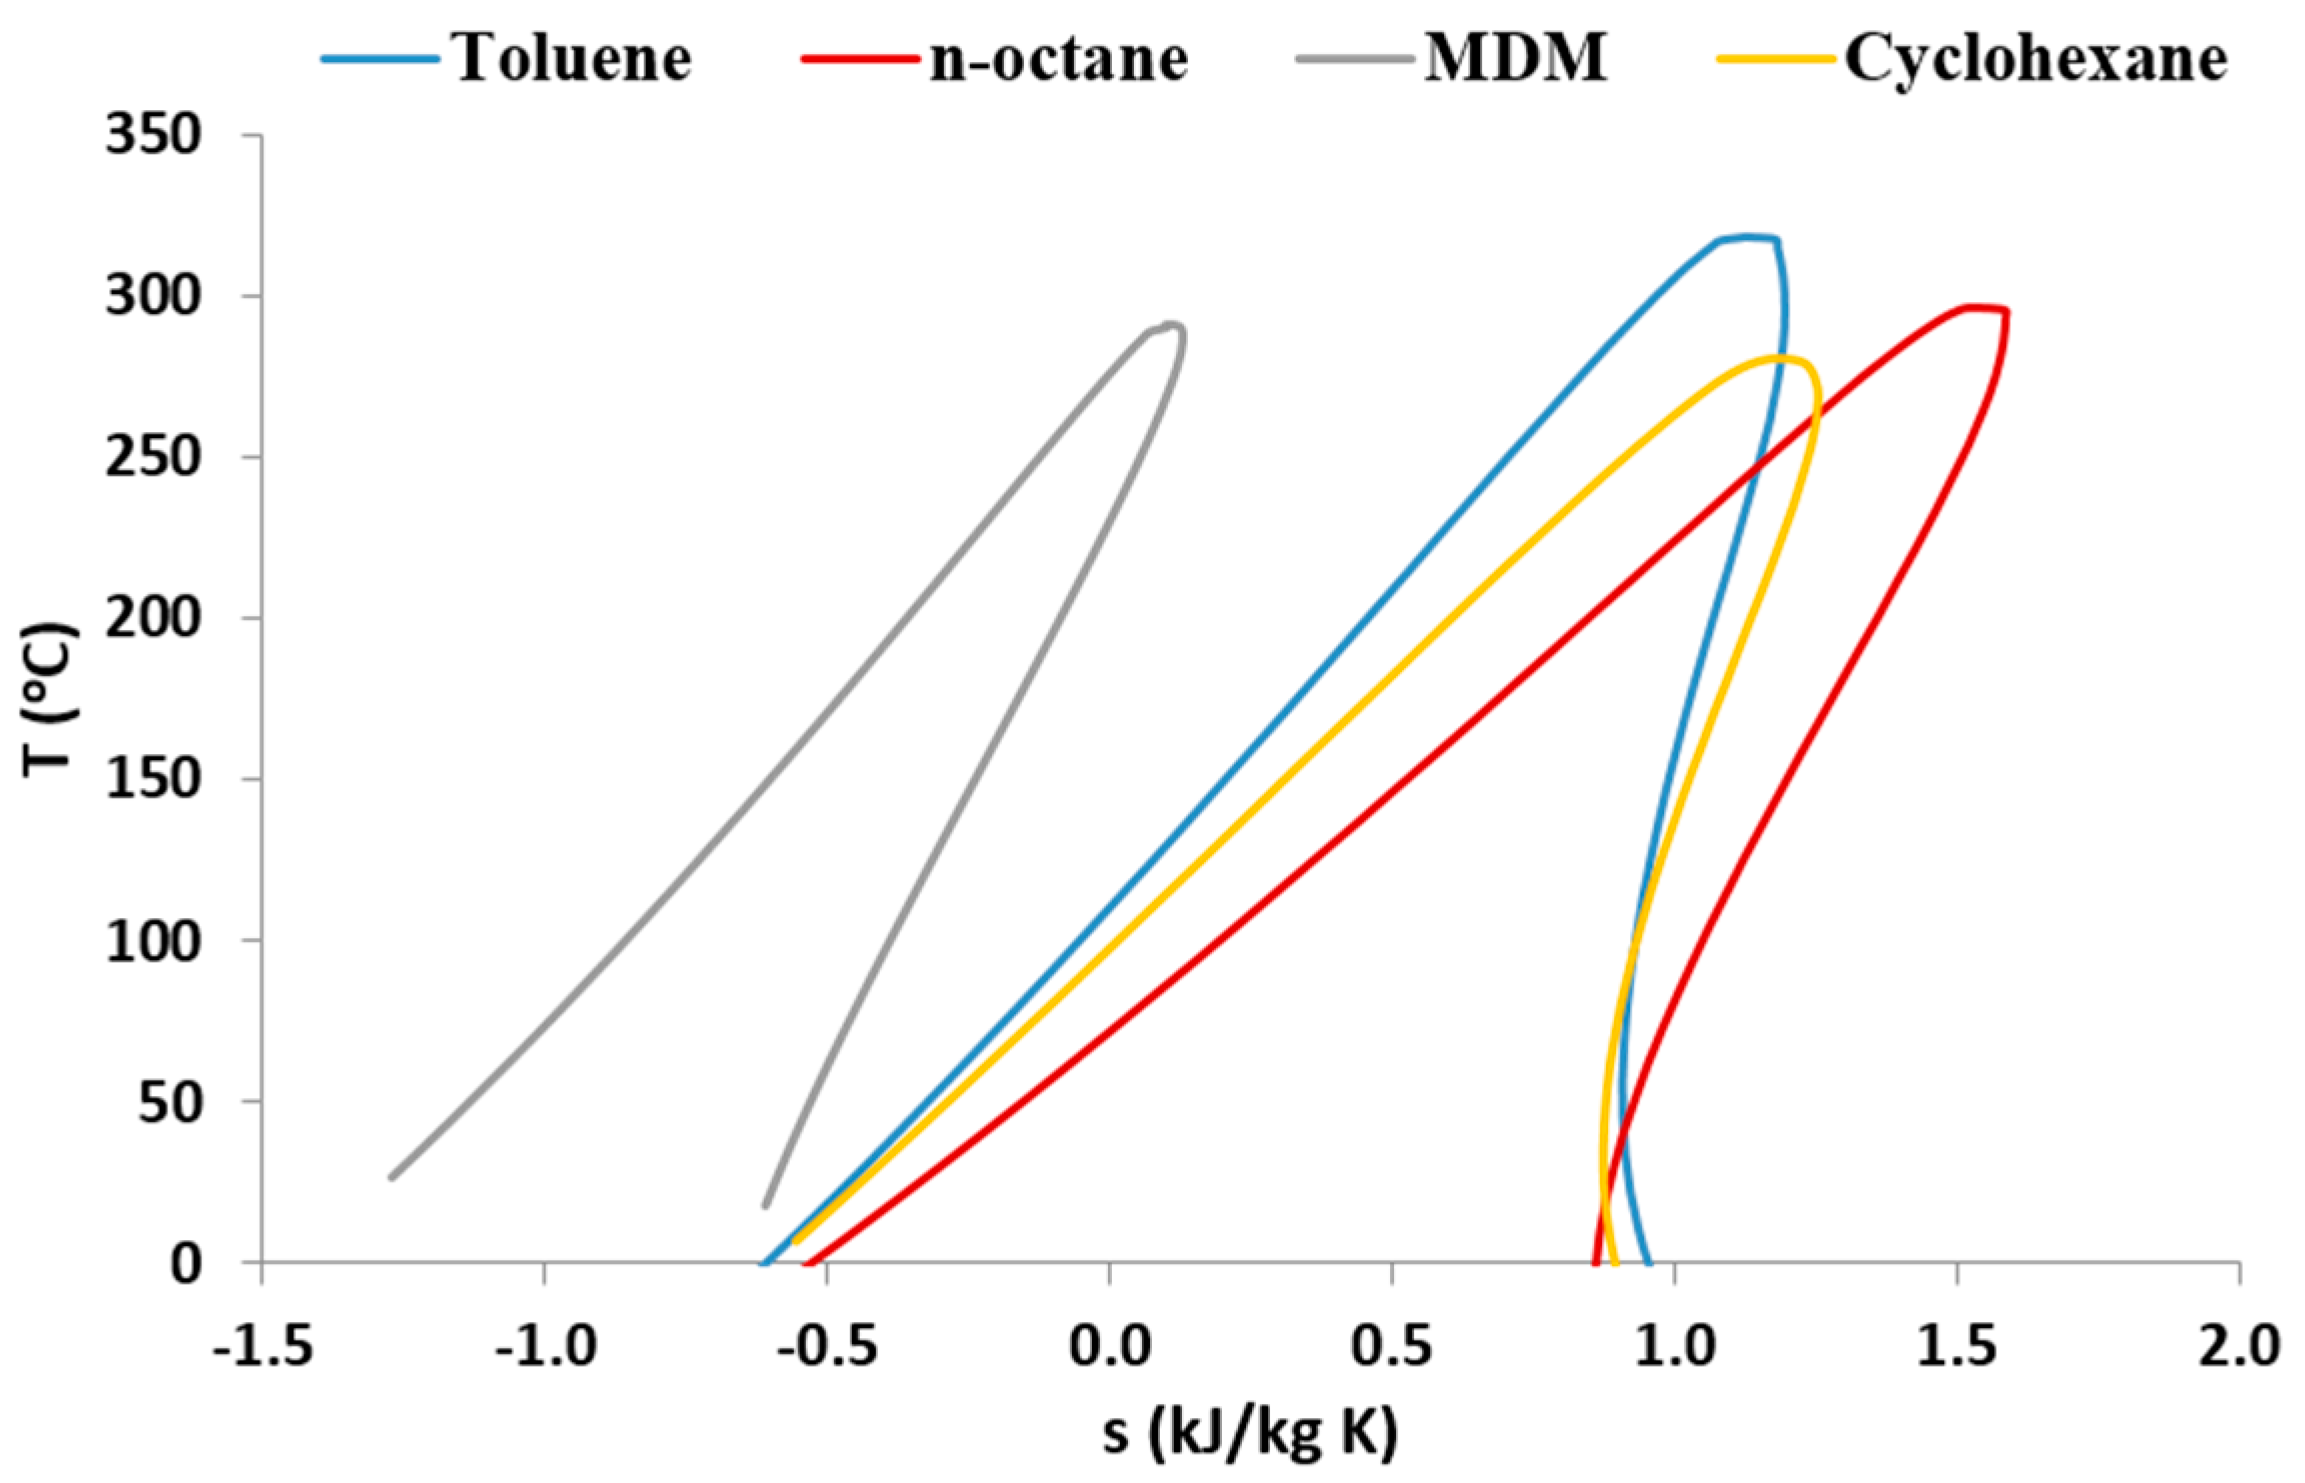
Figure 3.
Thermal properties of nanofluids (a) specific heat capacity (b) density (c) thermal conductivity and (d) dynamic viscosity.
Figure 3.
Thermal properties of nanofluids (a) specific heat capacity (b) density (c) thermal conductivity and (d) dynamic viscosity.
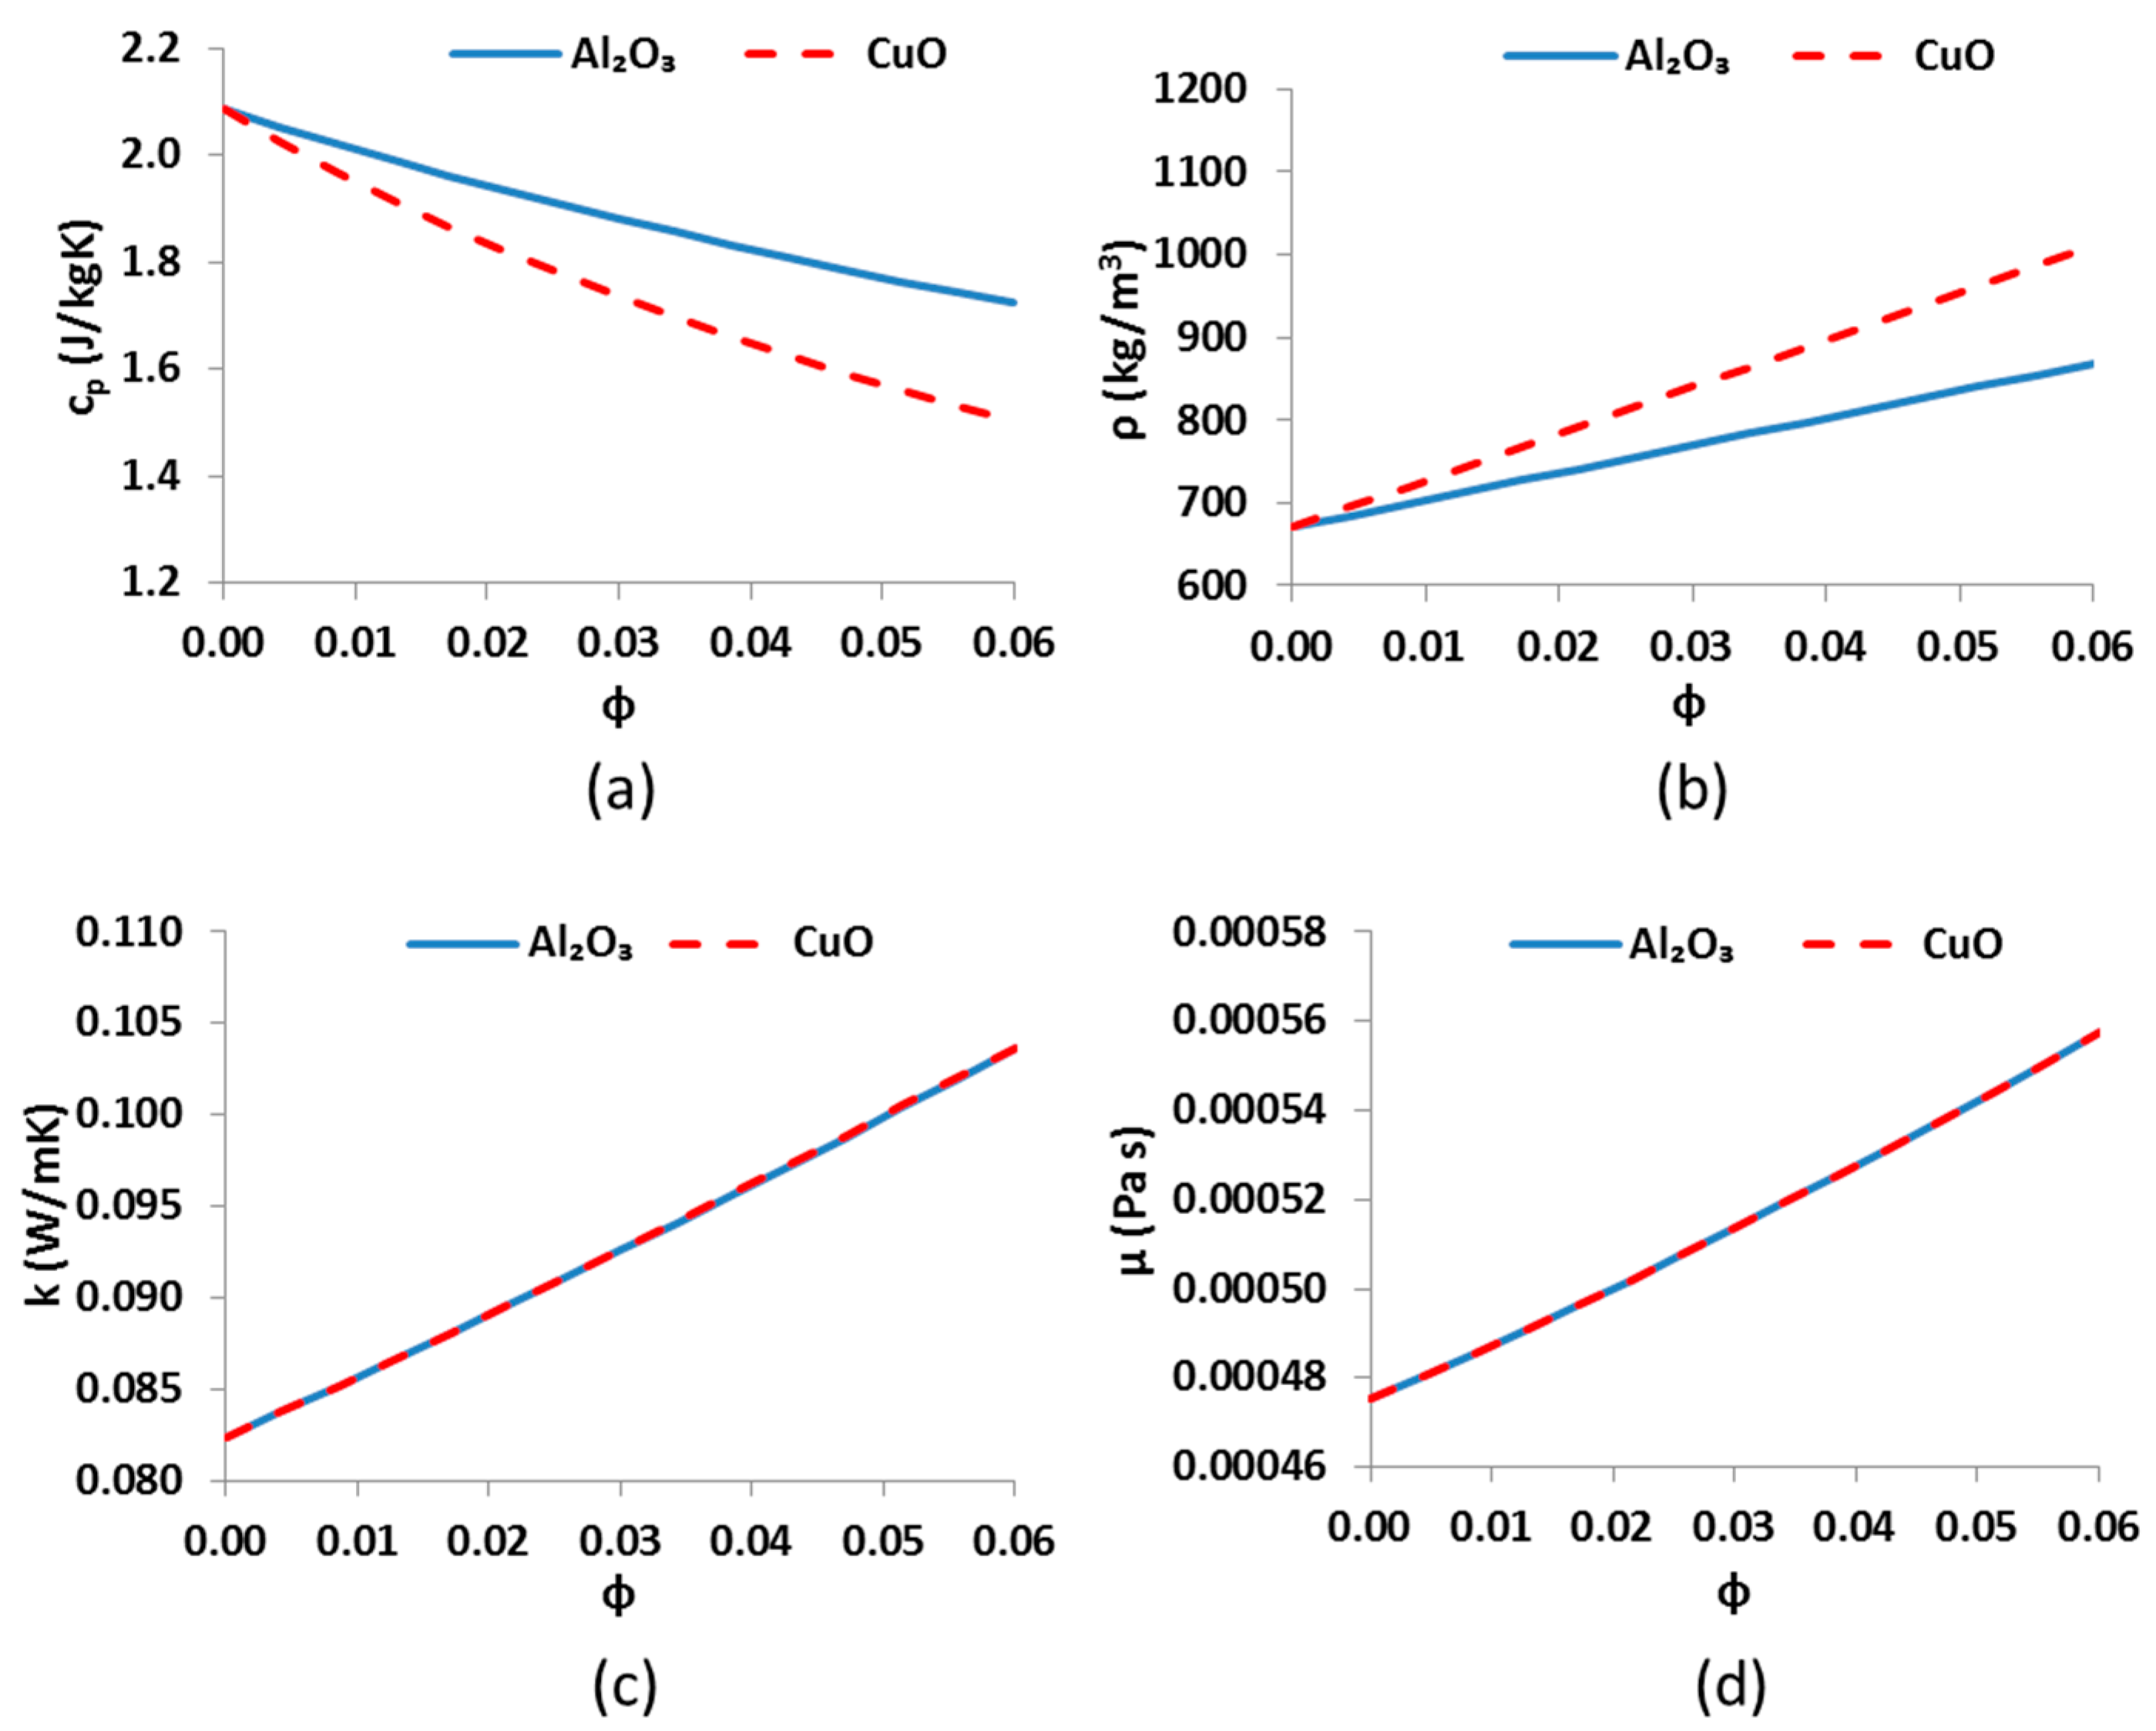
Figure 4.
The heat transfer process in the heat recovery system.

Figure 5.
Exergetic and energetic efficiency for various pressure ratios and for all the examined organic fluids with CuO-Syltherm nanofluid in PTCs.
Figure 5.
Exergetic and energetic efficiency for various pressure ratios and for all the examined organic fluids with CuO-Syltherm nanofluid in PTCs.

Figure 6.
Electricity and cooling load production for various pressure ratios and for all the examined organic fluids with CuO-Syltherm nanofluid in PTCs.
Figure 6.
Electricity and cooling load production for various pressure ratios and for all the examined organic fluids with CuO-Syltherm nanofluid in PTCs.

Figure 7.
Exergetic and energetic efficiency for various heat rejection temperatures and for all the examined organic fluids with CuO-Syltherm nanofluid in PTCs.
Figure 7.
Exergetic and energetic efficiency for various heat rejection temperatures and for all the examined organic fluids with CuO-Syltherm nanofluid in PTCs.
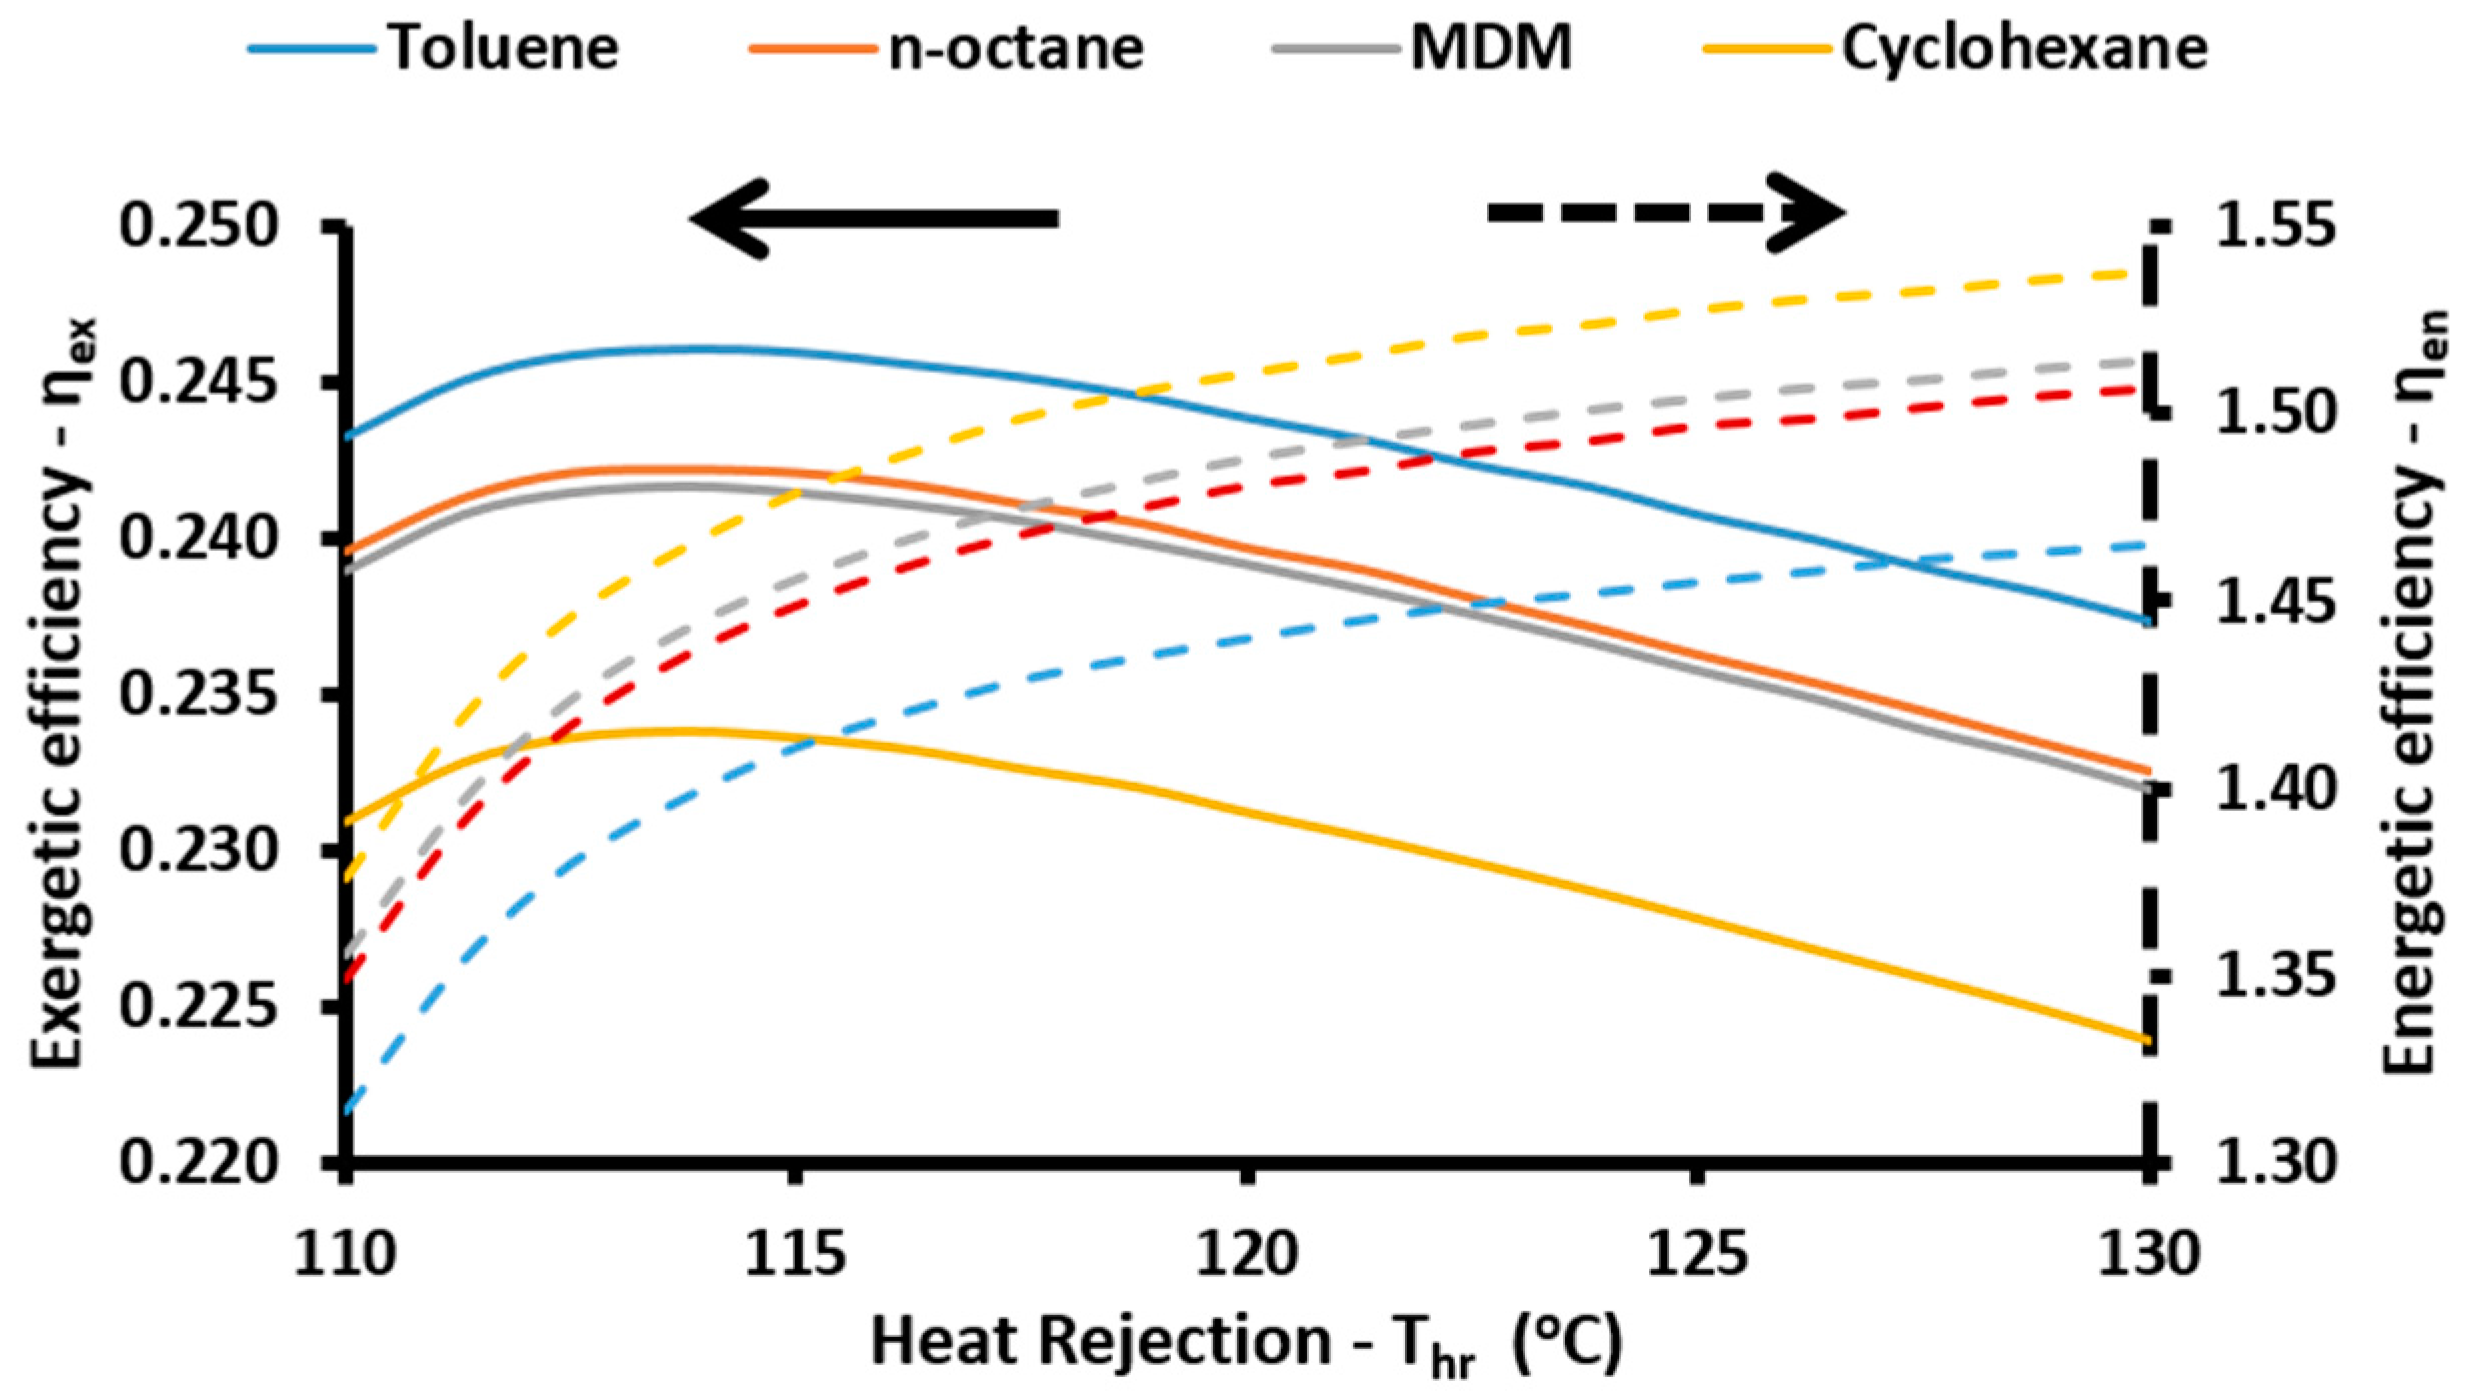
Figure 8.
Electricity and cooling load production for various heat rejection temperatures and for all the examined organic fluids with CuO-Syltherm nanofluid in PTCs.
Figure 8.
Electricity and cooling load production for various heat rejection temperatures and for all the examined organic fluids with CuO-Syltherm nanofluid in PTCs.
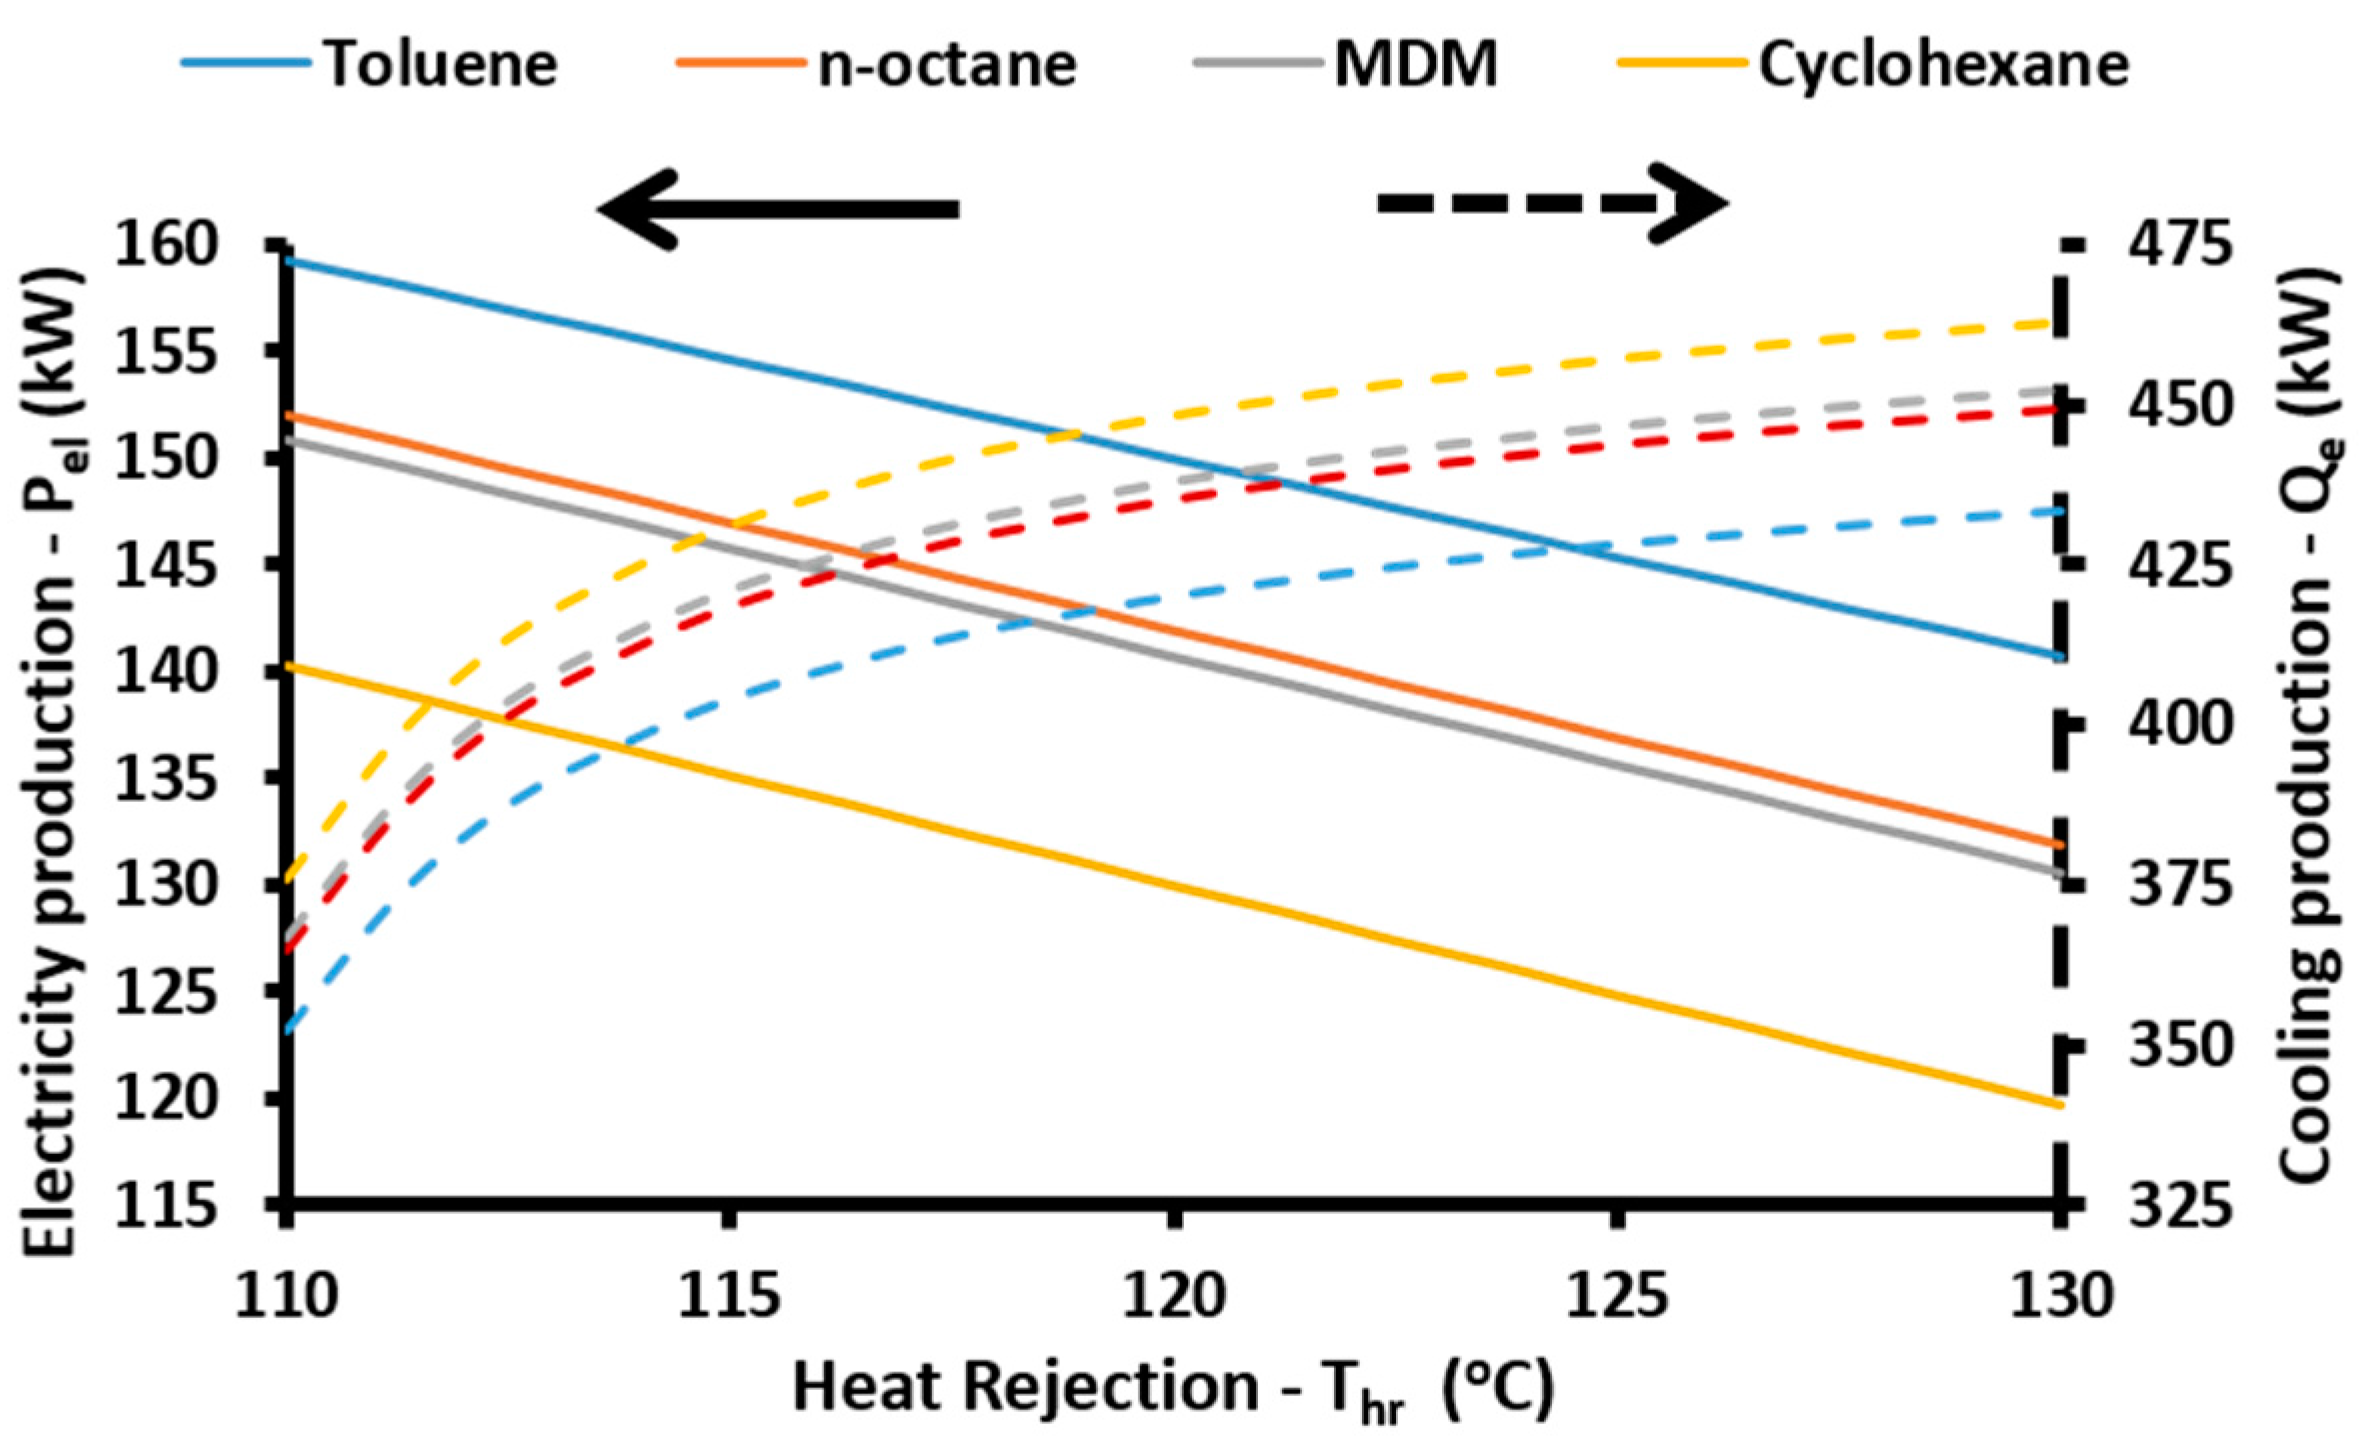
Figure 9.
Cooling and heating COP of the absorption heat pump for various heat rejection temperatures.
Figure 9.
Cooling and heating COP of the absorption heat pump for various heat rejection temperatures.
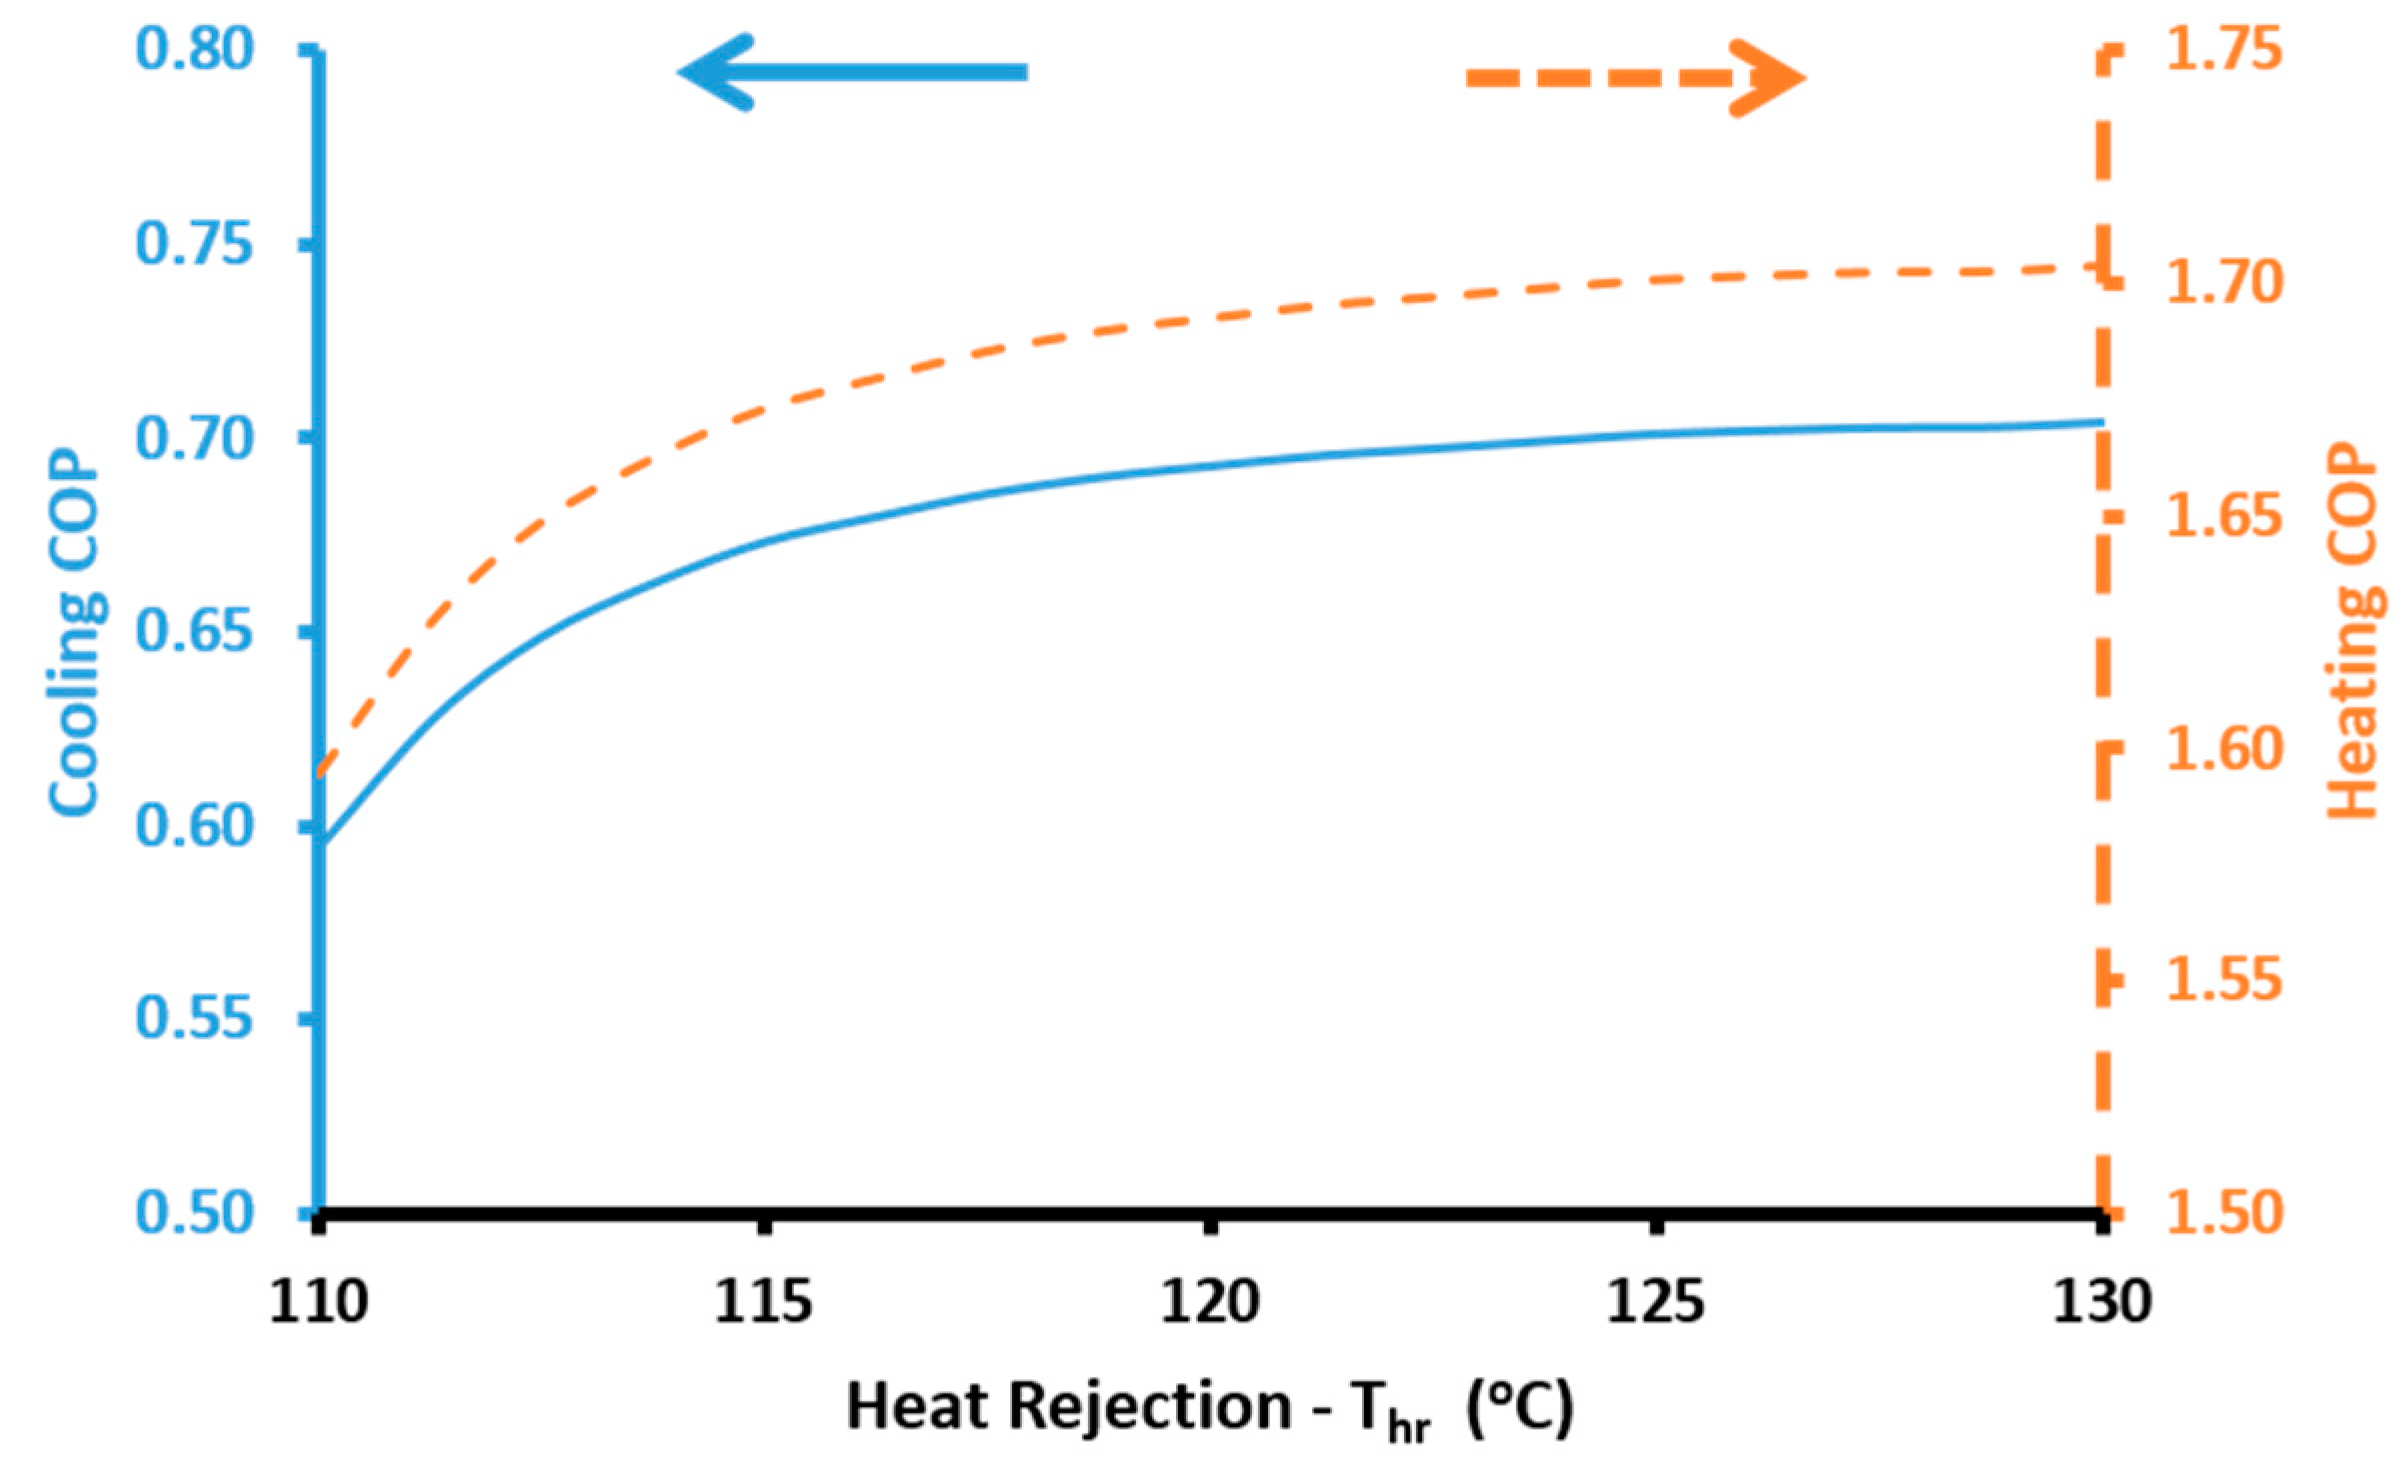
Figure 10.
Exergetic efficiency for various concentration ratios and for all the combinations of organic working fluids with nanofluids in PTCs.
Figure 10.
Exergetic efficiency for various concentration ratios and for all the combinations of organic working fluids with nanofluids in PTCs.
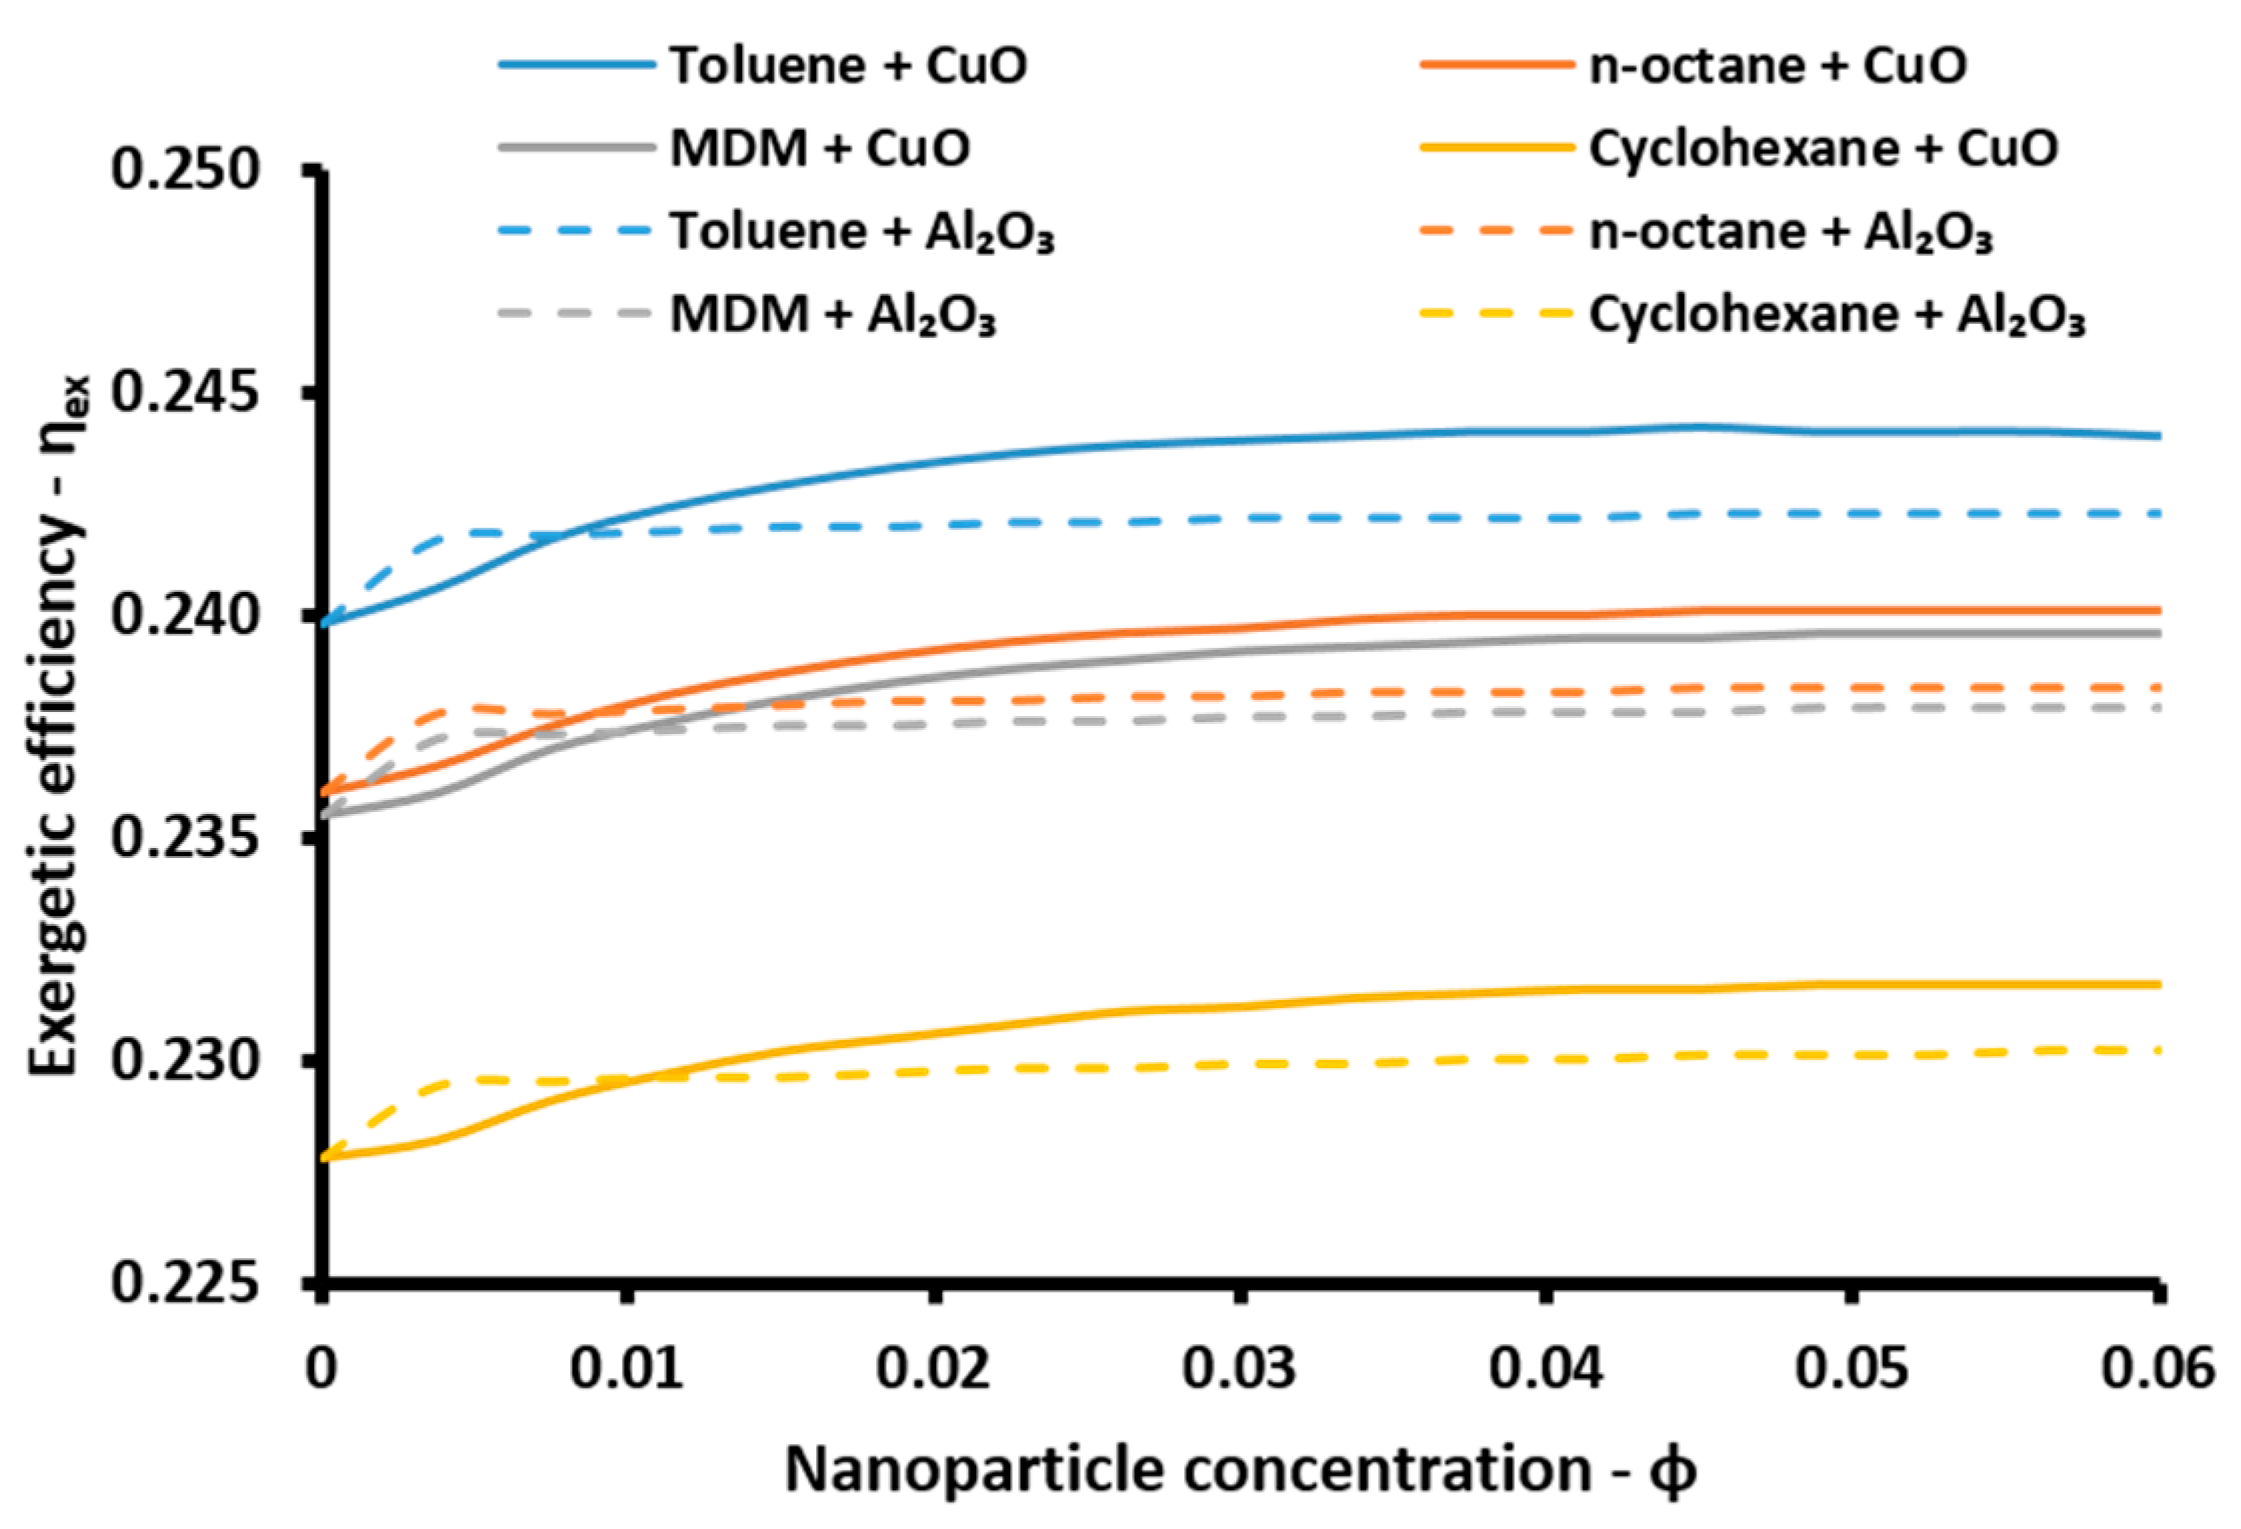
Figure 11.
Energetic efficiency for various concentration ratios and for all the combinations of organic working fluids with nanofluids in PTCs.
Figure 11.
Energetic efficiency for various concentration ratios and for all the combinations of organic working fluids with nanofluids in PTCs.

Figure 12.
Electricity production for various concentration ratios and for all the combinations of organic working fluids with nanofluids in PTCs.
Figure 12.
Electricity production for various concentration ratios and for all the combinations of organic working fluids with nanofluids in PTCs.
Figure 13.
Cooling production for various concentration ratios and for all the combinations of organic working fluids with nanofluids in PTCs.
Figure 13.
Cooling production for various concentration ratios and for all the combinations of organic working fluids with nanofluids in PTCs.
Figure 14.
Cooling production for various concentration ratios and for all the combinations of organic working fluids with nanofluids in PTCs.
Figure 14.
Cooling production for various concentration ratios and for all the combinations of organic working fluids with nanofluids in PTCs.

Figure 15.
Exergetic efficiency enhancement after the optimization for all the examined case.

Figure 16.
Optimum pressure ratios for all the examined case.
Figure 17.
Optimum nanoparticle concentrations of the nanofluids case.
Figure 18.
Exergetic efficiency enhancement compared to the respective cases with pure Syltherm 800.
Figure 18.
Exergetic efficiency enhancement compared to the respective cases with pure Syltherm 800.

Figure 19.
Energetic efficiency enhancement compared to the respective cases with pure Syltherm 800.
Figure 19.
Energetic efficiency enhancement compared to the respective cases with pure Syltherm 800.
Figure 20.
Electricity production enhancement compared to the respective cases with pure Syltherm 800.
Figure 20.
Electricity production enhancement compared to the respective cases with pure Syltherm 800.
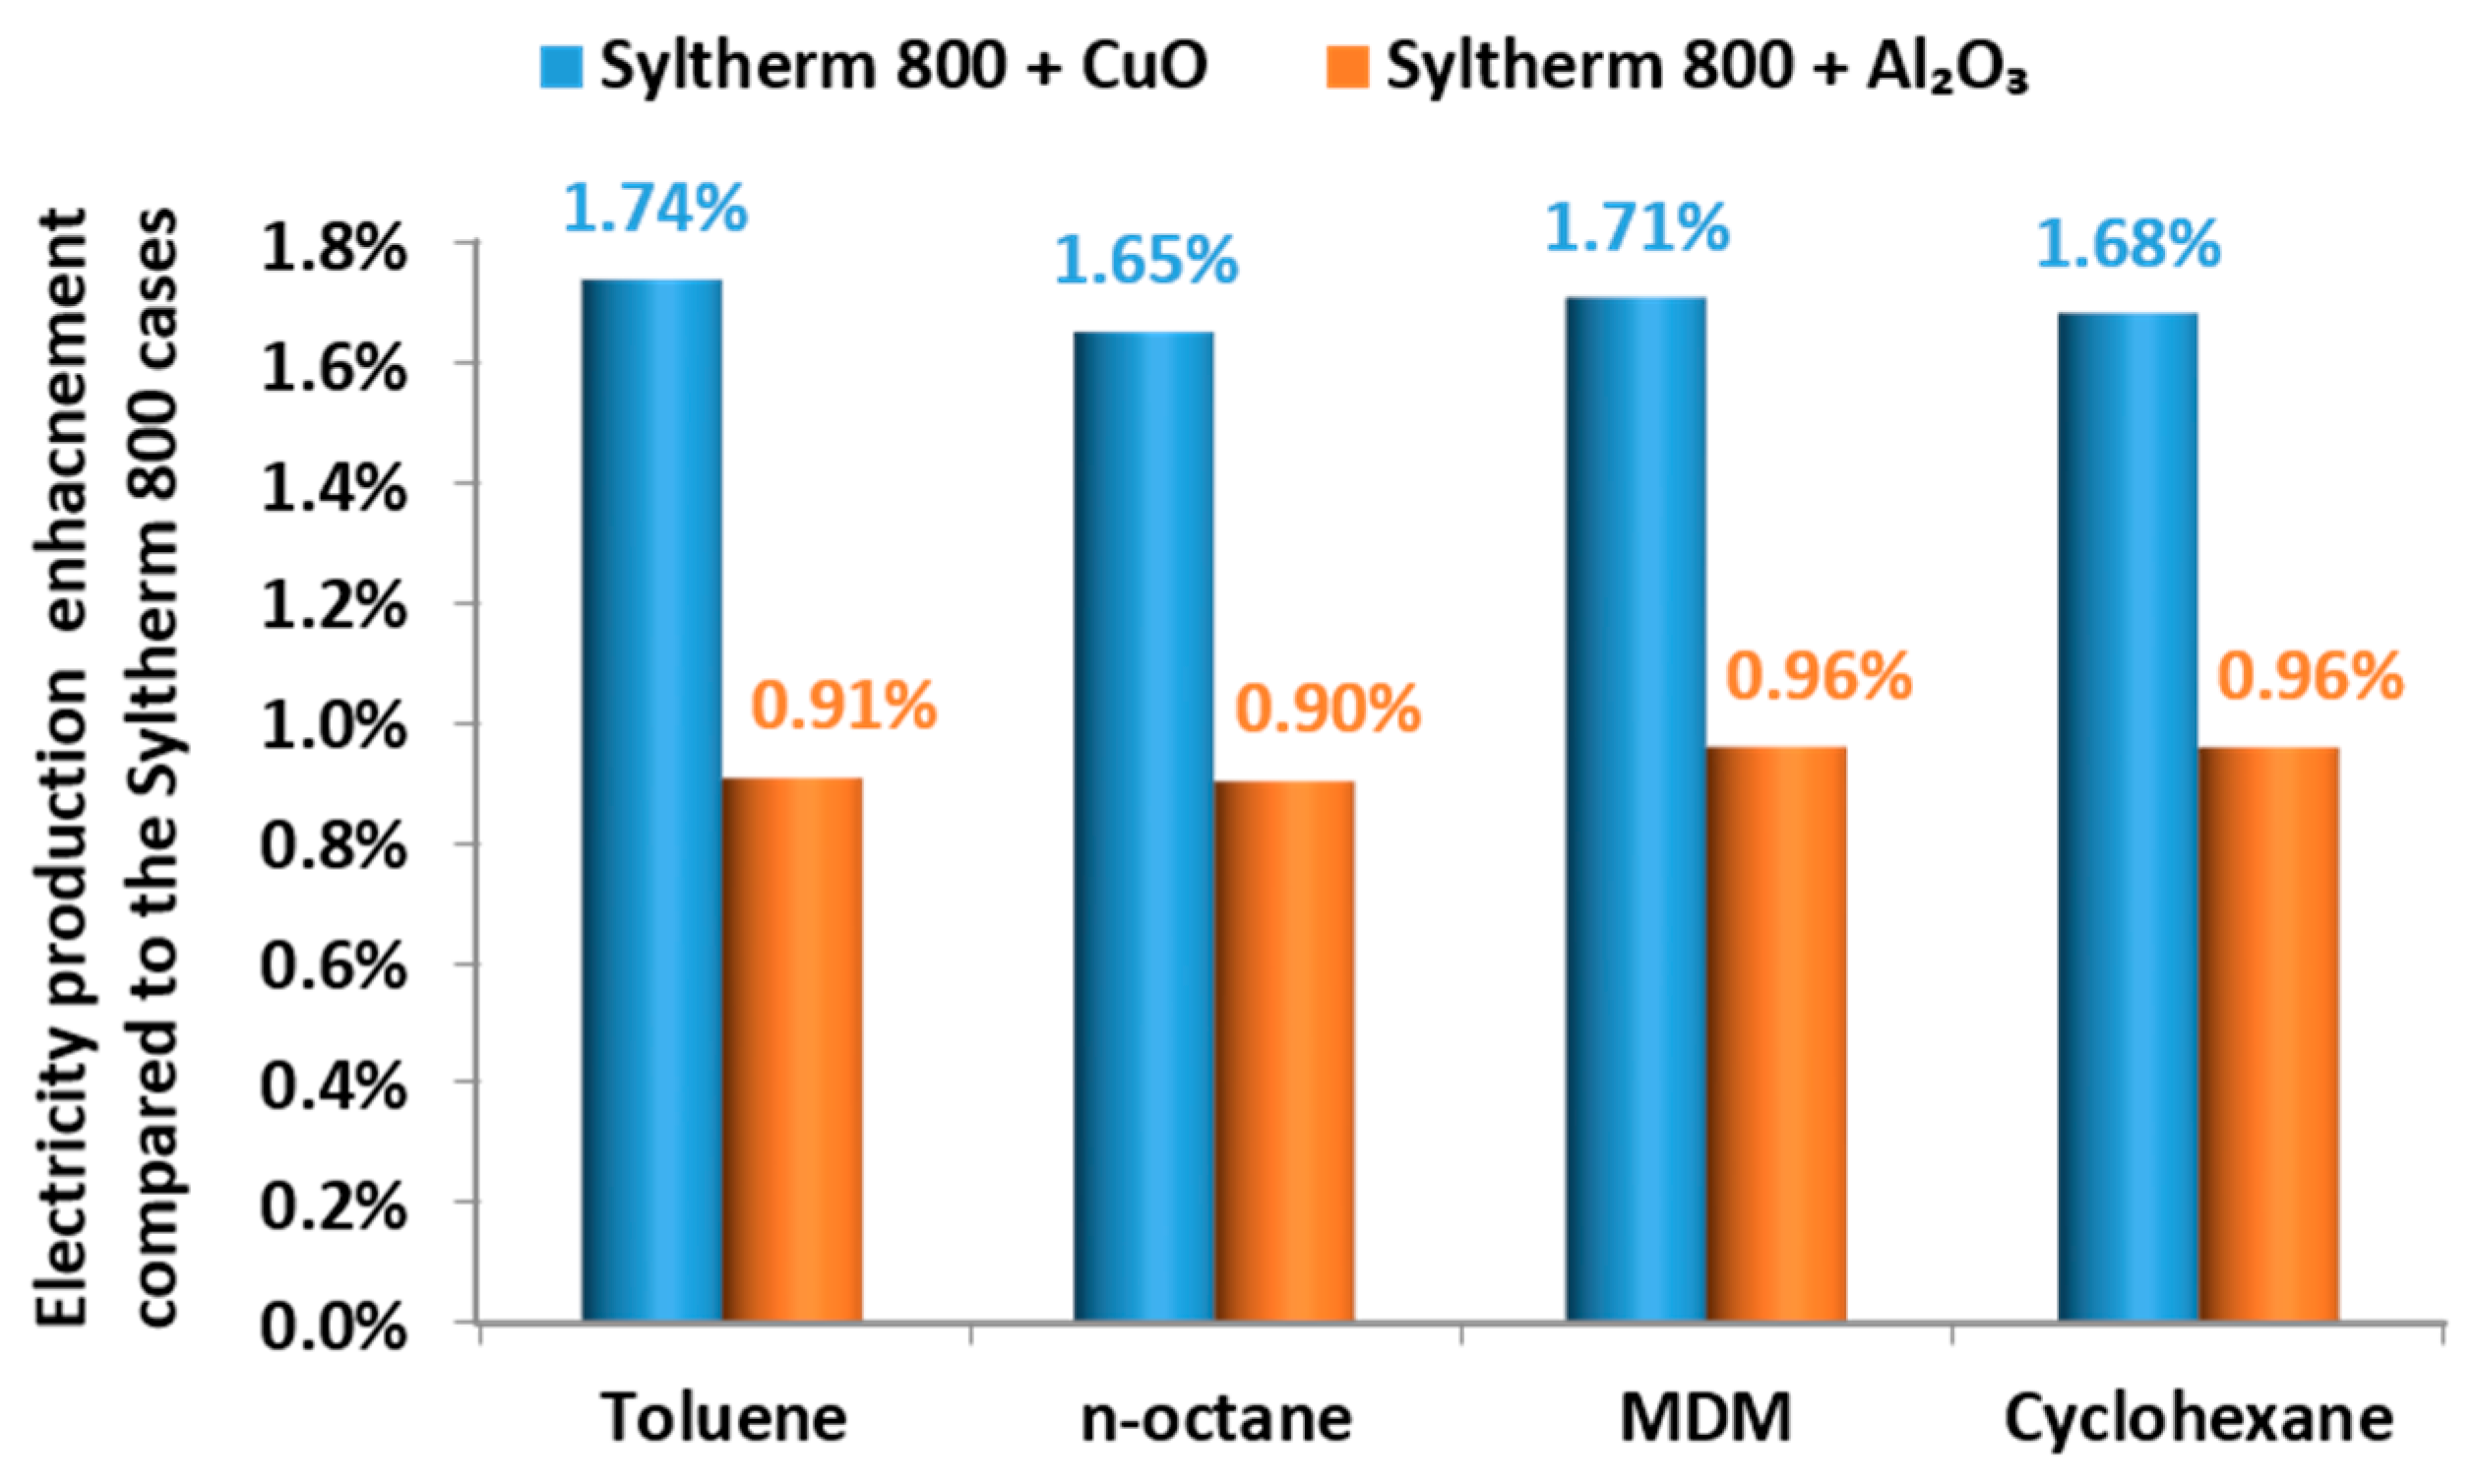
Figure 21.
Cooling production enhancement compared to the respective cases with pure Syltherm 800.

Figure 22.
Heating production enhancement compared to the respective cases with pure Syltherm 800.

Figure 23.
Final evaluation of the optimized cases with the exergetic efficiency criterion.

| Working Fluids | Tcrit (°C) | pcrit (bar) | MW (kg/kmol) |
|---|---|---|---|
| Toluene | 318.60 | 41.26 | 92.14 |
| n-Octane | 296.17 | 24.97 | 114.2 |
| MDM | 290.90 | 14.15 | 236.5 |
| Cyclohexane | 280.49 | 40.75 | 84.16 |
Table 2.
Properties of the examined nanoparticles [30].
Table 2.
Properties of the examined nanoparticles [30].
| Particle | ρ (kg/m3) | k (W/mK) | cp (kJ/kgK) |
|---|---|---|---|
| Al2O3 | 3970 | 40 | 0.765 |
| CuO | 6320 | 77 | 0.532 |
Table 3.
Variable parameters of the present analysis.
| Variable Parameters | Default Value | Examined Range |
|---|---|---|
| Heat rejection temperature (Thr) | 120 °C | 100 °C–140 °C |
| Pressure ratio (PR) | 70% | 50–90% |
| Nanoparticle concentration (φ) | 3% | 0–6% |
Table 4.
System constant parameters.
| Parameters | Values |
|---|---|
| Ambient temperature (Tam) | 25 °C |
| Solar beam irradiation (Gb) | 0.8 kW/m2 |
| Condenser temperature (Tcon) | 40 °C |
| Pinch point (PP) | 20 °C |
| Temperature difference in recuperator (ΔTrc) | 20 °C |
| Electromechanical efficiency of the generator (ηmg) | 98% |
| Turbine isentropic efficiency (ηis) | 85% |
| Organic fluid pump efficiency (ηpum) | 70% |
| Thermal loss coefficient of the storage tank (Ust) | 0.5 × 10⁻³ kW/m2K |
| Storage tank volume (Vst) | 10 m3 |
| Heat exchanger effectiveness (UA)c-st | 17 kW/m2K |
| Volumetric flow rate on the collector module (V) | 3 m3/h |
| Number of modules (N) | 20 |
| Module collecting area (Aa) | 69.2 m2 |
| Collector module length (L) | 12 m |
| Incident angle modifier (K) | ~1 |
| Maximum optical efficiency (ηopt(θ = 0°)) | 0.741 |
| Absorber inner diameter (Dri) | 0.066 m |
| Absorber outer diameter (Dro) | 0.070 m |
| Cover inner diameter (Dci) | 0.120 m |
| Cover outer diameter (Dco) | 0.125 m |
| Cover emittance (εc) | 0.90 |
| Wind speed (Vwind) | 1 m/s |
| Cooling production temperature (Te) | 10 °C |
| Heating production temperature (Th) | 50 °C |
| Temperature difference between condenser-generator (ΔTcg) | 10 K |
| Solution heat exchanger efficiency (ηHEX) | 70% |
| Sun temperature (Tsun) | 5770 K |
Table 5.
Optimization results for the cases with Syltherm 800 + CuO.
| Parameters | Toluene | n-Octane | MDM | Cyclohexane |
|---|---|---|---|---|
| PRopt | 0.761 | 0.849 | 0.900 | 0.876 |
| φopt (%) | 4.35 | 4.64 | 4.61 | 5.23 |
| Thr,opt (°C) | 113.7 | 113.7 | 113.7 | 113.7 |
| ηex | 0.2466 | 0.2442 | 0.2455 | 0.2369 |
| ηen | 1.389 | 1.414 | 1.414 | 1.437 |
| Pel (kW) | 157.1 | 152.3 | 153.8 | 142.2 |
| Qe (kW) | 394.0 | 402.8 | 402.3 | 412.8 |
| Qh (kW) | 987.5 | 1011 | 1010 | 1036 |
| Qin (kW) | 738.3 | 747.5 | 747.9 | 815.6 |
| COPc | 0.6922 | 0.6903 | 0.6903 | 0.6902 |
| COPh | 1.6922 | 1.6903 | 1.6903 | 1.6902 |
| ηorc | 0.2127 | 0.2037 | 0.2056 | 0.1882 |
Table 6.
Optimization results for the cases with Syltherm 800 + Al2O3.
| Parameters | Toluene | n-Octane | MDM | Cyclohexane |
|---|---|---|---|---|
| PRopt | 0.757 | 0.847 | 0.900 | 0.878 |
| φopt (%) | 5.49 | 6.00 | 6.00 | 6.00 |
| Thr,opt (°C) | 113.7 | 113.7 | 113.7 | 113.7 |
| ηex | 0.2447 | 0.2424 | 0.2438 | 0.2353 |
| ηen | 1.379 | 1.404 | 1.404 | 1.427 |
| Pel (kW) | 155.8 | 151.1 | 152.7 | 141.2 |
| Qe (kW) | 391.1 | 400.0 | 399.5 | 410.4 |
| Qh (kW) | 980.3 | 1004 | 1003 | 1030 |
| Qin (kW) | 732.8 | 742.3 | 742.6 | 750.6 |
| COPc | 0.6921 | 0.6902 | 0.6903 | 0.6908 |
| COPh | 1.6921 | 1.6902 | 1.6903 | 1.6908 |
| ηorc | 0.2126 | 0.2036 | 0.2056 | 0.1882 |
Table 7.
Optimization results for the cases with pure Syltherm.
| Parameters | Toluene | n-Octane | MDM | Cyclohexane |
|---|---|---|---|---|
| PRopt | 0.767 | 0.856 | 0.900 | 0.883 |
| φopt (%) | 0 | 0 | 0 | 0 |
| Thr,opt (°C) | 113.7 | 113.7 | 113.7 | 113.7 |
| ηex | 0.2423 | 0.2401 | 0.2415 | 0.2329 |
| ηen | 1.363 | 1.390 | 1.391 | 1.413 |
| Pel (kW) | 154.4 | 149.8 | 151.2 | 139.9 |
| Qe (kW) | 386.7 | 395.9 | 395.8 | 406.1 |
| Qh (kW) | 969.3 | 993.9 | 993.6 | 1019 |
| Qin (kW) | 0.2129 | 0.2038 | 0.2055 | 0.1882 |
| COPc | 0.6921 | 0.6902 | 0.6903 | 0.6907 |
| COPh | 1.6921 | 1.6902 | 1.6903 | 1.6907 |
| ηorc | 0.2129 | 0.2038 | 0.2055 | 0.1882 |
© 2017 by the authors. Licensee MDPI, Basel, Switzerland. This article is an open access article distributed under the terms and conditions of the Creative Commons Attribution (CC BY) license (http://creativecommons.org/licenses/by/4.0/).
Share and Cite
MDPI and ACS Style
Bellos, E.; Tzivanidis, C. Optimization of a Solar-Driven Trigeneration System with Nanofluid-Based Parabolic Trough Collectors. Energies 2017, 10, 848. https://doi.org/10.3390/en10070848
AMA Style
Bellos E, Tzivanidis C. Optimization of a Solar-Driven Trigeneration System with Nanofluid-Based Parabolic Trough Collectors. Energies. 2017; 10(7):848. https://doi.org/10.3390/en10070848
Chicago/Turabian StyleBellos, Evangelos, and Christos Tzivanidis. 2017. "Optimization of a Solar-Driven Trigeneration System with Nanofluid-Based Parabolic Trough Collectors" Energies 10, no. 7: 848. https://doi.org/10.3390/en10070848
Note that from the first issue of 2016, this journal uses article numbers instead of page numbers. See further details here.