Article

A Non-Ventilated Solar Façade Concept Based on Selective and Transparent Insulation Material Integration: An Experimental Study

Faculty of Civil Engineering, Brno University of Technology, AdMaS Centre, Brno 602 00, Czech Republic
*
Author to whom correspondence should be addressed.
Energies 2017, 10(6), 815; https://doi.org/10.3390/en10060815
Submission received: 12 April 2017 / Revised: 29 May 2017 / Accepted: 8 June 2017 / Published: 15 June 2017
(This article belongs to the Special Issue Solar Energy Application in Buildings)

Abstract

:
A new solar façade concept based on transparent insulation and a selective absorber is proposed, tested and compared with conventional insulation and a non-selective type of absorber, respectively. The presented study focuses on an experimental non-ventilated solar type of façade exposed to solar radiation both in the laboratory and in outdoor tests. Due to the high solar absorbance level of the façade, high- and low-emissivity contributions were primarily analysed. All of the implemented materials were contrasted from the thermal and optical point of view. An analysis was made of both thermodynamic and steady state procedures affecting the proposed solar façade concept. Experimental full scale tests on real building components were additionally involved during summer monitoring. An indicator of the temperature response generated by solar radiation exposure demonstrates the outdoor performance of the façade is closely related to overheating phenomena. From the thermal point of view, the proposed transparent insulation and selective absorber concept corresponds to the performance of conventional thermal insulation of identical material thickness; however, the non-selective prototype only provides 50% thermal performance. The results of the solar-based experiments show that with a small-scale experimental prototype, approximately no significant difference is measured when compared with a non-selective absorber type. The only difference was achieved at the maximum of 2.5 K, when the lower temperature was obtained in the solar selective concept. At the full-scale outdoor mode, the results indicate a maximum of 3.0 K difference, however the lower temperature achieves a non-selective approach. This solar façade can actively contribute to the thermal performance of building components during periods of heating.

Graphical Abstract

1. Introduction

Today, research and development in the field of comprehensive building solutions and the implementation of advanced forms of materials in construction are in great demand. This is primarily due to the expansion of new scientific knowledge in both fields. Furthermore, the challenge is to achieve flexibility in the manufacturing of building façade components in order to adapt them to different types of facades and meet our current needs. At present, buildings are usually constructed with a frame structure which is filled by prefabricated façade panels, these being either modular or with adaptable ways. Such panels have disadvantages, such their focus is on only some building physics features (e.g., lighting, shading, thermal insulation, acoustics, fire protection, and moisture handling), and limited (if any) integration of renewable energy sources. That is why multifunctional [1,2,3], adaptive and responsive [4,5] façade systems are designed to be used in modular constructions and future façade design approaches with the highest possible level of prefabrication and at the same time the best possible integration of renewable energy generation (e.g., solar, photovoltaics, hybrid technologies, etc.). That is why actually switching from static to adaptable and dynamic building envelopes [6] is seeing rapid progress. Recently, a wide range of progressive solutions have been investigated. Newly disseminated theoretical findings can be implemented in the field of building science. Another related research topic is the development and evaluation of different technical solutions and the integration of new progressive materials. Considering the most recent findings, it could be one way of improving the thermal and/or energy performance of current buildings and including new technologies [7,8]. New ideas and the latest developments in research into various innovative materials, for instance materials with phase change aspects (PCMs) [9,10], transparent insulation materials (TIMs), vacuum insulation panels (VIPs) [11], and materials specifically based on new nano-technologies such as aerogel insulation [12], etc., are becoming the basis for a variety of potential combinations in future building components. One possible way of developing solar technology even involves the development of materials with spectral selective functions [13] that can principally employ individually required parameters for specific cases within the thermal radiation spectrum. Concurrently, in the near future, the directives and requirements of the Energy Performance of Buildings Directive II framework will be enforced for all building types: newly built, retrofitted and revitalized, residential and non-residential, etc. with regard to attaining near zero energy performance attributes and subsequently approaching a zero energy balance. This requires a high level of thermal insulation function throughout the whole building envelope. When we consider the opaque vertical parts of the envelope, depending on building type, basically the proportion of the walls taken up by such parts consists of more than 50% of the total area. As a result, the opaque building envelope becomes of high relevance as regards solar energy exploitation. In order to optimise building envelope thickness [14], attention is also being focused on façade systems integrating passive or active heating and cooling systems with the aim of achieving the greatest rate of energy self-sustainability for the whole building. From this point of view, the basic requirement concerns synergy between the provision of improvements in thermal insulation functions for winter periods and, on the other hand, the elimination of overheating in the summer.
The main principle of the presented research is based on solar wall principles [15,16,17], of which the most fundamental is the Trombe wall [18,19] design that was developed a few decades ago. Various applications of solar walls and their significance for energy savings in buildings are discussed in literature reviews. An operational framework of already developed solar-wall configurations, used technologies and their efficiency is analyzed in detail in, e.g., [15], as well as by many other authors and research teams aiming to implement the need for this sustainable energy design approach to improving the energy efficiency of buildings [20]. Their research typically concerns the application of passive wall systems. Recently, the use of an innovative Trombe wall as a passive heating system modified by an extra window was presented and numerically investigated in [21]. Both [22,23], the numerical [24,25,26,27] and experimental [28,29,30,31] approaches, detailed in the literature, are variously taken into account. Basically, a conventional Trombe wall is a system that transforms indirect solar gain into thermal energy. It is normally composed of a massive wall painted black, an exterior glazing cover, and a ventilated air gap in between these two elements [25].
With regard to this novel form closely related to the idea of solar walls and facades, the integration of innovative materials may be of great importance. From the basic materials perspective, transparent insulation materials (TIMs) [32] could predominantly be used with current concepts that are trying to replace conventional insulating materials. However, their use in building envelopes only occurs in specific situations, and therefore application in building practice is currently rather rare. The earliest references relate to both theoretical and experimental work on the use of TIMs as aperture covers for flat-plate solar collectors, while later works introduce TIMs integrated into translucent building façades to provide natural lighting and solar space heating in order to reduce lighting and heating energy requirements in buildings. For instance, a stable honeycomb structure made of natural materials is the innovative element in a façade system developed in Austria. Principally, the rays of the winter sun penetrate deep into the honeycomb and increase its temperature. This autonomous zone reduces heat loss to almost zero and reduces thermal bridges. During the summer, much of the radiation is reflected due to the honeycomb structure itself. However, the installation of an excessive quantity of TIMs is not only cost-inefficient, but can also cause problems with overheating. Several studies describe the benefits of TIMs, their disadvantages and the options for their application [33]. Various implementations are looking for integration in building compositions [34] with the aim of analyzing their potential contribution related to energy balance and many other thermal aspects, depending on climatic conditions, and finally determining the potential payback period if using them [35]. The environmental and energy aspects of TIMs in selected climatic zones of Austria and for a variety of building types with the influence of differing cardinal orientation have been previously studied [36]. There is a perspective option to improve the efficiency of flat plate solar air collectors as well as novel solar façade concepts by replacing their conventional glass covers with TIMs. Dowson et al. [37] implements a lightweight polycarbonate panels filled with high performance aerogel insulation for it to be incorporated in a solar air collector to improve its overall performance. Another approach is based on a prototype of innovative flat plate solar collector with honeycomb TIM that has been constructed and experimentally tested and in parallel, a numerical model has been implemented by Kessentini et al. A specific ventilation channel with a thermally actuated door was inserted below the absorber allowing to protect the collector from stagnation conditions, while preserving good performance during normal operation [38]. In Dowson et al. [39], the in-situ performance of a flat plate solar air heater connected to a dwelling’s active mechanical ventilation system with heat recovery was carried out. Again, in his concept, instead of glass, the cover was a lightweight multiwall polycarbonate panel filled with granular aerogel as the form of TIM. Concerning the specific structure of honeycomb TIM and its modelling, several works were conducted. Cadafalch [40] addresses in detail the formulation and numerical approach adopted to solve transparently insulated layers with honeycomb structures integrated within the flat plate solar thermal device transient model. A numerical model for a honeycomb was developed by Suehrcke et al. [41] based on the experimentally measured results whilst three-dimensional heat transfer analysis destined for improving the efficiency of flat plate solar collectors was performed by Kessentini et al [42] to finally develop new correlations for the heat transfer coefficients through the TIM. At the novel form, our recent findings can contribute to the integration of TIM coupled with a selective absorbent technologies in façade construction as key absorbing factors that may be used to prevent heat loss in winter, decrease overheating in summer, and finally allow the conversion of incident solar energy into thermal energy. With respect to the observation of heat storage and thermal capacity layers, the integration of advanced forms of PCM-based heat storage may have significant role [43]. In this regard, experimental research and numerical modelling are required in relation to the fundamental interaction base and final full-scale approach.

2. Methodological Approach

A new solar façade concept based on transparent insulation and a selective absorber is proposed at fundamental level, tested and confronted experimentally with conventional insulation and a non-selective type of absorber, respectively. The focus of this research is to analyze the contribution of optical properties applied in a newly proposed experimental solar prototype in order to investigate their interrelationships for a final future contemporary solar façade concept applying advanced forms of materials. Based on solar wall principles, the main objective is to measure the temperature response within proposed components at a laboratory during initial full-scale levels of exposure to solar radiation, especially via the monitoring of the response at the surfaces and in the air cavity behind transparent insulation (honeycomb transparent PMMA-based) with the integration of a selective function, both with high solar absorbance level. The main structure of this analysis is based on:
-
Short term monitoring of the temperature response within proposed components,
-
Analyzing the thermal benefits of optical properties involved in components,
-
Measurements of a comparative nature with solar radiation exposure,
-
Thermal resistance quantification of proposed components,
-
Solar transmittance measurements of TIMs applied based on an outdoor approach.
The key aspect of this contribution resides in investigating the thermodynamic, steady state and time transient heat transfer applied in a proposed small- and full-scale solar façade concept that is to be potentially implemented in future full-scale testing modes. Laboratory, small- and full-scale tests were conducted to analyse the thermal performance of the proposed components based on the solar wall principle. The main objective of this study relies on:
i
The determination of spectral optical properties; reflective measurement techniques and spectral methods were applied to determine the solar reflectance and thermal emissivity parameters of samples tested in small-scale mode as the predominant and most sensitive attribute in the analysis of the presented concept,
ii
The determination of thermal resistance; the guarded hot plate method was applied in determining thermal resistance and/or equivalent thermal conductivity parameters,
iii
The determination of total solar transmittance; dynamic outdoor principles and spectral methods were applied and compared with each other, determining the solar transmittance parameters of transparent insulation samples, both at the laboratory and small-scale outdoor level,
iv
Monitoring of thermal performance and temperature response during solar simulator and outdoor small-scale tests,
v
Thermodynamic testing based on initial full-scale outdoor testing of the compositions of the proposed structure with transparent insulation glazing units and spectrally selective functions with a high solar absorbance level, both at the high- and low-emissivity base.
For the purpose of spectral optical and thermal analysis samples were prepared (Table 1) and spectral optical properties were measured. The main difference between all tested samples was in their absorber part and the form of applied thermal insulation, for both the transparent and conventional type. A spectrally selective absorber and thermal insulation of the transparent type were used as a proposed base. Table 2 shows all the measured materials applied for this study. Two types of absorbers were tested in combination with transparent insulation. One standard conventional sample of expanded polystyrene was used as a reference (Table 3). Basically, each concept consists of several functional layers. First represents thermal insulation based on conventional and transparent insulation type, both coupled with non-ventilated air cavity. Second is based on the type of absorber, selective and non-selective type. Last material employs the heat accumulation layer which is on a basis of gypsum board. It represents thermal accumulation mass of thermal energy in structure. External side of gypsum board is directly covered by absorber layer. Finally, transparent insulation concepts are covered by simple glass pane from external side.
For the thermodynamic experiments: a steady state and time-transient analysis was carried out based on experimental measurements of the models prepared for the testing of each concept, where at the laboratory scale the temperature response through the measured elements was analysed primarily together with the monitoring of all parameters specifically related to thermal and optical properties. The temperature response was monitored with the application of a solar simulator at the BCEE laboratories at Concordia University (Montreal, QC, Canada). Material parameters and the data obtained from outdoor testing were analysed at the AdMaS research centre at Brno University of Technology.

3. Thermal and Spectral Optical Analysis

One of the assumptions in the field of experimental approaches is based on appropriately quantifying the optical and thermal properties of the proposed model. This issue, as it relates to the presented concept, should therefore be quantified in terms of thermal performance in several specific areas. The first focuses on the model’s spectral optical properties. The solar reflectance and thermal emissivity parameters of solar absorbers were measured, whilst in the case of the transparent insulation layer, solar transmittance needed to be determined in an optimum manner at the angular and spectral optical level. From the point of view of thermal aspects, thermal resistance was analysed, whole concepts and each individual material were tested.

3.1. Spectral Reflectance and Emissivity Measurements

The measurement of solar reflectance parameters requires techniques based on measuring the fraction of incident beam light of wavelength reflected by a surface. Solar reflectance properties can basically be determined by three measurement instruments: the pyranometer, spectrophotometer and solar spectrum reflectometer [44]. Detailed specifications and their interrelated comparison can also be found in [44,45]. For this analysis, spectrophotometer measurements were taken.
A Lambda 1050 UV/VIS/NIR spectrophotometer (PerkinElmer, Waltham, MA, USA) equipped with a 150 mm Spectralon integrating sphere was used to measure solar reflectance. This apparatus can register spectral reflectance properties ranging from 200 nm to 3300 nm. Spectral curves and integrated total solar reflectance (TSR) values from 280 to 2500 nm are presented. The solar reflectance is calculated by means of ASTM Standard G173 [46] for hemispherical global tilt irradiance Equation (1) and of each specific region is demonstrated, where R is the percent reflectance, I is the solar irradiance and is the wavelength interval of integration. For the solar weighted hemispherical and specular reflectance evaluating, this can be calculated according to a procedure characterized by Gagliano, respectively [47]:
% T S R = ( % R × I d λ ) I d λ × 100   [ - ]
The available principles for the determination of spectral emissivity (reflectance) are based on spectral analysis using infrared spectroscopy in the longwave region. Reflective measurement techniques utilising a Michaelson wave interferometer and Fourier Transform (FT-IR) are used. A Nicolet 380 infrared spectrometer from the Thermo Electron Corporation (Waltham, MA, USA) equipped with a Mid-IR™ IntegratIR integrating sphere from PIKE Technologies (Madison, WI, USA) was used. The applied instrument represents a method by which the detector can eliminate any reflected radiation loss by integrating sphere from the whole measured surface area.
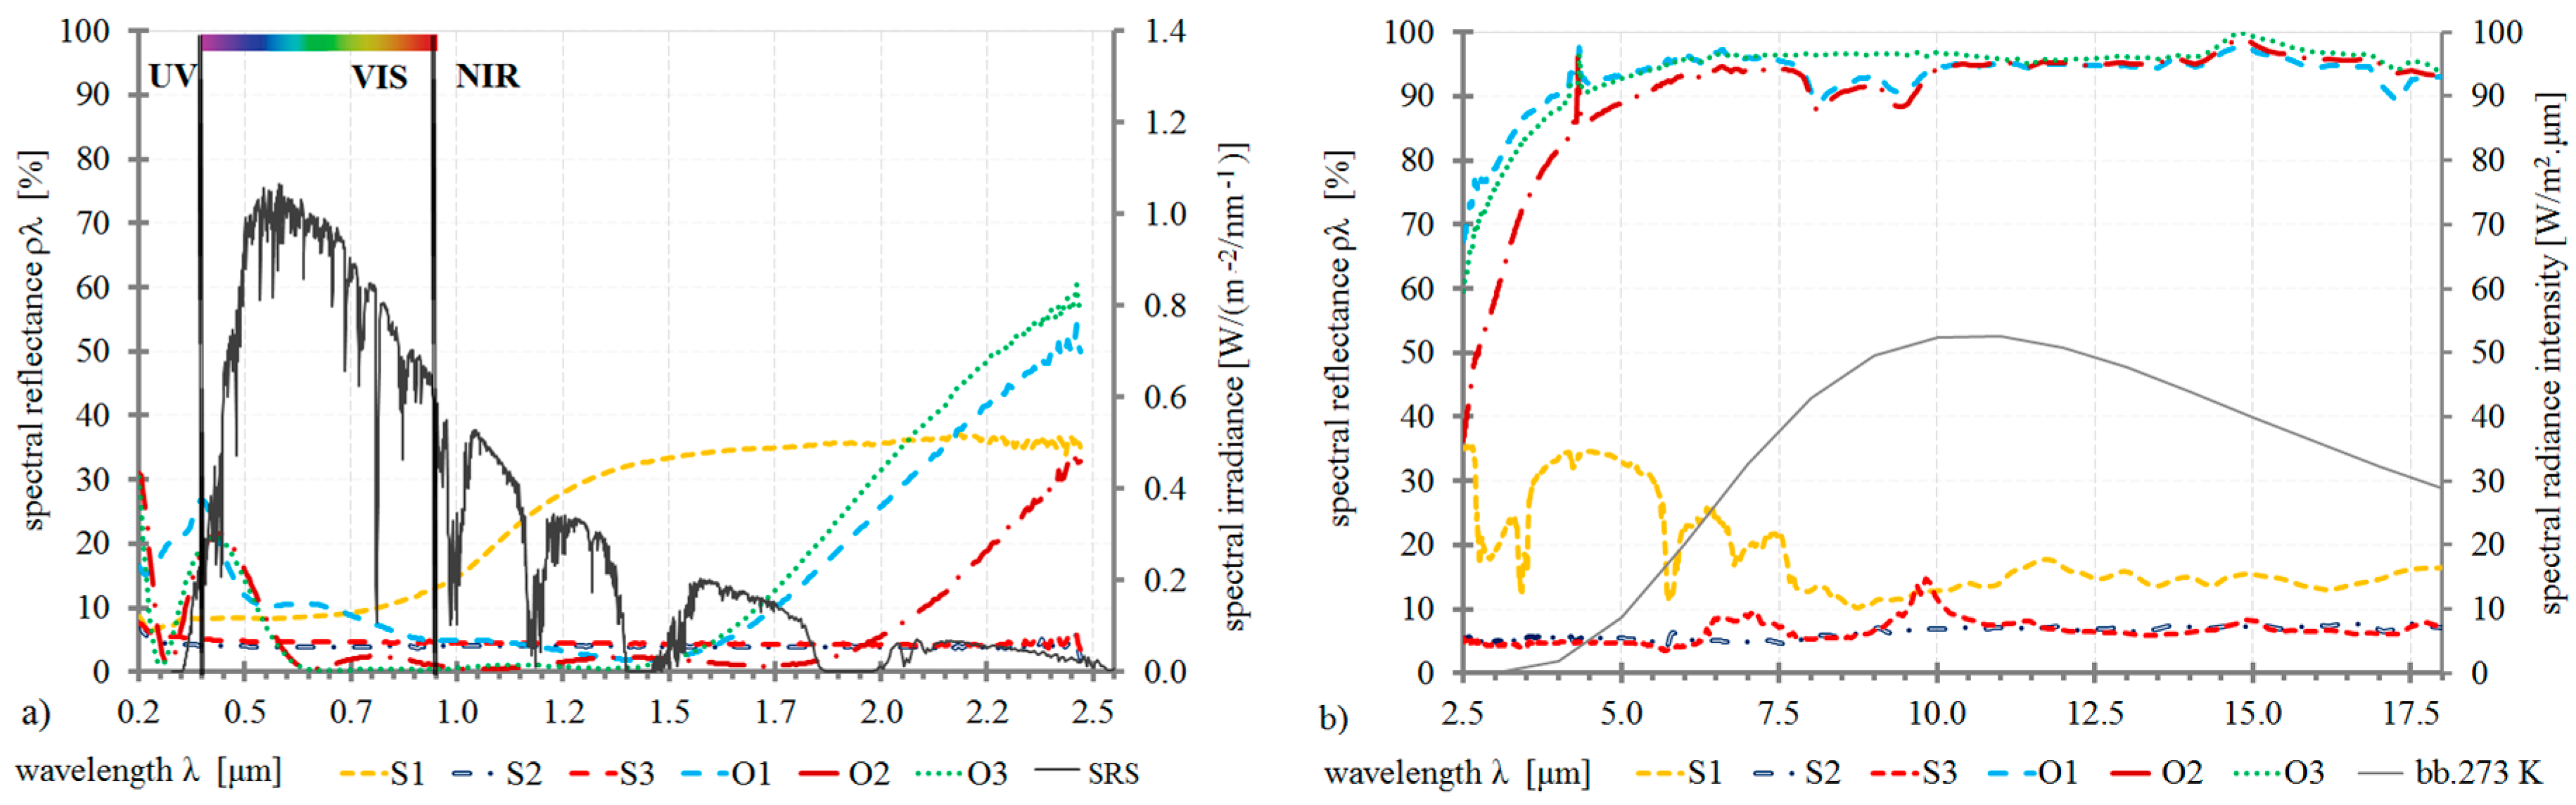
The results of the measurements are spectrally presented in a range from 200 nm to 20 μm (Figure 1). The graphs represent all thermal regions of the spectrum. The spectral irradiance curve of the solar radiation spectrum is shown in the UV/VIS/NIR results, while the curve for the spectral radiance intensity of a 273 K black body (bb273K) represents the weighted function for the determination of emissivity in the results of the longwave infrared radiation range. Figure 1 present the results of spectral reflectance in the solar and longwave radiation spectrum respectively. The results of the spectral reflectance analysis are finally evaluated as thermal emissivity and solar absorbance values (Table 4) according to the method in [48].
An equation (Equation (2)) can be used for determination of the measurement results in terms of emissivity values, which result from the law of the conservation of energy and Kirchhoff’s laws:
ε = α = 1 ρ   or   ε λ = α λ = 1 ρ λ   [ - ]
As a consequence, Plank’s formula (Equation (3)) of spectral radiance intensity of 273 K black body M0,λ (Figure 1) as the weighted function for determination of emissivity values was used (Table 4):
M 0 , λ ( λ , T ) = C 1 × λ 5 × ( e C 2 k T 1 ) 1   [ W / ( m 2 µ m ) ]

3.2. Solar Transmittance Quantification

Several studies aimed to measure the directional-hemispherical (also sometimes called direct-diffuse) solar transmittance for various honeycomb-type structures with an indoor solar simulator and a 40 cm diameter integrating sphere for incidence angles up to 70° [49,50]. In this relation, outdoor measurements using the sun as the source might be the option. Platzer [49] pointed out that it is not an option for Central European climates. Although there are many specific issues to take into account, such as inclined angular dependence, fluctuations of solar irradiation and overall solar distribution as well as cardinal point aspect, we employed the using of solar transmittance estimating by real outdoor measurements. This is already implemented in standard test method for solar transmittance of sheet materials using sunlight with detailed specification and procedures according to ASTM E1084-86(2015) [51]. Overall, there is lack information regarding real outdoor measurements in literature as typically used for solar transmittance measurements. Therefore, this may represent very simple and well available way of measuring the total solar transmittance parameter. Finally, combinations of two separate methods of spectral and total solar transmittance quantification were compared with each other due to a specific property of applied transparent insulation, where an aspect of diffuse solar radiation transfer appears to play a significant role. The first method takes the form of laboratory testing based on spectrophotometer measurements. Again, a PerkinElmer Lambda 1050 UV/VIS/NIR spectrophotometer was used. The spectrally obtained results are presented in 
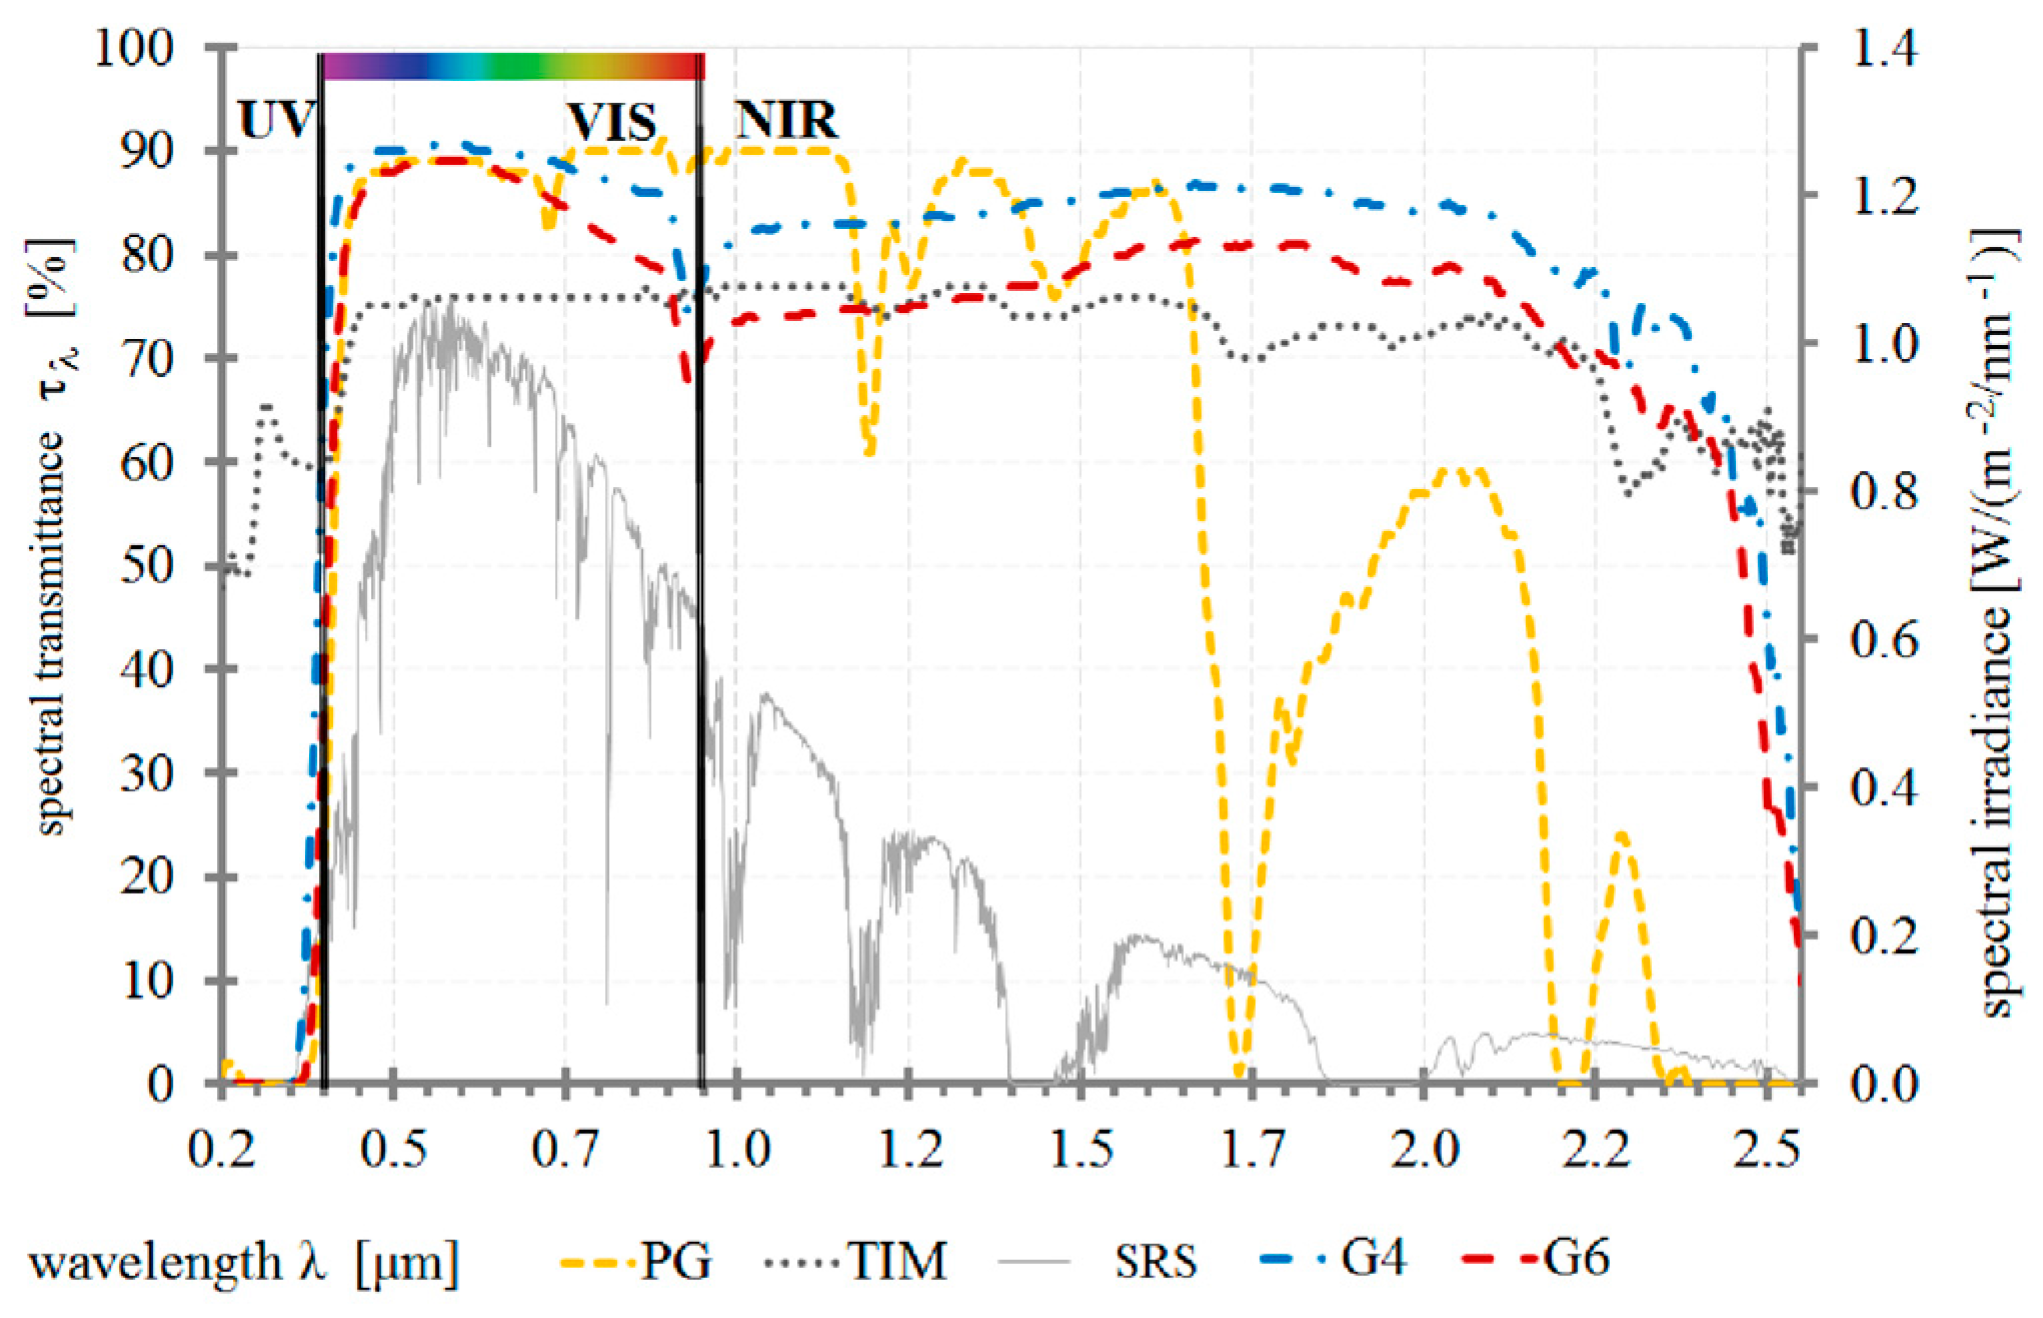
Figure 2, where the measurement data for the analyzed TIM is primarily supplemented with other transparent materials, such as Plexiglass (PG), simple glass pane 4 mm thick (G4), simple glass pane 6 mm thick (G6) and TIM based on honeycomb structure.
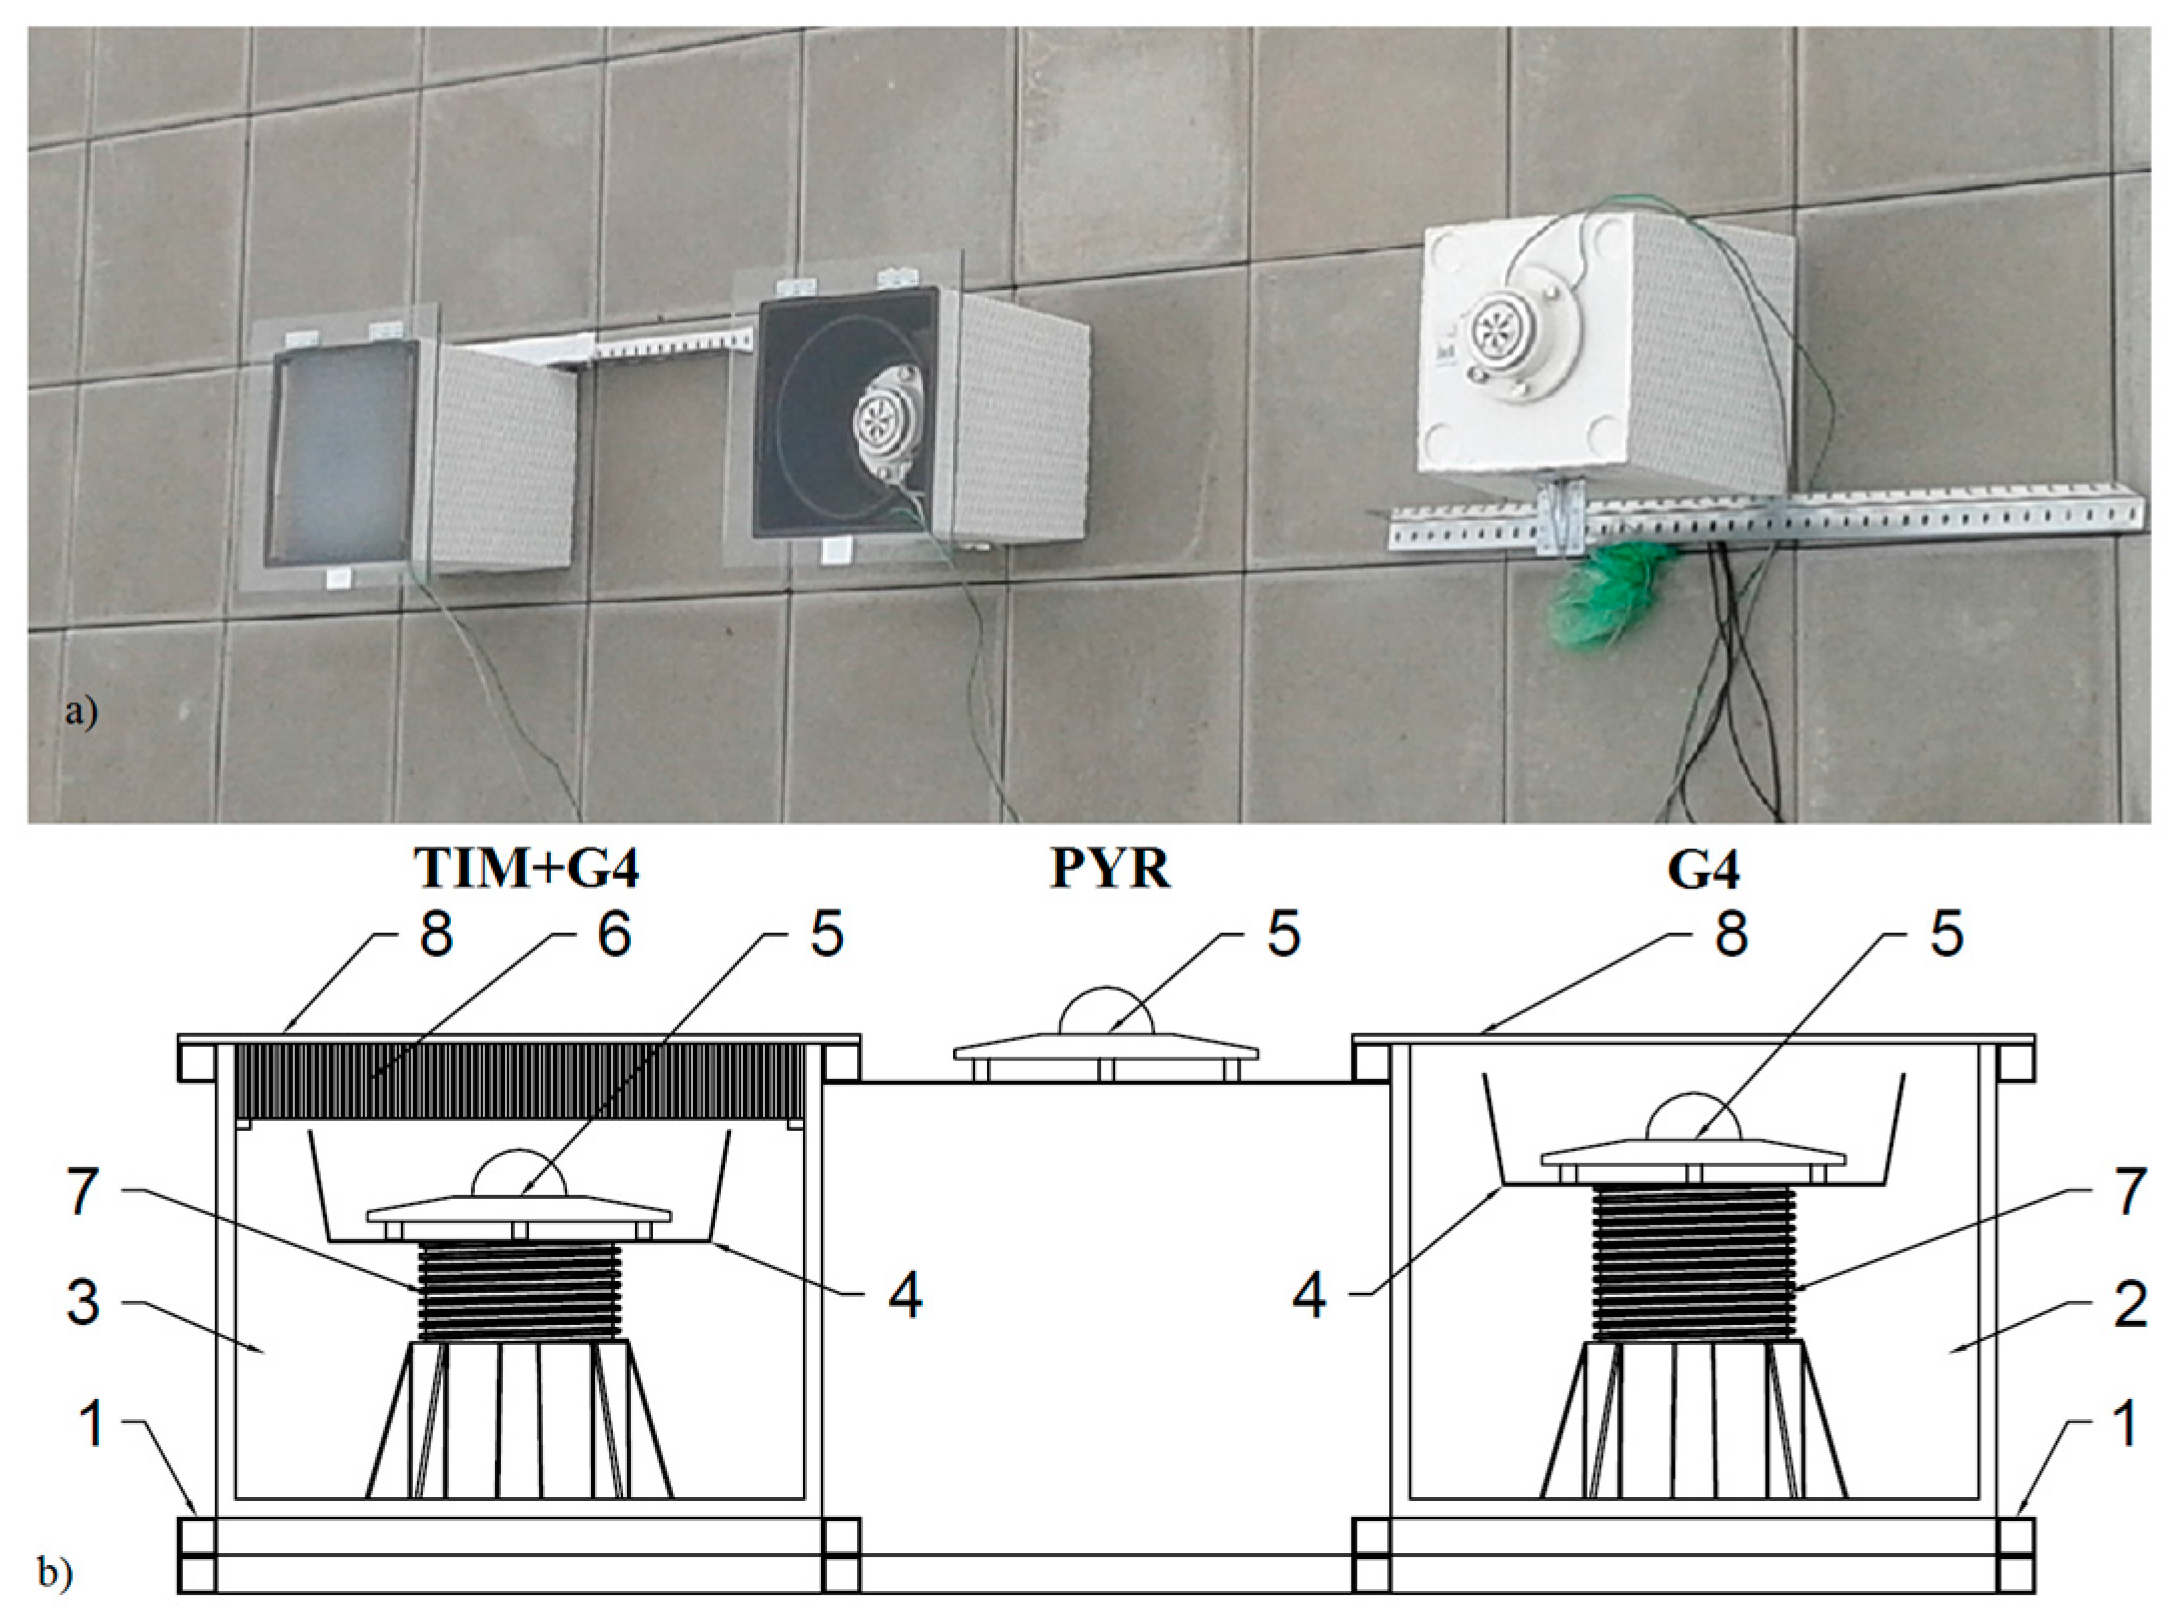
The second method is based on outdoor experiments applying the comparative in-situ measurement approach. The authors assembled their own measurement apparatus for this task taken fundamental specification of ASTM E1084-86(2015) into account. This test method also allows measurement of solar transmittance at angles other than normal incidence. In addition, it is particularly applicable to the measurement of transmittance of inhomogeneous, fiber reinforced, patterned, or corrugated materials since the transmittance is averaged over a large area. Two pyranometers were mounted in square boxes and a third additional device was left exposed to outdoor conditions (Figure 3). The equipment was used to determine the total solar transmittance of the TIM. The experimental setup and a diagram of it are illustrated in 
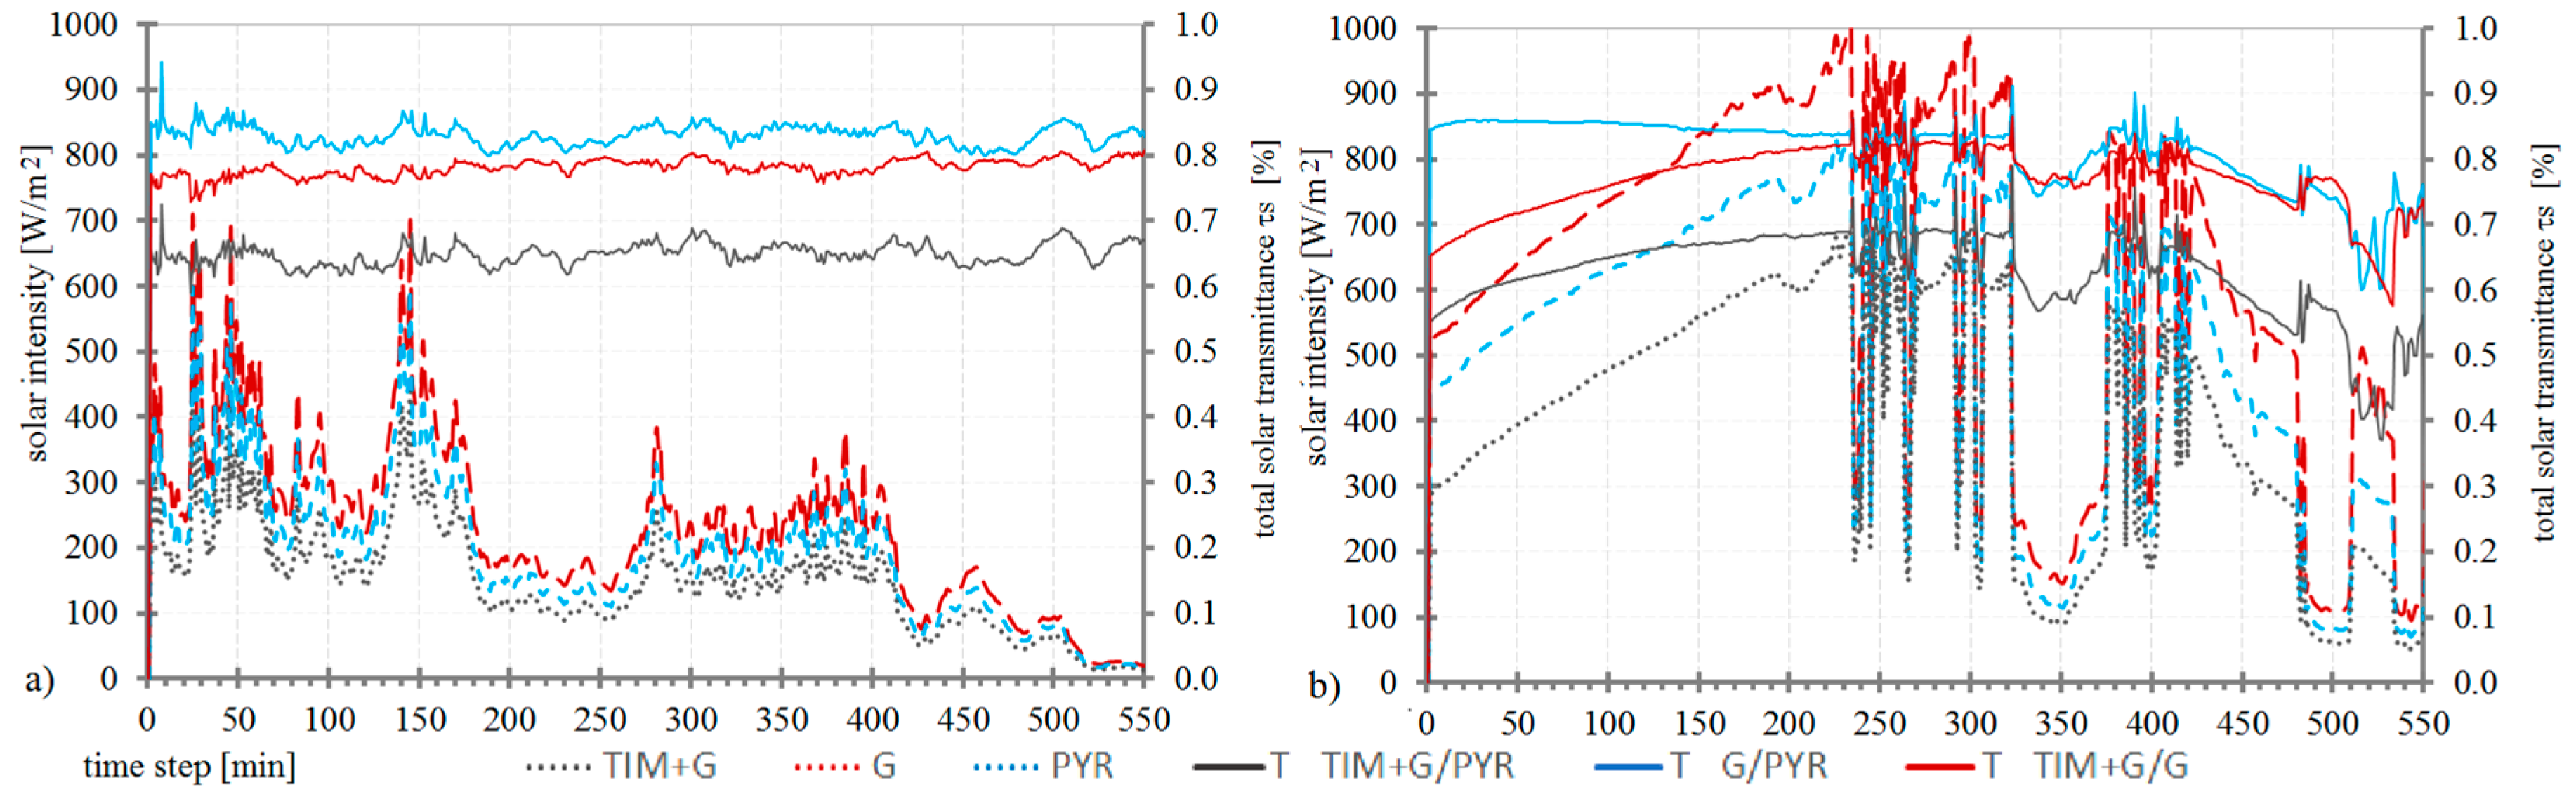
Figure 3 conducted at the AdMaS research centre at Brno University of Technology (longitude 16°34′, latitude 49°14′, altitude 297.23 m). All results were taken during measurements where maximum sun height above horizon has been achieved during midday at 60°, which corresponds to the 30° incline from normal incidence angle. The results presented in Figure 4 are from two different measurement days representing two different sky conditions: overcast (Figure 4a) and almost clear (Figure 4b). Here, the ratio between solar intensity of opened air pyranometer sensor and those placed in both test boxes behind the measured component is presented corresponding to the total solar transmittance value (TIM + G4/PYR and G4/PYR), as well as the courses of solar intensities monitored respectively (TIM + G4, PYR ad G4). Finally, the ratio of solar intensity of TIM combined with G4 and sample G4 (TIM + G4/G4) represents a value for TIM separately. For almost clear sunny period Figure 4b, results are strongly cloud sensitive. This aspect is observed by continuous solar transmittance varying. On the other hand, very stable progressions are observed during cloud conditions (Figure 4a). For both test periods, higher the maximum level of solar intensity is, slightly higher the total solar transmittance obtained. All of the results were finally evaluated as tabular values (Table 5). As can be seen, good agreement was achieved between both of the applied methods. A spectral transmittance of around 0.75 was obtained for pure transparent honeycomb insulation in the laboratory, whilst its total outdoor value reached up to 0.80. This deviation can be caused by final test setup positioning. Further improvements could be achieved, however already obtained results can demonstrate an applicable and adequate level. Regarding the real outdoor in-situ measurements using the sun as the source, this approach specifically aimed to obtain real outdoor values.

3.3. Thermal Resistance Measurements

The thermal resistance of the proposed material compositions was measured by the guarded hot plate method in accordance with ISO 8302. A TLP 300 DTX-1 device (Taurus Instruments, Weimer, Germany) was used (Figure 5). This apparatus can determine the thermal resistance of a sample with a thickness ranging from 20 mm to 80 mm. The device is equipped with two plates. A required temperature difference between both plates is maintained to activate heat flow within the tested sample. The dimensions of the applied plates are 300 mm × 300 mm; the protected measured field is 100 mm × 100 mm in area. The sample is placed between the two plates, whose temperatures are controlled by a Peltier element. The total power of the elements is maintained to achieve one dimensional steady state heat transfer. The temperature difference on the sample’s surfaces is measured via two batteries of thermocouples applied on each side. Using the equation below (Equation (4)), the thermal resistance R is calculated from the heating power Q, the measured area A, and the temperature difference between the sample’s surfaces ΔT:
R = Δ T × A Q   [ W / ( m 2 K ) ]
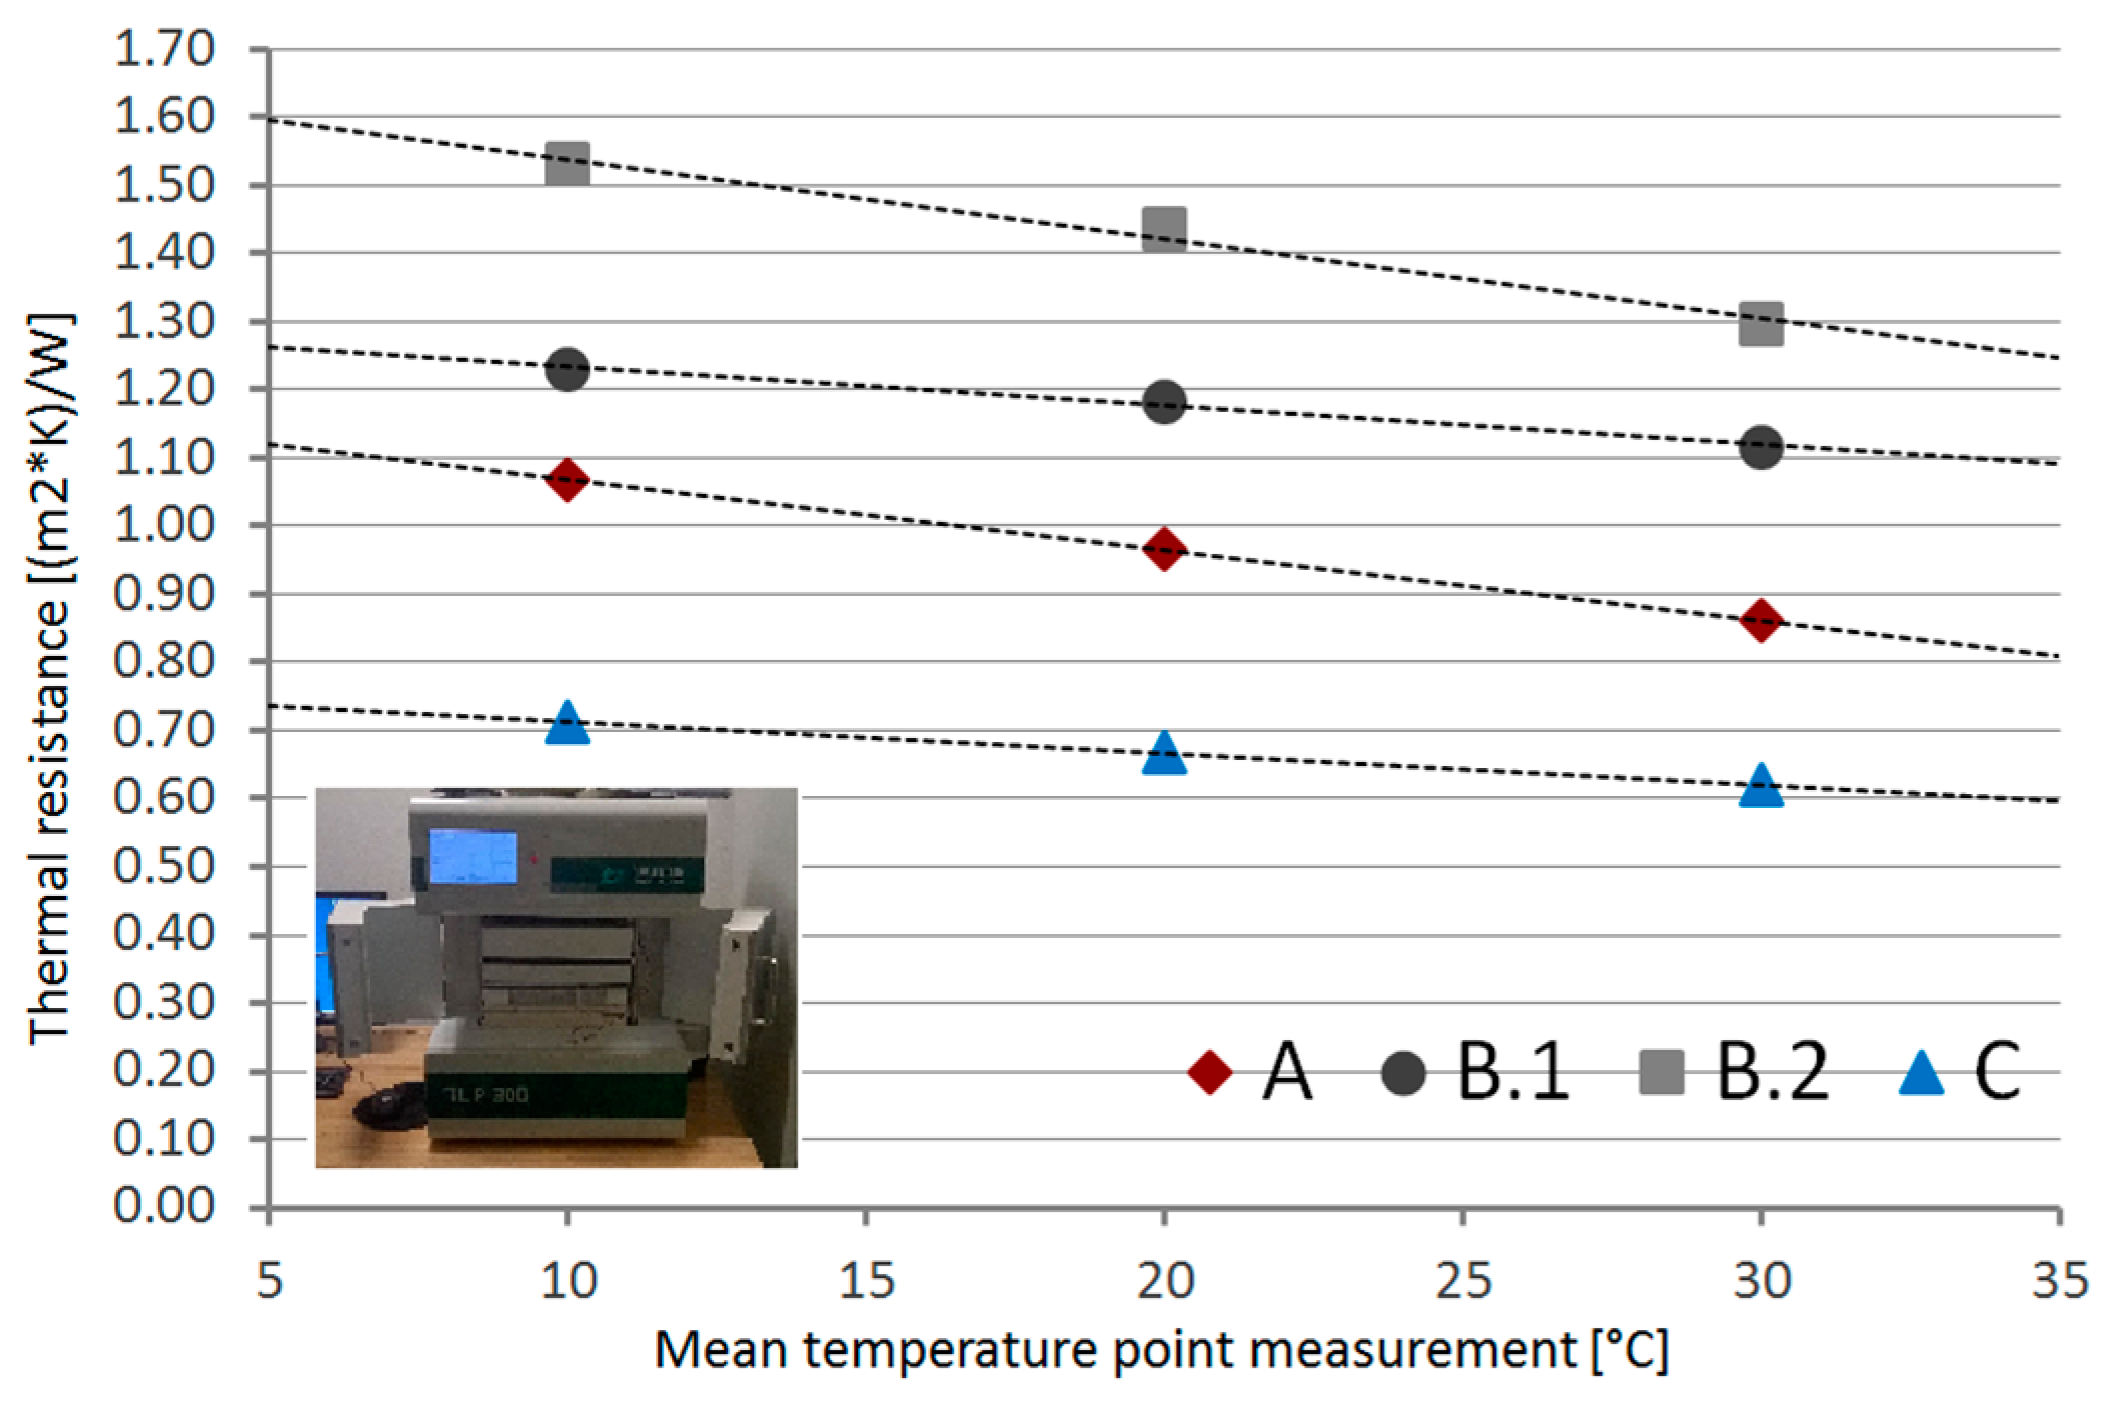
Although the TLP 300 DTX-1 apparatus represents a system for the estimation of thickness, when applying the contact mat the thickness of the sample could be distorted. Before the main measurements were taken, the weight and overall thickness of the sample were measured separately. Each sample is placed between plates covered by a contact mat with a thickness of 3 mm. Plastic foil with thermocouple batteries is installed between the contact mat and the surface of the measured sample. The higher plate is slowly lowered until the pressure on the sample reaches the predefined value. Considering the 10 K temperature difference between each side of the sample, testing may utilise several measurement points, which means various temperatures are recorded in the middle of the sample. The measurement process starts by cooling and/or warming the plates until a predefined temperature is reached at a given measurement point. The top Peltier plate monitors voltage and electric current, the obtained values being used for the determination of overall heating power. Finally, as demonstrated above, the thermal resistance of the tested sample is calculated via Equation (4). The time varying power is managed by the microprocessor’s control system according to the surface temperatures of the sample. It exhibits a mainly decreasing trend until a steady state is reached, which corresponds to Fourier’s law.
Four samples of proposed components (Table 3) based on applied materials (Table 2) were measured. Table 2 and Table 3 present basic material parameters. Finally, the equivalent thermal conductivity coefficient λekv is calculated based on whole component thickness and its thermal resistance (Equation (5)). Three measurement cases were tested at different mean temperature levels: 10 °C, 20 °C and 30 °C. The load imposed by the top plate on the sample was 200 N for all cases. In addition, the temperature dependency between the thermal resistance and the mean temperature of the sample was observed. The resistance approximated by linear function indicates the same tendency of slope: the higher the temperature level, the lower the thermal resistance of all tested samples (Figure 5):
λ ekv = d R   [ W / ( m K ) ]
As a sample of a conventional type of insulation using the same structure is considered as a reference, all of the presented compositions can be compared and contrasted with each other. Based on the measured results, the conventional insulation concept (B.1) showed a maximum thermal resistance of 1.231 (m2K)/W, while the low-e material (B.2) displayed a maximum of 1.530 (m2K)/W. This means that the low-e surface inside the air gap can increase the thermal properties of the proposed conventional component type by up to 24%. In contrast, when transparent insulation material (C) is used, the thermal resistance is almost 42% less than B.1. However, with a spectrally selective absorber (A) the thermal resistance nearly approaches the conventional level, being only 14% lower at 1.067 (m2K)/W. Finally, when both TIM compositions are contrasted, the standard non-selective solar absorbent sample C has 0.712 (m2K)/W, which means its thermal resistance is almost 50% lower than the spectrally selective absorber, sample A.

4. Small Scale Solar Based Testing

Timescales of the time transient conditions to which a solar façade responds may vary from a few minutes or hours to diurnal and seasonal through to several years. This analysis deals with diurnal timescale and focuses on an experimental non-ventilated solar type of façade exposed to solar radiation both in the laboratory and in outdoor tests. As the proposed concept is based on non-ventilated air gap implementation, solar based testing may determine the maximum temperature that can be achieved in the solar prototype and to check the operation of the overheating protection system under stagnation conditions. Currently, some of the plastic TIM available in the market can withstand up to 140 °C as a maximum resistance temperature [38].

4.1. Solar Simulator Testing

The Solar Simulator measurement apparatus at the Environmental Chamber Lab at Concordia University [52] was utilised for testing. A 0.762 m × 1.219 m insulated model fitted with solar façade prototypes (Figure 6) was built, using the same type of TIM but with a different solar absorber type. It was tested in the solar simulator under high irradiation with an ambient room temperature that was maintained at a roughly constant 22 °C. The irradiated proposed model transfers thermal energy, which is measured along with surface and material interface temperatures. Because the only difference between the two setups is the addition of a low emissivity type of absorber on the solar absorber side, their influence can be directly evaluated. However, heat transfer through all adjacent parts plays an important role as well. The main objective of this analysis was based on:
-
The short term monitoring of temperature response within the proposed components,
-
Analyzing the thermal benefits of the optical properties of components,
-
Measurements of a comparative nature taken during exposure to solar radiation.
The main difference between the tested components lay in the modifications to their absorber surface located behind the transparent insulation (Table 6). As mentioned above, two samples (A and C) were composed with regard to optical properties analyzed behind the transparent insulation material (TIM), while one sample (B.1) was based on conventional insulation (expanded polystyrene), though it also was constructed in the manner used in non-ventilated façades, meaning that it included an air gap layer. Each sample contains 25 mm thick gypsum board because it is assumed to act as a simple provider of heat storage. Finally, the samples with TIM differ in the application of two absorber materials with the analyzed optical properties based on spectral analysis (see Table 4). Both have almost the same solar absorbance (around 0.90 and 0.96), whilst their emissivities vary widely, being 0.06 and 0.94 respectively (Table 6).
The measurements were carried out for three different cases and the duration of each measurement was measured until temperatures stabilised at a steady state. The resultant temperature growth within the measured samples was analyzed. The laboratory temperature was maintained at 22 °C. Solar performance reached around 1000 W/m2, where uniformity is within 5% or less, depending on the collector area. The solar simulator is equipped with special glass filters and metal halide lamps (MHG). The MHG lamp field provides a spectral distribution which is very close to that of natural sunlight. A Ventilation Unit (blower) is mounted at the bottom of the test platform, which blows grazing airflow parallel to the sample surface to simulate parallel wind conditions (up to 4 m/s). In order to eliminate long wave infrared irradiation emitted by the hot lamps, an artificial sky is positioned in front of the main lamp field. The artificial sky consists of two panes of low iron glass with an antireflective coating that create a cavity within which cold air (10 °C) is circulated in a closed loop and cooled by a heat exchanger. The installation of the artificial sky is necessary to simulate the radiant loss from the hot sample surface to the cold glass panes. This apparatus and the methods by which it is used comply with the specifications of EN12975:2006 [53] and ISO9806-1:2013 [54].
Three different cases were tested to demonstrate the thermodynamic performance of the analyzed model in terms of standardized and non-standardized procedures. Case c_1 is a non-standard mode in which the artificial sky is not used, while c_2 is a non-standardized mode featuring sky activation but no ventilation. Case c_3 sees the application of both the sky and ventilation based on an air velocity of 2 m/s parallel to the sample. For the two first cases, the thermodynamic performance is analyzed in an exploratory manner at a non-standardized level of solar collector testing in order to investigate the maximum level of sample overheating, whilst the third case demonstrates the standardized procedure involving the application of both the artificial sky and ventilation:
-
Case c_1 artificial sky off, non-standardized method of solar collector testing,
-
Case c_2 artificial sky on, non-standardized method of solar collector testing,
-
Case c_3 artificial sky on and ventilated regime with a 2 m/s air velocity level, standardized method of solar collector testing.
Temperatures are measured by 16 thermocouples (Type T, NBS special limits of errors, 30 AWG). Figure 6g displays the measurement model with all sensor locations. The total temperature progression is monitored for each position in relation to the proposed components, though two material interfaces are primarily analyzed. Although several positions were measured, the surface absorber temperatures and those located behind the gypsum boards are presented and analyzed in detail here. First monitored level represents temperatures behind heat accumulation layer, particular positions are A_01 (test sample A), B.1_02 (test sample B.1) and C_03 (test sample C), whilst second corresponds to the absorber surface temperatures at positions A_05, B.1_04 and C_6. Table 7 summarizes and Figure 7 shows the averaged temperatures monitored during all tested cases for each component respectively. In addition air cavity temperatures are presented.
The first two cases, c_1 and c_2, show almost the same differences between all tested samples, with the only variety occurring in the level of the maximum peak, which lies at around 70 °C or 80 °C, respectively. The absorber temperature at the center of the prototype reached a maximum of 75.5 °C at maximum peak when the incident solar radiation reached its maximum of 1000 W/m2 and the ambient temperature was 22 °C. At this moment, the corresponding TIM temperature measured at the center of the façade prototype reached not more than 85 °C which is below the maximum resistance temperature of the TIM (around 140 °C). Looking at the surface temperatures of both absorbers (Figure 8), selective A and non-selective C, there is very small variety: in case c_3 it is more than +2 K, whilst without fan operation it is almost −5 K. The temperature response behind the absorber becomes most significant when a low-e absorber is used in comparison with a standard black painted absorber; it means a nearly +5 K difference in the case of c_3; however, in the non-ventilated cases, the difference ranged from +10 K to almost +15 K, with the results for the conventional insulation component B.1 lying somewhere in the middle. This aspect, as well as the highly significant temperature increase, is primarily caused by the overheating of the whole model, where heat is additionally transferred through the thermal insulation of the model. In addition, the effect of a certain level of expanded polystyrene translucency is evident, thus the use of unmodified or plastered thermally expanded polystyrene for such experimental models is not so appropriate.

4.2. Small-Scale Outdoor Testing

The same apparatus as was proposed for total solar transmittance measurements (Figure 3) was additionally used to contrast measurements obtained from the solar simulator and outdoor testing, both at the small-scale level. The only difference is that one whole proposed model integrating all the elements underwent solar simulator testing, whilst in the outdoor tests both of the assembled concepts (not including the conventional type) were tested separately. The measurements were carried out during real outdoor solar radiation exploitation. Identical A and C samples were fabricated, placed into the test boxes and exposed to the outdoor climate. The test scheme and experimental setup are shown in Figure 9a,b. One reference case and a second comparative case were measured. Again, the only difference between both boxes was in terms of the absorber used, with non-selective black paint S2 and selective material O3 being contrasted. All of the materials are based on Table 2. Six measurement points are monitored and finally analyzed in the results section. The interpretation of all given measurement points is: ai represents the air temperature of the non-ventilated air gap, se is the surface absorber temperature, bl/bsel corresponds to the material interface between the absorber and the heat accumulation layer (for this study it is gypsum board), sd is the temperature behind the gypsum board, in represents the temperature inside the box and PYR is the outdoor solar radiation intensity obtained by the pyranometer sensor, whilst Fdi is its transmitted part through the TIM obtained by the photodiode element. The total temperature progression is monitored for a period of one whole day. The results are presented in Figure 9, both for a whole day (Figure 9c) and the maximum peak (Figure 9d) of the presented day. Not surprisingly, the maximum level of the measured temperatures is more than 100 °C, thus the solar radiation received and transferred into the thermal energy has huge potential. Here the difference between the non-selective and selective absorber is approximately 2.5 K at the maximum peak. This basically corresponds to the measurements obtained for case c_3 during solar simulator testing. The maximum temperature level is different, however. The absorber temperature at the center of the prototype reached a maximum of 107.5 °C at maximum peak when the incident solar radiation reached its maximum of around 1000 W/m2 and the ambient outdoor temperature was around 25 °C. At this moment, the corresponding TIM temperature measured at the center of the façade prototype reached a maximum of 107.5 °C which is below the maximum resistance temperature of the TIM (around 140 °C).

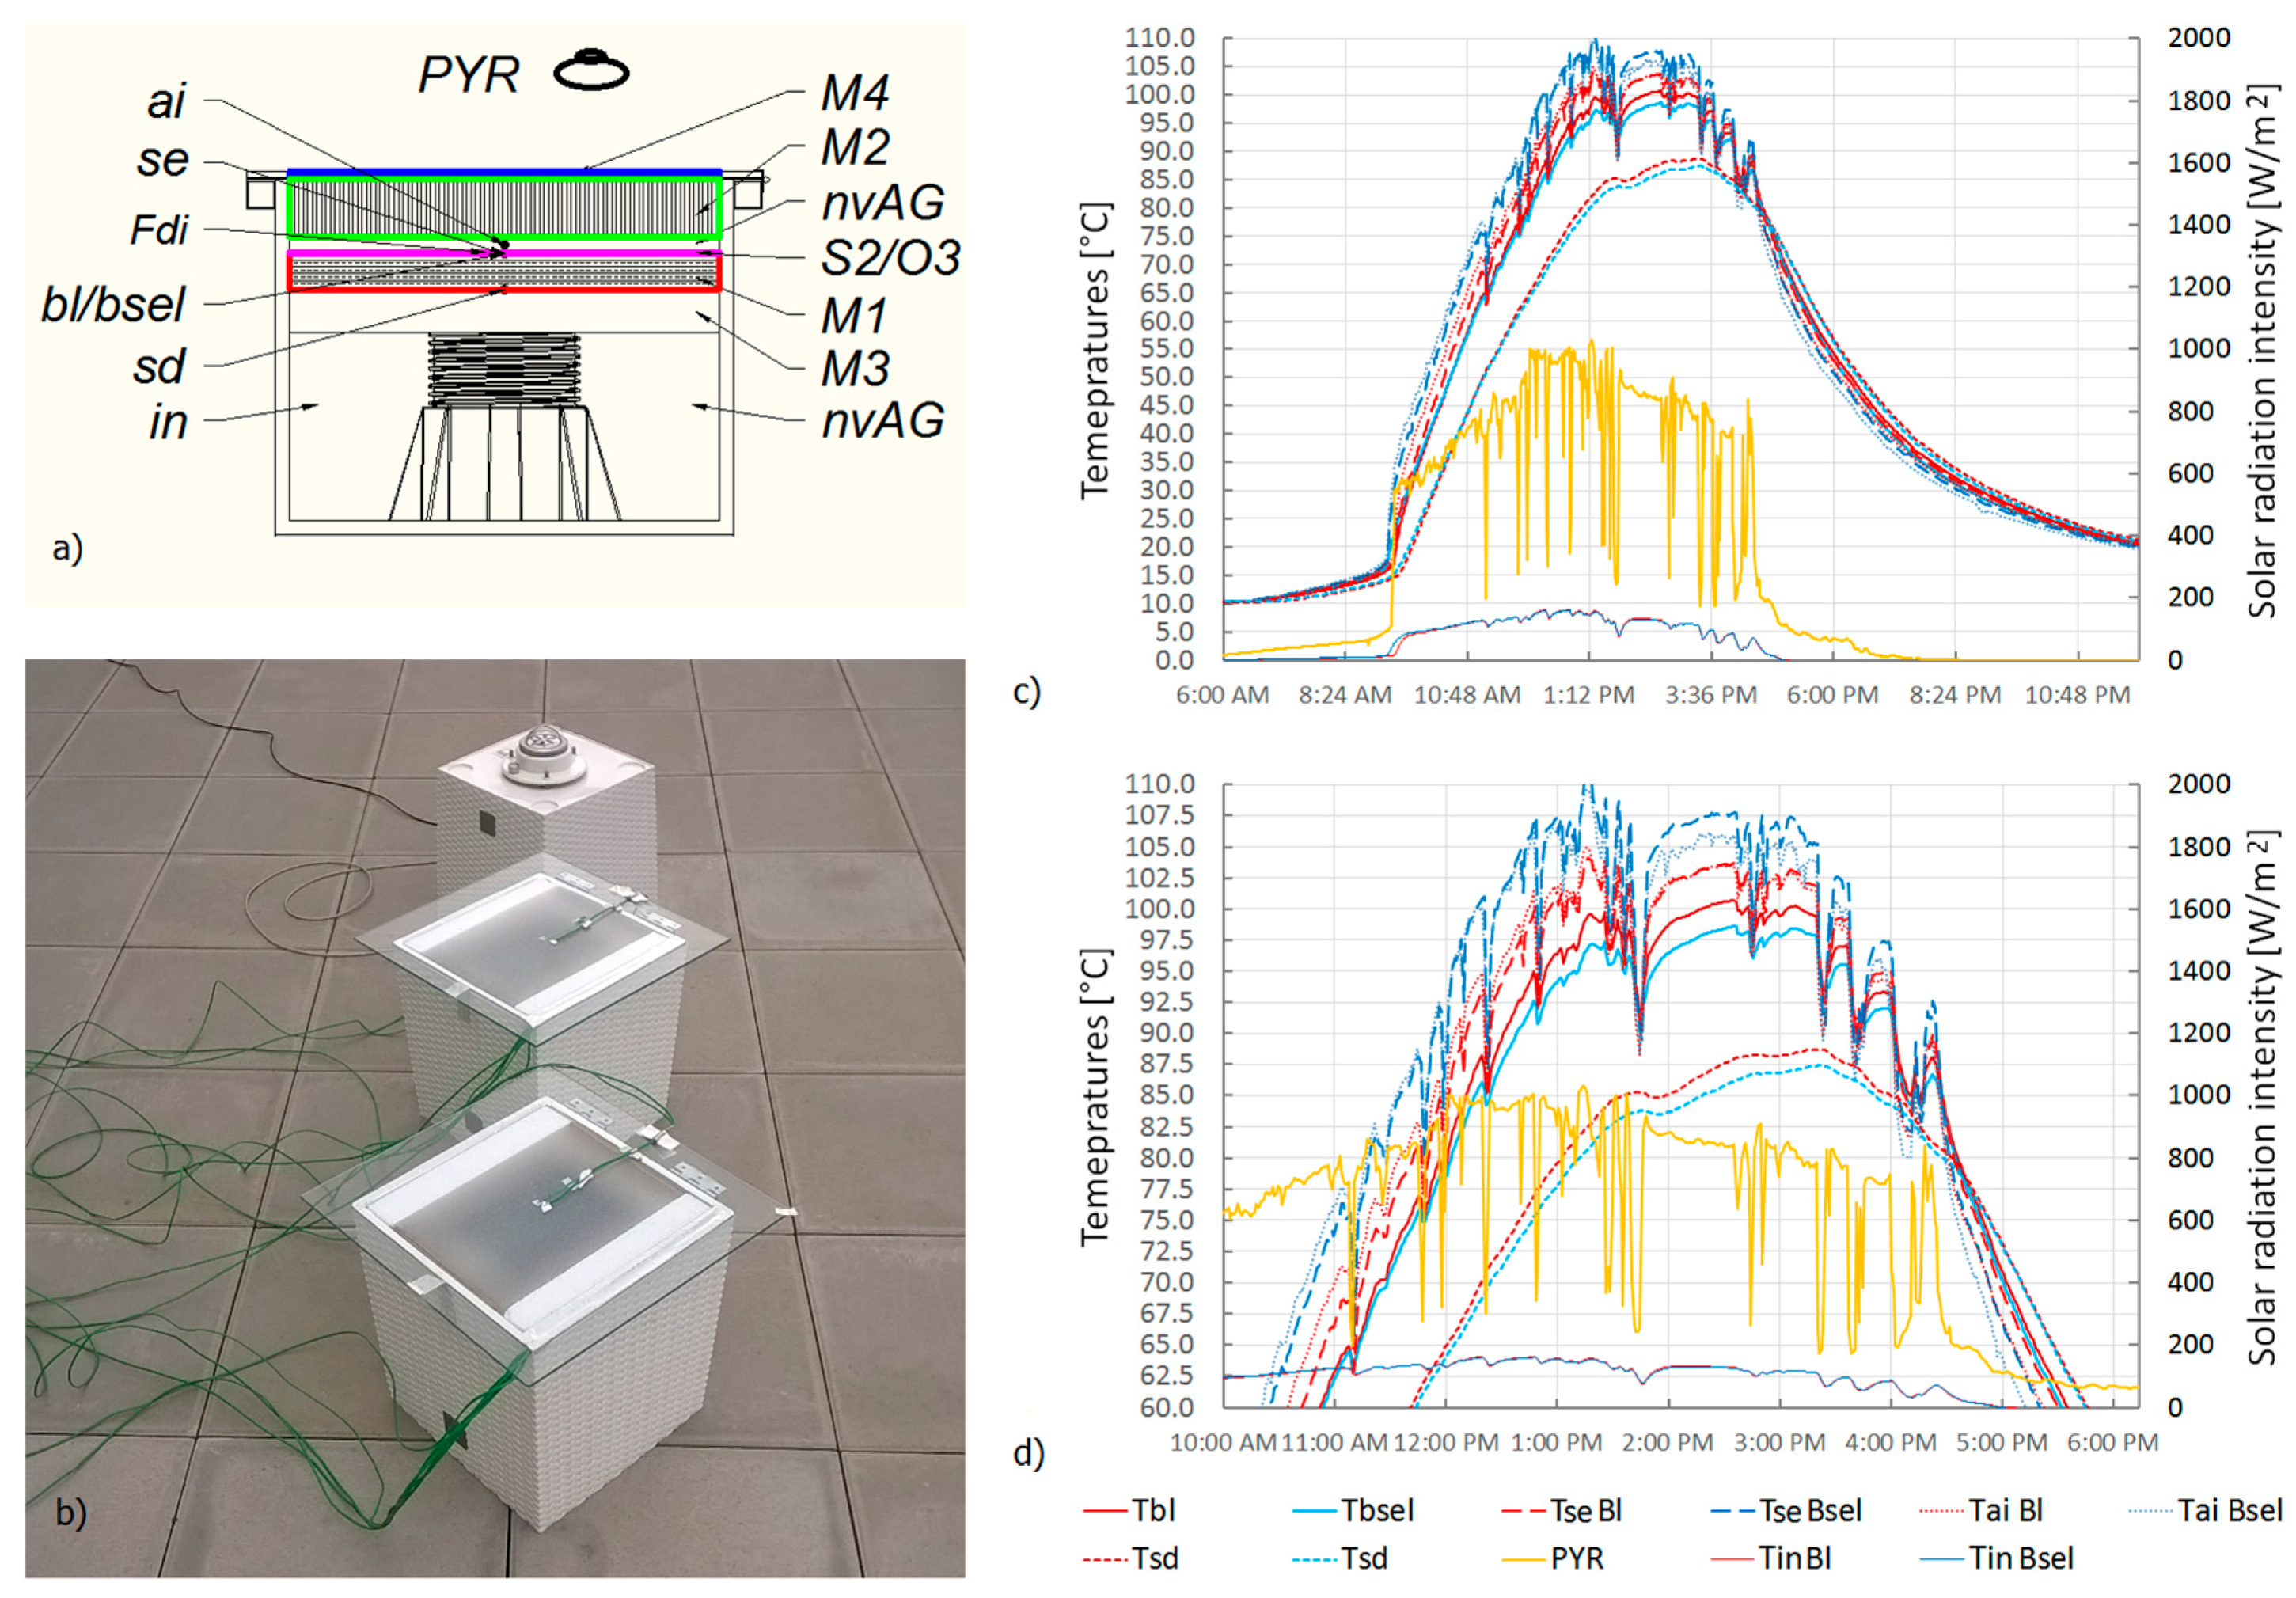
5. Full Scale Outdoor Testing

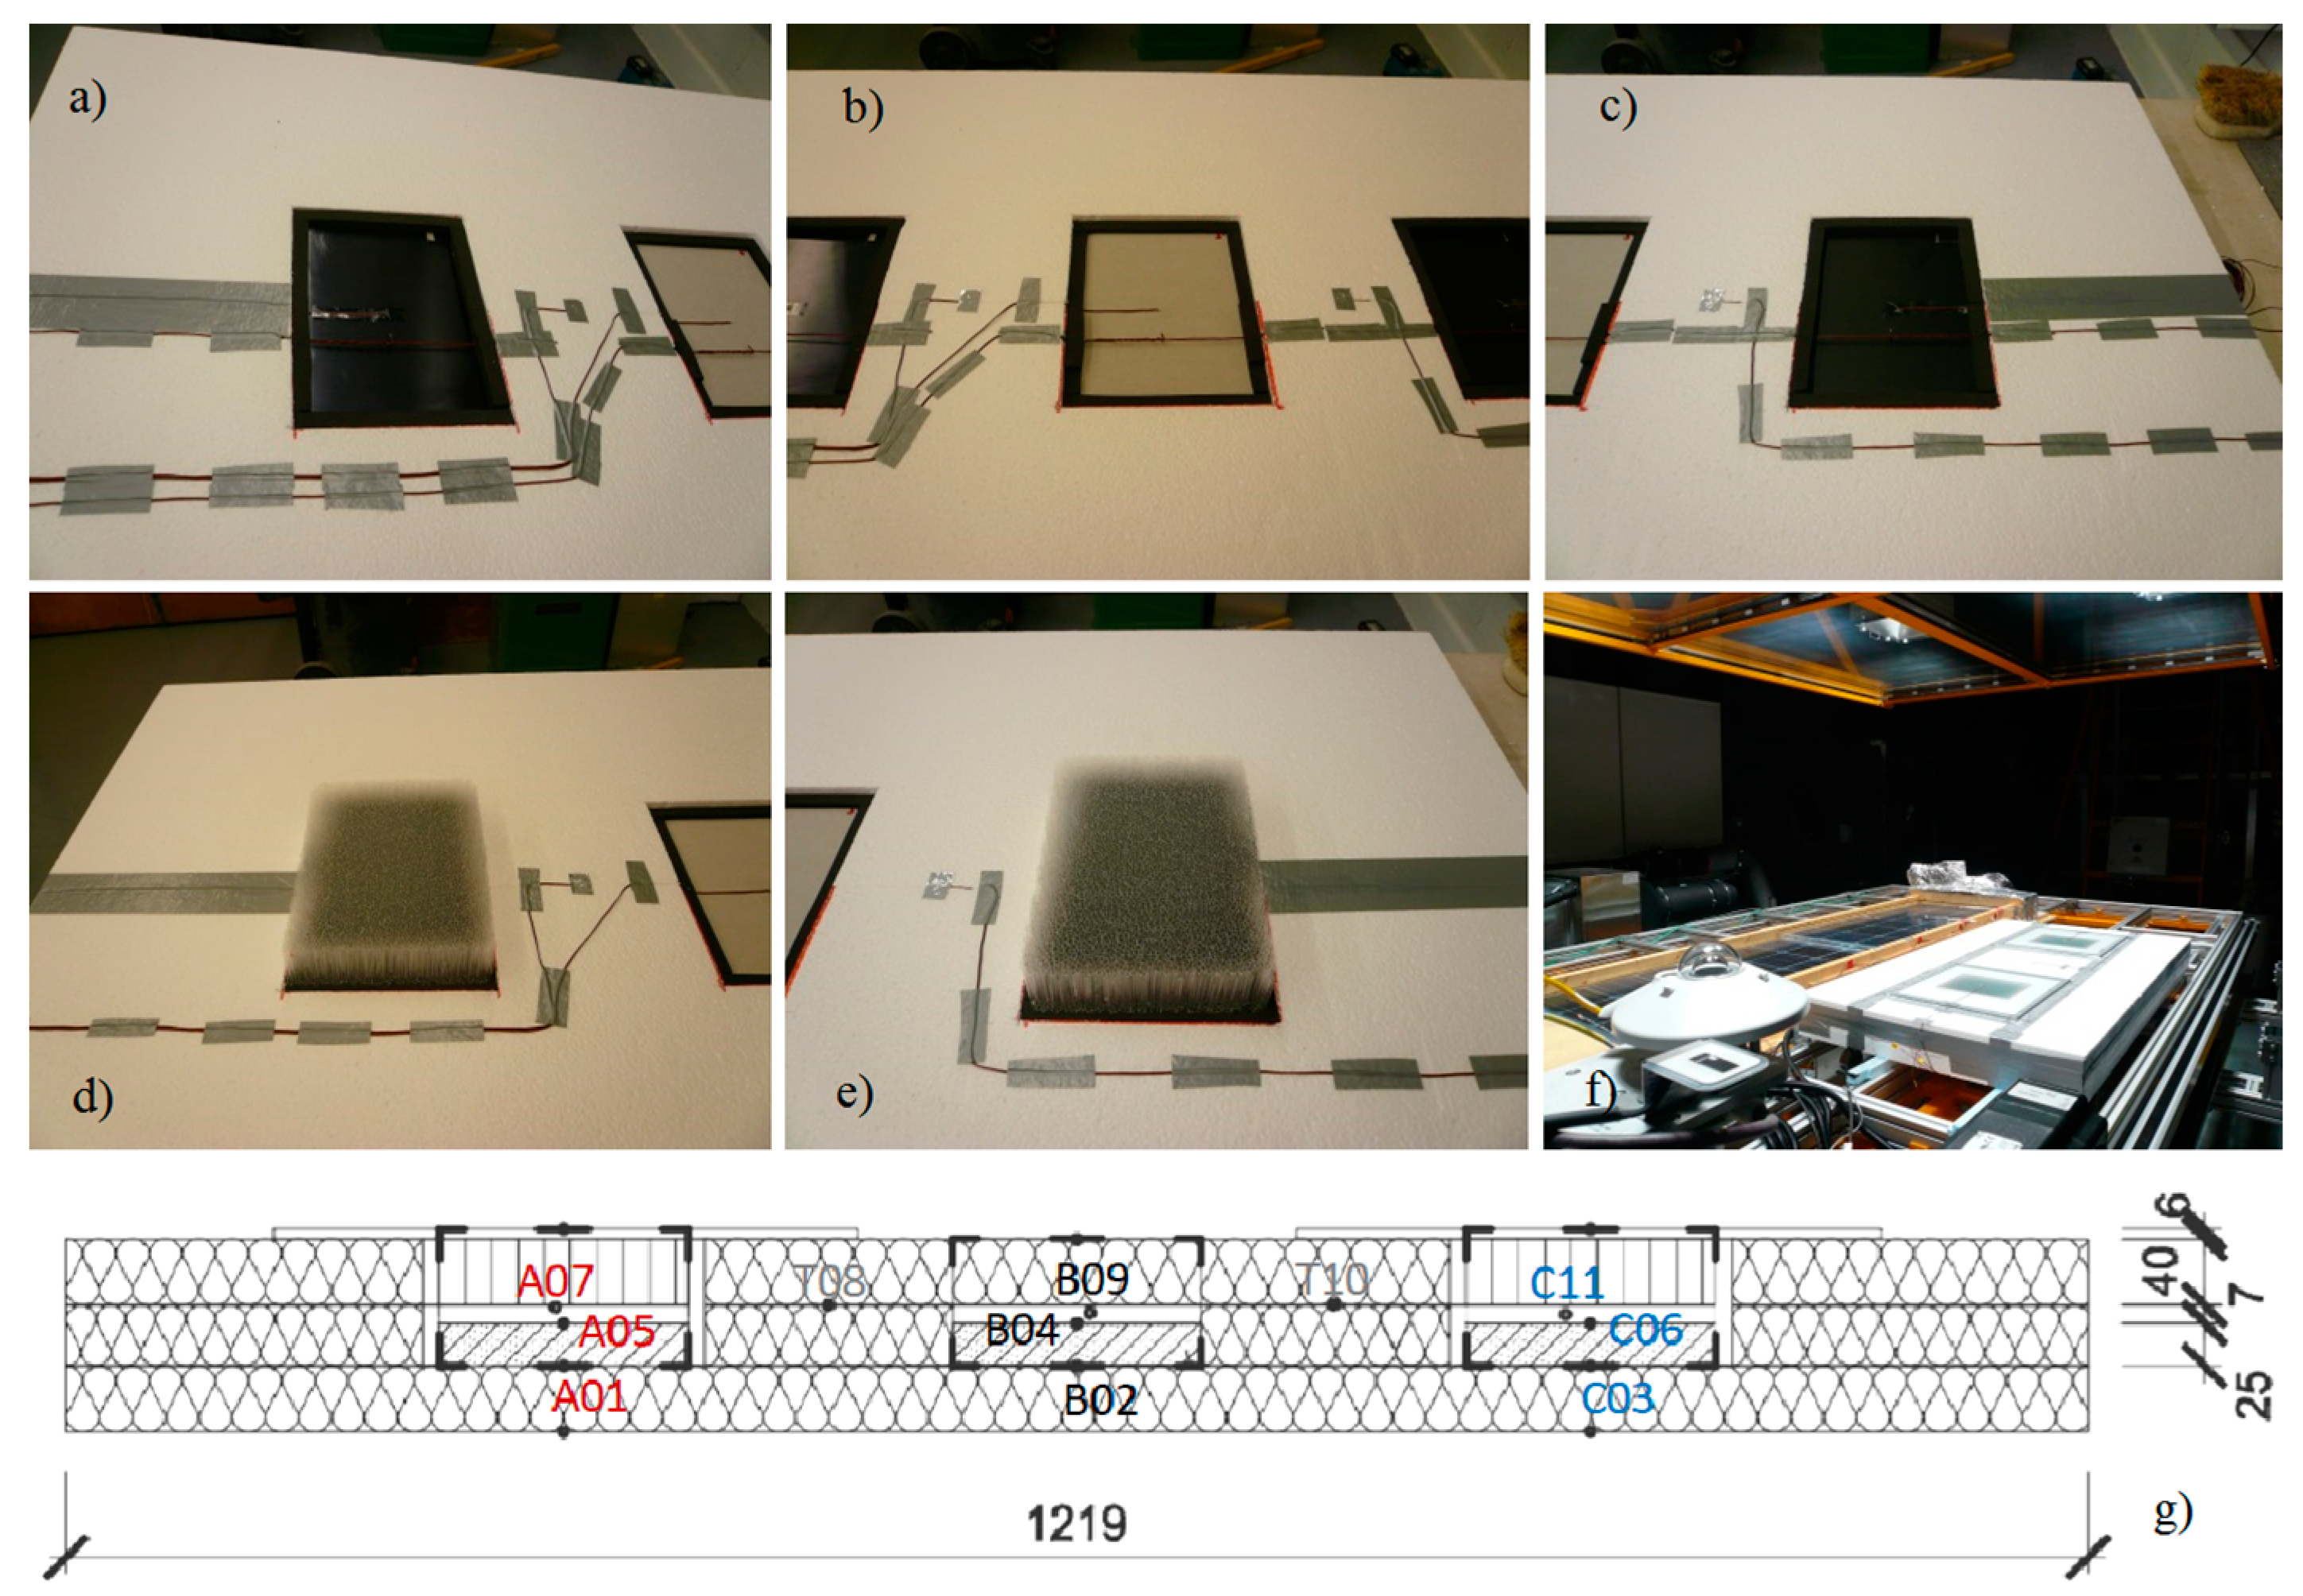
The overall results of the laboratory, solar simulator and small-scale outdoor testing were applied in the measurement of full-scale outdoor thermodynamic performance. All testing periods are specified in the thermodynamic performance analysis of the time-transient summer period. A full-scale test sample was designed (Figure 10), after which a 1.19 m × 1.19 m test prototype (Figure 10) was built using the system based on the Kapilux TWD transparent insulation fitted with honeycomb transparent PMMA-based insulation with a different solar absorber type, and tested outdoors. The TWD system is double low-e glazing incorporating honeycomb PMMA transparent insulation with air cavity. The declared thermal and optical properties are as follows: thermal transmittance Ug is 0.7 W/(m2K), total solar energy transmittance or solar heat gain coefficient is 61% and light transmission is 70%. The type of transparent insulation directly incorporated in glazing system represents the only difference as compared with small-scale prototypes. Figure 10 shows the geometrical parameters of the prototype, the positions of all sensors and key illustrations of their construction phase. As demonstrated in Figure 10, this prototype may allow to implement a ventilation function, however in this study it has not been applied. The last illustration (Figure 10f) presents the prototype’s outdoor installation in two identical wall brick boxes with 50 mm thick thermal insulation, in which both samples, a reference and comparative one, were installed facing south at the AdMaS Centre at Brno University of Technology. (longitude 16°34′, latitude 49°14′, altitude 297.23 m). More detailed information about the test boxes can be found in [55]. Measurements were taken at six positions along the test sample, with each interface being on a diagonal line consisting of three sensors. Temperatures were measured by Pt100 sensors (Type CRZ 2005-100, class A, tolerance 0.15 + 0.0002t). Again, as previously mentioned, similar indexes were used to recognize the particular position measured, though they primarily focused on the material interface between the absorber and the heat accumulation layer (gypsum board). First, the internal surface temperatures of tested samples si were measured, and second, the internal space temperature of each full-scale box in. In addition, silicon pin photodiodes Fdi were installed inside the air gap to monitor solar radiation behind the TIM incident at the absorber level Figure 11. The monitoring of outdoor ambient temperature Tae and the solar radiation intensity inside the air gap Fdi represent an important part of the testing in relation to this stage of the presented analysis. The outdoor temperature varied from 15 °C to more than 30 °C. Solar intensities behind the TIM reached more than 200 W/m2 in the area of the solar absorbers.
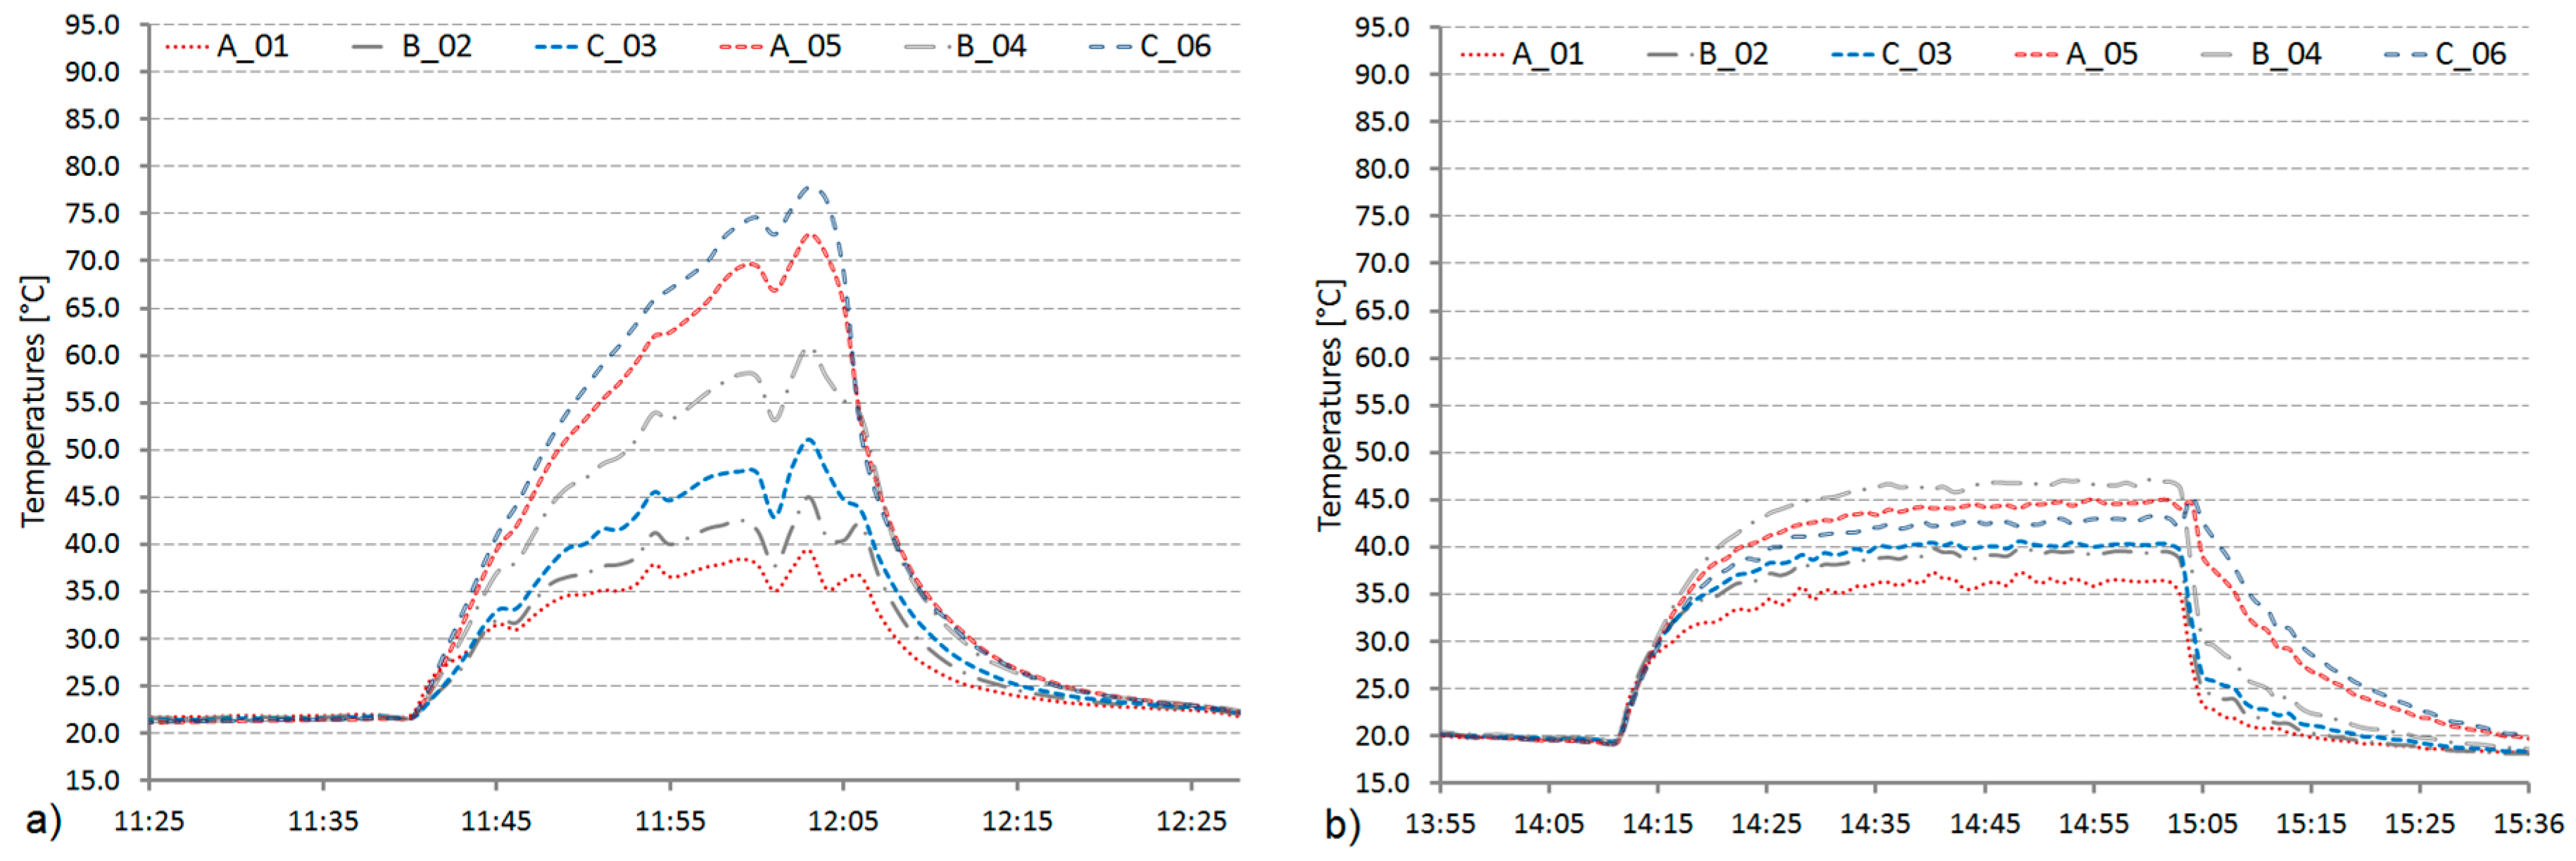
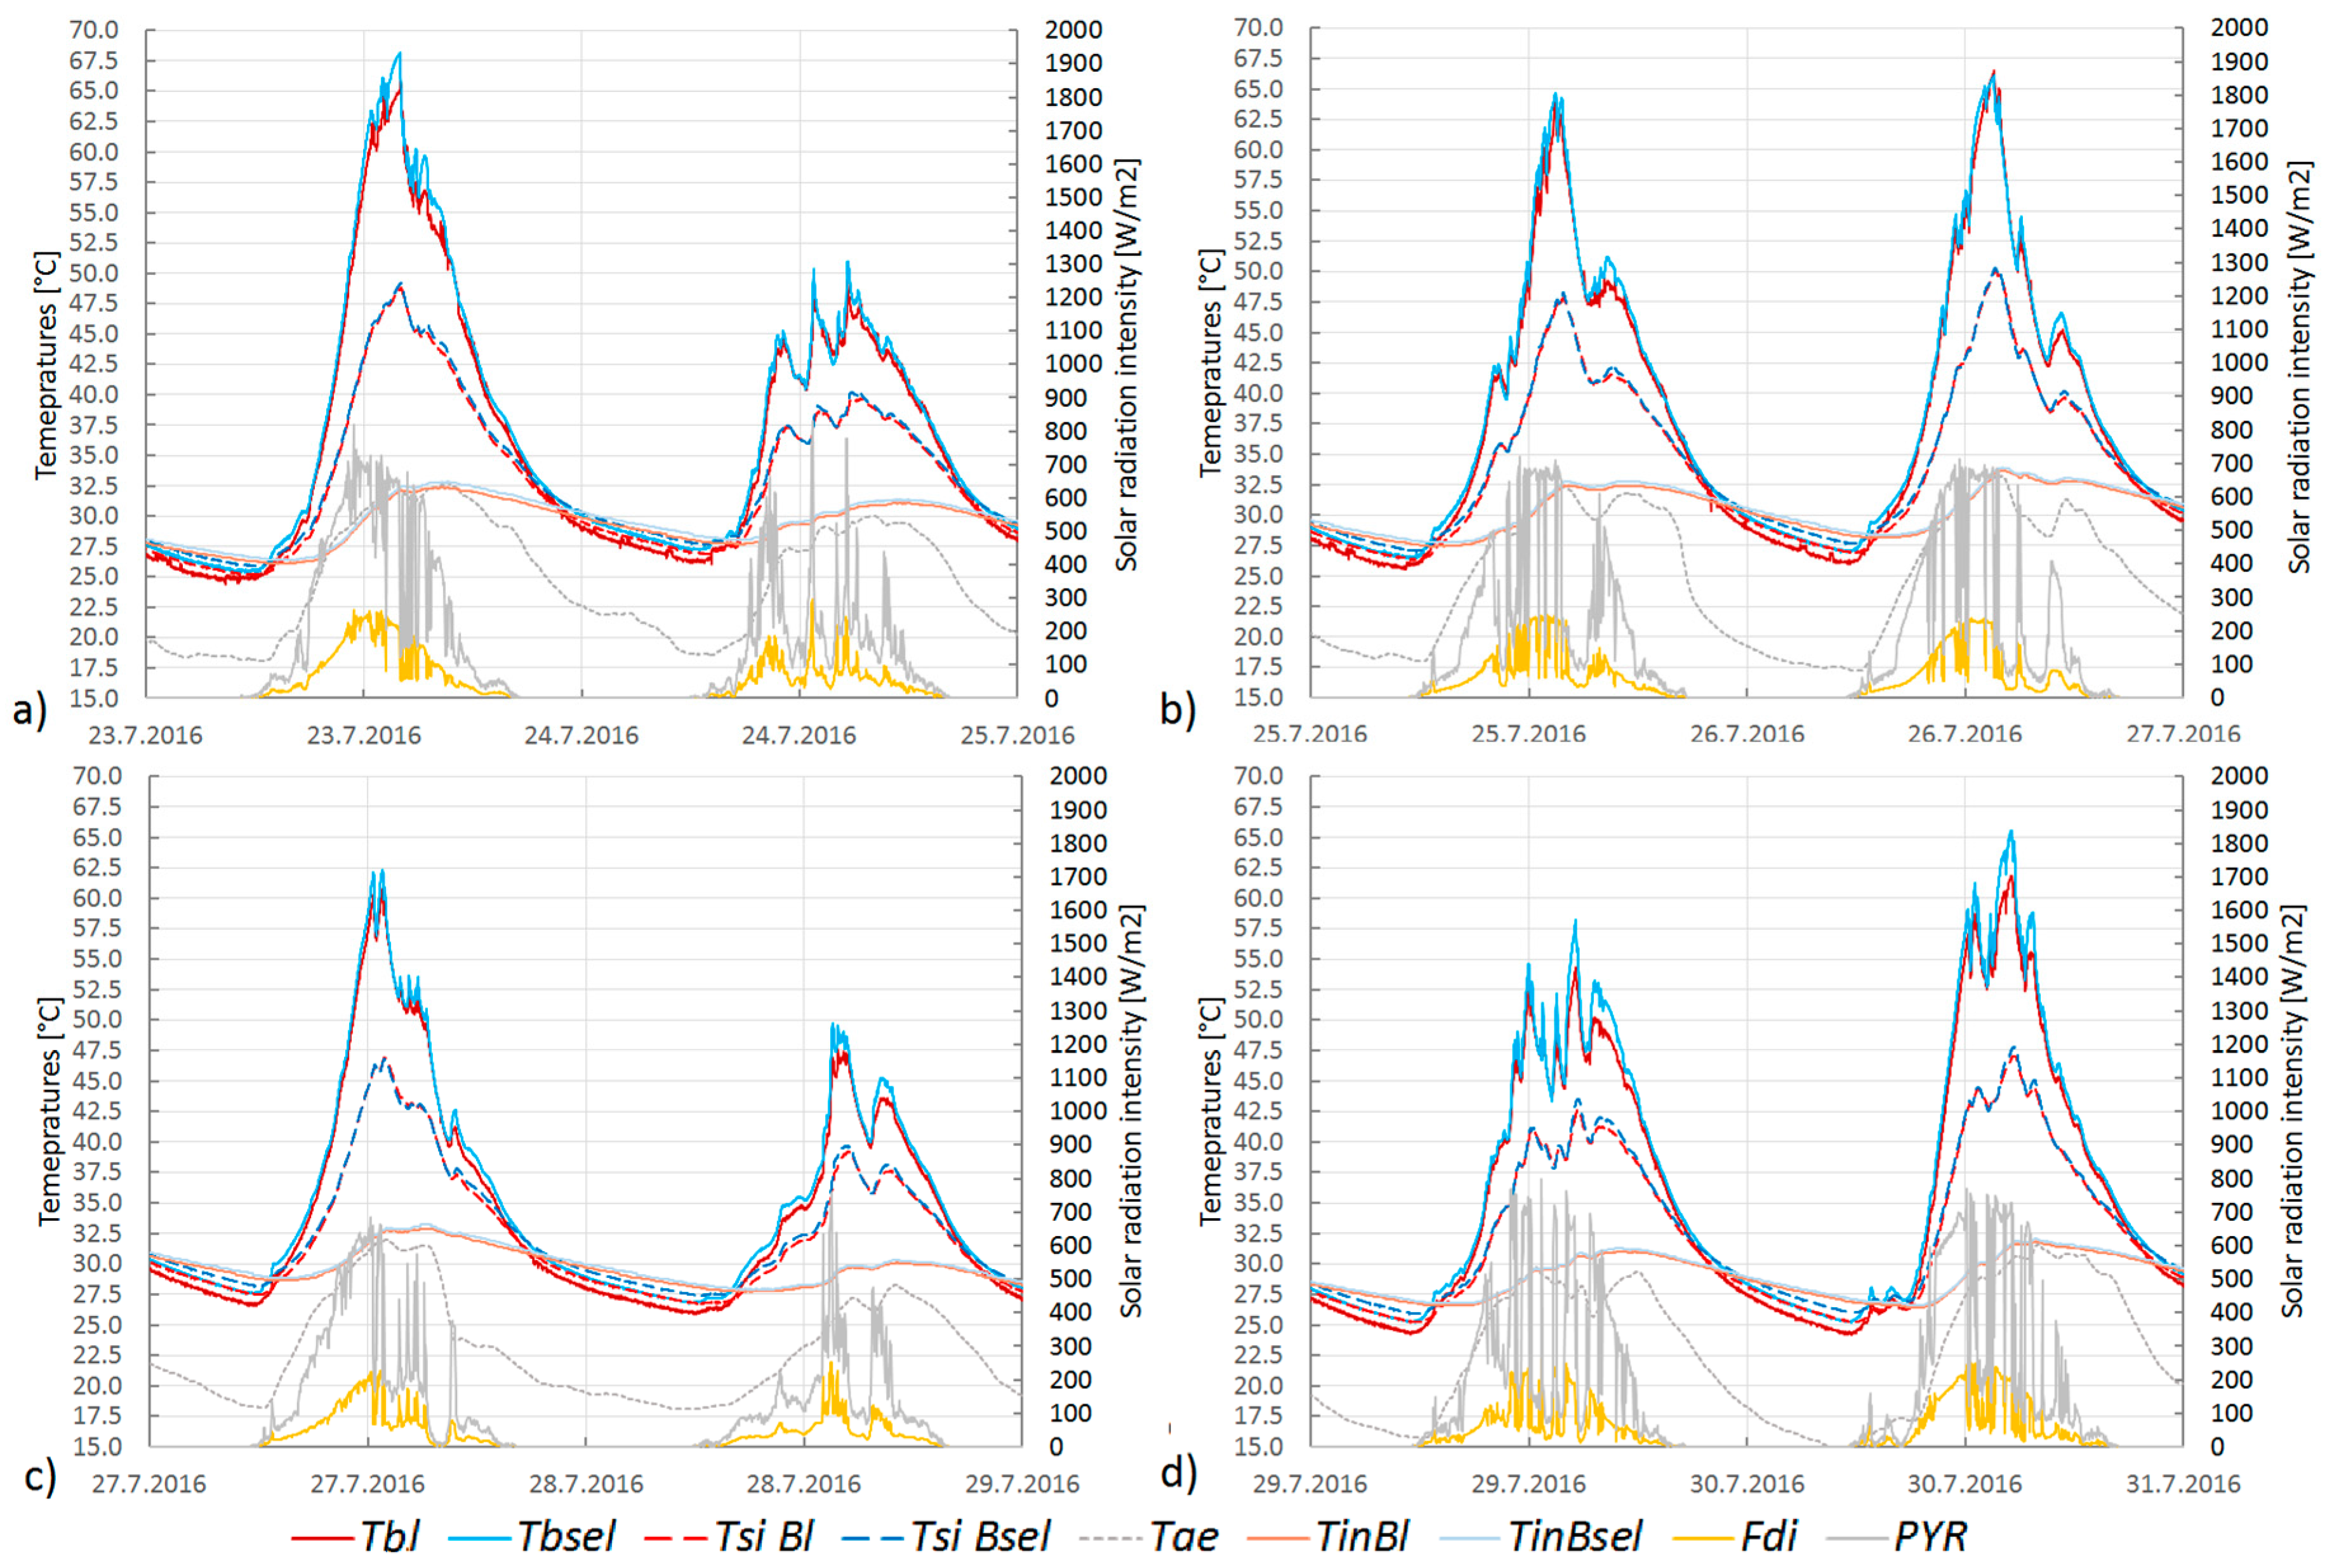
All results are taken applied for outdoor conditions where maximum sun height above horizon has been achieved during midday at 60°, which corresponds to the 60° incline from normal incidence angle. This represents accordingly a maximum solar incidence at the tested location. Looking at the results obtained during outdoor tests (Figure 11), it is clear there is an opposite tendency in comparison with the small-scale testing. This is presumably caused by applying the TWD system that incorporates another low-e surface. Thus, the combination of two low emissivity materials can completely change its physical substance as compared to the small-scale prototype testing. The selective absorber reaches a higher temperature in comparison with the non-selective absorber behind the absorber plate, which is direct contact with the accumulation board. Depending on the solar radiation level, it represents a maximum difference of up to 3 K. On the other hand, the effect of temperature difference at internal surface temperatures of whole samples is almost negligible in daytime periods, though a phase shift occurs in the night-time, where the non-selective absorber could principally cool down more intensively. This aspect is specifically directed towards positive utilizing in winter and periods of heating. The absorber temperature at the center of the full-scale prototype reached a maximum of approximately 67.5 °C at maximum peak when the incident outdoor vertical solar radiation reached its maximum of around 700 W/m2 in parallel with its internal transmitted part of around 250 W/m2 and the ambient outdoor temperature was around 32.5 °C. At this moment, the corresponding inside space temperature measured reached a maximum of its outdoor level.
The solar angular or effects of the incidence angle on the solar transmittance is parametrized by Table 8. This dependence is obtained by Matuška [56], assuming zero transmittance for the incidence angle 90°. Theoretically, for system that combines double low-e glazing and honeycomb transparent insulation, the calculated value can be derived by their multiplying to correspond its approximate value. For outdoor tests, a specific approach of monitoring the total solar transmittance responding to the outdoor conditions can be applied.
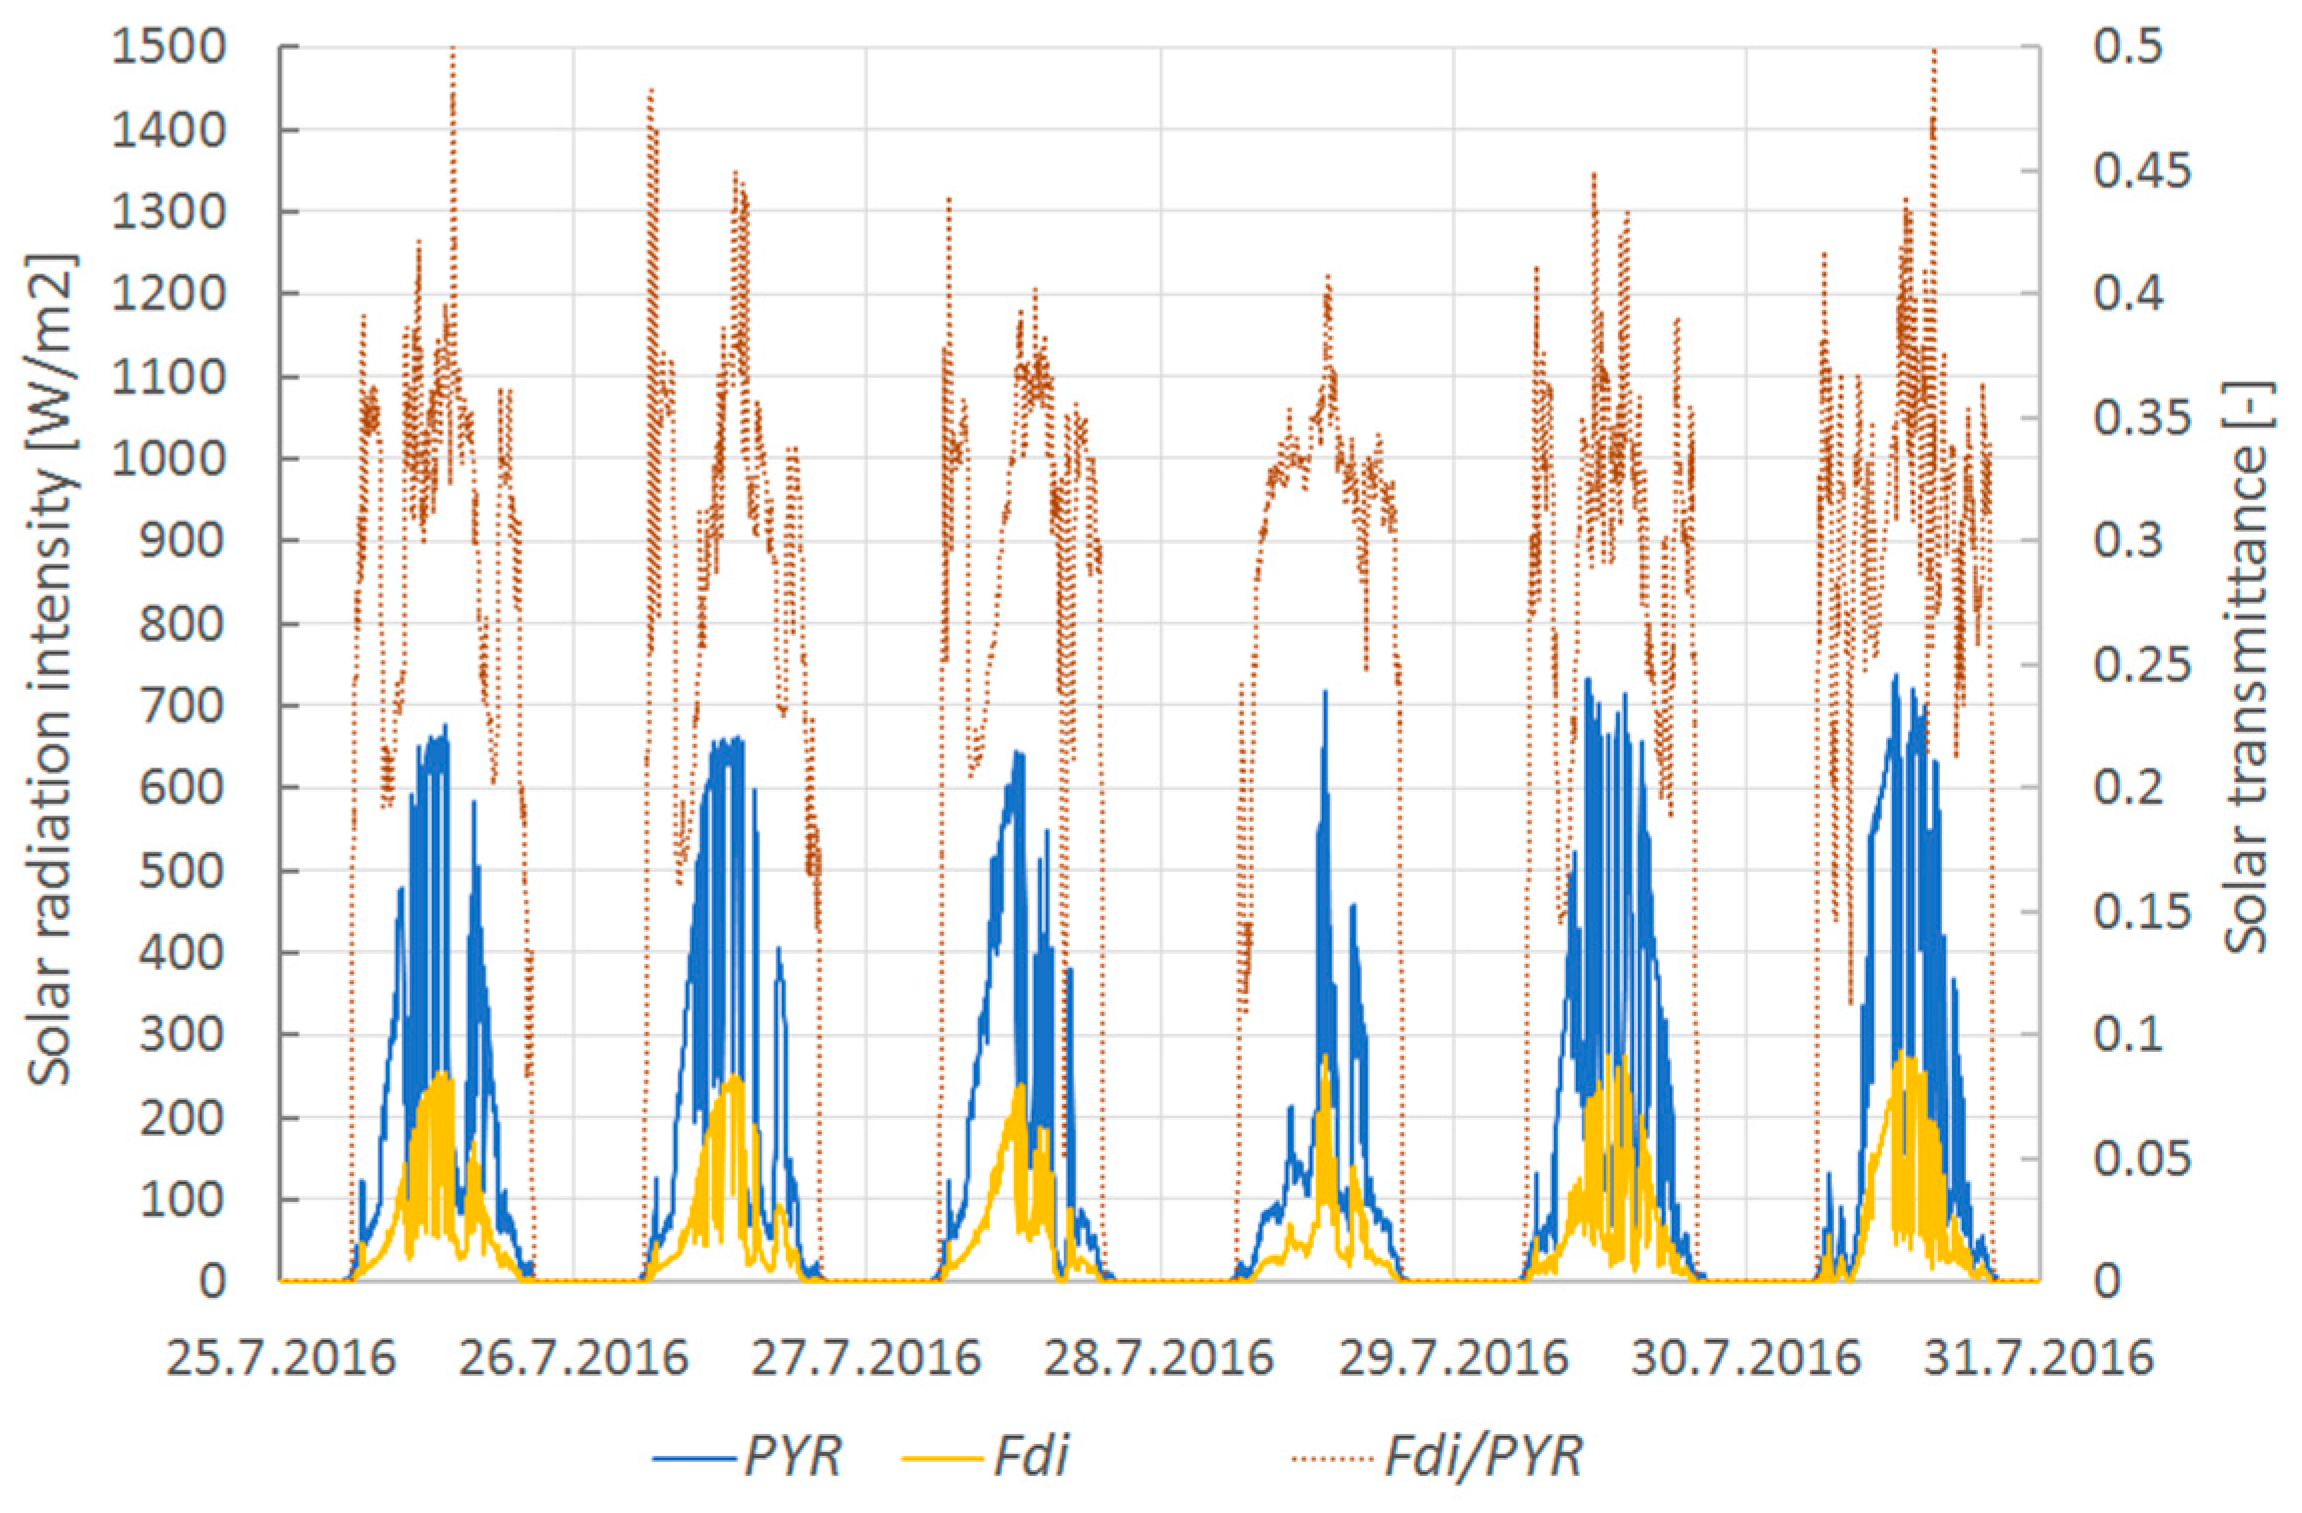
The same methodology is employed as applied in Section 3.2 to calculate the outdoor solar transmittance of TIM. Results presented in Figure 12 show time varying values of total solar transmittance based on real measured solar intensities. Here the ratio (Equation (6)) between two solar intensities is calculated, where PYR corresponds to the total solar radiation incident in front of measured components, whilst Fdi is its transmitted value through the TIM, both obtained by the silicon pin photodiode. Detailed application of this element can be found in [57]. Typically, measured values are varying from 0.25 to a maximum of 0.45 depending on solar radiation intensity, its average value corresponds roughly to 0.35 achieving the theoretical calculation from Table 8.
T = F d i P Y R   [ - ]
In general, this approach and methodology might demonstrate annual values of solar transmittance with relation to the angle of incidence and dynamic time transient conditions of outdoor climate.

6. Conclusions

The paper presents the results of an experimental analysis of a proposed non-ventilated solar façade concept. Thermal and optical parameters have been specified for it to be considered in this context. An experimental monitoring on simple based elements focuses on the dynamic response of selective absorbers coupled with TIM as a fundamental step towards understanding overall interactions influencing the heat transfer of presented concept. Selective absorber and transparent insulation functions are implemented for this study. Based on the detailed observation of all the experimental procedures involved, it is demonstrated that from the thermal point of view, the selective absorbent properties could improve thermal properties significantly compared to concepts using high emissivity absorbers. From the thermal resistance point of view, the proposed concept implementing transparent insulation and a selective absorber provides comparable performance to conventional thermal insulation. On the other hand, when comparing the temperature response invoked by solar radiation at its maximum peak, based on solar experimental models, no significant effect is observed. A difference of up to 3.0 K is principally reached at the maximum obtained temperature level. In addition, the total solar transmittance of TIM applied in small- and full-scale tests is additionally analysed to demonstrate its effect on incidence angle and other specifics.
Further research will be focused on numerical modelling as well as the application of the described concepts in full-scale mode tested outdoors via year-round testing, where heating periods are supposed to be more relevant. Based on this study, it is planned that other functions will be implemented, such as transparent selectivity, and at the heat storage level of the base of PCMs.

Acknowledgments

This research was supported by the project GA 16-02430Y “Contemporary concepts of climatically active solar façades integrating advanced material solutions” supported by Czech Science Foundation and under the project No. LO1408 “AdMaS UP—Advanced Materials, Structures and Technologies”, supported by Ministry of Education, Youth and Sports under the “National Sustainability Programme I”. Special thanks belong to the researchers at Concordia University’s Department of BCEE, Andreas Athienitis, Hua Ge and Jiwu Rao, whose support within solar simulator testing is appreciated here.

Author Contributions

Miroslav Čekon conceived and designed the experiments and main concept of presented research; Richard Slávik actively participated and significantly contributed to perform the experiments; Miroslav Čekon analyzed the data related to optical analysis and Richard Slávik analyzed the data based on thermal aspects; Finally, Miroslav Čekon wrote and revised the paper.

Conflicts of Interest

The authors declare no conflict of interest. The founding sponsors had no role in the design of the study; in the collection, analyses, or interpretation of data; in the writing of the manuscript, and in the decision to publish the results.

Nomenclature

SymbolsExpressionUnit
AArea[m2]
M0,λSpectral radiance intensity[W/(m2µm)]
TThermodynamic temperature[K]
TTotal solar transmittance[-]
TaeExternal ambient temperature[°C]
TTemperature gradient[K]
UGThermal transmittance[W/m2/K]
RThermal resistance[W/(m2K)]
RPercent reflectance[-]
QHeat flux[W/m2]
τSpectral transmittance[-]
ISolar irradiance[W/m2]
ρBulk density[kg/m3]
dThickness[mm]
cSpecific heat capacity[J/(kgK)]
cLight speed in vacuum (299 792 458)[m/s]
C1Planck´s function 2πhc2 (3.74 × 10⁻¹⁶)[W/m2]
C2Planck´s function hc/k (1.43 × 10⁻²)[mK]
hPlanck constant (6.626 × 10⁻³⁴)[Js]
kBoltzmann constant (1.3807 × 10⁻²³)[J/K]
α, αλAlpha, absorbance, spectral absorbance[-]
ε, ελEpsilon, emissivity, spectral emissivity[-]
ρ, ρλRho, reflectance, spectral reflectance[-]
λLambda, wavelength[µm]
λLambda, thermal conductivity[W/(mK)]
Subscripts:
aiTemperature of air, internal air cavity temperature
blTemperature between absorber and heat accumulation layer
bselTemperature between selective absorber and accumulation layer
ekvEquivalent
inTemperature inside box, internal
sdTemperature behind gypsum board
seExternal surface temperature, surface absorber temperature
siInternal surface temperature
0Black body
Abbreviations
BlBlack painted absorber, non-selective
BselSelective absorber
DGDouble glazing with low-e
FT-IRFourier transform infrared
G, PGGlass, plexiglass
GBGypsum board
ISOInternational Organization for Standardization
nvAGNon ventilated air gap
NIRNear infrared radiation region
PMMApolymethylmethacrylate
PYRPyranometer sensor
TCThermocouple
TIMsTransparent insulation materials
UVUltraviolet radiation region
VIPsVacuum insulation panels
VISVisible radiation region

References

  1. Treberspurg, M.; Djalili, M. New Technical Solutions for Energy Efficient Buildings; State of the Art Report, Multifunctional Façade Systems; BOKU: San Francisco, CA, USA, 2010. [Google Scholar]
  2. Favoino, F.; Goia, F.; Perino, M.; Serra, V. Experimental assessment of the energy performance of an advanced responsive multifunctional façade module. Energy Build. 2014, 68, 647–659. [Google Scholar] [CrossRef]
  3. Gosztonyi, S.; Stefanowicz, M.; Bernardo, R.; Blomsterberg, Å. Multi-active façade for Swedish multi-family homes renovation—Evaluating the potentials of passive design measures. J. Facade Des. Eng. 2016, 4, 7–21. [Google Scholar]
  4. Loonen, R.C.G.M.; Trčka, M.; Cóstola, D.; Hensen, J.L.M. Climate adaptive building shells: State-of-the-art and future challenges. Renew. Sustain. Energy Rev. 2013, 25, 483–493. [Google Scholar] [CrossRef]
  5. Goia, F.; Perino, M.; Serra, V.; Zanghirella, F. Towards an Active, Responsive, and Solar Building Envelope. J. Green Build. Fall 2010, 5, 121–136. [Google Scholar] [CrossRef]
  6. Perino, M.; Serra, V. Switching from static to adaptable and dynamic building envelopes: A paradigm shift for the energy efficiency in buildings. J. Facade Des. Eng. 2015, 3, 143–163. [Google Scholar] [CrossRef]
  7. Sadineni, S.B.; Madala, S.; Boehm, R.F. Passive building energy savings: A review of building envelope components. Renew. Sustain. Energy Rev. 2011, 15, 3617–3631. [Google Scholar] [CrossRef]
  8. Jelle, B.P. Traditional, state-of-the-art and future thermal building insulation materials and solutions—Properties, requirements and possibilities. Energy Build. 2011, 43, 2549–2563. [Google Scholar] [CrossRef]
  9. AL-Saadi, S.N.; Zhai, Z. Modeling phase change materials embedded in building enclosure: A review. Renew. Sustain. Energy Rev. 2013, 21, 659–673. [Google Scholar] [CrossRef]
  10. Soares, N.; Costa, J.J.; Gaspar, A.R.; Santos, P. Review of passive PCM latent heat thermal energy storage systems towards buildings’ energy efficiency. Energy Build. 2013, 59, 82–103. [Google Scholar] [CrossRef]
  11. Alam, M.; Singh, H.; Limbachiya, M.C. Vacuum Insulation Panels (VIPs) for building construction industry-A review of the contemporary developments and future directions. Appl. Energy 2011, 88, 3592–3602. [Google Scholar] [CrossRef]
  12. Baetens, R.; Jelle, B.P.; Gustavsen, A. Aerogel insulation for building applications: A state-of-the-art review. Energy Build. 2011, 43, 761–769. [Google Scholar] [CrossRef]
  13. Orel, Z.C.; Klanjšek, G.M. Spectrally selective paint coatings: Preparation and characterization. Sol. Energy Mater. Sol. Cells 2011, 68, 337–353. [Google Scholar] [CrossRef]
  14. Kaynakli, O. A review of the economical and optimum thermal insulation thickness for building applications. Renew. Sustain. Energy Rev. 2012, 16, 415–425. [Google Scholar] [CrossRef]
  15. Saadatian, O.; Lim, C.H.; Sopian, K.; Salleh, E. A state of the art review of solar walls: Concepts and applications. J. Build. Phys. 2013, 37, 55–79. [Google Scholar] [CrossRef]
  16. Quesada, G.; Rousse, D.; Dutil, Y.; Badache, M.; Hallé, S. A comprehensive review of solar facades. Opaque solar facades. Renew. Sustain. Energy Rev. 2012, 16, 2820–2832. [Google Scholar] [CrossRef]
  17. Stazi, F.; Mastrucci, A.; Costanzo, D.P. The behaviour of solar walls in residential buildings with different insulation levels: An experimental and numerical study. Energy Build. 2012, 47, 217–229. [Google Scholar] [CrossRef]
  18. Jaber, S.; Ajib, S. Optimum design of Trombe wall system in mediterranean region. Sol. Energy 2011, 85, 1891–1898. [Google Scholar] [CrossRef]
  19. Chel, A.; Nayak, J.K.; Kaushik, G. Energy conservation in honey storage building using Trombe wall. Energy Build. 2008, 40, 1643–1650. [Google Scholar] [CrossRef]
  20. Omrany, H.; Ghaffarianhoseini, A.; Ghaffarianhoseini, A.; Raahemifar, K.; Tookey, J. Application of passive wall systems for improving the energy efficiency in buildings: A comprehensive review. Renew. Sustain. Energy Rev. 2016, 62, 1252–1269. [Google Scholar] [CrossRef]
  21. Bellos, E.; Tzivanidis, C.; Zisopoulou, E.; Mitsopoulos, G.; Antonopoulos, K.A. An innovative Trombe wall as a passive heating system for a building in Athens-A comparison with the conventional Trombe wall and the insulated wall. Energy Build. 2016, 133, 754–769. [Google Scholar] [CrossRef]
  22. Abbassi, F.; Dehmani, L. Experimental and numerical study on thermal performance of an unvented Trombe wall associated with internal thermal fins. Energy Build. 2016, 15, 119–128. [Google Scholar] [CrossRef]
  23. Mohamed, L.; Dehmani, L.; Gagliano, A. Effect of glazing type on the performance of a Trombe wall in Tunisia. In Proceedings of the Sixth International Renewable Energy Congress, Sousse, Tunisia, 24–26 March 2015; pp. 1–6. [Google Scholar]
  24. Bojič, M.; Johannes, K.; Kuznik, F. Optimizing energy and environmental performance of passive Trombe wall. Energy Build. 2014, 70, 279–286. [Google Scholar] [CrossRef]
  25. Hu, Z.; He, W.; Hong, X.; Ji, J.; Shen, Z. Numerical analysis on the cooling performance of a ventilated Trombe wall combined with venetian blinds in an office building. Energy Build. 2016, 126, 14–27. [Google Scholar] [CrossRef]
  26. Hong, X.; He, W.; Hu, Z.; Wang, C.; Ji, J. Three-dimensional simulation on the thermal performance of a novel Trombe wall with venetian blind structure. Energy Build. 2015, 89, 32–38. [Google Scholar] [CrossRef]
  27. Shen, J.; Lassue, S.; Zalewski, L.; Huang, D. Numerical study on thermal behavior of classical or composite Trombe solar walls. Energy Build. 2007, 39, 962–974. [Google Scholar] [CrossRef]
  28. Stazi, F.; Mastrucci, A.; Perna, C.D. Trombe wall management in summer conditions: An experimental study. Sol. Energy 2012, 86, 2839–2851. [Google Scholar] [CrossRef]
  29. Abbassi, F.; Dimassi, N.; Dehmani, L. Energetic study of a Trombe wall system under different Tunisian building configurations. Energy Build. 2014, 80, 302–308. [Google Scholar] [CrossRef]
  30. Duan, S.; Jing, C.; Zhao, Z. Energy and exergy analysis of different Trombe walls. Energy Build. 2016, 126, 517–523. [Google Scholar] [CrossRef]
  31. Rabani, M.; Kalantar, V.; Dehghan, A.A.; Faghih, A.K. Experimental study of the heating performance of a Trombe wall with a new design. Sol. Energy 2015, 118, 359–374. [Google Scholar] [CrossRef]
  32. Kaushika, N.D.; Sumathy, K. Solar transparent insulation materials: A review. Renew. Sustain. Energy Rev. 2003, 7, 317–351. [Google Scholar] [CrossRef]
  33. Braun, P.O.; Goetzberger, A.; Schmid, J.; Stahl, W. Transparent insulation of building facades—Steps from research to commercial applications. Sol. Energy 1992, 49, 413–427. [Google Scholar] [CrossRef]
  34. Rommel, M.; Wagner, A. Application of transparent insulation materials in improved flat-plate collectors and integrated collector storages. Sol. Energy 1992, 49, 371–380. [Google Scholar] [CrossRef]
  35. Wong, I.L.; Eames, P.C.; Perera, R.S. A review of transparent insulation systems and the evaluation of payback period for building applications. Sol. Energy 2007, 81, 1058–1071. [Google Scholar] [CrossRef]
  36. Hausner, R.; Geißler, S.; Platzer, W. Ecological and energetic evaluation of transparent insulation systems. In Proceedings of the EuroSun Conference, Freiburg, Germany, 16–19 September 1996. [Google Scholar]
  37. Dowson, M.; Pegg, I.; Harrison, D.; Dehouche, Z. Predicted and in situ performance of a solar air collector incorporating a translucent granular aerogel cover. Energy Build. 2012, 49, 173–187. [Google Scholar] [CrossRef]
  38. Kessentini, H.; Castro, J.; Capdevila, R.; Oliva, A. Development of flat plate collector with plastic transparent insulation and low-cost overheating protection system. Appl. Energy 2014, 133, 206–223. [Google Scholar] [CrossRef]
  39. Dowson, M.; Harrison, D.; Dehouche, Z. Trombe walls with nanoporous aerogel insulation applied to UK housing refurbishments. Int. J. Smart Nano Mater. 2014, 5, 283–303. [Google Scholar] [CrossRef]
  40. Cadafalch, J.; Cònsul, R. Detailed modelling of flat plate solar thermal collectors with honeycomb-like transparent insulation. Sol. Energy 2014, 107, 202–209. [Google Scholar] [CrossRef]
  41. Suehrcke, H.; Däldehög, D.; Harris, J.A.; Lowe, R.W. Heat transfer across corrugated sheets and honeycomb transparent insulation. Sol. Energy 2004, 76, 351–358. [Google Scholar] [CrossRef]
  42. Kessentini, H.; Capdevila, R.; Castro, J.; Oliva, A.; Bouden, C. Three-dimensional heat transfer analysis of combined conduction and radiation in honeycomb transparent insulation. Sol. Energy 2014, 105, 58–70. [Google Scholar] [CrossRef]
  43. Zalewski, L.; Joulin, A.; Lassue, S.; Dutil, Y.; Rousse, D. Experimental study of small-scale solar wall integrating phase change material. Sol. Energy 2012, 86, 208–219. [Google Scholar] [CrossRef]
  44. Levinson, R.; Akbari, H.; Berdahl, P. Measuring solar reflectance—Part II: Review of practical methods. Sol. Energy 2010, 84, 1745–1759. [Google Scholar] [CrossRef]
  45. Levinson, R.; Akbari, H.; Berdahl, P. Measuring solar reflectance—Part I: Defining a metric that accurately predicts solar heat gain. Sol. Energy 2010, 84, 1717–1744. [Google Scholar] [CrossRef]
  46. American Society for Testing and Materials. Standard Tables for Reference Solar Spectral Irradiances: Direct Normal and Hemispherical on 37° Tilted Surface; ASTM G173-03; American Society for Testing and Materials: West Conshohocken, PA, USA, 2012. [Google Scholar]
  47. Čekon, M.; Kalousek, M.; Hraška, J.; Ingeli, R. Spectral optical properties and thermodynamic performance of reflective coatings in a mild climate zone. Energy Build. 2014, 77, 343–354. [Google Scholar] [CrossRef]
  48. Gagliano, A.; Nocera, F.; Patania, F.; Contino, A. A procedure for the characterization of the solar-weighted reflectance of mirrored reflectors. In Proceedings of the 2014 5th International Renewable Energy Congress (IREC), Hammamet, Tunisia, 25–27 March 2014; pp. 1–6. [Google Scholar]
  49. Platzer, W.J. Directional-hemispherical solar transmittance data for plastic honeycomb-type structures. Sol. Energy 1992, 49, 359–369. [Google Scholar] [CrossRef]
  50. Platzer, W.J. Solar transmission of transparent insulation material. Sol. Energy Mater. 1987, 16, 275–287. [Google Scholar] [CrossRef]
  51. ASTM International. Standard Test Method for Solar Transmittance (Terrestrial) of Sheet Materials Using Sunlight; ASTM E1084-86(2015); ASTM International: West Conshohocken, PA, USA, 2015. [Google Scholar]
  52. Athienitis, A.; Fazio, P.; Rao, J.; Kapsis, C.; Bambara, J.; Chen, Y. Simulateur Solaire et Chambre Climatique (Laboratoire SSEC); Association Québécoise pour la Maîtrise de l’Énergie: Montréal, QC, Canada, 2012. [Google Scholar]
  53. European Committee for Standardization. European Standard: Thermal Solar Systems and Components—Solar Collectors—Part 2: Test Methods; Operating and Service Instructions; European Committee for Standardization: Brussels, Belgium, 2006. [Google Scholar]
  54. International Organization for Standardization. Test Methods for Solar Collectors—Part 1: Thermal Performance of Glazed Liquid Heating Collectors Including Pressure Drop; ISO: Geneva, Switzerland, 2013. [Google Scholar]
  55. Slávik, R.; Čekon, M.; Kolář, R.; Oravec, P. Operative Temperature Predicting of a Room in Summer: An approach for Validating of Empirical Calculation Models. Appl. Mech. Mater. 2016, 824, 519–526. [Google Scholar] [CrossRef]
  56. Matuska, T. A simple trombe wall: Comparison of different glazings. In Proceedings of the 3rd ISES Europe Solar Congress third ISES-Europe Solar Congress, Copenhagen, Denmark, 19–22 June 2000. [Google Scholar]
  57. Čekon, M.; Slávik, R.; Juráš, P. Obtainable Method of Measuring the Solar Radiant Flux Based on Silicone Photodiode Element. Appl. Mech. Mater. 2016, 824, 477–484. [Google Scholar] [CrossRef]
Figure 1. Spectral analysis of absorber samples; (a) Spectral reflectance for solar region UV/VIS/NIR; (b) spectral reflectance for infrared region.
Energies 10 00815 g001
Figure 2. Spectral analysis of transparent samples; spectral transmittance for UV/VIS/NIR region.
Energies 10 00815 g002
Figure 3. Total solar transmittance outdoor setup; (a) TIM + G4 and G4 test boxes and standalone PYR sensor; (b) proposed testing scheme: (1) measurement apparatus; (2) reference box; (3) metering box; (4) round bowl; (5) solar radiation intensity sensor; (6) measured sample space; (7) height adjustable screw; (8) protective layer, glass pane.
Energies 10 00815 g003
Figure 4. Total solar transmittance results based on outdoor testing; (a) overcast; (b) almost clear sky, (notes: TIM—transparent insulation material; G—glass pane; PYR—pyranometer; T—total solar transmittance as a ratio of two box configurations).
Energies 10 00815 g004
Figure 5. Thermal resistance results, guarded hot plate method.
Energies 10 00815 g005
Figure 6. Tested absorber surfaces, transparent insulation application and final tested setup, (a) component with selective metal sheet; (b) gypsum board surface without finishing; (c) component with black painted metal sheet; (d,e) transparent insulation applying; (f) test setup exposed by solar simulator; (g) test setup model and its sensor positioning, thermocouples (TC) installed between layers, on interior and exterior surfaces. Thermocouples are located in the middle of each component.
Energies 10 00815 g006
Figure 7. Averaged temperature values; (a) Temperature of absorber surface (°C); (b) Temperature behind gypsum board representing heat accumulation layer (°C); (c) air cavity temperatures (°C).
Energies 10 00815 g007
Figure 8. Temperatures behind gypsum board and absorber surface temperatures; (a) c_1 test case; (b) c_3 test case.
Energies 10 00815 g008
Figure 9. Small-scale outdoor measurements (a) Test scheme and measurement points; (b) Test setup; (c) Whole day measured temperatures; behind absorber temperatures; surface and air cavity temperatures; (d) Selected maximum peak temperatures of monitored day.
Energies 10 00815 g009
Figure 10. Full-scale outdoor measurements (a) Test setup and its geometrical compositions; (b) Measurements temperature and solar radiation points; (c) Selective absorber part; (d) Transparent insulation material TWD Kapilux; (e) Whole sample component and final test prototype; (f) Outdoor test.
Energies 10 00815 g010
Figure 11. Full-scale test results of one-week period; (ad) Temperature measurements behind absorbers and internal surface temperatures of tested components.
Energies 10 00815 g011
Figure 12. Outdoor solar transmittance results derived from solar intensity measurements.
Energies 10 00815 g012
Table 1. Table of measured absorber samples.
SampleMaterialSurface ShadeColor
S1Blacksmith refractory paintsemi-glossblack
S2Standard synthetic paintmatblack
S3Standard synthetic paintglossblack
O1Spectrally selective material—TiNOx-Nanomatblack
O2Spectrally selective material—TiNOx-Cuglossdark blue
O3Spectrally selective material—TiNOx-Alglossdark blue
Table 2. Table of measured materials.
SampleMaterialThickness [mm]Thermal Conductivity [W/m/K]Bulk Density [kg/m3]Specific Heat * [J/kg/m3]
M1Gypsum board12.50.1960653.701060
M2Transparent insulation40.20.076933.32n/a
M3Expanded polystyrene38.20.039314.111270
M4Float glass6.00.7600 *1331.69840
nvAGnon-ventilated air gap12.00.0251 *1.2471010
* Standardized values.
Table 3. Table of measured compositions.
CompositionThickness [mm]Composition (from Exterior Side)Absorber TypeThermal Insulation Type
A84.4M4 + M2 + nvAG + O1 + 2x M1O1transparent
B.176.8M3 + nvAG + 2x M1n/aconventional
B.277.1M3 + nvAG + O1 + 2x M1O1conventional
C84.4M4 + M2 + nvAG + S2 + 2x M1S2transparent
Table 4. Total spectral emissivity ελ and reflectance ρλ as weighted values in measured IR spectrum.
Characterρλ 0.3–2.5 μmαλ 0.3–2.5 μmρλ 2.5–18.0 μmελ 0.3–2.5 μm
S10.150.850.180.82
S20.040.960.060.94
S30.050.950.070.93
O10.100.900.940.06
O20.050.950.930.07
O30.060.940.960.04
Table 5. Total solar transmittance values τλ.
Materialτλ ASTM G 173τλ SRS UV 0.2–0.3 μmτλ SRS VIS 0.3–0.8 μmτλ SRS NIR 0.8–2.5 μmτλ Insitu ′ 0.3–3.0 μmτλ Insitu ″ 0.3–3.0 μm
G40.860.810.900.830.830.82
G60.810.690.880.76n/an/a
PG0.820.530.880.80n/an/a
TIM0.750.660.760.750.780.80
TIM+G40.650.530.680.620.650.66
´—overcast ´´—almost clear sky.
Table 6. Thermal resistance at mean temperature.
SampleThickness [mm]Equivalent Thermal Conductivity Coefficient at Mean Temperature [W/(m·K)]Thermal Resistance at Mean Temperature [(m2·K)/W]Optical Properties of Absorbers
10 °C20 °C30 °C10 °C20 °C30 °CελαλAbs. Color
A84.40.0790.0880.0981.0670.9650.8620.060.90black
B.176.80.0620.0650.0691.2311.1831.1160.86n/an/a
B.277.10.0500.0540.0591.5301.4351.2970.060.90black
C84.40.1190.1260.1360.7120.6680.6200.940.96black
Table 7. Summary of temperatures averaged on proposed components.
CaseTime [min]Temperature of Absorber Surface [°C]Temperature Behind Heat Accumulation Level [°C]Temperature of Inside Air Cavity [°C]
A_05B.1_04C_06A_01B.1_02C_03A_07B_1.09C_11
c_145–6550.3848.2653.4033.2533.9338.0259.0262.1856.67
c_290–13058.1250.1661.2835.0939.2042.3665.1866.9061.40
c_3190–24044.1746.4442.4233.9336.5337.2939.1038.2632.51
Table 8. Angular solar transmittance values τӨi [56].
MaterialτӨi τӨi 40°τӨi 50°τӨi 70°τӨi 80°
DG0.650.630.580.430.22
TIM0.800.730.680.530.31
TIM + DG *0.520.460.390.230.07
* Calculated theoretical value by multiplying of DG and TIM.

