
Study on the Effects of Evaporation and Condensation on the Underfloor Space of Japanese Detached Houses Using CFD Analysis


1
Graduate School of Engineering, Department of Architecture, The University of Tokyo, 4-6-1 Komaba, Meguro-ku, Tokyo 153-8505, Japan
2
Institute of Industrial Science, The University of Tokyo, 4-6-1 Komaba, Meguro-ku, Tokyo 153-8505, Japan
*
Author to whom correspondence should be addressed.
Energies 2017, 10(6), 798; https://doi.org/10.3390/en10060798
Submission received: 27 April 2017
/
Revised: 31 May 2017
/
Accepted: 8 June 2017
/
Published: 13 June 2017
(This article belongs to the Special Issue Engineering Fluid Dynamics)
Abstract
:The purpose of this study is to determine the effects of evaporation and condensation on the underfloor space of Japanese detached houses. In this underfloor space, natural ventilation is applied. A typical Japanese wooden detached house is raised 0.3–0.5 m over an underfloor space made of concrete. The bottom of the underfloor space is usually paved with concrete, and the ceiling which is directly underneath the indoor occupant zone is made of wood. Computational fluid dynamics (CFD) analysis is applied to calculate the rates of the evaporation and condensation generated inside the underfloor under two conditions, namely, a constant (fixed) outdoor environmental condition and a fluctuating environmental condition. In the constant condition, we verified the effects of the outdoor humidity, ventilation rate, and ratio of wetted surface (RWS, ω) on the evaporation and condensation inside the underfloor space. In this condition, the rate of evaporation and condensation was quantified considering the varying outdoor humidity between 0 to 100%, and the RWS (ω = 1 or 0). In addition, the influence of the different ventilation rates at 1.0 m/s for normal and 0.05 m/s for stagnant wind velocities were confirmed. Under fluctuating environmental conditions, the outdoor conditions change for 24 h, so the RWS varies. Therefore, the rate of evaporation and condensation, the amount of the condensed water, and the area of condensation were confirmed. The results were as follows: with a high airflow rate on the underfloor space, the evaporation and condensation phenomenon occurs continuously and is easily affected by outdoor humidity, while under low airflow rate conditions, only the condensation appeared steadily. If the wind velocity is strong, the convective mass transfer on a surface becomes large. In a condition of the outdoor humidity and the airflow rate on underfloor are high, condensation mainly occurs in a corner of the underfloor space due to high evaporation by convection in the mainstream of the airflow. By contrast, when the airflow rate is low, condensation occurs along the air stream. Accordingly, this information could be employed as design considerations for the underfloor space at the architectural design stage.
1. Introduction
The aim of ventilation of the underfloor space is to prevent moisture generated in the ground from entering the living area and to improve the heating and cooling efficiency of the building, given the large heat capacity of the ground. Moisture is the main problem in wooden buildings, as it causes rotting of the wood and an unpleasant smell inside the building. Even so, the underfloor space is generally ignored by the residents, as it is not only inconspicuous, but also difficult to clean. Generally, moisture originates from the ground (soil), which absorbs water after rain, or from groundwater, and enters the building through the ventilation openings. It is important to block the source of the moisture in order to control the humidity level and to prevent the generation of condensation inside the underfloor space. Therefore, it is crucial not only to prevent ground moisture from entering, but also to eliminate any moisture forming inside from rainwater or high humidity. Since these phenomena influence the health of the occupants and the durability of the buildings, methods, such as paving of the ground or mechanical ventilation are applied occasionally. However, it is useful to predict the climate of the underfloor space in the attempt to control the humidity and to apply an appropriate method during construction, as installing such alternative methods could be costly.
In previous research, the relative humidity, temperature, and pressure inside the underfloor space were measured, the ground moisture evaporation rate was calculated, and subsequently the effects of natural and mechanical ventilation were confirmed [1]. The results showed that the average value of moisture evaporation with unpaved ground was 3.6 g h−1 m−2 in a naturally ventilated condition and 5.7 g h−1 m−2 in a mechanically ventilated condition. Research also indicated that the optimum air change rate on the underfloor space was 1–3 air change rate per hour (ACH) throughout the year [2]. Experiments have also been conducted with benzene in the underfloor space to identify the potential health risks associated with toxic soil vapors penetrating into the living spaces [3,4]. These studies employed point measurements. However, the internal humidity was excluded as a factor in the research. Several studies have attempted to confirm the presence of internal humidity by employing computational fluid dynamics (CFD) to determine the distribution of such internal humidity. However, no research has been conducted on the internal condensation of the underfloor space. In the current study, we attempt to determine the effects of internal condensation and evaporation and the probable area where condensation would occur relevant to the natural ventilation. Research on such aspects has not been conducted before.
A Japanese detached house can be simply illustrated as in Figure 1. The height of the underfloor space is 0.3–0.5 m from ground level. As openings are dispersed around the underfloor space for natural ventilation, outdoor moist air flows into the underfloor space, which gives rise to condensation and evaporation. The bottom of the underfloor space is usually paved with concrete and the ceiling, which is directly underneath the indoor occupant zone, is made of wood.
There are two main causes of condensation on the underfloor environment, namely, moisture deriving from the outside environment that condenses on the cold surface of the underfloor, and re-condensation that occurs when the condensed water inside the underfloor space evaporates. Once the condensation has been evaporated by ventilation, it becomes another moisture generation source inside the underfloor, raising the indoor humidity and significantly reducing the evaporation effect. The airflow and temperature distribution of the internal environment cause condensation and evaporation locally. Consequently, simple point measurements of the humidity cannot adequately explain the general condensation phenomena on the underfloor space or predict the probable occurrence of condensation. Furthermore, as the inside of the underfloor has a complicated shape, it is important to understand which parts would be vulnerable to condensation and to give due consideration to these vulnerable regions in the design of the house. Generally, in Japan, a detached house is a wooden building and it has an underfloor space, where its bottom touches the ground surface, which is usually paved with concrete to block water seepage from the ground. Natural ventilation is usually employed through underfloor air vents, shown in Figure 2, and mechanical ventilation is generally not introduced.
As many previous studies have conducted research on the conditions of unpaved ground and natural ventilation, we attempted to confirm the internal condensation and evaporation effects on the underfloor space under conditions of paved ground and natural ventilation. It is difficult to determine the distribution of internal humidity by employing experimental methods; therefore, we chose CFD analysis to determine the climate inside the underfloor space. Additionally, the aim of the study is to understand the degree of evaporation and condensation arising because of underfloor ventilation and the distribution of the internal humidity, as well as to identify the area at risk of condensation.
Generally, In CFD, turbulent flows can be predicted through three approaches: direct numerical simulation (DNS), large-eddy simulation (LES), and Reynolds-averaged Navier-Stokes (RANS) equation simulated with turbulence models [5]. DNS gives highly reliable results directly solving Navier-Stokes equations but the required calculation time will be very long. The LES approach is an intermediate modeling technique between DNS and RANS. Turbulent motion can be divided into large eddies and small eddies, where LES is a method that solves the Navier-Stokes equations with filtered large-scale eddies of the turbulent flow except for small-scale eddies. LES can give us more detailed information on turbulence than RANS. However, it still requires a considerable calculation cost. Using RANS, turbulence motion can be quickly predicted and it is the most practical approach.
Computational fluid dynamics (CFD) is also the most effective way to predict the airflow in a building. Predicting airflow patterns in an indoor room by using a CFD analysis was first applied by Nielsen [6]. For the indoor environment prediction, the RANS k–ε turbulence model was used for many years and shows the acceptable results according to many researchers. [7,8,9,10]. The standard k–ε turbulence model showed reasonable results to predict the airflows in indoor environment [11]. Moreover, realizable k–ε models usually provide much improved results for swirling flows and flows involving separation compared to the standard k–ε model [5,12,13].
1.1. Weather Data in Tokyo, Japan
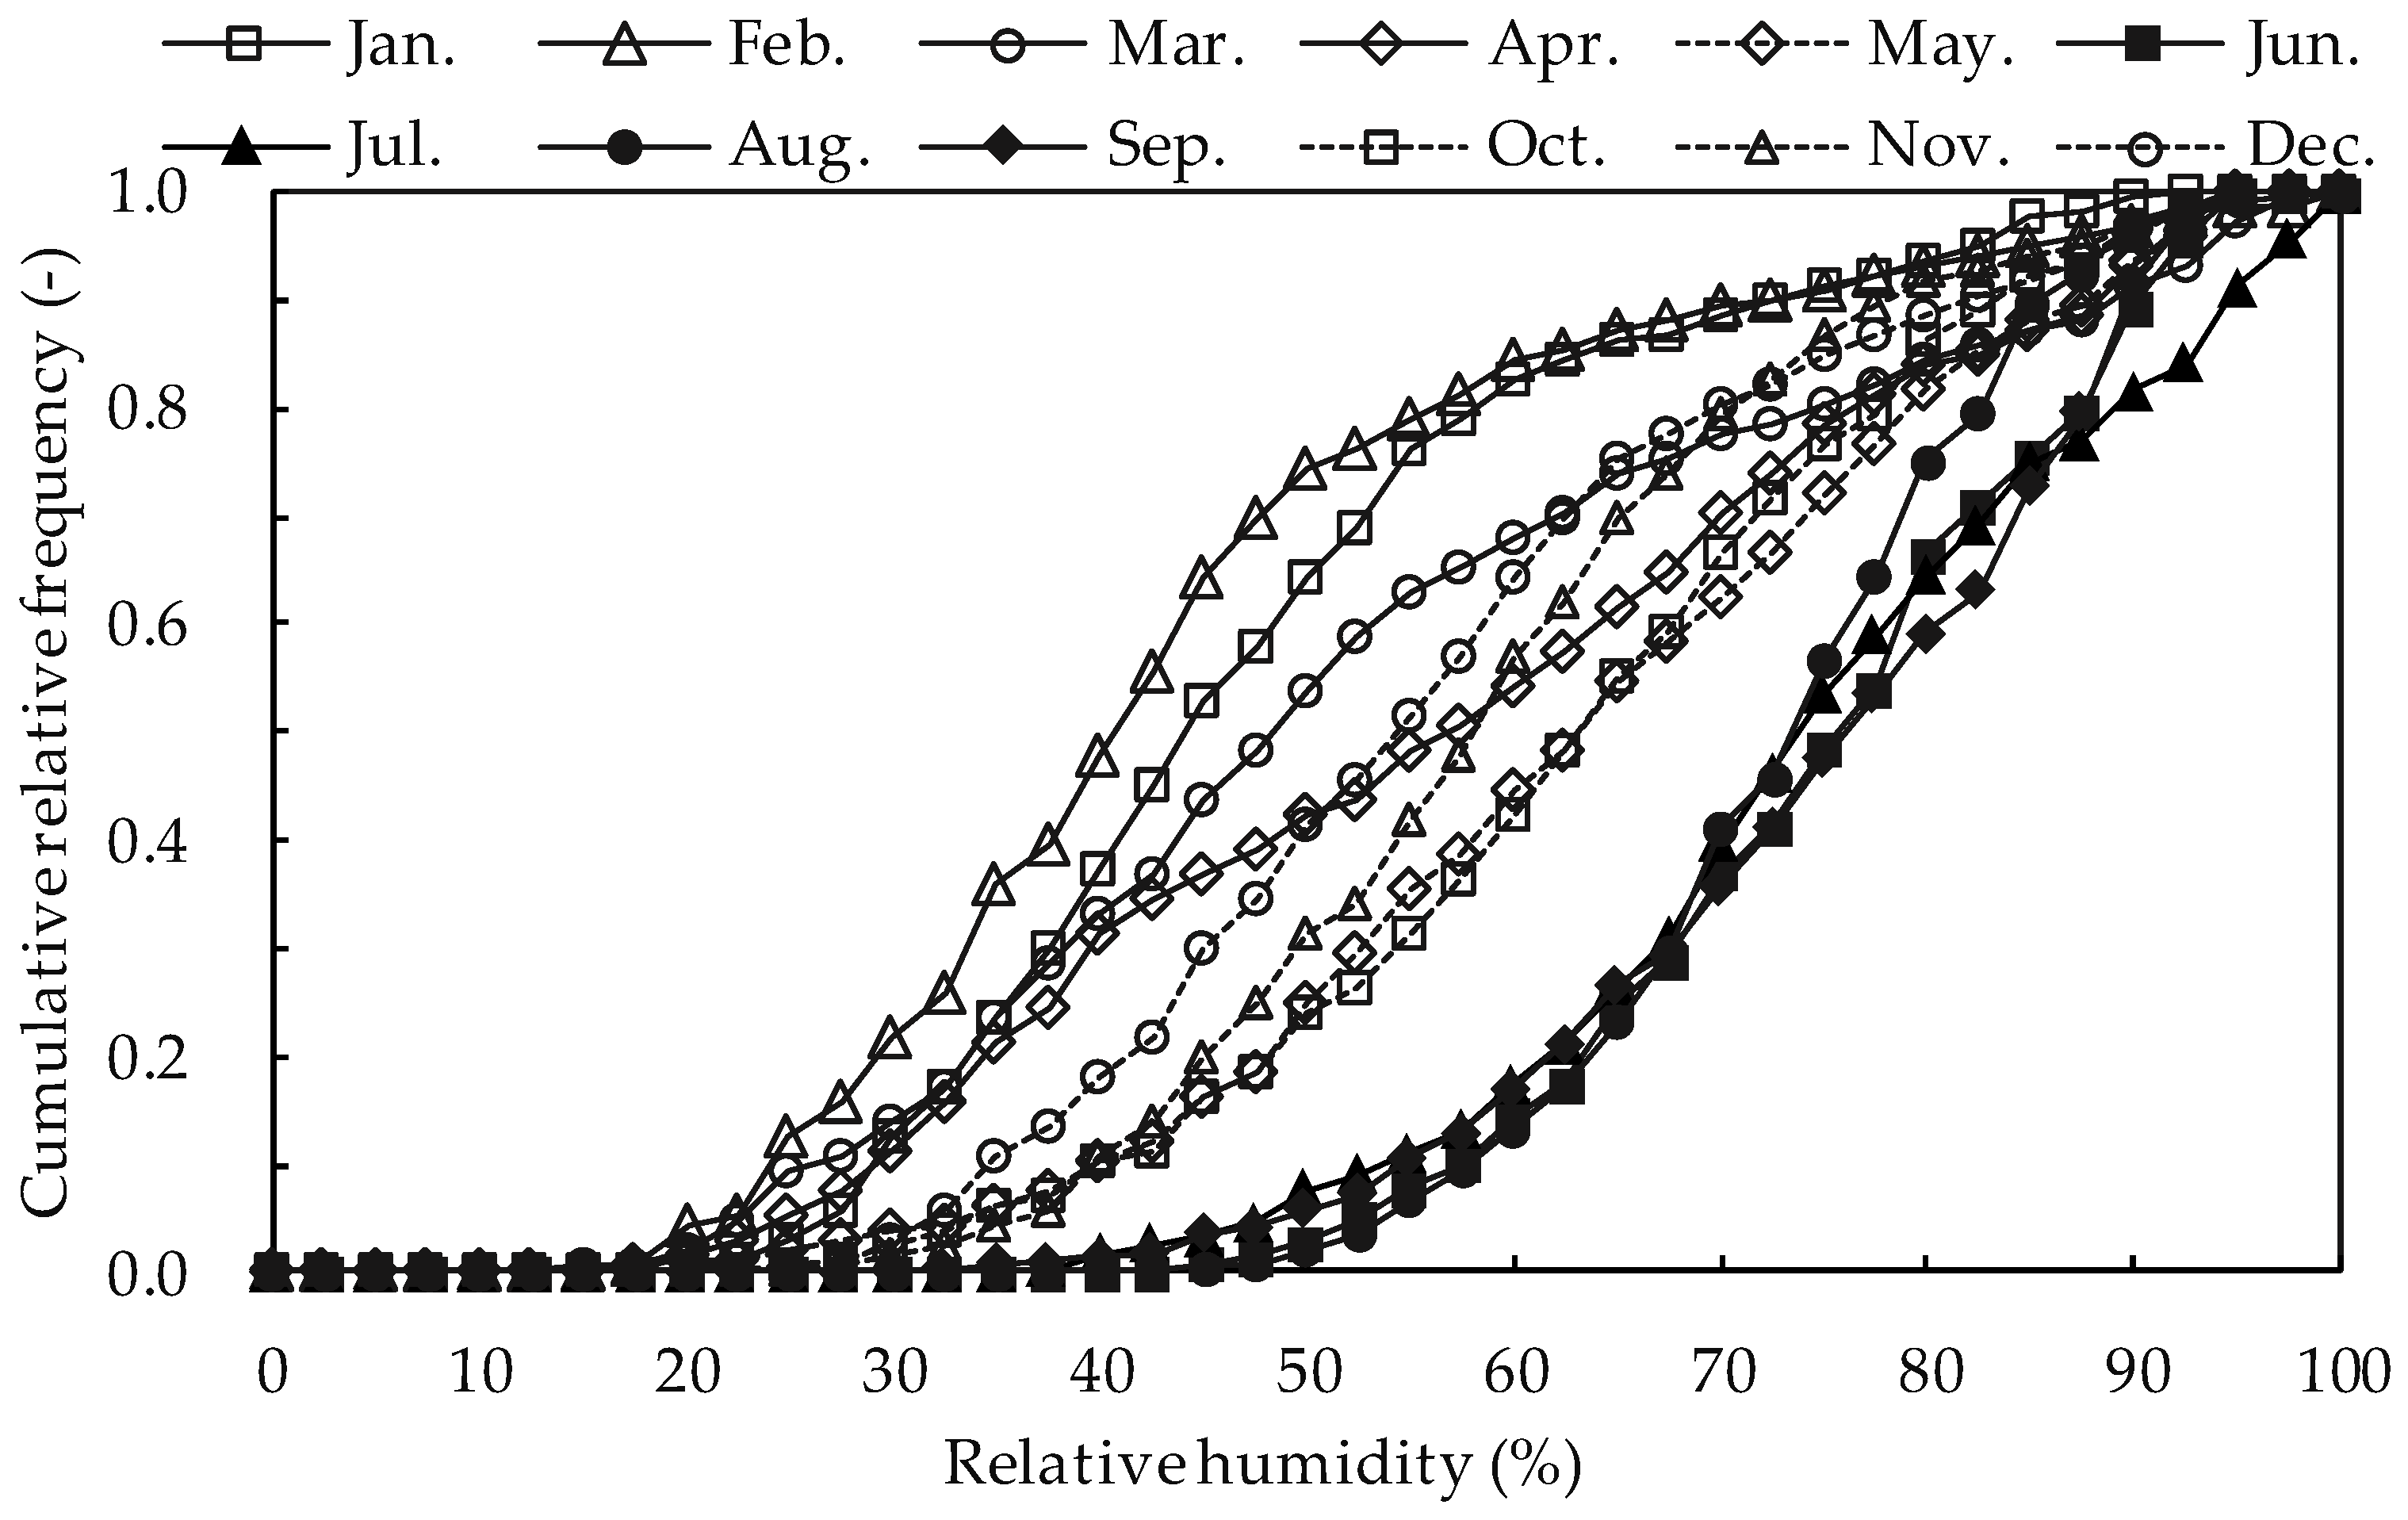
The extended Automated Meteorological Data Acquisition System (AMeDAS, 1981–2000) was used as standard-year weather data to estimate the underfloor climate. Tokyo city in Japan was selected as the representative location for our simulation. The detailed weather conditions are described in Figure 3 and Figure 4. Figure 3 shows the correlation of the cumulative relative humidity per month in Tokyo. The wettest months of the year are June to September and a high-humidity climate prevails for more than half of this period, with the relative humidity being more than 75%.
To consider the worst probable weather situation, the data for 10–17 June were employed in our study, as these days represent the high humidity season in Tokyo. During the rainy season, although the external humidity increases significantly, the temperature of the internal environment remains lower than that of the external environment. This is because the influence of solar radiation is insignificant as the sky is always overcast. Therefore, the risk of internal condensation during this period is expected to increase significantly.
1.2. Research Procedure
In the design of the underfloor space, it is important to consider the interior environmental characteristics and the likely location and time of condensation occurring. However, since the internal airflow is complicated, it is difficult to predict the areas where condensation could occur. Therefore, we employed CFD analyses to determine and confirm the effects of evaporation and condensation relevant to natural ventilation. The underfloor space has dispersed ventilation openings for natural ventilation, with the pattern of the airflow being complex, as this area is divided into several zones by internal partition walls. Evaporation and condensation phenomena arise because of the difference of the partial pressure of water vapor caused by the difference between the surface temperature and the adjacent air temperature right near the surface. It is difficult to confirm this phenomenon inside the whole underfloor space through experiments. This study was conducted relevant to two different circumstances, namely, a constant outdoor environmental condition for 1 h and a fluctuating outdoor environmental condition for 24 h. The rate of evaporation and condensation generated inside the underfloor space was calculated and confirmed relevant to the first condition to determine the influence of outdoor environmental factors. The influence of natural ventilation was determined by quantifying the rate of evaporation and condensation with the internal surface being completely wet (ω = 1) and completely dry (ω = 0), and with the outdoor humidity increasing at a range of 0 to 100%, with a 10–20% interval. Under this condition, the influence of different ventilation rates was also confirmed by verification at a general wind speed condition of 1.0 m/s and a stagnant wind condition at 0.05 m/s. In a fluctuating condition, the ambient air temperature near the internal surface temperature also fluctuated continuously, and evaporation and condensation easily occurred because of the temperature difference. Accordingly, based on these fluctuating conditions, the rate of evaporation and condensation over time and the accumulated volume of condensed water on the surface were determined. The information obtained from our research could be utilized at the architectural design stage to pinpoint the spots vulnerable to and the conditions conducive to the generation of condensation inside the underfloor space.
2. Natural Ventilation on Underfloor Space
Since the geometry of the underfloor space is complex and it has many vents all around, it is difficult to predict the internal airflow patterns. Generally, as the wind blows from the south during a summer season in Japan, it is considered only two conditions of wind speed. During a calculation, the variation of wind direction and wind speed were disregarded in this study. The ventilation rate from inside and outside pressure difference at each opening was calculated.
2.1. Outline of CFD Analysis
The underfloor ventilation rate was calculated by realizable k–ε model with the semi-implicit method for pressure-linked equation (SIMPLE) algorithm and the second-order upwind-convection differencing scheme. The performance of realizable k–ε turbulence model is superior to that of other k–ε turbulence models [13]. Transport equations of airflow are solved for turbulence kinetic energy k (m2/s2) and its dissipation ε (m2/s3). The turbulent eddy viscosity is calculated as follows:
Transport equation of k and ε is expressed as:
and:
where is the generation of turbulence kinetic energy due to the mean velocity gradients, is the generation of turbulence kinetic energy due to buoyancy effect, is the contribution of the fluctuating dilatation in compressible turbulence to the overall dissipation rate, , are the turbulent Prandtl numbers for k and and , are source terms. The model constants are , , , and . The standard wall functions were applied to calculate the airflow near the wall.
2.2. Simulated Model
The simulation model was selected based on the Institute for Building Environment and Energy Conservation (IBEC) standard model which guides design and evaluation of a typical Japanese house [14]. At the bottom of the building is the underfloor space, which has air vents all around to supply natural ventilation.
The control volume for the calculation was selected properly, i.e., larger than the building model, as shown in Figure 5. Because the wind direction and speed were considered only for the constant southern wind, the south side was set as the inlet and the north side as the outflow (zero gradient condition).
The inlet wind from the south was created from the power law model to the mean velocity profile in Equation (4):
where U0 represents wind speed, and Uz is the wind speed at a height of z. The specified velocity U0 takes into account two conditions, namely, a typical 1 m/s condition and a stagnant wind speed of 0.05 m/s, and the reference height h was assumed 1 m. The power law exponent was determined as 0.25 [15]. The logarithm-raw was applied on a surface of the building and the floor as a boundary condition. The side boundary (east, west) and upper boundary conditions were chosen as symmetry conditions (shear slip zero). The calculation was conducted by realizable k–ε turbulence model using a fine grid with 38 million hexahedral cells. Predicting airflow and dispersion around a building, numerical calculation by realizable k–ε turbulence models showed good agreement with the wind tunnel experiment than standard k–ε turbulence model [16]. Plan IJKL is a cross section of the left part of the opening on the southern wall of the building. Plan MNOP refers to the area 0.35 m above ground level.
2.3. Anslysis Results
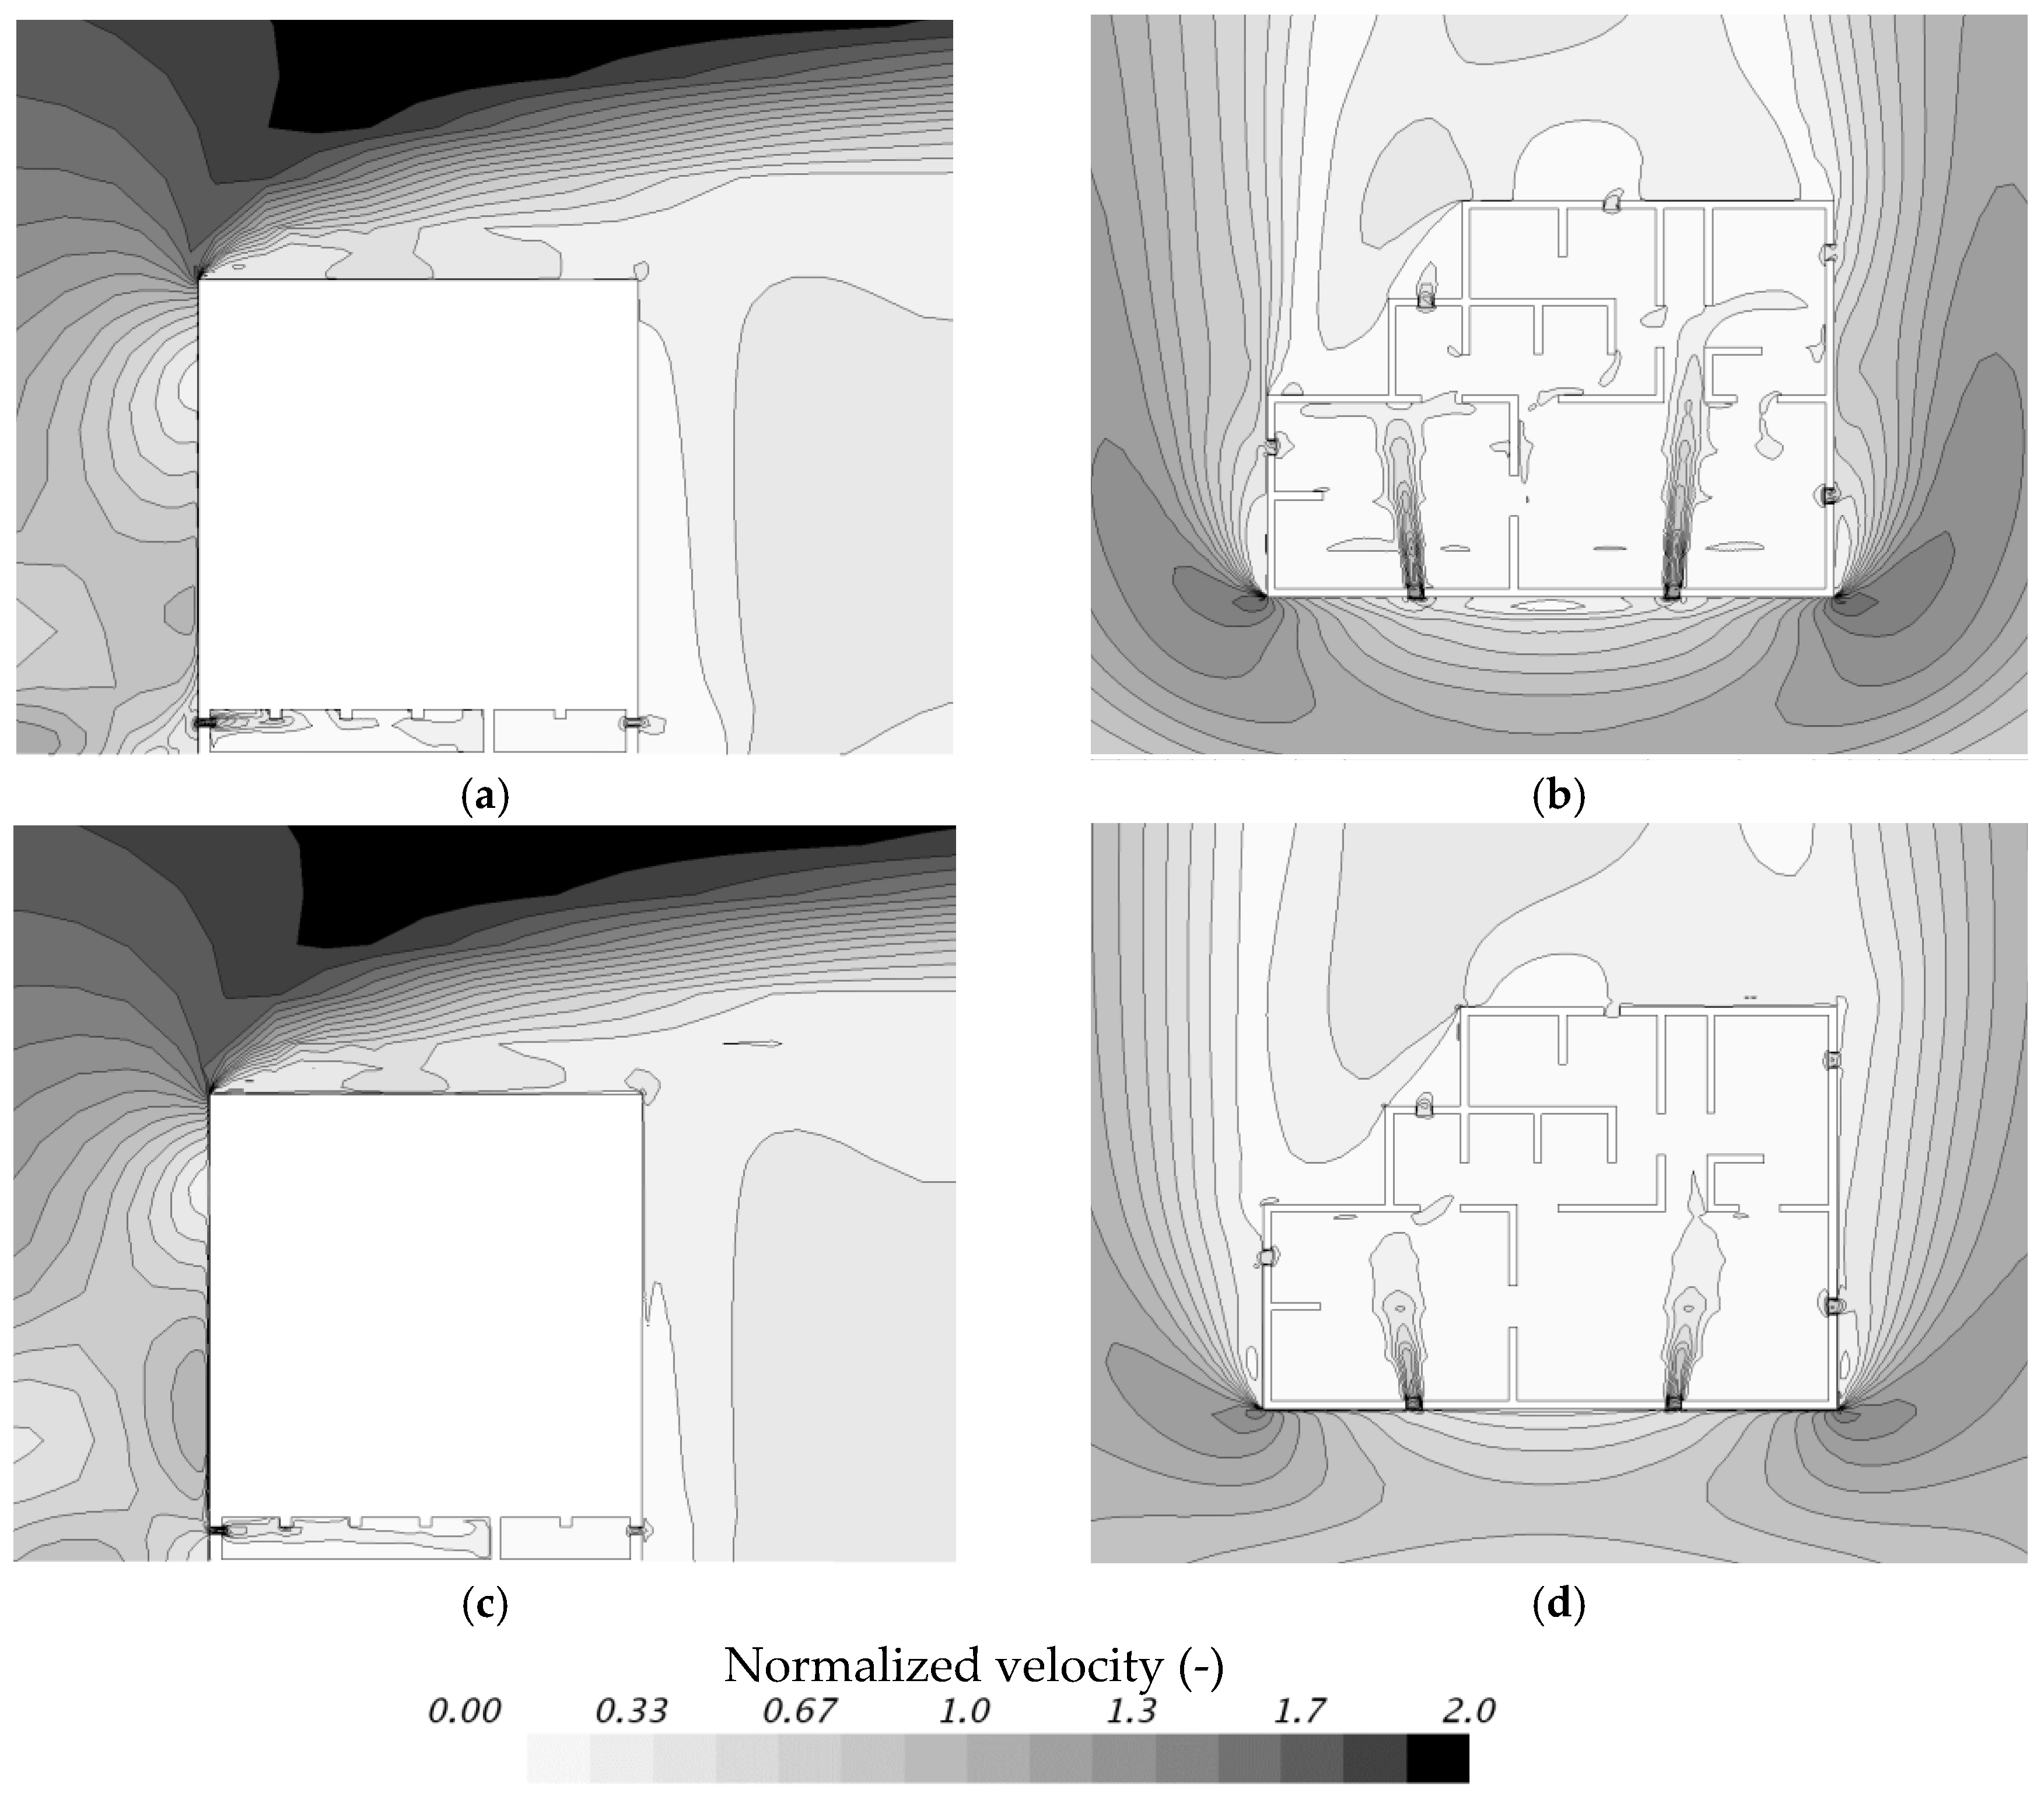
The results for the two wind speed conditions, namely, 1.0 m/s and 0.05 m/s, are as follows: the wind direction is from the south, with the wind flowing into the underfloor space through two openings in the wall on the southern side, from where it is dispersed into each internal zone and exhausted through the other five openings.
The normalized velocity distribution around the building and inside the underfloor is shown in Figure 6. The airflow rate was calculated by the wind speed of the outdoor and the internal pressure difference of each opening, with the result shown in Table 1. In addition, this result was used as a boundary condition to calculate where the moist air from outside would be drawn into the internal underfloor space.
3. Evaporation and Condensation Effects on the Underfloor Space
3.1. Outline of Evaporation and Condensation Estimation Method
By modeling the water thickness calculation, the evaporation and condensation phenomena on the surface of the wall could be estimated. This involves the estimation of an additional scalar transport equation for the mass fraction of the water vapor. A source–sink term is considered for the scalar of the condensation and evaporation of the water layer, as well as the latent heat required for the transition. In the instance of a difference between the water vapor content of the water layer on the surface and the cell next to this surface, the model would calculate a rate of evaporation or condensation, depending on the conditions. This model assumes the following [17], namely, the vapor content in the air does not affect the thermal properties of the vapor–air mixture, and the water vapor mass is ignored with respect to the total mass in a cell.
The rate of mass transfer per unit surface, in kg s−1 m−2, is given by:
where is the density (kg m−3)
- is the empirical constant 0.9 (-)
- L is a characteristic length (cubic root of cell volume next to fog layer boundary) (m)
- is diffusion of vapor in air (m2/s)
- Re is the Reynolds number (-)
- Sc is the Schmidt number (-)
- Cg is the actual concentration of vapor in air
- Cs is the saturation concentration of vapor in air
For a given temperature, the saturation pressure is calculated from the following expression:
The change rate of the water thickness over time can be confirmed from the simulation. In addition, the mass change rate can be obtained from the calculated area of each cell, the water-thickness change rate, and water density. A decrease of the mass change rate indicates that the evaporation phenomenon has occurred and an increase means the condensation phenomenon has occurred. Finally, by determining the mass change rate, the rate of evaporation and condensation of the underfloor space can be calculated.
3.2. Simulated Model
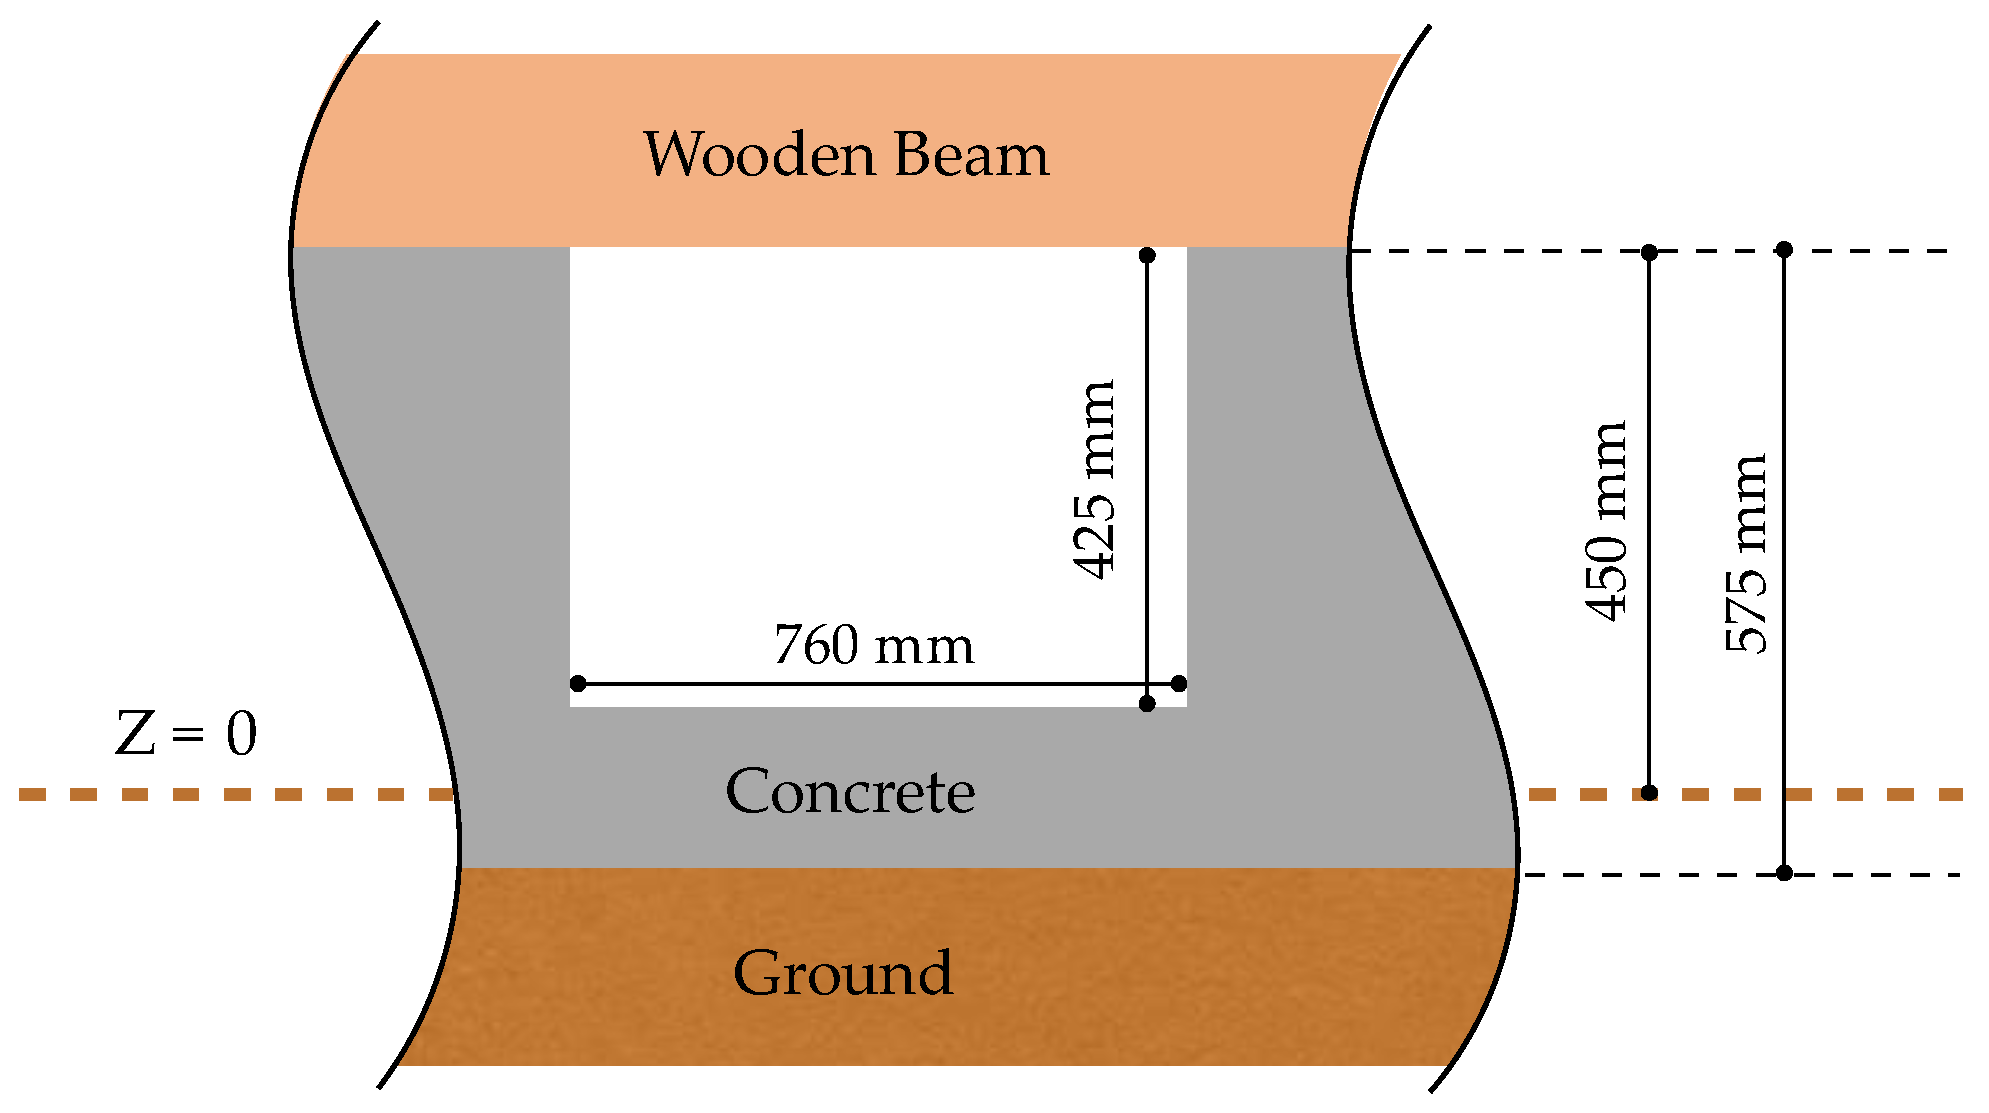
The simulation model was selected based on the IBEC standard, which includes design standards for a Japanese detached house [14]. A two-story residential building is considered in this research, with seven openings on the underfloor space, as shown in Figure 7, which depicts the inside of the underfloor space. The walls and floor are made of concrete, with a basic thickness of 150 mm. The floor of the room corresponding to the ceiling of the underfloor space is made of a wood, supported by a wooden beam section of 105 mm × 105 mm, which is expressed as a dotted line. Figure 8 indicates the air movement passage inside the underfloor space and Figure 9 indicates the ventilation passage exposed to the outside, which is described in Figure 2.
The temperature of underfloor space is low even in the summer season, as it is mostly influenced by the ground temperature, which is not affected by solar radiation and does not have significant temperature changes. Our understanding is that the concrete surface on underfloor space of typical house is maintained low temperature, 20–22 °C during rainy season in Japan. The characteristics of the material should be considered because the surface temperature of the material is time dependent. The material properties for the calculations refer to the American Society of Heating, Refrigerating, and Air-Conditioning Engineers (ASHRAE) data in Table 2.
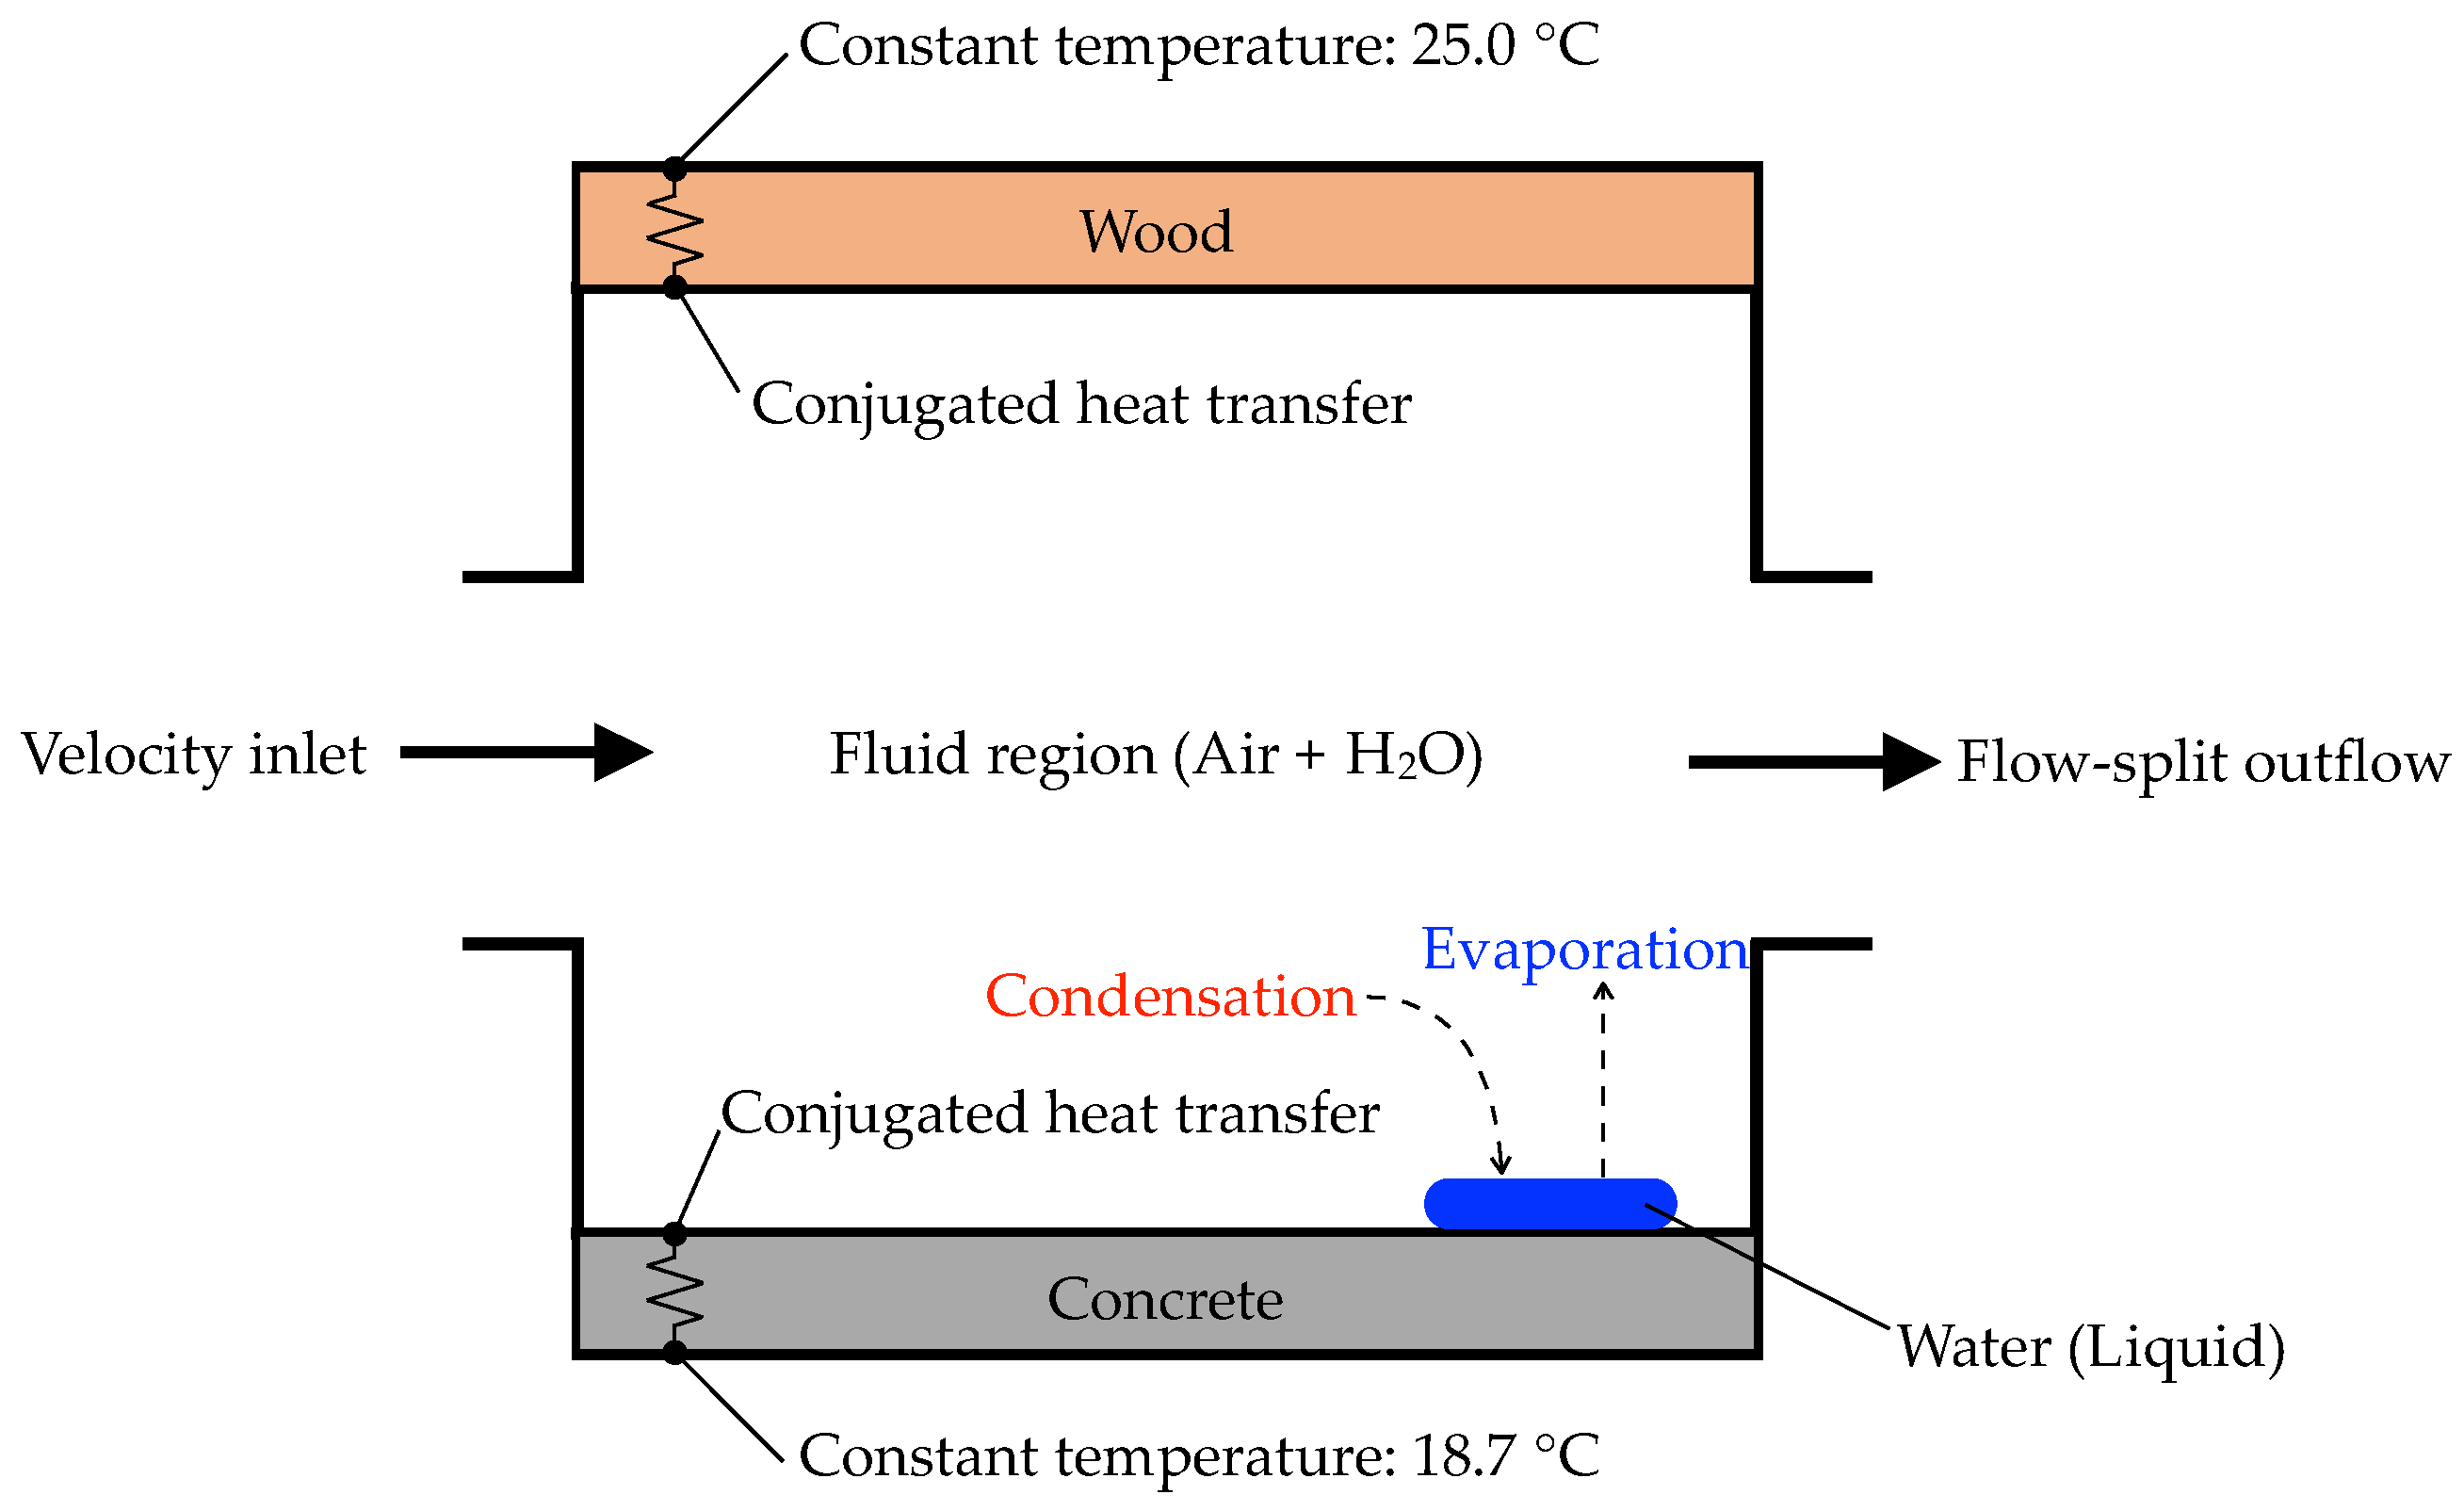
The opposite side of the ceiling on underfloor space which represents the floor of the dwelling zone is assumed to remain constant at a temperature of 25 °C, as is the indoor environment. According to the weather data, the temperature of 1 m underground had almost no change in daytime. Therefore, it is assumed that the temperature of the concrete surface contacted with the ground is constant at 18.7 °C during the rainy season. As shown in Figure 10, the room temperature and the ground temperature is constant and the thermal conduction acts purely one-dimensional by the material characteristics of Table 2. The moist air from the outside was set to cause the evaporation and condensation phenomenon on the inner surface of underfloor space. Although some studies have considered the risk of annual condensation considering the absorption-desorption properties of the building materials [18], in this study, only the short-term evaporative condensation due to internal and external environmental conditions was focused on, so that the moisture transfer inside the materials was not considered.
The pressure-velocity coupling for the airflow solution was conducted with the SIMPLE algorithm [19]. The convection and diffusion terms were integrated, using the QUICK difference scheme [20]. The boundary and calculation conditions are shown in Table 3. The parameters of the outdoor environment, which include wind speed (VS), air temperature (TS), and humidity (WS) were applied in openings, the inlet boundary condition. The initial condition of the internal space was set equal to the temperature of the input initial condition. Wind speed conditions of 1.0 m/s and 0.05 m/s were considered, based on the ventilation rates calculated in the previous section. The condition of the inner wall was set to adiabatic and the emissivity was assumed as 0.95.
The emissivity of inside wall is supposed to be 0.95 and the simulation modeling of underfloor space is illustrated in Figure 11, which is composed of 48,000 hexahedral cells and covered with five prism layers. The value of y+ is lower than 1 on all over the surface of wall. All meshes were calculated by the realized k–ε turbulence model which performs better [13], and enhanced wall treatment, that is to say, two layer all y+ wall treatment which is a hybrid approach that seeks to recover the behaviors of the other two wall treatments in the limit of fine or coarse meshes. When the mesh resolution increases, the result showed better accuracy, while the calculation time has become longer. On the other hand, the results were shown quite similar in case of fine and coarse meshed model [21,22].
3.3. Wetted Area Ratio
When there is a source of moisture generation inside, the partial pressure of the water vapor in the air is shown to differ, which affects the evaporation and condensation phenomena. Therefore, it is necessary to consider the wetted area ratio on the inner surface:
When water is present partially on the surface, the distribution of the internal partial pressure of water vapor differs, depending on its position due to the evaporation. Therefore, even if the ratio of wetted surface is the same, different aspects of evaporation and condensation phenomena are expected to be seen depending on the location of the wet area. However, as it is difficult to generalize the effect of condensation according to the position of the wet area, therefore, only the conditions where the RWS is 1 (all surfaces are completely wet) and the RWS is 0 (all surfaces are completely dry) were considered. Furthermore, a sufficient amount of water was taken into account, so that the ratio of the RWS would not change during the simulation (water thickness = 0.01 m).
If the evaporation phenomenon occurred on all the surfaces under the condition ω = 1, the maximum evaporation effect from underfloor ventilation could be assumed confirmed. If condensation occurred on all the surfaces in the condition ω = 0, the maximum condensation effect from underfloor ventilation could be assumed confirmed. The wind speed was calculated based on the rate of ventilation at 1.0 m/s and 0.05 m/s. The temperature was set at 25 °C, considering the average temperature during the rainy season in June. In addition, the influence of relative humidity was confirmed by varying it within the range 0–100%, with 20% increasing intervals. A summary is presented in Table 4 of the detail conditions of each study case to confirm the evaporation and condensation effect on the internal underfloor space relevant to the outdoor environmental conditions. The effects of underfloor ventilation relevant to the outdoor environment were investigated by determining the overall average rate of evaporation and condensation inside the underfloor space after a time elapse of 1 h in each study condition. The mass change from evaporation and condensation was calculated for each cell of the surface through the above process.
3.4. Analysis Results
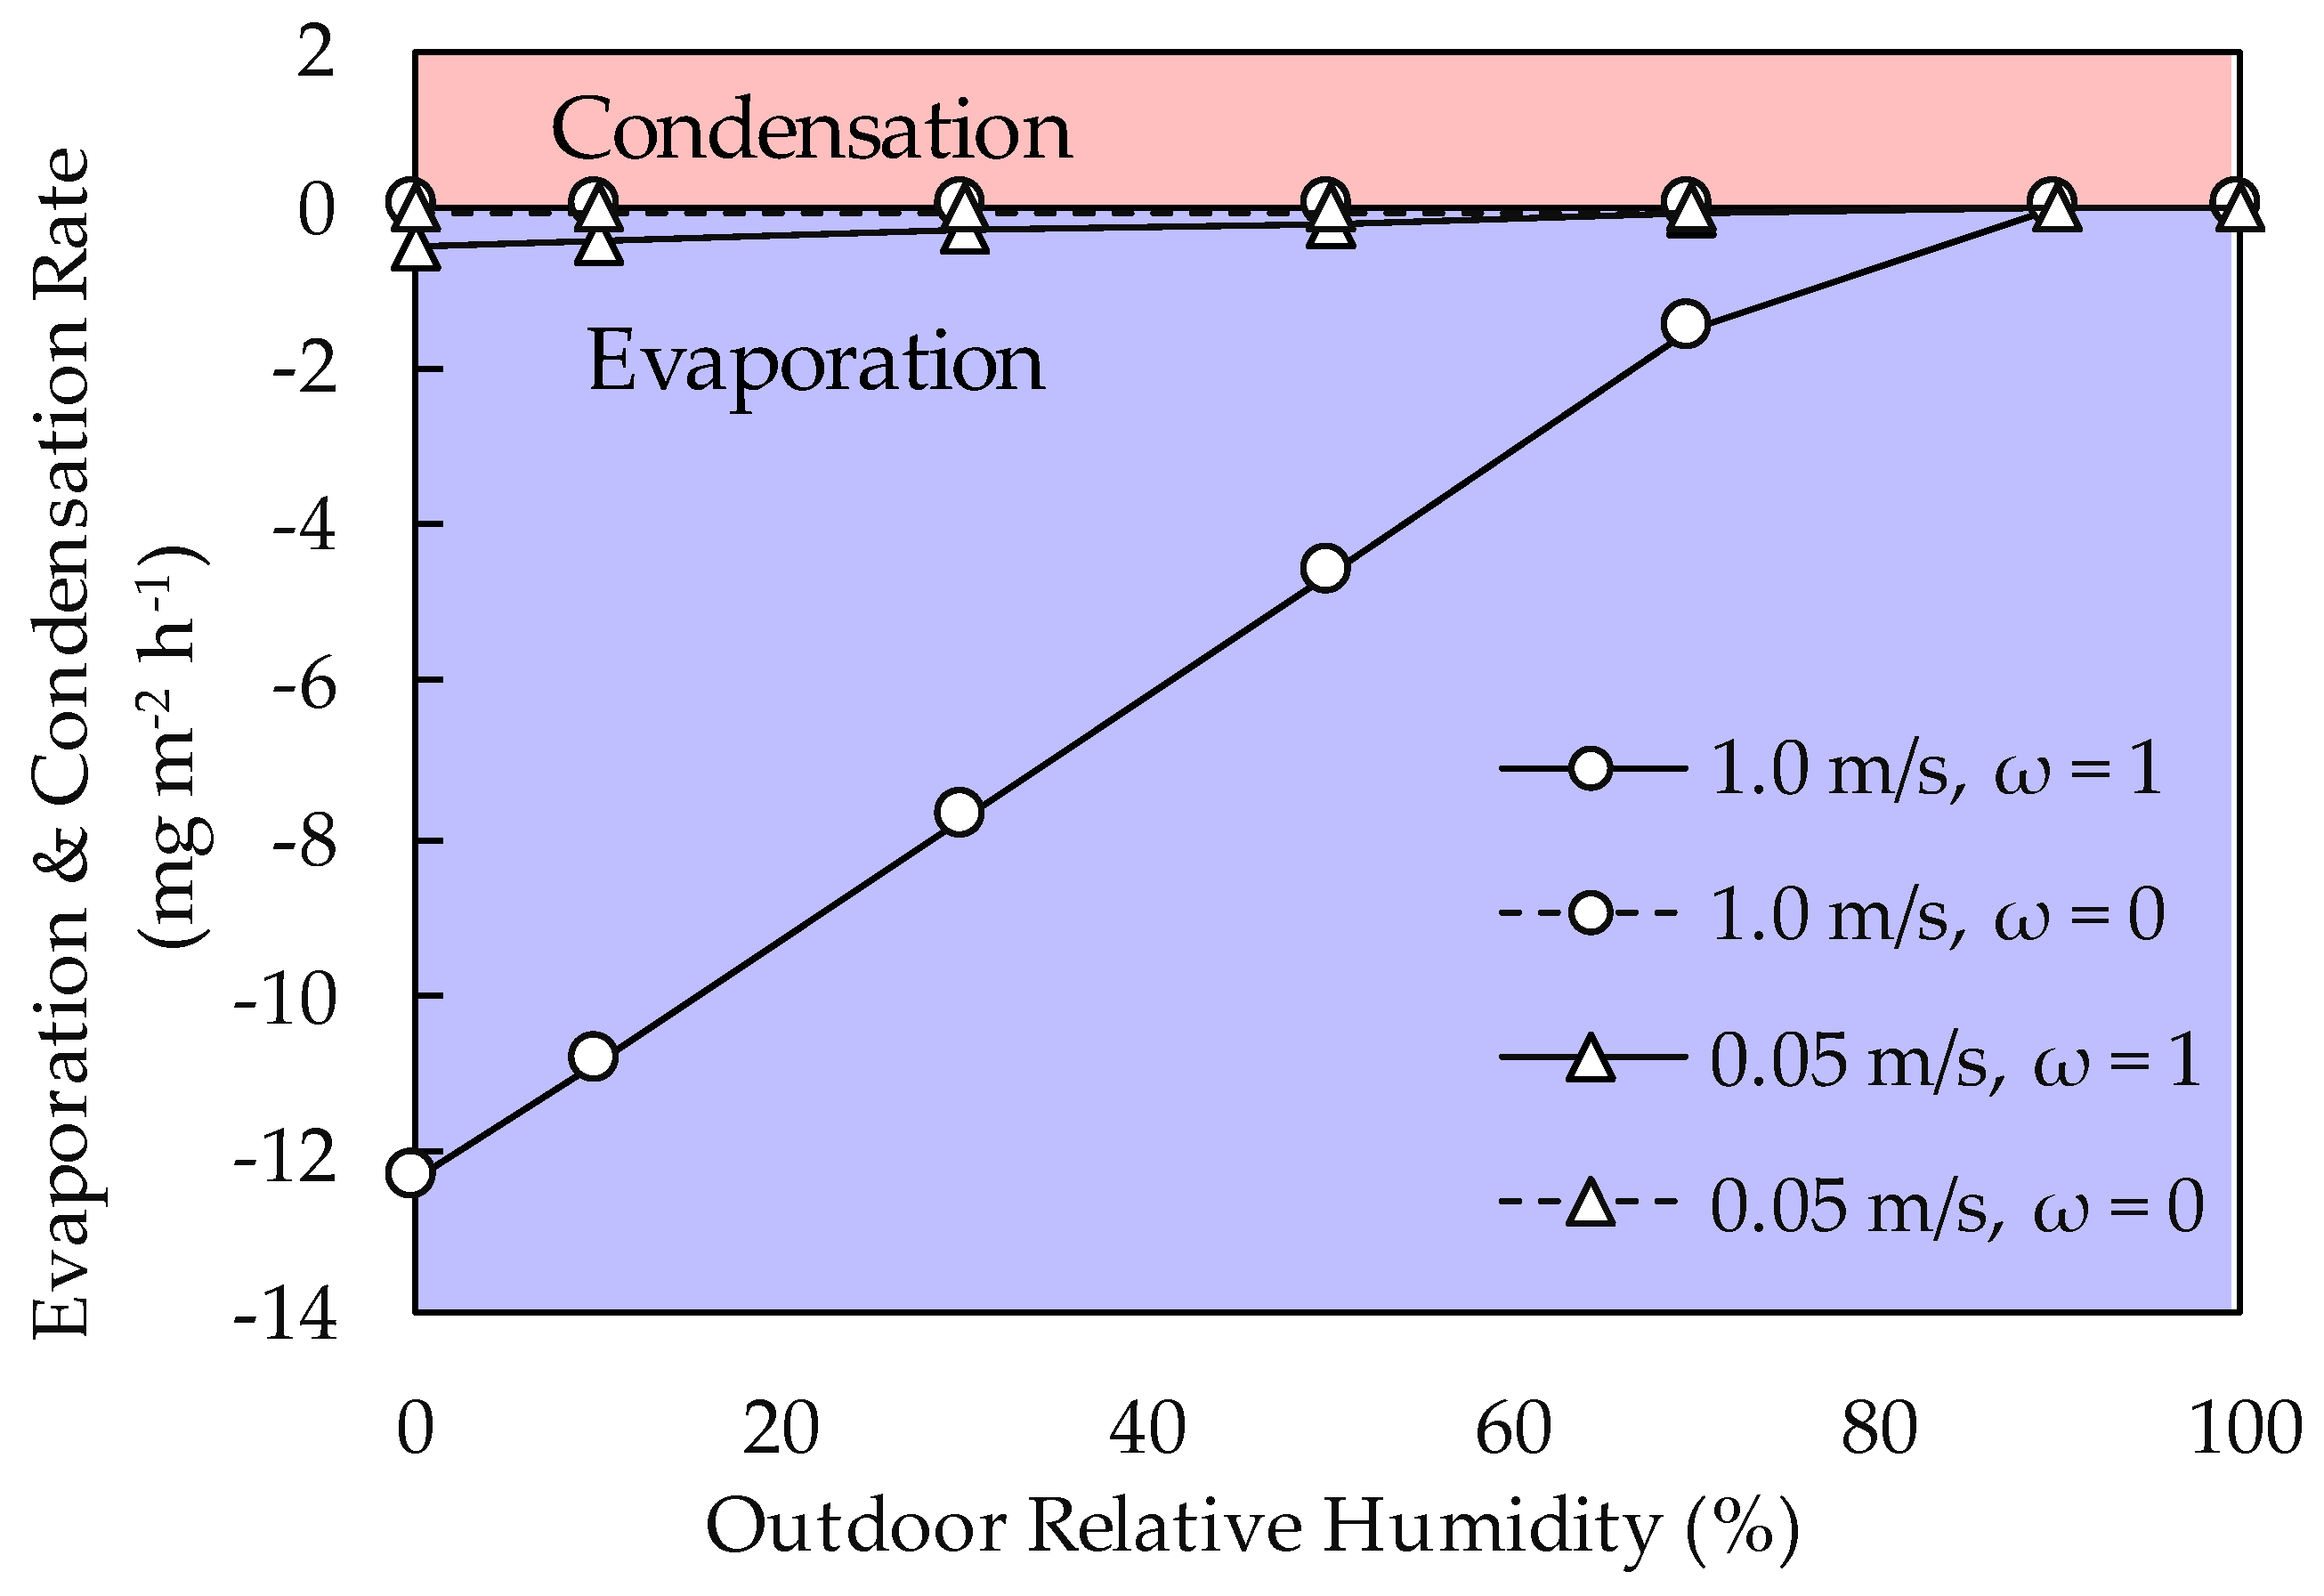
The results of evaporation and condensation on underfloor space when outdoor environment conditions remained constant for an hour can be identified from the thickness of the water. Accordingly, the results, depending on the differences in the outdoor environmental conditions (wind speed, humidity), were compared by calculating the change per unit time (mg m−2 h−1) through the analytical method, as shown in Figure 12.
Evaporation and Condensation Effect
The drier the air that flowed into the underfloor space and the larger the rate of ventilation, the faster the moisture evaporated from the surface to be exhausted to the outside, leading to the rate of evaporation increasing.
Under conditions of 1.0 m/s wind speed and 0% humidity, and when the entire surface was completely wet (ω = 1), evaporation occurred on all the surfaces, resulting in the largest evaporation rate of 12.3 mg m−2 h−1. Considering that the floor area covers 59 m2, the total evaporation rate of the internal underfloor space was 726 mg/h. When the outdoor humidity was 90%, the evaporation phenomenon reversed and condensation occurred, and, with humidity of 90–100%, the result was 0.4 × 10⁻³–0.5 × 10⁻³ mg m−2 h−1. The total internal condensation rate was indicated as 0.24–0.03 mg/h.
Under the condition of ω = 1, the outdoor wind speed decreased 1.0 m/s to 0.05 m/s, and the underfloor space shows a lower evaporation rate. This is because the exhausted volume of water that evaporated from the internal surface was smaller than the 1.0 m/s resulting from ventilation was. The higher the humidity the less the difference between the partial pressure of the water vapor on the water surface and the adjacent air would be, so that the occurrence of evaporation was reduced. Accordingly, with a 0–70% outdoor humidity condition, the evaporation effect was 0.5–0.05 mg m−2 h−1 per underfloor space on average. On the other hand, with a condition of 90% outdoor humidity, a state of equilibrium was reached, with no evaporation or condensation occurring. When outdoor humidity of 100% was introduced, the evaporation phenomenon reversed and 0.7 × 10⁻⁴ mg m−2 h−1 condensation occurred.
As there was no source of internal water generation when ω = 0, the evaporation phenomenon would not occur under humidity conditions of 0–70%. However, with 90–100% humidity, the moisture introduced from the outside air condensed on the cold surface of the concrete at a condensation rate of 0.03 g/h. The condensation phenomenon was slight, as indicated by the result of 0.4 × 10⁻² mg/h. Furthermore, under conditions of 90–100% humidity and ω = 0, the condensation was 0.7 × 10⁻⁴ mg m−2 h−1, which means all the internal surfaces were dry. As the temperature of the concrete was lower than was the air temperature of the internal underfloor space, the occurrence of condensation had higher significance when all the surfaces were dry (ω = 0) than when they were all wet (ω = 1). This is because the surface temperature of the dry concrete was lower than was the temperature of the water that formed on this surface; therefore, less condensation occurred. As regards the result shown in Table 5, (+) and (−) represent condensation and evaporation, respectively.
4. Daily Changes in Fluctuating Environmental Condition
In the second instance, we studied a fluctuation of outdoor environmental conditions over time, as the RWS status varied with the introduction of varying parameter values over time relevant to the outdoor environment. Accordingly, the effect of the ventilation rate of the underfloor space was confirmed by verifying the rate of evaporation and condensation, the amount of the condensed water, and the region where the condensation was likely to occur. Such information could be utilized in the architectural design of residences with underfloor spaces.
When the air conditions changed with time, the indoor conditions of evaporation and condensation fluctuated correspondingly. Furthermore, depending on the airflow, the surface temperature distribution, and moisture distribution, and the position where the condensation can occur would change, so as the RWS. When the condensed water evaporated, it acted as a generation source of water vapor, which affected the occurrence of the evaporation and condensation phenomena. Accordingly, our study confirmed variations over time in the rate of evaporation and condensation, the weight of condensed water, and the area where condensation would likely occur relevant to a rainy day during the rainy season, when the average humidity was high.
4.1. Weather Data
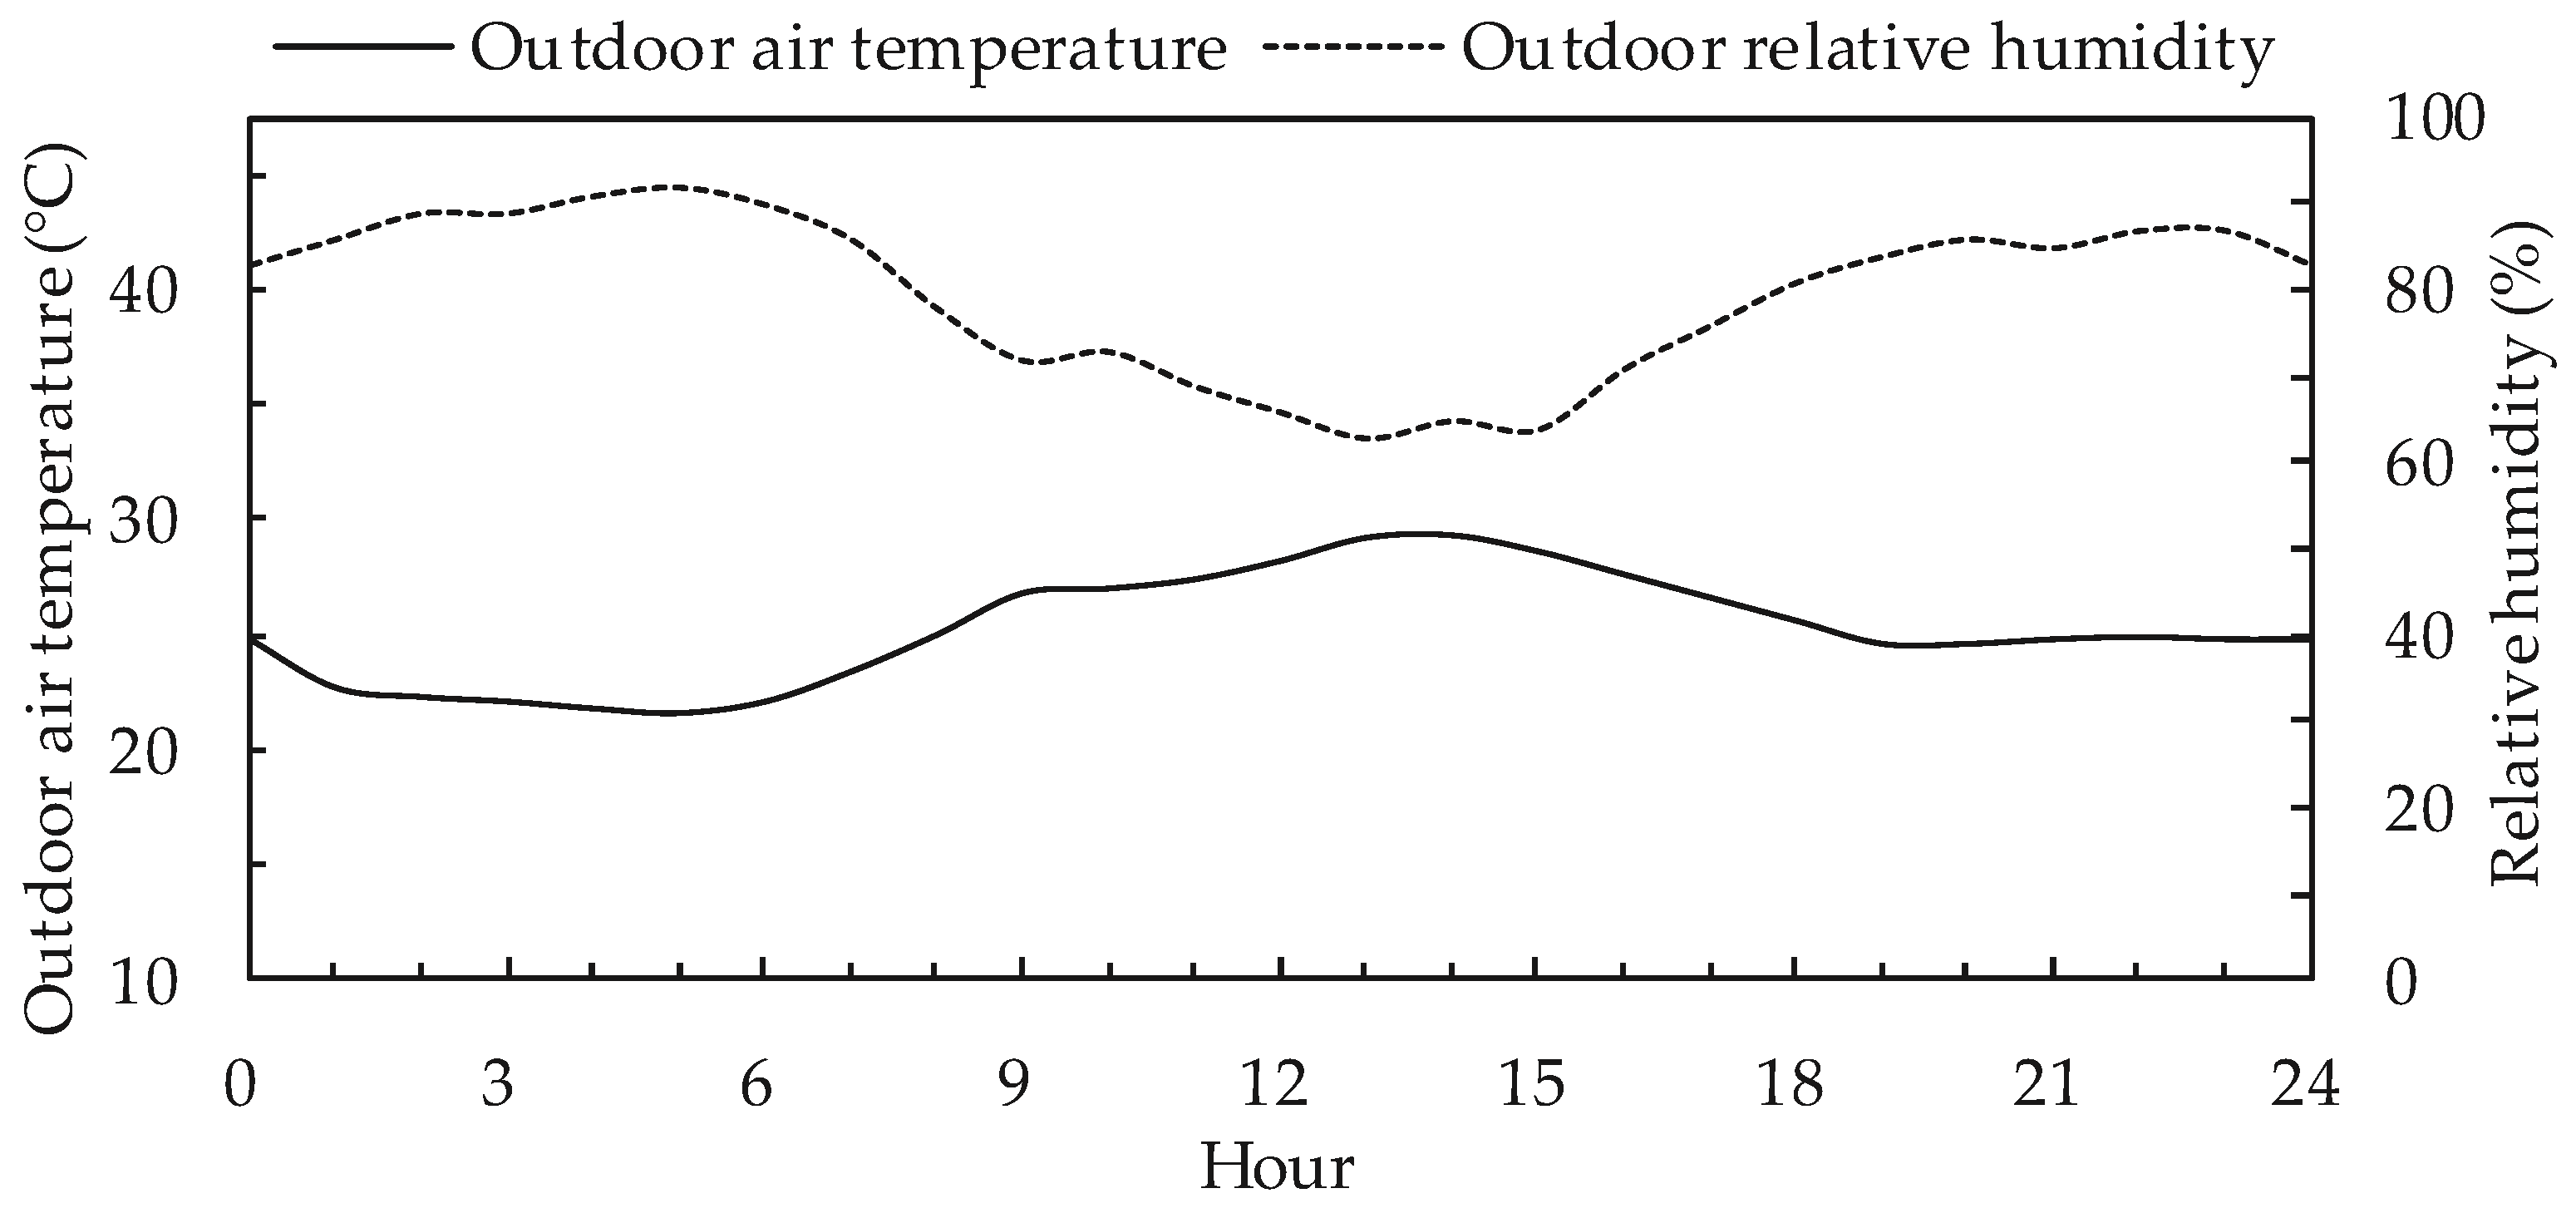
In this part of the study, we considered the outdoor environment during the rainy season, with the highest humidity levels and a high risk of condensation. Figure 13 shows the changes in daily temperature and relative humidity in Tokyo during the rainy season, and absolute humidity is expressed in Figure 14.
The average temperature measured was 25 °C, and the highest temperature was measured between 12:00 and 15:00. The relative humidity with the increasing temperature was approximately 65%. The average daily humidity was 74%.
Wind speed conditions of the outdoor air were assigned uniformly by using the calculated ventilation rate of the underfloor, as described in Table 1, assuming a general wind speed and a stagnant wind speed. However, this time, changes in wind direction and wind speed as time elapses were not considered.
4.2. Analysis Method
As shown in Figure 15, the average rate of evaporation and condensation, the amount of condensed water on the surface, and the change in the condensation area over 24 h were confirmed in our study. As changes in wind speed and direction were not taken into consideration, we utilized the values in Table 1, representing the results of ventilation rates at 1.0 m/s and 0.05 m/s of the southern wind. In this instance, unlike the uniform condition of the outdoor environment, RWS changed continuously according to the elapse of time. The simulation calculations were conducted for 24 h, with the method reflected in Table 3. The environmental conditions of the outdoor air complied with the temperature and humidity data of the rainy season in Tokyo, as represented in Figure 13. The initial RWS condition of the internal surface was set at 0, which means that all the surfaces were dry.
4.3. Analysis Results
The evaporation and condensation rates, the amount of the condensed water, and the area of condensation of the underfloor space were observed at hourly intervals over time to identify the effects of the ventilation rate of the underfloor space.
4.3.1. Evaporation and Condensation Effect
The distribution of temperature and pressure inside the underfloor was not uniform because of the influx of outdoor air introduced through the ventilation openings. The value of RWS changed continuously because of the condensation phenomenon. Furthermore, as evaporation and condensation occur differently, depending on the location, the rates of evaporation and condensation was confirmed through the average rate of the entire underfloor space.
When the amount of evaporation was greater than that of condensation, it is expressed as the total average condensation, but when the amount of condensation was greater than that of evaporation, it is expressed as the total average evaporation. The internal humidity of the underfloor would be influenced by the outdoor humidity when the volume of introduced outdoor air increased with an increase in the ventilation rate. In the instance of the outdoor air velocity being 1.0 m/s, the absolute humidity increased with the rising temperature after 6:00 in the morning. The rate of internal condensation continued to increase until 11:00, resulting in a maximum condensation rate of 0.34 mg m−2 h−1 at 10:00. From 11:00, the condensation rate gradually decreased and the condensed water on the surface evaporated between 11:00 and 12:00, whereas the evaporation rate increased significantly at 12:00 to 0.46 mg m−2 h−1. During the rainy season, the humidity remains high throughout the day. Therefore, during the calculated period, the absolute humidity increased with the rise in temperature and the condensation phenomenon appeared again after 13:00 and continued until 23:00. Furthermore, at 24:00, the humidity decreased and evaporation occurred at a largest value of 0.46 mg m−2 h−1 for the day measured. In a condition of stagnant wind velocity (0.05 m/s), it was not influenced significantly by the outdoor conditions. This means that not only was the outdoor moisture not introduced well but also that the internal moisture was not exhausted well. As time elapsed, the condensation phenomenon continued as the humidity from outside entered the underfloor space; however, the evaporation did not occur for 24 h. Furthermore, the evaporation and condensation phenomena were shown to be in equilibrium at 15:00.
4.3.2. Evaporation and Condensation Effect
We confirmed the overall characteristics of the internal underfloor space over time according to the average value of the amount of condensed water occurring in the entire underfloor space. The occurrence of condensation initially commenced when all the internal surfaces were in the dry state and it subsequently accumulated water inside the underfloor space.
As shown in Figure 16, in a condition of wind speed of 1.0 m/s, the condensation continued until 10:00, with evaporation starting to occur between 11:00 and 12:00, and the amount of condensed water starting to decrease. Between 13:00 and 23:00, condensation continued, with the amount of condensed water being the highest at an average value of 2.22 mg/m2. At 24:00, the rate of evaporation was high, resulting in an average cumulative condensation of 1.76 mg/m2 per day. Condensation occurred continuously with a wind velocity of 0.05 m/s, assuming a stagnant environment, and an amount of 0.48 mg/m2 of cumulative condensed water was observed at 24:00.
Convective mass transfer on surface increases as the air velocity increased. The air temperature increase causes the absolute humidity rise in the moist air due to the change of saturated vapor pressure. These results affect the amount of moist introduced from the outdoor air. As the higher ventilation rate, inflow rate of water vapor into underfloor space increase. This means that the convective mass transfer in a condition of 0.05 m/s is not a dominant comparing to 1.0 m/s. Before 6 o’clock, the evaporation at 1.0 m/s was stronger than the condensation due to water vapor inflow. On the other hand, at 0.5 m/s, the condensation by convection was stronger than the evaporation. In the case of 1.0 m/s, condensation due to water vapor flow is stronger than evaporation due to forced convection as the absolute humidity flowing into the inside increases after 6 o’clock. For this reason, the amount of condensed water in the underfloor space is reversed by 1.0 m/s and 0.05 m/s after 7 o’clock.
4.3.3. Condensed Water Distribution on Surface of Concrete
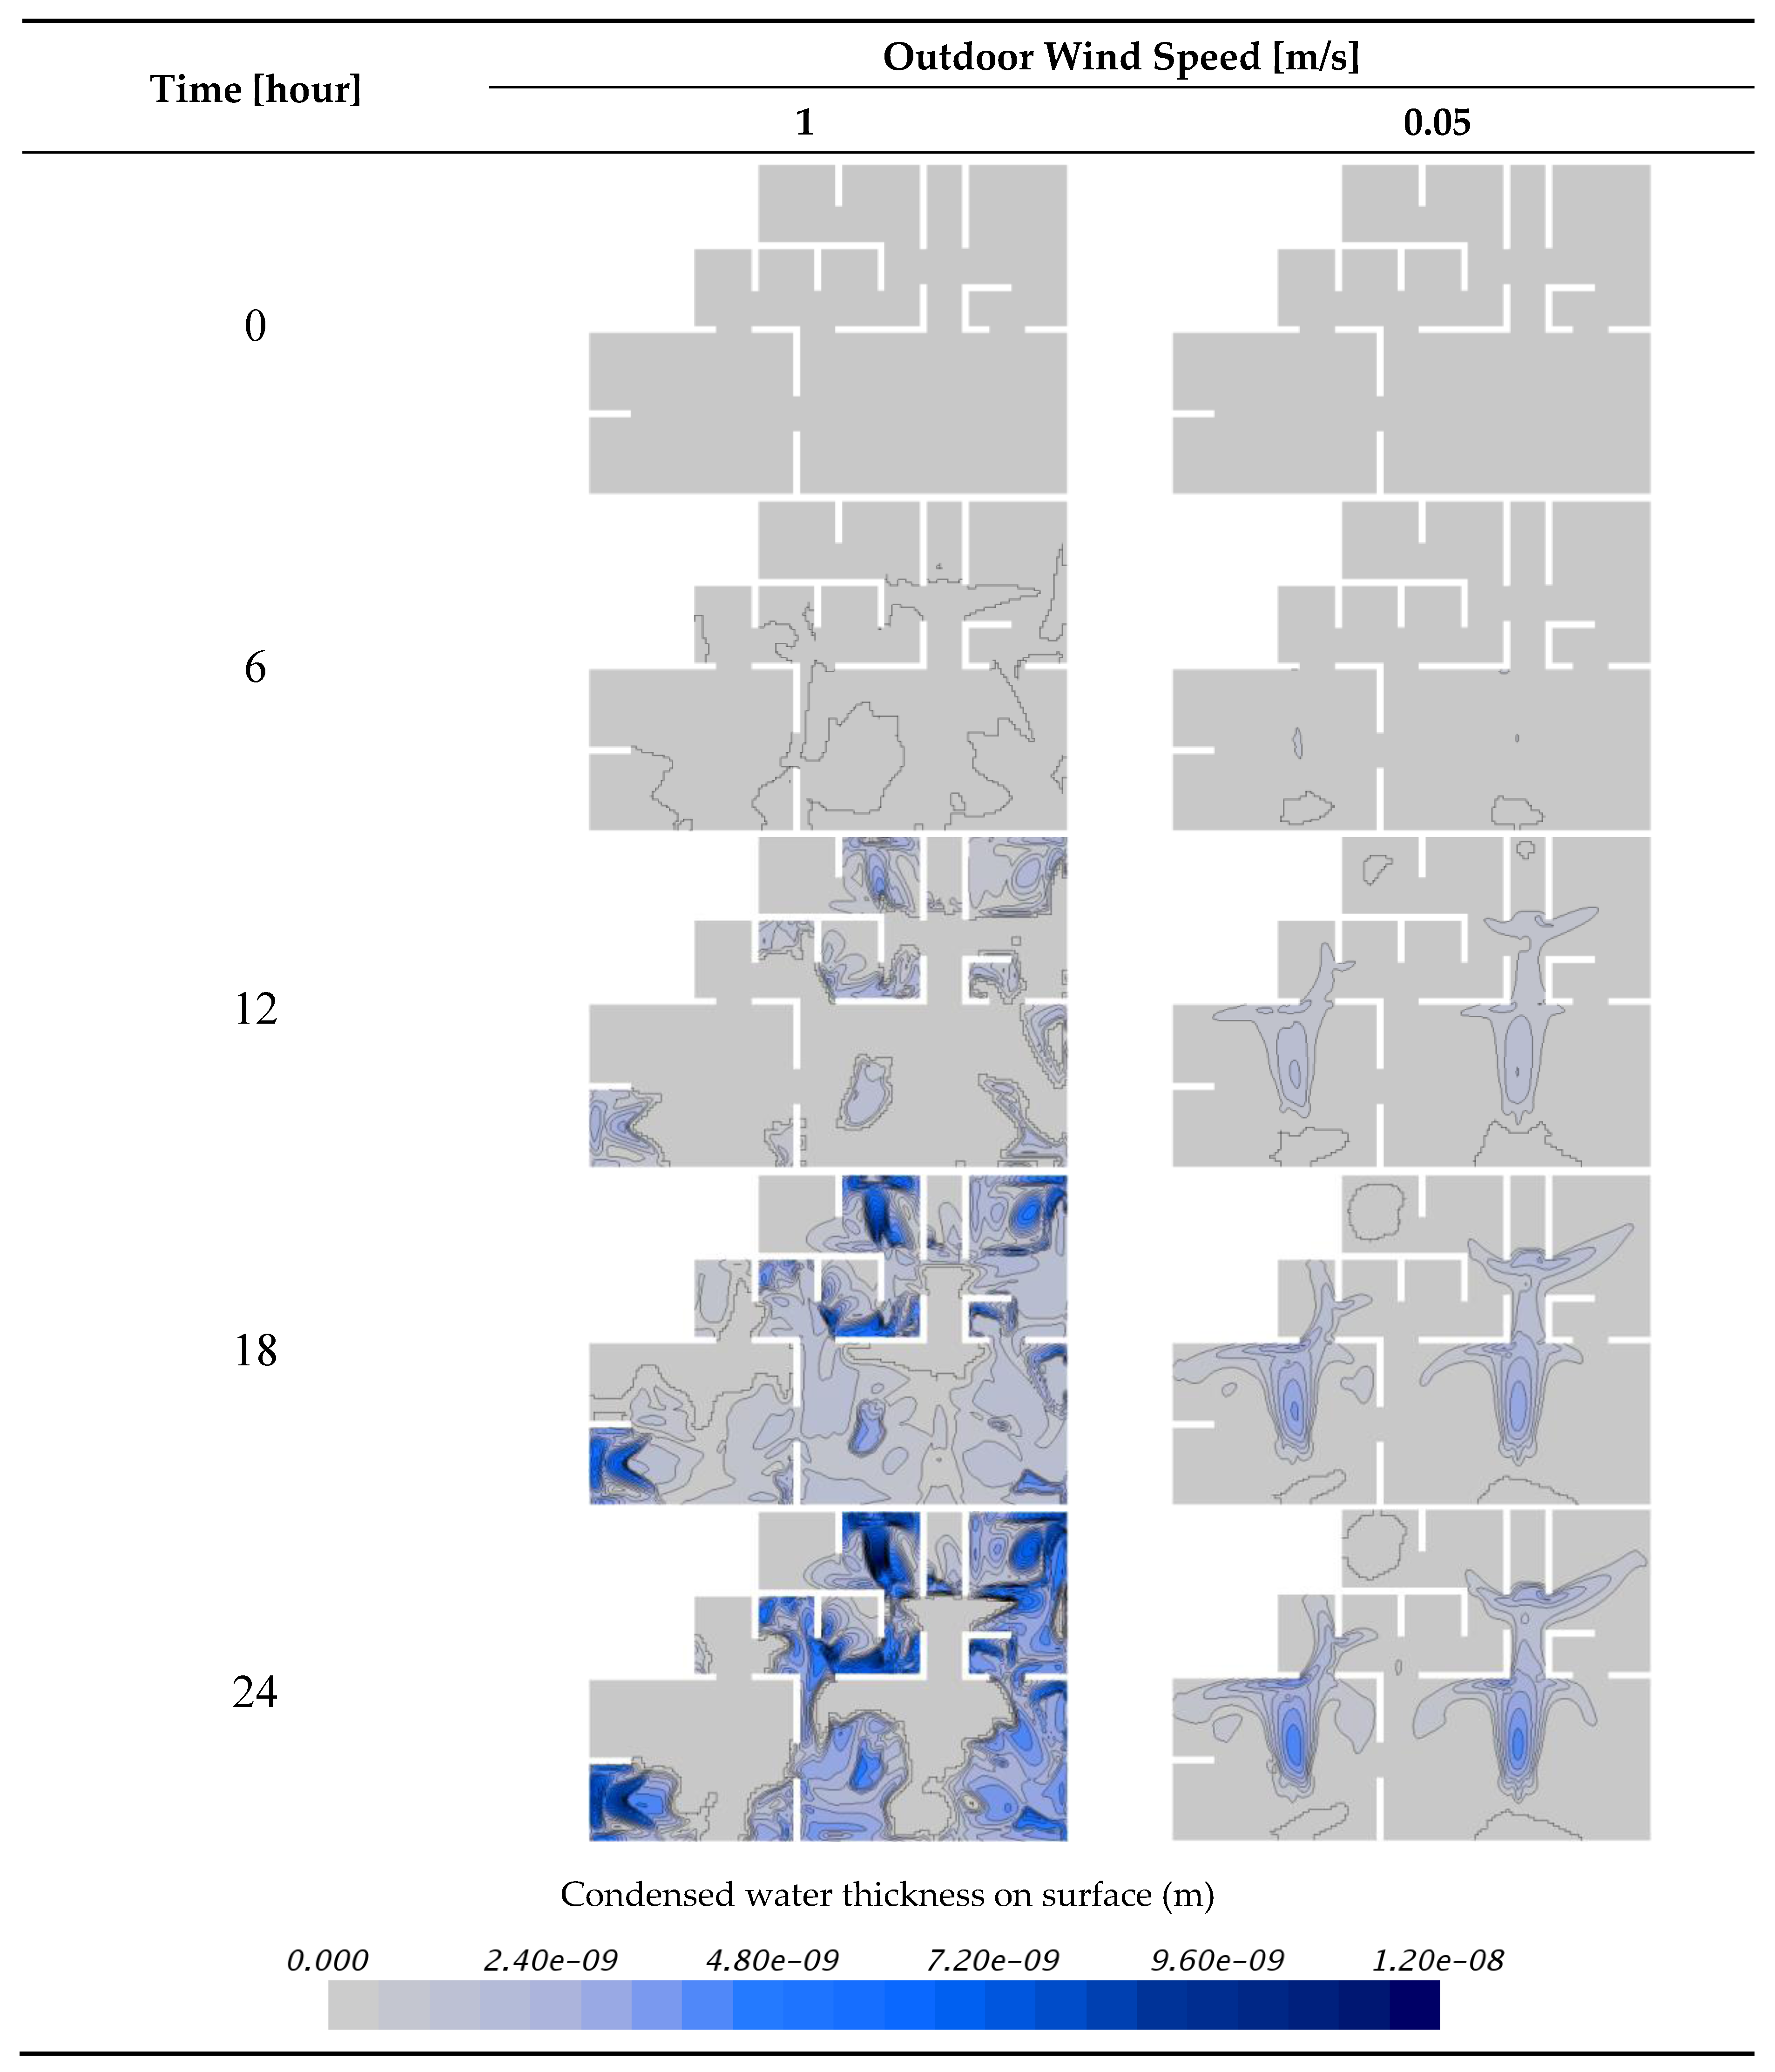
The area where condensation occurred differed according to the ventilation rates. As shown in Figure 17, at a wind speed of 1.0 m/s, condensation did not occur where the airflow is strong, but did occur nearby the mainstream of the strong airflow, and was likely to occur in the corners of the underfloor space. However, in the northern zone, where the airflow does not reach, condensation hardly occurred at all. The evaporation phenomenon was likely to occur in an area of strong airflow, as mass transfer easily occurred and condensation rarely occurred. In addition, the convective heat transfer from the surface was more pronounced because of the strong airflow when the outdoor air flowed in; therefore, condensation was less likely to occur. In contrast, in a stagnant condition of 0.05 m/s wind speed, condensation occurred mostly near the zone where the airflow was generated. This is because the velocity of the incoming airflow was extremely low and the convective heat transfer on the surface was not large; therefore, the moisture of the incoming outdoor air condensed at the area where the airflow was formed.
5. Discussion
The RWS of the initial internal environment was assumed zero in fluctuating conditions. Under such conditions, dry air was introduced into the underfloor space and the evaporation phenomenon did not occur, even if ventilation were performed. Therefore, the result could not be confirmed and could be different from the actual phenomenon. However, as the relative humidity of the airflow in the initial condition was 80%, the evaporation phenomenon was considered unlikely to occur originally. It is necessary to check the temperature distribution by calculations over a long time in order to confirm an environment similar to the actual environment. However, both the initial surface temperature and the internal temperature of the material were assumed uniform because of the limitation of the calculation load. Therefore, it could differ from the actual environmental conditions.
6. Conclusions
In the case where condensed water exists inside the subfloor, the rate of evaporation was shown to be greater when the airflow rate was high. However, under extreme conditions where the outdoor humidity is 90% or more, condensation occurs instead of evaporation. When the outdoor humidity was less than 90%, the condensation did not occur, regardless of the airflow rate. This means that keeping the inside of the underfloor space free from condensed water and dry is important. In the situation when the outdoor humidity is high, such as the rainy season, internal condensation in the underfloor space easily occurs due to natural ventilation no matter what the airflow rate is. If the airflow rate is high, it is easily affected by outdoor humidity, and the evaporation and condensation phenomena are continuously changing. On the other hand, under low airflow rate conditions, only the condensation appeared steadily. If the wind velocity is strong, the convective mass transfer on a surface becomes large. When the outdoor humidity is high and the airflow rate is high, condensation mainly occurs in a corner of the underfloor space due to high evaporation by convection in the mainstream of the airflow. By contrast, when the airflow rate is low, condensation occurs along the air stream. If condensation occurs once in the corner where the airflow has not reached well, it is difficult to evaporate again. Therefore, it is necessary to control the ventilation rate according to the characteristics of the external environment and internal RWS.
- We confirmed the influence of the difference in the humidity when the outdoor wind speed was assumed 1.0 m/s and the outdoor air flowing into the room remained constant according to the calculated ventilation rate. In the instance of a RWS value of 1, evaporation occurred actively and the evaporation rate was 12.3 mg m−2 h−1. The total volume of the internal evaporation rate was 726 mg/h. The evaporation phenomenon did not occur in a condition of 0–70% humidity, where the value of RWS was 0 and the entire surface was dry. When humidity was high at 90–100%, the total condensation rate of the underfloor was 0.03 g/h.
- We confirmed the influence of the difference in humidity when the outdoor wind speed was assumed stagnant at 0.05 m/s and the outdoor air flowing into the room remained constant according to the calculated ventilation rate. When the value of RWS was 1, the average evaporation effect per area was determined as 0.5–0.05 mg m−2 h−1, and the total volume of the evaporation rate was 29.5–3.0 mg/h. In a condition of 90% humidity of the introduced outdoor air, a state of equilibrium was indicated, with neither evaporation nor condensation occurring. With 100% humidity, the evaporation phenomenon reversed and a condensation phenomenon of 0.7 × 10⁻⁴ mg m−2 h−1 occurred. However, the condensation phenomenon was slight, as indicated by the result of 0.4 × 10⁻² mg/h. When the RWS value was zero, with all the internal surfaces dry and humidity of 90–100%, the total condensation rate of the underfloor space was 0.03 g/h.
- When the outdoor wind speed was 1.0 m/s and the outdoor environmental conditions fluctuated for 24 h, the outdoor humidity remained high and condensation continued. However, with the temperature rising or humidity decreasing, evaporation occurred between 11:00 and 12:00, and at 24:00. The maximum condensation rate was 0.34 mg m−2 h−1 at 10:00 and the maximum evaporation rate was 0.46 mg m−2 h−1 at 12:00 and at 24:00.
- In a stagnant environment, with an outdoor wind speed of 0.05 m/s, the rate of natural ventilation into the underfloor was low and the effect of the outdoor environment was therefore insignificant. Consequently, condensation continued for 24 h and evaporation did not occur at all.
- Under a condition of 1.0 m/s wind speed, evaporation and condensation occurred continuously throughout the day and the cumulative rate of condensation of the underfloor space was 1.76 mg/m2 per day. Under a condition of 0.05 m/s wind speed, the cumulative rate of condensation of the underfloor space from natural ventilation was 0.48 mg/m2 per day.
- When the wind speed was 1.0 m/s, condensation did not occur near the strong airflow, but did occur in the vicinity of the airflow, and easily occurred in the corners. Furthermore, as there was less moisture transfer through the airflow, condensation hardly occurred where the airflow could not reach. At a wind speed of 0.05 m/s, assuming a stagnant condition, moisture was transferred to the inside by the airflow and condensation occurred in accordance with the airflow.
Author Contributions
Wonseok Oh performed the simulations, analyzed the simulation results, designed the simulations and wrote the paper. Shinsuke Kato reviewed the paper. All authors have read and approved the final manuscript.
Conflicts of Interest
The authors declare no conflict of interest.
References
- Kurnitski, J. Ground moisture evaporation in crawl spaces. Build. Environ. 2001, 36, 359–373. [Google Scholar] [CrossRef]
- Kurnitski, J.; Kurnitski, J. Crawl space air change, heat and moisture behaviour. Energy Build. 2000, 32, 19–39. [Google Scholar] [CrossRef]
- Ferguson, C.C.; Krylov, V.V.; McGrath, P.T. Contamination of indoor air by toxic soil vapours: A screening risk assessment model. Build. Environ. 1995, 30, 375–383. [Google Scholar] [CrossRef]
- Krylov, V.V.; Ferguson, C.C. Contamination of indoor air by toxic soil vapours: The effects of subfloor ventilation and other protective measures. Build. Environ. 1998, 33, 331–347. [Google Scholar] [CrossRef]
- Zhai, Z.J.; Zhang, Z.; Zhang, W.; Zhang, Z.; Zhang, W.; Chen, Q.Y. Evaluation of various turbulence models in predicting airflow and turbulence in enclosed environments by CFD: Part 1—Summary of prevalent turbulence models. HVAC R Res. 2007, 13, 853–870. [Google Scholar] [CrossRef]
- Nielsen, P.V. Flow in Air Conditioned Rooms: Model Experiments and Numerical Solution of the Flow Equations. Ph.D. Thesis, Technical University of Denmark, Nordborg, Denmark, 1974. [Google Scholar]
- Murakami, S.; Kato, S. Numerical and experimental study on room airflow—3-D predictions using the k-ϵ turbulence model. Build. Environ. 1989, 24, 85–97. [Google Scholar] [CrossRef]
- Nielsen, P.V. The description of supply openings in numerical models for room air distribution. Indoor Environ. Tech. 1991, R9251, 963–971. [Google Scholar]
- Nielsen, P.V. Computational fluid dynamics and room air movement. Indoor Air 2004, 7, 134–143. [Google Scholar] [CrossRef] [PubMed]
- Gan, G. Evaluation of room air distribution systems using computational fluid dynamics. Energy Build. 1995, 94, 665–675. [Google Scholar] [CrossRef]
- Zhai, Z.J. Application of computational fluid dynamics in building design: Aspects and trends. Indoor Built Environ. 2006, 15, 305–313. [Google Scholar] [CrossRef]
- Van Maele, K.; Merci, B. Application of two buoyancy-modified k–ε turbulence models to different types of buoyant plumes. Fire Saf. J. 2006, 41, 122–138. [Google Scholar] [CrossRef]
- Shin, T.H.; Liou, W.W.; Shbbir, A.; Yang, Z.; Zhu, J. A new k-ε eddy viscosity model for high Reynolds number turbulent flows. Comput. Fluids 1995, 24, 227–238. [Google Scholar]
- CASBEE for Home (Detached House) Technical Manual 2007 Edition; Japan Sustainable Building Consortium & Japan Green Build Council: Tokyo, Japan, 2007; pp. 195–215.
- Counihan, J. Adiabatic atmospheric boundary layers: A review and analysis of data from the period 1880–1972. Atmos. Environ. 1975, 9, 871–905. [Google Scholar] [CrossRef]
- Tominaga, Y.; Stathopoulos, T. Numerical simulation of dispersion around an isolated cubic building: Comparison of various types of k–ɛ models. Atmos. Environ. 2009, 43, 3200–3210. [Google Scholar] [CrossRef]
- Sandhu, K.S. Predicting the Windscreen Demisting Performance Using CAE; Elsevier: Amsterdam, The Netherlands, 2011; pp. 401–410. [Google Scholar]
- Cho, W.; Iwamoto, S.; Kato, S. Condensation risk due to variations in airtightness and thermal insulation of an office building in warm and wet climate. Energies 2016, 9, 875. [Google Scholar] [CrossRef]
- Patankar, S.V.; Spalding, D.B. A calculation procedure for heat, mass and momentum transfer in three-dimensional parabolic flows. Int. J. Heat Mass Transf. 1972, 15, 1787–1806. [Google Scholar] [CrossRef]
- Leonard, B.P. A stable and accurate convective modelling procedure based on quadratic upstream interpolation. Comput. Methods Appl. Mech. Eng. 1979, 19, 59–98. [Google Scholar] [CrossRef]
- Mulvany, N.; Tu, J.Y.; Chen, L. Assessment of two-equation turbulence modelling for high Reynolds number hydrofoil flows. Int. J. Numer. Methods Fluids 2004, 45. [Google Scholar] [CrossRef]
- Salim, S.M.; Cheah, S. Wall Y strategy for dealing with wall-bounded turbulent flows. In Proceedings of the International Multi Conference of Engineers and Computer Scientists, Hong Kong, China, 18–20 March 2009; Volume II. [Google Scholar]
Figure 1.
Underfloor ventilation in a Japanese detached house.
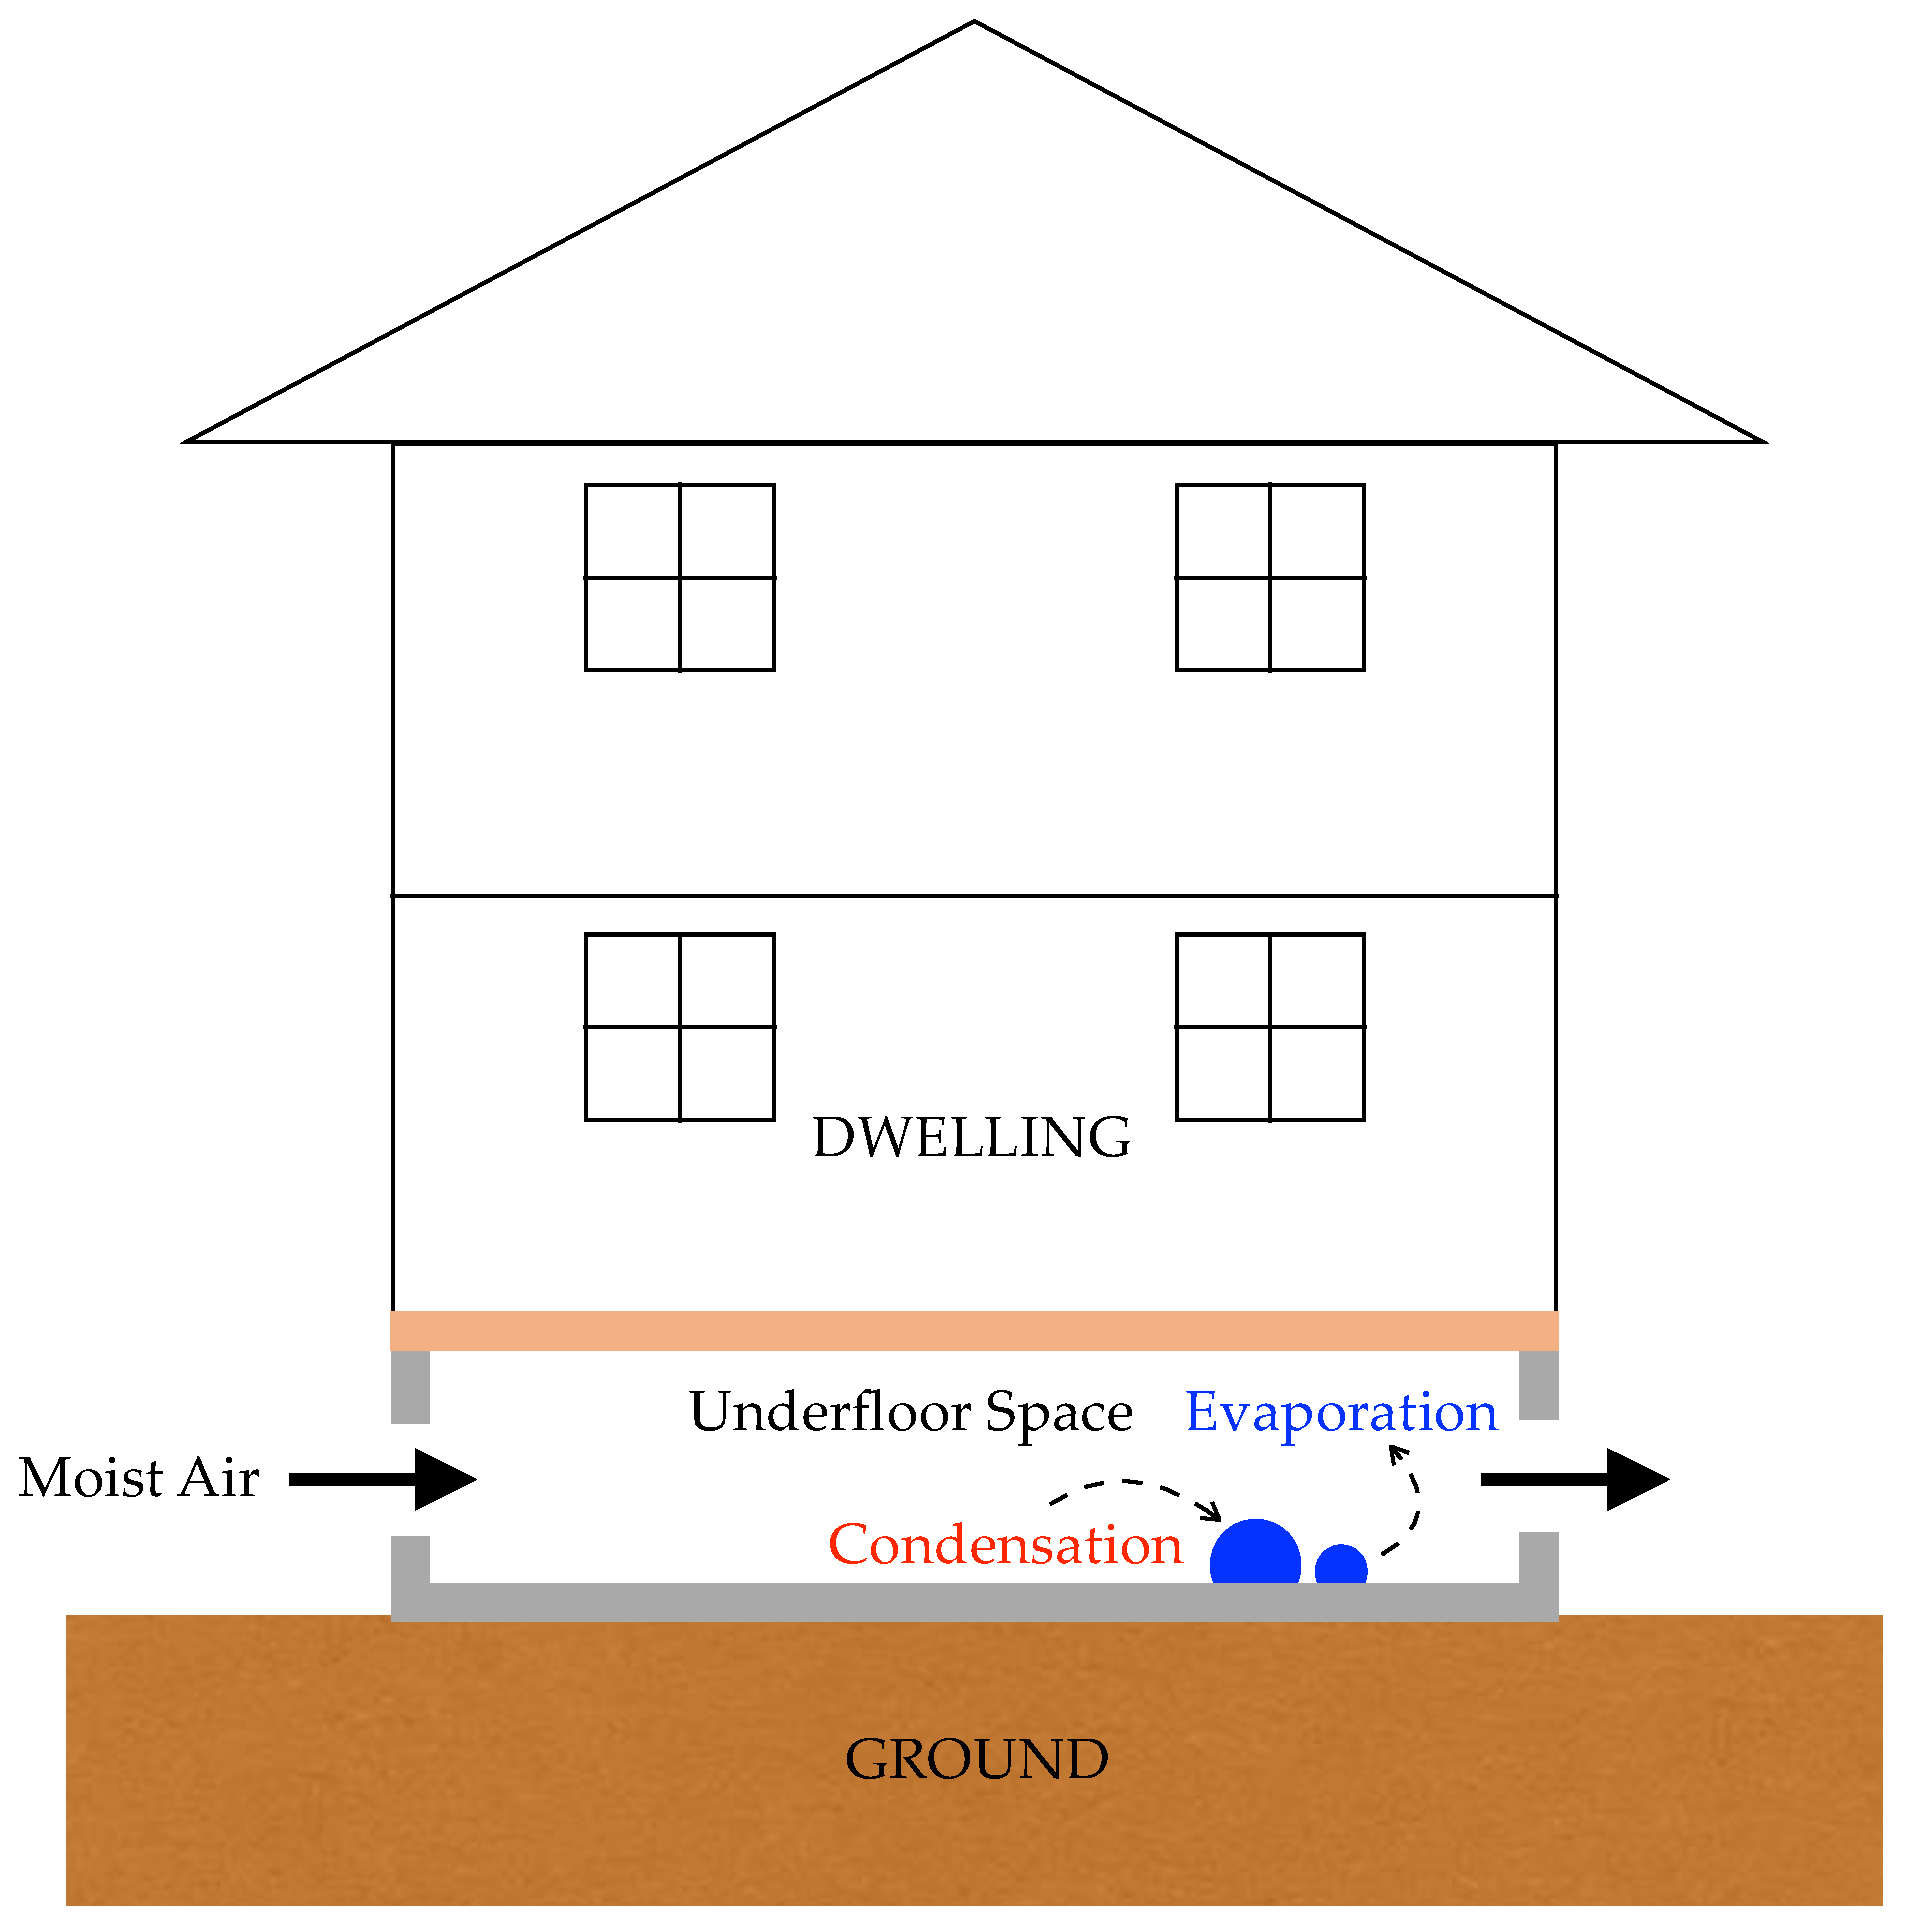
Figure 2.
Underfloor openings for the natural ventilation in Tokyo, Japan.
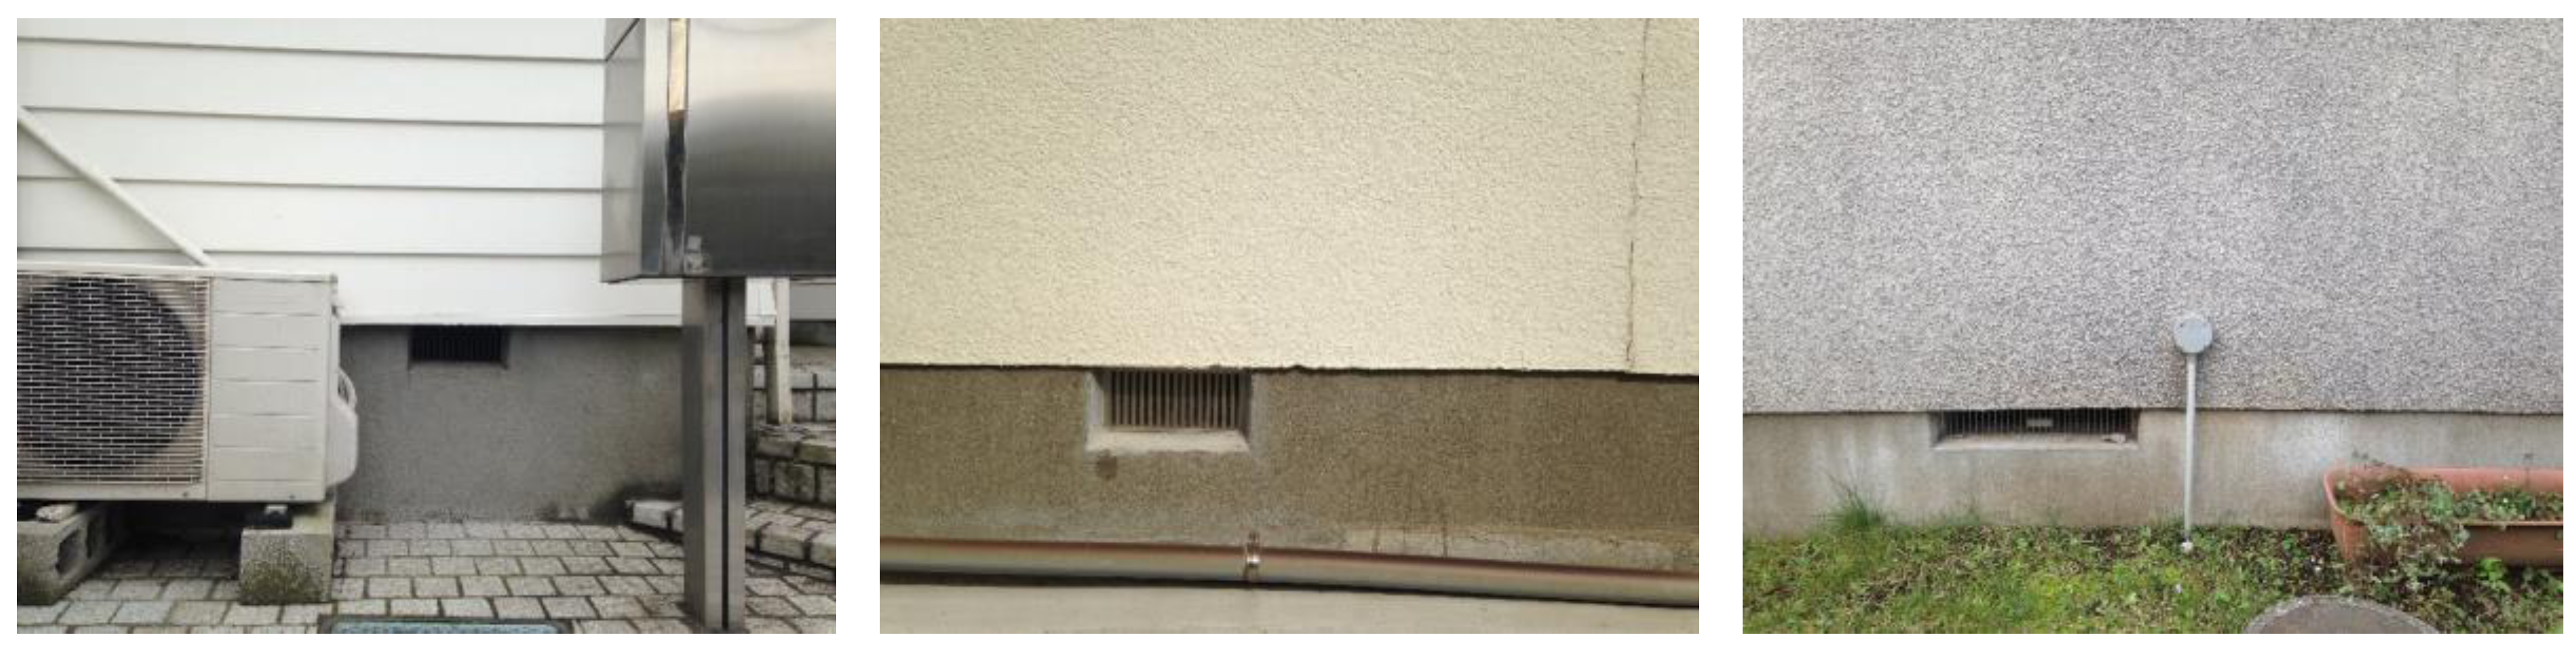
Figure 3.
The correlation of the cumulative relative humidity and relative humidity per a month during a year in Tokyo, Japan.
Figure 3.
The correlation of the cumulative relative humidity and relative humidity per a month during a year in Tokyo, Japan.

Figure 4.
Outdoor air temperature and relative humidity of Tokyo according to the AMeDAS standard weather data (10–17 June).
Figure 4.
Outdoor air temperature and relative humidity of Tokyo according to the AMeDAS standard weather data (10–17 June).
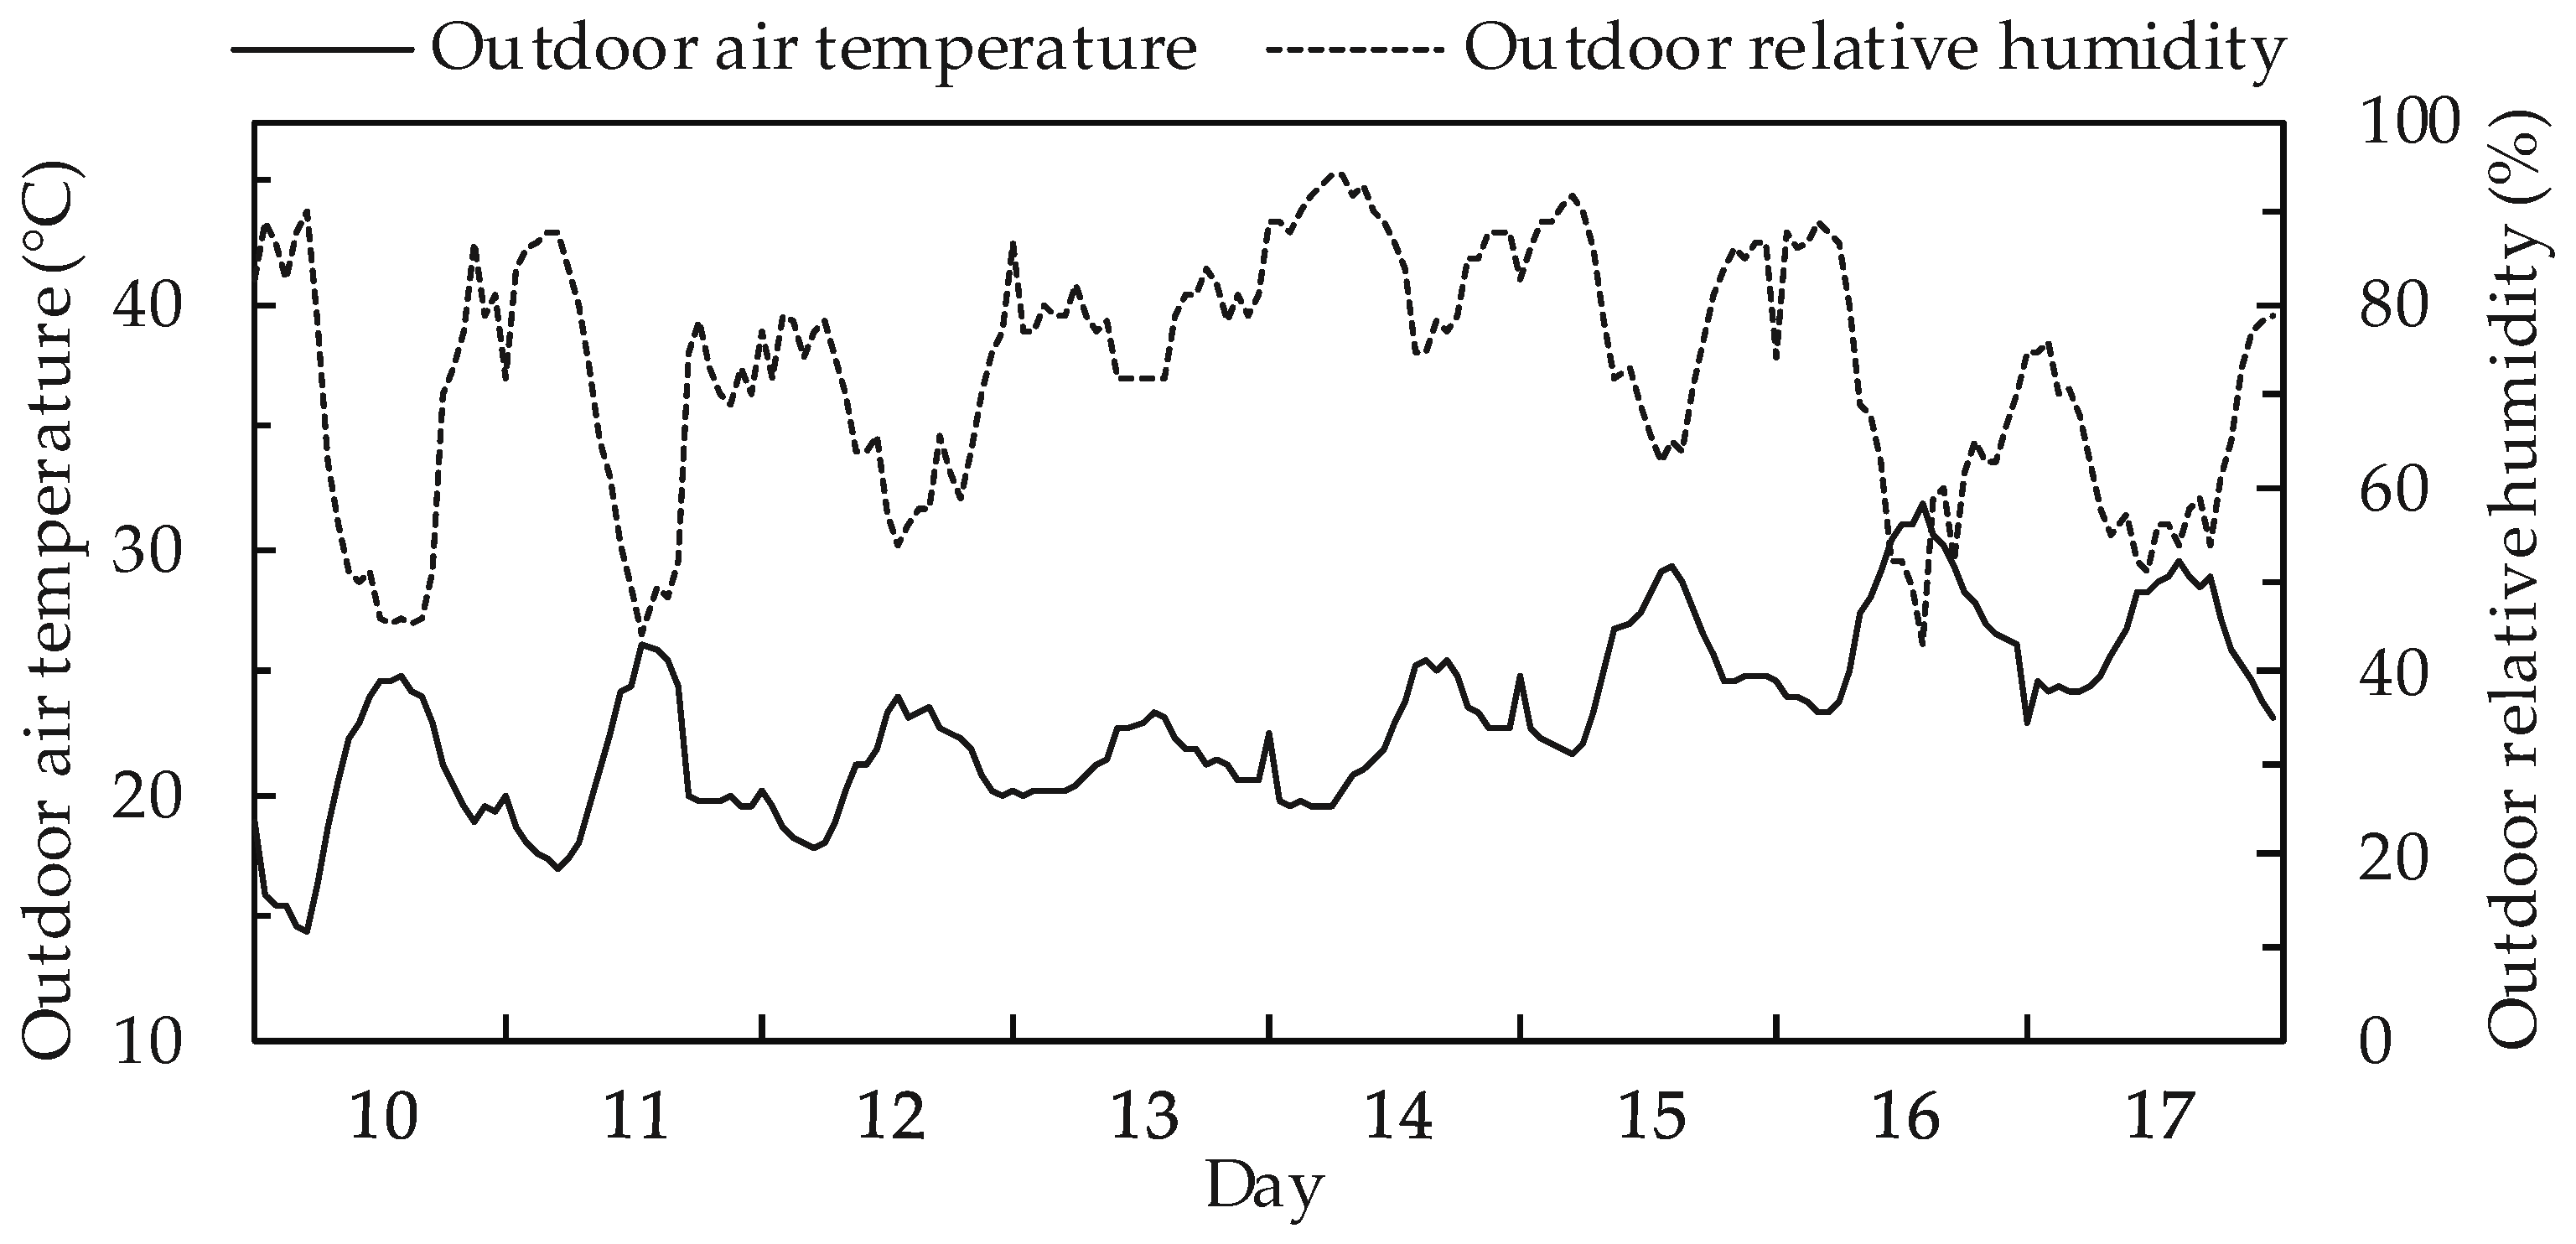
Figure 5.
Residential building and control volume for calculating the ventilation rate in sub floor ventilation area.
Figure 5.
Residential building and control volume for calculating the ventilation rate in sub floor ventilation area.
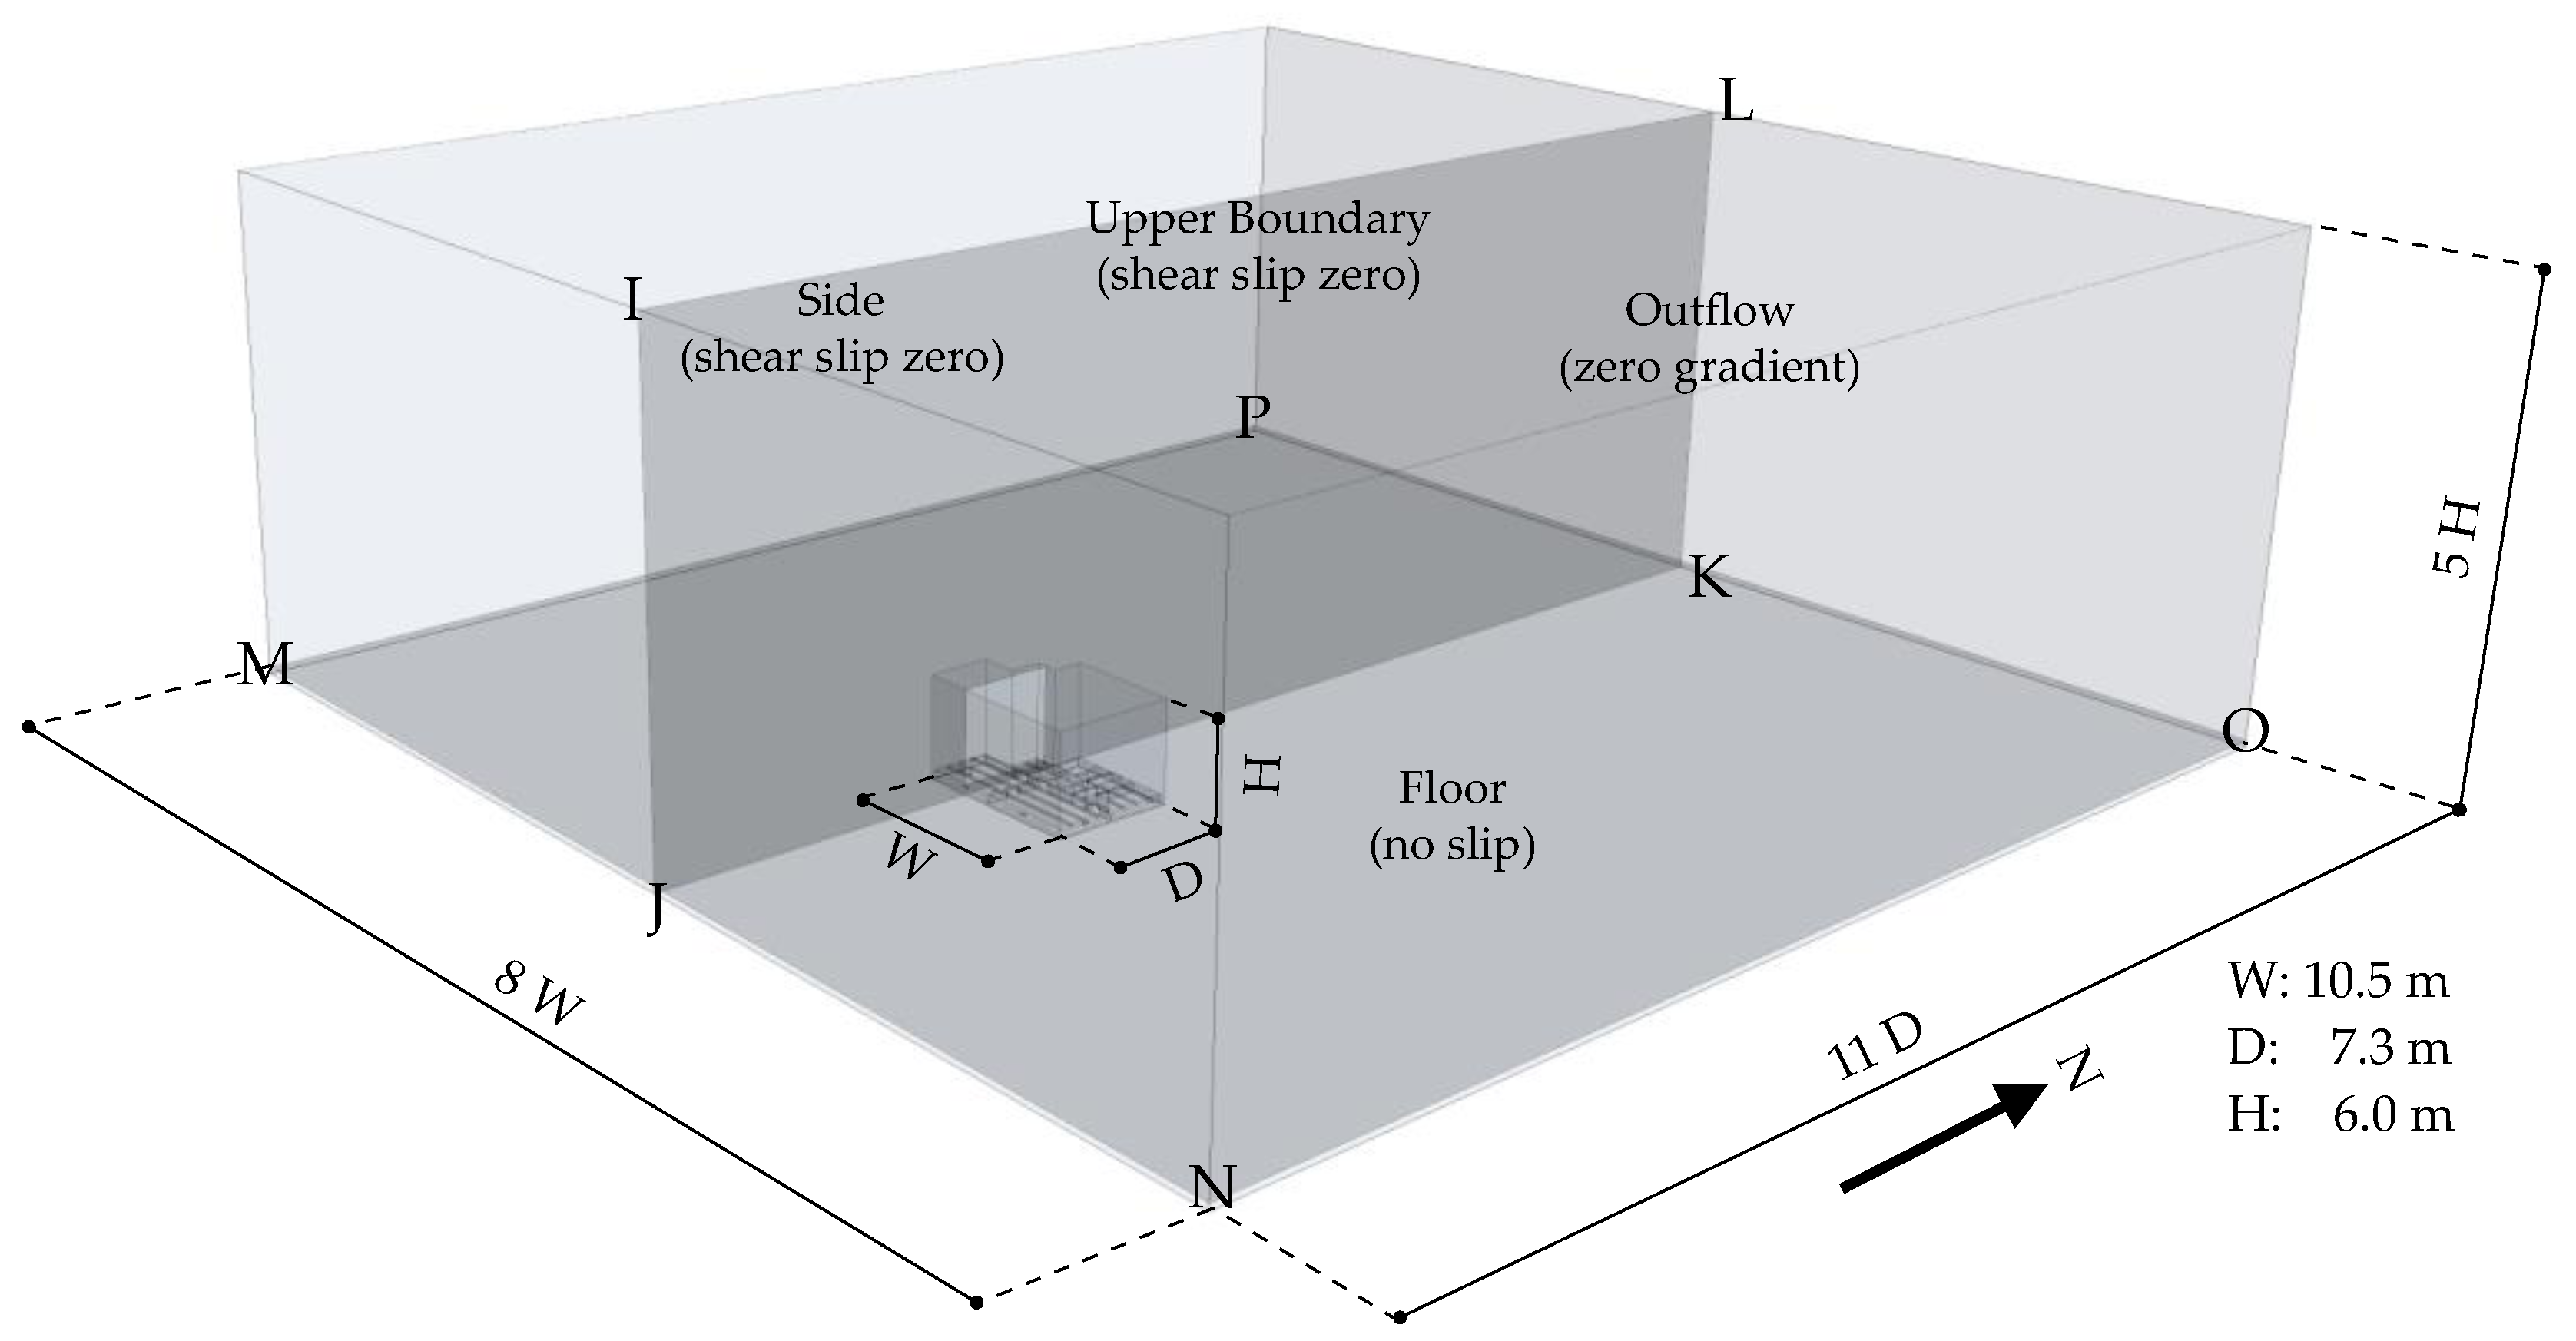
Figure 6.
The normalized velocity distribution of around the building and inside of the underfloor space in condition of velocity profile: (a) Scalar velocity distribution in section IJKL, where the velocity condition (h) is 1.0 m/s; (b) Scalar velocity distribution in section MNOP, where the velocity condition (h) is 1.0 m/s; (c) Section velocity distribution on section IJKL, where the velocity condition (h) is 0.05 m/s; (d) Section velocity distribution on MNOP, where the velocity condition (h) is 0.05 m/s.

Figure 7.
Inside of the underfloor ventilation area.
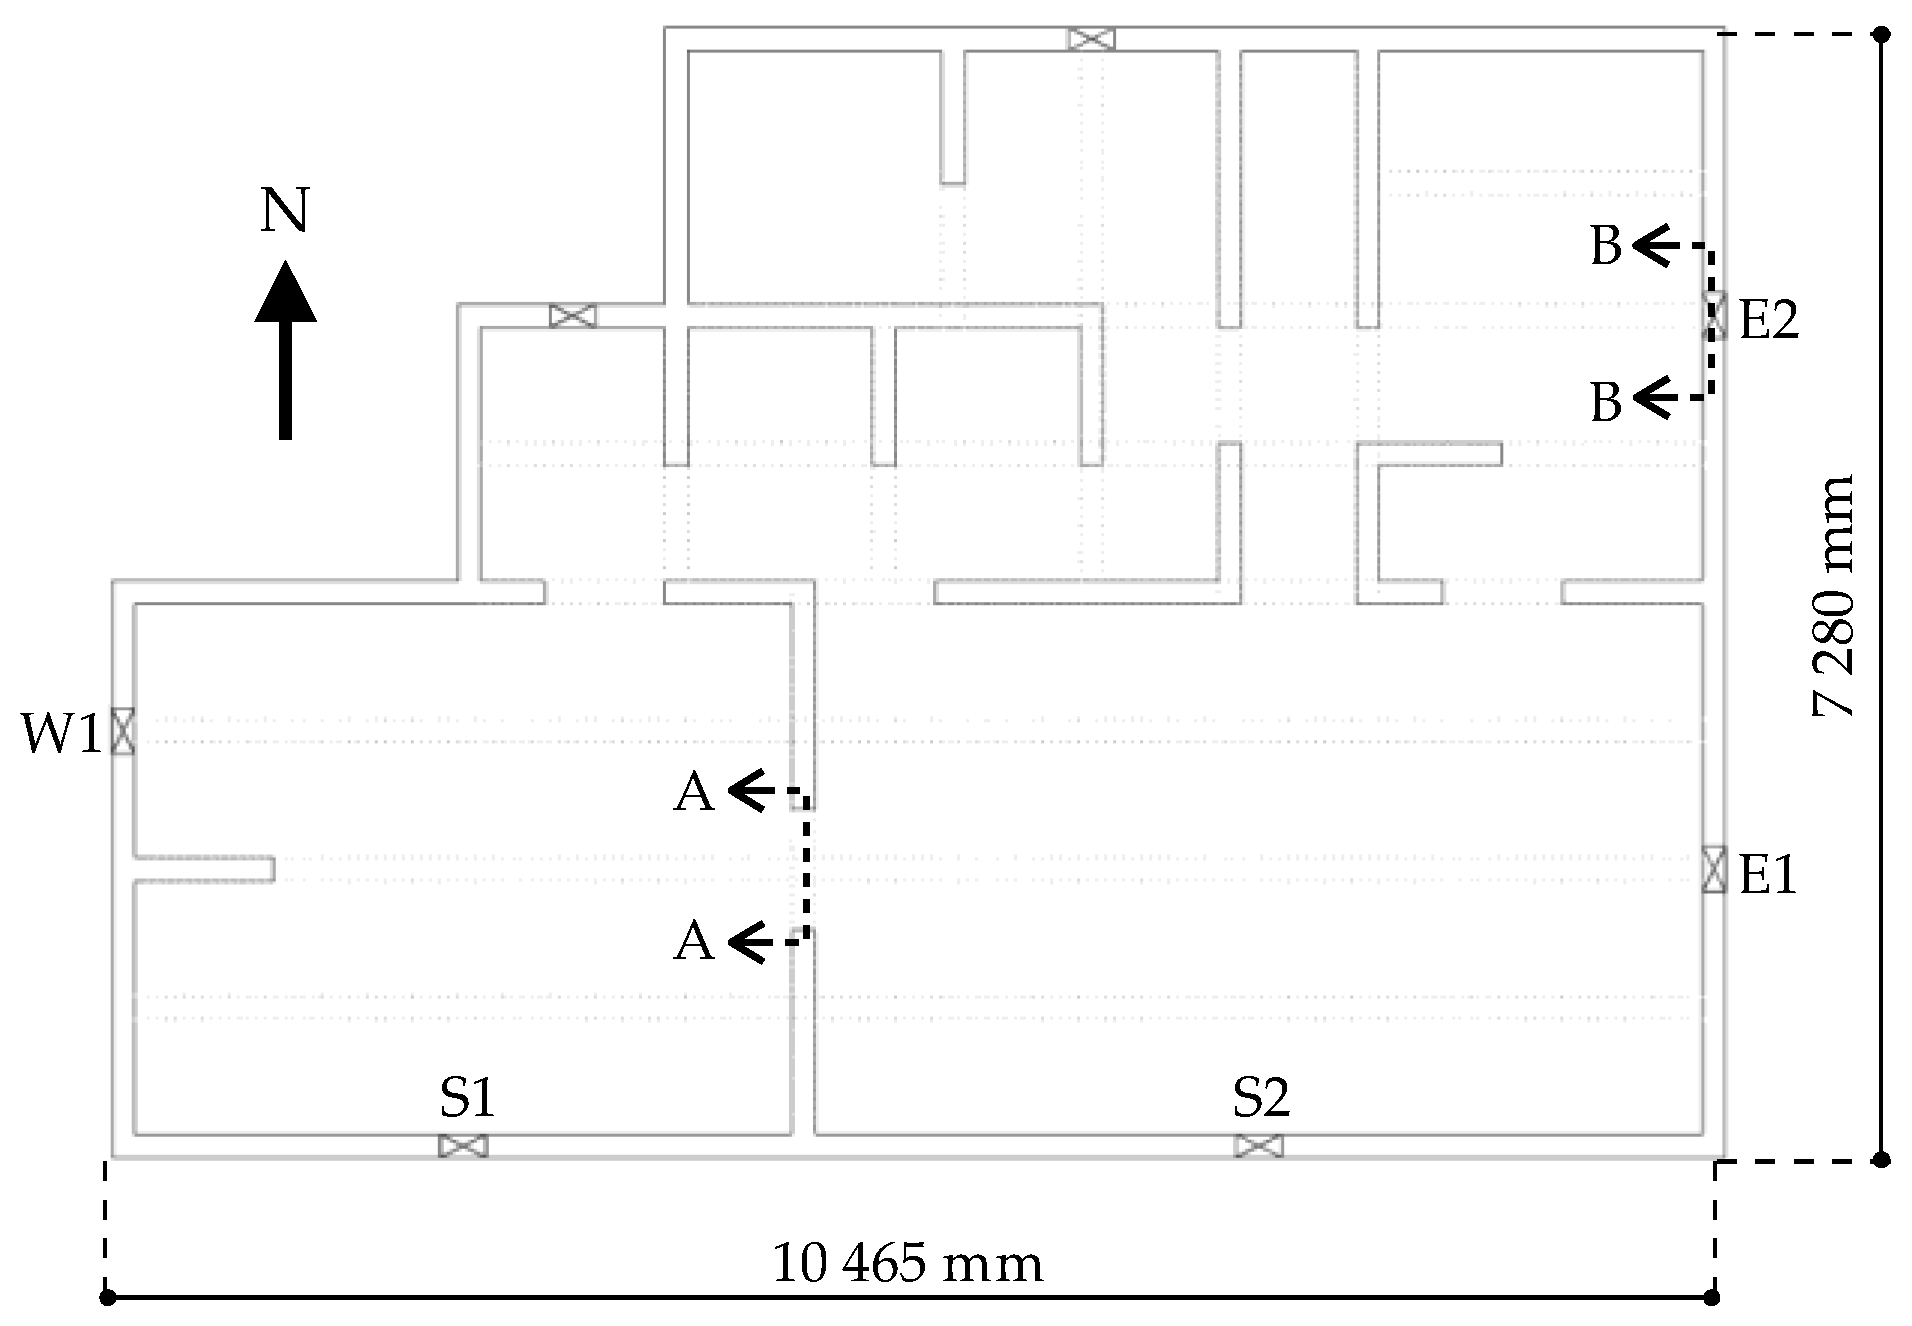
Figure 8.
The section view of A-A.

Figure 9.
The section view of B-B.
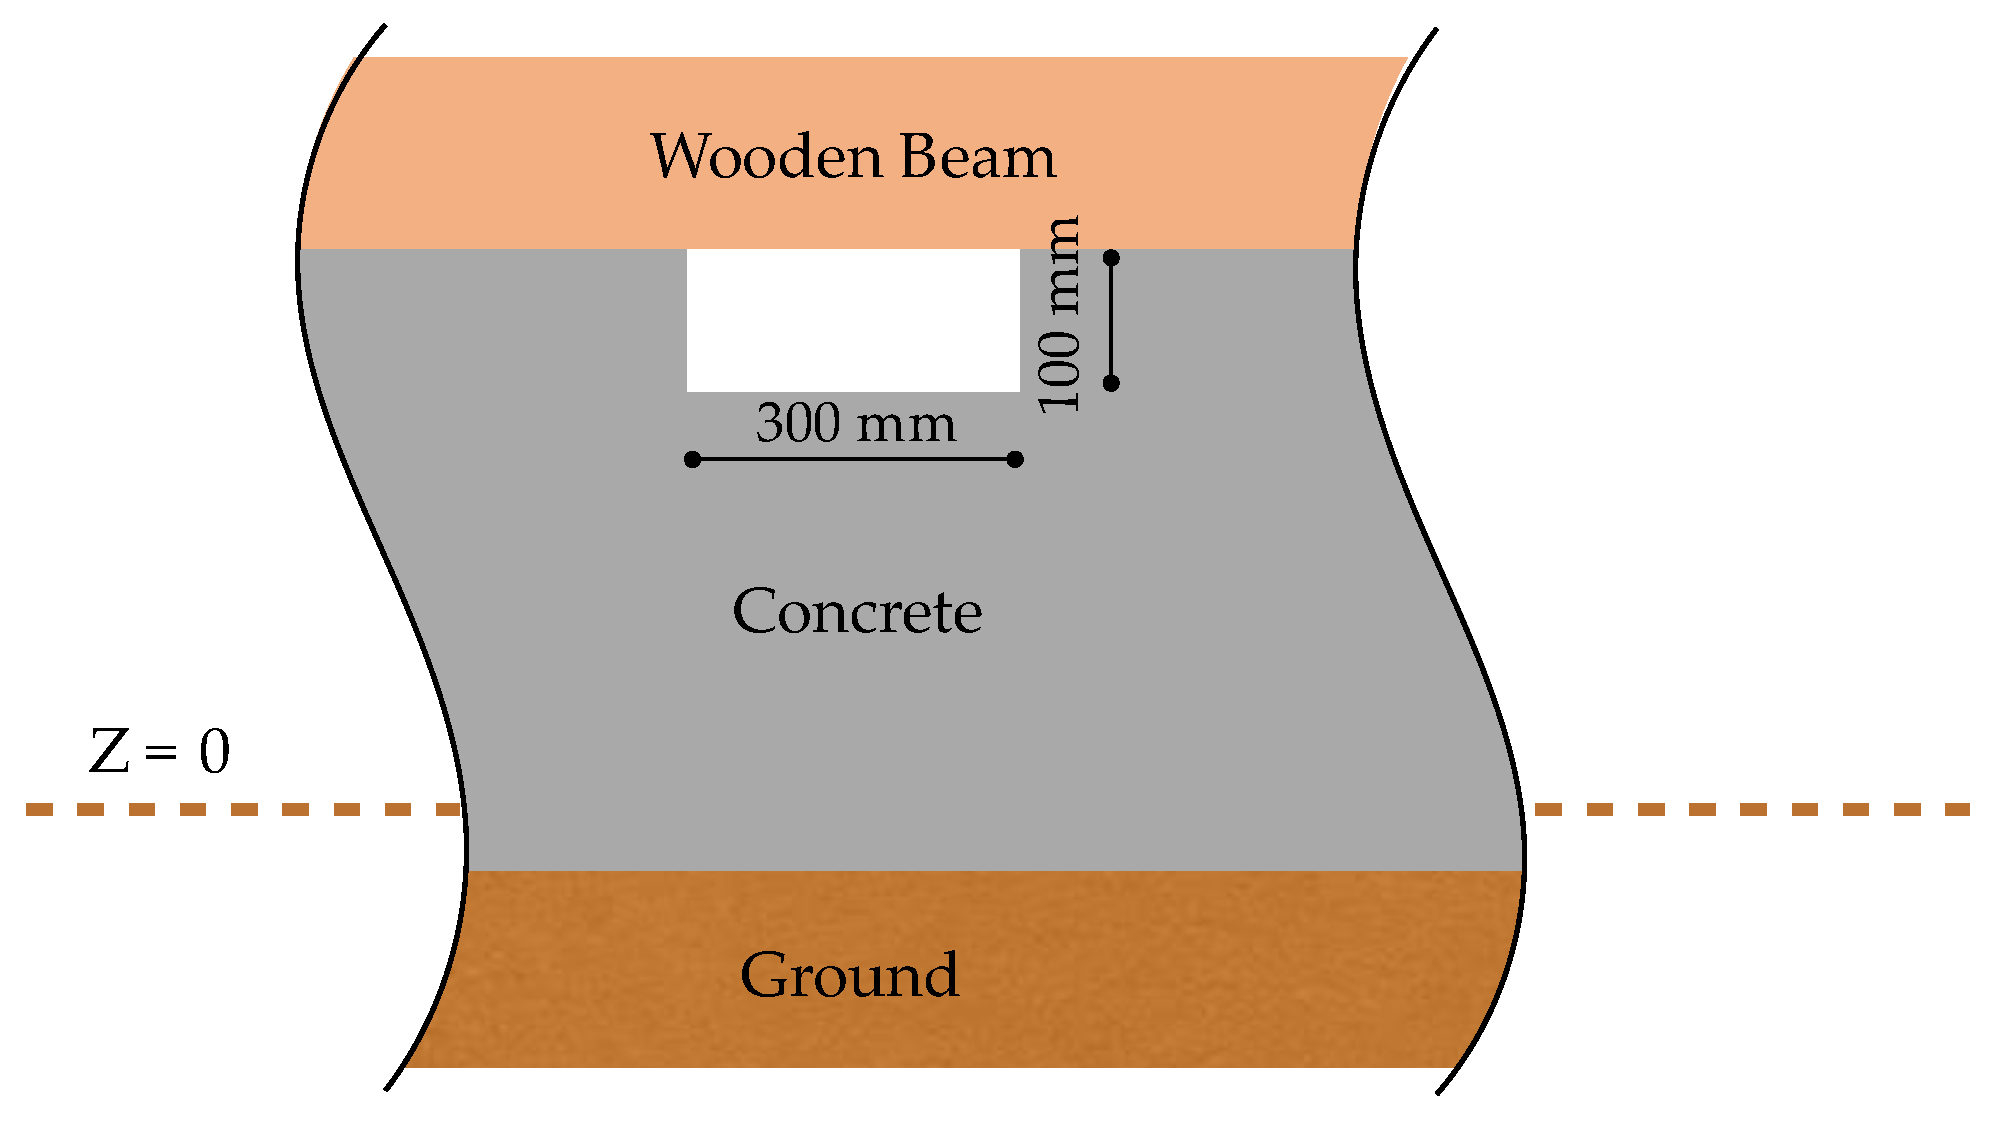
Figure 10.
Sketch of the computational domain showing the relevant boundary conditions.

Figure 11.
Outline of prism layers and hexahedral meshes prism layers on underfloor space and its opening.
Figure 11.
Outline of prism layers and hexahedral meshes prism layers on underfloor space and its opening.
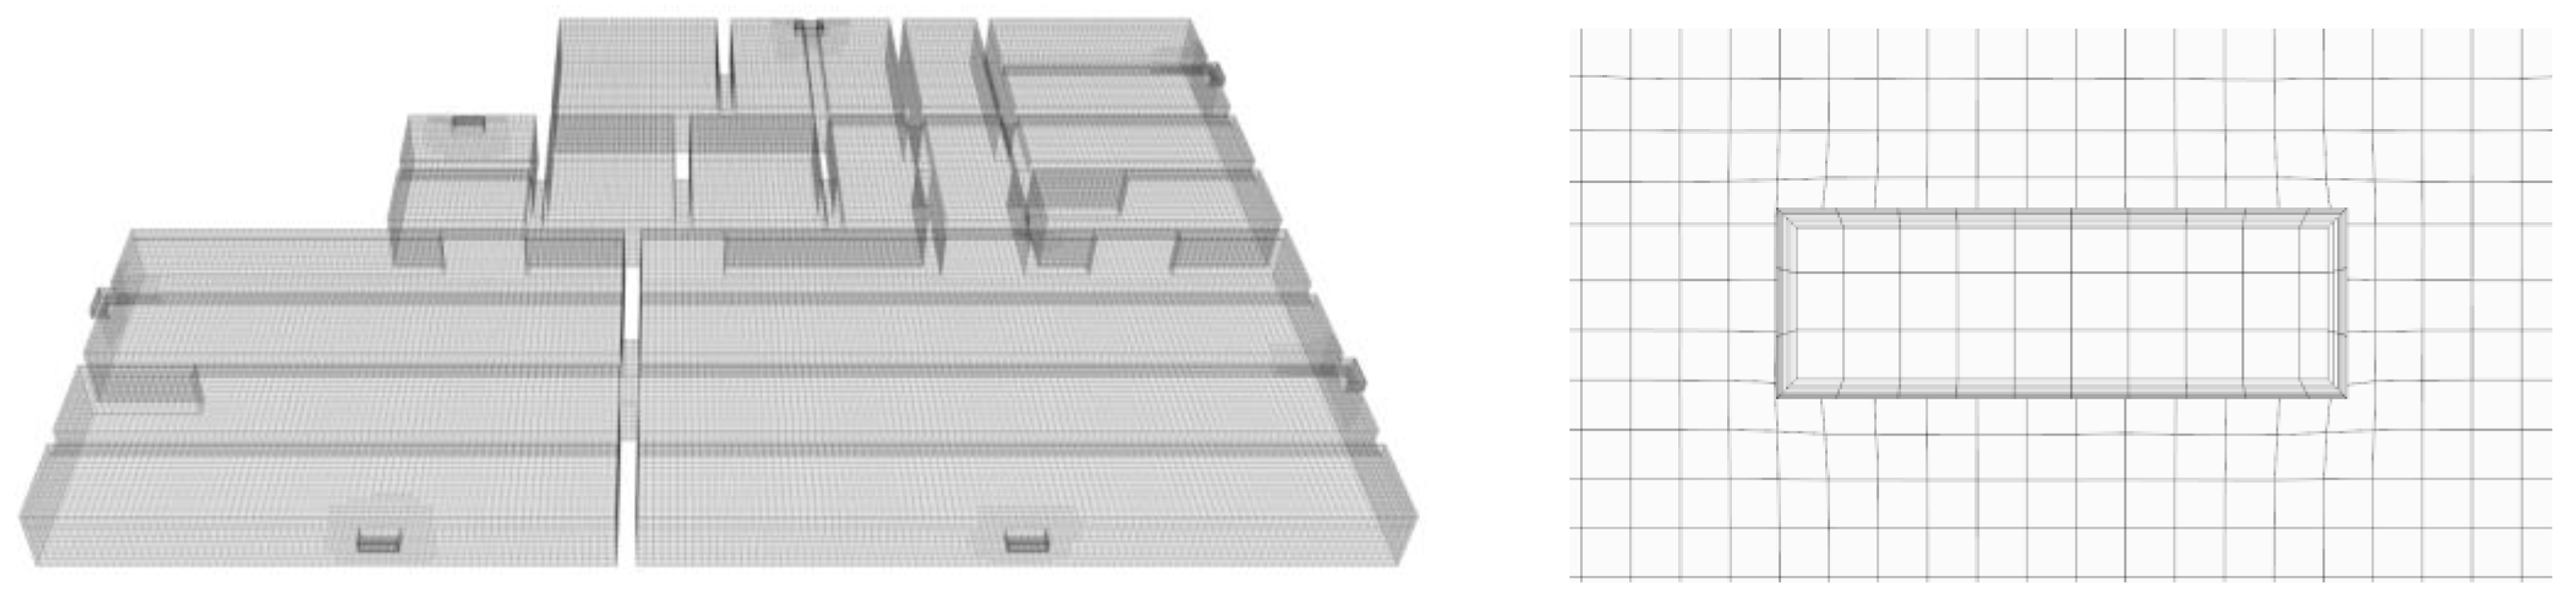
Figure 12.
Evaporation and condensation effects relevant to the outdoor environmental conditions and RWS on the surface of the concrete on underfloor space.
Figure 12.
Evaporation and condensation effects relevant to the outdoor environmental conditions and RWS on the surface of the concrete on underfloor space.

Figure 13.
Variations in the daily outdoor air temperature and relative humidity in Tokyo, Japan, according to the AMeDAS standard weather data (15 June).
Figure 13.
Variations in the daily outdoor air temperature and relative humidity in Tokyo, Japan, according to the AMeDAS standard weather data (15 June).

Figure 14.
Daily outdoor absolute humidity variations of Tokyo, Japan by AMeDAS standard weather data (June 15).
Figure 14.
Daily outdoor absolute humidity variations of Tokyo, Japan by AMeDAS standard weather data (June 15).
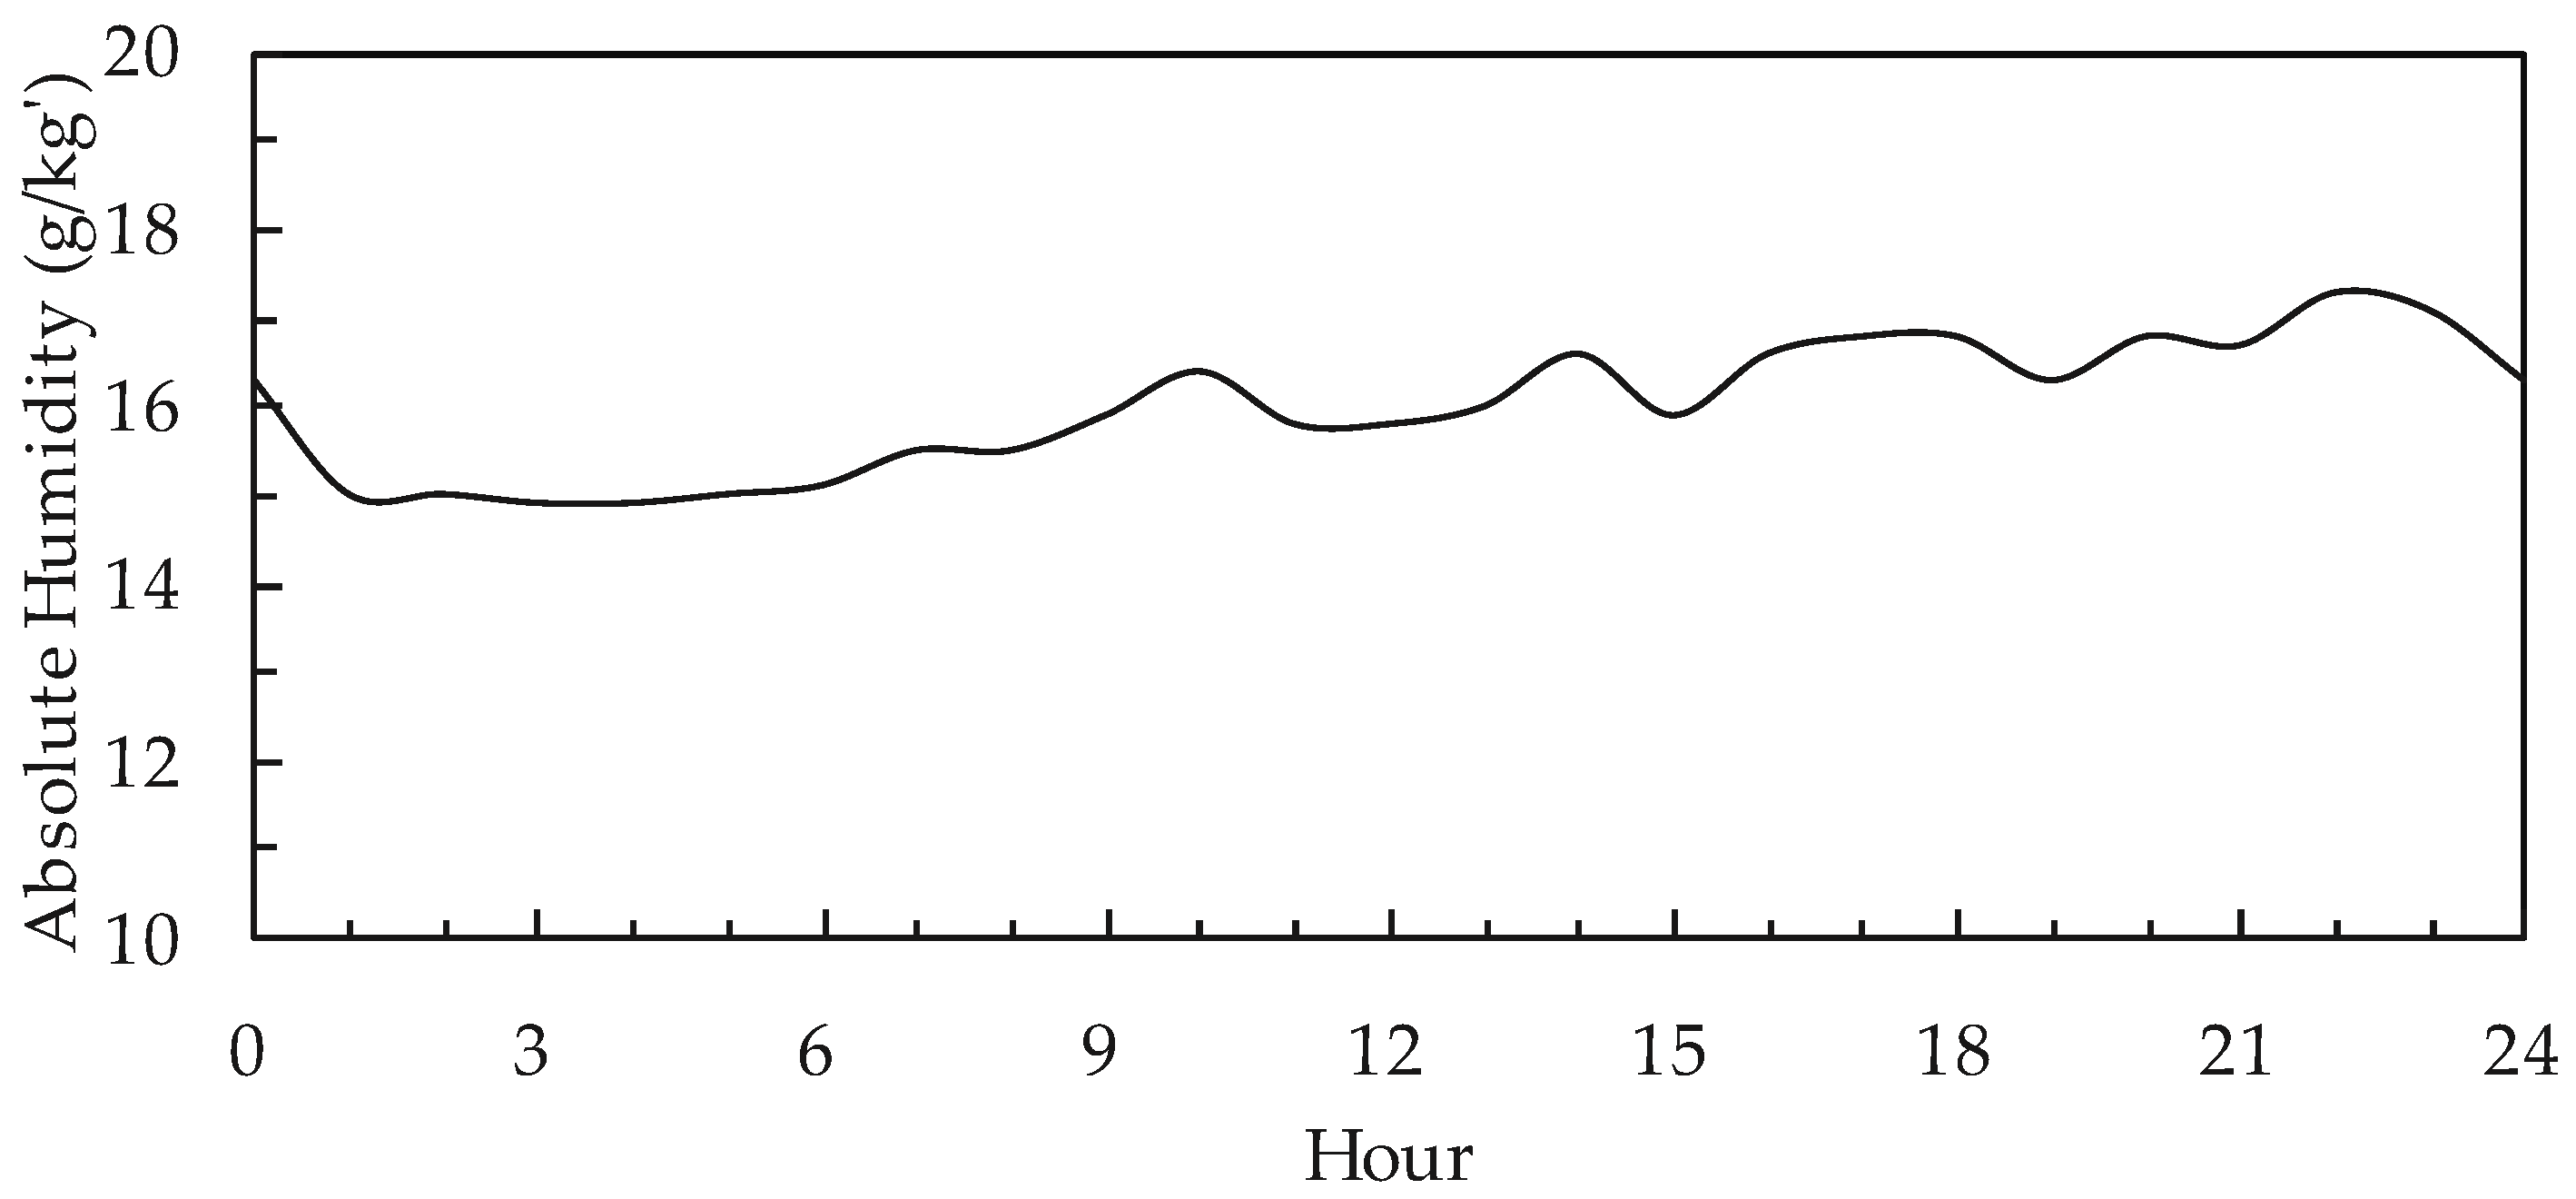
Figure 15.
Variation in the average evaporation and condensation rate on the surface of the underfloor space during a day.
Figure 15.
Variation in the average evaporation and condensation rate on the surface of the underfloor space during a day.
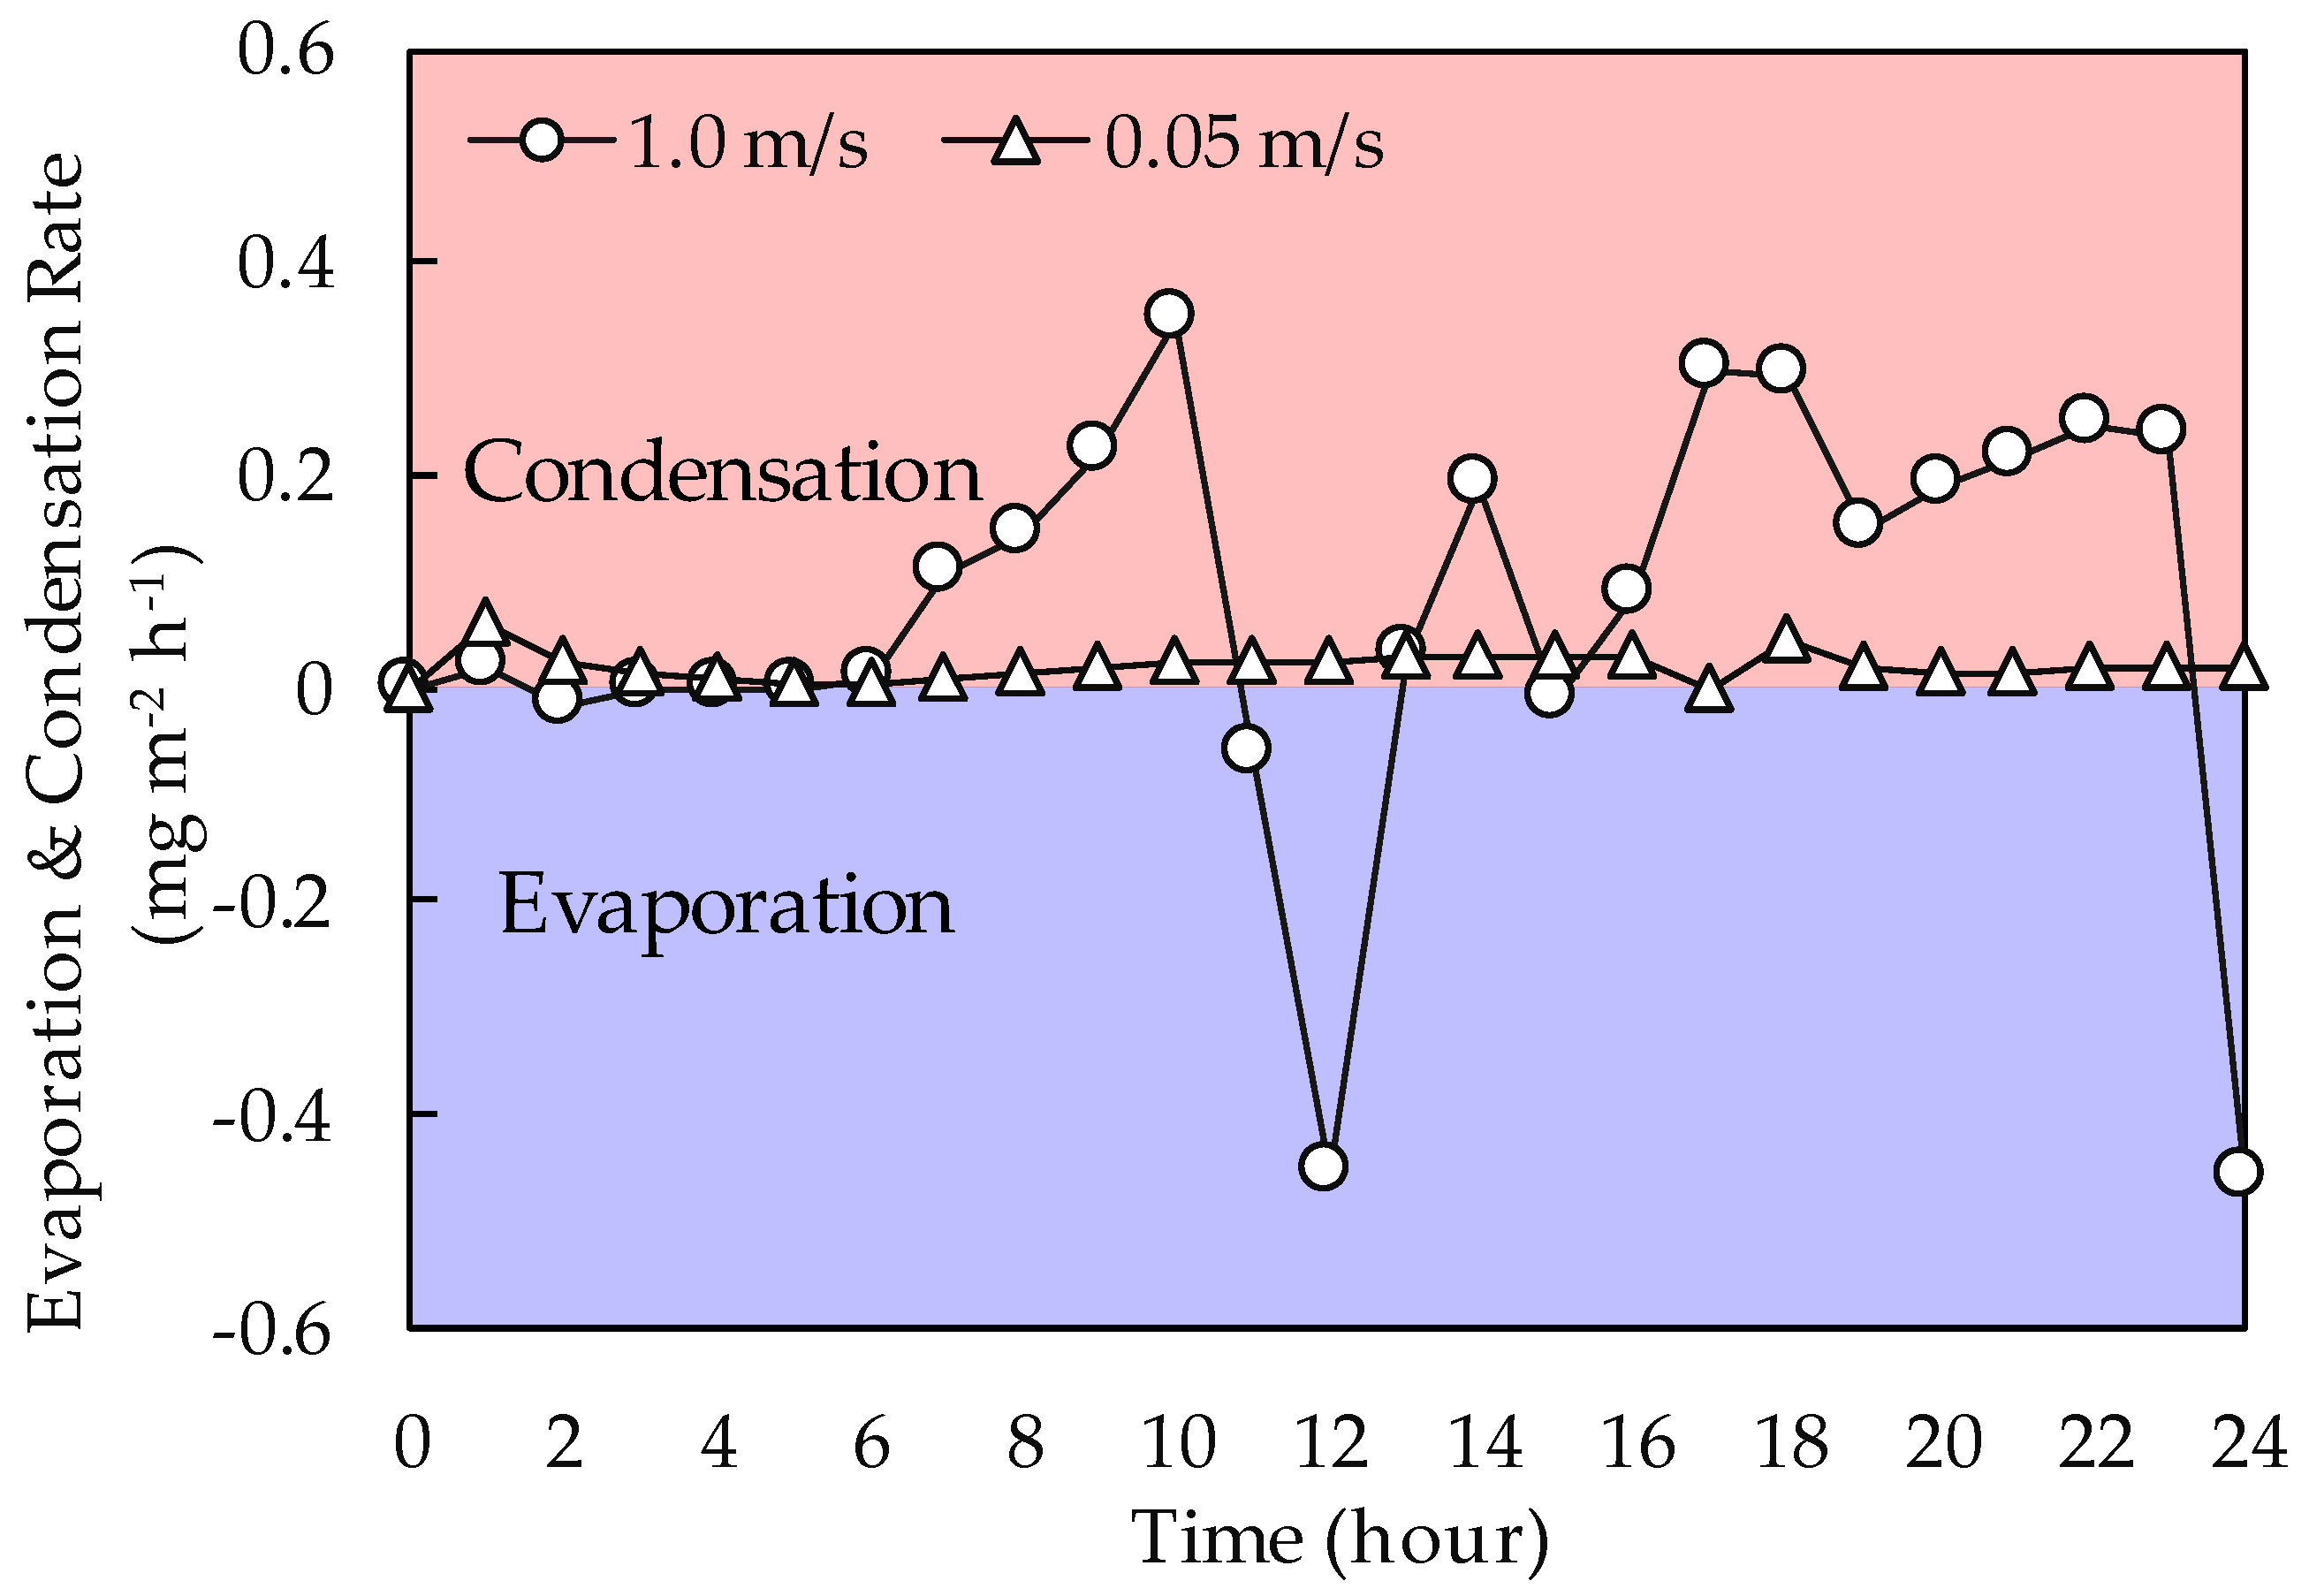
Figure 16.
Amount of condensed water of the underfloor space relevant to evaporation and condensation during a day.
Figure 16.
Amount of condensed water of the underfloor space relevant to evaporation and condensation during a day.
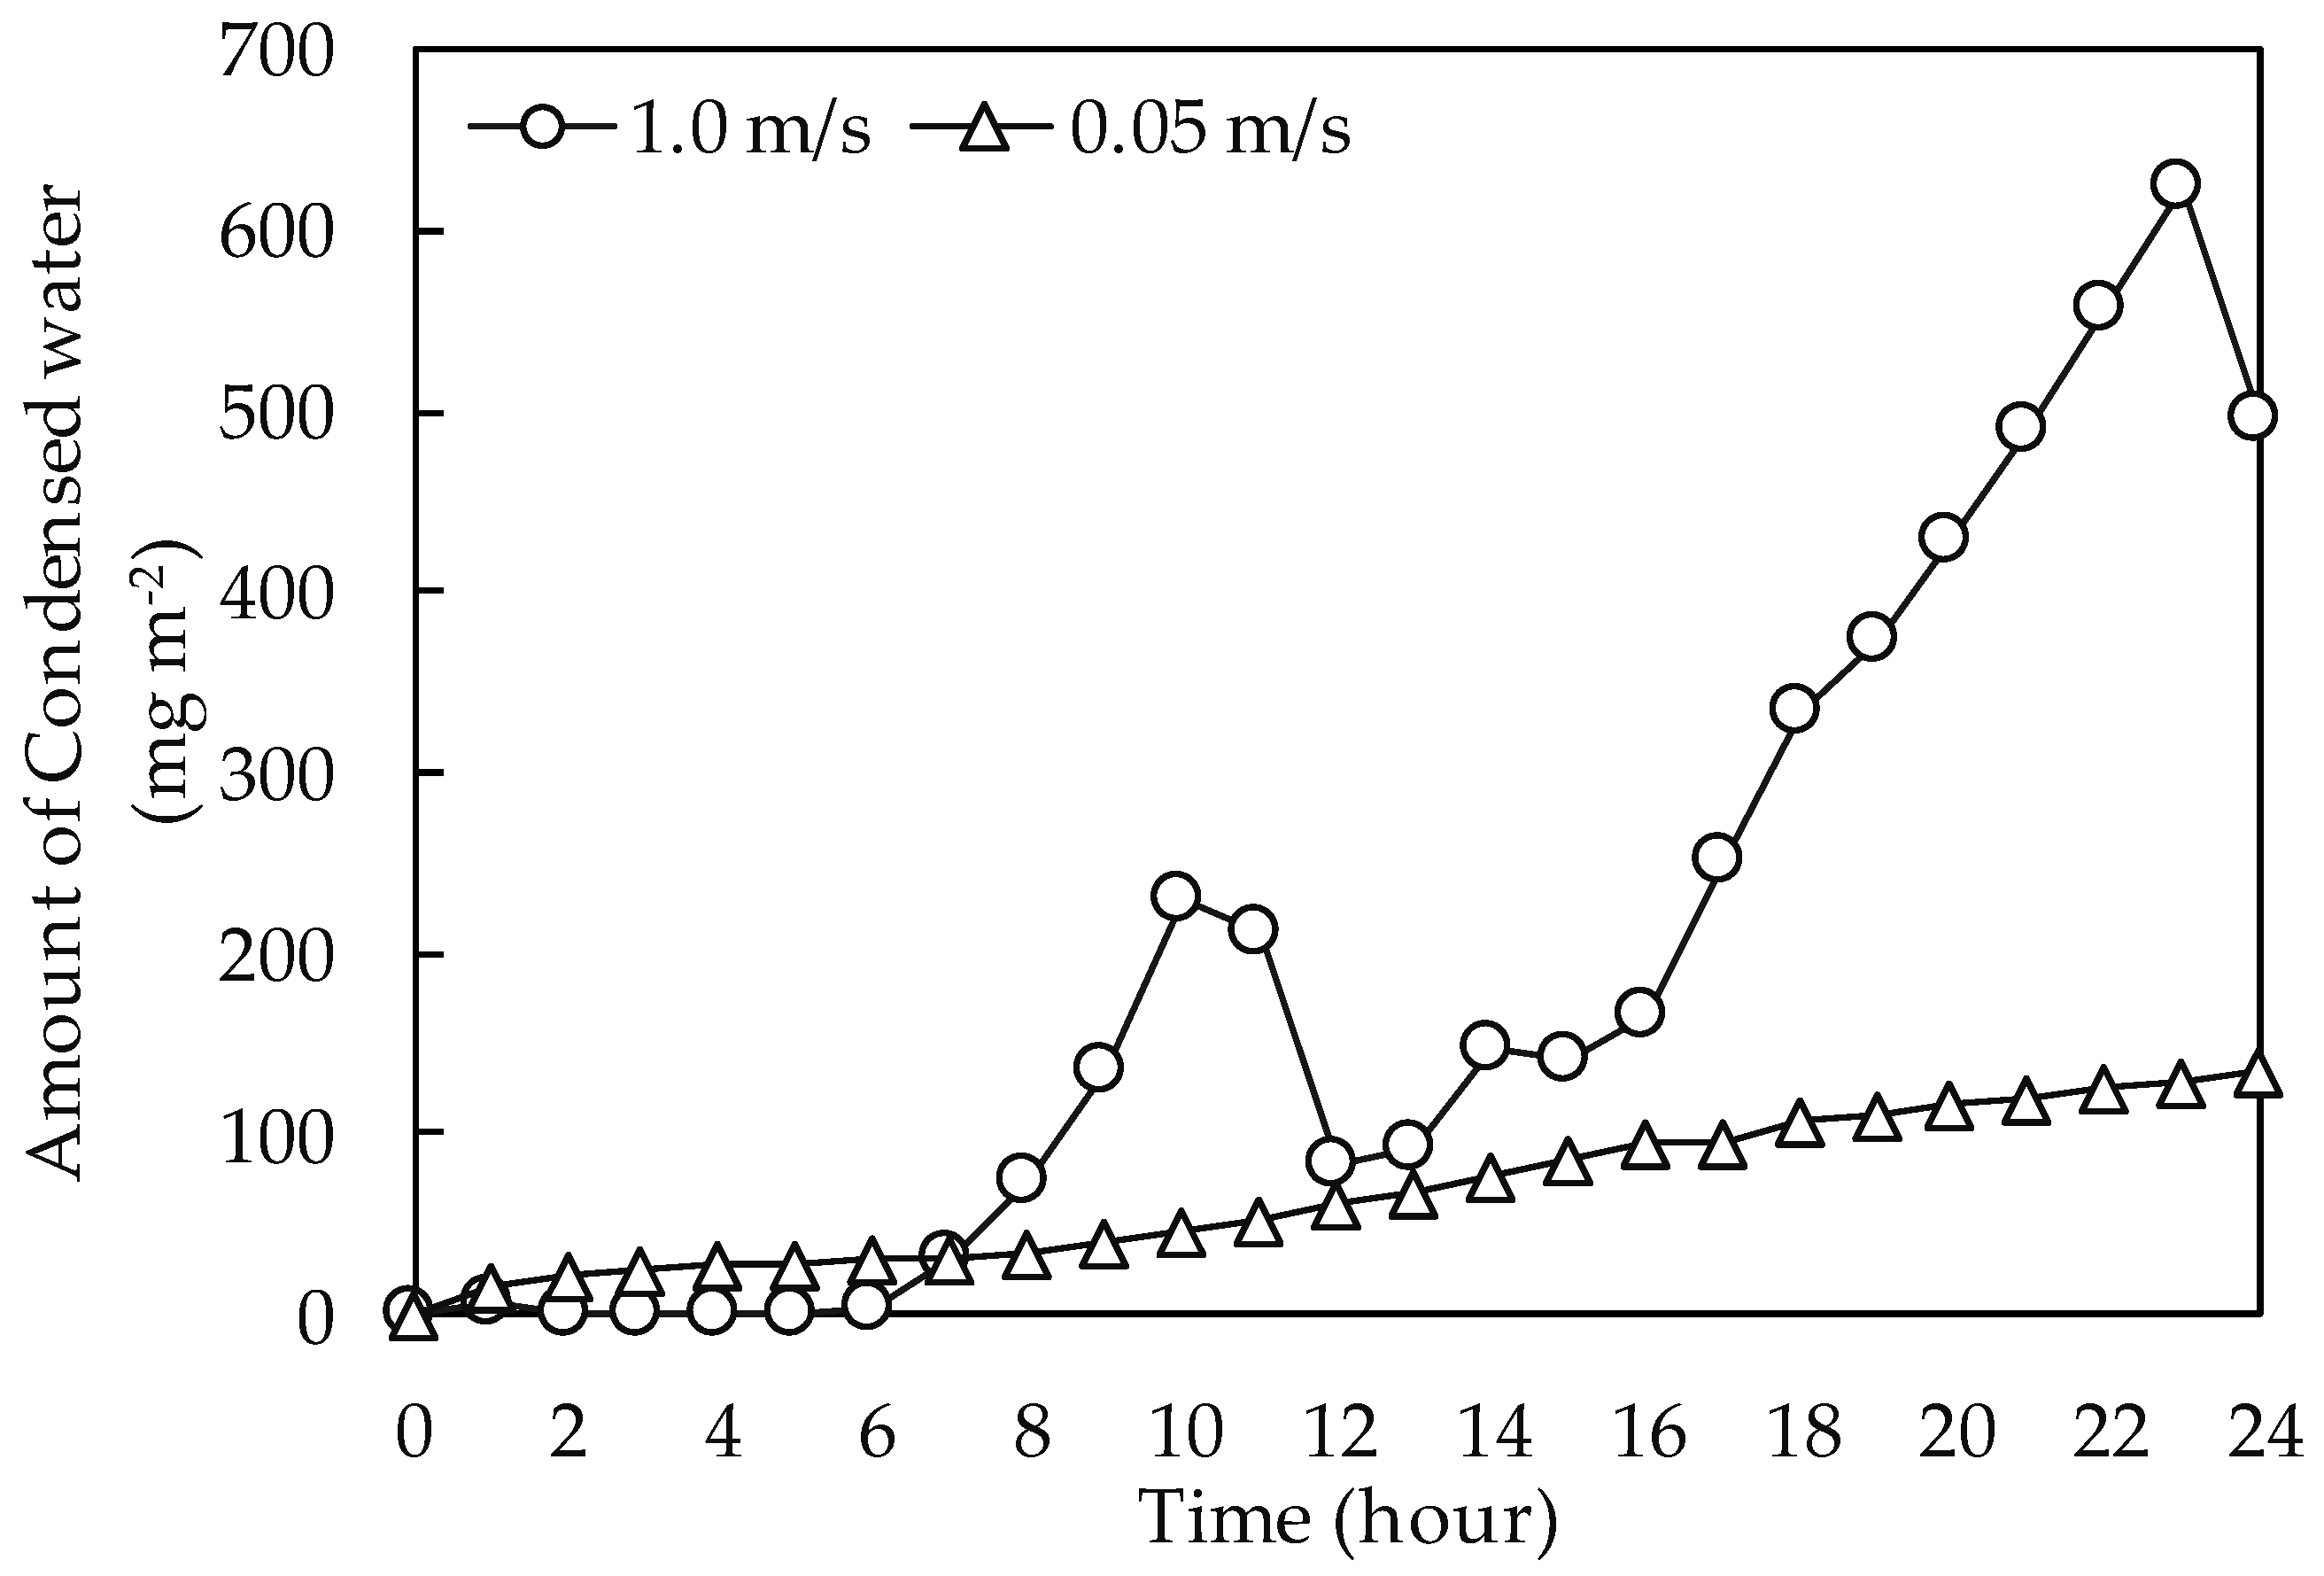
Figure 17.
Variation in the condensed water thickness on the surface of the concrete during a day.


Table 1.
The result of the Airflow rate through the underfloor openings.
| Opening | Air Flow Rate ∆Q, m3/h | |
|---|---|---|
| 1 m/s, South | 0.05 m/s, South | |
| E1 | −75.3 * | −0.3 * |
| E2 | −33.9 * | −1.9 * |
| W1 | −54.5 * | −2.2 * |
| S1 | 112.4 | 4.9 |
| S2 | 112.9 | 5.0 |
| N1 | −46.9 * | −1.7 * |
| N2 | −33.5 * | −0.8 * |
* A negative value means that the airflow is from inside to outside.
Table 2.
The material properties of underfloor ventilation area and physical conditions.
| Material | Density, (kg/m3) | Specific Heat, (J kg−1 K−1) | Thermal Conductivity (W m−1 K−1) | Thickness (m) |
|---|---|---|---|---|
| Concrete | 2240 | 750 | 0.53 | 0.15 |
| Ground (soil) | 1500 | 800 | 0.33 | 0.85 |
| Floor (wood) | 370 | 1900 | 0.11 | 0.012 |
Table 3.
Boundary and calculation conditions.
| Turbulence model | Realizable k–ε turbulence model |
| Algorithm | SIMPLE |
| Convection | Upwind second-order difference |
| Numerical schemes | QUICK |
| Time dependence | Transient calculation |
| Room size | Described in Figure 9 |
| Inlet | Velocity (VS), Temperature (TS), Humidity (WS) |
| Outflow | Calculated with mass balance |
| Concrete-side wall | Standard log-law, emissivity = 0.95 |
| Floor-side wall | Standard log-law, emissivity = 0.95 |
| Initial conditions | Concrete: 20 °C, Floor: 25 °C |
Table 4.
Initial conditions of the film thickness of water on surface of the concrete for the CFD analysis.
Table 4.
Initial conditions of the film thickness of water on surface of the concrete for the CFD analysis.
| Outdoor Condition (25 °C) | Initial Water Thickness on Surface of the Concrete (m) | |||
|---|---|---|---|---|
| Humidity (%) | Wind Speed (m/s) | Wind Direction | ω = 1 | ω = 0 |
| 0 | 1.0 | South | 0.01 | 0 |
| 10 | 0.01 | 0 | ||
| 30 | 0.01 | 0 | ||
| 50 | 0.01 | 0 | ||
| 70 | 0.01 | 0 | ||
| 90 | 0.01 | 0 | ||
| 100 | 0.01 | 0 | ||
| 0 | 0.05 | 0.01 | 0 | |
| 10 | 0.01 | 0 | ||
| 30 | 0.01 | 0 | ||
| 50 | 0.01 | 0 | ||
| 70 | 0.01 | 0 | ||
| 90 | 0.01 | 0 | ||
| 100 | 0.01 | 0 | ||
Table 5.
Water thickness on the surface of the concrete relevant to the outdoor conditions.
| Outdoor Condition (25 °C) | Evaporation and Condensation Rate (mg m−2 h−1) | |||
|---|---|---|---|---|
| Humidity (%) | Wind Speed (m/s) | Wind Direction | ω = 1 | ω = 0 |
| 0 | 1.0 | South | −12.3 | 0 |
| 10 | −10.8 | 0 | ||
| 30 | −7.8 | 0 | ||
| 50 | −4.7 | 0 | ||
| 70 | −1.6 | 0 | ||
| 90 | 0.4 × 10⁻³ | 0.5 × 10⁻³ | ||
| 100 | 0.5 × 10⁻³ | 0.5 × 10⁻³ | ||
| 0 | 0.05 | −0.5 | 0 | |
| 10 | −0.4 | 0 | ||
| 30 | −0.3 | 0 | ||
| 50 | −0.2 | 0 | ||
| 70 | −0.05 | 0 | ||
| 90 | 0 | 0.7 × 10⁻⁴ | ||
| 100 | 0.7 × 10⁻⁴ | 0.7 × 10⁻⁴ | ||
(+): Positive value corresponds to the condensation. (−): Negative value corresponds to the evaporation.
© 2017 by the authors. Licensee MDPI, Basel, Switzerland. This article is an open access article distributed under the terms and conditions of the Creative Commons Attribution (CC BY) license (http://creativecommons.org/licenses/by/4.0/).
Share and Cite
MDPI and ACS Style
Oh, W.; Kato, S. Study on the Effects of Evaporation and Condensation on the Underfloor Space of Japanese Detached Houses Using CFD Analysis. Energies 2017, 10, 798. https://doi.org/10.3390/en10060798
AMA Style
Oh W, Kato S. Study on the Effects of Evaporation and Condensation on the Underfloor Space of Japanese Detached Houses Using CFD Analysis. Energies. 2017; 10(6):798. https://doi.org/10.3390/en10060798
Chicago/Turabian StyleOh, Wonseok, and Shinsuke Kato. 2017. "Study on the Effects of Evaporation and Condensation on the Underfloor Space of Japanese Detached Houses Using CFD Analysis" Energies 10, no. 6: 798. https://doi.org/10.3390/en10060798
Note that from the first issue of 2016, this journal uses article numbers instead of page numbers. See further details here.