
An Efficient Reactive Power Control Method for Power Network Systems with Solar Photovoltaic Generators Using Sparse Optimization

Mechanical Dynamics Laboratory, Department of Mechanical Engineering, Osaka University, M4-505, 2-1 Yamadaoka, Suita, Osaka 565-0871, Japan
*
Author to whom correspondence should be addressed.
Energies 2017, 10(5), 696; https://doi.org/10.3390/en10050696
Submission received: 26 March 2017
/
Revised: 9 May 2017
/
Accepted: 11 May 2017
/
Published: 16 May 2017
(This article belongs to the Special Issue Control and Communication in Distributed Generation Systems)
Abstract
:With the incremental introduction of solar photovoltaic (PV) generators into existing power systems, and their fast-growing share in the gross electricity generation, system voltage stability has become a critical issue. One of the major concerns is voltage fluctuation, due to large and random penetration of solar PV generators. To suppress severe system voltage deviation, reactive power control of the photovoltaic system inverter has been widely proposed in recent works; however, excessive use of reactive power control would increase both initial and operating costs. In this paper, a method for efficient allocation and control of reactive power injection using the sparse optimization technique is proposed. Based on a constrained linearized model describing the influence of reactive power injection on voltage magnitude change, the objective of this study is formulated as an optimization problem, which aims to find the best reactive power injection that minimizes the whole system voltage variation. Two types of formulations are compared: the first one is the conventional least-square optimization, while the second one is adopted from a sparse optimization technique, called the constrained least absolute shrinkage and selection operator (LASSO) method. The constrained LASSO method adds -norm penalty to the total reactive power injection, which contributes to the suppression of the number of control nodes with non-zero reactive power injection. The authors analyzed the effectiveness of the constrained LASSO method using the IEEE 39-bus and 57-bus power network as benchmark examples, under various PV power generation and allocation patterns. The simulation results show that the constrained LASSO method automatically selects the minimum number of inverters required for voltage regulation at the current operating point.
1. Introduction
Promotion of electricity production with renewable energy sources delivers significant ecological and economic benefits to the world’s sustainable development. Global electricity production from renewable energy reached a production share by the end of 2015 [1]. Among all the renewable energy sources, the falling cost of the solar photovoltaic system (PV) brings incremental demands for its power system integration, which expands the electricity production share of PV in both the industrial and residential market, and makes PV one of the most fast-growing renewable sources of electricity [2,3]. Meanwhile, the widespread use of PV also challenges the existing power system to ensure its power quality. One of the major concerns is system voltage variation caused by power flow from the grid-connected PV [4], where a grid-connected PV compensates the power demand of its integrated consumer bus with solar power generation and delivers excess power to the utility grid as a reverse power flow. These two processes may result in voltage exceeding or decreasing beyond its permitted operation limit [5,6,7].
Since the power flow from PV generation induces voltage variation to the power system, several studies have concentrated on the optimal allocation and sizing of the grid-connected PV to improve the overall system voltage profile through strategic planning [8,9,10]. Unfortunately, practical location or size of PV is usually a matter of customer’s choice [4], and the exponential growth of PV integration may significantly influence the voltage quality of the utility grid without appropriate technical support for voltage regulation, as the power system operates only within a permitted range of voltage. Namely, the large penetration of randomly allocated PV demands effective voltage control methods to suppress system voltage deviation and sustain power system voltage stability [7].
Reactive power control of the PV inverter has been widely proposed to regulate voltage deviation with respect to high and random allocated PV generation in recent works. Smith et al. [11] and Turitsyn et al. [12] discussed the benefits of utilizing local inverter reactive power to control voltage deviation, and proposed several control functions of inverter reactive power with respect to voltage state. On the contrary, the IEEE 1547 standard for interconnecting distributed resources with a power system forbids reactive power injection from distributed resources in current state due to safety concerns [13]. Thus, massive reactive power control of grid-connected PV inverters would be difficult to realize in a power system with high and random allocated PV generators. Excessive use of reactive power control would also increase both initial and operating costs. In this paper, we propose a method for efficient allocation and control of reactive power injection using sparse optimization technique to realize the voltage regulation with less choice of PV inverters.
In the authors’ previous works [14,15], statistical and worst-case analyses of voltage stability were conducted under a completely random distribution of PV generators. The authors then pointed out that the voltage stability may be spoiled under local reactive power control, for some dangerous choices of PV allocations. These results motivate the authors to consider the importance of allocation of both PV generators and reactive power controllers, and to consider better allocation of reactive power controllers with limited control effort. Now, to begin this study, a constrained linear relation between inverter reactive power change and voltage magnitude change is derived from linearized power flow equations with PV power generation at the current system operating point [16,17]. Based on the constrained linear model, the study objective is formulated as an optimization problem to find the best reactive power injection that minimizes the system voltage variation. Two types of formulations are compared: the first one is the conventional least-square optimization, while the second one is adopted from a sparse optimization technique, called the constrained least absolute shrinkage and selection operator (LASSO) method [18,19]. The constrained LASSO method is characterized by a -norm penalty on its regression coefficients, which is added to the reactive power change in this study. The -norm penalty contributes to the reduction of some estimates of the reactive power change towards zero and selects fewer PV inverters to interpret the strongest feature of the provided model [20,21].
The resulting sparsity and effectiveness of the constrained LASSO method were compared with the corresponding results of the constrained least-square method. Analyses of voltage regulation with these methods were conducted on two benchmark power networks: 39-bus and 57-bus power systems, under various PV power generation and allocation patterns. The 39-bus and 57-bus power systems consist of different network topologies, initial system parameters, and size of consumer power demands. Analysis results on the two systems contributed to fully illustrate the performance of the proposed method.
This manuscript is organized as follows: Section 2 formulates power flow equations in the PV integrated power system; Section 3 derives a constrained linear mathematical relation between voltage change and PV inverter reactive power change from the power flow equations in Section 2, and adapts the constrained LASSO method based on this linear model to conduct inverter reactive power control for voltage regulation; Section 4 analyzes the effectiveness of the constrained LASSO method on voltage regulation in PV integrated power systems with respect to various amounts of PV generation and allocation patterns; Section 5 summarizes the conclusions of this study, and discusses our future works.
2. Power Flow Model
To conduct an analysis of voltage regulation with a PV integrated power system, power flow equations with PV integration are formulated in this section. Assume a power system is composed of n buses and m generators. Let be the set of indices of all buses; the buses are sorted into the following three types:
- Reference bus: One generator is selected as the reference bus; let denote the set of bus indices.
- Generator buses: Let denote the set of bus indices, which is composed of buses.
- Consumer buses: Let denote the set of bus indices (the subscript “d” stands for “demand”.), which is composed of buses.
The power flow equations can be described as follows [22]:
where and are net real power and reactive power balance at bus i and j. and are the real and the imaginary parts of the element in the bus admittance matrix corresponding to the ith row and sth column, and and correspond to its jth row and sth column. and are the difference of voltage angle between the respective two index buses. and are vectors of real and reactive power demand at consumer buses, which are assumed constant and given. and are vectors of real and reactive power generation at generator buses, is assumed given. , is the vector of voltage magnitudes; , is the vector of voltage phase angles. Equation (1) characterizes the real and reactive power balance for all buses, which is formulated to solve unknown voltage magnitudes and voltage angles.
When PV generators connect with the power system, power generation of PV flows into the PV-enabled consumer buses, and excess power injects into the utility grid. The power demand of consumer buses could be modified in Equation (1) as below:
where and are vectors of real and reactive power from PV generators respectively, and are the original vectors of real and reactive power demand of the consumer buses respectively. Power flow with PV integration could be solved using Equations (1) and (2). The Matpower software is used to solve the power flow equations in this study [23].
3. Reactive Power Control Scheme Using Sparse Optimization
In this section, a reactive power control scheme for voltage regulation is proposed, with the aid of the sparse optimization technique. First, a linearized relation between the reactive power injection and the resulting voltage change is derived from the original nonlinear power flow model, under the constraint of constant real power injection. Then, the voltage regulation problem is formulated so as to minimize the regulation error subject to inverter capability constraints, with two types of penalty functions: a standard least-square method is introduced in the Section 3.2, while the constrained LASSO method is introduced in the Section 3.3 in order to pick up essential inverters for voltage regulation to suppress the effort of reactive power injection.
3.1. Linearized Model
First, the nonlinear power flow Equation (1) is linearized by taking its gradient at the operating point, as in the manner of [24]:
where the Jacobian matrix J in Equation (3) consists of partial derivatives of the power flow Equation (1) with respect to voltage angle vector and voltage magnitude vector V, evaluated at the current system operating point.
Assume that the real power demand at the consumer buses and the real power injection at PV-enabled buses do not change during the voltage regulation period, and the generator buses sustain their power production at the operating point, the constraint of real power is obtained as:
substitute Equations (4) and (5) for Equation (3), which gives [16]:
where .
Similarly, the reactive power demand at consumer buses without PV integration remains the same at the operating point, thus, reactive power change at consumer buses without PV integration would be zero. Let denote the set of PV-enabled bus indices; the constraint is described as:
Rearrange the sequence of non-PV integrated consumer buses and PV-enabled consumer buses in Equation (6), and reformulate it as follows [17]:
where and denote vectors of voltage magnitude change at non-PV consumer buses and PV-enabled consumer buses respectively; represents the vector of reactive power change at PV-enabled consumer buses; matrix B is the reformulated version of matrix . From Equation (8), the relation between and can be described as:
where . Thus:
based on Equation (10), we regulated the voltage variation with the reactive power change of PV inverters in this study. Let and be the reference voltage.
3.2. Constrained Least-Square Method
A simple and direct approach of reactive power control with the constrained linear model of Equation (10) is the constrained least-square method, which finds the best injection of reactive power that minimizes the pre-designed response vector of voltage magnitude change in terms of the sum of the squared residuals. The corresponding optimization problem can be expressed as follows:
where is the inverter-apparent power capability, is the real power injection of PV at k-th bus, and the total number of integrated PV generators is K.
However, the solution to the constrained least-square method tends to contain all non-zero entries, and all grid-connected PV inverters may need to participate in the reactive power control. To overcome the drawback of the constrained least-square method, the authors propose the adoption of the constrained LASSO method to suppress the number of non-zero entries in the optimizing solution.
3.3. Constrained Least Absolute Shrinkage and Selection Operator (LASSO) Method
The original LASSO problem modifies the least square problem by adding the -norm penalty to its regression coefficients, [20,21], which is described as:
LASSO shrinks some coefficient estimates in towards 0 due to the -norm penalty. The -norm penalty could contribute to the reformation of the optimal solutions of the inverter reactive power set point formed by the least-square method, characterize the covariance of , and select the least essential PV inverters for voltage regulation.
As the reactive power capability of the PV inverter is limited by its physical components, constrained LASSO is employed in the constrained linear model [18,19], which allows prior constraints on to be added to the original LASSO problem. The constrained LASSO is demonstrated as below:
where is a tuning parameter that determines the shrinkage of , and thus controls the minimum required number of PV inverters instead of all integrated PV generators to regulate system voltage deviation. The constrained LASSO method predicts in a permitted range as well as the constrained least-square method. The effectiveness of the constrained LASSO method on voltage regulation in PV integrated power systems is analyzed under various power generation and allocation patterns of PV.
4. Benchmark Analysis of the Proposed Method
The 39-bus and 57-bus power systems were taken as benchmark examples to analyze the performance of voltage regulation schemes. The 39-bus and 57-bus power systems consist of different network topologies, initial system parameters, and size of consumer power demands. The 39-bus power system is generally representative of the New England power system, with 10 generators, 46 branches, 29 consumer buses, and large size of power demands allocated among consumer buses [25]. The 57-bus power system represents a simple approximation of the American power system, with seven generators, 80 branches, 50 consumer buses, and relatively small size of consumer power demands sited among consumer buses [26]. The analysis results of the two systems were compared to evaluate the performance of the LASSO method which resulted in similar tendencies in the effects of voltage regulation. The 39-bus power system is mainly chosen to demonstrate the results; the basic information of this system is shown in Figure 1a. Figure 1b shows the associated benchmark data. The buses from 1 to 29 are consumer buses, where the blue bars indicate real power demand and the yellow bars are for reactive ones. The buses from 30 to 39 are generator buses, the red bars are for real power generation and the black bars are for reactive ones. Using the power flow Equation (1), we can compute the voltage of each bus as shown in Figure 1c. Note that this is computed under the absence of PV generation. The voltage profile would change in the presence of PV generators, and we will analyze its influence in the following subsections.
4.1. Performance Indices
Before discussing the analysis results, we introduce three indices—MSE, VSM and RP—to evaluate the performance of control schemes. MSE is for the precision of voltage regulation, VSM is for the voltage stability margin and RP is for the control cost.
4.1.1. Mean Square Error of Voltage Magnitudes
In order to measure the achievement of voltage regulation, we first introduce the mean square error. Let be the reference voltage, and be the resulting voltages in the presence of PV generators and with voltage regulation under consideration. The mean square error of voltage magnitudes, MSE for short, is given as:
less MSE implies better performance in voltage regulation .
4.1.2. Voltage Stability Margin with Continuation Power Flow Method
Apart from the mean square error of voltage magnitudes, voltage stability margin is induced to evaluate the voltage stability and system capability of PV integration in a power system with/without reactive power control schemes. This value is computed with the continuation power flow method.
The continuation power flow method solves power flow solutions with respect to continuous power change, which characterizes voltage stability with a P–V nose curve starting at some base point to the voltage stability limit (critical point) [27,28]. Assume , the continuous power flow, CPF for short, could be described as a function of x:
where represents base power flow at the starting point, is a continuous parameter which expresses the continuation process of power variation in CPF, and b is one vector of power transfer. While PV power flows into the power system, the elements of b could be composed as:
where , and , are the vectors of base power injection and target power injection in the power system. The effects of PV real and reactive power integration on voltage stability could be analyzed by varying the value of and . An example of nose curve at one bus i is shown in Figure 2, which expresses the relation between voltage magnitude and power injection at the bus; is the voltage stability limit (critical) point, is the current operating point.
In this study, the voltage stability margin is designed as the relative distance between the PV power integration limit point, and current system operating power, , over the current system operating power, . The sum of this value in the power system is defined as the whole system voltage stability margin here, which is described as:
clearly from its definition, takes a non-positive value. Therefore, the performance would be better if becomes smaller (or becomes larger).
4.1.3. Net Absolute Reactive Power Generation
Finally, an index is designed to evaluate control cost. The is defined as the sum of absolute reactive power generation at all inverters, namely:
less implies better performance. The decrease of is expected by using the constrained LASSO instead of the constrained least-square method, thanks to the sparsity of the optimizing solution. This will be verified in the next subsection.
4.2. Results
Based on the indices defined above, the effectiveness of voltage regulation schemes was analyzed by comparing difference among three cases (without any reactive power control, the constrained least-square method and the constrained LASSO method). The authors also compared two patterns of PV assignment conditions: one is to uniformly distribute PV generators to all the consumers, the other is to distribute PV generators in proportion to the consumer demands. Note that, in the following analyses, the reference voltage is set as the voltage profile in the absence of PV generators.
4.2.1. Uniform Distribution of PV Generators
In this case, the amount of real PV power generation at each bus is determined as follows. First, the total real power generation by PV is fixed, in terms of its share ratio to the total consumer demands (ranging from 5% to 45% in this case). Second, the total amount of PV generation is divided into small pieces, say a PV piece. (For example, if the total amount is 100 p.u. and the amount of a PV piece is 0.2 p.u., then there will be 500 PV pieces. ) Third, each PV piece is randomly assigned to one of the consumer buses, under uniform probabilistic distribution. The resulting PV power generation at a consumer bus is the sum of all the PV pieces assigned to the bus.
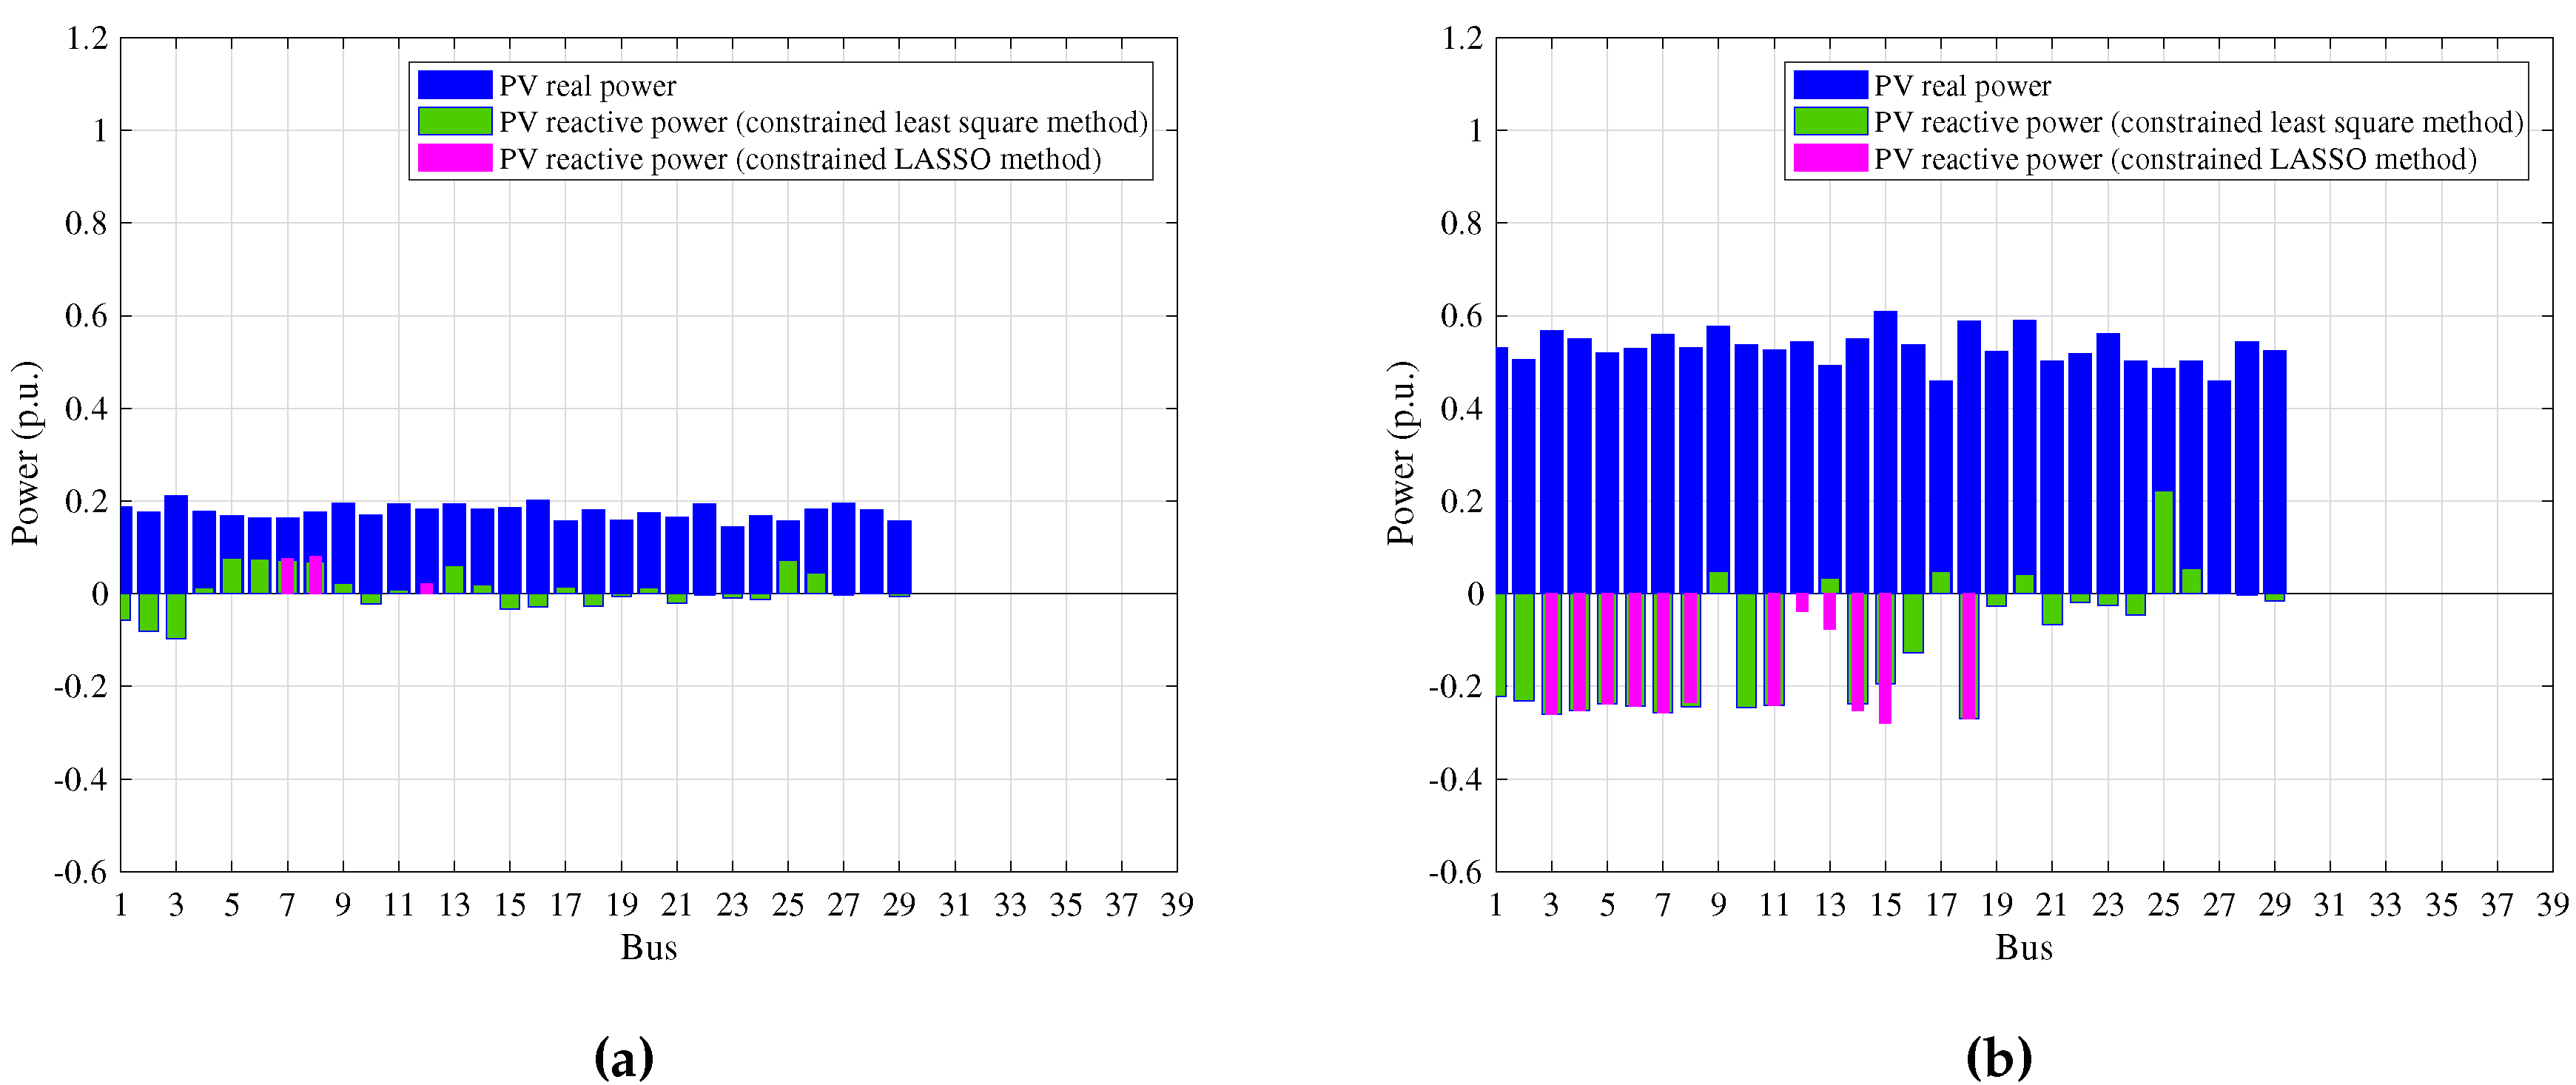
Two examples are shown in Figure 3. Figure 3a shows a case where PV power generation is 10% of the net real power demand, while Figure 3b shows a case where it is 30% of the demand. The blue bars show PV power generation at each bus, the green bars show reactive power generated by the least-square control method, and the magenta ones show reactive power generated by the LASSO method. We roughly notice that there are less magenta bars than green ones. This suggests that the LASSO method requires fewer reactive inverters than the least-square method.
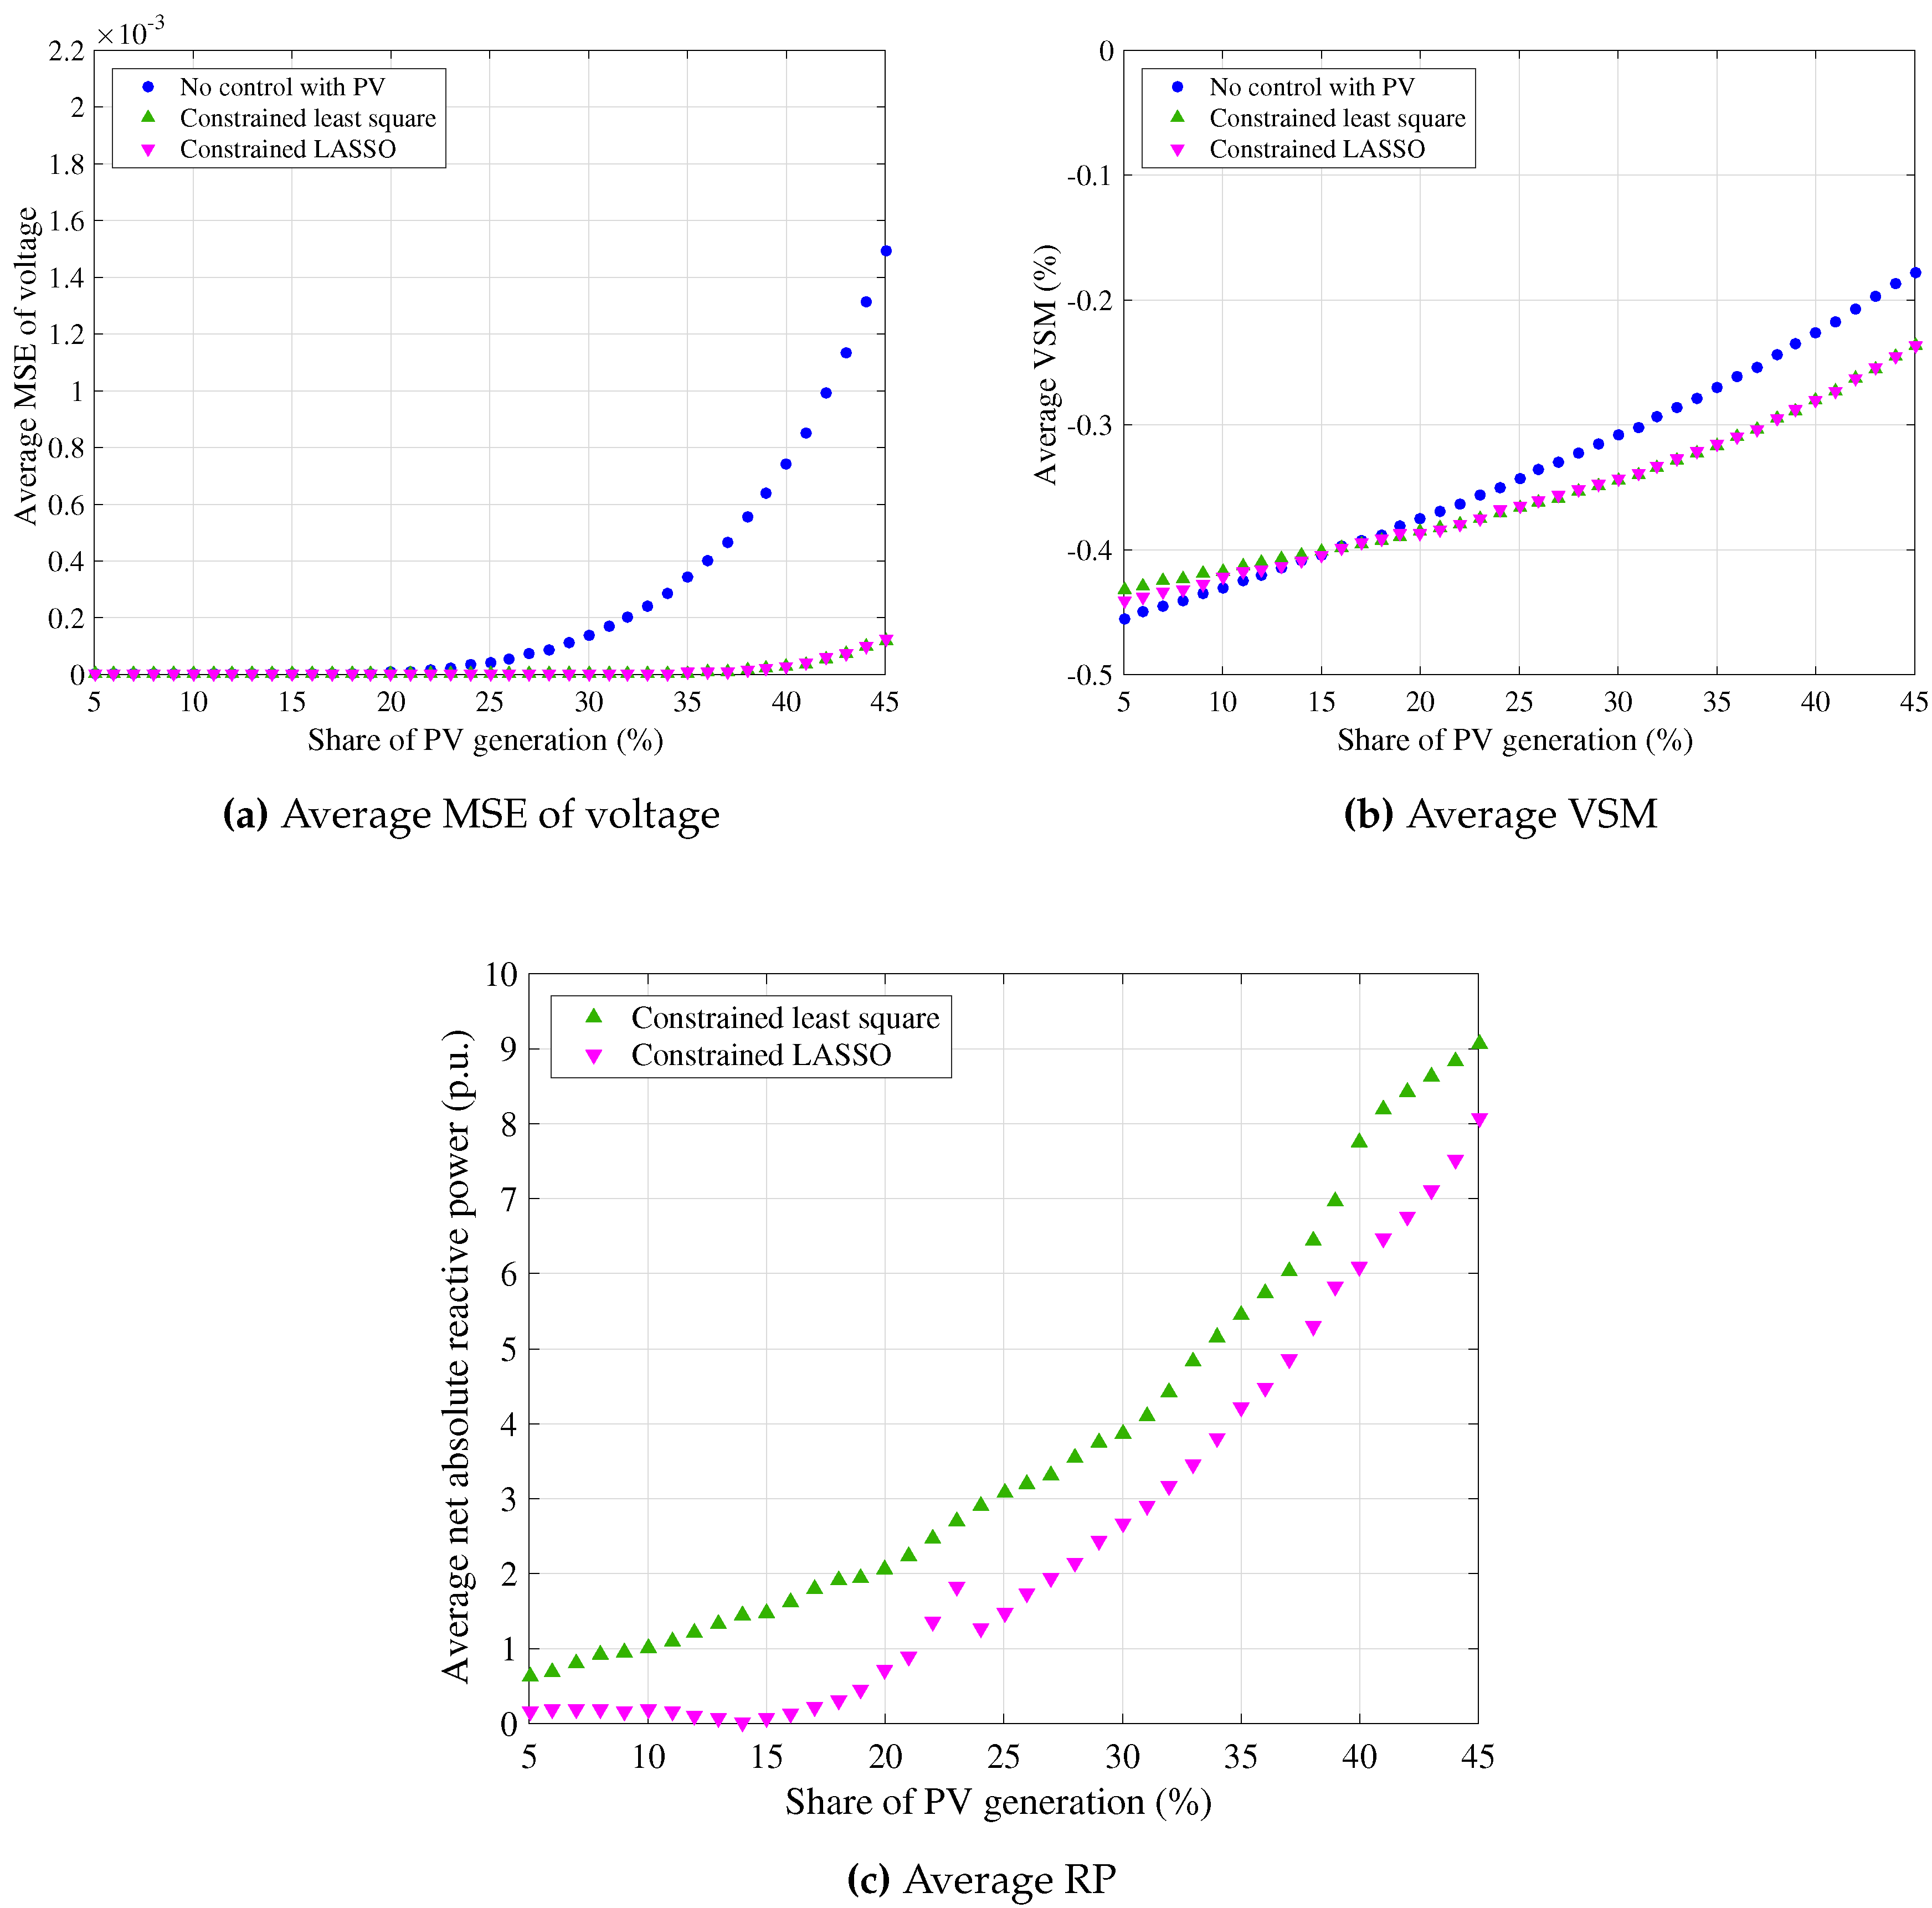
Let us go into a more detailed analysis. The share ratio of the net PV generation amount to the consumer demands was scanned, ranging from 5% to 45%. For each choice of the share ratio, random distributions were repeated 5 times. The averages of the corresponding indices (MSE, VSM and RP) over five trials are shown in Figure 4. The average of voltage in Figure 4a shows that voltage magnitude varies severely with respect to the increase of PV power integration when no voltage regulation is applied to the PV inverters. Meanwhile, the constrained least-square method and constrained LASSO method control voltage deviation effectively compared with the no control case. The average in Figure 4b shows that the voltage stability of the 39-bus power system decreases with respect to the growth of PV generation, although the PV inverter reactive power control with the constrained least-square and constrained LASSO method results in the improvement of system voltage stability compared with the no control case. In addition, the results in Figure 4a,b explain that the constrained least-square method and constrained LASSO method show very similar effectiveness on voltage regulation. However, the net absolute reactive power generation from PV, with respect to the increasing PV power generation plotted in Figure 4c, shows that voltage regulation with the constrained LASSO method results in less reactive power generation from PV inverters than with the constrained least-square method. In other words, the constrained LASSO method succeeds in selecting the minimum required number of PV inverters to control voltage variation, while maintaining the same effectiveness on voltage regulation as the constrained least-square method.
4.2.2. On-Demand Distribution of PV Generators
As opposed to the previous case, the authors consider the non-uniform, weighted distribution of PV generators, meaning that PV generators are only assigned to consumer buses with real power demand. In this case, the real power generation of PV at each bus is proportional to the consumer real power demand at the bus, where the PV/demand ratio is equal at each PV-enabled bus. The share ratio also ranges from to . The authors name this case as on-demand distribution of PV power generators. The corresponding indices (MSE and RP) are shown in Figure 5. The net absolute reactive power generation from PV results in smaller value with the constrained LASSO method than with the constrained least-square method in Figure 5b. The constrained LASSO method shrinks the amount of inverter reactive power generation in the case of the on-demand distribution of PV generators. However, MSE of voltage varies severely with respect to the increase of PV real power generation in Figure 5a. The main reason is the validity of the linearization technique employed while formulating the control schemes. The linearization of power flow Equation (1) induces computing error to the voltage regulation process, and the reactive power constraint shown in Equation (7) accumulates this error when the number of PV-enabled buses declines. In the 39-bus power system, the number of PV-enabled consumer buses decreases in the on-demand case, since there is no power demand at some of the consumer buses. Consequently, the potential voltage regulation points of PV inverters became fewer, which impacted the precision of voltage regulation (MSE) to a certain extent. However, the authors consider that proper reference voltage design may suppress the computing error and improve the performance of MSE; a comprehensive study on this topic is left for future work.
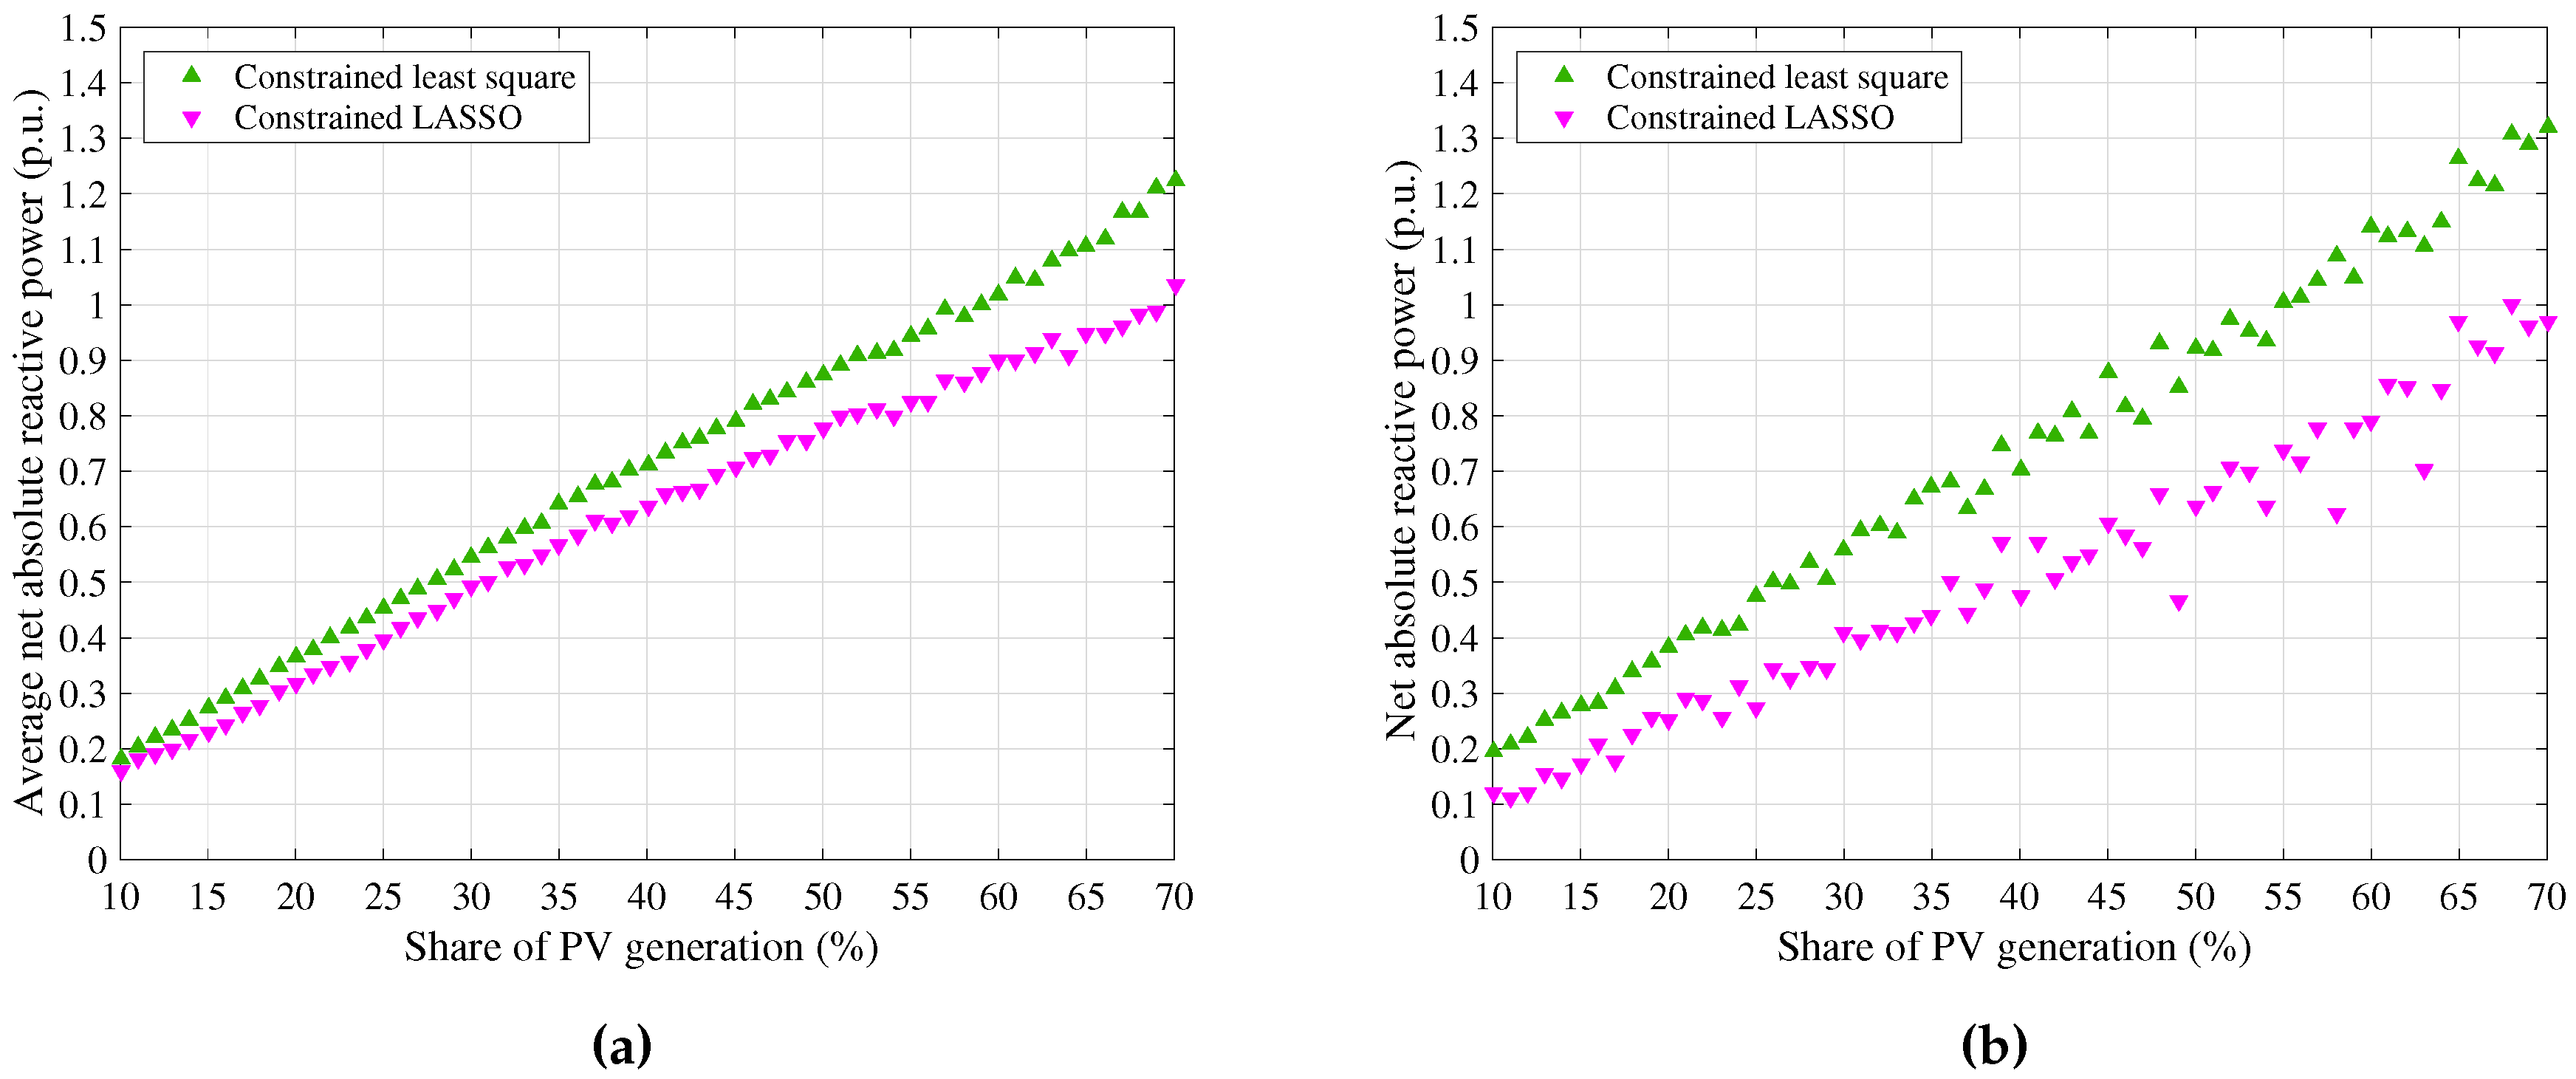
Besides the 39-bus power system, the authors also conducted the same above-mentioned analyses on an IEEE benchmark power system, called the 57-bus power system. The net absolute reactive power from PV generators in the uniform distribution case and on-demand case is shown in Figure 6, which demonstrates the same characteristics as the 39-bus power system. Thus, the authors conclude that the constrained LASSO method with -norm penalty performs sparse optimization of reactive power generation on voltage regulation in a power system with PV generation.
5. Conclusions
In this study, the authors concentrated on voltage regulation with reactive power control in a power system with high and random PV generation. A constrained linear model was derived describing voltage magnitude change and PV inverter reactive power change. The constrained LASSO method was adapted based on the constrained linear model to optimize the set point of reactive power. The -norm penalty in the constrained LASSO method contributed to the selection of the least essential PV inverters to minimize system voltage variation. For comparison, the same optimization problem was formulated with the conventional least-square method. The net absolute reactive power generation of PV inverters (RP), voltage stability margin (VSM) and mean square error of voltage magnitude (MSE) were computed to evaluate the optimization results of the constrained LASSO method and the constrained least-square method. Analyses were conducted on benchmark examples of the 39-bus power system and 57-bus power system, and the authors succeeded in obtaining sparse solutions for distributed reactive power control, which enabled the selection of the minimum required number of inverters for voltage regulation without losing control performance. To further improve voltage regulation quality, the proper design of the reference voltage in the control schemes, comparison of other types of local control schemes for inverters (while some of them were examined in our previous works), and the expansion of the operating range due to linearization approximation, are left for future research.
Acknowledgments
Yu Li thanks the China Scholarship Council overseas study program for partially supporting her doctoral course study.
Author Contributions
All authors contributed in preparing of the manuscript. Yu Li has performed the literature survey and simulation analysis under the supervision of Masato Ishikawa. Masato Ishikawa guided Yu Li on the development of this paper, and revised the manuscript.
Conflicts of Interest
The authors declare no conflict of interest.
References
- REN21. Renewables 2016 Global Status Report; REN21 Secretariat: Paris, France, 2016. [Google Scholar]
- Mueller, S.; Frankl, P.; Sadamori, K. Next Generation Wind and Solar Power From Cost to Value; International Energy Agency: Paris, France, 2016. [Google Scholar]
- Philibert, C.; Frankl, P.; Tam, C.; Abdelilah, Y.; Bahar, H.; Marchais, Q.; Mueller, S.; Remme, U.; Waldron, M.; Wiesner, H. Technology Roadmap Solar Photovoltaic Energy; International Energy Agency: Paris, France, 2014. [Google Scholar]
- Borges, C.L.; Falcão, D.M. Impact of distributed generation allocation and sizing on reliability, losses and voltage profile. In Proceedings of the 2003 IEEE Bologna Power Tech Conference, Bologna, Italy, 23–26 June 2003; IEEE: Piscataway, NJ, USA; Volume 2, pp. 1–5. [Google Scholar]
- Begović, M.; Pregelj, A.; Rohatgi, A.; Novosel, D. Impact of renewable distributed generation on power systems. In Proceedings of the 34th Hawaii International Conference on System Sciences, Maui, HI, USA, 3–6 January 2001; pp. 2001–2008. [Google Scholar]
- Comfort, R.; Mansoor, A.; Sundaram, A. Power quality impact of distributed generation: Effect on steady state voltage regulation. Proceeding of the PQA 2001 North America Conference, Pittsburgh, PA, USA, 2–7 June 2001. [Google Scholar]
- Barker, P.P.; De Mello, R.W. Determining the impact of distributed generation on power systems. I. Radial distribution systems. Proceedins of the 2000 Power Engineering Society Summer Meeting, Seattle, WA, USA, 16–20 July 2000; IEEE: Piscataway, NJ, USA, 2000; Volume 3, pp. 1645–1656. [Google Scholar]
- Celli, G.; Ghiani, E.; Mocci, S.; Pilo, F. A multiobjective evolutionary algorithm for the sizing and siting of distributed generation. IEEE Trans. Power Syst. 2005, 20, 750–757. [Google Scholar] [CrossRef]
- Abu-Mouti, F.S.; El-Hawary, M. Optimal distributed generation allocation and sizing in distribution systems via artificial bee colony algorithm. IEEE Trans. Power Deliv. 2011, 26, 2090–2101. [Google Scholar] [CrossRef]
- Haghifam, M.R.; Falaghi, H.; Malik, O. Risk-based distributed generation placement. IET Gener. Transm. Distrib. 2008, 2, 252–260. [Google Scholar]
- Smith, J.; Sunderman, W.; Dugan, R.; Seal, B. Smart inverter volt/var control functions for high penetration of PV on distribution systems. In Proceedings of the 2011 IEEE/PES Power Systems Conference and Exposition (PSCE), Phoenix, AZ, USA, 20–23 March 2011; IEEE: Piscataway, NJ, USA, 2011; pp. 1–6. [Google Scholar]
- Turitsyn, K.; Sulc, P.; Backhaus, S.; Chertkov, M. Options for control of reactive power by distributed photovoltaic generators. Proc. IEEE 2011, 99, 1063–1073. [Google Scholar] [CrossRef]
- Basso, T.S.; DeBlasio, R. IEEE 1547 series of standards: Interconnection issues. IEEE Trans. Power Electron. 2004, 19, 1159–1162. [Google Scholar] [CrossRef]
- Li, Y.; Ishikawa, M. Sensitivity analysis of radially distributed power system under random penetration of photovoltaic generation. In Proceedings of the 2015 10th Asian Control Conference (ASCC), Kota Kinabalu, Malaysia, 31 May–3 June 2005; IEEE: Piscataway, NJ, USA, 2015; pp. 1–6. [Google Scholar]
- Li, Y.; Ishikawa, M. Statistical analysis of power system sensitivity under random penetration of photovoltaic generation. Asian J. Control 2017, in press. [Google Scholar] [CrossRef]
- Gao, B.; Morison, G.; Kundur, P. Voltage stability evaluation using modal analysis. IEEE Trans. Power Syst. 1992, 7, 1529–1542. [Google Scholar] [CrossRef]
- Baran, M.E.; El-Markabi, I.M. A multiagent-based dispatching scheme for distributed generators for voltage support on distribution feeders. IEEE Trans. Power Syst. 2007, 22, 52–59. [Google Scholar] [CrossRef]
- Gaines, B.R.; Zhou, H. Algorithms for Fitting the Constrained Lasso. Available online: https://arxiv.org/abs/1611.01511 (accessed on 13 May 2017).
- James, G.M.; Paulson, C.; Rusmevichientong, P. The Constrained Lasso. Available online: https://pdfs.semanticscholar.org/d018/79fd336ca22556681a313acdbbc7a3be6afd.pdf (accessed on 13 May 2017).
- Tibshirani, R. Regression Shrinkage andSelection via the Lasso. J. R. Stat. Soc. Ser. B (Methodol.) 1996, 58, 267–288. [Google Scholar]
- Efron, B.; Hastie, T.; Johnstone, I.; Tibshirani, R. Least angle regression. Ann. Stat. 2004, 32, 407–499. [Google Scholar]
- Kundur, P.; Balu, N.J.; Lauby, M.G. Power System Stability and Control; McGraw-hill: New York, NY, USA, 1994. [Google Scholar]
- Zimmerman, R.D.; Murillo-Sánchez, C.E.; Thomas, R.J. MATPOWER: Steady-state operations, planning, and analysis tools for power systems research and education. IEEE Trans. Power Syst. 2011, 26, 12–19. [Google Scholar] [CrossRef]
- Deng, J.J.; Chiang, H.D. Convergence region of Newton iterative power flow method: Numerical studies. J. Appl. Math. 2013, 2013, 12. [Google Scholar] [CrossRef]
- Pai, A. Energy Function Analysis for Power System Stability; Springer Science & Business Media: Berlin, Germany, 2012. [Google Scholar]
- Christie, R. IEEE 57-Bus Power System, 1993. Available online: https://www2.ee.washington.edu/research/pstca/pf57/pg_tca57bus.htm (accessed on 13 May 2017).
- Ajjarapu, V.; Christy, C. The continuation power flow: A tool for steady state voltage stability analysis. IEEE Trans. Power Syst. 1992, 7, 416–423. [Google Scholar] [CrossRef]
- Chiang, H.D.; Flueck, A.J.; Shah, K.S.; Balu, N. CPFLOW: A practical tool for tracing power system steady-state stationary behavior due to load and generation variations. IEEE Trans. Power Syst. 1995, 10, 623–634. [Google Scholar] [CrossRef]
Figure 1.
Information of a benchmark example: the 39-bus power system.
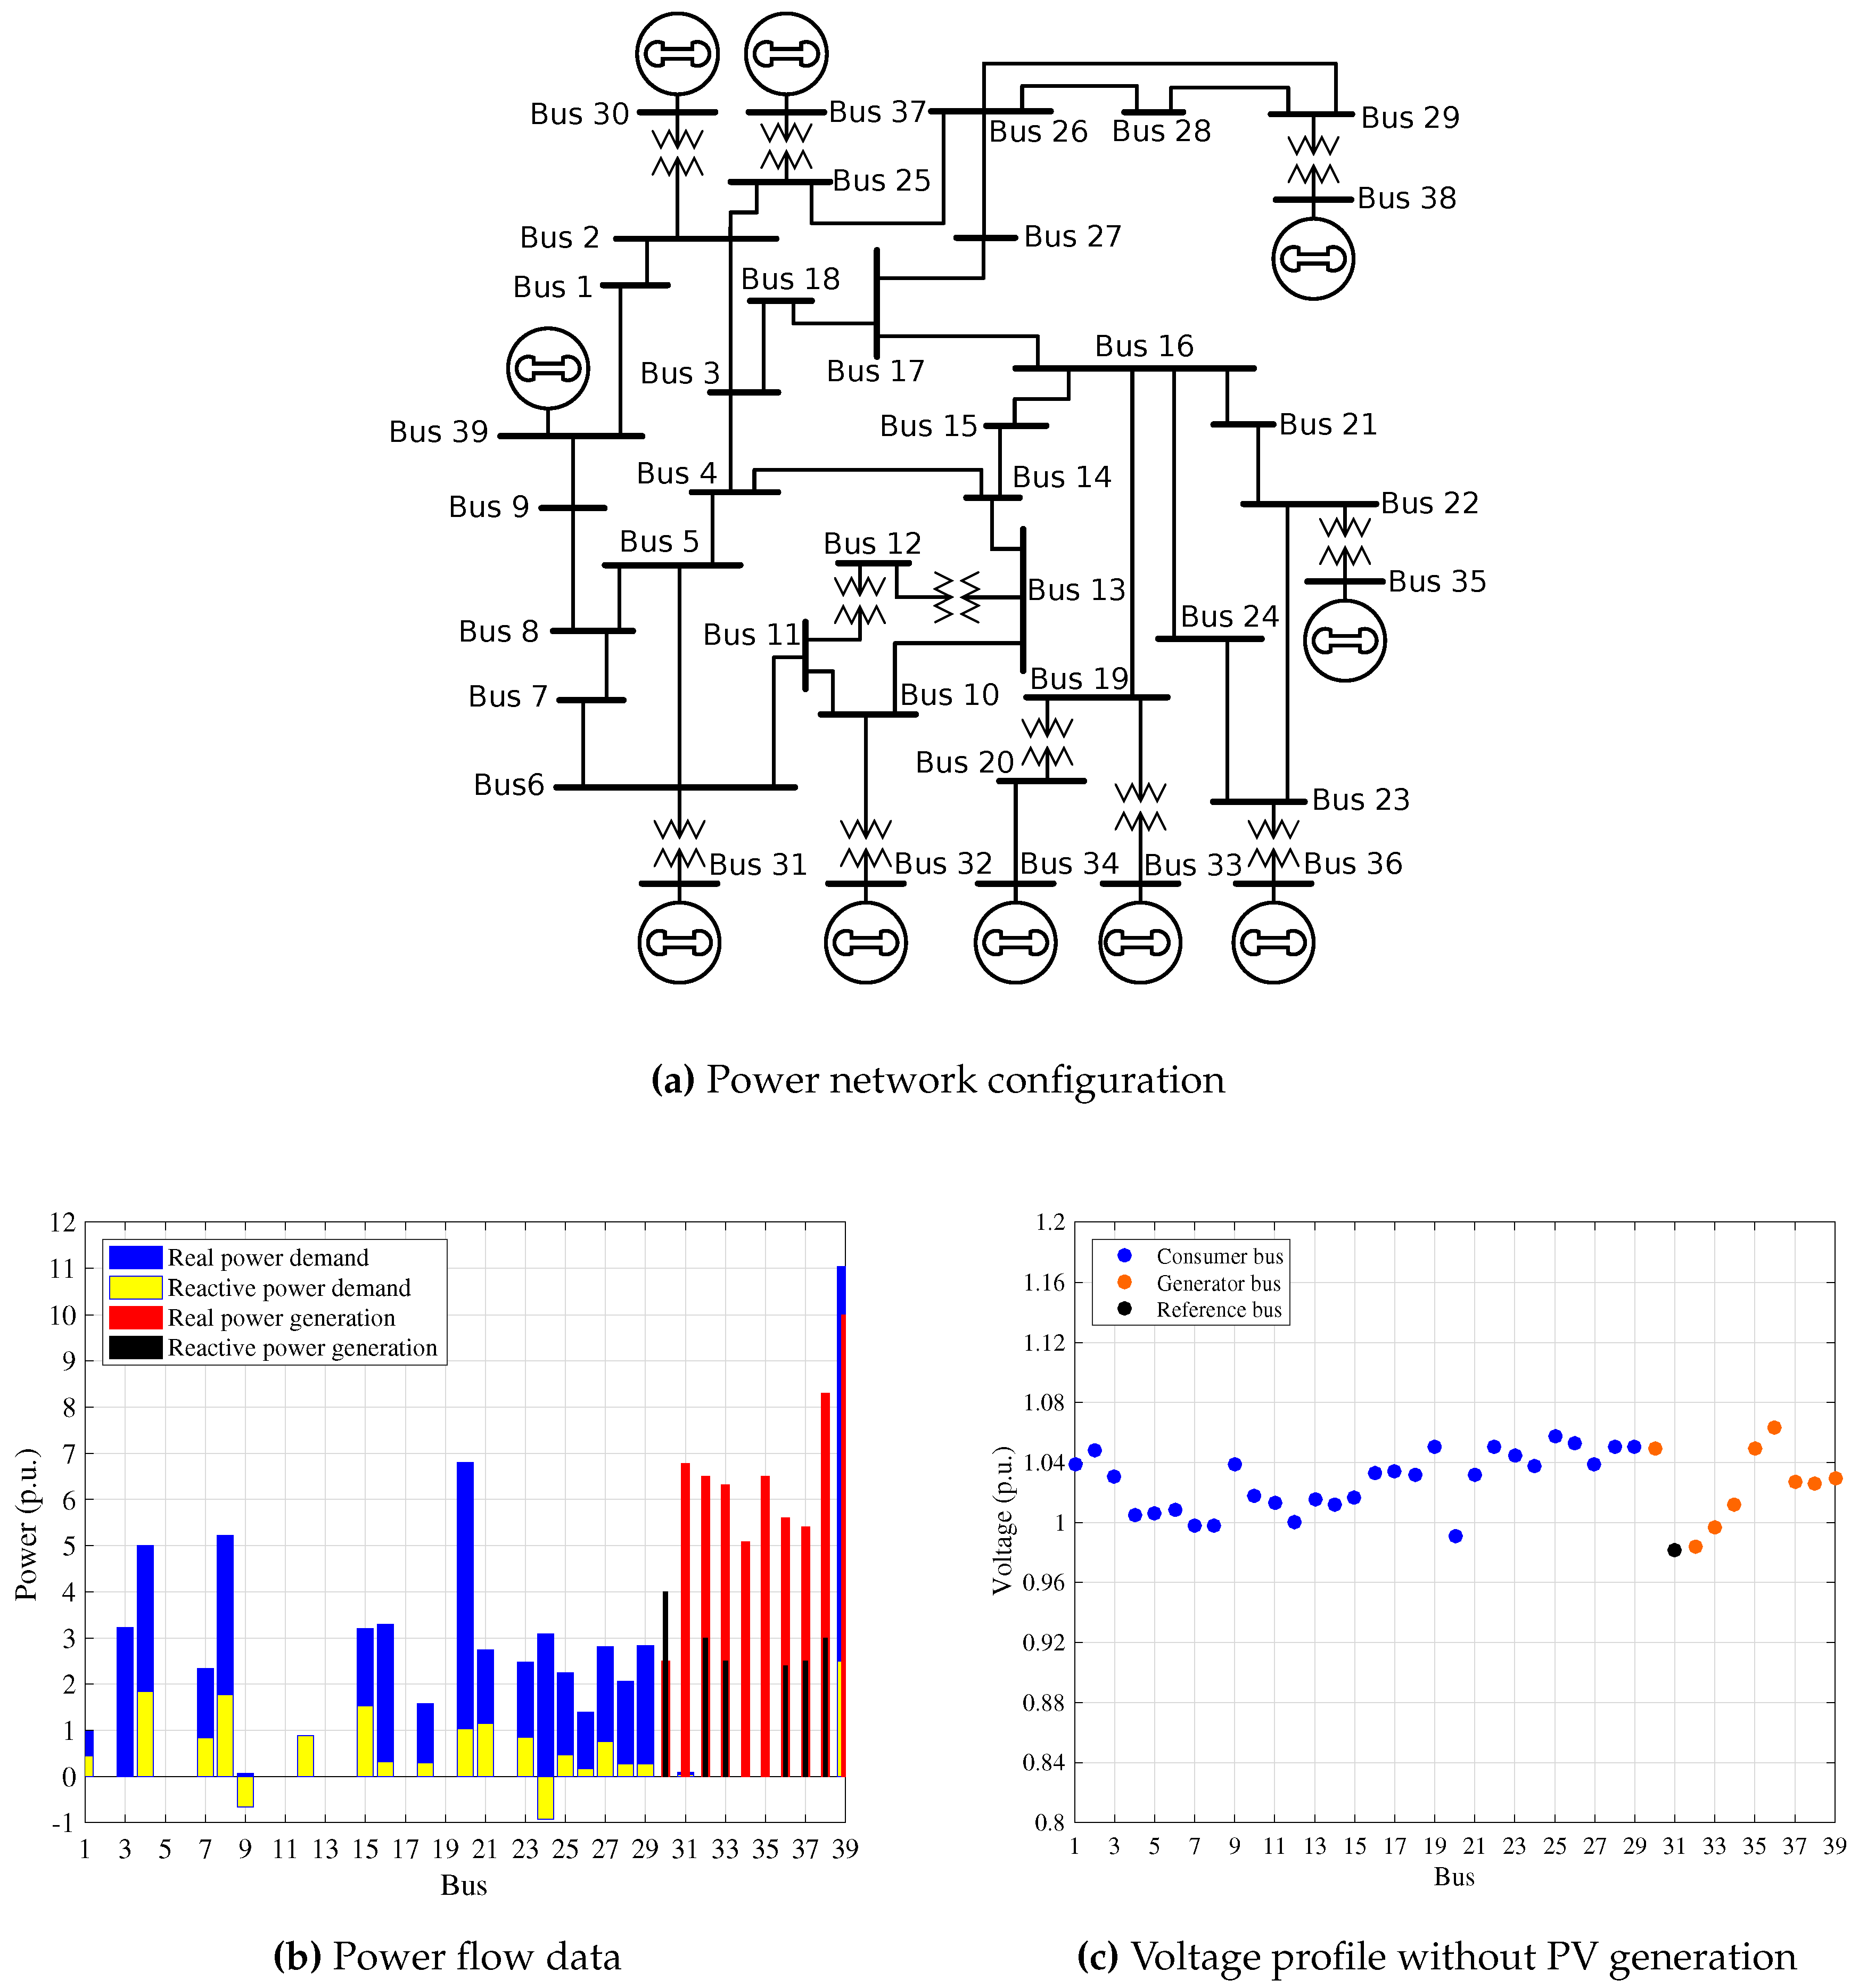
Figure 2.
P–V nose curve: It illustrates the relation between voltage magnitude change and real power variation at one bus. represents the continuous variation of real power at the bus, which can be transformed into real power injection at this bus.
Figure 2.
P–V nose curve: It illustrates the relation between voltage magnitude change and real power variation at one bus. represents the continuous variation of real power at the bus, which can be transformed into real power injection at this bus.
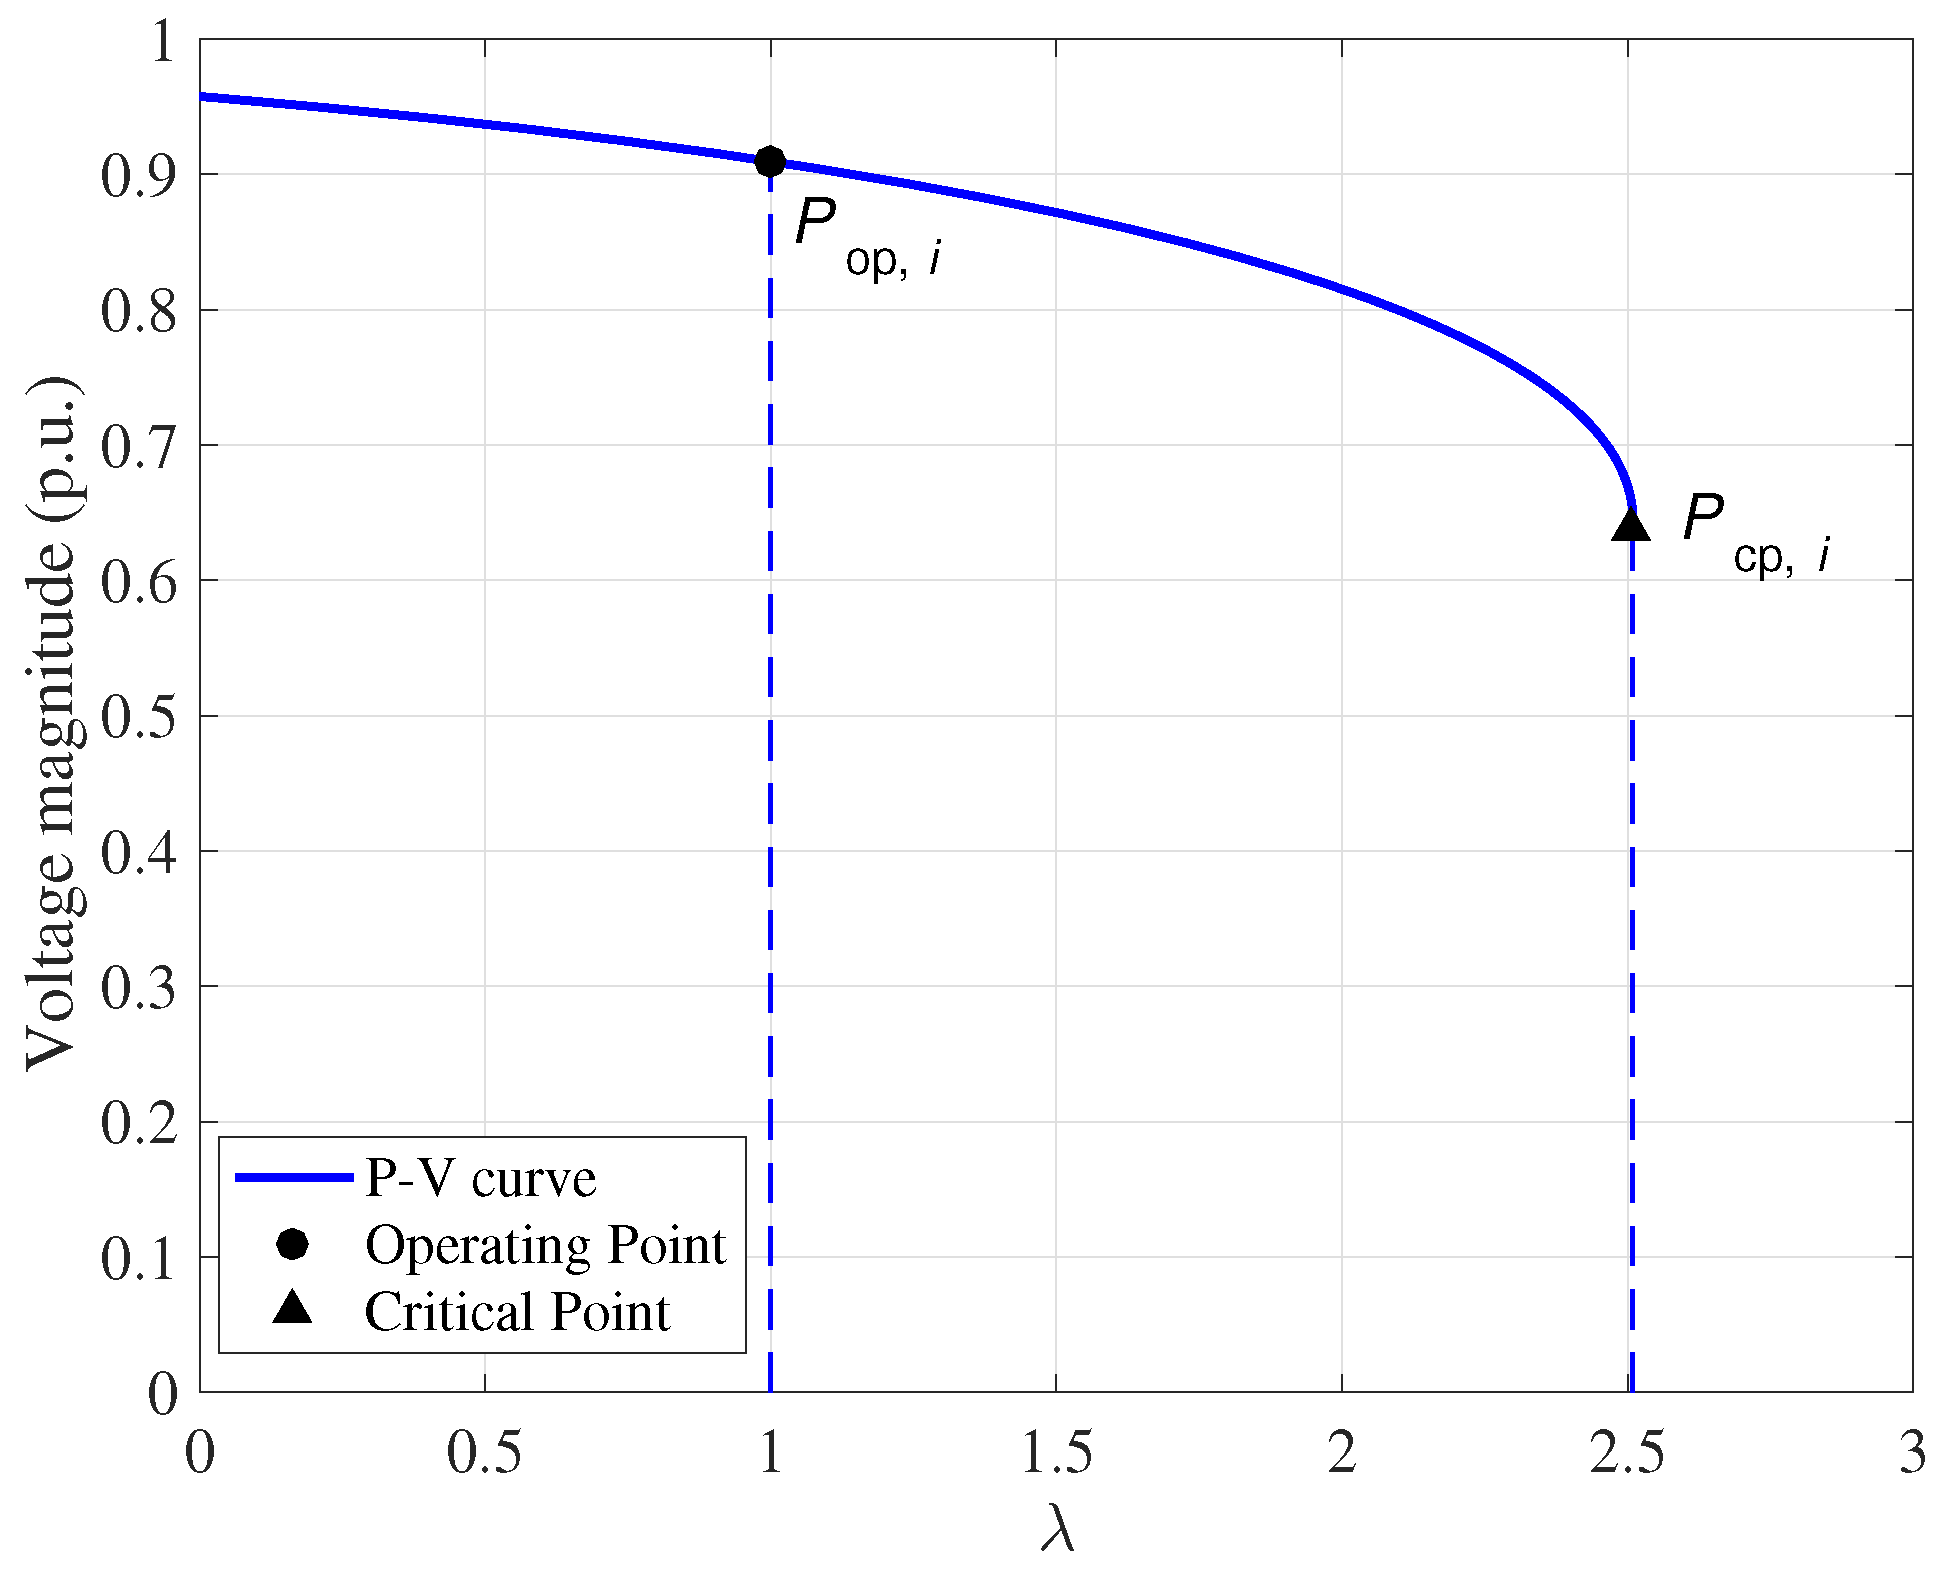
Figure 3.
Examples of PV power generation at consumer buses with uniform distribution of PV generators at consumer buses of the 39-bus power system. Net real power generation of PV is and of the net real power demand at consumer buses respectively, and the corresponding reactive power set point of PV inverters computed with the constrained least-square method and constrained LASSO method. (a) Net PV real power generation is of the net real power demand at consumer buses; (b) Net PV real power generation is of the net real power demand at consumer buses.

Figure 4.
Uniform distribution of PV generators at consumer buses of the 39-bus power system. Real power generation from one PV: 0.2 p.u.; Fixed net real power generation by PV, in terms of its share ratio to net consumer demands, snap results of share ratio ranges from 5% to 45%; MSE of voltage: Mean square error of voltage from the reference voltage; VSM: Voltage stability margin which evaluates the voltage stability and system capability of PV integration at the current system operating point; RP: Net absolute reactive power generation from PV inverters.

Figure 5.
On-demand distribution of PV power generators at each consumer bus of the 39-bus power system. PV is assigned only at consumer buses with real power demand. The real power generation of PV at each bus is proportional to the consumer real power demand at the bus, where the (PV/demand) ratio is equal at each PV-enabled bus; snap results of the share ratio range from 5% to 45%; MSE of voltage: Mean square error of voltage from the reference voltage; RP: Net absolute reactive power generation from PV inverters.
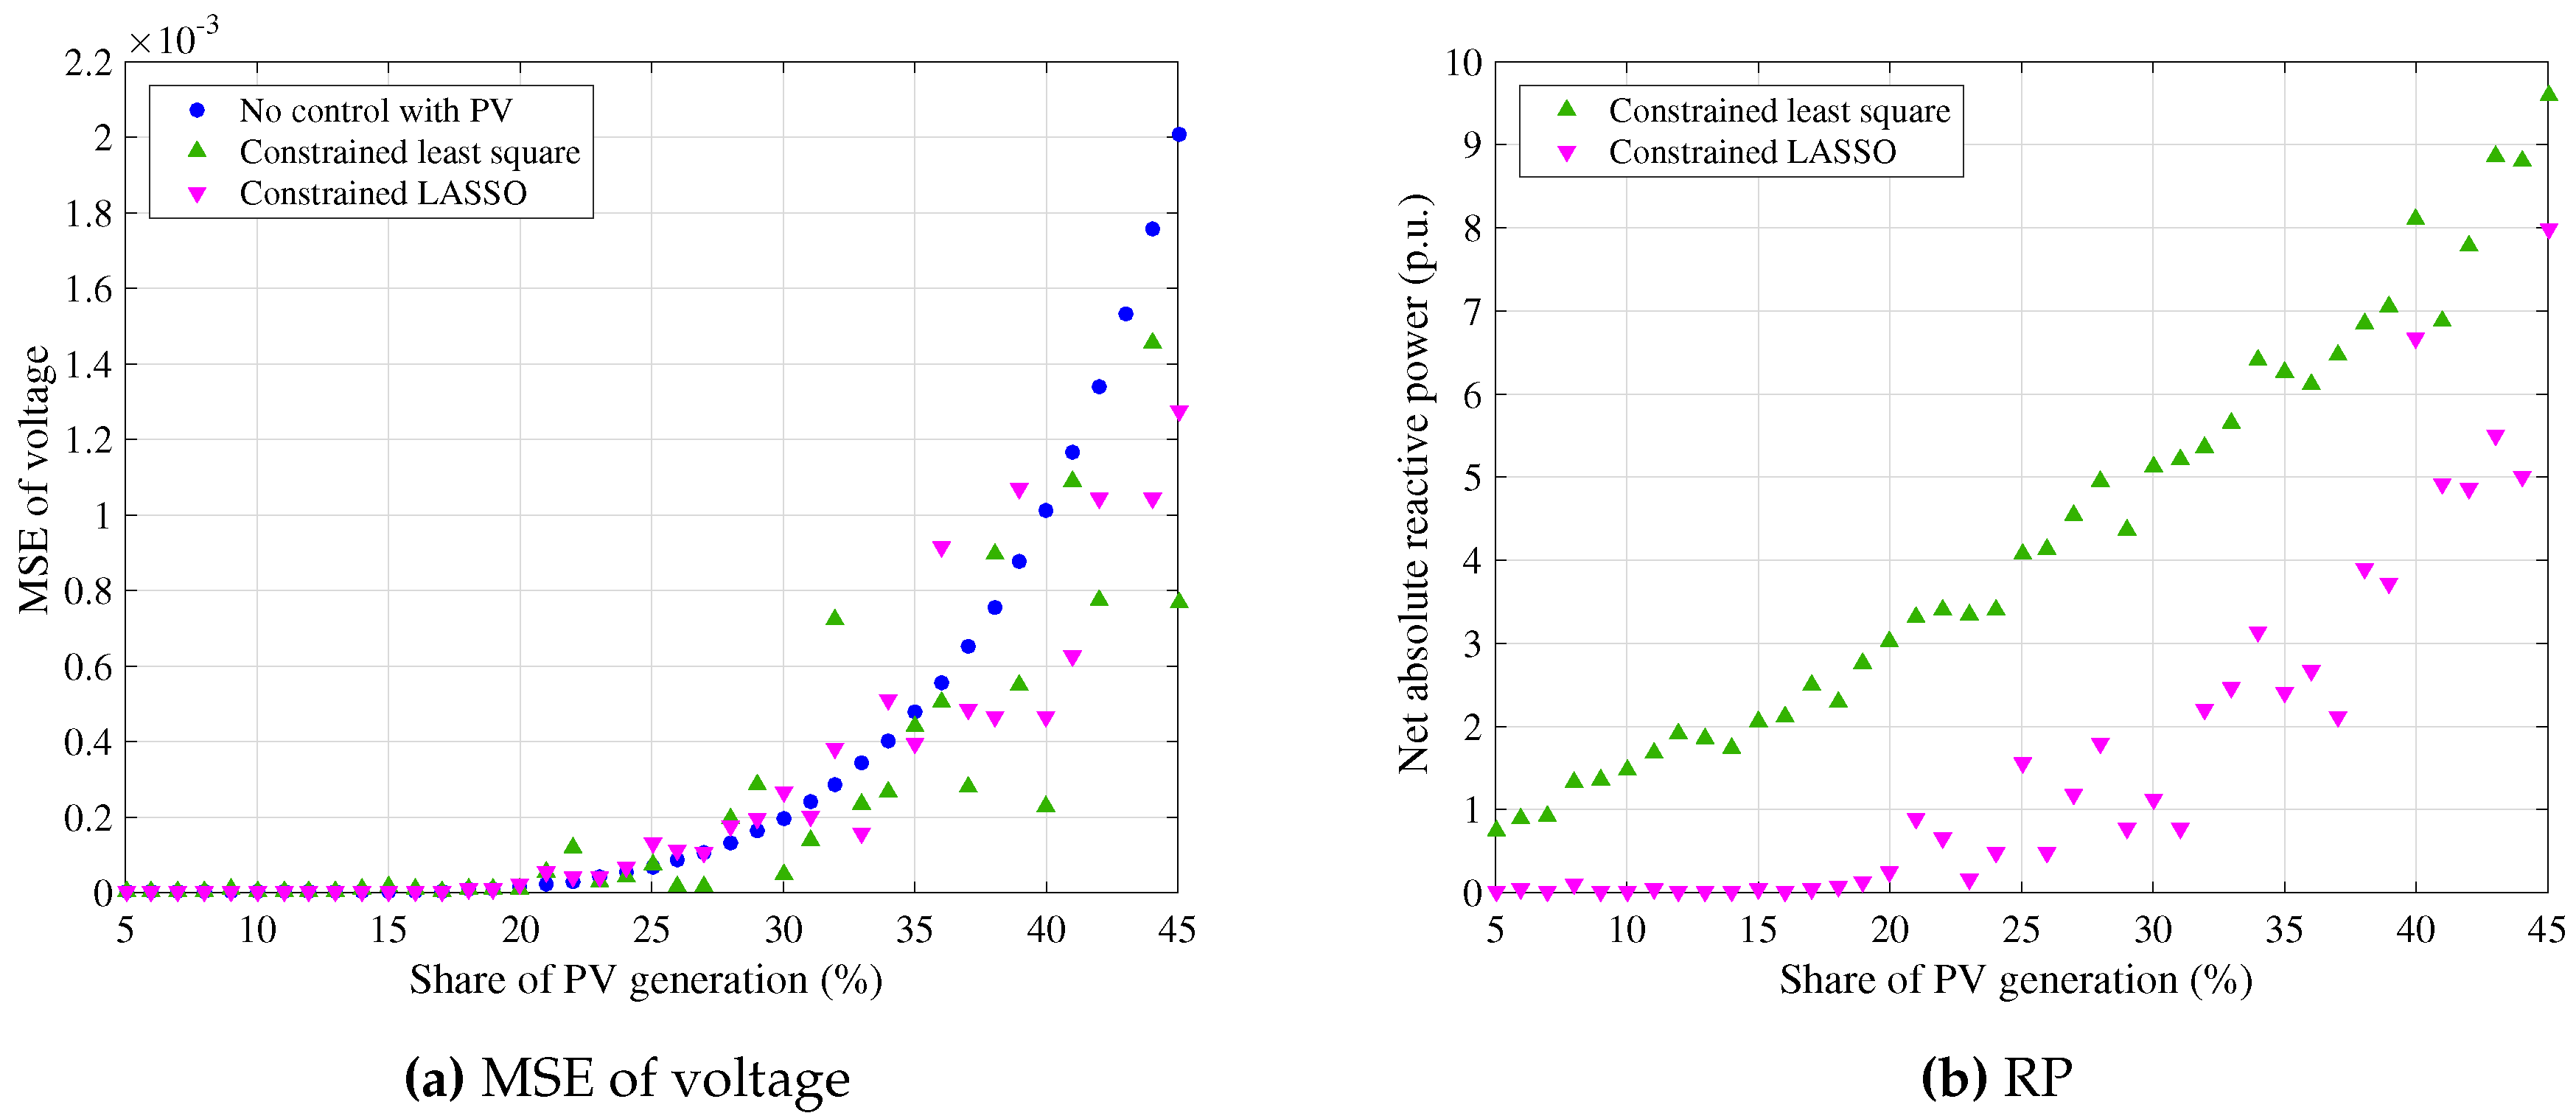
Figure 6.
Net absolute reactive power generation from PV inverters with the constrained least-square method and the constrained LASSO method in the 57-bus power system. (a) In case of uniform distribution of PV generators; (b) In case of on-demand distribution of PV generators.
Figure 6.
Net absolute reactive power generation from PV inverters with the constrained least-square method and the constrained LASSO method in the 57-bus power system. (a) In case of uniform distribution of PV generators; (b) In case of on-demand distribution of PV generators.
© 2017 by the authors. Licensee MDPI, Basel, Switzerland. This article is an open access article distributed under the terms and conditions of the Creative Commons Attribution (CC BY) license (http://creativecommons.org/licenses/by/4.0/).
Share and Cite
MDPI and ACS Style
Li, Y.; Ishikawa, M. An Efficient Reactive Power Control Method for Power Network Systems with Solar Photovoltaic Generators Using Sparse Optimization. Energies 2017, 10, 696. https://doi.org/10.3390/en10050696
AMA Style
Li Y, Ishikawa M. An Efficient Reactive Power Control Method for Power Network Systems with Solar Photovoltaic Generators Using Sparse Optimization. Energies. 2017; 10(5):696. https://doi.org/10.3390/en10050696
Chicago/Turabian StyleLi, Yu, and Masato Ishikawa. 2017. "An Efficient Reactive Power Control Method for Power Network Systems with Solar Photovoltaic Generators Using Sparse Optimization" Energies 10, no. 5: 696. https://doi.org/10.3390/en10050696
Note that from the first issue of 2016, this journal uses article numbers instead of page numbers. See further details here.