1. Introduction
Electricity is a significant factor for rapid industrialization, urbanization and improving quality of life [
1]. In the 21st century, demand for electricity is rising and will continue to do so due to industrialization in developing and emerging countries. Providing affordable, accessible, reliable, low to zero carbon electricity in developing and emerging countries will be the main aim of electricity generation in the next decades [
2]. The region of Southeast Asia and the Pacific Rim (from hereafter Southeast Asia and the Pacific Rim will be called Southeast Asia) consists of developed countries such as Australia, New Zealand and Singapore, as well as fast developing and emerging economies such as Brunei, Cambodia, Indonesia, Laos, Malaysia, Myanmar, Papua New Guinea, the Philippines, Thailand, Timor-Leste and Vietnam [
3]. The developing region was home to approximately 630 million people in the year 2015 [
4] and the need for energy has been higher and growing rapidly due to increasing population and industrialization since the Asian Financial Crisis of 1997–1998 [
5,
6,
7]. To sustain growth and development, demand for electricity will be 3–4 times the demand of the year 2013 by 2040 [
5]. On the other hand, Australia and New Zealand, which are well developed economies, have higher per capita electricity use than the Southeast Asian member states. Australia has one of the highest emissions per capita in the developed world due to its use of coal in electricity generation [
8]. To overcome the above-mentioned challenges and meet the electricity demand for economic growth at least cost and with the lowest possible greenhouse gas emissions is a huge challenge for the Southeast Asian region [
9]. Therefore, development of a 100% renewable energy (RE) based energy system is of utmost priority [
10,
11]. Northern and central regions of Australia are excellent in terms of solar resources and the southern, western and eastern coasts are good for wind [
12,
13]. New Zealand has a high potential for hydropower and geothermal energy [
14,
15]. In addition, the Association of Southeast Asian Nations (ASEAN) region as a whole is richly endowed with hydro, solar, geothermal, wind, and biomass resources which can be used for the generation of electricity [
16]. The Asian Development Bank has estimated high technical potential for solar, wind, biofuel and biogas in the Greater Mekong Region [
17] and provides an outline for various business models for investments in renewable energy (RE) for achieving its full potential [
18].
The Southeast Asian region is rich in RE resources and their potential can be maximized if there is an infrastructure for interconnection of the region’s electricity grids [
13]. There have been various studies undertaken on 100% RE or high share of RE based electricity systems in a specific country or combining some of the countries of Southeast Asian region. A brief summary of the studies undertaken is presented in
Table 1.
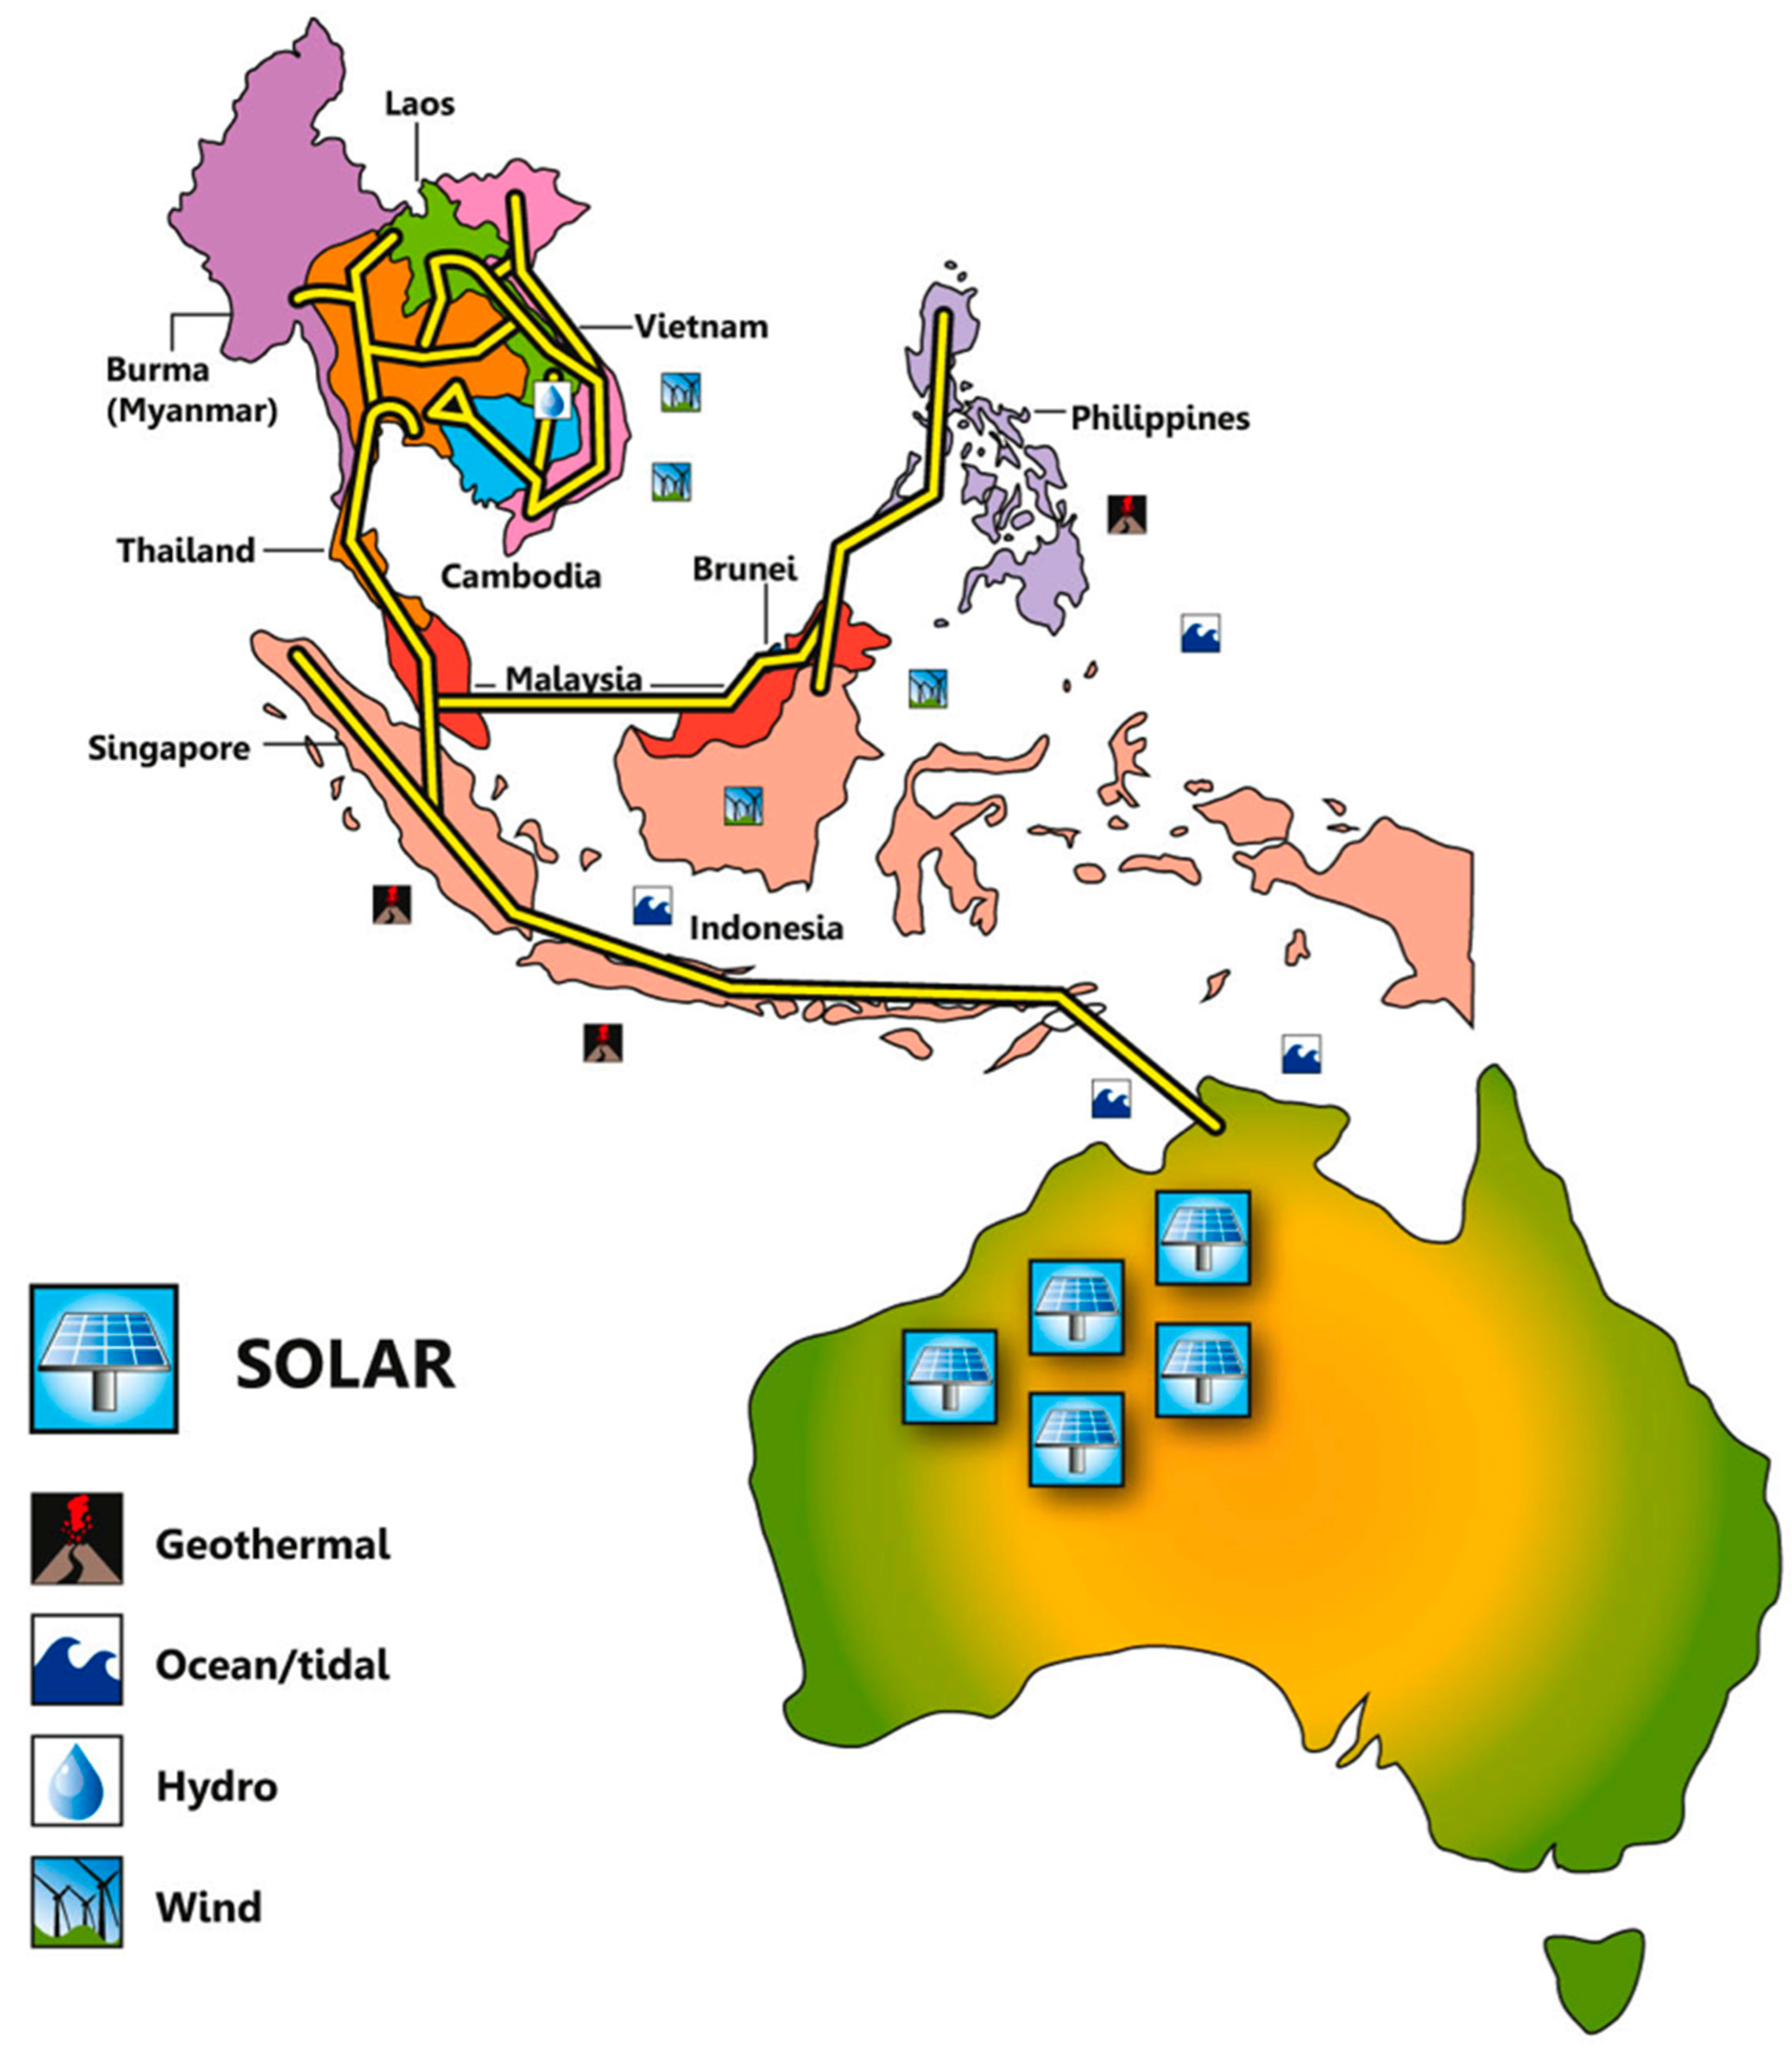
The idea of an ASEAN supergrid [
25,
26] connecting Australia and New Zealand has already been discussed [
27], taking European Union-Middle East and North Africa (EU-MENA) Desertec [
28,
29], Gobitec and a Northeast Asian supergrid as an initial template [
30,
31,
32]. An example of the grid connection from Australia to the ASEAN countries is shown in
Figure 1 [
33]. However, integrating all the energy sectors, incorporating a spatial and temporal resolution of energy supply and demand, and fully considering energy infrastructure or constraints of sustainability criteria have never been done before for this region. For the modeling of real world conditions, all this has to be taken into account to obtain a comprehensive least cost energy system which will be based on 100% renewable energy. Using RE resources for power generation may often lead to excess power, which needs to be stored. This excess power can be used, for instance, in seawater reverse osmosis (SWRO) desalination to provide clean water in many countries. Other possibilities include Power-to-heat and heat storage technologies for industrial heating needs [
34,
35] and Power-to-gas [
34,
35,
36,
37], which can supply natural gas for transportation, chemical, fertilizers and other industrial sectors, and can function as an enabler of seasonal energy storage. The main aim of the paper is to design an optimal energy system based on 100% renewable energy by proper utilization of the renewable energy resources available in Southeast Asia.
2. Methodology
The model optimization of the energy system is based on linear optimization of the parameters which are applied to the system under known constraints with the assumption of a perfect foresight of RE power generation and power demand, storage technologies, as well as water desalination and synthetic natural gas (SNG) generation, which operate as flexible demands in the model. The model used in this study has been described in Bogdanov and Breyer [
37] and the next sections do not include a detailed description of the model, its input data and the applied technologies. However, detailed information has been provided for all the additional assumptions considered in this study. Matching of the power generation and demand for every hour of the year 2030 is the key constraint for the optimization. The hourly resolution of the model significantly increases the computation time; however, it guarantees that for every hour of the year the total generation within a sub-region and electricity import cover the local electricity demand and enable a more precise system description including synergy effects of different system components for the power system balance. The set of applied technologies can be easily expanded, which is one of the main features of the used Lappeenranta University of Technology (LUT) energy system model.
2.1. Summary of the Model
Minimization of the total annual energy system cost of the power sector and the additional flexibility demand sectors such as gas synthesis and water desalination is the main aim of the system optimization. This cost is calculated as the sum of the annual costs of installed capacities of the different technologies, costs of energy generation and generation ramping. In addition, included in the system are the distributed generation and self-consumption of residential, commercial and industrial electricity consumers (prosumers) by installing respective capacities of rooftop PV systems and batteries. For PV prosumers, minimizing the cost of consumed energy is the main target function, which is calculated as a sum of self-generation, annual cost and cost of electricity consumed from the grid, minus the benefits of selling excess electricity. The prosumers can sell electricity to the grid at 2 €ct/kWh; however, they have to satisfy their own demand before selling.
2.2. Input Data
The model is built on many types of different constraints and datasets. Additional information about all the input data for the model is given in Bogdanov and Breyer [
37]. Data calculation for geothermal energy, desalinated water demand and industrial gas demand are described here.
- (1)
The geothermal potential data for every sub-region is calculated based on the already available information on the surface heat flow rate [
38,
39] and the surface ambient temperature for the year 2005 globally. Extrapolation of the available heat flow data was performed for areas where surface heat flow data were not available. Based on these available data, different temperature levels and available heat at the mid-point of a 1 km thick deep layer, between the depths of 1 km to 10 km [
40,
41] globally with 0.45° × 0.45° spatial resolution are derived.
- (2)
Industrial gas consumption data are based on IEA statistics for energy sector demand [
42].
- (3)
Projected water desalination demand was determined for every sub-region. Water desalination demand is calculated on projections for water consumption and water stress [
43]. In the model, it is assumed that water stress of more than 50% will be covered by seawater desalination. The calculations for the technical constraints and financial cost of seawater reverse osmosis desalination are described in [
44].
2.3. Applied Technologies
For the Southeast Asian energy system optimization, technologies applied can be divided into three main categories:
(1) Conversion of renewable energy sources into electricity
For electricity generation from renewable energy sources, technologies used are solar PV systems which are ground mounted (optimally tilted and single-axis north-south oriented horizontal continuous tracking) and rooftop PV, concentrating solar thermal power (CSP), onshore wind turbines, hydro power divided into run-of-river and dams, biomass plants (biogas and solid biomass), waste-to-energy power plants and geothermal power plants.
(2) Energy storage
The technologies used in this model for energy storage are battery storage, pumped hydro storage (PHS), adiabatic compressed air energy storage (A-CAES), thermal energy storage (TES) and power-to-gas (PtG) technology. The synthesis of SNG technologies are included in PtG. Technologies such as water electrolysis, methanation, CO2 scrubbing from air, gas storage, and both combined and open cycle gas turbines (CCGT, OCGT) are part of the synthesis of SNG and its reconversion to electricity. The PtG technologies have to be operated in synchronization because of the absence of hydrogen and CO2 storage. There is a 48-hour biogas buffer storage and part of the biogas can be upgraded to biomethane and introduced to the gas storage.
(3) Electricity transmission
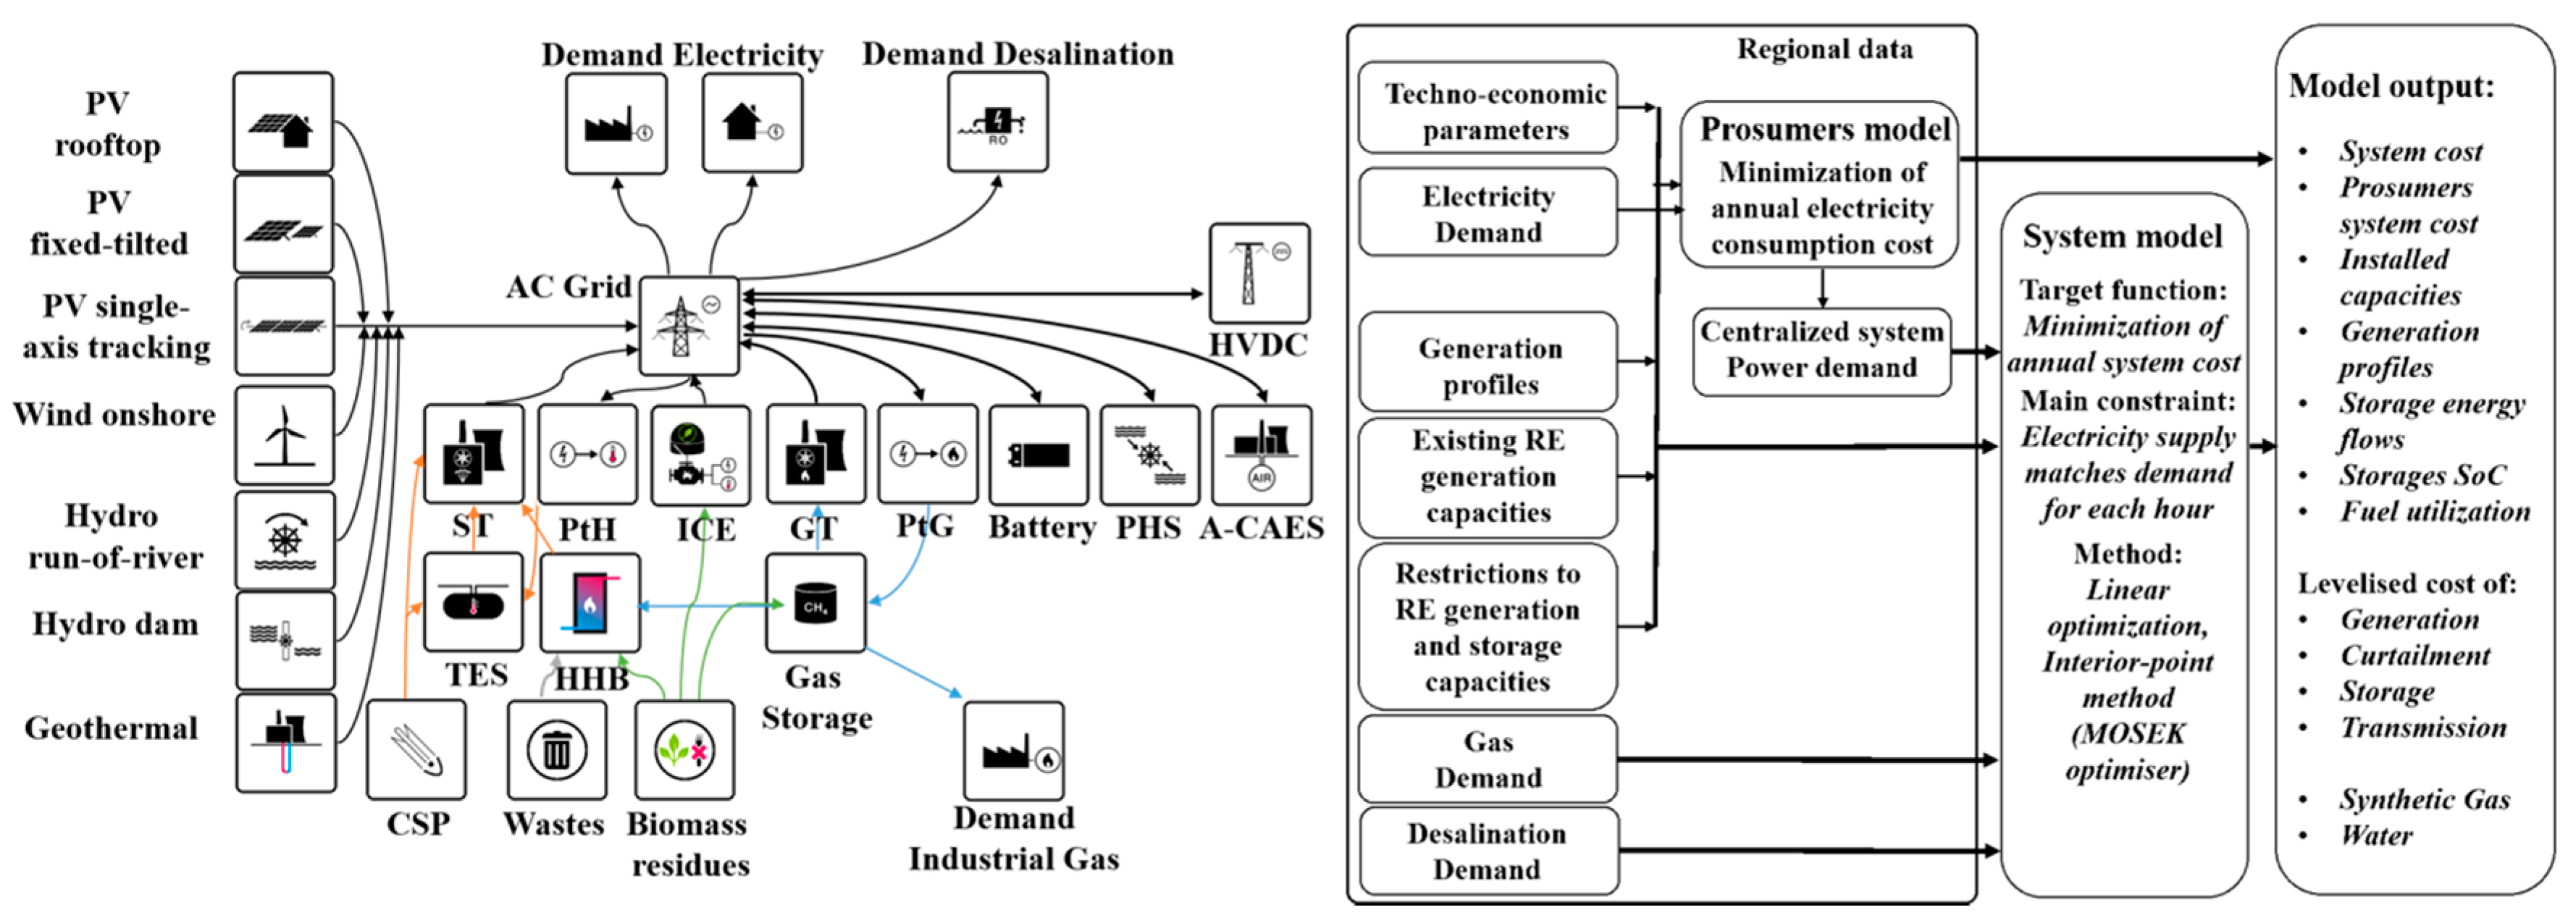
The power distribution and transmission within the sub-regions is assumed to be based on alternating current (AC) grids and transmission grids between the regions are based on high voltage direct current (HVDC) technology. Loss of electricity due to the length of the power lines and losses in converter stations at the interconnection with the AC grid form the major component of the power losses in HVDC grids. The full block model diagram is presented in
Figure 2.
(4) Energy sector bridging technologies
The SNG from the PtG technology can be used for industrial gas demand rather than storage for the electricity sector. In addition, SWRO desalination provides clean water with the use of renewable electricity. These two technologies provide the required flexibility to the system by reducing cost of curtailment and storage.
4. Results
The optimized electrical energy system configuration is derived for each scenario, which is characterized by optimized installed capacities for RE electricity generation, storage and transmission for every technology used in the model. This in turn leads to hourly generation of electricity, charging and discharging of storage technologies, import and export of electricity between regions or countries, and curtailment. The key average financial results for the different scenarios are presented in
Table 4. The key numbers represent total system (LCOE) levelized cost of electricity (including PV self-consumption and the centralized system), levelized cost of electricity for primary generation (LCOE primary), levelized cost of curtailment (LCOC), levelized cost of storage technologies (LCOS), levelized cost of transmission (LCOT), total annualized cost, total capital expenditures, total renewables capacity and total primary generation.
Despite lower primary generation costs, the connection of different regions via HVDC power lines does not yield an expected benefit, since there is no transmission of power from Australia to the ASEAN countries. However, connection due to HVDC power lines still has a positive impact on the LCOE and total annual costs of the system. The LCOE is decreased from the region-wide to area-wide scenario by 4.5%, and the total annual costs of the system are decreased by 4.6%. The other benefits of grid utilization include a decrease in installed capacities by 7.6% and in total electricity generated by 3.7% from the region-wide to area-wide scenarios. Grid integration decreases the cost of storage technologies and leads to utilization of transmission capacities as the cost of transmission is relatively small in the regions where the cost of storage is not cost competitive with electricity transmission. The power line capacities for the electricity trade between the sub-regions for the area-wide open trade scenario is shown in
Supplementary Materials (Figure S8 and Table S15).
The LCOE components and the import/export share in region-wide, country-wide, area-wide and integrated scenario are presented in
Supplementary Materials (Table S10). The share of export is defined as the ratio of net exported electricity to the generated primary electricity of a sub-region and the share of import is defined as the ratio of imported electricity to the electricity demand. The average for the whole region is composed of sub-regional values weighted by the electricity demand.
A decrease in total installed capacities of RE is observed as grid utilization increases (
Table 4). For PV, the installed capacities decrease by 10% from the region-wide to area-wide scenarios, and for wind they remain same even when the regions are interconnected. In the integrated scenario, installed capacities of PV and wind increase due to the additional demands of seawater desalination and industrial gas. For Southeast Asia, PV is the least cost RE source followed by wind energy. The shares of PV single-axis tracking and PV self-consumption in the total solar PV installed capacity for the area-wide scenario are 66.5% and 33.5%, respectively.
When comparing the region-wide and integrated scenarios, a decrease in total LCOE by 23.4% is observed due to the integration of desalination and industrial gas demands. A decrease of 48.5% is observed in the cost of storage technologies due to its reduced need, as additional electricity demand flexibility is provided to the system by industrial gas synthesis and the desalination sectors. Due to this flexible demand from two new sectors in the integrated scenario, there is an increase in installed capacities of low cost solar PV and wind power in comparison to area-wide scenario, and a slight decrease in biomass power plant capacities, as observed in
Table 5. The share of hydro dams does not change as it also provides required flexibility to the system. The inter-regional electricity trade decreases between the regions due to the integration of the desalination and gas sectors, which leads to a decrease in electricity transmission costs by 50%.
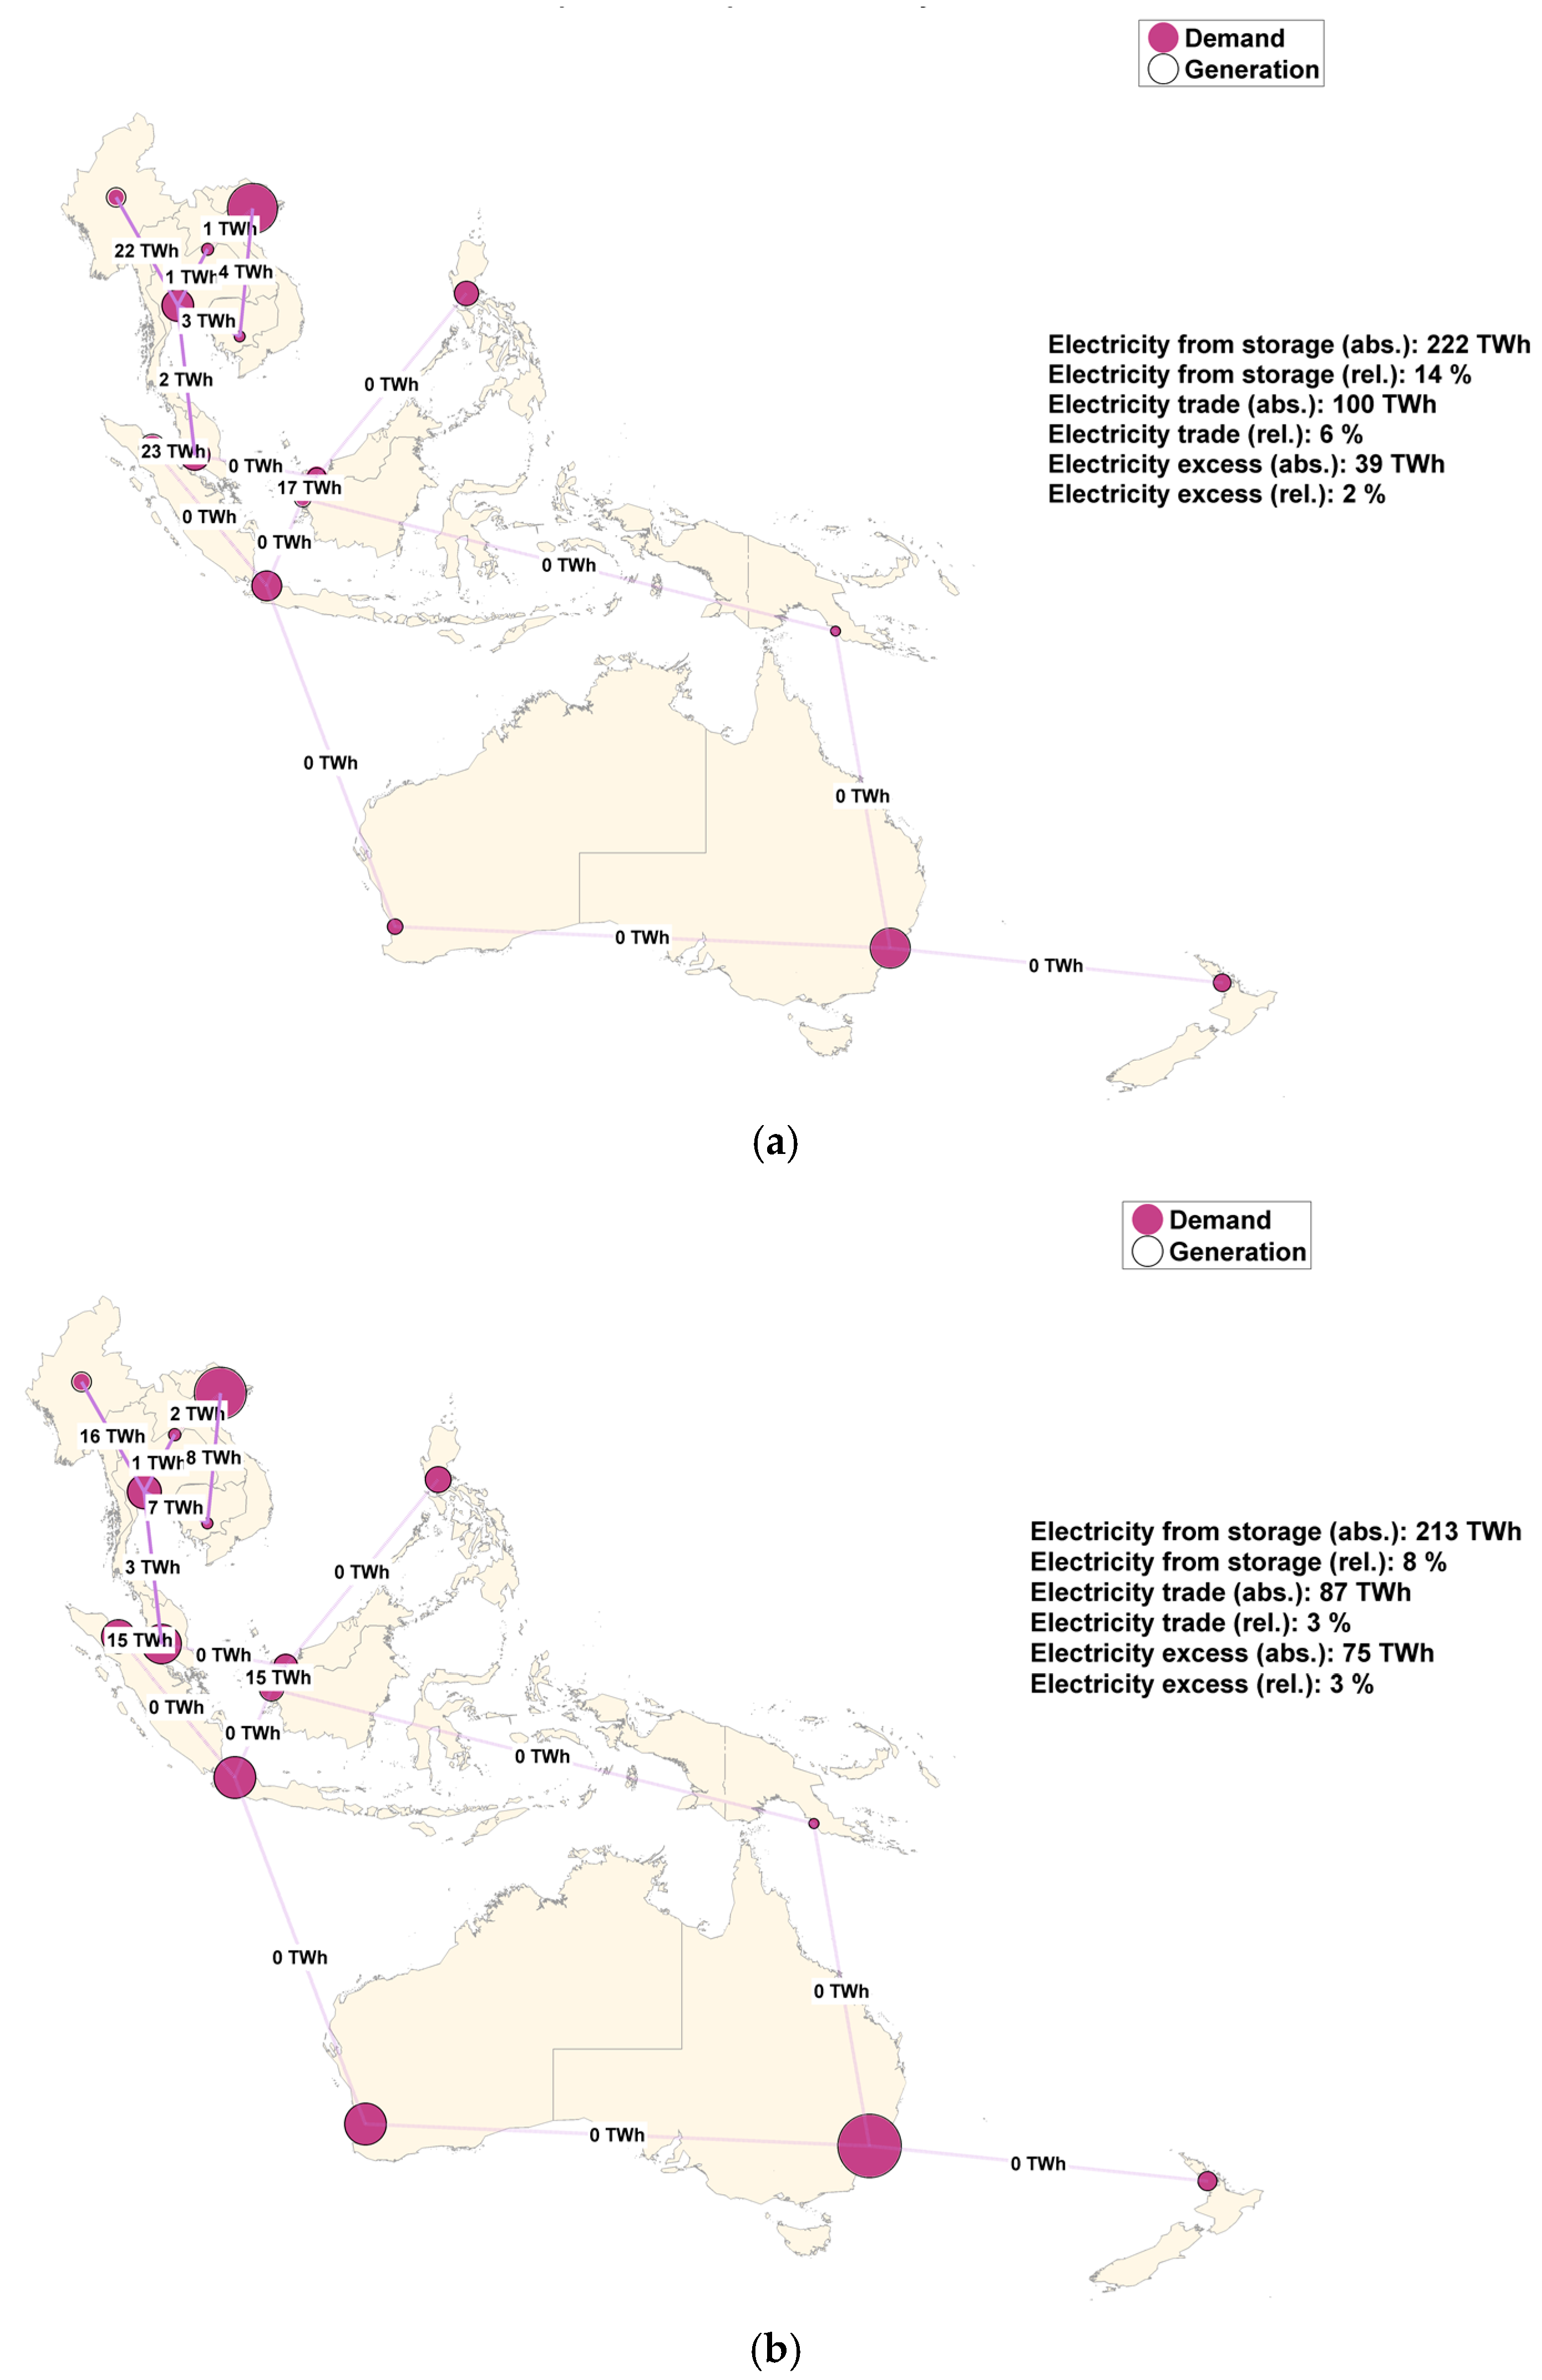
The distribution of the system optimized sub-regional RE sources can be observed from
Figure 6. Sub-regions with the best renewable resources are net exporters, and the others are net importers. In the case of the region-wide scenario, all individual sub-regions of Southeast Asia need to satisfy their demands using the available RE sources in that particular region. A division of regions into net importers and exporters can be observed for the area-wide scenario and the integrated scenario, which are presented in
Figure 6. The difference observed between demand and generation is mainly due to import and export, but also due to storage losses. For the integrated scenario, this difference is due to energy consumption for SNG production, as shown is
Figure 6. The net importer regions for Southeast Asia and Pacific are: Malaysia West and Singapore, Thailand, Malaysia East and Brunei. The net exporter regions are: Sumatra, Myanmar and Indonesia Kalimantan Sulawesi. Due to a high electricity demand for additional desalination and SNG production, the integrated scenario tends to show an increase in the electricity generation between the regions to fulfill the increased demand. Hourly resolved profiles for the net importing region Malaysia West and Singapore and net exporting region Sumatra are presented in
Supplementary Materials (
Figures S1 and S2, respectively).
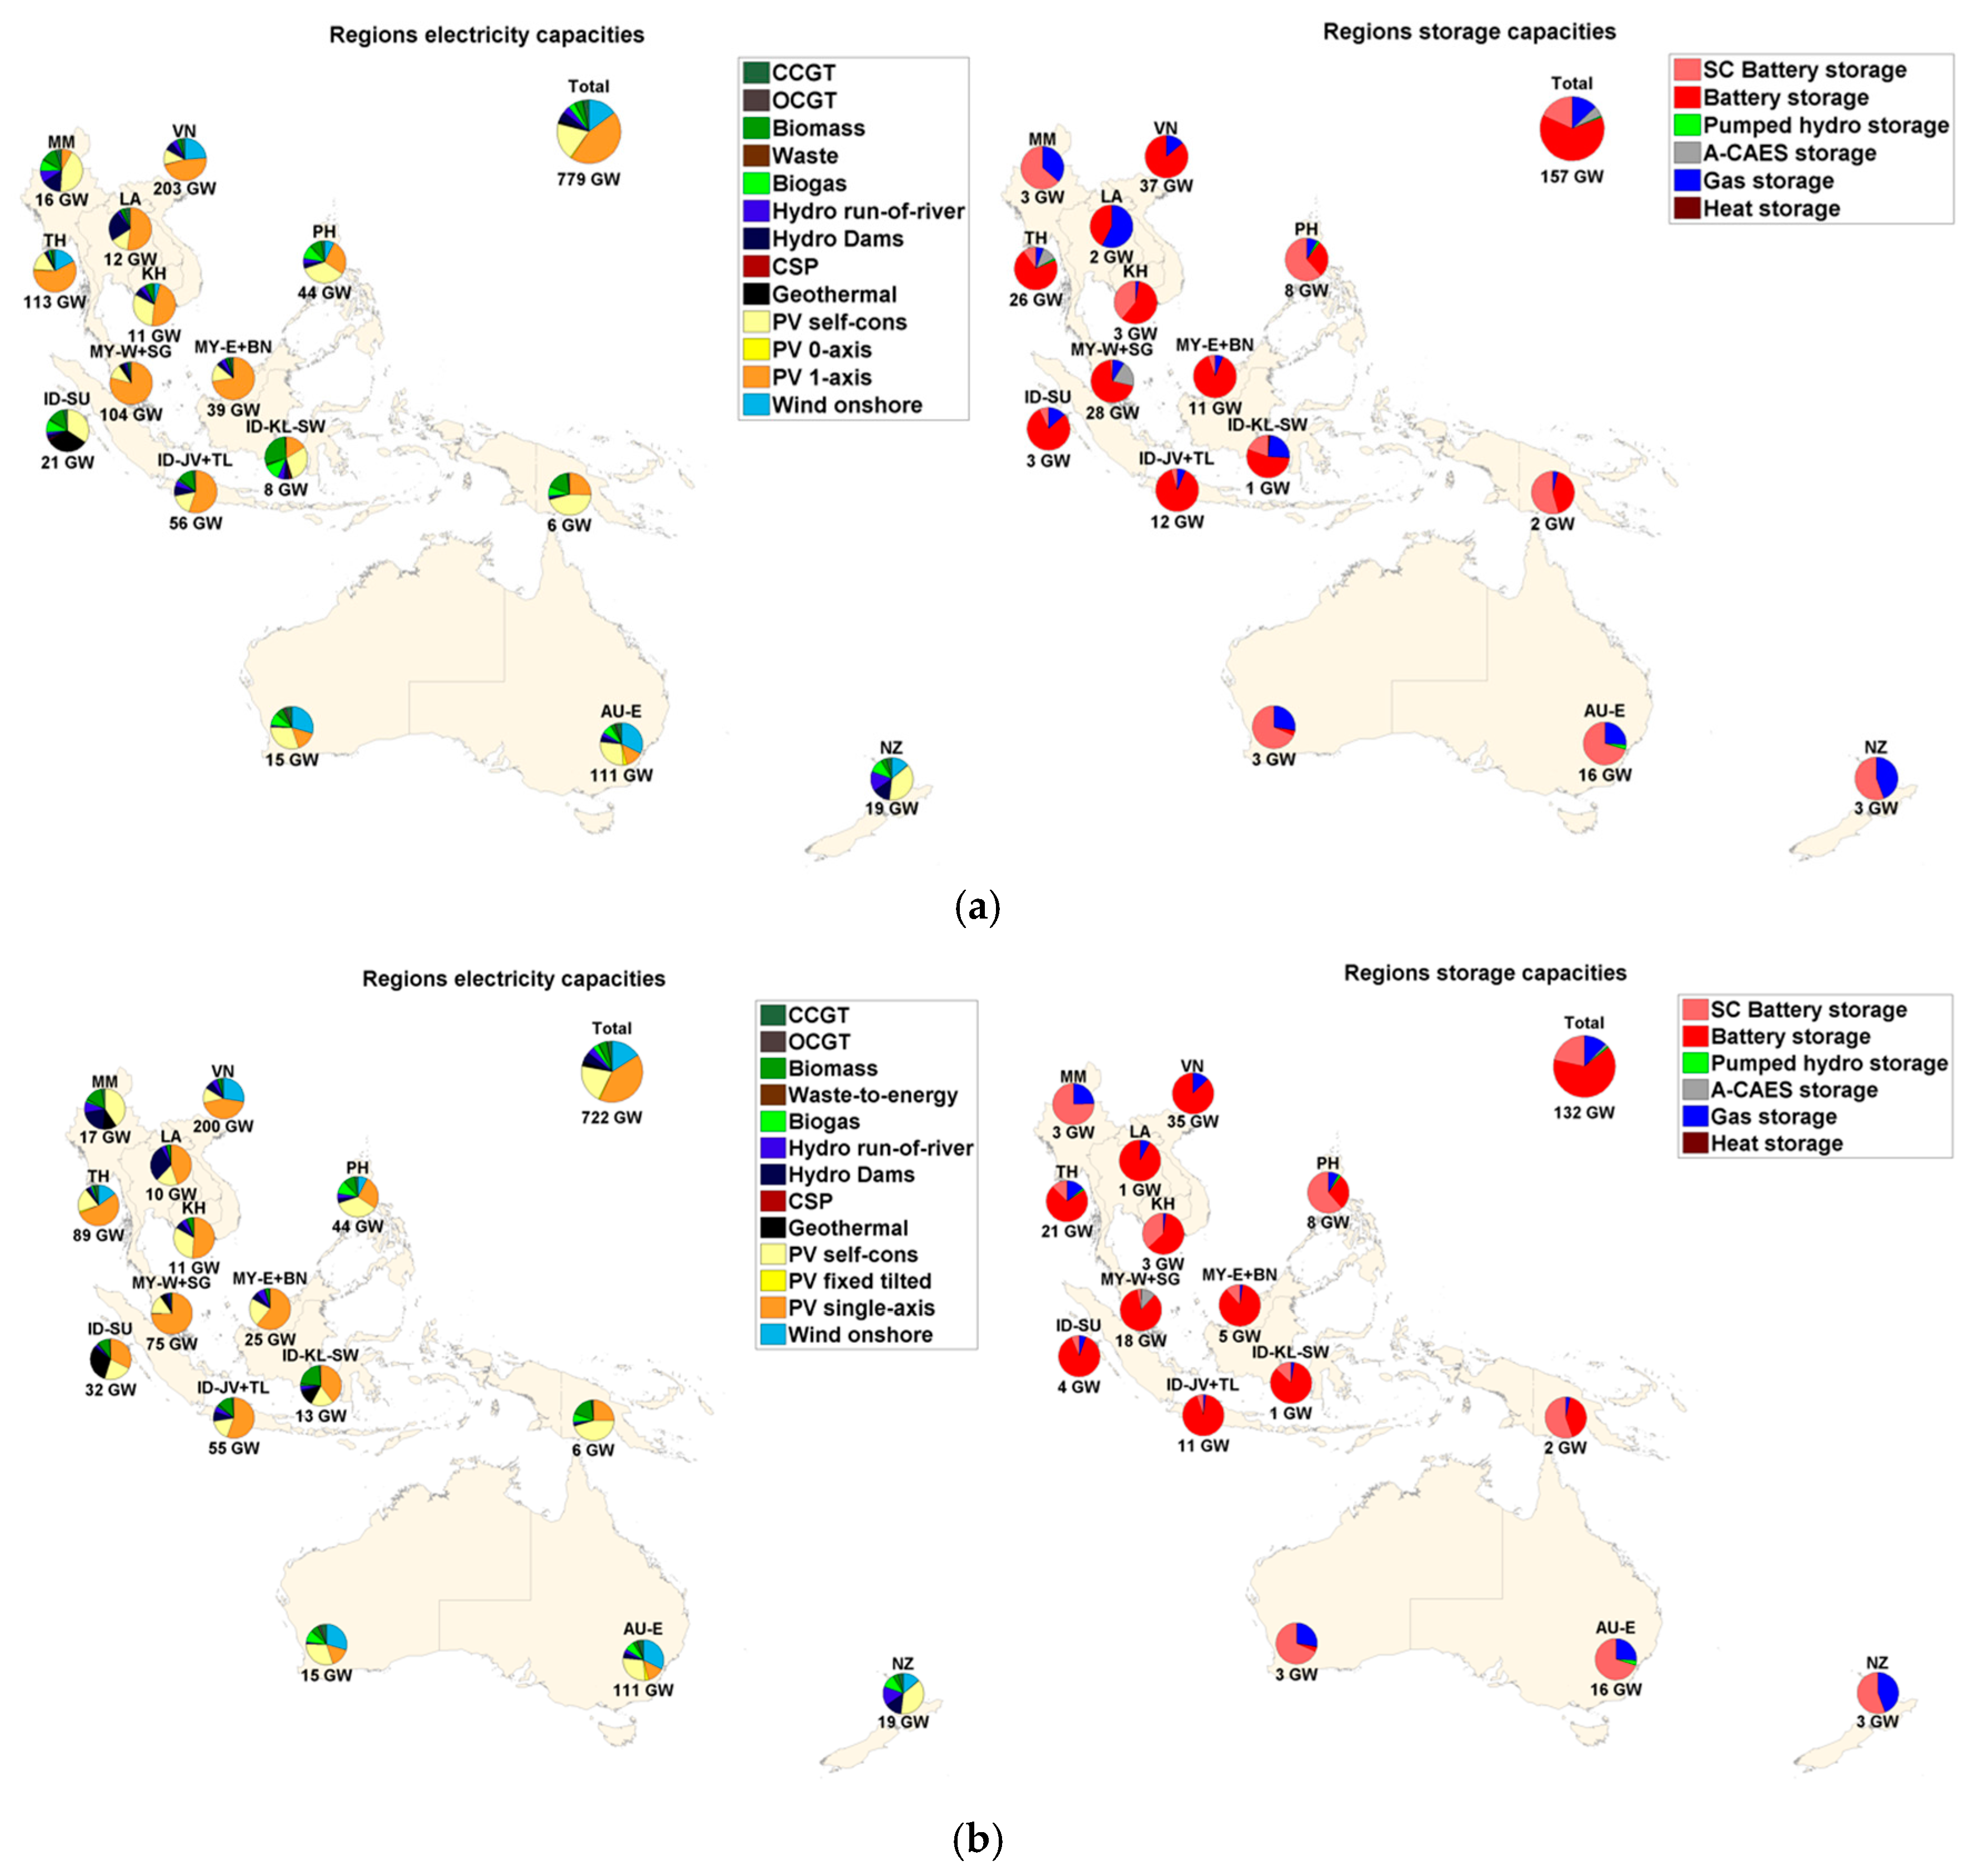
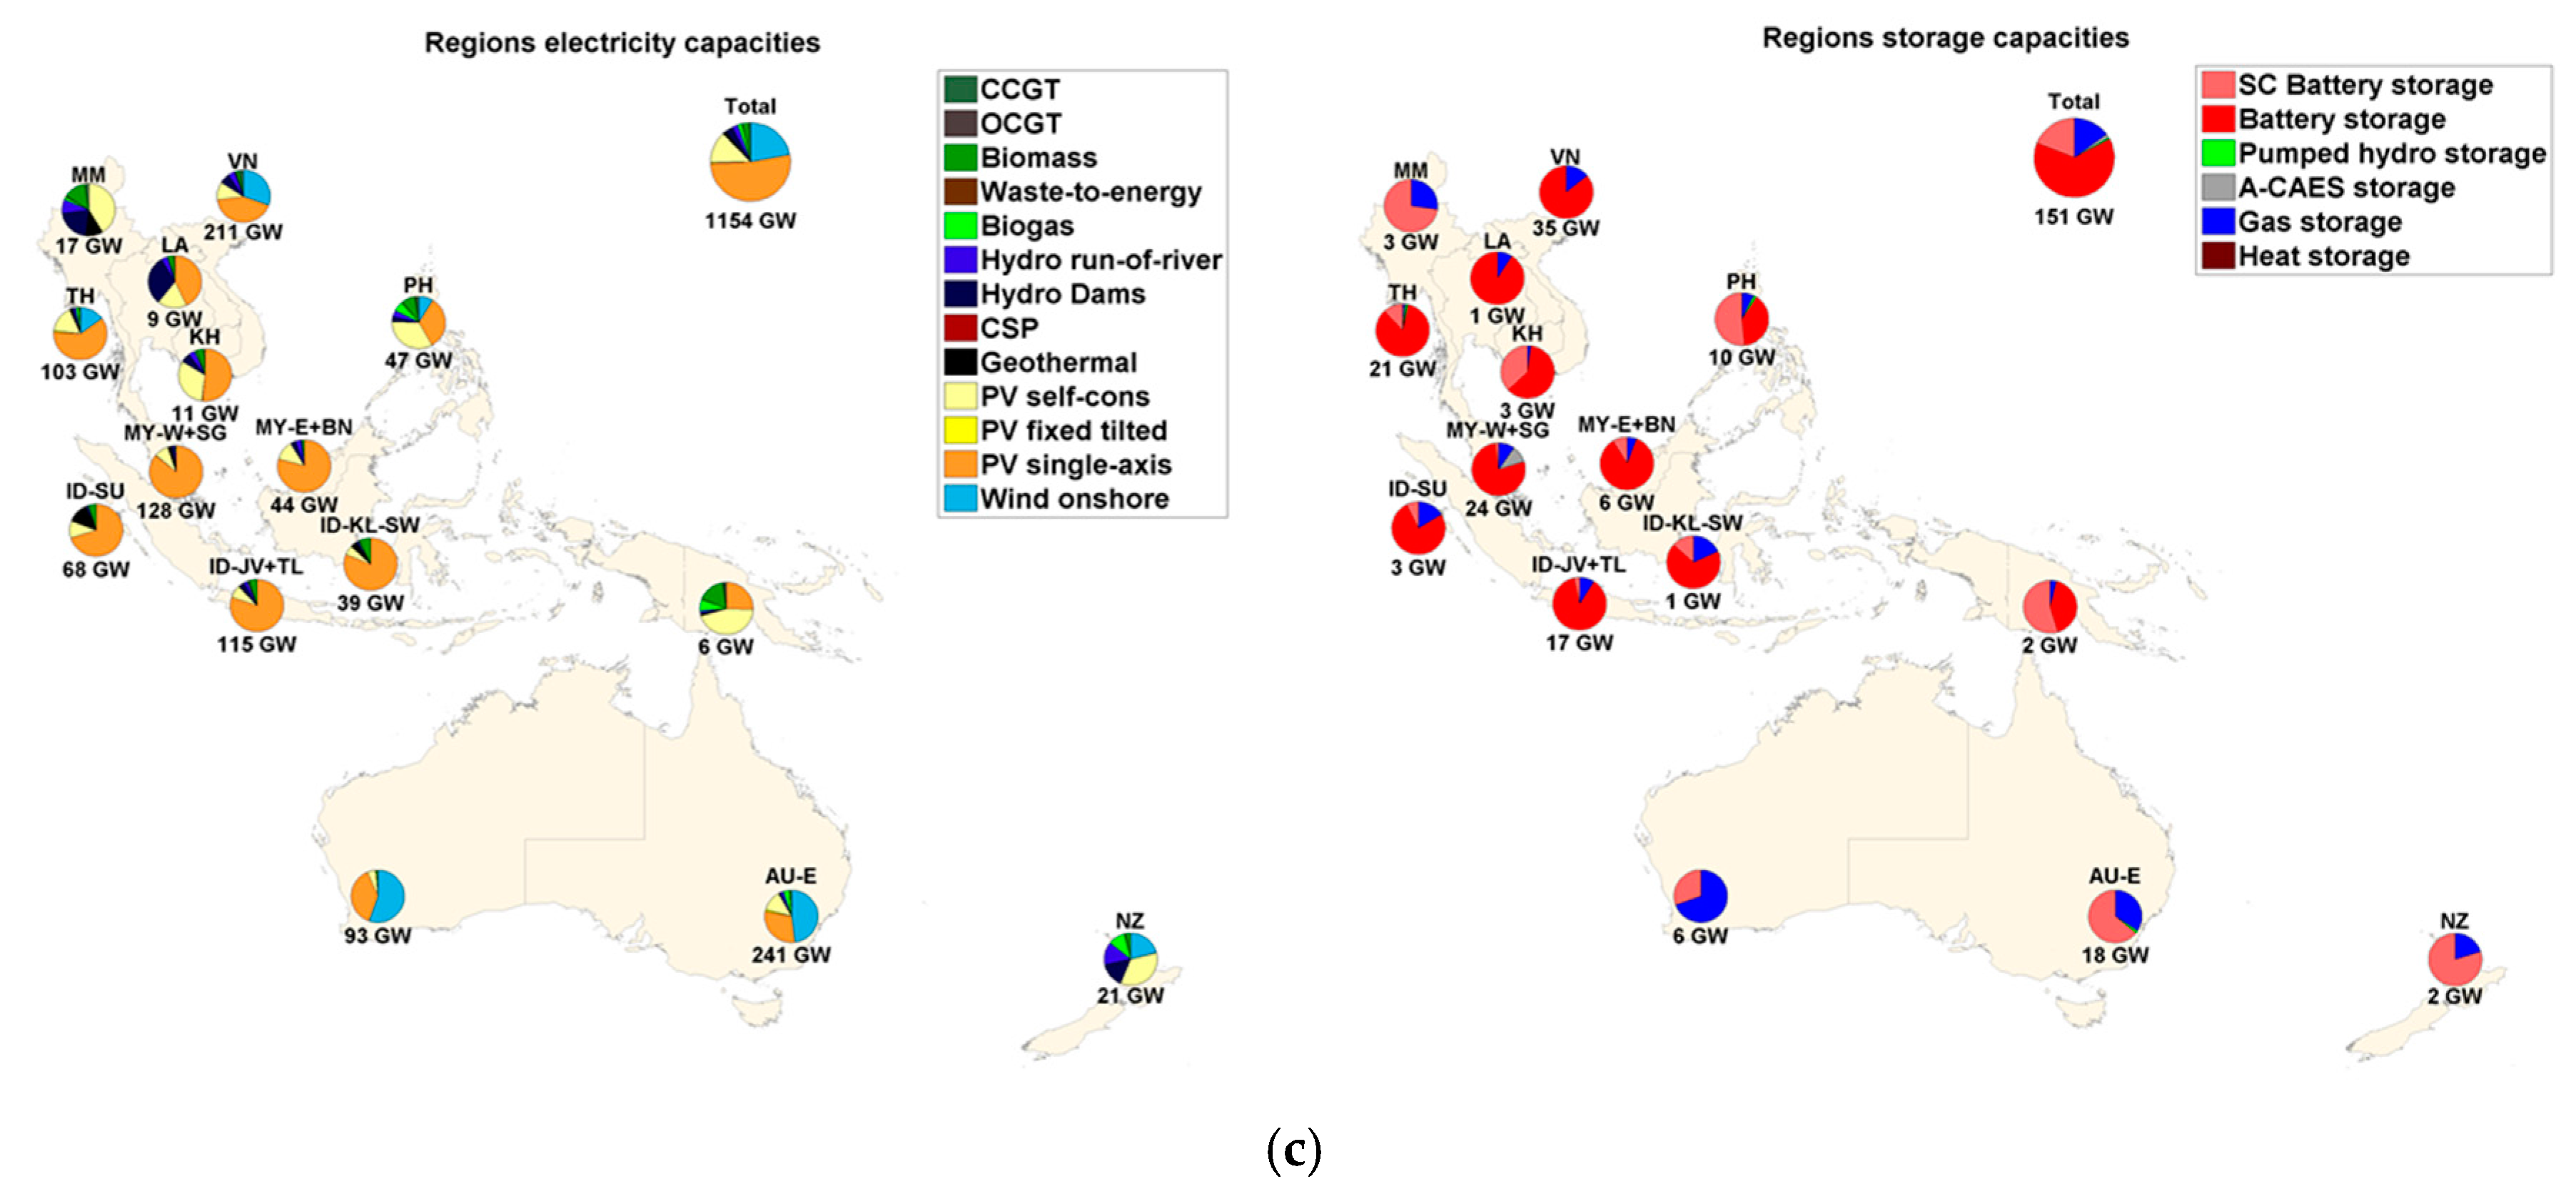
Figure 7 gives an overview of the installed capacities for RE generation and storage technologies for all sub-regions for the region-wide, area-wide and integrated scenarios. For the region-wide scenario in the sub-regions of New Zealand, Australia East, Australia West and Vietnam, solar PV capacities exceed 40% of all installed RE capacities despite the full load hours (FLH) for wind being higher or comparable to PV full load hours. It is observed that in the sub-regions that have excellent wind conditions, low cost wind energy is the next preferred technology after solar PV, which is lowest in cost. When comparing the region-wide and area-wide scenarios, the interconnection of the sub-regions via HVDC transmission lines results in a decrease of the installed capacities of PV by 10.7%, as seen in
Figure 7 and
Table 5. In the case of the integrated scenario, installed capacities for PV and wind increase significantly, by 40.9% and 54.9%, respectively, compared to the area-wide scenario, due to a higher demand for electricity.
The connection of the regions via HVDC transmission lines, RE generation and demand greatly influence the total storage capacity required. In addition, they also change the combination of different storage technologies required for the energy system in the whole region. The throughput of batteries, A-CAES, and gas storage technologies decreases by 9.7%, 73.9% and 18.7%, respectively, from the region-wide to the area-wide scenario. State of charge profile diagrams for the area-wide scenario for battery, PHS, A-CAES and gas storage are given in
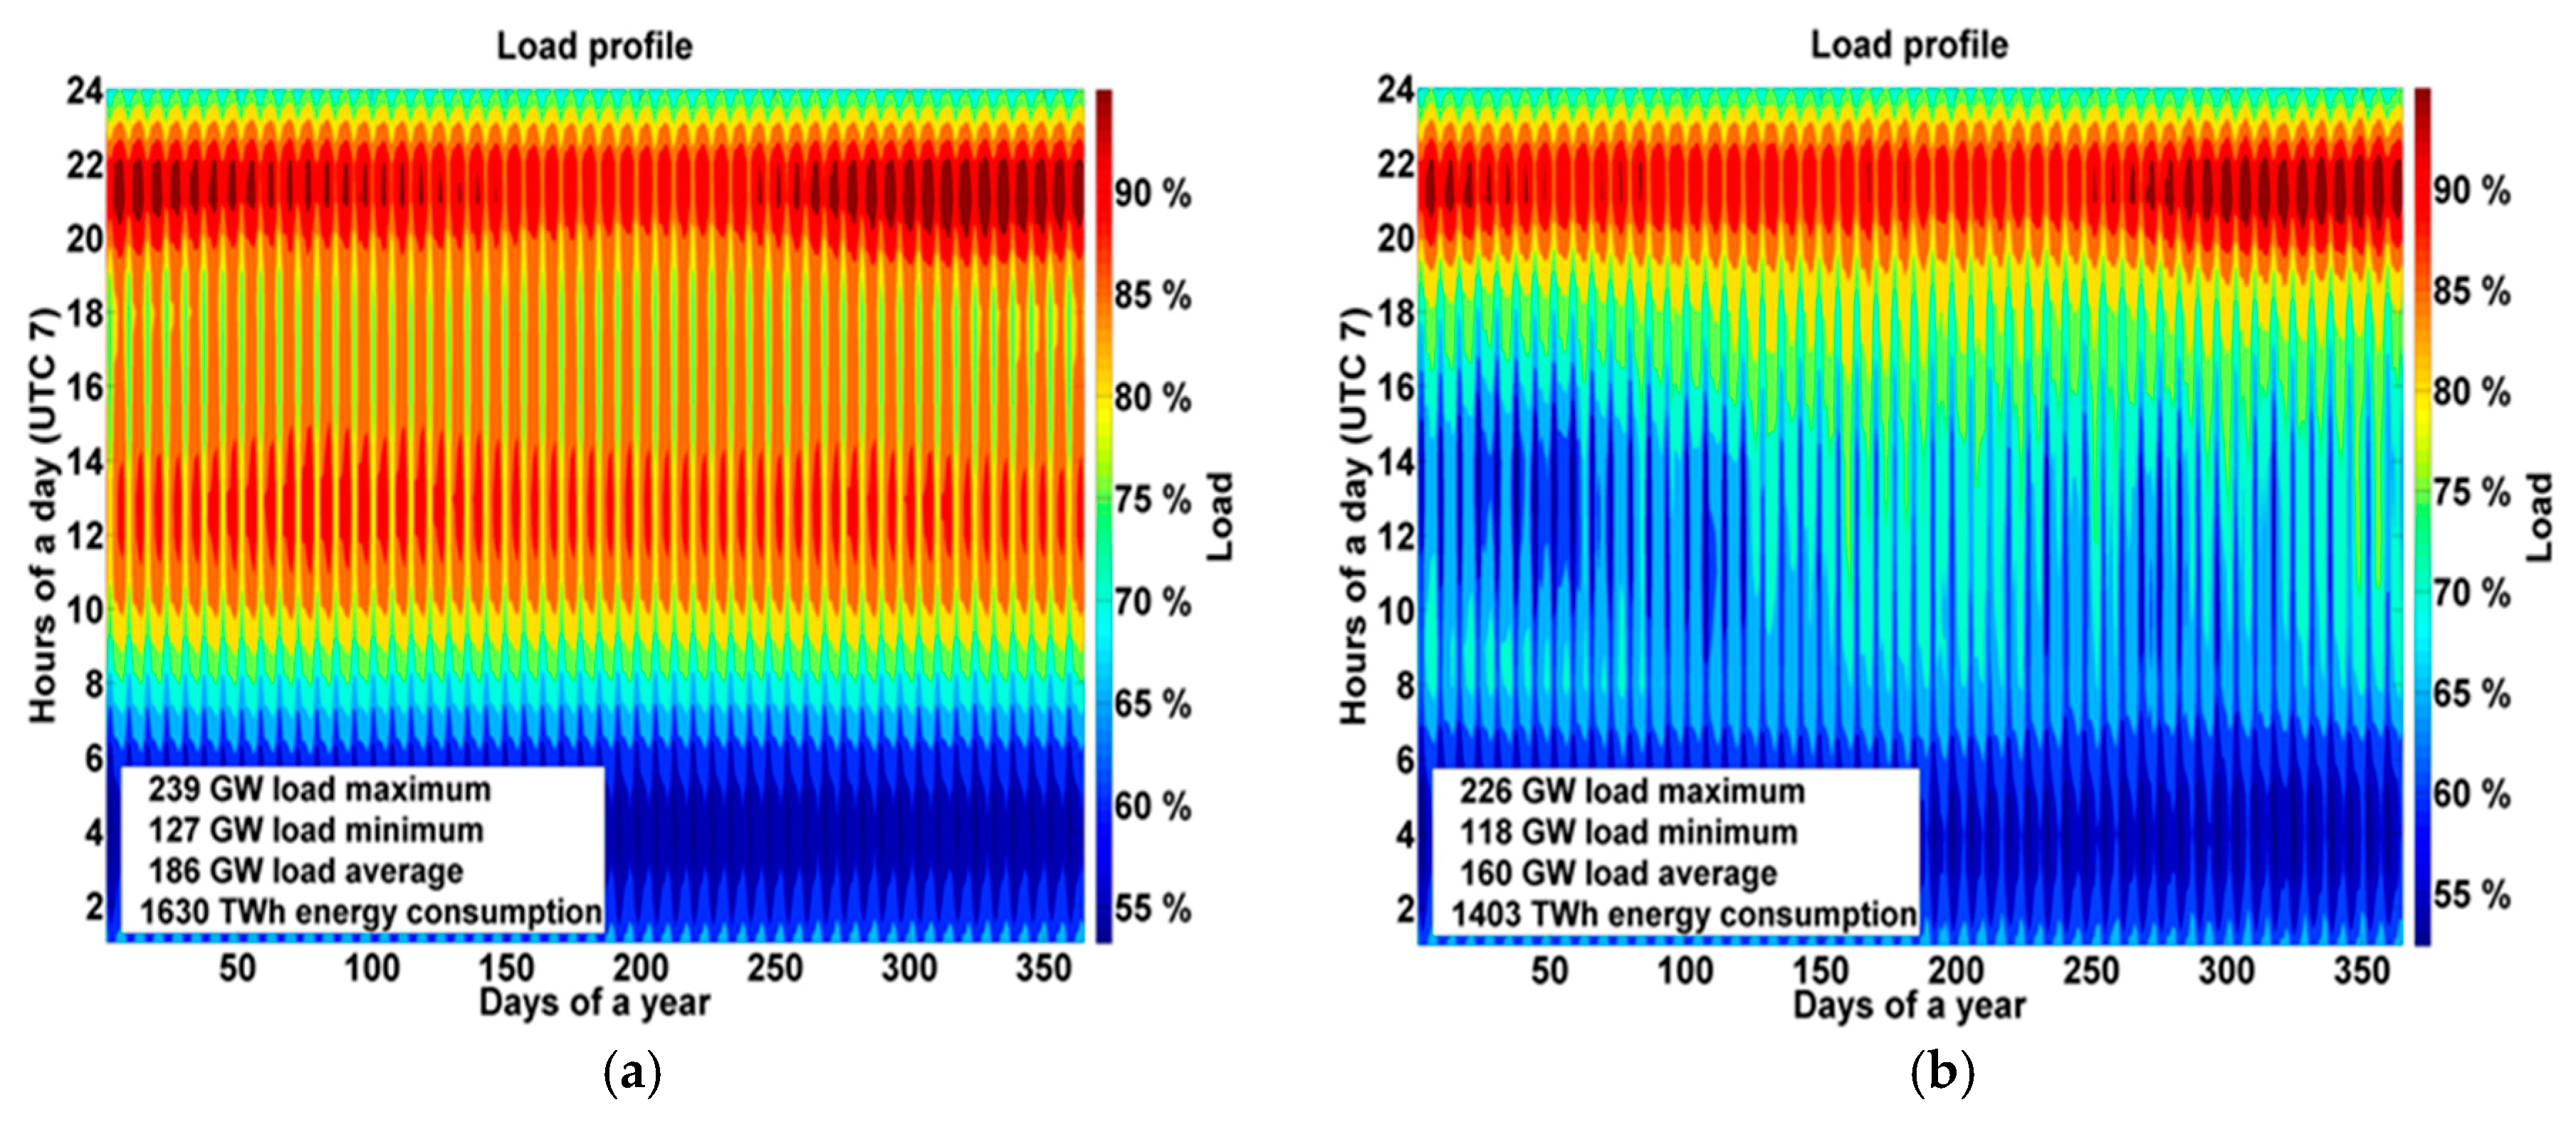
Supplementary Materials (Figure S6). It is observed that batteries are utilized on a daily basis with charging in the noon and afternoon hours, with discharging in the evening and night hours to satisfy evening demand. Something similar is observed for pumped hydro storage, but the frequency of discharge is less than batteries. Further, gas storage discharges in the summer months, due to peak loads associated with cooling demands resulting from hot and humid conditions in the ASEAN region. At this time of the year, we see the utilization of gas storage and A-CAES. PV self-consumption plays a large role in Southeast Asia due to higher electricity prices. PV self-generation covers 62.8%, 59.9%, 54.2% of residential, commercial and industrial prosumers demand, respectively. An overview of PV self-consumption is provided in
Supplementary Materials (Table S11).
The impact of A-CAES on the system parameters of Southeast Asia and Eurasia was studied in detail by Gulagi et al. [
63]. A-CAES could emerge as a valuable component in a portfolio of different storage options, as found by Fthenakis et al. [
64]. There is already long-term experience with the technology despite only two respective facilities. However, the geologic preconditions needed for A-CAES are available all over the world [
65]. Integration of A-CAES in Southeast Asia (a region with low seasonal variation and low wind energy share) does have an effect on the system in a positive way. However, this effect is more dramatic in Eurasia (a region with high seasonal variation and high wind share). A summary of the important system parameters taken from [
63] for Southeast Asia and Eurasia is given in
Supplementary Materials (Table S12). The utilization of low cost A-CAES decreases overall cost of the system by decreasing the share of other storage technologies used. Battery, gas and PHS output of electricity decreased by 5.5%, 1.6% and 0.4% in Southeast Asia. The installation of HVDC lines had a positive impact and decreased the utilization of storage technologies. This is due to the fact that the cost of transmitting electricity is lower in many cases than the cost of storage options. Due to the expansion of the grid, installed capacities of batteries, PHS, A-CAES, heat storage, PtG and gas turbines decrease. An overview of the storage capacities, throughput of storage technologies, full cycles and utilization of available A-CAES potential for the four scenarios for Southeast Asia and Eurasia is presented in
Supplementary Materials (
Tables S13 and S14, respectively) [
63].
The electricity generation curves for the area-wide scenario are presented in
Supplementary Materials (Figure S7). A full year divided into 8760 h is represented and sorted according to the generation minus the load, which is represented by a black line. The storage technologies are charged for about 3800 h of the year due to higher electricity generation than demand. The reason for high electricity generation can be attributed to the inflexibility of solar and wind energy and favorable conditions for these technologies in these hours in Southeast Asia. As a result, other flexible options such as hydro dams, biomass, biogas and discharge of storage technologies are required. As observed for the other hours of the year, the inflexible electricity generation options are reduced significantly as the electricity demand decreases and there is a need for flexible electricity generation options, discharge of storage technologies and utilization of the grid. There is not much curtailment in the whole year and it takes place for some hundred hours since for all the other hours the HVDC lines enable the export of the electricity from the best RE producing sub-regions to other sub-regions with remaining demand.
The grid utilization profile for Southeast Asia can be found in
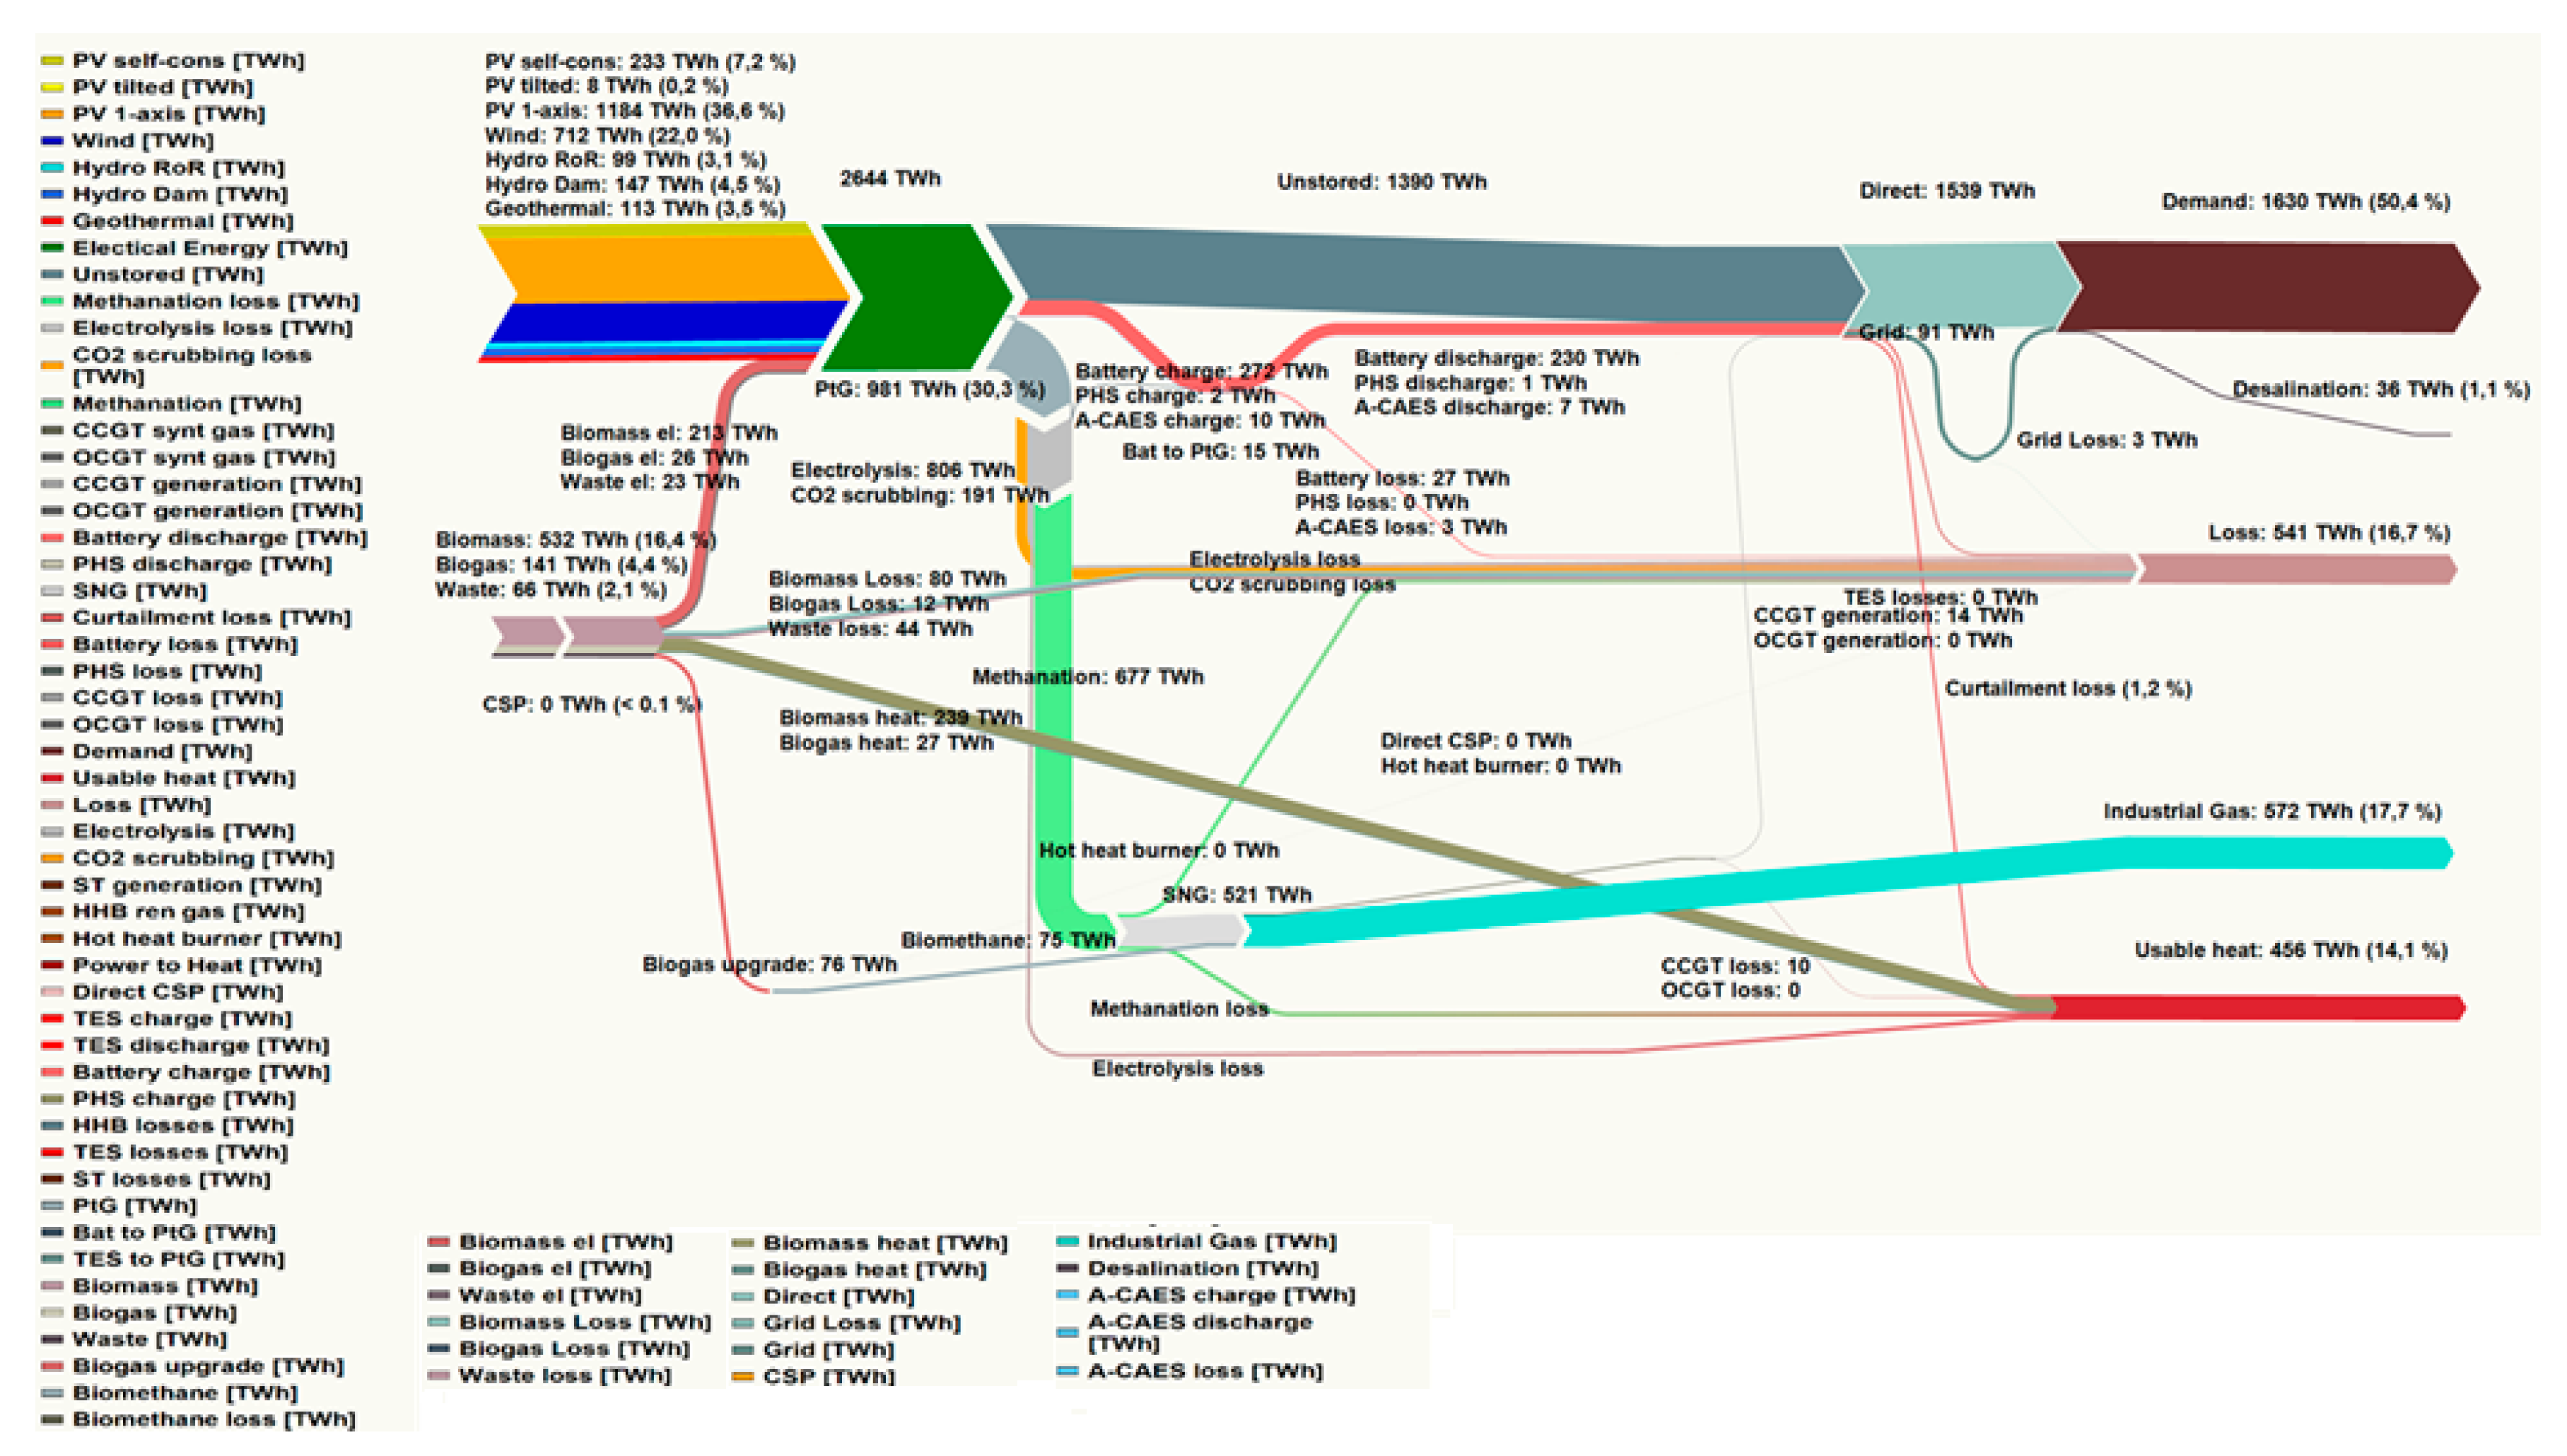
Supplementary Materials (Figure S8). An interesting observation can be made from the grid profile that the grid is mostly utilized in the morning hours. A possible explanation that can be provided is the seasonal variation in the ASEAN region, where most of the trading of the electricity takes place. This region consists of two major climatic patterns, summer from January to May, and the rainy season from May to December. In the rainy months, due to the overcast and cloudy conditions, there is a decrease in solar radiation. Therefore, to satisfy the morning or afternoon demands, transmission of electricity takes place between the regions. The capacities and utilization of the transmission lines between various regions is presented in
Supplementary Materials (Table S15). The energy flow of the system, from generation to demand in the integrated scenario, is presented in
Figure 8. This flow diagram consists of RE resources, storage technologies for the generated energy and the transmission of this energy via HVDC grids. The end use of electricity for the integrated scenario consists of electricity, desalination and industrial gas demands. The usable heat generated and the losses incurred are comprised of curtailed electricity; heat produced by biomass, biogas and waste-to-energy power plants; and heat generated from electrolyzers for transforming power-to-hydrogen, from the methanation process transforming hydrogen-to-methane, and from methane-to-power in gas turbines. Efficiency losses occurred in A-CAES, PHS, battery storage and HVDC transmission. The energy flow diagrams for the region-wide and area-wide scenarios are presented in
Supplementary Materials (
Figures S9 and S10, respectively).
6. Conclusions
Enough power can be generated from the RE technologies to cover all the electricity demand for the year 2030 on a cost level of 51–66 €/MWhel depending on geographical and sectorial integration. The cost parameter range when compared to non-renewable energy resources is significantly lower and the intermittency of renewables is effectively stabilized by grids and storage technologies to provide the hourly demand of electricity. In addition, the cost of primary energy generation is between 66–72% of the total cost depending on the scenario, which ensures that demand is always met at a modest cost. In addition to electricity demand, it is possible to cover the gas demand in the industrial sector by the PtG technology. The demand for heating in the industrial and residential sectors may be at least partly covered by the excess heat generated as a by-product of SNG generation and conversion of curtailed electricity. For all the scenarios, PV plays a major role followed by biomass and wind energy in all the regions apart from Australia, where PV and wind play an important role. For the region-wide scenario, the storage requirements are mainly based on batteries. The role of other storage technologies, especially A-CAES, has a vital role in the region-wide scenario as a mid-term storage between batteries and PtG particularly in areas of high wind share and high seasonal variation. The HVDC transmission grid plays a role in the trading of electricity in the ASEAN countries, where trading is more cost competitive than local storage technologies available. However, in some cases, due to long distances, local storage technologies are more cost competitive than transmission of electricity. This is also observed in the case of A-CAES, where grid integration reduces the economic benefit of this particular storage technology but other storage technologies such as batteries and PtG are still required. Due to this, the system configurations for a region-wide and area-wide open trade scenario are very similar. A slight increase of 3–4% in the total cost of electricity because of PV self-consumption is due to the utilization of solar electricity and in particular respective batteries for self-consumption at a higher cost level. In addition, disturbances in the system due to the excess electricity generated from prosumer increases system’s need for additional flexibility, while reducing the most costly peak hours in the year. In the case of an integrated scenario, it was found that seasonal SNG storage is largely substituted by industrial SNG generation for the electricity sector. In the case of energy deficit, instead of using gas turbines the system restricts SNG production as a major source of flexibility.
More research is required that investigates how to utilize the waste heat generated in the system and to better understand a fully integrated renewable energy system in Southeast Asia and the Pacific. However, this research indicates that a 100% RE system is reachable in Southeast Asia and the Pacific, and more cost competitive than a nuclear-fossil fuel option.


