
Experimental and Numerical Analyses of a Flat Plate Photovoltaic/Thermal Solar Collector


1
Department of Industrial Engineering, University of Naples Federico II, P.le Tecchio 80, 80125 Naples, Italy
2
Department of Engineering, University of Naples Parthenope, Centro Direzionale IS.C4, 80143 Naples, Italy
3
Department of Civil and Mechanical Engineering, University of Cassino and Southern Lazio, V. Di Biasio 43, 03043 Cassino, Italy
*
Author to whom correspondence should be addressed.
Energies 2017, 10(4), 491; https://doi.org/10.3390/en10040491
Submission received: 2 February 2017
/
Revised: 28 March 2017
/
Accepted: 31 March 2017
/
Published: 6 April 2017
(This article belongs to the Special Issue Solar Cooling and Heating)
Abstract
:This paper presents a one-dimensional finite-volume model of an unglazed photovoltaic/thermal (PVT) solar collector. The unit consists of a conventional solar photovoltaic (PV) collector coupled with a suitable heat exchanger. In particular, the collector includes a roll bond heat exchanger and it is not equipped with back and frame insulation. The system is discretized along the flow direction (longitudinal) of the cogenerative collector. For each finite-volume element of the discretized computational domain, mass and energy balances are implemented. The collector geometry and materials parameters are taken from a commercially available device. An on-field experimental investigation is performed in order to validate the proposed model. The model is used to evaluate both electrical and thermodynamic parameters for each element of the domain and for fixed operating conditions. Finally, a sensitivity analysis is also performed in order to investigate the energetic performance of the cogenerative collector as a function of the main design/environmental parameters.
1. Introduction
During the lasts decades of the past century, issues concerning energy availability and environmental impact of the utilization of fossil fuels have become more and more relevant for the worldwide scientific community and international organizations, as well as for national governments. This scenario has led to the investigation of alternative, sustainable and environment-friendly energy sources. In this context, the development of renewable energy sources has become a crucial issue for researchers, manufacturers, designers and policymakers.
In this framework, solar energy is one of the most promising renewable energy sources since it suitably fits with sustainable development objectives and it can be exploited worldwide [1], along with biomass [2], wind [3] and hydropower [4]. In the majority of applications, solar energy is used to produce separately thermal and electrical energy by solar thermal collectors [5,6] and photovoltaic panels [7,8], respectively. However, a possible improvement of both technologies consists in the hybrid photovoltaic/thermal (PVT) collector, which allows one to produce simultaneously thermal and electrical energy using the available solar radiation [9,10].
A PVT solar collector consists of an integration of a photovoltaic (PV) panel in a conventional solar thermal collector, coupled together in a single cogenerative unit [11]. In particular, the process used to manufacture the PVT collector consists in the encapsulation of the photovoltaic film above the absorber of the conventional solar thermal collector. The application of hybrid PVT collectors leads to an increase of energy output per unit of collector area with respect to the conventional solar thermal or photovoltaic panels [12]. In particular, the main advantage of the PVT collector lies in the possibility of cooling the photovoltaic cell supplying low-temperature thermal energy and possibly enhancing PV electrical efficiency. In fact, PV operating temperature is a key factor dramatically affecting the panel electrical efficiency [13]. The lower the cell temperature, the higher the electrical efficiency is. Thus, in order to achieve a better electrical performance of the PVT collector compared to a conventional PV module under the same irradiance conditions, the PVT cooling fluid must operate at a relatively low temperature (20 °C–50 °C) [14]. For this reason, PVT collectors are well suited for low-temperature applications, as residential users [15,16], swimming pools [17], building integrated systems [18,19], etc.
Several numerical and/or experimental analyses have been performed in the literature in order to investigate the performance of PVT cogenerative collectors [20,21]. Su et al. [22] investigated the electrical and thermal performance of a photovoltaic–thermal solar collector equipped with dual channels for different fluids. In particular, the combinations of water and air fluids are used in order to investigate the dual channel configuration. The results show a better performance in case of water for both PVT collector channels compared to the other combinations, consisting of an electrical and thermal efficiency equal to 7.8% and 76.4%, respectively, with a mass flow rate of 0.15 kg/s. Shyam et al. [23] presented an experimental set-up consisting of an installation of PVT water collectors connected in series performing an analysis of its annual energy gain, exergy gains, CO2 mitigation, energy matrices and carbon credits. Different weather conditions of New Delhi were used in order to validate a theoretical model developed by the authors. A ratio between thermal energy and exergy generated in a year of about 9.5 is found, along with an energy pay-back time of 1.50 years calculated on the overall thermal energy basis. Kalogirou and Tripanagnostopoulos [24] performed a numerical simulation of hybrid PVT solar systems for both passive and active domestic hot water installations in order to evaluate the performance of the collectors in terms of electrical and thermal efficiencies. Polycrystalline and amorphous silicon cells are used for the two PVT collector models, and the system is analyzed for Nicosia, Athens and Madison climatic conditions. The results show that the electrical energy production ranges from 222 to 532 kWh for the considered locations, and the solar contribution varies from 29% to 72%. Khelifa et al. [25] presented a finite-difference model of a sheet and tube PVT collector based on energy balance equations and coupled differential equations. The hybrid PVT collector is investigated theoretically and experimentally, and the model is used to calculate fluid and collector temperatures. The results outlined a PV cell temperature reduction for the PVT collector of 15–20% compared to the one achieved by a conventional PV panel ranging from 60 to 80 °C. Ben Cheikh el Hocine et al. [26] developed and simulated a typical PV/T collector by means of a detailed model in order to investigate its thermal and electrical performance. Polycrystalline PV cells and galvanized iron absorber are used to manufacture the hybrid collector. The model results are compared with experimental data, and a good agreement is achieved. PVT thermal efficiency resulted around 55% and 16% with water and air heat exchange, respectively, while the electrical efficiency of about 11% for both heat exchange fluids was achieved. Aste et al. [27] studied a uncovered hybrid collector system and developed its mathematical model for a simulation under there different climatic conditions (Milan, Paris and Athens). Moreover, outdoor conditions are used for the calibration and validation of the commercial PVT unit model. Numerical results showed a good agreement with measured data, and an electrical efficiency of about 14% is estimated for all the analyzed locations. Yazdanifard et al. [28] modeled and simulated a flat plate PVT system with and without glass cover under both laminar and turbulent water flow regime. The authors used the available literature data in order to check model accuracy, and they also investigated the system performance as a function of solar irradiation, Reynolds number, packing factor, collector length, pipes diameter and number of pipes parameters. The results highlighted a better energy efficiency for the PVT collector with glass cover compared to the unglazed one, showing also that in laminar flow regime the effect of the considered parameters is more significant with respect to the turbulent one. Nualboonrueng at al. [29] experimentally investigated two types of PVT collectors integrating amorphous and multi-crystalline silicon PV panels, under the outdoor climatic conditions of Bangkok. On-field results showed that the electrical energy production of multi-crystalline silicon PVT collector is 20% higher compared to the amorphous silicon one, whereas the thermal production resulted practically the same. In addition, thermal and electrical efficiencies of about 50% and 4–5% have been achieved by the hybrid system. Jarimi et al. [30] analyzed a bi-fluid PVT solar collector from a theoretical and experimental point of view be means of a 2D model and steady state analysis. In particular, the operation of the collector was investigated in case of only air or water fluid operation and also with both fluids. Three different methods of error analysis have been used (root mean square percentage deviation, coefficient of determination and mean absolute percentage error) and a good agreement was found between experimental and simulation results.
As described above, a significant number of papers available in literature deals with numerical and experimental investigations of PVT collectors. The majority of them is based on simplified lumped models and large sample time intervals for the experimental investigation (1 h). Moreover, the papers available in the literature highlight a scarce number of analyses of cheap low-tech flat plate PVT collectors without glass cover and thermal insulation. In fact, the majority of papers focus on conventional and expensive PVT units. Low tech PVT collectors have a worse thermal performance compared to the conventional PVT ones (due to the higher thermal losses), while the electrical one can be even better due to the lower operating temperature and absence of glass cover, reducing PV incident radiation. In general, this leads to a worse overall efficiency of the uncovered and not insulated PVT collectors compared to the traditional ones. However, this performance reduction is counterbalanced with a significantly lower capital cost for the low-tech units compared to the conventional PVT ones. This is a crucial point, since the massive commercialization of PVT collectors is mainly limited by their extremely high capital cost. In fact, the capital cost of a not insulated and uncovered PVT collector is only slightly higher compared to a PV unit, because a simple absorber is added to a standard PV panel. In particular, the specific cost of a PV module is about 370 €/m2 [31], while, for the PVT collector here investigated the cost is estimated in 420 €/m2, according to the manufacturer data. It is worth noting that, the cost of the low-tech collector is significantly lower compared to the one of a conventional glazed PVT unit, which is equal to 600 €/m2 [32]. As previously mentioned, this cost difference is due to the integration of a glass cover and thermal insulation, which allows one to achieve a better thermal performance in case of traditional PVT collector.
The majority of the numerical and experimental studies available in literature mainly focus on conventional glass-covered and insulated PVT collectors. Therefore, a significant research effort must still be performed in order to investigate the cost/benefits of the low-cost PVT collectors. In this framework, the novelty of the paper consists in the development of a suitable thermodynamic model and an on-field experimental analysis of such low cost/tech PVT collector, in order to prove the technical feasibility of this device and to develop a suitable tool to be used to predict its performance. To the best of authors’ knowledge, such analyses are missing in literature for this type of low-cost PVT collector. Furthermore, in authors’ knowledge such kind of collector has never been analyzed in the available literature works by means of one dimensional finite-volume model.
Therefore, this paper aims at covering these lacks, presenting an experimental investigation and a finite volume model of an unglazed and not insulated flat plate PVT collector. In particular, a “Janus” PVT panel, manufactured by the Italian company AV Project Ltd. (Avellino, Italy), is considered in order to perform the analysis. It consists of a commercial polycrystalline hybrid collector, suitable for low temperature applications, as water heating during summer season. The experimental investigation is performed by means of an outdoor set-up installation, located at the Company headquarter in Avellino (Southern Italy), while the simulation model of the collector is developed by the Engineering Equation Solver (EES) software. The data collected by the experimental analysis are compared with the numerical results carried out by the simulation. The thermal/electrical performance and temperatures of the PVT layers are evaluated for each slice of the computational domain. Finally, a sensitivity analysis is performed in order to investigate the performance of the PVT collector under different operating parameters: fluid inlet temperature, fluid mass flow rate and irradiation.
2. Collector Description
The Janus PVT collector [33] consists of a roll bond type with a PV panel integrated above the absorber. In particular, a high efficiency polycrystalline silicon panel is used for the photovoltaic module, and the aluminum absorber is equipped with a separated double circuit in order to distribute the cooling fluid across the absorber channels. The unit is a low-cost PVT collector suitable for low temperature heating in mild-hot climates, thus the collector configuration does not include any glass cover and back/frame insulation. More in detail, the PVT collector consists of a series of layers:
- -
- solar glass cover, used to protect the PV panel against the outdoor conditions;
- -
- photovoltaic module, encapsulated by two ethylene vinyl acetate (EVA) protecting films;
- -
- back-sheet, consisting of a dielectric material, essentially polyethylene terephthalate (PET);
- -
- butyl adhesive, used to bond the photovoltaic module and the absorber;
- -
- roll bond aluminum absorber, consisting of two aluminum bonded sheets (one of them with a channel profile).
The dimensions of the collector are 1644 mm of height and 992 mm of width, while the useful area of the photovoltaic module is 1.44 m2. The absorber plate is equipped with 48 trapezoidal channels, with the lengths of the two parallel sides of 10.0 and 6.6 mm, and a height of 1.6 mm. The collector operating fluid, flowing inside the channels of the absorber, is water, and the channels configuration allows one to operate the unit at a maximum operating flowrate of 100 L/h. Further technical data of the Janus PVT collector are reported in [33].
3. Numerical Model of the Collector
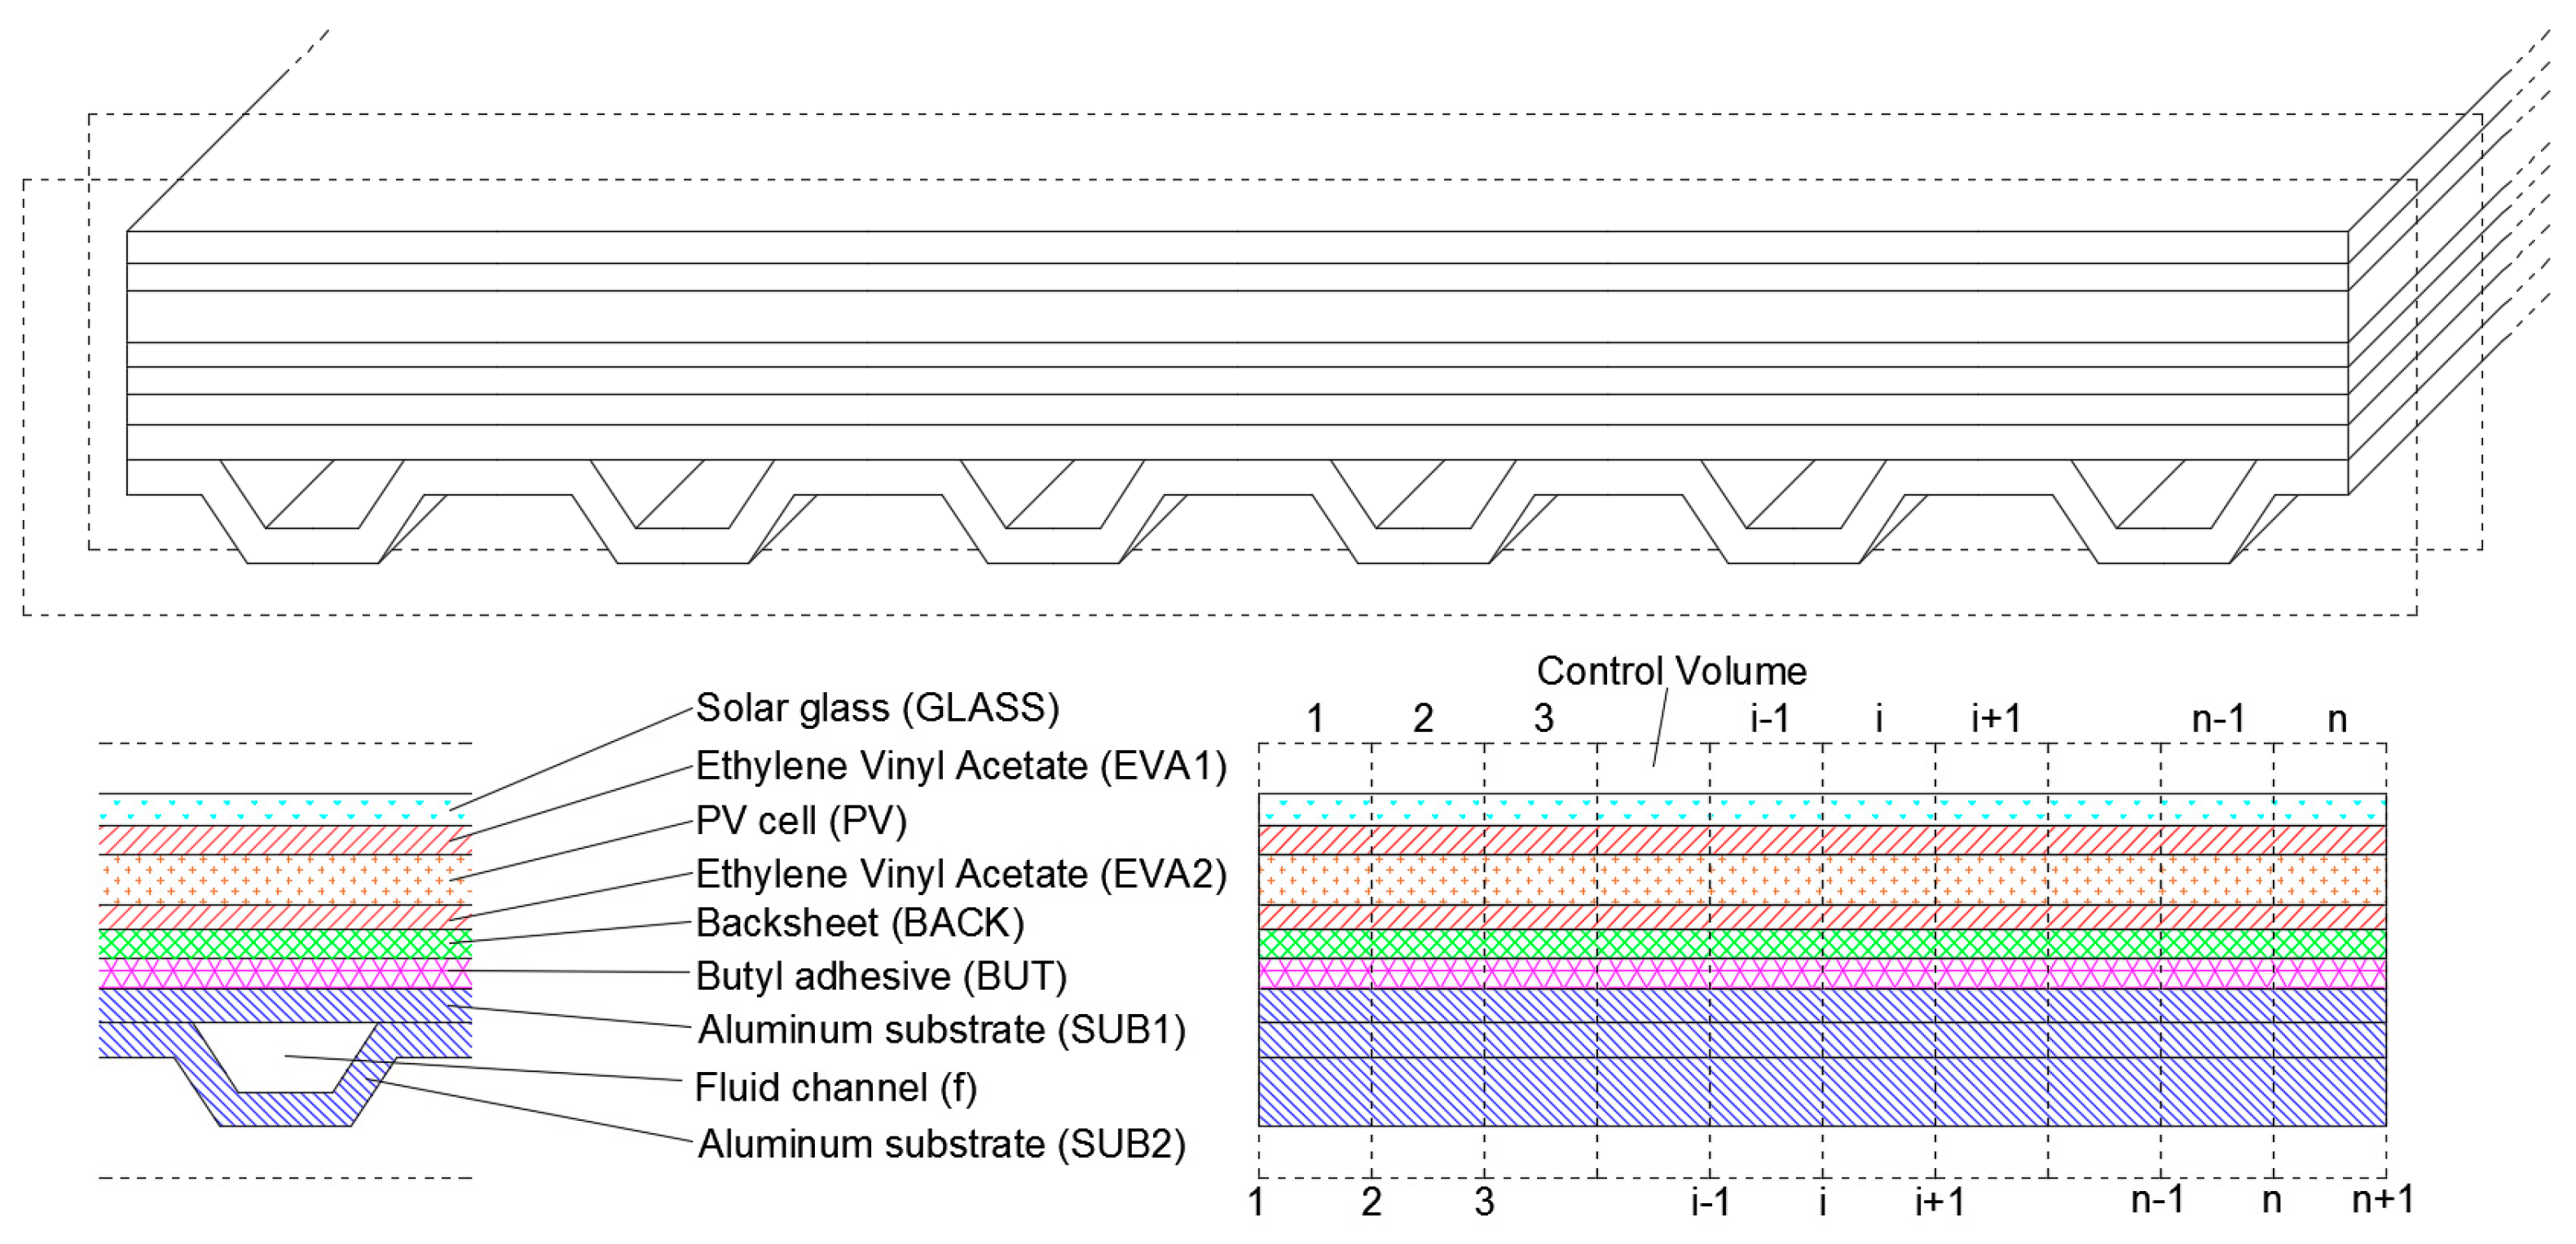
A 1-dimensional finite volume model is developed in order to simulate the performance of the Janus PVT collector and to compare the experimental and numerical results. In particular, the model calculates the thermodynamic parameters and thermal and electrical powers along the direction of the heat transfer fluid passing through the PVT collector. The collector is homogenously discretized along its longitudinal axis in n elementary slices, thus, n + 1 nodes of the computational domain are considered (Figure 1).
The model is based on mass and energy balance equations, implemented for each computational domain element using Engineering Equation Solver (EES) software, a general equation-solving tool. The software solves coupled non-linear algebraic and differential equations, and its main feature consists of detailed database and routines for the calculation thermodynamic and transport properties. The feature is used to calculate the thermo-physical properties of the fluids involved in the heat transfer of the collector: air (for the surrounding environment) and water (the collector heat exchange fluid). For the formulation of the model, several assumptions are adopted:
- -
- division of each collector slice in nine layers, as shown in (Figure 1): glass cover, first EVA film, PV, second EVA film, PET back-sheet, butyl adhesive, fluid channels and two aluminum substrates (roll bond absorber);
- -
- steady-state conditions;
- -
- collector thermodynamic equilibrium;
- -
- negligible kinetic and gravitational terms in the energy balances;
- -
- uniform distribution and absorption of the solar radiation on the photovoltaic module surface;
- -
- constant thermal conductivity of solid materials;
- -
- uniform temperature distribution in each solid material of the computational domain element;
- -
- linear variation of the fluid temperature between the inlet and outlet of the domain element;
- -
- perfect bond between the layers of the collector;
- -
- grey-body radiative behavior the aluminum substrate;
- -
- hemispherical scheme assumption for the calculation of the infrared radiation heat transfer between the PVT collector top/bottom and the sky/ground;
The adopted model assumptions imply that the transversal temperature gradients in each layer are negligible compared to the longitudinal ones [25,34]. In addition, in order to support this assumption, the Biot number [35] is also calculated for both glass cover and bottom aluminum substrate, considering the typical operation conditions of the collector. The adimensional number resulted for glass cover and bottom aluminum substrate in the order of magnitude of 10−2 and 10−5, respectively. For such condition, the heat transfer phenomena within the collector layers occurs mainly across the longitudinal direction of the collector (fluid flow direction). Moreover, the model neglects any possible interfacial thermal resistance between the layers of the collector. Such assumption is widely adopted in literature [21,25] and it is consistent with the PVT industrial manufacturing process which allows one to avoid any air gap between the different layers.
For the computational domain, the fluid inlet thermodynamic conditions for slice 1 are the boundary conditions used for the simulation of the PVT collector. The same temperature and pressure conditions of the fluid exiting and entering the i-th and i-th + 1 slice, respectively, are assumed. In order to reduce the linearization error of the temperature profile and to achieve a reliable simulation time, a number of n = 20 elements are adopted for the simulation.
The mathematical model is based on nine energy balance equations. The first one considers the control volume including the collector and the surrounding air:
The second balance is based on the control volume including glass cover and PV layer:
For the third balance, the control volume within EVA films 1 and 2 is considered:
The fourth balance concerns the control volume within PV film and PET back-sheet:
The fifth balance is written for the control volume including EVA film 2, PET back-sheet layer and butylic adhesive:
The sixth energy balance considers the PET back-sheet layer, butylic adhesive and aluminum substrate 1 as control volume:
The seventh balance control volume includes butylic adhesive, aluminum substrate 1/2 and fluid channel, delimited by the channel width:
The eight energy balance is written for the control volume containing aluminum substrate 1/2 and the fluid channel, delimited by the channel width:
The ninth balance concerns the control volume including fluid channel, aluminum substrate 1 and bottom air, delimited by the channel width:
The convective heat transfer coefficient between glass cover and air is calculated with the following correlation [35]:
where local Reynolds and Prandtl numbers are considered. Such adimensional numbers are calculated using the following temperature and characteristic length:
Equation (10) holds true for the following conditions: isothermal surface, forced convection, Reynolds number < 5∙105 and Prandtl number ≥ 0.6. The first one is consistent with the assumptions of the model, while the second one is suitable with the real operating condition of the collector. In order to verify the applicability of Equation (10), Re and Pr numbers have been calculated for the operating conditions of the collector. Such adimensional numbers resulted within the values of the previously stated limits.
The same Equation (10) and characteristic lengths are used to calculate the convective heat transfer coefficient between aluminum substrate 2 and air, while a different temperature is considered:
The model also calculates the fluid heat transfer coefficient and the pressure drop in each domain element. Note that, the liquid water is assumed as cooling fluid. The operating conditions of the PVT collectors in terms of fluid flowrate ensure a laminar flow regime within the collector channels. Thus, the Nusselt number and the friction factor are assumed constant and equal to 5.02 and 77.5 [35], respectively. The fluid heat transfer coefficient is calculated as follows:
where d is the equivalent diameter of the channel, calculated as:
The pressure drop for each computational domain is written as:
Note that, the following temperature and pressure are used in order to calculate the fluid properties:
The calculation of the thermal resistance of each solid material is performed taking into account the thickness and thermal conductivity of the material, according to the following equation:
Finally, the calculation of the electrical efficiency of the polycrystalline silicon cell in each element of the domain is performed by means of the following equation:
while the thermal efficiency of the PVT collector element is calculated as:
The model of the collector is based on several parameters, consisting of the properties of the materials and photovoltaic cell performance data. Such parameters are obtained from manufacturer data, reported in Table 1.
4. Experimental Set-Up
The experimental set-up consists of a solar system installation that includes four Janus PVT collectors connected in parallel. Other main components (Figure 2) of the experimental system are:
- water storage tank, BSV ELBI vitrified tank, used to store the thermal energy supplied by the collectors by means of an internal one-pipe heat exchanger. The tank also includes an internal electrical resistance used to supply eventual auxiliary heat to the tank water in order to achieve a fixed set point temperature;
- connecting pipes, consisting of flexible multilayer pipes, used to connect the internal heat exchange coil of the tank to the collectors;
- expansion vessel, used to avoid the overpressures of the fluid due to the increasing fluid temperatures, allowing the expansion of the fluid;
- safety valve, installed in order to ensure a maximum operating pressure of the plant and to avoid overpressures that may cause connection disjunctions;
- circulation pump, WILO Yonos PARA ST 7.0 PWM2 model, installed for the circulation of water between the internal coil of the heat storage tank and the solar collectors. Such pump is selected taking into account the total loss of pressure within the solar loop, consisting of about 0.324 bar of distributed and concentrated pressure losses.
In order to monitor the system operation, a suitable measurement equipment is installed, consisting of:
- a Multicon Simex CMC14multifunction data logger used to simultaneously measure and control several system parameters, as temperatures, solar radiation, fluid flowrate;
- a, SolarEdge PV regulator/inverter system consisting of a highly efficient single-phase inverter coupled with a power optimizer, used for maximizing the power output of each PV module and for a real time monitoring of the panels performance;
- a SMC LFE 1D4F1 flowmeter used to measure the water flow within the solar circuit;
- a LP PYRA 02 AC pyranometer used to measure the solar total radiation;
- PT100 thermoresistances and K type thermocouples for measuring the temperature.
In particular, PT100 probes are used to measure the inlet/outlet of the in the PVT collectors configuration and air temperature, while K type sensors are used to measure PVT bottom side and ground temperature. In particular, the bottom side sensor has been positioned at half length/width of the collector. The specification of the main components and of the measurement equipment is reported in Table 2.
5. Experimental and Numerical Results
The experimental setup presented in the previous section was previously used in order to compare energetic performance of PVT collector with respect to the one of conventional PV collectors, as shown in [33]. In that analysis, authors aimed at performing energy balances on the collector by means of a lumped model. Conversely, the scope of the present paper is to compare experimental data with the numerical one obtained with the developed 1-D model of the collector. Therefore, in order to achieve this goal, the experimental setup previously installed [33] was suitably rearranged in order to measure all the parameters involved in the 1-D heat transfer process of the collector. In fact, the study focuses on the numerical analysis of the collector performance across the fluid flow direction (for each element domain), and a global performance analysis of the collector for different operating conditions is also performed. In particular, the entire experimental data collected during the investigation is reported, and the numerical results are compared with the experimental ones in terms of outlet fluid and bottom aluminum substrate temperatures. In addition, measured and simulated electrical powers are also compared. It is important to note that, the experimental set up consists of four Janus PVT collectors connected in parallel and the fluid temperature sensors are installed on the inlet and outlet of such configuration. Therefore, the flow rater meter can measure only the overall flow rate, flowing in all the four PVT collectors. Conversely, the simulation model considers only one PVT collector. Therefore, in order to perform the experimental vs. numerical comparison, it is assumed that the overall mass flow rate is divided in four identical flows to be supplied to the four PVT collectors. This assumption is very reliable because the fluid distribution circuit is hydraulically balanced and there is no device that may cause a non-uniform flow distribution among the four PVT collectors.
Furthermore, constant operating and environment conditions are used to investigate the profile of temperatures, thermal/electrical powers and efficiencies across the longitudinal direction of the PVT collector. Finally, the collector fluid outlet temperature, thermal and electrical efficiencies are analyzed as a function of the inlet fluid temperature and irradiation. For such analysis, the nominal fluid flowrate is assumed.
5.1. Experimental vs. Numerical Results
The measurements are performed during an about 3.5-h operation of the PVT system, from about 1:30 p.m. to about 5:00 p.m. of 23rd September 2016. During such operation, the Multicon Simex data logger measures and stores the following parameters: solar radiation (I), the PVT outlet (TPVT,out) and inlet (TPVT,in) water temperature, the PVT bottom side temperature (TPVT,botton), ambient air (Tamb) and ground (TGROUND) temperature. The measurement of such parameter is performed with a sample time of 1.00 min. Moreover, the measurements are performed setting the water flow rate equal to 5.00 L/min, thus, corresponding to 1.25 L/min per each collector.
Figure 3 shows the measured data during the experimental activities. The trend of the solar radiation fluctuates due to the variation of the cloudiness during the day, while almost constant trends of the ambient air and ground temperature are recorded. In particular, the solar radiation results above 700 W/m2 for less than one hour from the beginning of the measurements, and during the central hours of the day the value oscillates around 400 W/m2. The outlet fluid temperature is higher than the inlet one only at the beginning/end of the measurements time period, due to the scarce availability of solar radiation during the central part of such time interval. As a consequence, after 2:00 p.m. PVT outlet temperature decreases, and it becomes slightly lower than the inlet one. It is worth noting that, as expected the trends of the PVT bottom side and the PVT outlet temperatures are rather similar.
The dynamic data collected by the experimental measurements is used in order to perform the numerical simulation of the PVT collector. In particular, the measured PVT inlet, ambient and ground temperature, solar irradiation and the constant mass flow rate are used as boundary conditions for the model, obtaining a data set used to simulate the PVT collector for each time step in which the experimental data is collected. By this technique, the numerical results are compared with the experimental ones (fluid outlet and bottom aluminum substrate temperature and electrical power output).
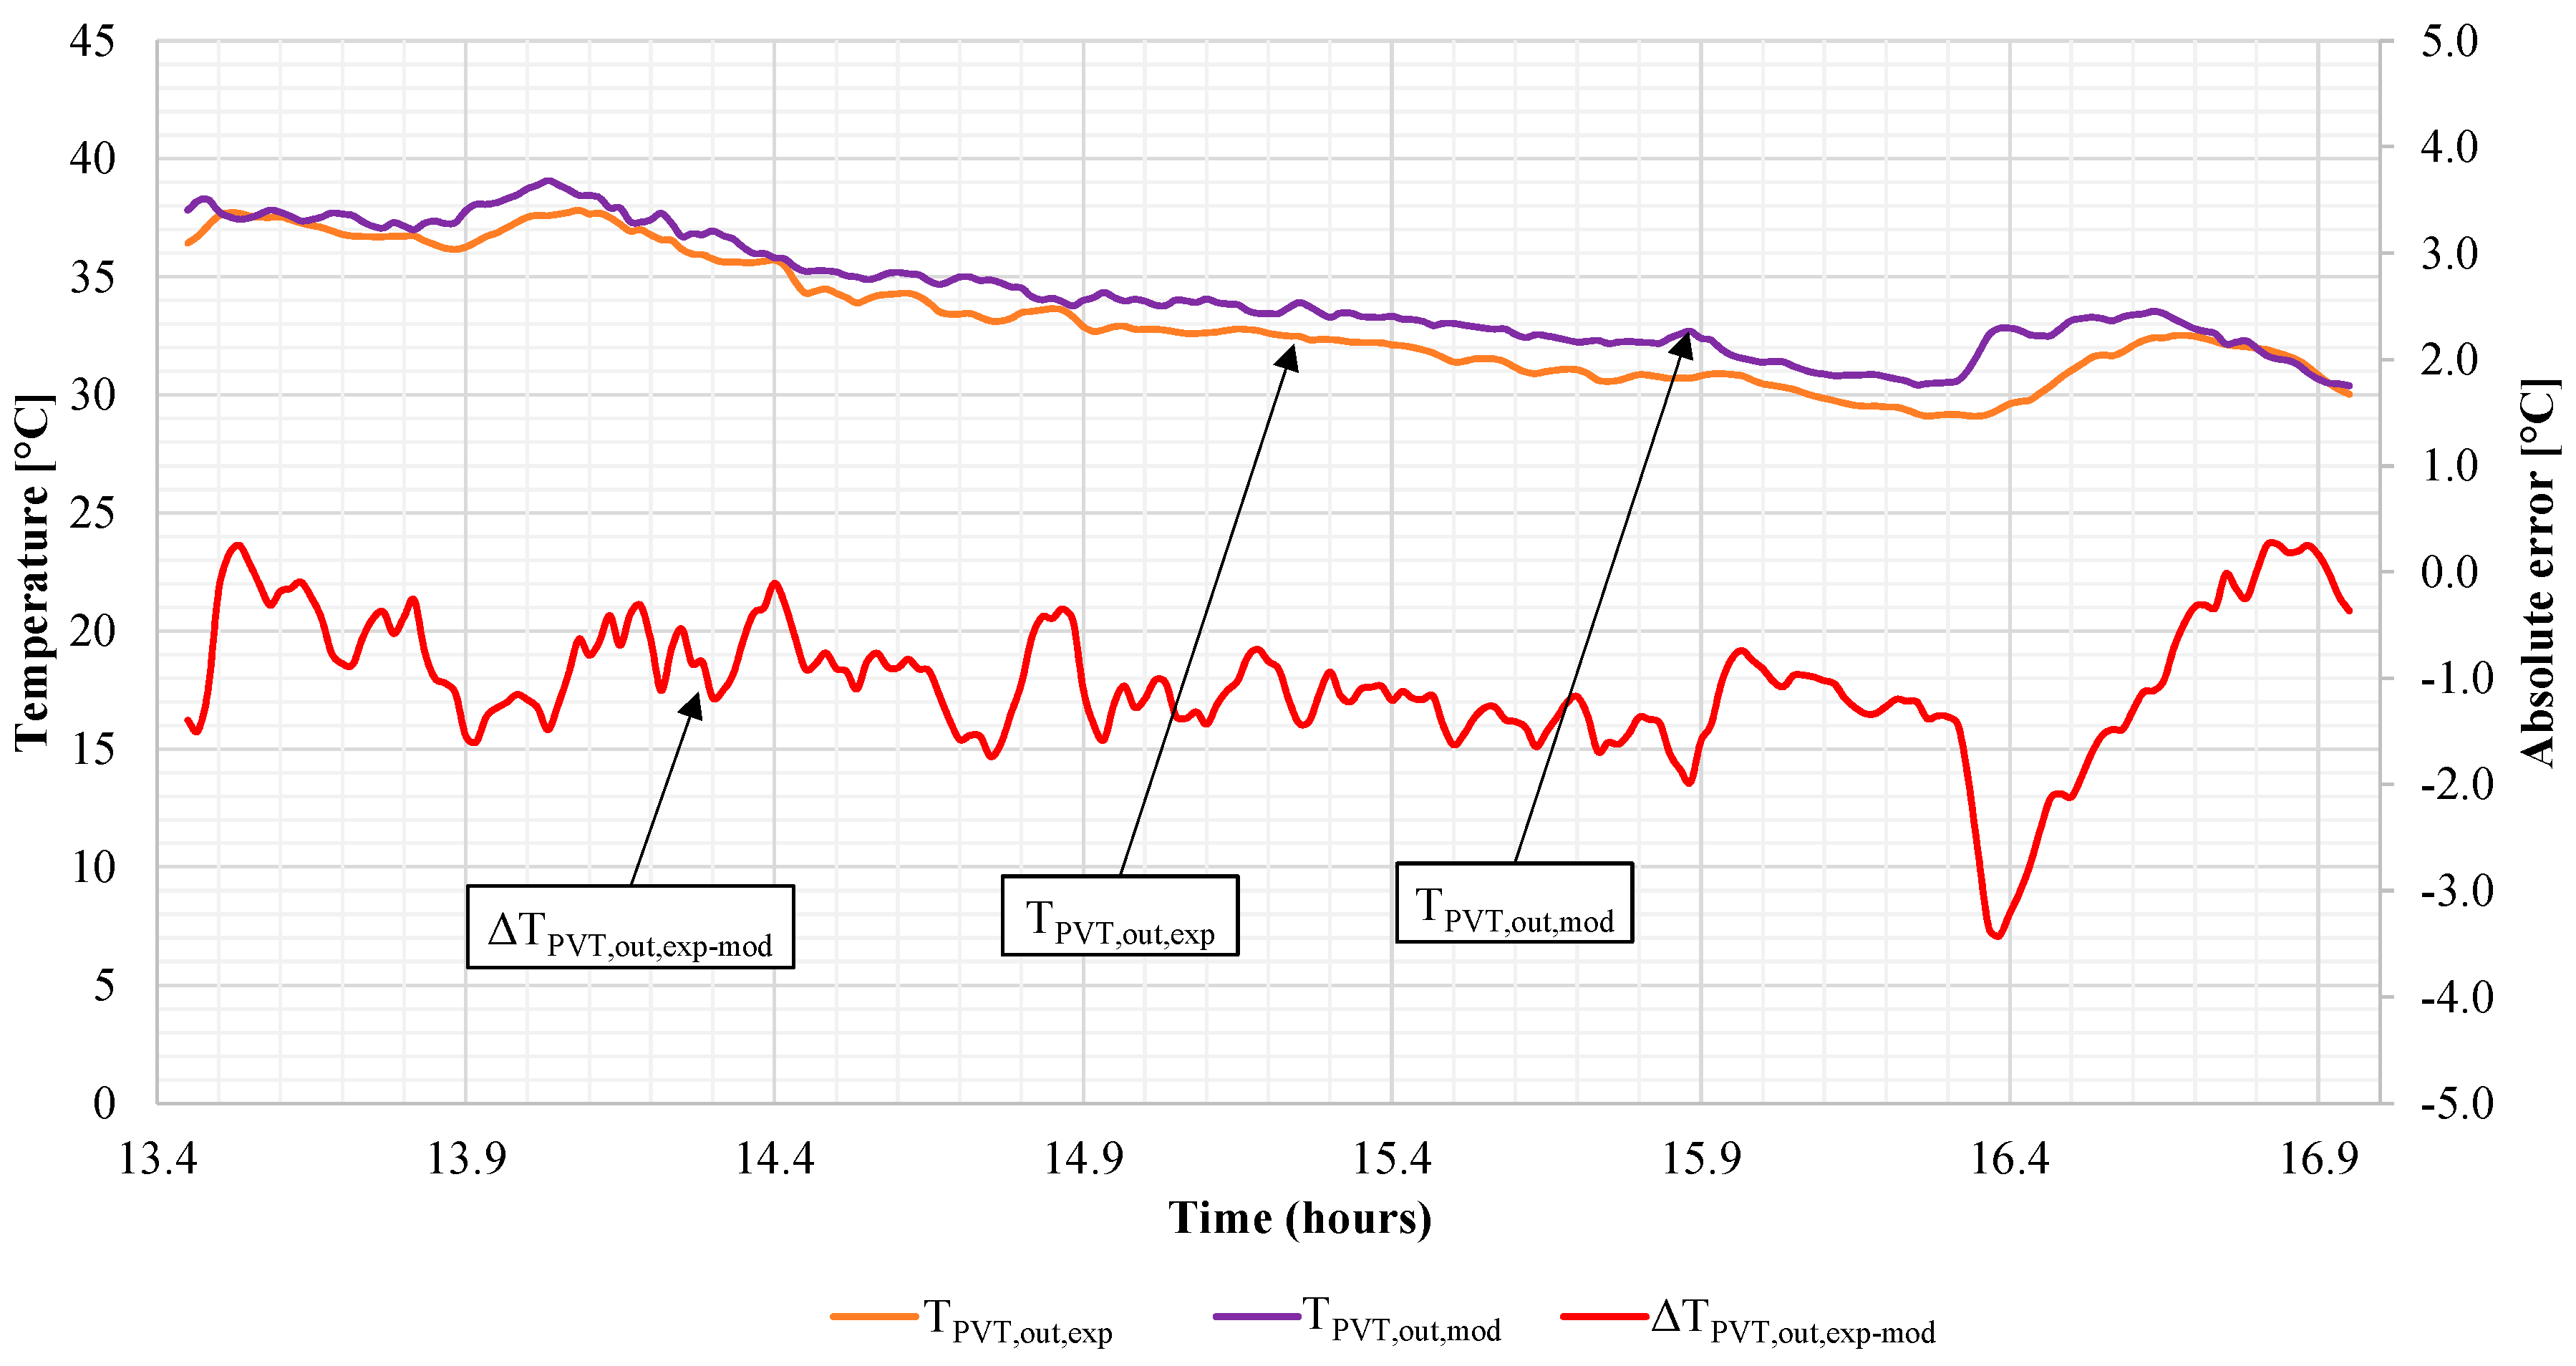
Figure 4 shows the measured and calculated PVT outlet temperature. In addition, in such figure the absolute error, calculated as the difference between the measured value and the calculated one, is also reported. In Figure 4 it is clearly shown that the developed model follows the experimental data trend, in particular it slightly overestimates the PVT outlet temperature. Higher differences between model and experimental results are achieved during the time periods in which there is a significant variation of the solar radiation, for e.g., from about 4:20 p.m. to 4:40 p.m. The deviation between experimental and numerical data is mainly due the quasi-steady state assumption used to develop the model. In fact, the developed model does not consider the thermal capacity of the collector and therefore fast transient behaviors of the system are not accurately estimated. However, this circumstance occurs only in case of rapid variations of irradiation availability (e.g., clouds movements), whereas in all the other cases, variations of environmental temperature, inlet water and radiation are very slow, allowing one to accept the quasi-steady state assumption. The maximum difference between experimental and model data is achieved during the previously mentioned time interval, and it is about 3.4 °C. Furthermore, the analysis of the data reveals that the mean value of the absolute error is −1.06 °C, while the standard deviation results equal to 0.628 °C.
In Figure 5 the experimental and numerical PVT bottom aluminum substrate temperature and the absolute error are reported. As for the fluid temperature, the aluminum substrate temperature predicted by the numerical model overlaps the experimental data, nonetheless small differences between the profiles can be detected. In particular, the model slightly underestimates the measured data, however the magnitude of the difference is lower compared to the one showed in Figure 4.
The trend of the absolute error for the PVT aluminum bottom substrate temperature assumes a similar profile to the one achieved for the outlet fluid temperature (Figure 4). This occurs because the response of the model in terms of temperatures (given the same variable input conditions) is similar for all the layers of the collector. The maximum difference between the experimental and numerical data is equal to 1.77 °C, while the mean value is 0.66 °C. Moreover, the analysis of the data outlines a standard deviation of 0.467 °C.
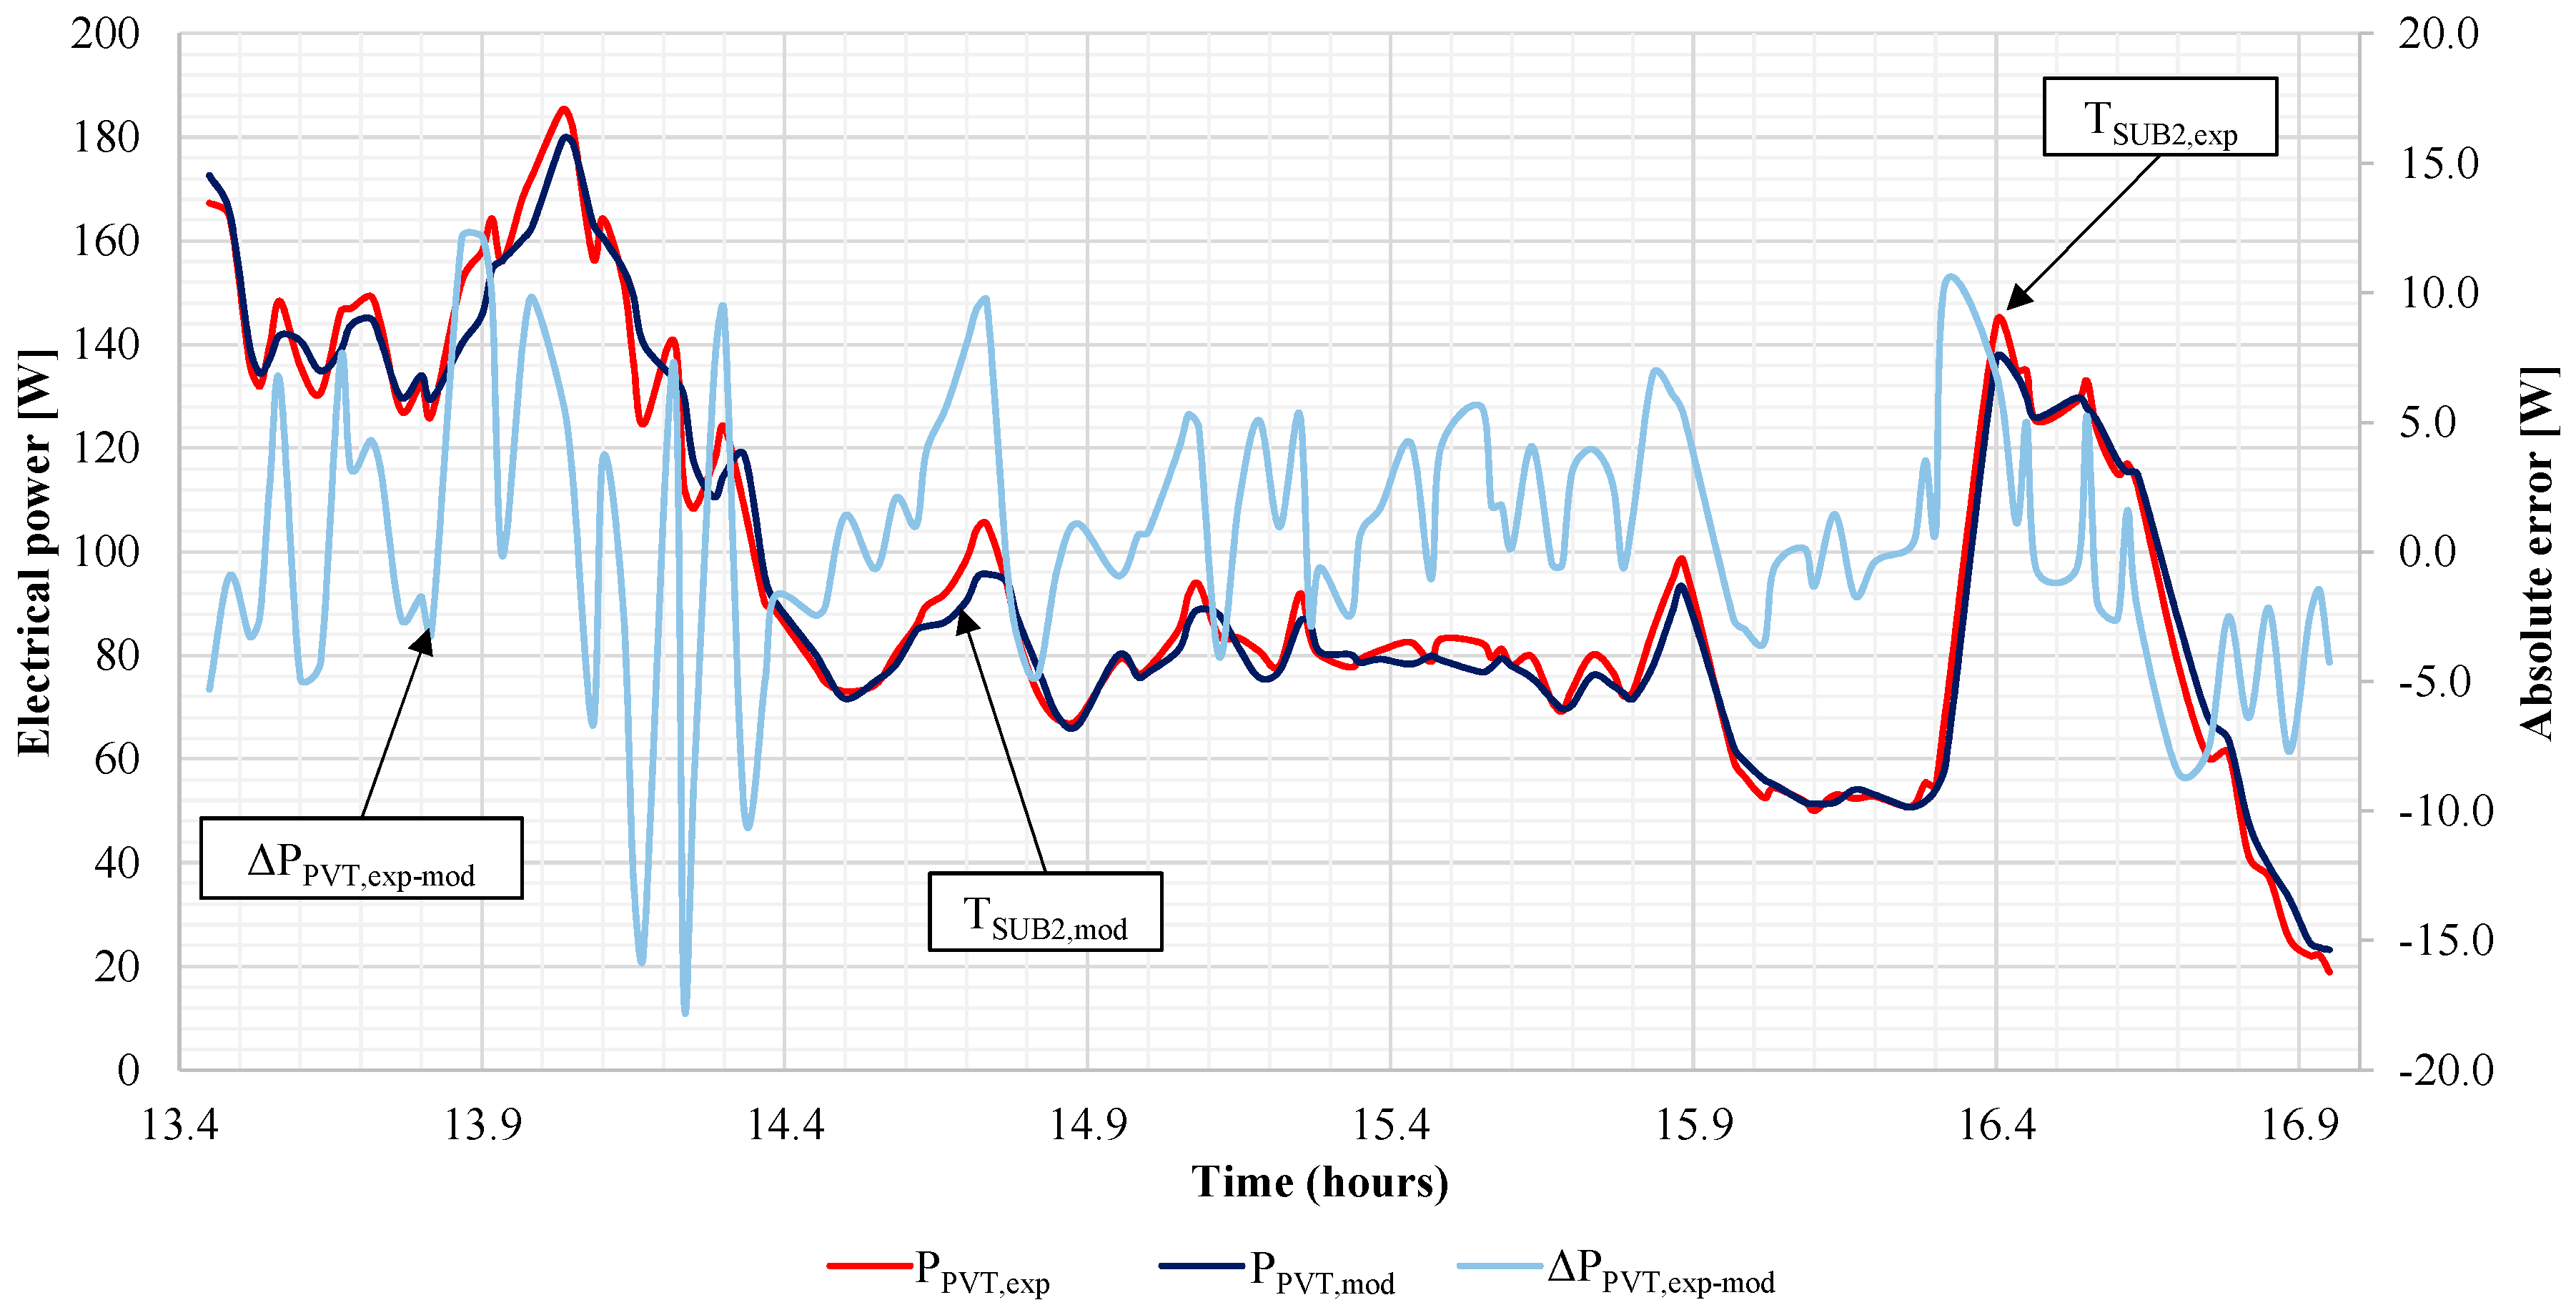
The PVT electrical power output data is measured and stored by means of the SolarEdge regulator/inverter unit during the experimental investigation of the hybrid collector system. The unit does not allow one to set the sample time of the measurement, due to the internal automatic algorithm coded in the unit firmware. As a consequence, a temporal synchronization between the data of Multicon Simex data logger and the SolarEdge unit is performed in order to compare the numerical and experimental results in terms of electrical and thermal power. The measured and simulated data of the PVT power output are reported in Figure 6, along with the absolute error. In this figure it is clearly shown that the numerical data calculated by the model shows a fair to good agreement with the measured one. In particular, some differences are registered in correspondence of the solar radiation peaks. The mean value of the absolute error is equal to 0.63 W, while the maximum error is −17.22 W. The fairly low value of the mean absolute error implies that the numerical model only slightly underestimates the electrical energy produced by the Janus PVT collector. Furthermore, the performed statistical analysis of the absolute error outlines a standard deviation equal to 5.24 W.
5.2. Numerical Results: Analysis Along the Discretization Domain
The developed numerical model of the Janus PVT collector allows one to calculate the profiles of temperature, pressure, thermal and electrical energy along the collector longitudinal direction. In particular, the temperature profiles are calculated by the model for each layer of the collector. As previously mentioned, the computational domain is discretized in 20 elements, a value allowing a reasonable simulation time and good accuracy. In fact, in order to select the suitable number of elements, a mesh sensitivity analysis is performed, showing that a greater number of domain elements does not significantly affects the accuracy of the calculation. In particular, a specific sensitivity analysis has been performed to achieve this result. The case of 20 cells showed excellent accuracy. In fact, an increase of the number of cells from 20 to 100 determines a negligible general variation of the calculated parameters. As an example, the variations of thermal/electrical efficiency and outlet temperature are within the order of magnitude of 10−7 and 10−5 °C, respectively.
Moreover, in order to perform the analysis of the PVT collector model, the following boundary conditions are used: solar radiation of 1000 W/m2, inlet fluid temperature of 32 °C, air and ground temperature of 30 °C, sky temperature of 20 °C and a mass flow rate of 1.25 kg/min.
Figure 7 shows temperature profiles of the collector layers. This plot clearly shows that both solid materials and fluid temperatures linearly increase along the discretization direction. The glass layer achieves the highest temperature, ranging between 61 °C and 62 °C, while PV cell temperature is about 8 °C lower. It is worth noting that, the temperature gradient across the different layers is not linear due to the different solid materials thermal properties. Higher gradients are obtained within the back sheet and first aluminum layer, due to the higher heat transfer properties of such materials. Moreover, the temperature difference between the first and last element increases from the top to the bottom PVT collector layers. In fact, this difference is about 1.0 °C for the glass layer, whereas it is equal to 3.0 °C for the butyl adhesive. This is due to the heat transfer to the fluid flow within the collector channels that dramatically affects the temperature distribution inside the collector layers.
The fluid flow temperature increases of about 4.0 °C with respect to the inlet temperature of 32.0 °C. In particular, the temperature of the fluid is very close to the temperature of both aluminum substrates, and this occurs because the heat transfer coefficient between the fluid flow and the aluminum surface is relatively high.
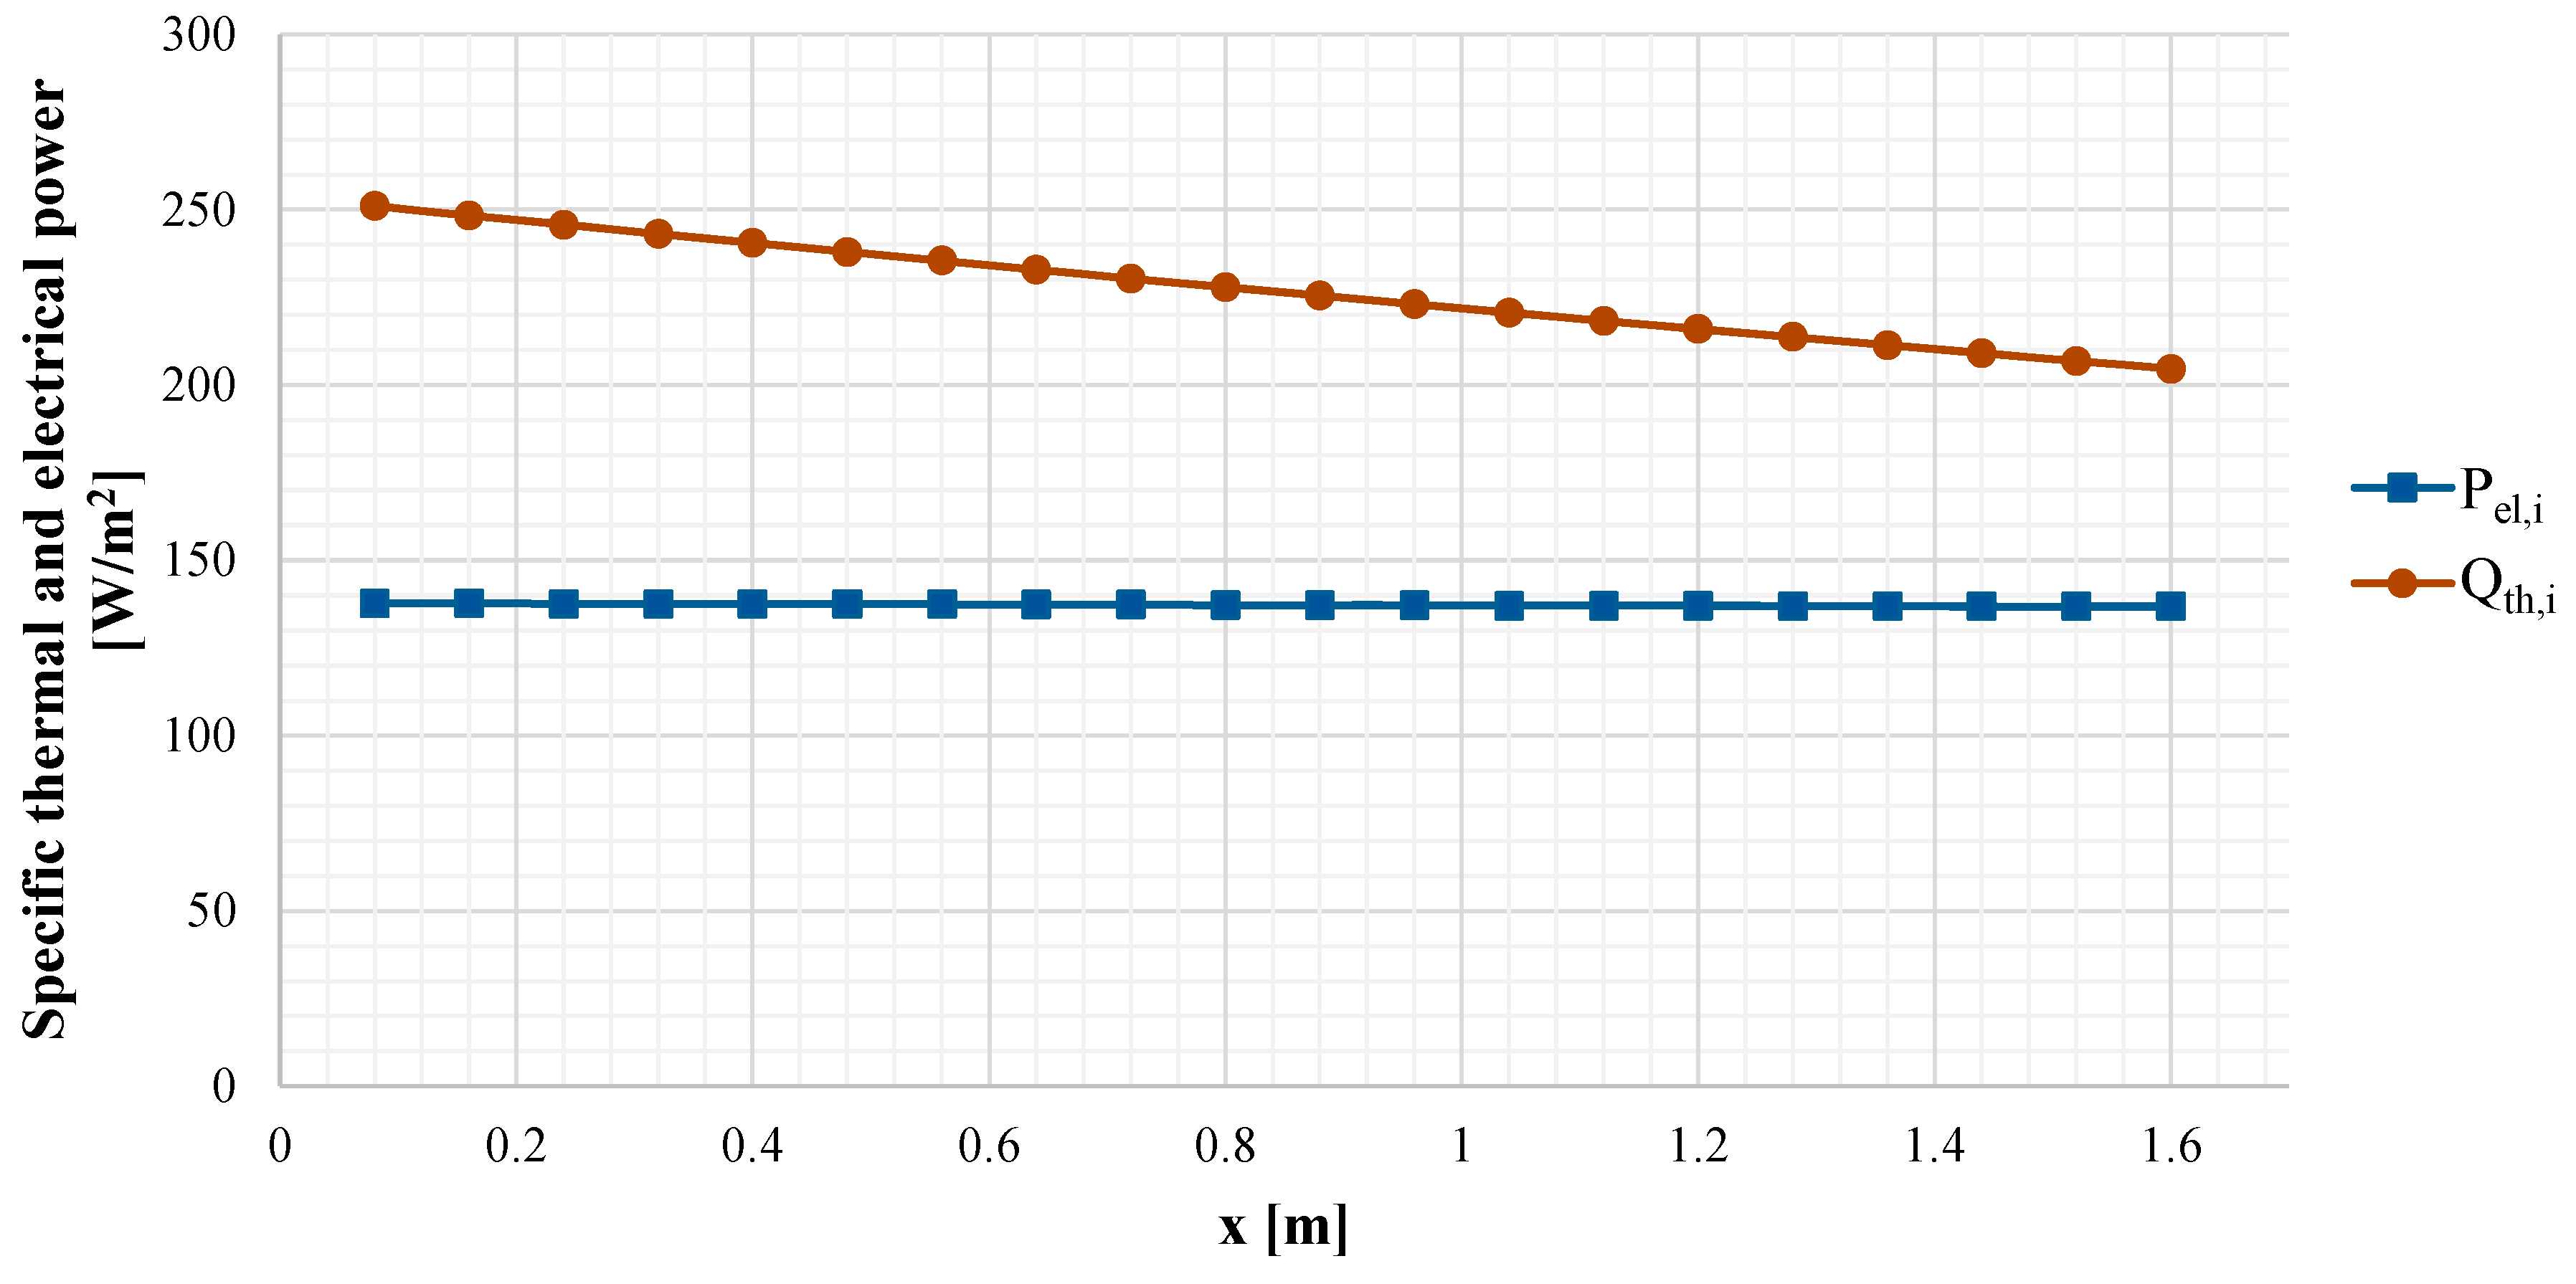
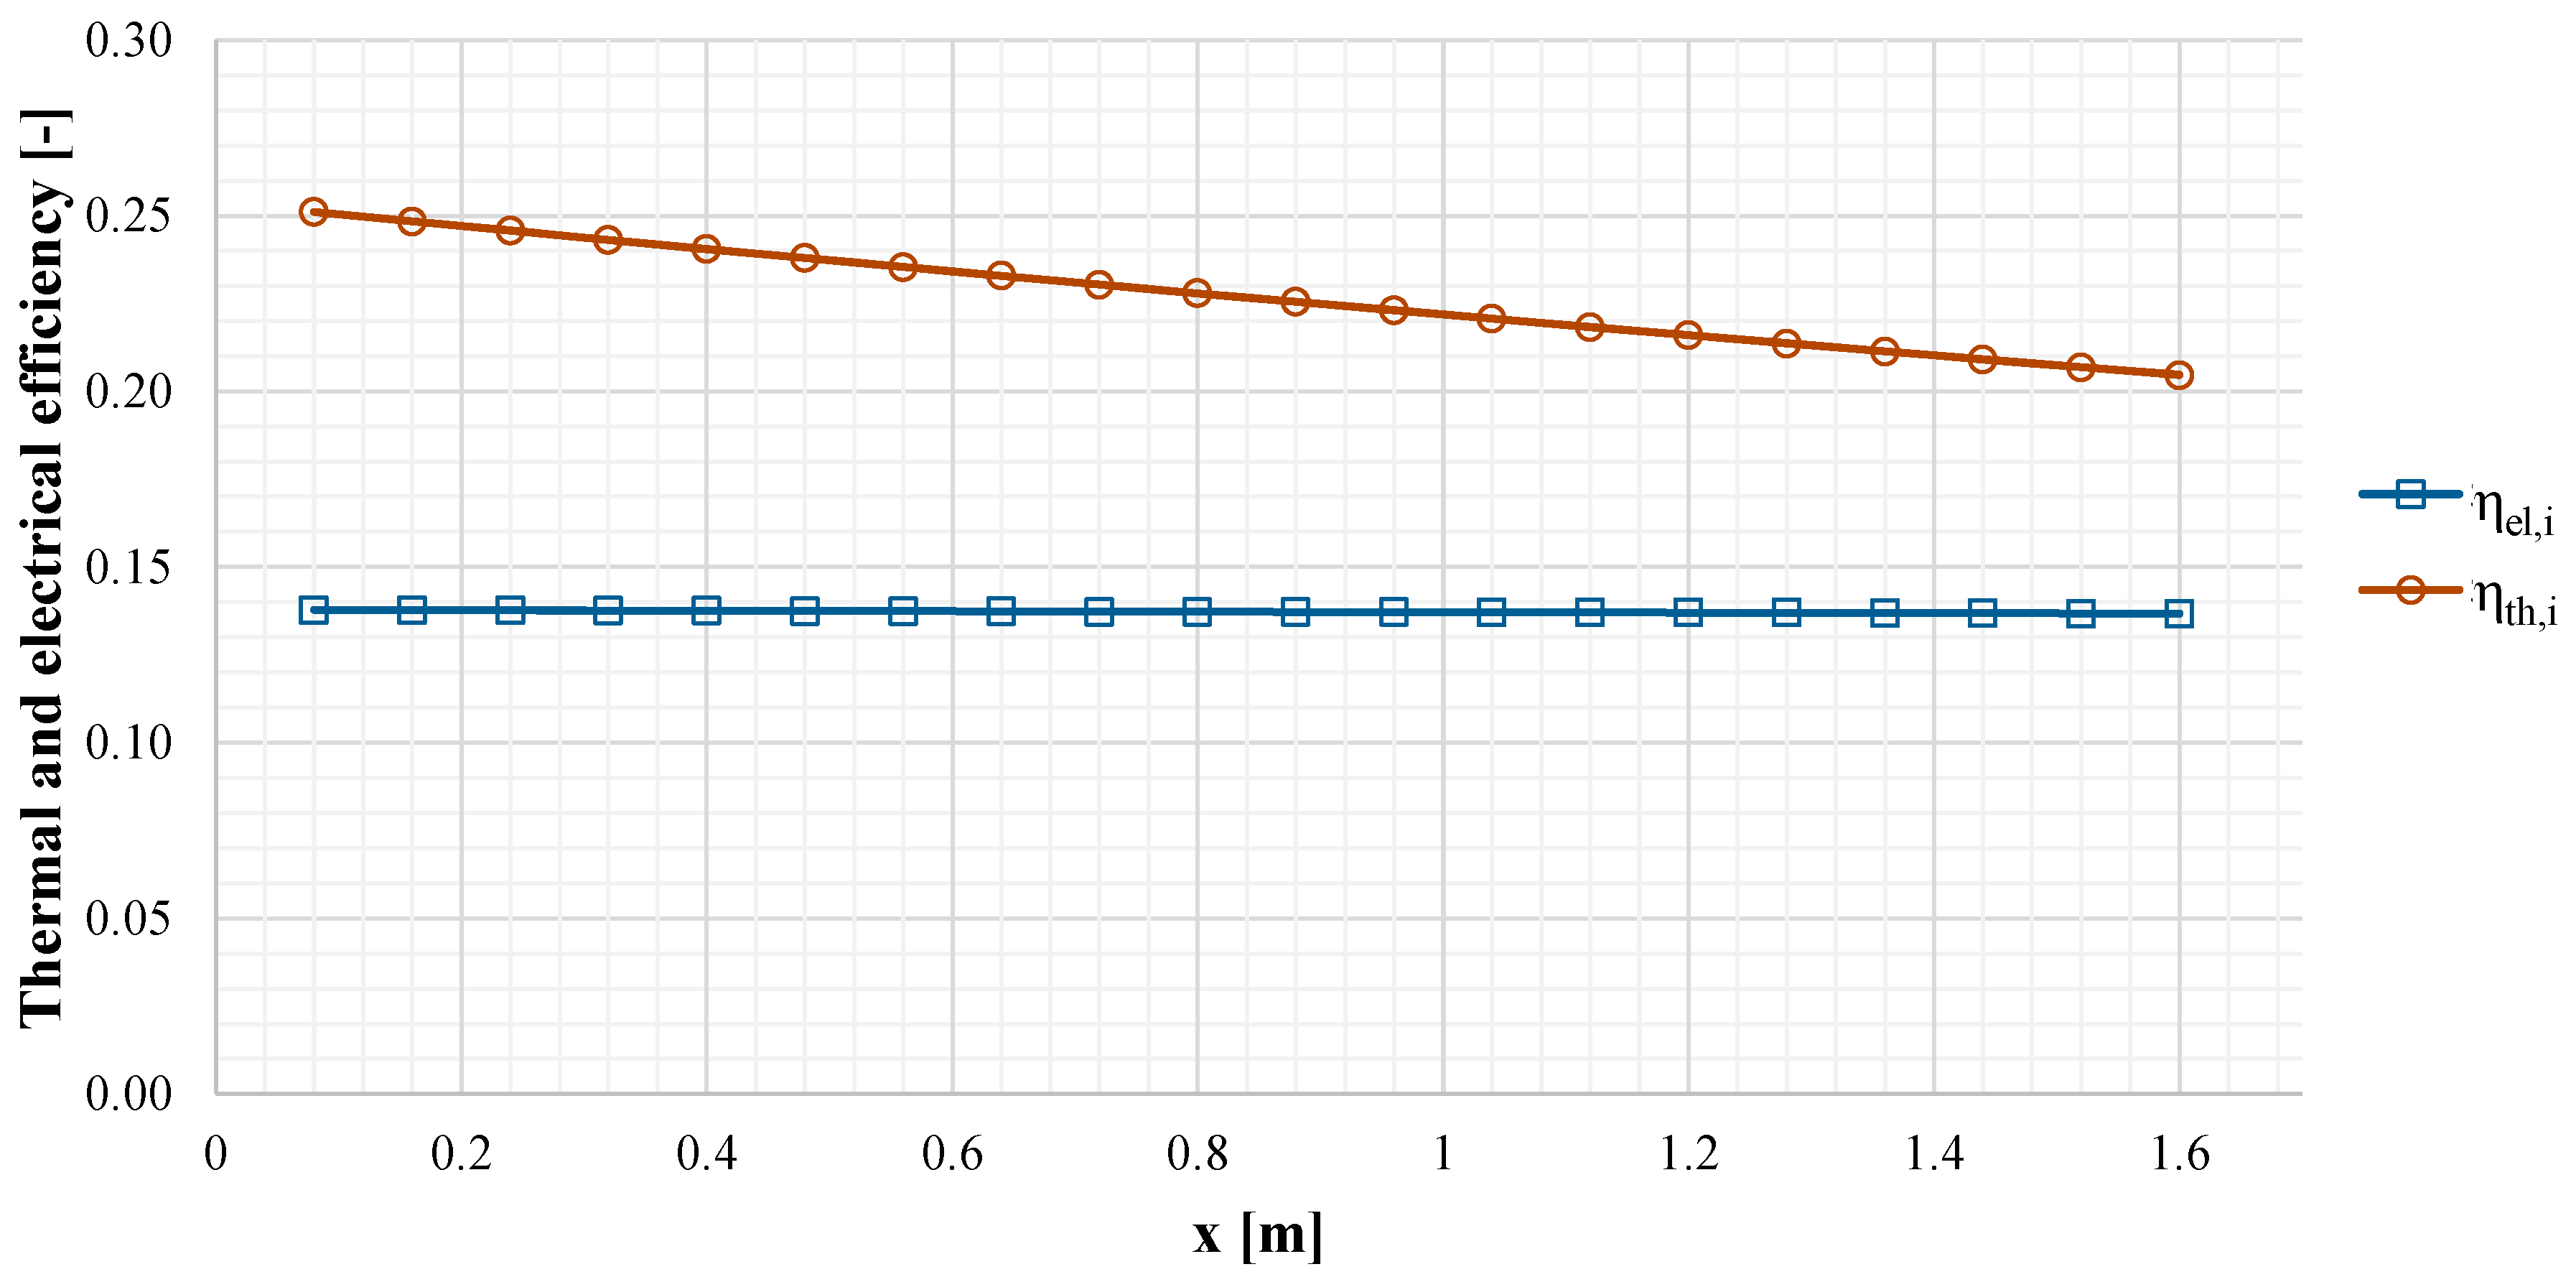
Figure 8 and Figure 9 report the electrical/thermal power and efficiencies profiles, respectively. In particular, in Figure 8, the specific total electrical/thermal power of each domain element is reported.
The specific electrical power and efficiency are almost constant along the discretization direction, assuming a mean value of 137.4 W/m2 and 0.137 per domain element. The variation of such parameters is negligible because the temperature increment along the PV cell layer is fairly low (1.6 °C). Moreover, the specific thermal power and efficiency trends are linear and decreasing, due to the fluid flow temperature profile. From the first to the last domain element, the specific thermal power decreases from 251.1 to 204.7 W/m2, while a decrease from 0.251 to 0.205 is achieved for the efficiency. Finally, the mean values of the specific thermal power and efficiency for each domain element are 227.2 W/m2 and 0.227, respectively.
Furthermore, the authors compared the thermal and electrical performance of the PVT collector under investigation with respect to the one achieved by conventional PV and PVT galzed units. In particular, this comparison is performed considering a PVT collector equipped with a glass cover and thermal insulation. In order to perform the analysis, the same operating conditions of the previously described analysis and, the same PV cell performance parameters of Janus collector are assumed. Moreover, the heat exchange properties of the traditional PVT collector are taken from ref. [17]. Unfortunately, this comparison cannot be performed by the EES code developed in this work, since that code only simulates the low-cost PVT collector and no EES code of conventional PV and PVT collectors are available. Therefore, the analysis is performed by means of the TRaNsient Systems Simulation tool (TRNSYS) [36], a software widely used in literature in order to simulate thermal/electrical solar systems. This software includes a large component library of components, featured with models validated against experimental or manufacturer data. In particular, Type 652 and Type 50 are used in order to simulate PV and traditional glazed PVT collectors, respectively. Under the same operating conditions (solar radiation of 1000 W/m2, inlet fluid temperature of 32 °C, air and ground temperature of 30 °C, sky temperature of 20 °C, solar and a mass flow rate of 1.25 kg/min), the PV module and the traditional PVT collector achieve an electrical efficiency of 11.0% and 12.9%, respectively. The electrical efficiency of both units is lower compared to the low-tech collector under investigation. This result is due to the fact that PV cell temperature of both collectors is higher compared to the one achieved by the low-tech unit, due to the lack of absorber/cooling fluid (PV module), and to the integration of the glass cover and thermal insulation (traditional PVT collector). On the contrary, the thermal efficiency of the traditional PVT collector is equal to 54.9%, a value significantly higher than the one achieved by the PVT collector under investigation. The relatively low thermal performance of the Janus collector is due to the high thermal losses, occurring because the unit is not equipped with any glass cover and thermal insulation. Finally, for the assumed conditions, the overall efficiency of the Janus PVT collector is equal to 36.4%, a value that is 46% lower than the one achieved by the traditional PVT collector, equipped with a thermal insulation.
5.3. Numerical Results: Sensitivity Analysis
The study of the modelled PVT collector is completed with a sensitivity analysis, aiming at determining the performance of the collector as a function of the boundary/operation variables. The parameters investigated by the analysis are: solar radiation and fluid inlet temperature. Mass flow rate is kept constant at 1.25 L/min. Furthermore, the same air, ground and sky temperature used in the previous analysis are assumed. In particular, the analysis is performed in terms of fluid outlet temperature and electrical/thermal efficiencies. Nevertheless, temperature profiles are evaluated for all the layers of the collector, however such profiles are similar to the ones achieved for the fluid outlet temperature and for reasons of brevity are omitted.
In Figure 10 the fluid outlet temperature as a function of solar radiation and fluid inlet temperature is reported. Obviously, higher the inlet temperature or the solar radiation, higher the fluid inlet temperature. In particular, Figure 10 clearly shows that the trend of such temperature linearly increases with the increase of inlet temperature, for a fixed value of solar radiation. Similarly, a linear trend of the fluid outlet temperature as a function of the solar radiation is achieved (for a fixed fluid inlet temperature). This trend occurs because a variation of the available solar energy causes a proportional variation of the produced thermal energy by the PVT collector. The analysis of Figure 10 outlines that, fixing the fluid inlet temperature at 30 °C, the outlet temperature rises from values of 30.1 °C to 34.6 °C, in case of the solar radiation increase from 100 to 1000 W/m2. Furthermore, for all the considered values of fluid inlet temperature, the increase of the fluid temperature is almost constant and equal to about 4.6 °C, for the same solar radiation variation.
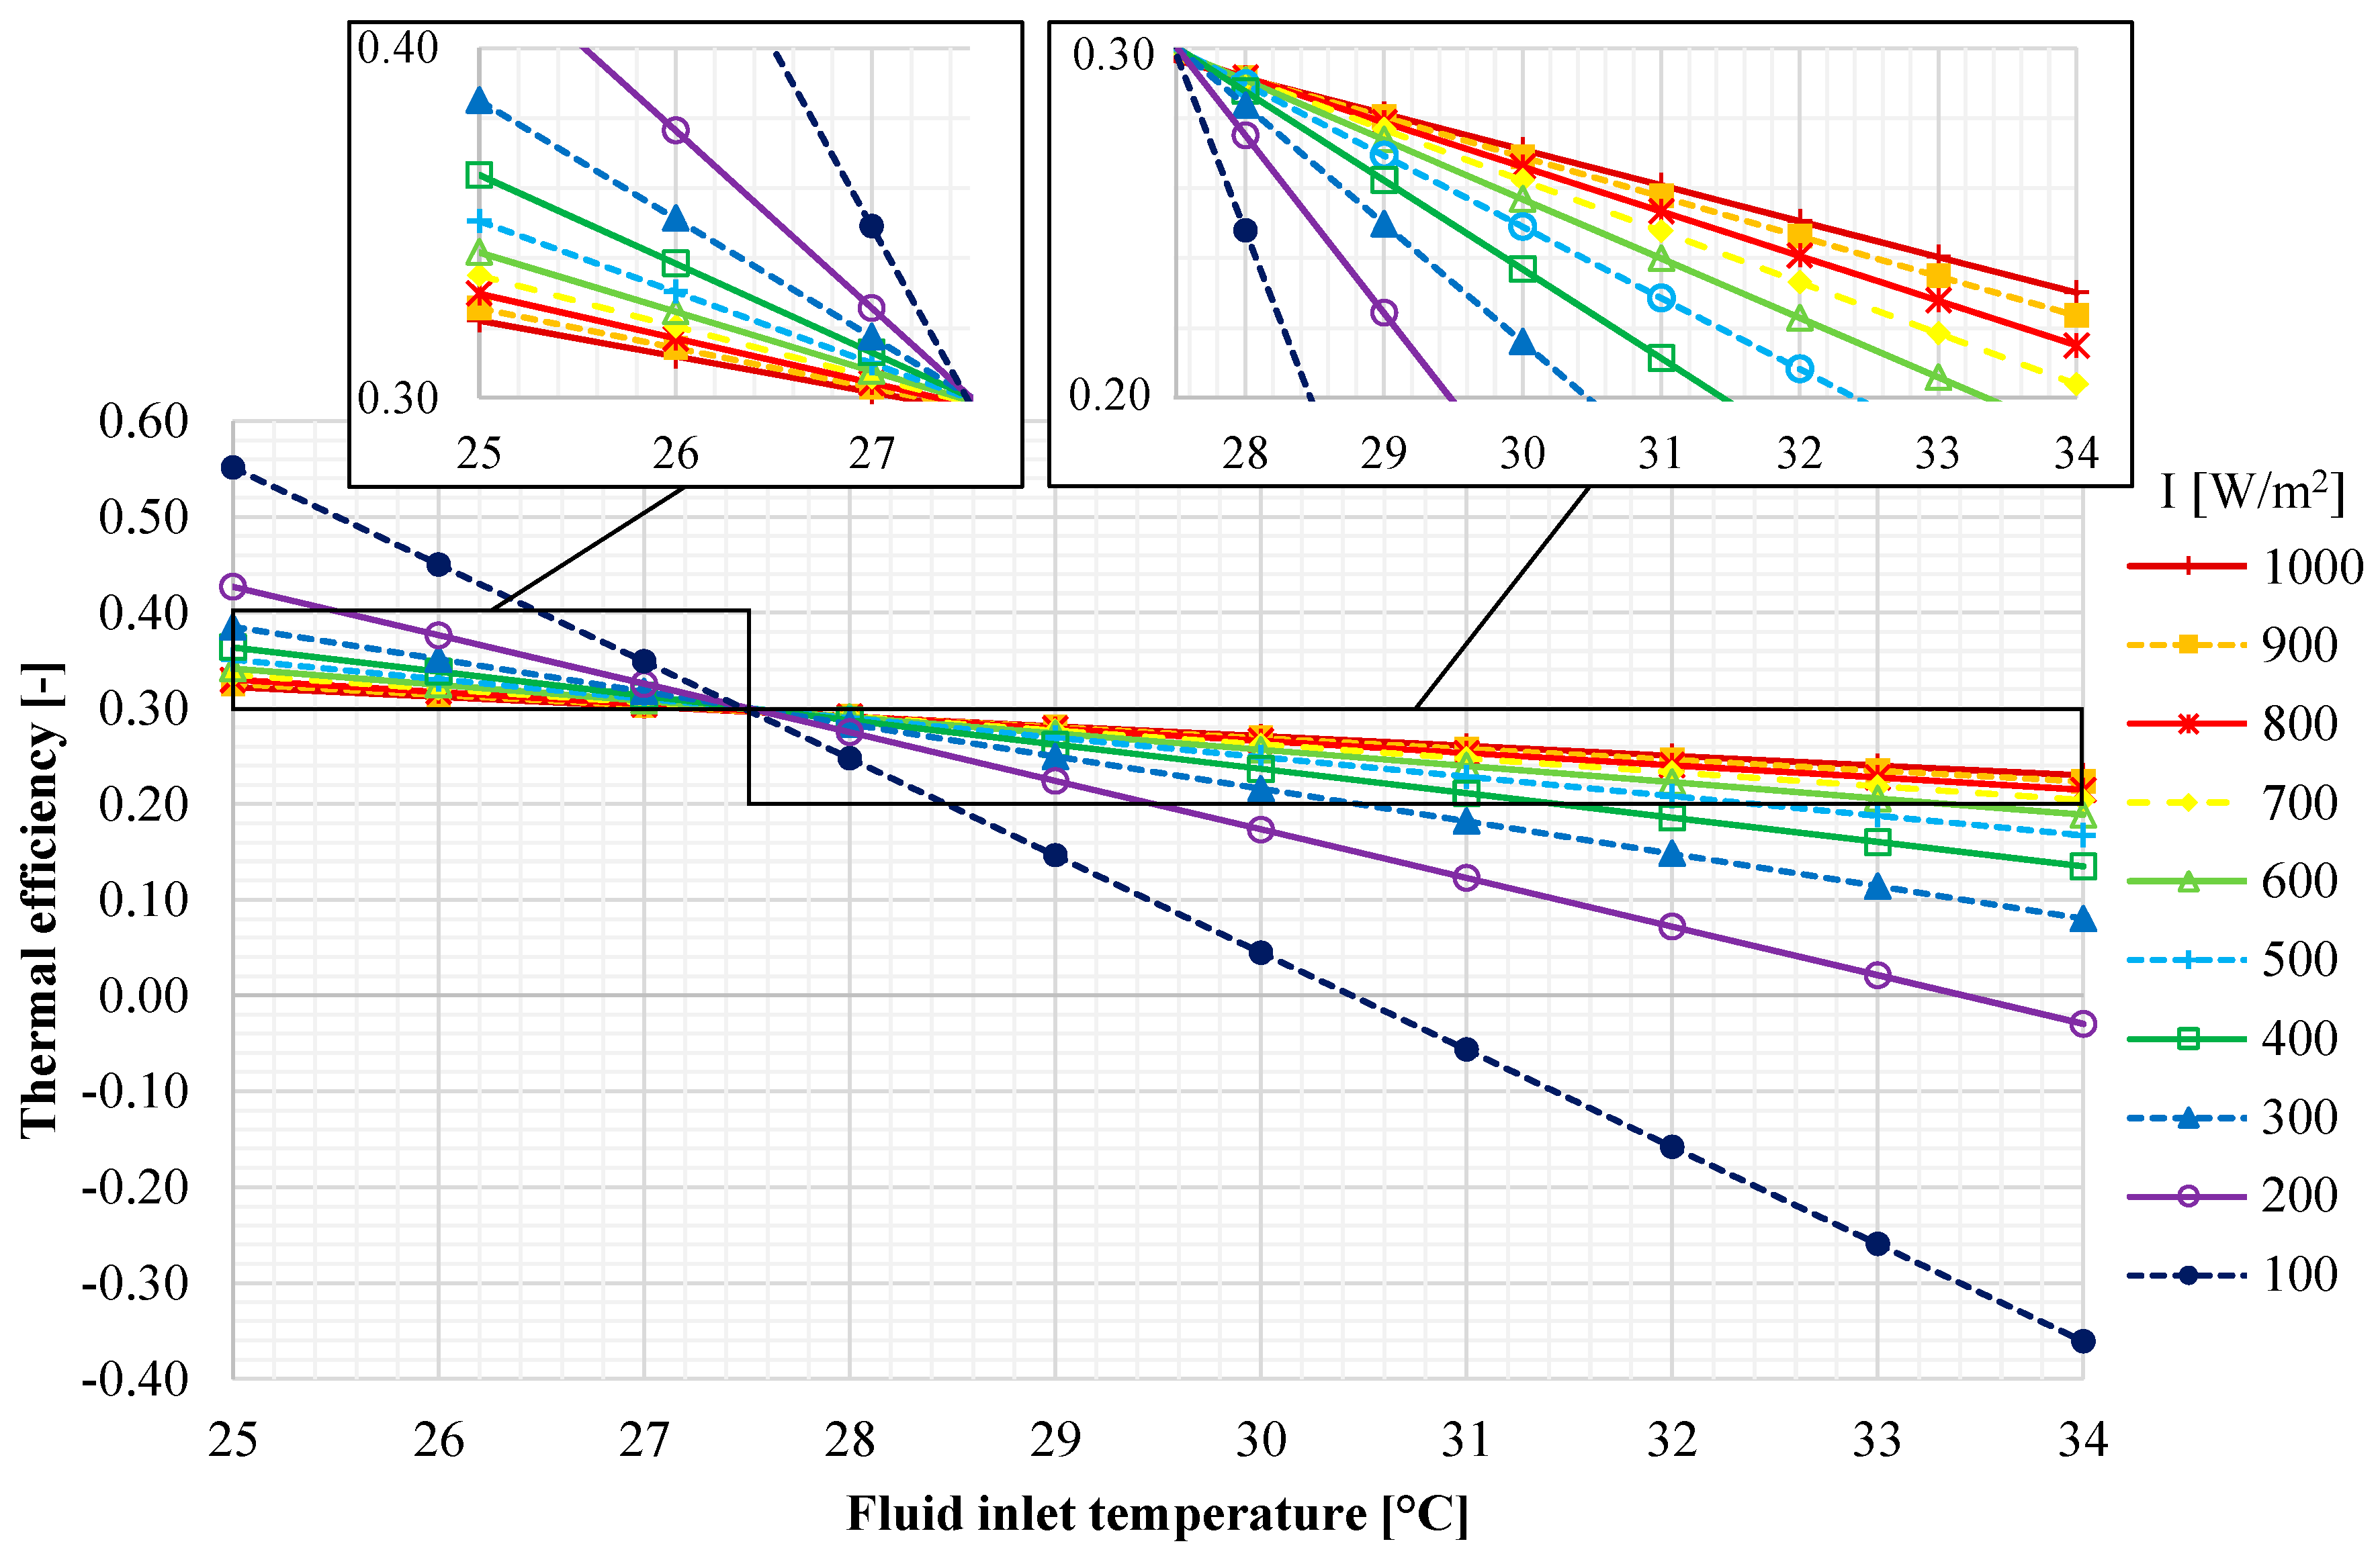
In Figure 11 the variability of the PVT collector thermal efficiency as a function of the solar radiation and fluid inlet temperature is shown. The plots outline a significant influence of the fluid inlet temperature for the thermal performance of the PVT collector, especially for lower values of the solar radiation.
The collector thermal efficiency can be even negative in case of a low radiation (100 W/m2–200 W/m2) and a relatively high inlet temperature (32 °C–34 °C). This means that PVT outlet temperature is lower than the inlet one. When the fluid inlet temperature is lower than 27.5 °C, the collector thermal efficiency increases for a decrease of the solar radiation. This occurs because of the thermal behavior of the PVT solar collector: for lower inlet temperature and solar radiation values the collector thermal gain is mainly given by the heat exchange between the unit and the ambient air and ground (both at 30 °C), while, when the radiation increases the main thermal contribution is due to the solar gain (with higher thermal losses). In fact, for whatever solar radiation value, PVT thermal efficiency increases with a decrease of the fluid inlet temperature. It is interesting noting that the thermal performance is almost the same for all the investigated inlet temperatures in case of the solar radiation above 700 W/m2. Over such value, the maximum efficiency variation is 0.015, whatever it is the inlet temperature.
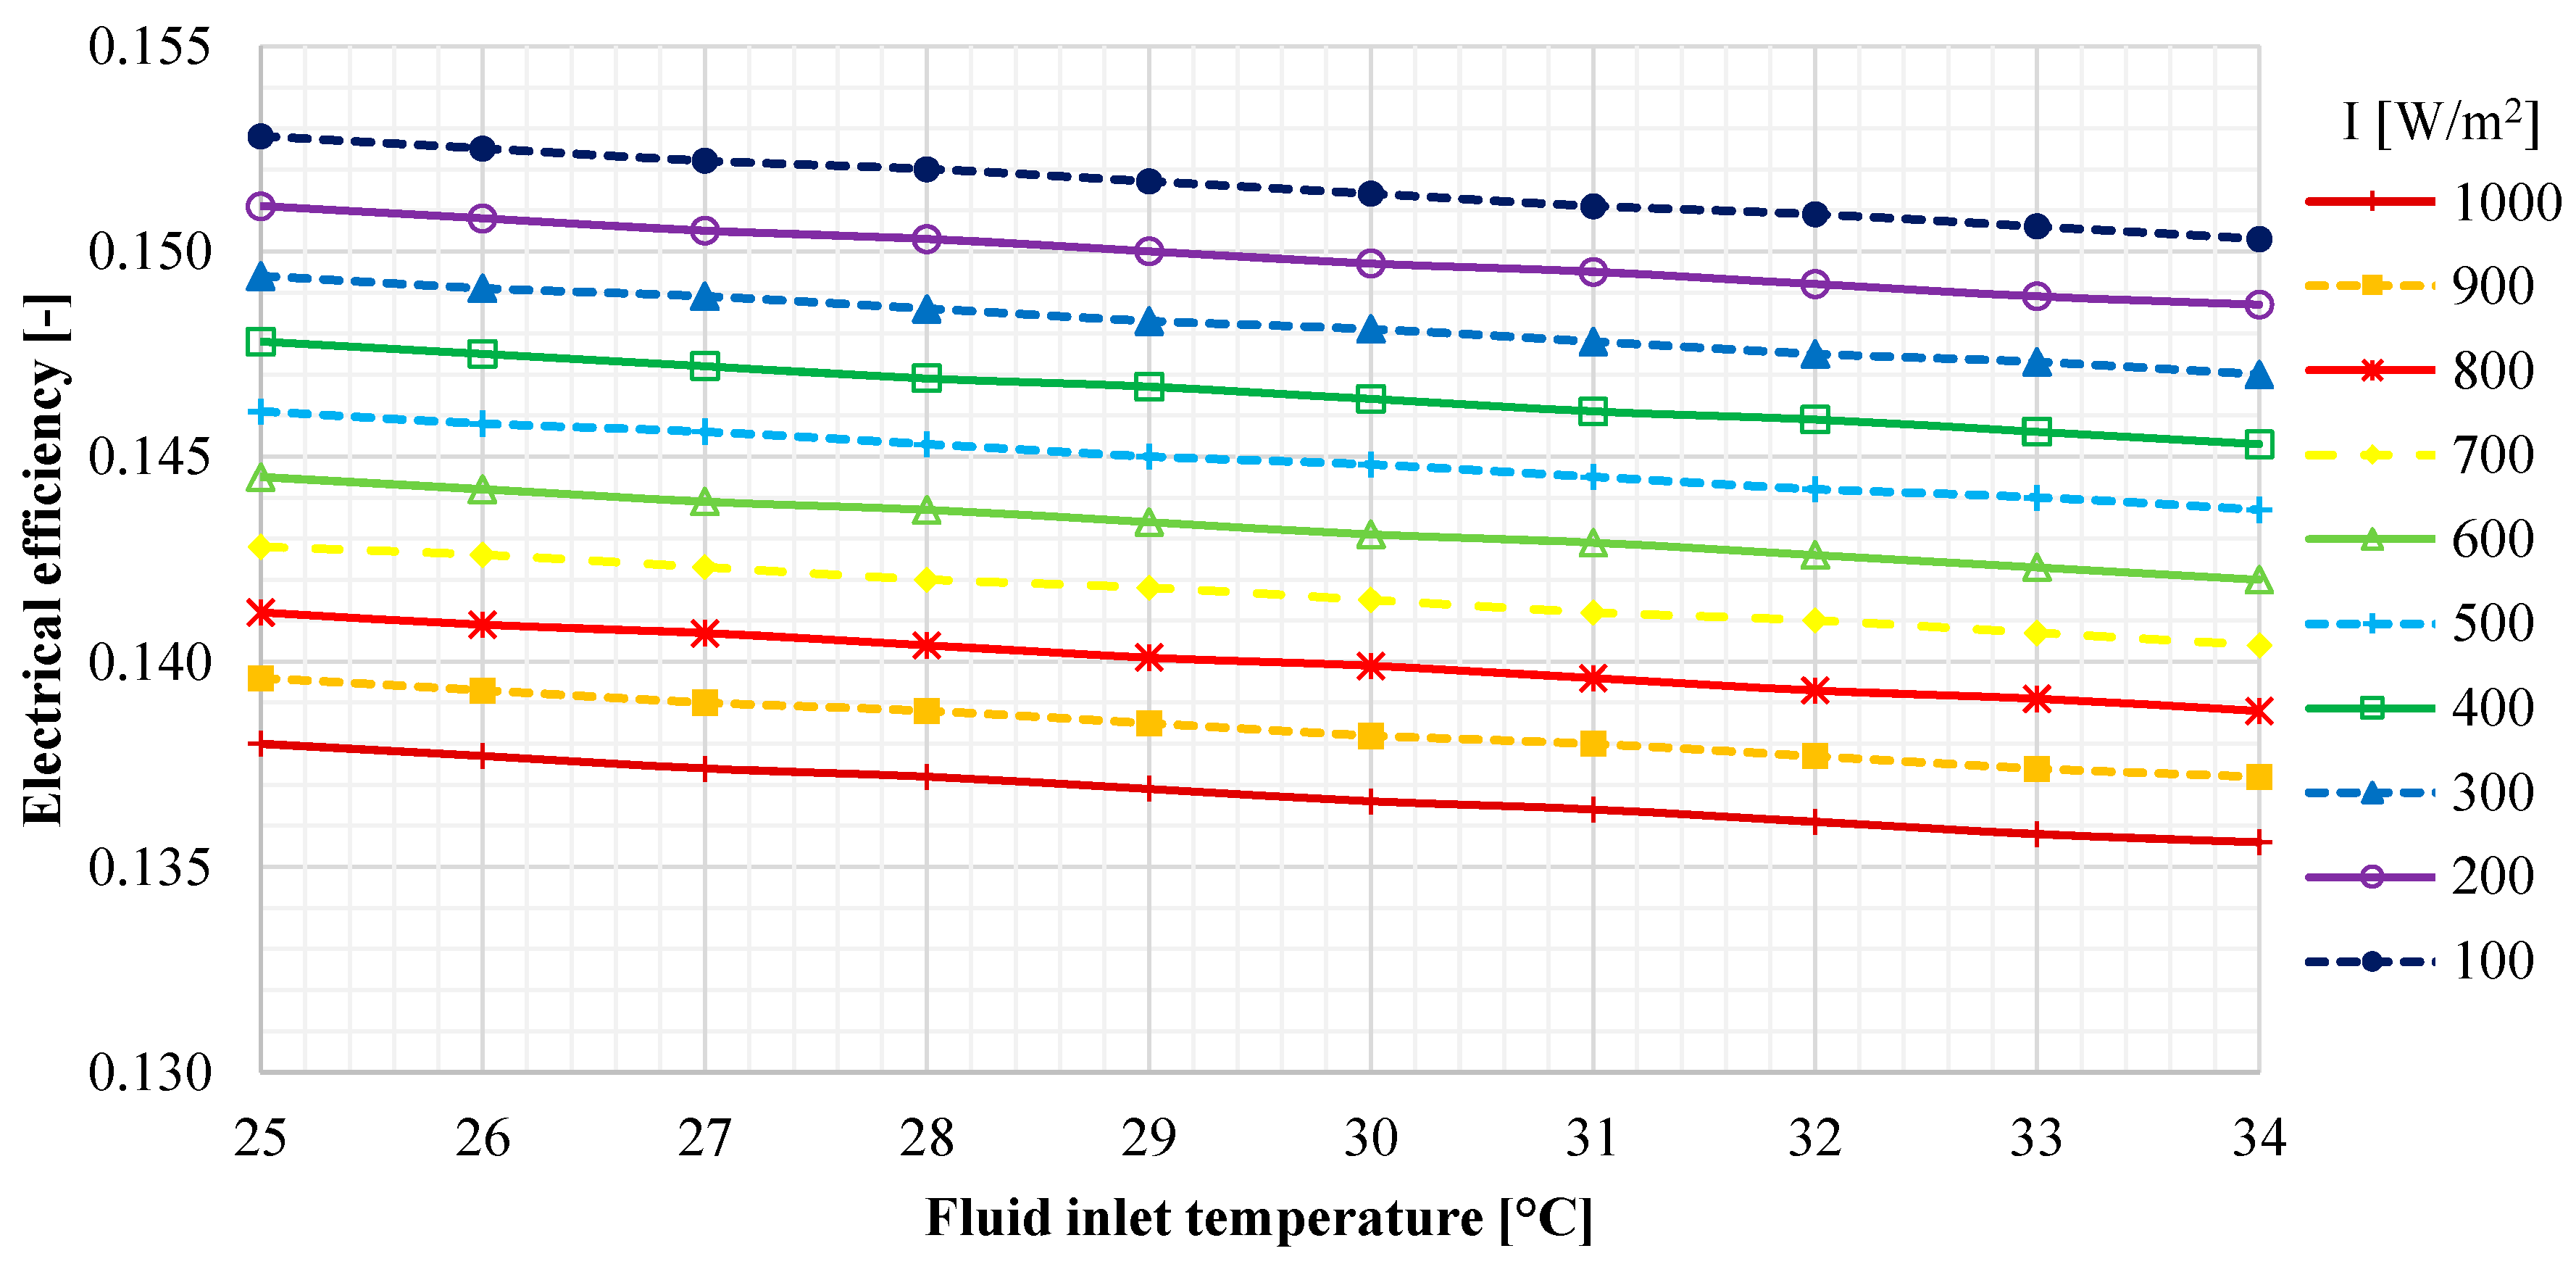
Finally, in Figure 12 the electrical efficiency of the profiles are reported. The performed analysis shows that the variation of the fluid inlet temperature (within the investigated range) slightly affects the electrical performance of the PV cell. In particular, the increase of the fluid inlet temperature from 25 to 34 °C implies an efficiency decrease ranging between 2.4∙10−3 and 2.5∙10−3, for the considered solar radiation values. The plots reported in Figure 12 highlight that the solar radiation parameter significantly affects the collector thermal efficiency. Higher the solar radiation, higher the cell temperature, as a consequence, lower the electrical performance. In case of a solar radiation increase from 100 to 1000 W/m2, the results outline a practically constant decrease of the electrical efficiency (0.015), whatever it is the considered fluid inlet temperature.
6. Conclusions
In this paper an experimental investigation and a finite-volume model of an unglazed and not insulated flat plate PVT collector is presented. A commercially available PVT collector, manufactured by the Italian company AV Project Ltd. located in Avellino (Italy), is used to perform the analyses. An outdoor set-up installation is used to perform the experimental investigation, while a 1-D simulation model of the collector is developed by EES software. The numerical results carried out by the simulation are compared with the dynamic data measured by the experimental installation. The thermal and electrical performance of the collector is evaluated along the discretized computational domain. The study is completed by a sensitivity analysis aiming at determine the impact of the different boundary/operating conditions on the PVT collector performance. The results show that:
- the developed model follows the experimental data trend, however some slightly overestimation/underestimation is achieved: the mean value of the absolute error is −1.06 °C, 0.66 °C and 0.63 W for the outlet and aluminum bottom substrate temperature and electrical power, respectively;
- the temperatures of both solid materials and fluid linearly increase along the discretization direction. Under nominal operating conditions, the glass layer achieves the highest temperature, ranging between 61 and 62 °C, while the PV cell temperature is about 8 °C lower;
- for the same nominal conditions, the electrical power and efficiency are almost constant along the discretization domain, due to the negligible temperature increment along the PV cell layer of 1.6 °C. The thermal efficiency trend is linear and descendent, as a consequence a value of 0.251 and 0.205 are achieved for the first and the last domain element;
- the trend of the fluid outlet temperature increases linearly with the increase of inlet temperature, for a fixed value of solar radiation. Moreover, the increase of the fluid temperature is practically constant and equal to about 4.6 °C, for the solar radiation variation from 100 to 1000 W/m2;
- the thermal performance is almost the same for all the investigated inlet temperatures (25–34 °C) in case of the solar radiation is above 700 W/m2;
- the decrease of the electrical efficiency is almost constant and equal to 0.015, in case of a solar radiation increase from 100 to 1000 W/m2 and whatever it is the considered fluid inlet temperature.
The linearity of the temperature distribution within the collector layers allows one to use the lumped version of the developed model in order to calculate integral/global parameters (e.g., outlet temperature, powers, efficiencies). In fact, for such model simplification, the integral/global parameters, e.g., efficiency, are quite similar. In particular, the variation of parameters like thermal/electrical efficiency and fluid outlet temperature is within 0.001 and 0.01 °C, respectively. As a consequence, both 1-D and lumped models achieves a similar accuracy in terms of global parameters calculation. However, in case of the lumped model, the specific information concerning the distribution of temperature or powers within the collector layers is not available.
Finally, the results will be adopted to validate the 0-D version of the model, that can be used when the calculation of global parameters are needed. In fact, further developments will include the use of the model for dynamic simulation of systems integrating the collector under investigation.
Author Contributions
The authors contributed equally to this work, they also revised and approved the manuscript. Laura Vanoli carried out the research being affiliated with University of Naples Parthenope, while the actual affiliation is University of Cassino and Southern Lazio.
Conflicts of Interest
The authors declare no conflict of interest.
Nomenclature
| A | Area (m2) |
| d | Equivalent diameter channel of the channel (m) |
| fr | Friction factor (-) |
| h | Enthalpy (kJ/kg) |
| I | Solar radiation (W/m2) |
| i | i-th element (-) |
| k | Thermal conductivity (W/(m°C)) |
| L | Characteristic length (m) |
| m | Mass flow rate (kg/s) |
| n | Number of elements (-) |
| Nu | Nusselt number (-) |
| P | Pressure or electrical power (Pa) or (W) |
| Pm | Perimeter (m) |
| Pr | Prandtl number (-) |
| Q | Thermal power (W) |
| r | Thermal resistance (°C/W) |
| ra-b | Thermal resistance between layers a and b (°C/W) |
| Re | Reynolds number (-) |
| s | thickness (m) |
| T | temperature (°C) |
| U | Heat transfer coefficient (W/(m2 °C)) |
| w | velocity (m/s) |
Greek Letters
| α | Absorptivity coefficient (-) |
| β | PV cell efficiency reduction coefficient (1/°C) |
| ε | Emissivity coefficient (-) |
| η | Efficiency (-) |
| λ | Thermal conductivity (W/(m°C)) |
| ρ | Reflectance coefficient or density (-) or (kg/m3) |
| σ | Stefan-Boltzmann constant (5.67 × 10⁻⁸ W/(m2 K4)) |
Subscripts
| AIR | Surrounding air |
| BACK | Back-sheet layer |
| bottom | Bottom side |
| BUT | Butyl adhesive layer |
| c | convective |
| channel | Fluid channel |
| GLASS | Glass of the collector |
| el | Electrical |
| EVA1 | Ethylene Vinyl Acetate layer 1 |
| EVA2 | Ethylene Vinyl Acetate layer 2 |
| exp | Experimental |
| f | Heat transfer fluid |
| GROUND | Ground surface |
| in | Inlet |
| material | Material |
| mod | Model |
| out | Outlet |
| PV | PV cell |
| PVT | PhotoVoltaic Thermal Collector |
| ref | Reference conditions |
| SUB1 | Aluminum substrate 1 |
| SUB2 | Aluminum substrate 2 |
| th | Thermal |
| tot | Total |
References
- Solangi, K.; Islam, M.; Saidur, R.; Rahim, N.; Fayaz, H. A review on global solar energy policy. Renew. Sustain. Energy Rev. 2011, 15, 2149–2163. [Google Scholar] [CrossRef]
- Pavanan, K.C.; Bosch, R.A.; Cornelissen, R.; Philp, J.C. Biomass sustainability and certification. Trends Biotechnol. 2013, 31, 385–387. [Google Scholar] [CrossRef] [PubMed]
- Dincer, I.; Acar, C. A review on clean energy solutions for better sustainability. Int. J. Energy Res. 2015, 39, 585–606. [Google Scholar] [CrossRef]
- Hartmann, J. Sustainability of hydropower. In Alternative Energy and Shale Gas Encyclopedia; John Wiley & Sons: Hoboken, NJ, USA, 2016; pp. 397–403. [Google Scholar]
- Tian, Y.; Zhao, C.-Y. A review of solar collectors and thermal energy storage in solar thermal applications. Appl. Energy 2013, 104, 538–553. [Google Scholar] [CrossRef]
- Thirugnanasambandam, M.; Iniyan, S.; Goic, R. A review of solar thermal technologies. Renew. Sustain. Energy Rev. 2010, 14, 312–322. [Google Scholar] [CrossRef]
- Singh, G.K. Solar power generation by PV (photovoltaic) technology: A review. Energy 2013, 53, 1–13. [Google Scholar] [CrossRef]
- Parida, B.; Iniyan, S.; Goic, R. A review of solar photovoltaic technologies. Renew. Sustain. Energy Rev. 2011, 15, 1625–1636. [Google Scholar] [CrossRef]
- Lamnatou, C.; Chemisana, D. Photovoltaic/thermal (PVT) systems: A review with emphasis on environmental issues. Renew. Energy 2017, 105, 270–287. [Google Scholar] [CrossRef]
- Michael, J.J.; Iniyan, S.; Goic, R. Flat plate solar photovoltaic–thermal (PV/T) systems: A reference guide. Renew. Sustain. Energy Rev. 2015, 51, 62–88. [Google Scholar] [CrossRef]
- Chow, T.T.; Tiwari, G.; Menezo, C. Hybrid solar: A review on photovoltaic and thermal power integration. Int. J. Photoenergy 2012, 2012. [Google Scholar] [CrossRef]
- Ozgoren, M.; Aksoy, M.; Bakir, C.; Dogan, S. Experimental performance investigation of photovoltaic/thermal (PV–T) system. In Proceedings of the EPJ Web of Conferences, Caen, France, 28–31 May 2013; EDP Sciences: Les Ulis, France, 2013; p. 01106. [Google Scholar]
- Dubey, S.; Sarvaiya, J.N.; Seshadri, B. Temperature dependent photovoltaic (PV) efficiency and its effect on PV production in the world—A review. Energy Procedia 2013, 33, 311–321. [Google Scholar] [CrossRef]
- Zondag, H. Flat-plate PV-thermal collectors and systems: A review. Renew. Sustain. Energy Rev. 2008, 12, 891–959. [Google Scholar] [CrossRef]
- Brottier, L.; Naudin, S.; Veeser, V.; Terrom, G.; Bennacer, R. Field test results of an innovative PV/T collector for solar domestic hot water. Energy Procedia 2016, 91, 276–283. [Google Scholar] [CrossRef]
- Dupeyrat, P.; Ménézo, C.; Rommel, M.; Henning, H.-M. Efficient single glazed flat plate photovoltaic–thermal hybrid collector for domestic hot water system. Sol. Energy 2011, 85, 1457–1468. [Google Scholar] [CrossRef]
- Buonomano, A.; De Luca, G.; Figaj, R.D.; Vanoli, L. Dynamic simulation and thermo-economic analysis of a photovoltaic/thermal collector heating system for an indoor–outdoor swimming pool. Energy Convers. Manag. 2015, 99, 176–192. [Google Scholar] [CrossRef]
- Yang, T.; Athienitis, A.K. A study of design options for a building integrated photovoltaic/thermal (BIPV/T) system with glazed air collector and multiple inlets. Sol. Energy 2014, 104, 82–92. [Google Scholar] [CrossRef]
- Corbin, C.D.; Zhai, Z.J. Experimental and numerical investigation on thermal and electrical performance of a building integrated photovoltaic–thermal collector system. Energy Build. 2010, 42, 76–82. [Google Scholar] [CrossRef]
- Charalambous, P.; Maidment, G.; Kalogirou, S.; Yiakoumetti, K. Photovoltaic thermal (PV/T) collectors: A review. Appl. Therm. Eng. 2007, 27, 275–286. [Google Scholar] [CrossRef]
- Chow, T.T. A review on photovoltaic/thermal hybrid solar technology. Appl. Energy 2010, 87, 365–379. [Google Scholar] [CrossRef]
- Su, D.; Jia, Y.; Huang, X.; Alva, G.; Tang, Y.; Fang, G. Dynamic performance analysis of photovoltaic–thermal solar collector with dual channels for different fluids. Energy Convers. Manag. 2016, 120, 13–24. [Google Scholar] [CrossRef]
- Tiwari, G.; Fischer, O.; Mishra, R.; Al-Helal, I. Performance evaluation of n-photovoltaic thermal (PVT) water collectors partially covered by photovoltaic module connected in series: An experimental study. Sol. Energy 2016, 134, 302–313. [Google Scholar]
- Kalogirou, S.A.; Tripanagnostopoulos, Y. Hybrid PV/T solar systems for domestic hot water and electricity production. Energy Convers. Manag. 2006, 47, 3368–3382. [Google Scholar] [CrossRef]
- Khelifa, A.; Touafek, K.; Moussa, H.B.; Tabet, I. Modeling and detailed study of hybrid photovoltaic thermal (PV/T) solar collector. Sol. Energy 2016, 135, 169–176. [Google Scholar] [CrossRef]
- Touafek, K.; Kerrour, F.; Haloui, H.; Khelifa, A. Model validation of an empirical photovoltaic thermal (PV/T) collector. Energy Procedia 2015, 74, 1090–1099. [Google Scholar]
- Aste, N.; Del Pero, C.; Leonforte, F.; Manfren, M. Performance monitoring and modeling of an uncovered photovoltaic-thermal (PVT) water collector. Sol. Energy 2016, 135, 551–568. [Google Scholar] [CrossRef]
- Yazdanifard, F.; Ebrahimnia-Bajestan, E.; Ameri, M. Investigating the performance of a water-based photovoltaic/thermal (PV/T) collector in laminar and turbulent flow regime. Renew. Energy 2016, 99, 295–306. [Google Scholar] [CrossRef]
- Nualboonrueng, T.; Tuenpusa, P.; Ueda, Y.; Akisawa, A. Field experiments of PV-thermal collectors for residential application in bangkok. Energies 2012, 5, 1229–1244. [Google Scholar] [CrossRef]
- Jarimi, H.; Bakar, M.N.A.; Othman, M.; Din, M.H. Bi-fluid photovoltaic/thermal (PV/T) solar collector: Experimental validation of a 2-D theoretical model. Renew. Energy 2016, 85, 1052–1067. [Google Scholar] [CrossRef]
- Taylor, M.; Daniel, K.; Ilas, A.; So, E.Y. Renewable Power Generation Costs in 2014; International Renewable Energy Agency: Abu Dhabi, UAE, 2015. [Google Scholar]
- Calise, F.; d’Accadia, M.D.; Figaj, R.D.; Vanoli, L. A novel solar-assisted heat pump driven by photovoltaic/thermal collectors: Dynamic simulation and thermoeconomic optimization. Energy 2016, 95, 346–366. [Google Scholar] [CrossRef]
- Buonomano, A.; Calise, F.; Vicidomini, M. Design, simulation and experimental investigation of a solar system based on PV panels and PVT collectors. Energies 2016, 9, 497. [Google Scholar] [CrossRef]
- Deng, J.; Yang, M.; Ma, R.; Zhu, X.; Fan, J.; Yuan, G.; Wang, Z. Validation of a simple dynamic thermal performance characterization model based on the piston flow concept for flat-plate solar collectors. Sol. Energy 2016, 139, 171–178. [Google Scholar] [CrossRef]
- Incropera, F.P.; DeWitt, D.P. Fundamentals of Heat and Mass Transfer, 5th ed; John Wiley & Sons Inc.: Hoboken, NJ, USA, 2001. [Google Scholar]
- University of Wisconsin—Madison. Solar Energy Laboratory, Trnsys. A Transient System Simulation Program; University of Wisconsin: Madison, WI, USA, 2006. [Google Scholar]
Figure 1.
Discretization of the computational domain.

Figure 2.
Experimental installation: (1) 4 Janus PVT collectors, (2) BSV ELBI storage tank, (3) connection pipes, (4) expansion vessel, (5) safety valve, (6) WILO Yonos PARA ST 7.0 PWM2 circulation pump.
Figure 2.
Experimental installation: (1) 4 Janus PVT collectors, (2) BSV ELBI storage tank, (3) connection pipes, (4) expansion vessel, (5) safety valve, (6) WILO Yonos PARA ST 7.0 PWM2 circulation pump.
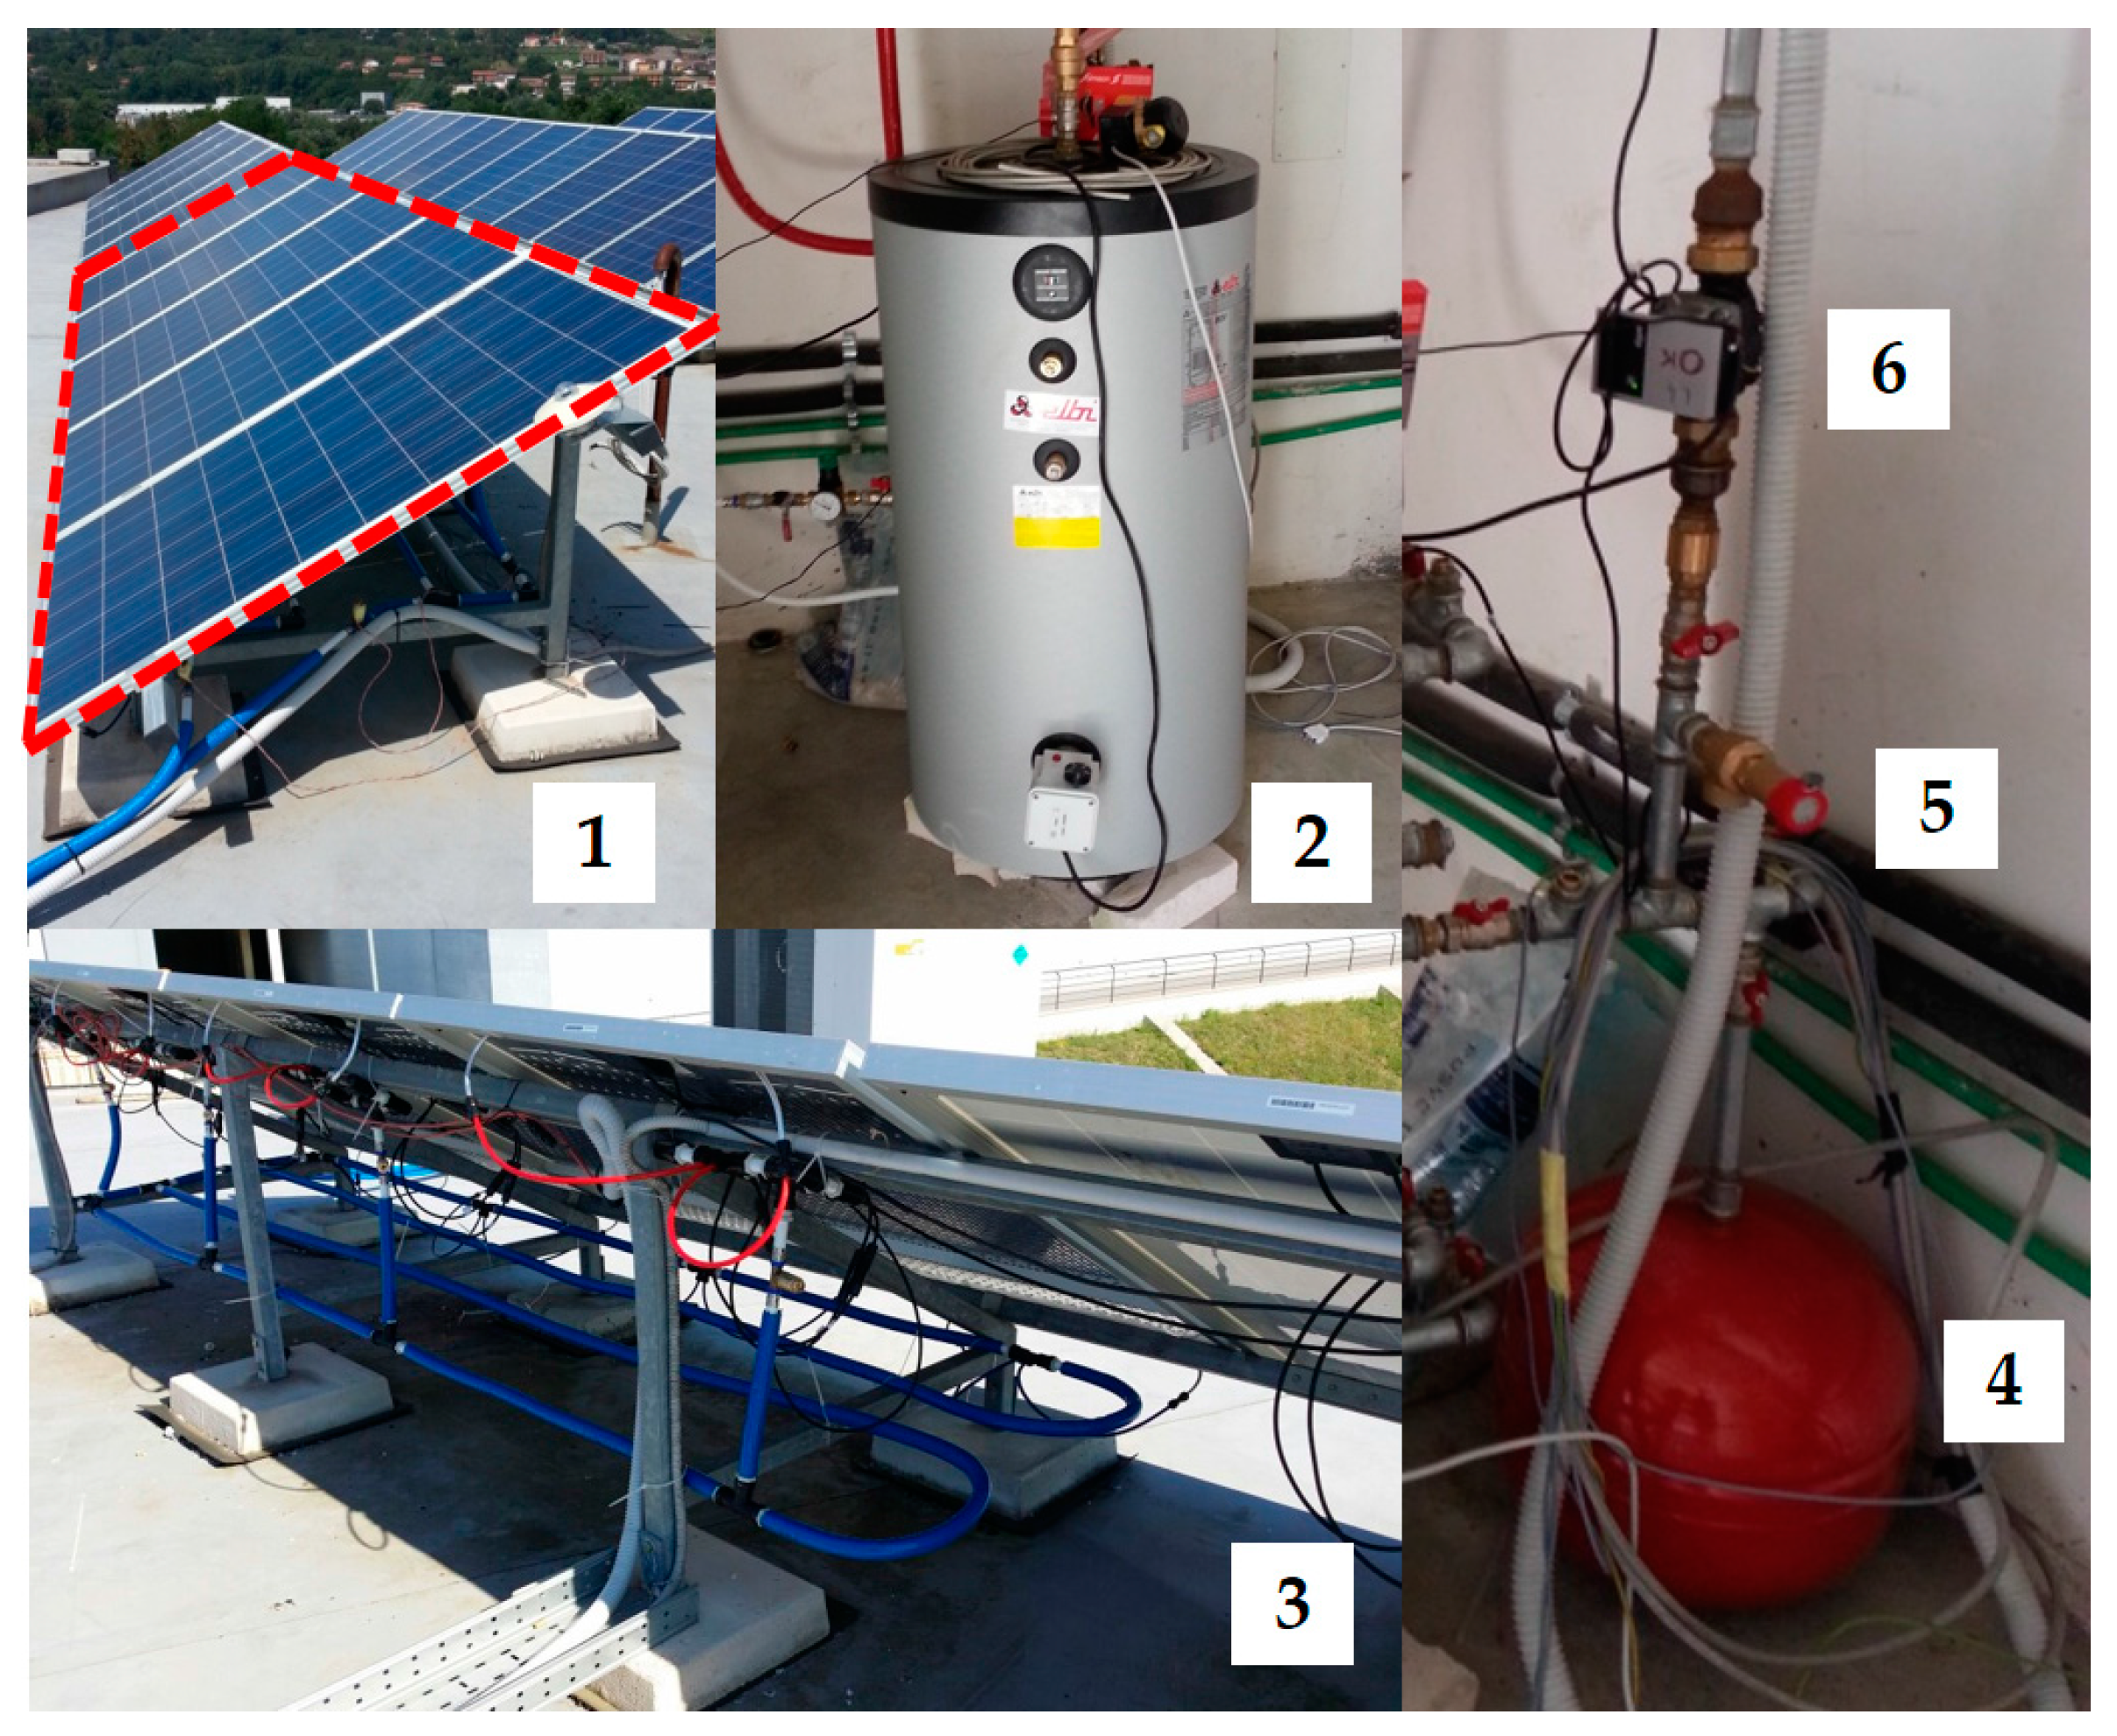
Figure 3.
Experimental results, temperatures and solar radiation.
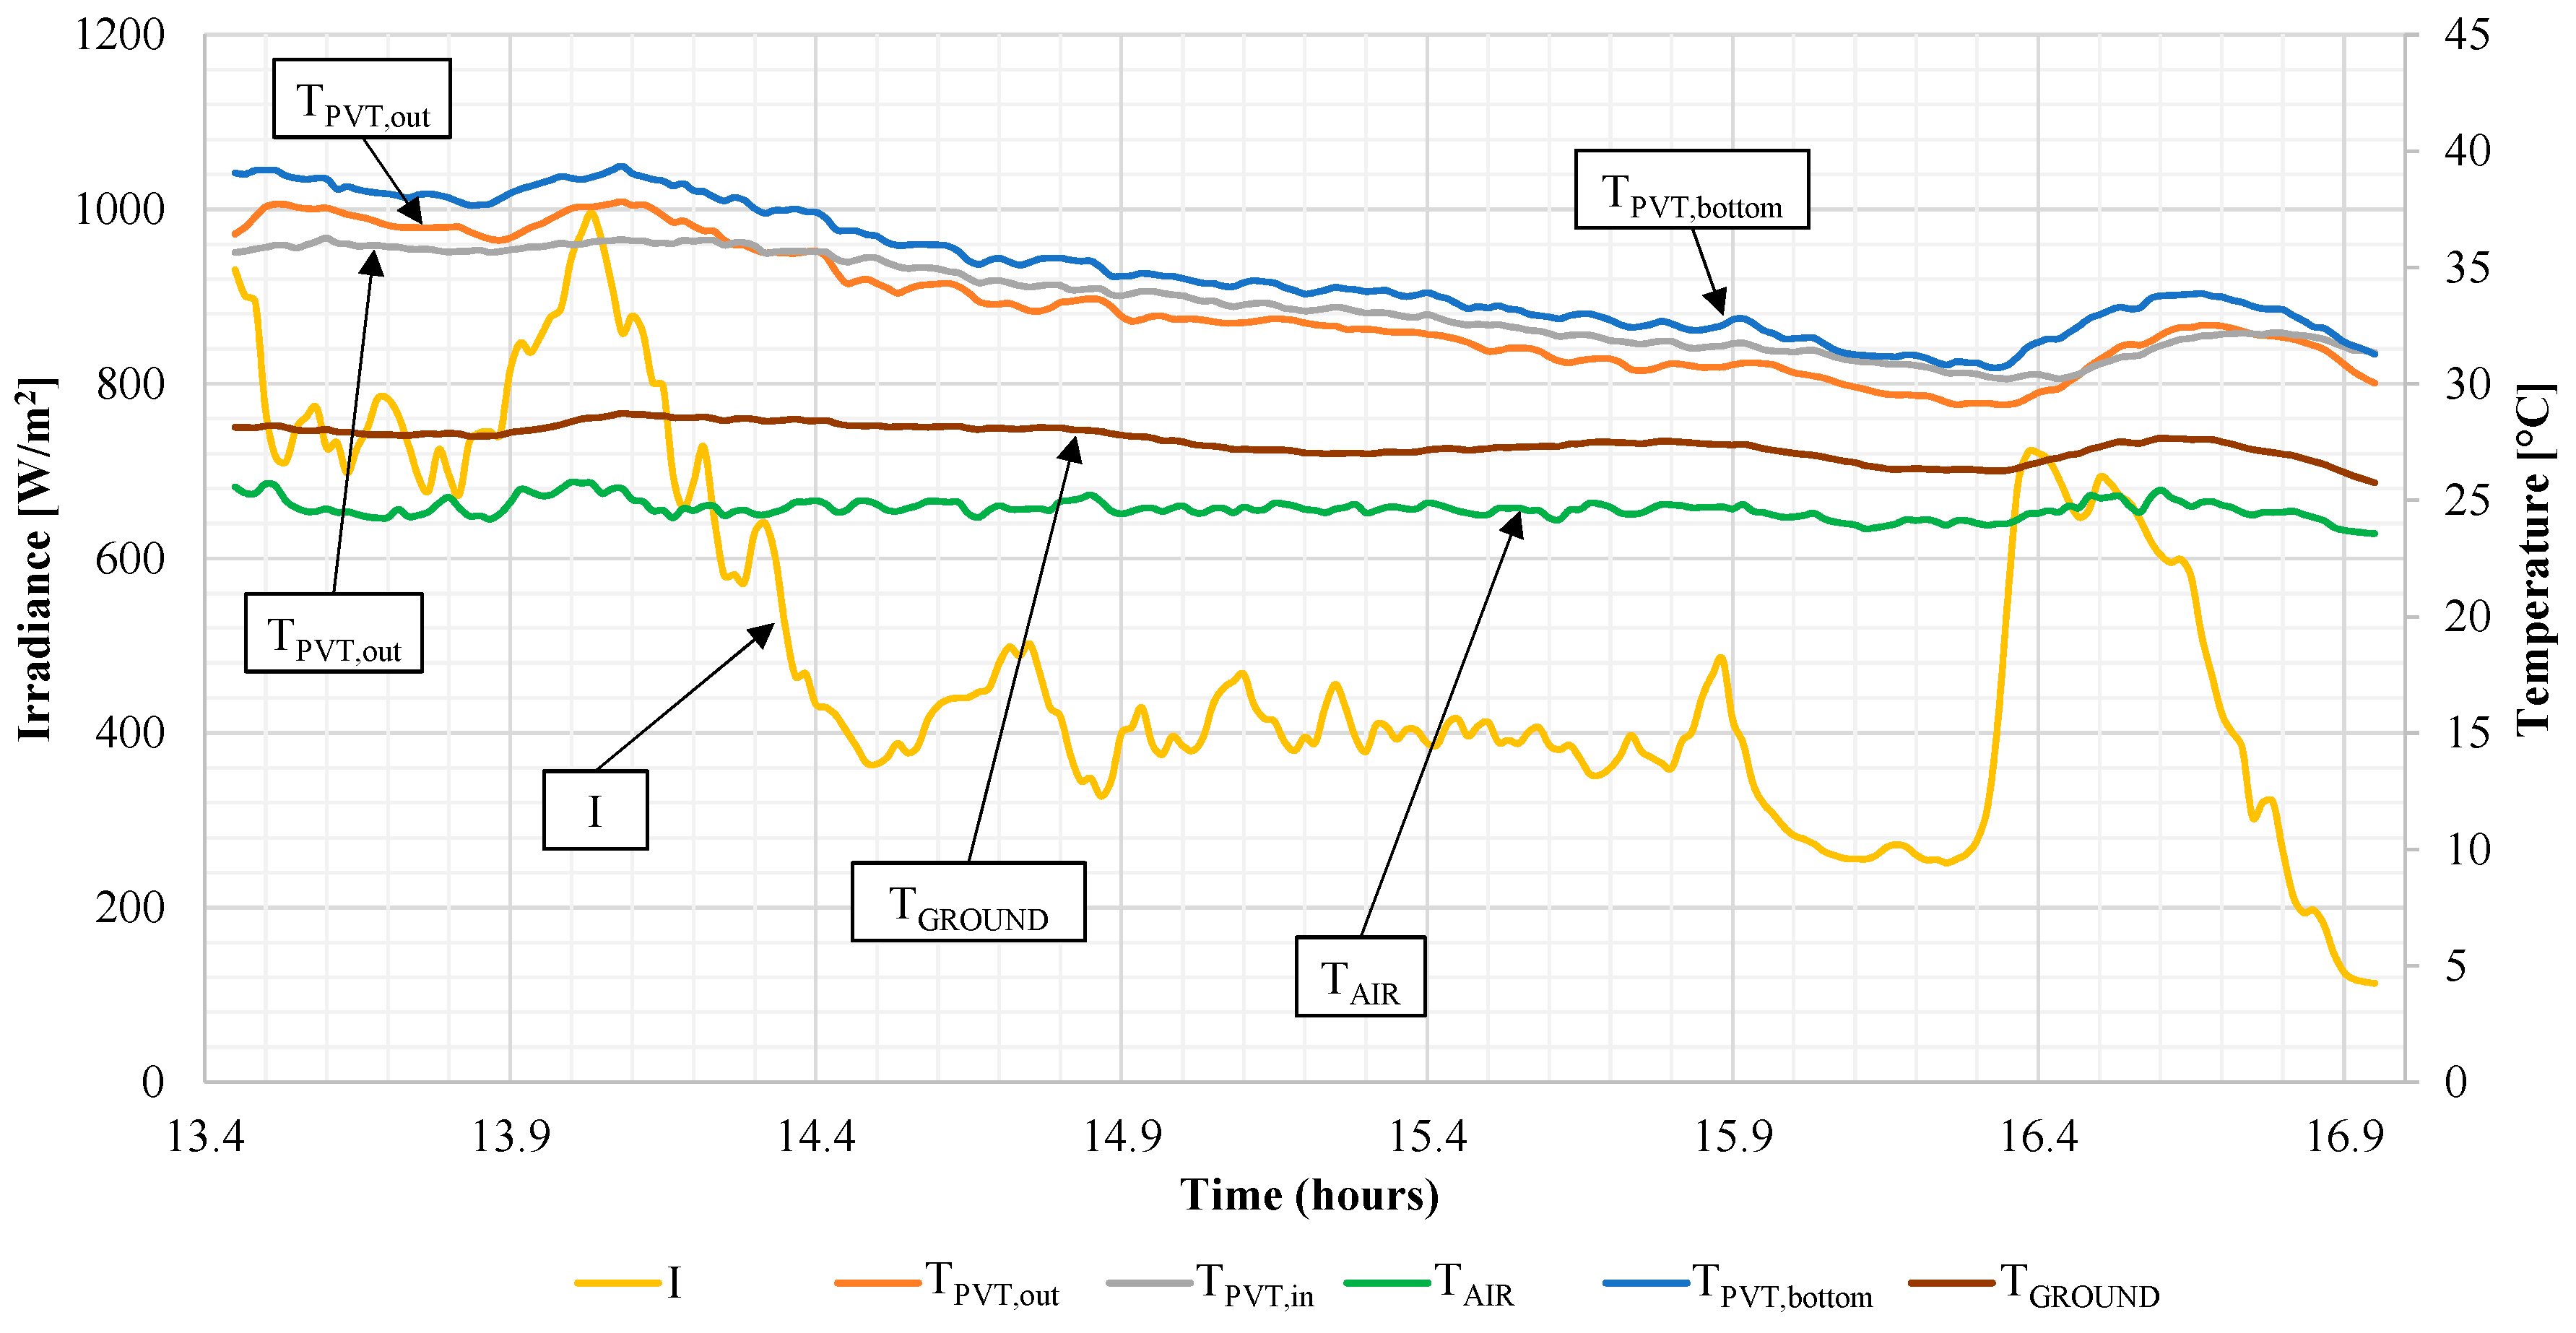
Figure 4.
Experimental vs. numerical results, measured and calculated PVT outlet temperature and absolute error.
Figure 4.
Experimental vs. numerical results, measured and calculated PVT outlet temperature and absolute error.

Figure 5.
Experimental vs. numerical results, measured and calculated PVT aluminum bottom substrate temperature and the absolute error.
Figure 5.
Experimental vs. numerical results, measured and calculated PVT aluminum bottom substrate temperature and the absolute error.
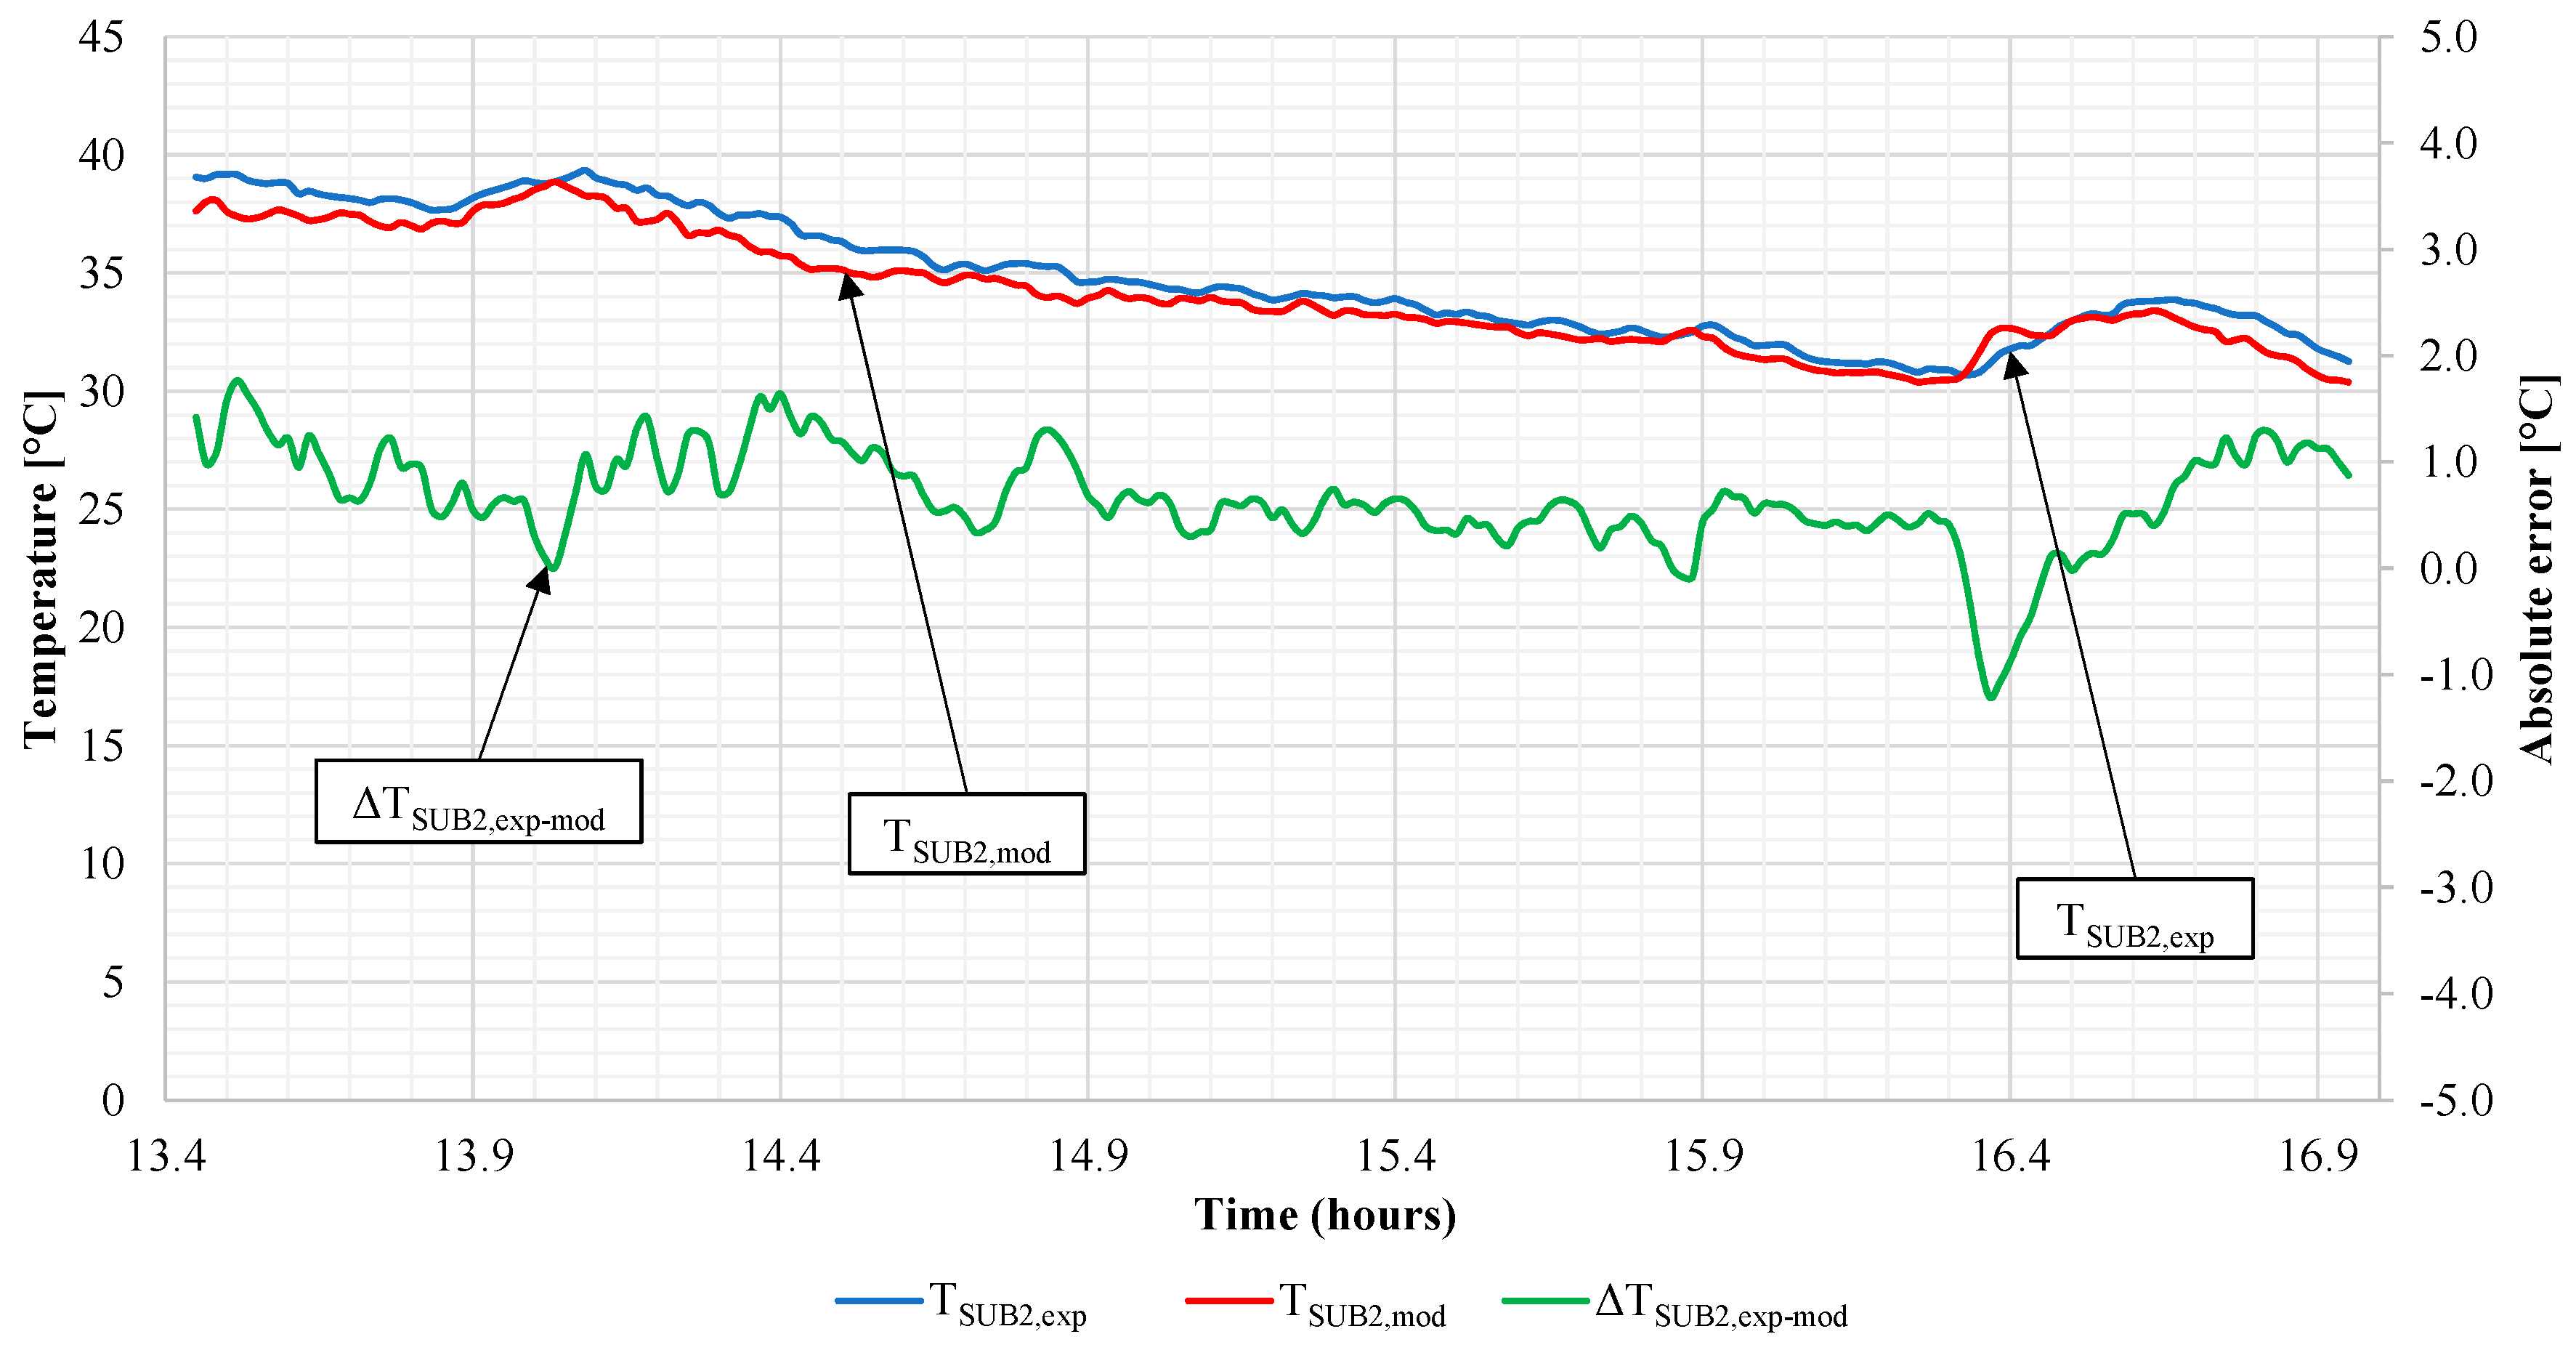
Figure 6.
Experimental vs. numerical results, measured and calculated PVT electrical power output and the absolute error.
Figure 6.
Experimental vs. numerical results, measured and calculated PVT electrical power output and the absolute error.

Figure 7.
Temperatures profiles of the collector layers.
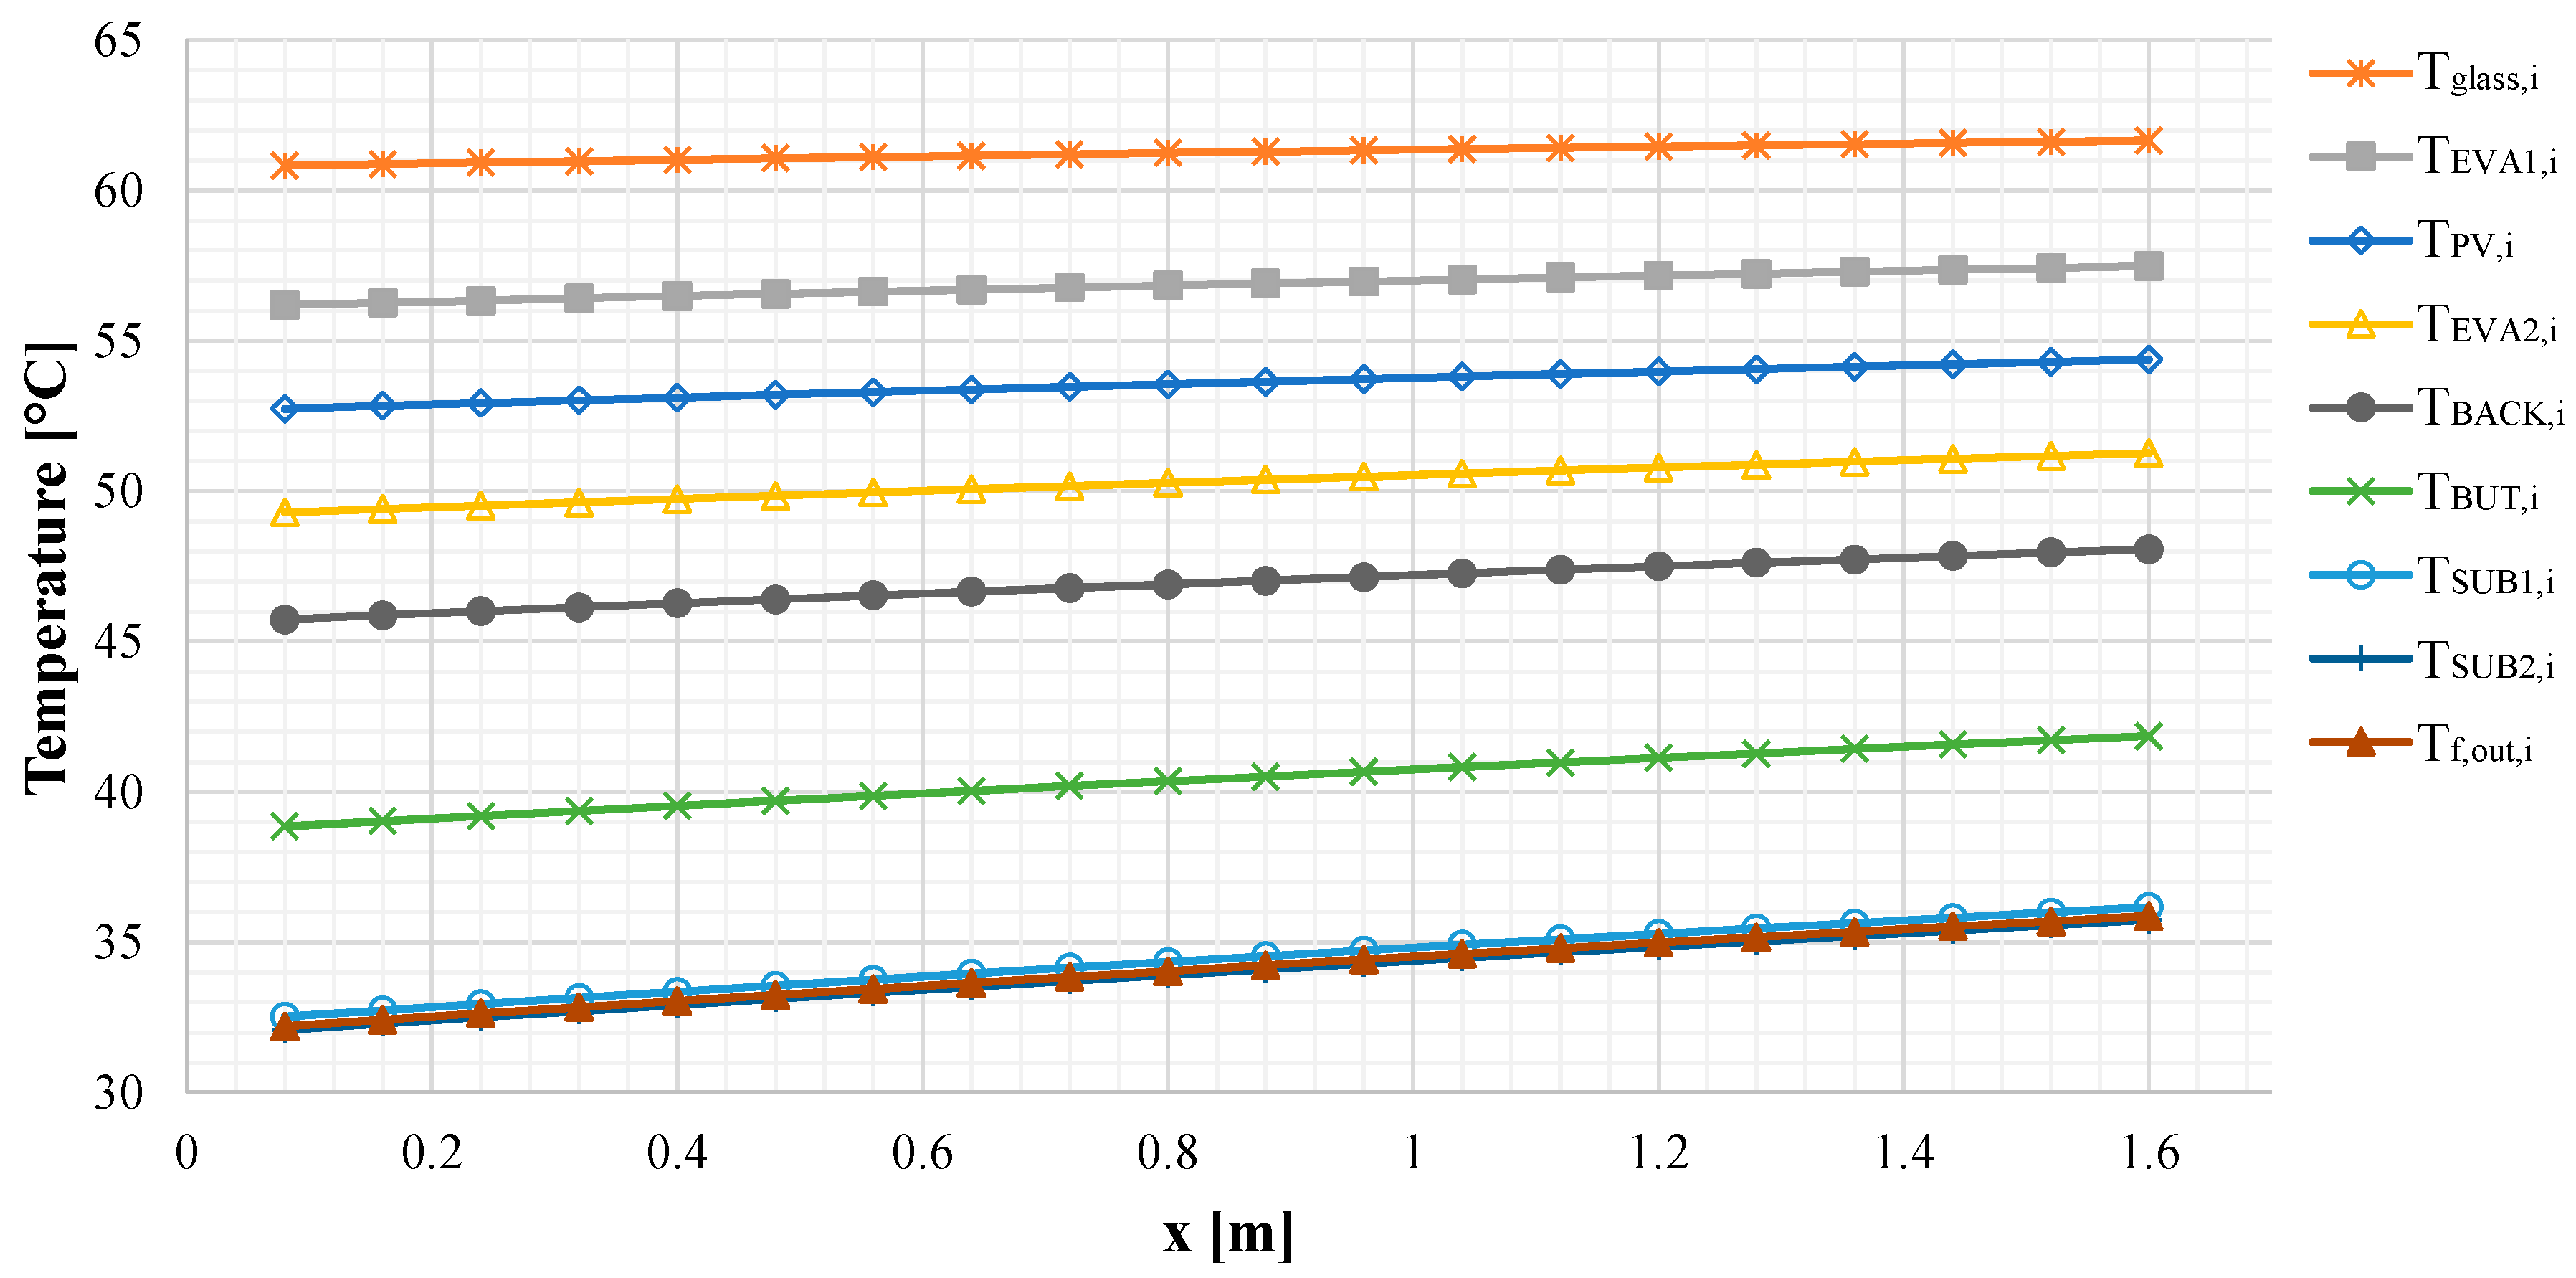
Figure 8.
Specific thermal and electrical power profiles.

Figure 9.
Electrical and thermal efficiency profiles.

Figure 10.
Sensitivity analysis, fluid outlet temperature vs. solar radiation and fluid inlet temperature.
Figure 10.
Sensitivity analysis, fluid outlet temperature vs. solar radiation and fluid inlet temperature.
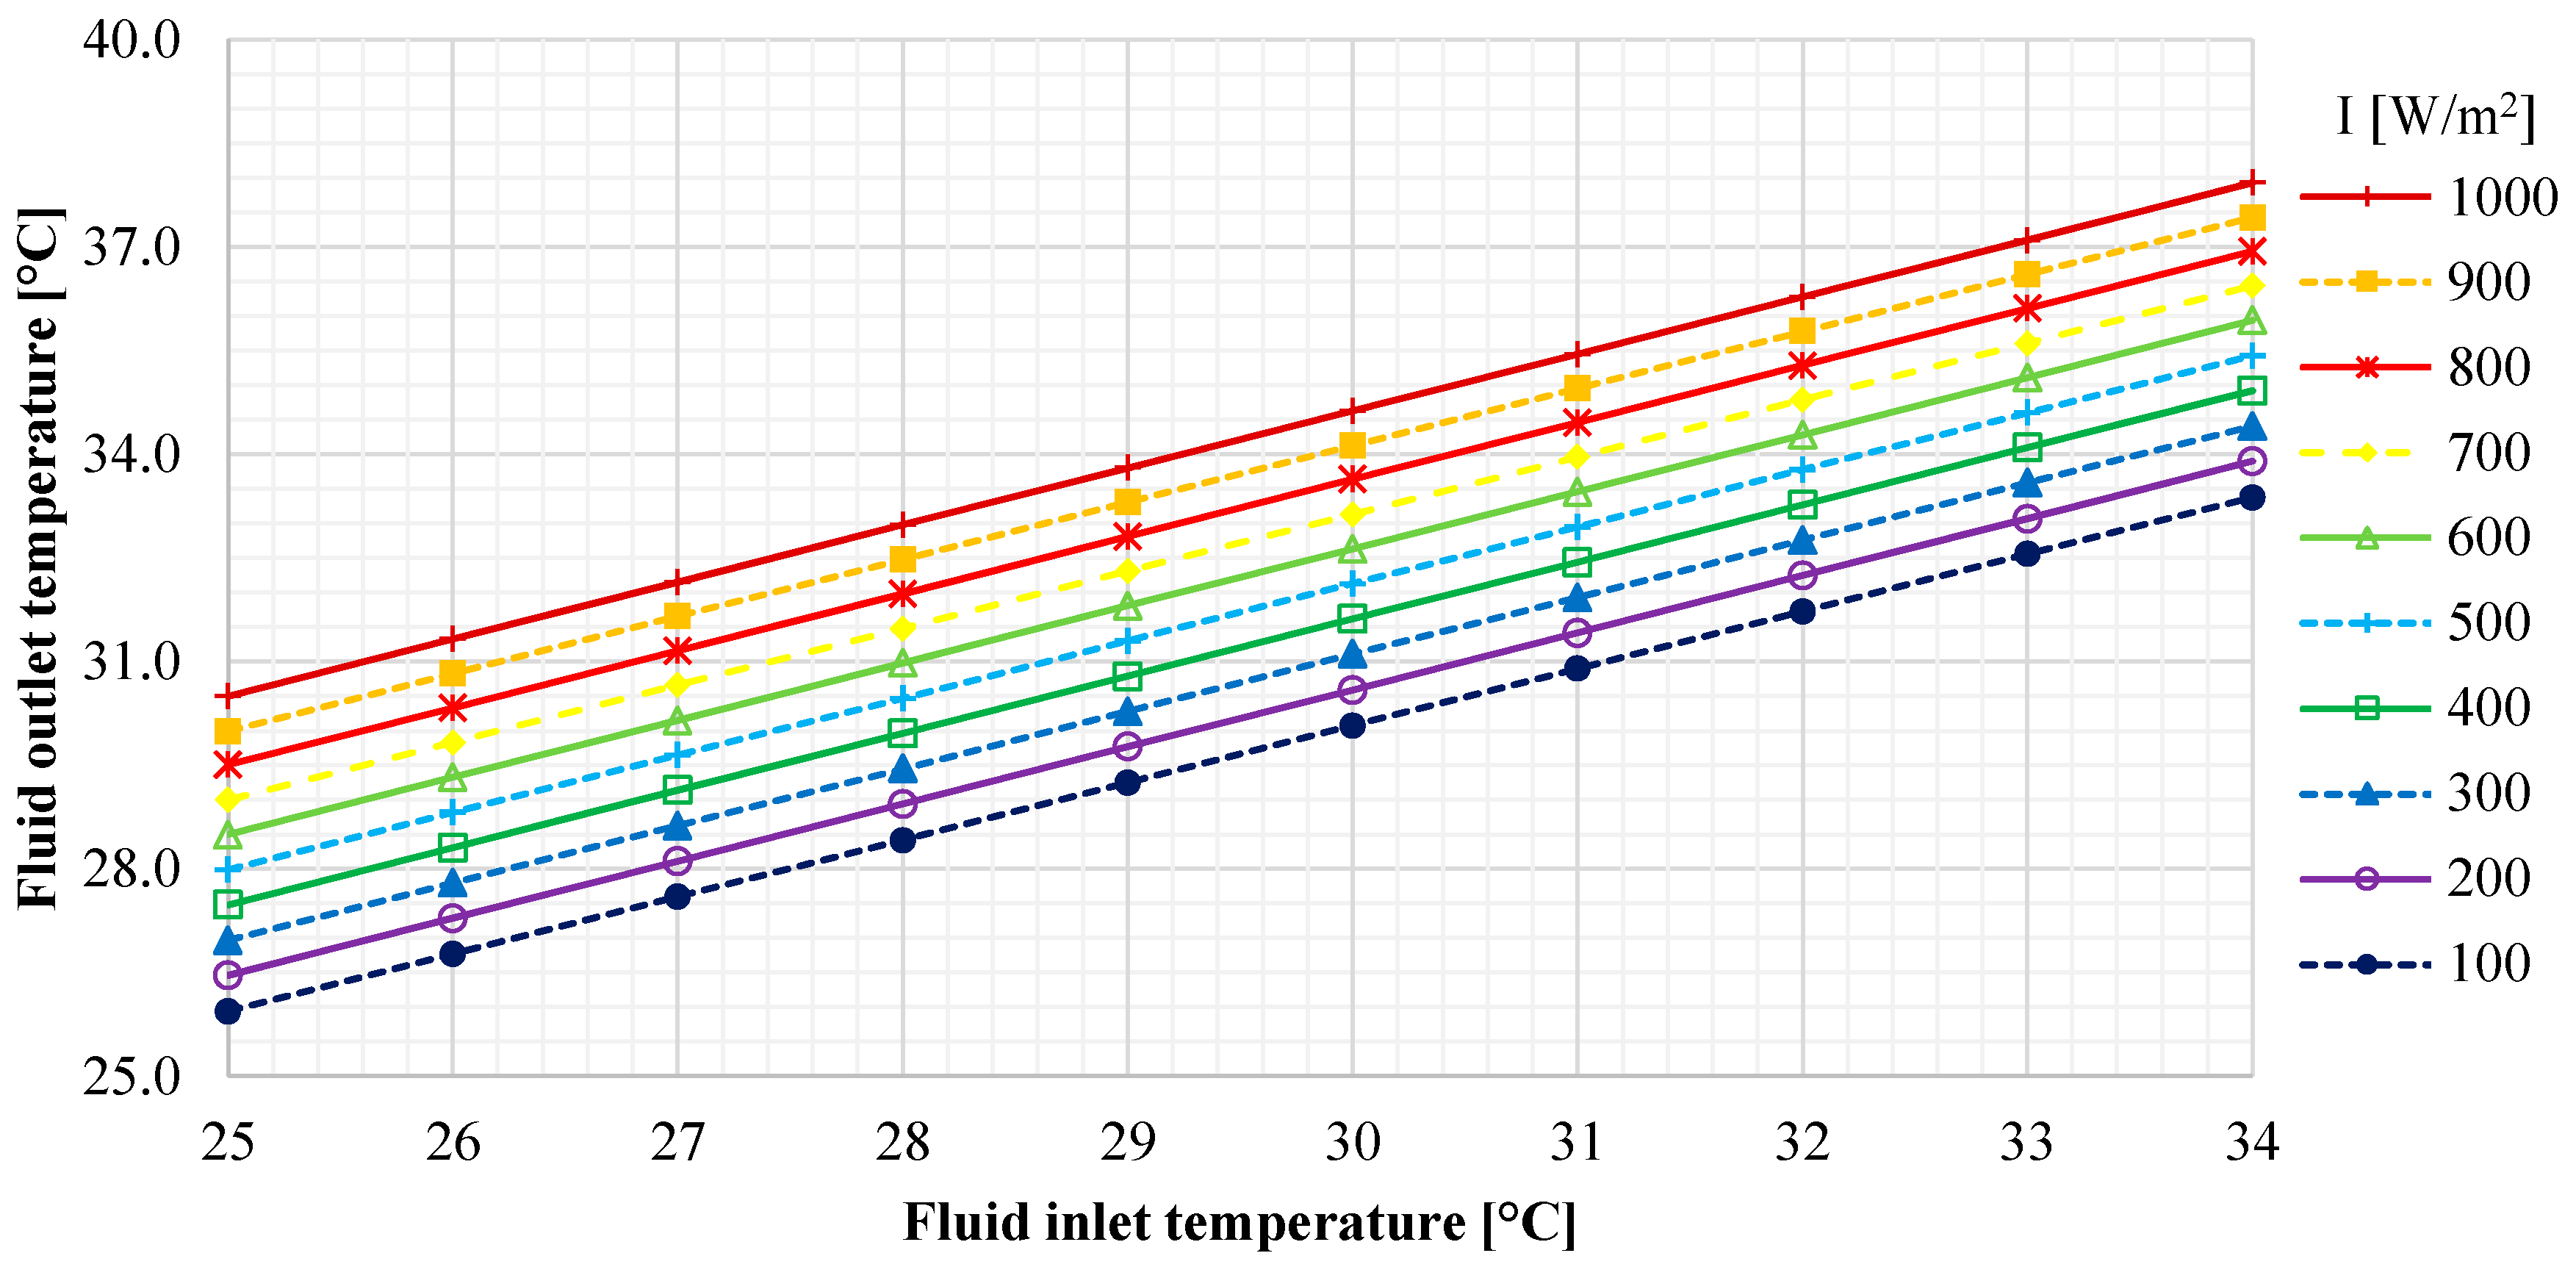
Figure 11.
Sensitivity analysis, thermal efficiency vs. solar radiation and fluid inlet temperature.
Figure 11.
Sensitivity analysis, thermal efficiency vs. solar radiation and fluid inlet temperature.

Figure 12.
Sensitivity analysis, PV cell electrical efficiency vs. solar radiation and fluid inlet temperature.
Figure 12.
Sensitivity analysis, PV cell electrical efficiency vs. solar radiation and fluid inlet temperature.


Table 1.
Parameters of the Janus PVT collector model.
| Parameter | Description | Value/Unit |
|---|---|---|
| ρGLASS | Glass reflectance coefficient | 0.07 [-] |
| εGLASS | Glass emissivity coefficient | 0.85 [-] |
| εSUB2 | Aluminum emissivity coefficient | 0.09 [-] |
| ηPV,ref | PV efficiency at reference conditions (25 °C) | 0.155 [-] |
| β | PV efficiency reduction coefficient | 0.0004 [1/°C] |
| λGLASS | Glass thermal conductivity | 0.50 [W/(m°C)] |
| sGLASS | Glass thickness | 3.2 [mm] |
| λEVA | EVA thermal conductivity | 0.04 [W/(m°C)] |
| sEVA | EVA thickness | 0.46 [mm] |
| λPV | PV cell thermal conductivity | 1.10 [W/(m°C)] |
| sPV | PV cell thickness | 2.0 [mm] |
| λBACK | Back-sheet thermal conductivity | 0.15 [W/(m°C)] |
| sBACK | Back-sheet thickness | 0.33 [mm] |
| λBUT | Butyl adhesive thermal conductivity | 0.041 [W/(m°C)] |
| sBUT | Butyl adhesive thickness | 1.0 [mm] |
| λSUB | Aluminum substrate thermal conductivity | 204 [(W/(m°C)] |
| sSUB | Aluminum substrate thickness | 0.75 [mm] |
Table 2.
Technical features of experimental equipment.
| Description | Value/Unit |
|---|---|
| WILO Yonos PARA ST 7.0 PWM2 pump | |
| Maximum flowrate | 3.2 m3/h |
| Maximum operating pressure | 10 bar |
| Head | 7.0 m |
| Multicon Simex CMC14 data logger | |
| Sensor power supply output | 24 Vcc ± 5%/max 200 mA |
| Communication interface | RS-485 Modbus RTU; USB |
| Digital input | 24 Vcc |
| Communication Module | Module “ETU” of communication, USB, Ethernet |
| Input Modules | Module “R81” 8 relè to 1 A, Module “I24” 24 analogic inlets in current 0/4–20 mA |
| Output Module | “IO6” 6 analogic outlets in current 4–20 mA |
| Operation Temperature | 0–50 °C |
| SMC LFE 1D4F1 flowmeter | |
| Range of flowrate reading | 0.5–20 L/min |
| Accuracy | ±0.5% of full scale |
| Range of operation temperature | 0–85 °C |
| Detection Method | Electrostatic capacity |
| Range of operating pressure | 0–10 bar |
| Digital output | Max current: 80 mA, Max voltage: 28 VDC |
| LP PYRA 02 AC pyranometer | |
| Radiation range | 0–2000 W/m2 |
| Typical sensitivity | 10 μV/(W/m2) |
| Spectral field | 305–2800 nm |
| Temperature operation range | −40–80 °C |
| Accuracy | ISO 9060-First Class |
| Off-set of zero | 25 W/m2 |
| PT 100 temperature sensor | |
| Temperature range | −50–200 °C |
| Accuracy | Class B: ±0.30 °C (0 °C) |
| Probe covering material | stainless steel AISI 316 |
| K type thermocouple sensor | |
| Temperature range | −50–150 °C |
| Accuracy | ±1.5 °C |
| Sensibility | 41 μV/°C |
| Probe covering material | silicon rubber |
© 2017 by the authors. Licensee MDPI, Basel, Switzerland. This article is an open access article distributed under the terms and conditions of the Creative Commons Attribution (CC BY) license (http://creativecommons.org/licenses/by/4.0/).
Share and Cite
MDPI and ACS Style
Calise, F.; Figaj, R.D.; Vanoli, L. Experimental and Numerical Analyses of a Flat Plate Photovoltaic/Thermal Solar Collector. Energies 2017, 10, 491. https://doi.org/10.3390/en10040491
AMA Style
Calise F, Figaj RD, Vanoli L. Experimental and Numerical Analyses of a Flat Plate Photovoltaic/Thermal Solar Collector. Energies. 2017; 10(4):491. https://doi.org/10.3390/en10040491
Chicago/Turabian StyleCalise, Francesco, Rafal Damian Figaj, and Laura Vanoli. 2017. "Experimental and Numerical Analyses of a Flat Plate Photovoltaic/Thermal Solar Collector" Energies 10, no. 4: 491. https://doi.org/10.3390/en10040491
Note that from the first issue of 2016, this journal uses article numbers instead of page numbers. See further details here.