1. Introduction
At the end of 2015, world cumulative installed solar PV power capacity reached 229.3 GWp. Only in this year, 50.6 GWp was installed and a growth of 29% was registered [
1]. Thus, year after year PV systems become increasingly popular. Around the world, there are many different applications, ranging from stand-alone systems, in rural and isolated areas, to grid-connected systems, usually huge power plants and/or distributed systems, inside or close to urban areas. One of these applications (and distinguished application) is to install PV systems on sports stadiums (football, basketball, baseball, cricket, etc.), as they promote the visibility of such structures.
Nowadays, since International Olympic Committee (IOC) first included environmental protection (Green Programs—“the third pillar of Olympics games”) as one of the requirements for a successful bid to host the Games, PV systems and solar heat collectors have been promoted as sources of renewable energy to be used in stadiums, multi sports arenas and athletes Olympic villages.
In particular, the 2000 Summer Olympic Games in Sydney (first IOC greening program, inspired by the commitment due to conservation measures taken during 1994 Winter Olympics in Lillehammer, Norway), as well as Winter Olympics Games in Turin (2006), Beijing (2008), Vancouver (2010), London (2012) and Rio (2016) all included substantial greening programs.
Green programs have five key performance areas: energy conservation, water conservation, reduction of waste generation, pollution avoidance and protection of natural environment [
2,
3]. Today, sustainability is an essential part of any modern Olympic Games’ project and a central concept in the Olympic Agenda 2020 initiative. Thus, solar energy in sports is becoming usual as professional sports seek a competitive edge in sustainability.
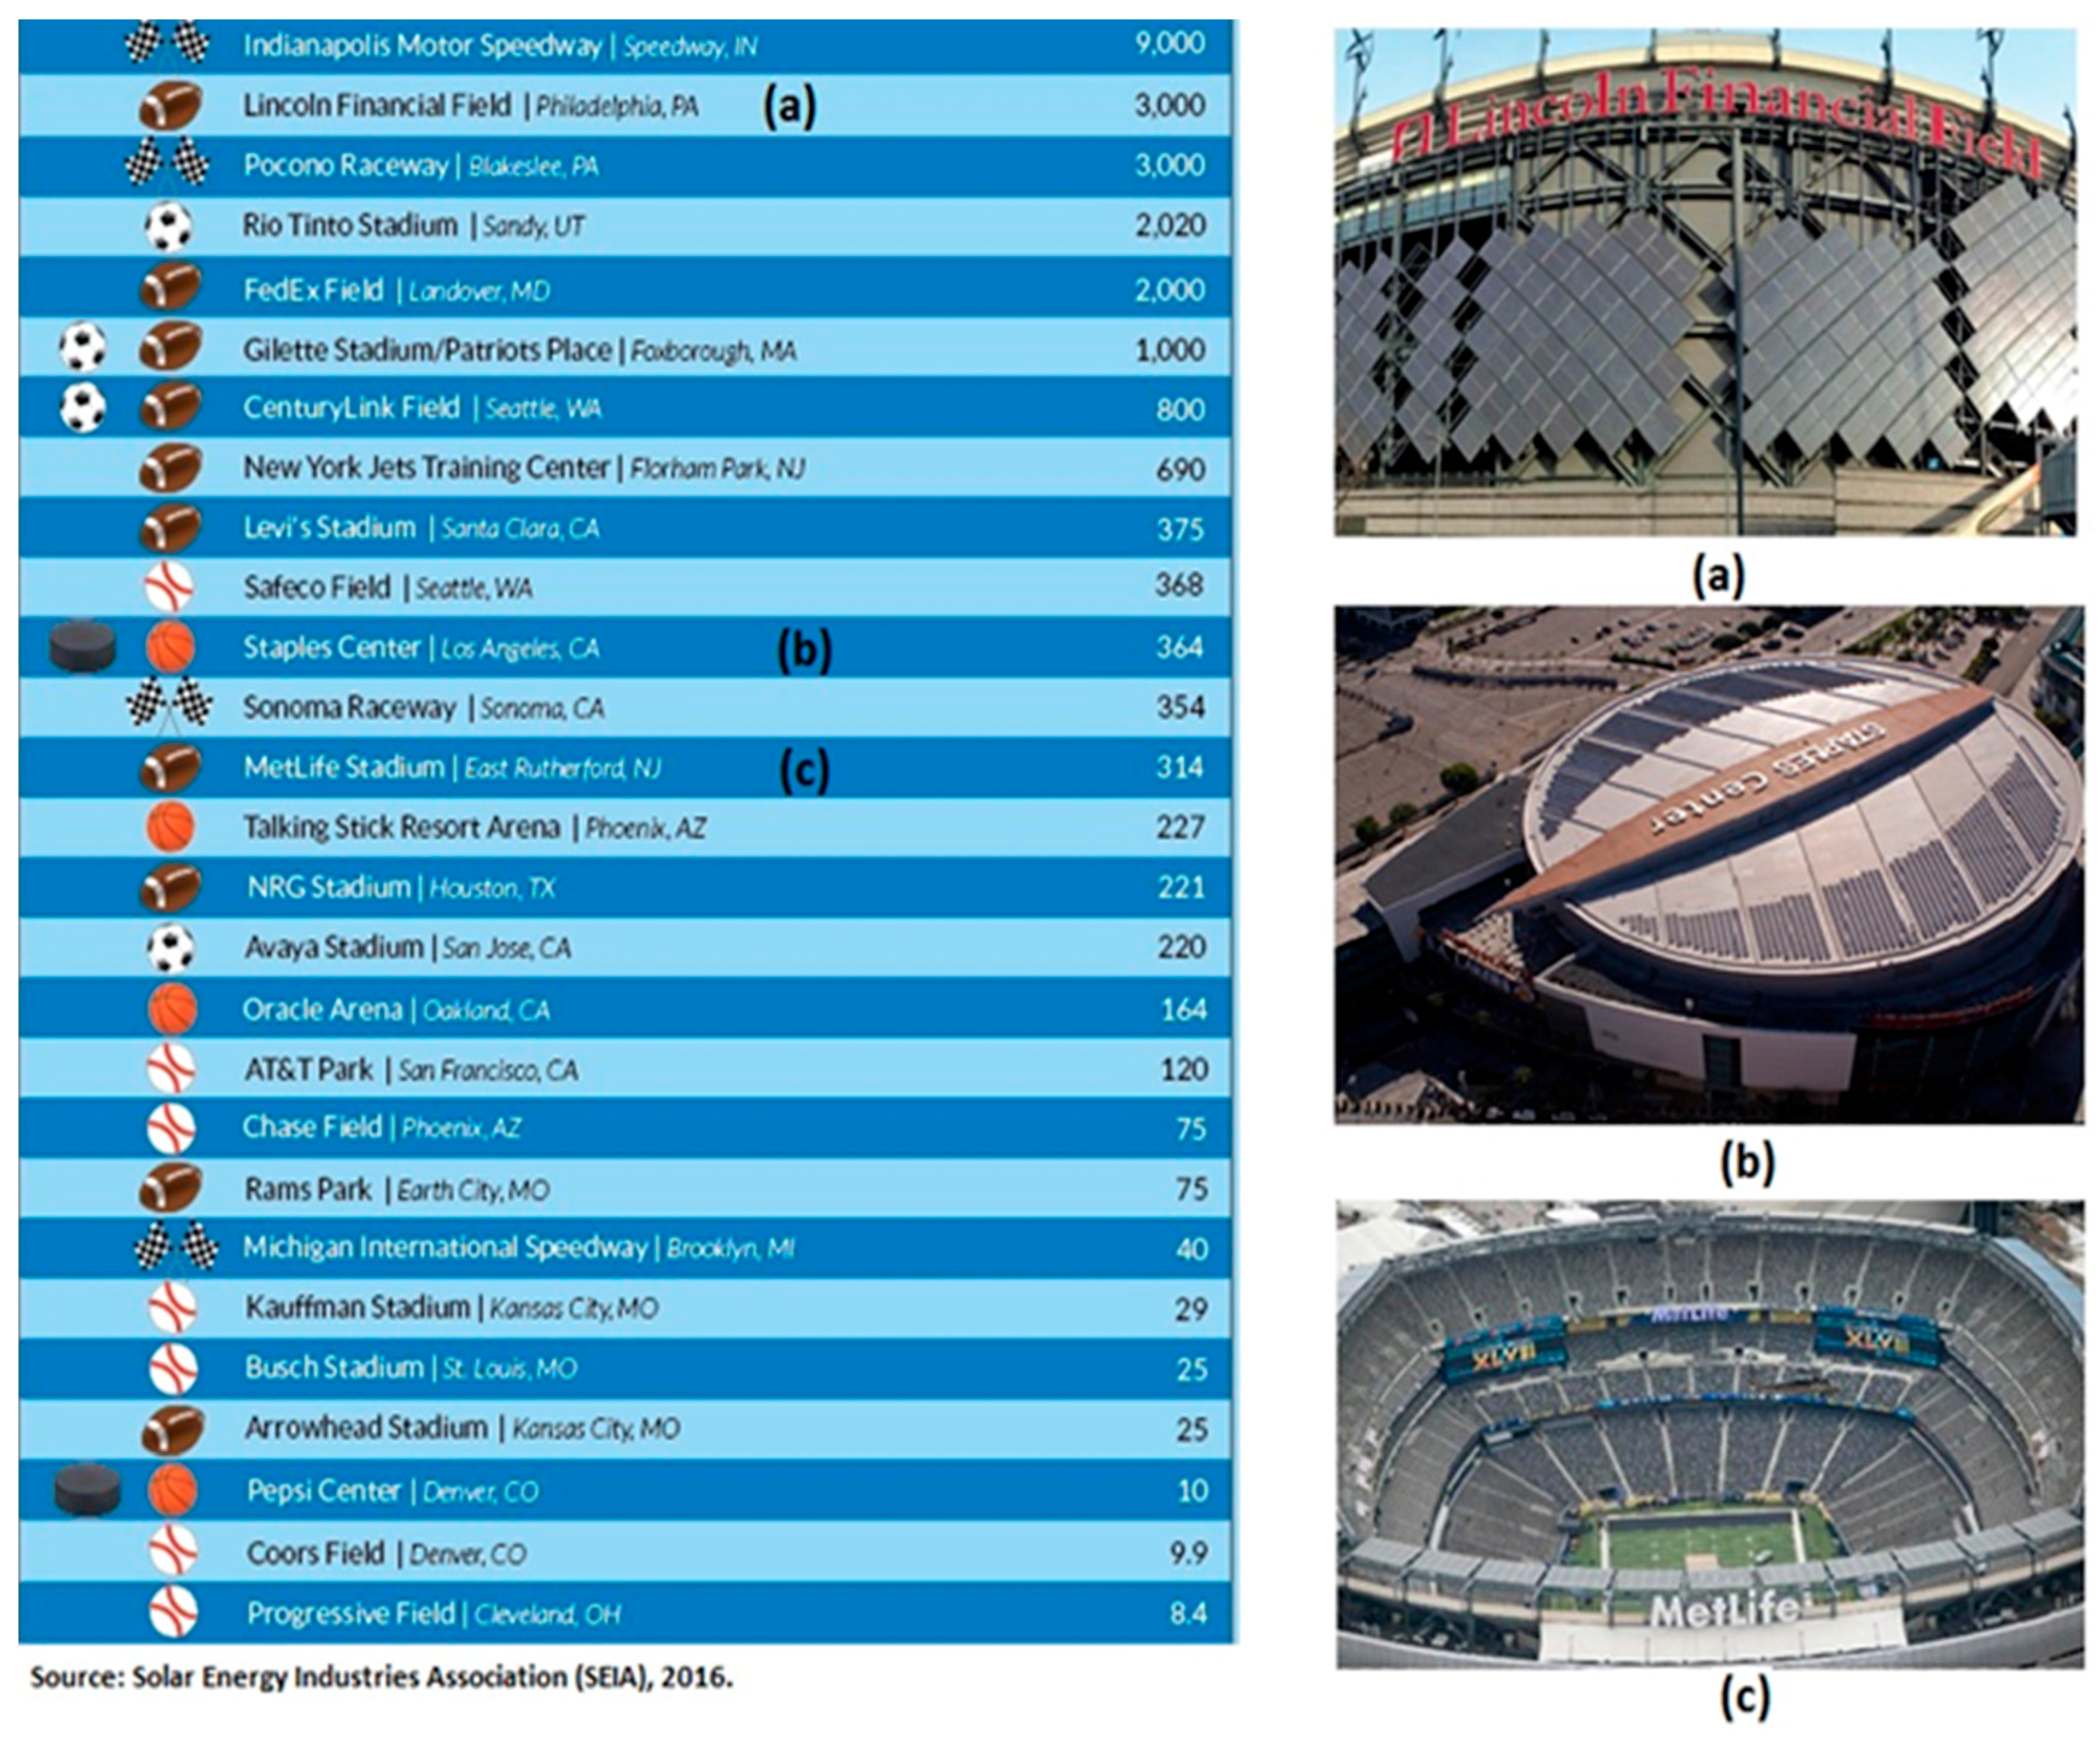
Many are initiatives around world that use solar power in sports stadiums to save and/or export energy to a local utility grid. According to Solar Energy Industries Association [
4] in United States of America (U.S.), the total accumulative solar power capacity in professional sports facilities reached 25.4 MWp in 2015 (a growth of 13% by year).
Figure 1 shows solar installations at professional U.S. sports facilities, ranked by the total cumulative capacity in kilowatts (kWp).
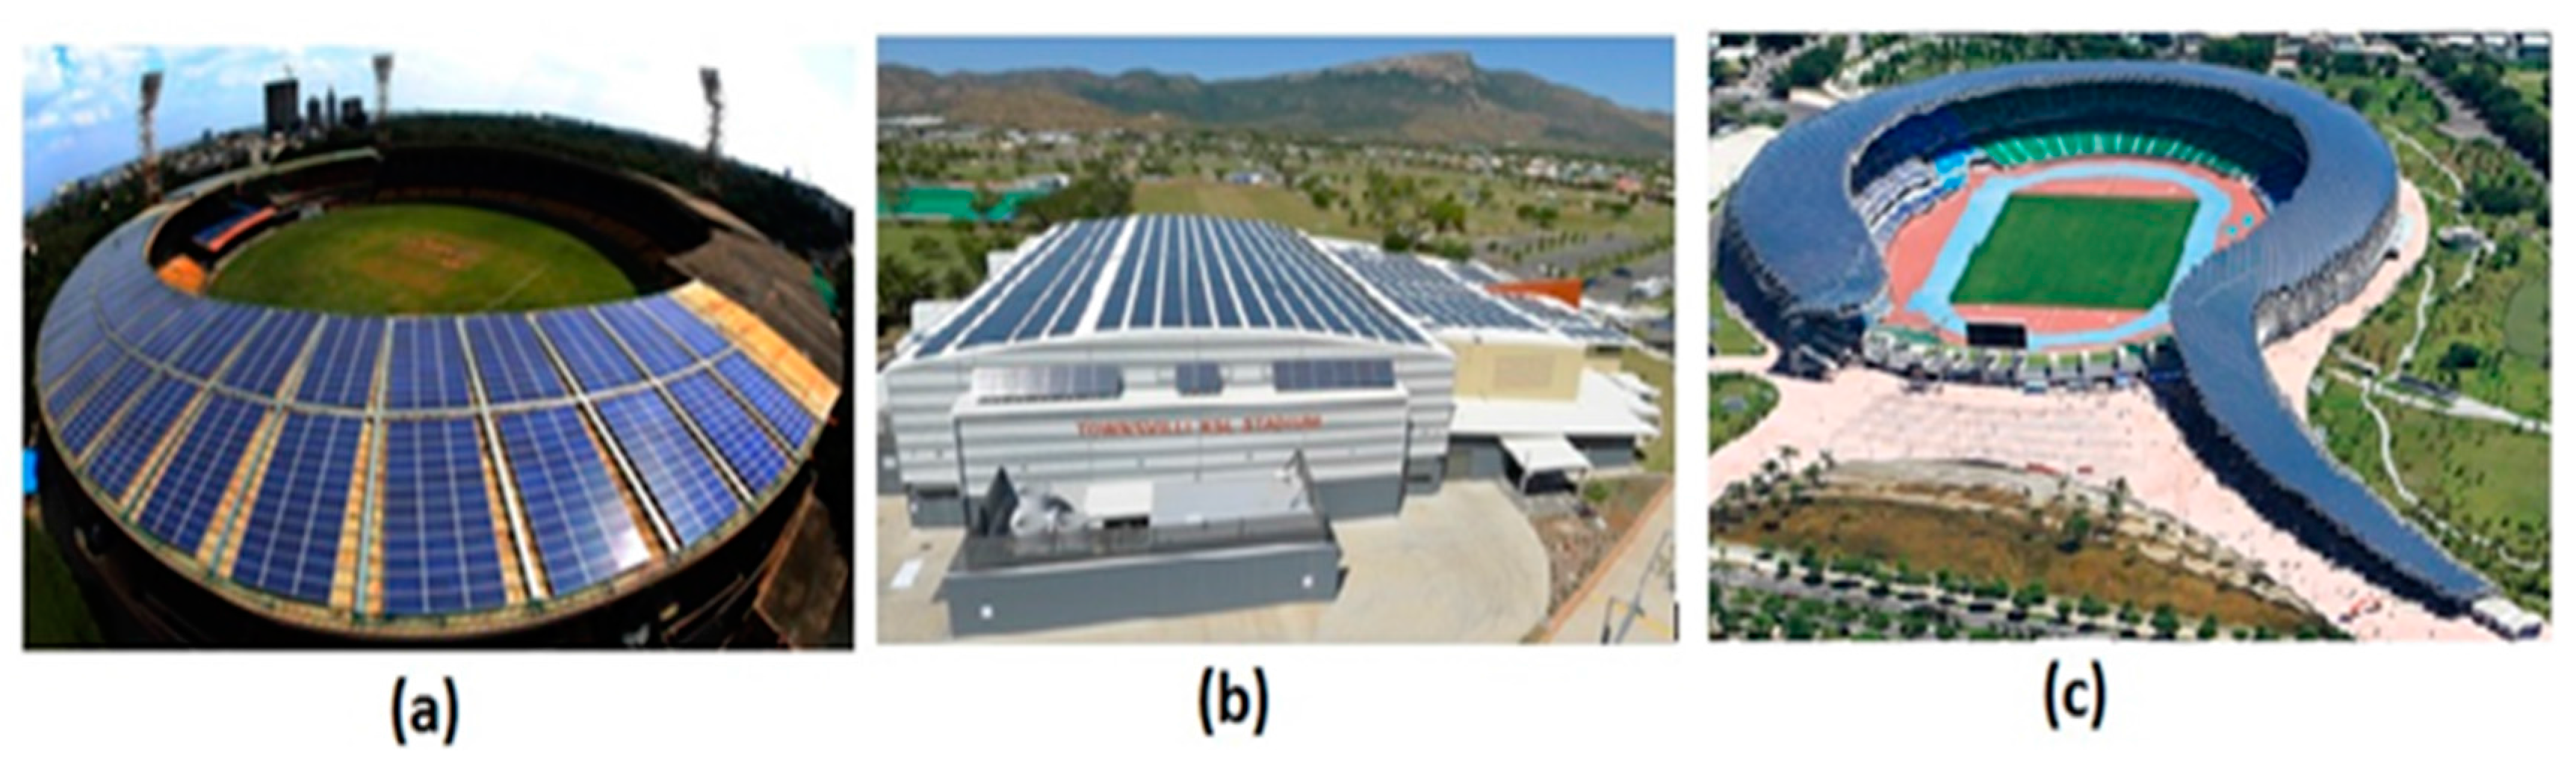
In Asia, the National Stadium in Kaohsiung, Taiwan has a 1 MWp PV system installed on the rooftop. Built for the 2009 World Games and used in the 2014 Asian Games, it is the world’s first stadium to rely solely on solar power. Thyagraj Stadium in India’s capital Delhi City, which hosted the 2010 Commonwealth Games, installed India’s first 1 MWp rooftop solar plant [
5]. In 2015, in Bangalore, India, the M. Chinnaswammy stadium received a 400 kWp PV system on its rooftop. In 2008, Summer Olympics Games in Beijing, China the Olympic Stadium “Bird’s Nest” was partially supplied by a 130 kWp PV system [
6].
In Australia, in 2000 Summer Olympics Games hosted in Sydney, the basketball Super Dome and Olympic Park received rooftop PV systems of 70 kWp and 64 kWp, respectively. In Townsville City, a 348 kWp PV power plant was installed on the Townsville Basketball Stadium in 2012 [
7] and in Carrara football stadium (220 kWp/BIPV) at Gold Coast City.
Figure 2 illustrates examples of PV systems installed at rooftops in Australia, India and Malaysia.
In Europe, some countries have adopted a method for space usage on rooftops of stadiums to generate electric energy from solar panels denominated as “Solar Stadia”. Therefore, during the 2006 FIFA (Fédération Internationale de Football Association) World Cup in Germany and 2008 UEFA (Union of European Football Associations) Cup in Switzerland this method was put into practice [
8]. Thus, for the first time in FIFA history, the World Cup Championships specifically addressed environmental concerns by creating the so-called “Green Goal” program (created in 2003 and, in Germany, 2006 was the first greening program for a football competition) which has the following main areas: water, waste, energy, and transportation [
9]. By doing so, FIFA did not have the purpose of creating a short-term vision, but rather making a long-term and lasting contribution to the improvement of environmental protection in hosting a mega-sporting event [
10].
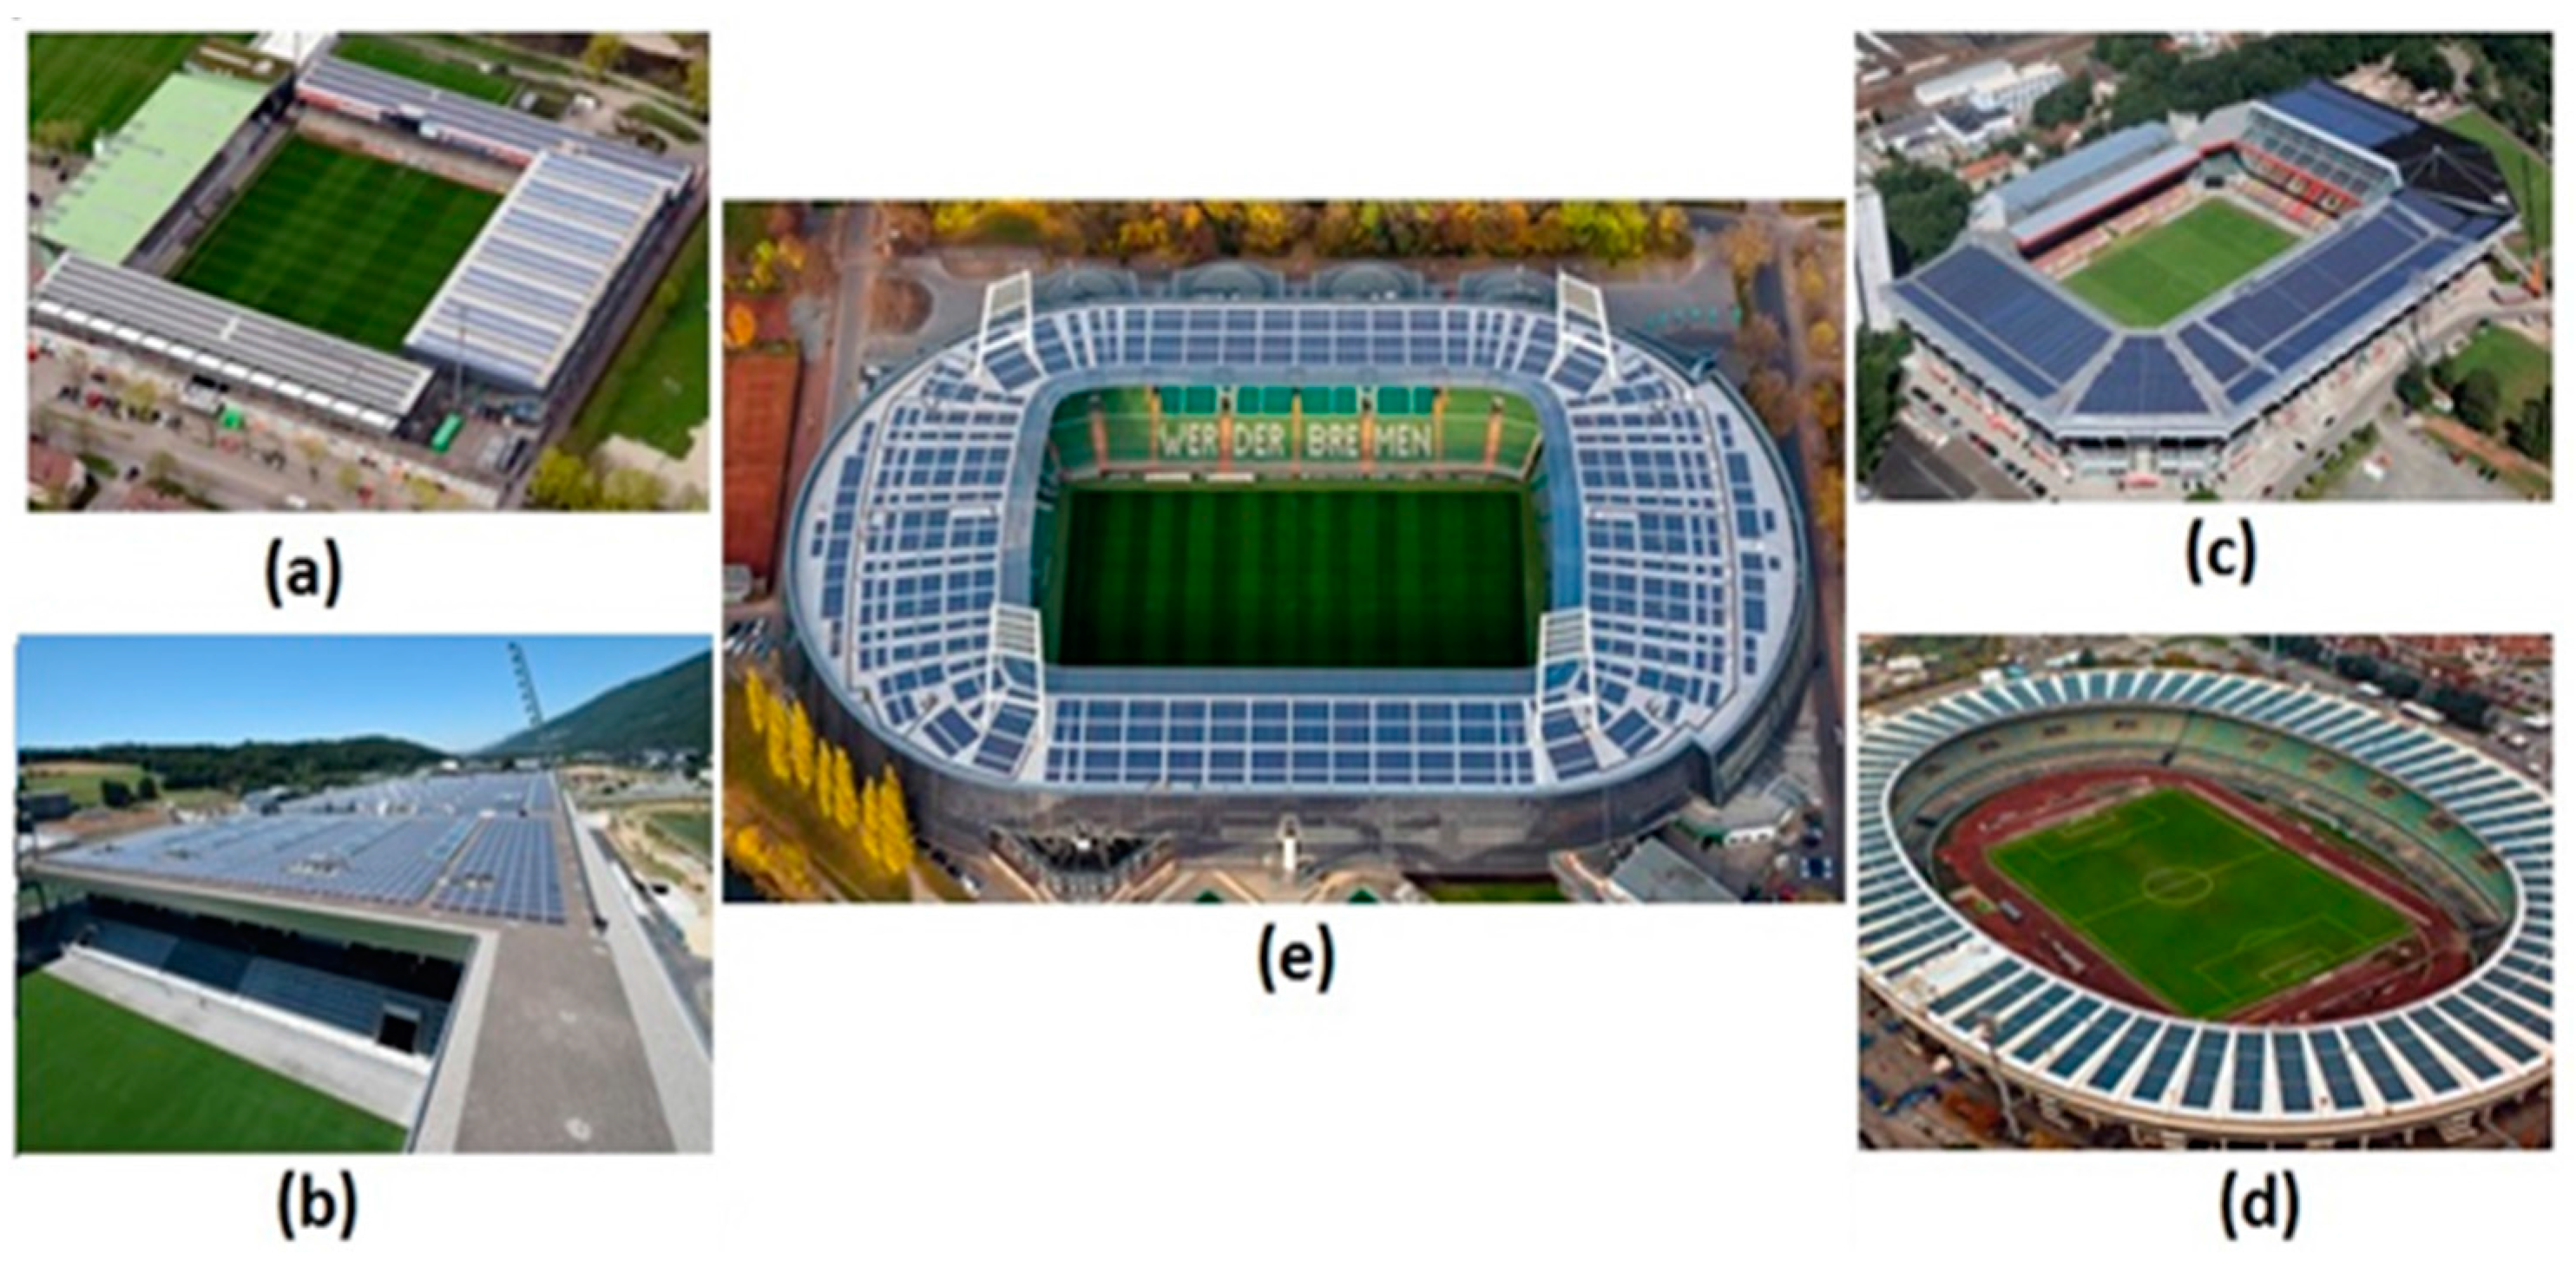
Badenova-Stadio (Mage Solar Stadio) located in Freiburg, Germany, was the first European football stadium to receive a PV system, a 259 kWp power capacity PV generators was installed on its rooftop, in 1995 [
11,
12]. Others examples are: Fritz-Walter-Stadion at Kaiserslautern (1.35 MWp/rooftop) and Bremer Weser-Stadion (1.27 MWp/rooftop) in Bremen, both in Germany; Football Stadium Wankdorf/Stade de Suisse in Bern (1.35 MWp/rooftop) and in Biel city, Tissot Arena (2.11 MWp/rooftop) in Switzerland [
13]; and the Stadio Marc’Antonio Bentegodi stadium, in Verona, Italiy, which became renewable with the commissioning of a 1 MWp solar photovoltaic installation over its dome in 2009 [
5].
Figure 3 illustrates examples of PV systems installed at rooftops in Germany, Italy and Switzerland.
Recently, in South America, Brazil hosted four important international sport events: 2013 FIFA Confederations Cup, 2014 FIFA World Cup, Rio 2016 Summer Olympics and Paralympic Games, thus, an opportunity emerged to solarize some stadiums across the country.
Therefore, the so-called program “Estádios Solares” (stadia solar) [
14], an initiative taken by the Ideal Institute and Federal University of Santa Catarina (UFSC), was meant to install PV power plants in the 2014 FIFA World Cup stadiums. It was the chance to retrofit solar PV onto rooftops of existing stadia, and at the same time, deploy a few systems onto newly constructed ones.
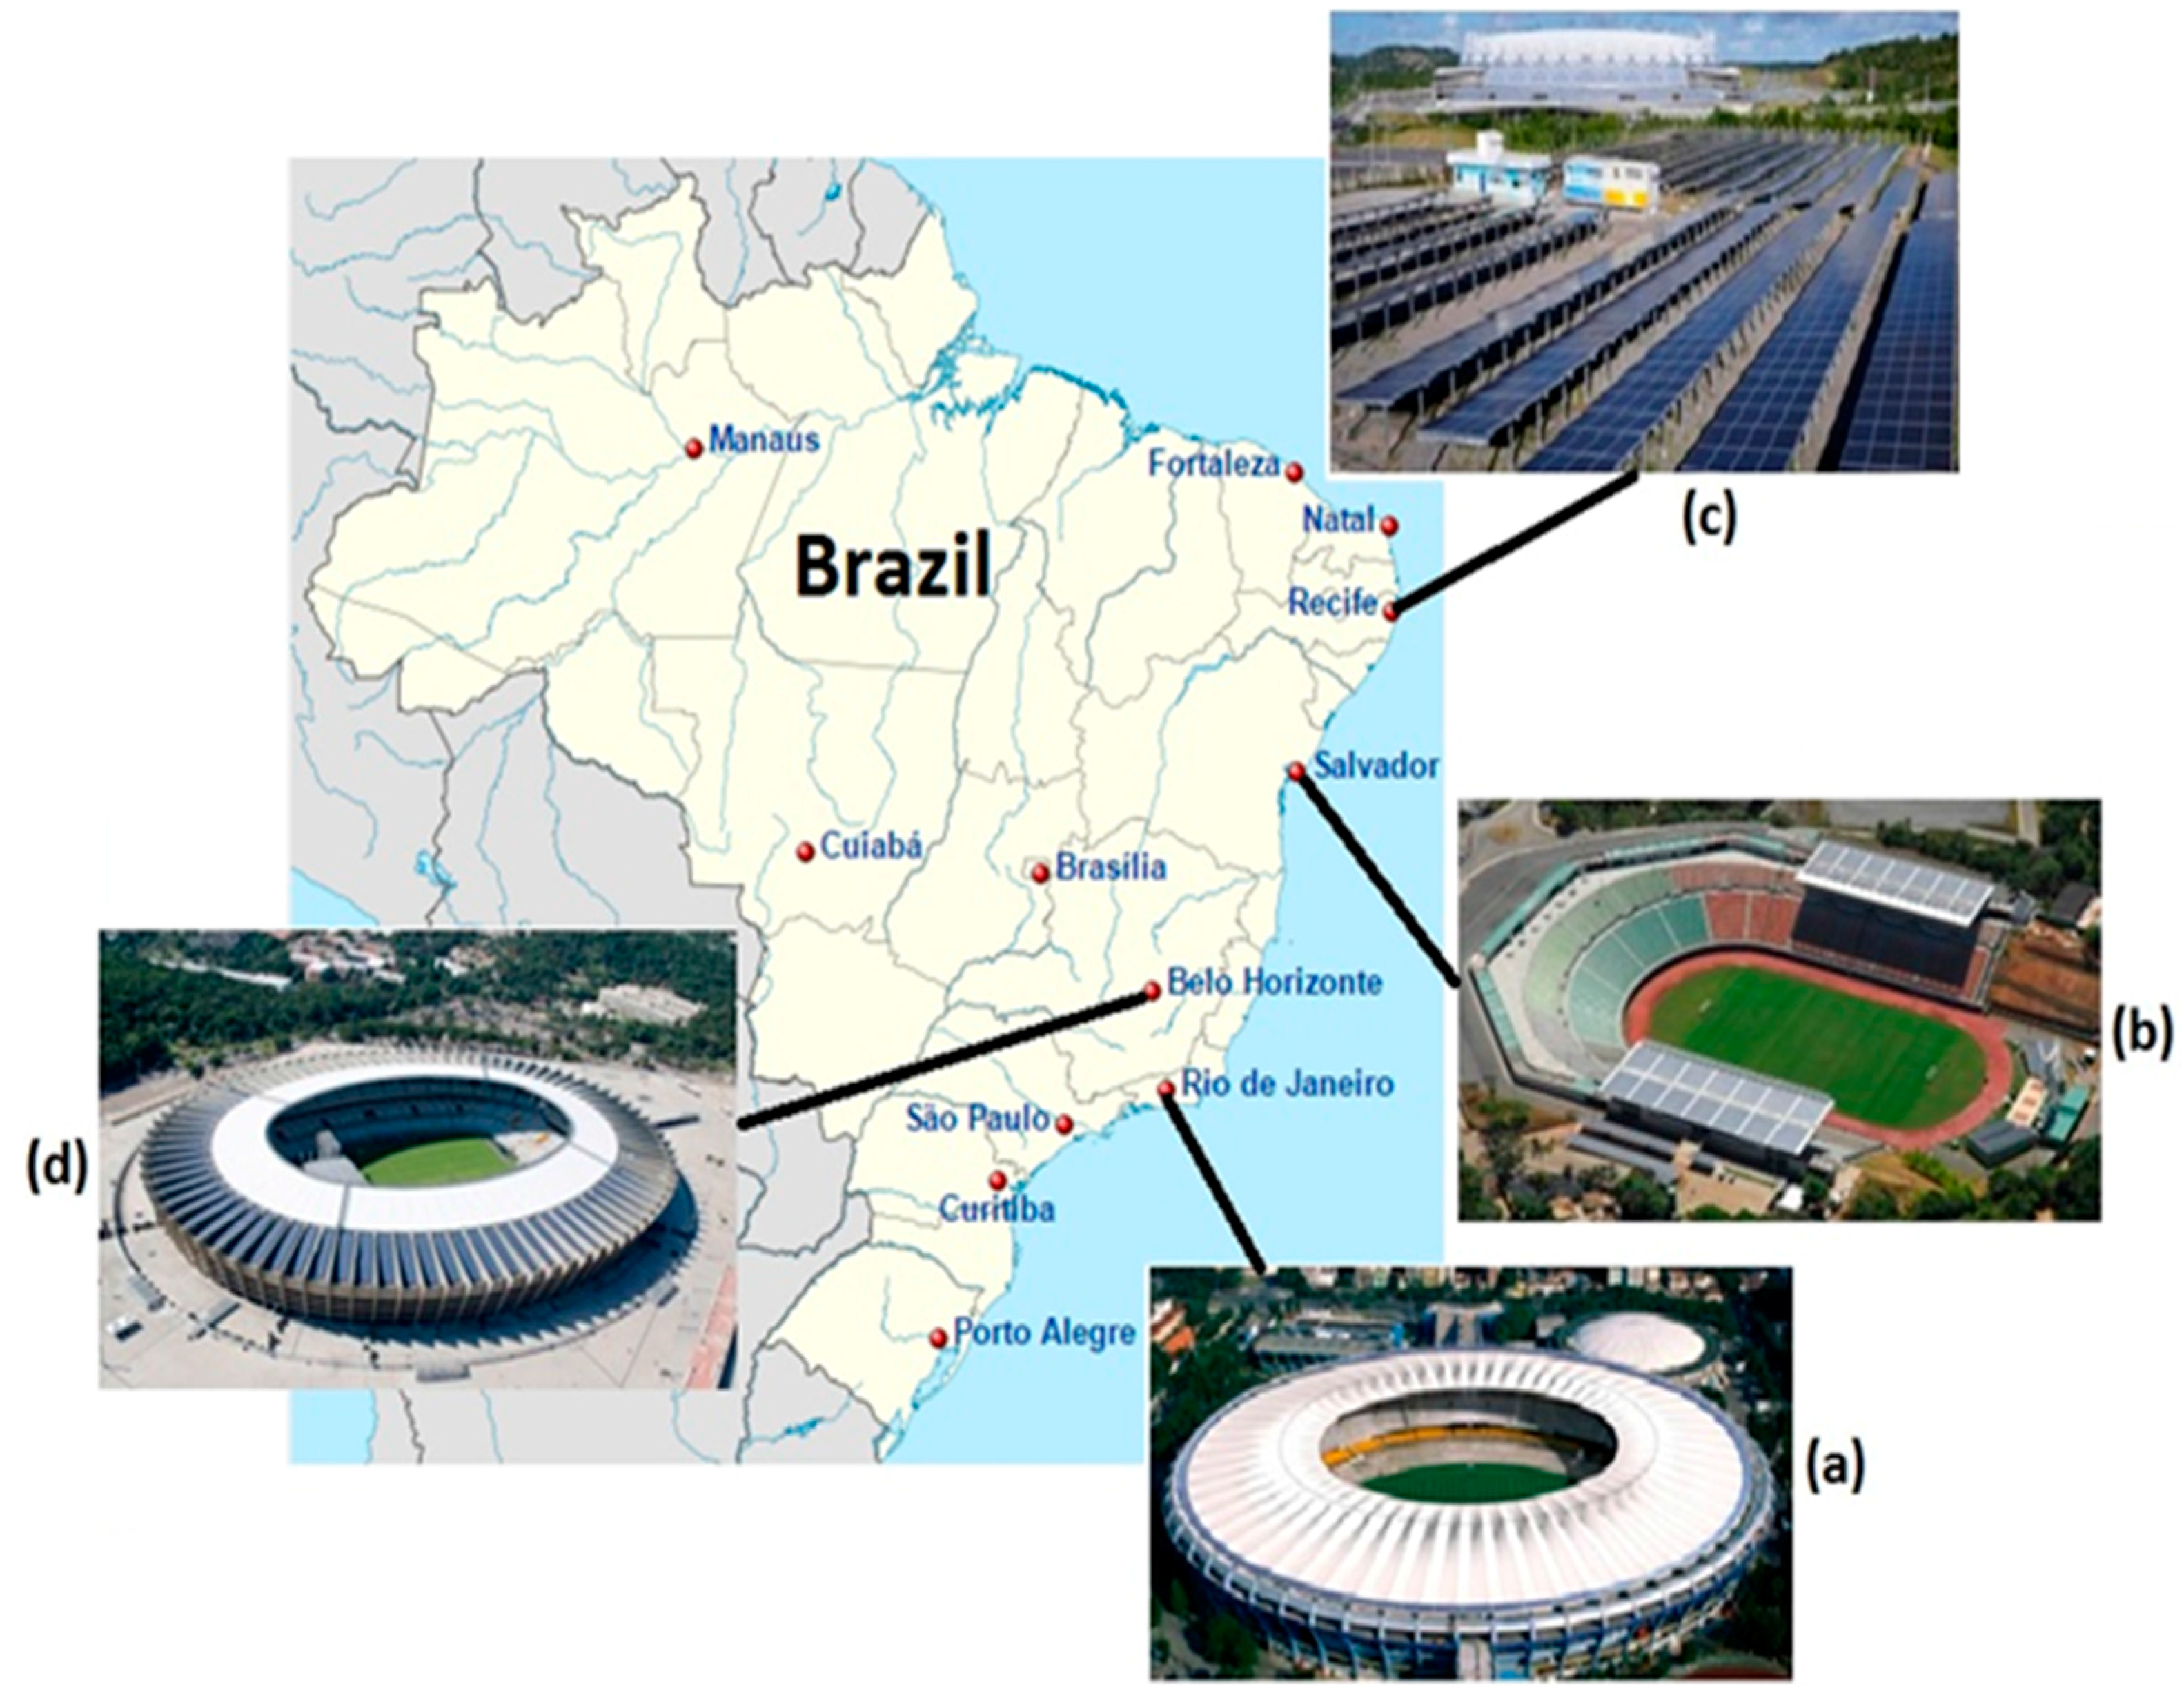
In Brazilian’s Southeast region, two stadiums had PV systems installed. One of them, Jornalista Mário Filho Stadium (Maracanã), located in Rio de Janeiro city, received a 390 kWp PV power system at its rooftop. In Belo Horizonte city, capital of Minas Gerais State, a 1.42 MWp PV power plant was installed at the Mineirão Stadium, also on the rooftop.
In Northeast region of Brazil, Pernambuco Arena in Recife/Pernambuco State has a 1 MWp ground mounted PV system installed. Brazilian 2014 World Cup did not utilize Pituaçu Stadium located at Salvador city in Bahia State, although this stadium was the first stadium in Latin America to receive a 403 kWp rooftop PV system. During this international sport event, the Pituaçu Stadium served only as an official training field.
Figure 4 shows the four stadiums that received PV systems in Brazil.
Despite these facilities, there are not many publications that disseminate the operating results associated with Brazilian solar stadiums, and, to help change this, this paper presents a one-year (October of 2014 to September of 2015) monitoring of electrical parameters (at AC side) and the characterization of local solar radiation for a PV Power Plant installed at the rooftop of Mineirão Football Stadium. First, Mineirão Football Stadium and its rooftop PV solar power plant are presented. In sequence, the used methods are presented and the main results of the solar resource characterization and monitoring of PV power plant are analyzed and discussed. Finally, final comments are presented.
2. Mineirão Football Stadium
Mineirão stadium, officially named Estádio Governador Magalhães Pinto, was opened in 1965. The football arena is part of Pampulha architectural complex (UNESCO’s World Cultural Heritage), designed by Oscar Niemeyer (Brazilian architect who is considered one of the key figures in the development of modern architecture) and located (geographic coordinates: 19°51′57″ S 43°58′15″ W) in the North region of capital Belo Horizonte (Minas Gerais State). The stadium is also a Cultural Heritage of Belo Horizonte city. Therefore, Mineirão is one of Brazil’s most famous football stadiums.
The stadium had capacity for 130,000 spectators and used it until the 1990s when maximum capacity decreased to 75,000 spectators. When Brazil won their bid to host the 2014 World Cup, Mineirão had a large redevelopment. The project included a complete reconstruction of bottom tier, an extension of roof, and further refurbishments to upgrade the stadium to FIFA standards and achieve the green goals commitments. Therefore, capacity decreased to 58,259 spectators for comfort and safety reasons.
After redevelopment, in 2014, Mineirão became the first stadium in Brazil, second in the World, to receive the LEED Platinum Sustainability Certification (Leadership in Energy and Environmental Design, the highest level of the seal) granted by the U.S. Green Building Council (USGBC) due to management of resources (energy, water, etc.) performed by the building.
In 2013 Confederations Cup, the stadium hosted three matches (including one semi-final); it hosted six matches (including one semi-final) in 2014 FIFA World Cup; and during Rio 2016 Summer Olympics Games, it hosted six group games, two quarter-finals, a women’s semi-final and the men’s third-place play-off.
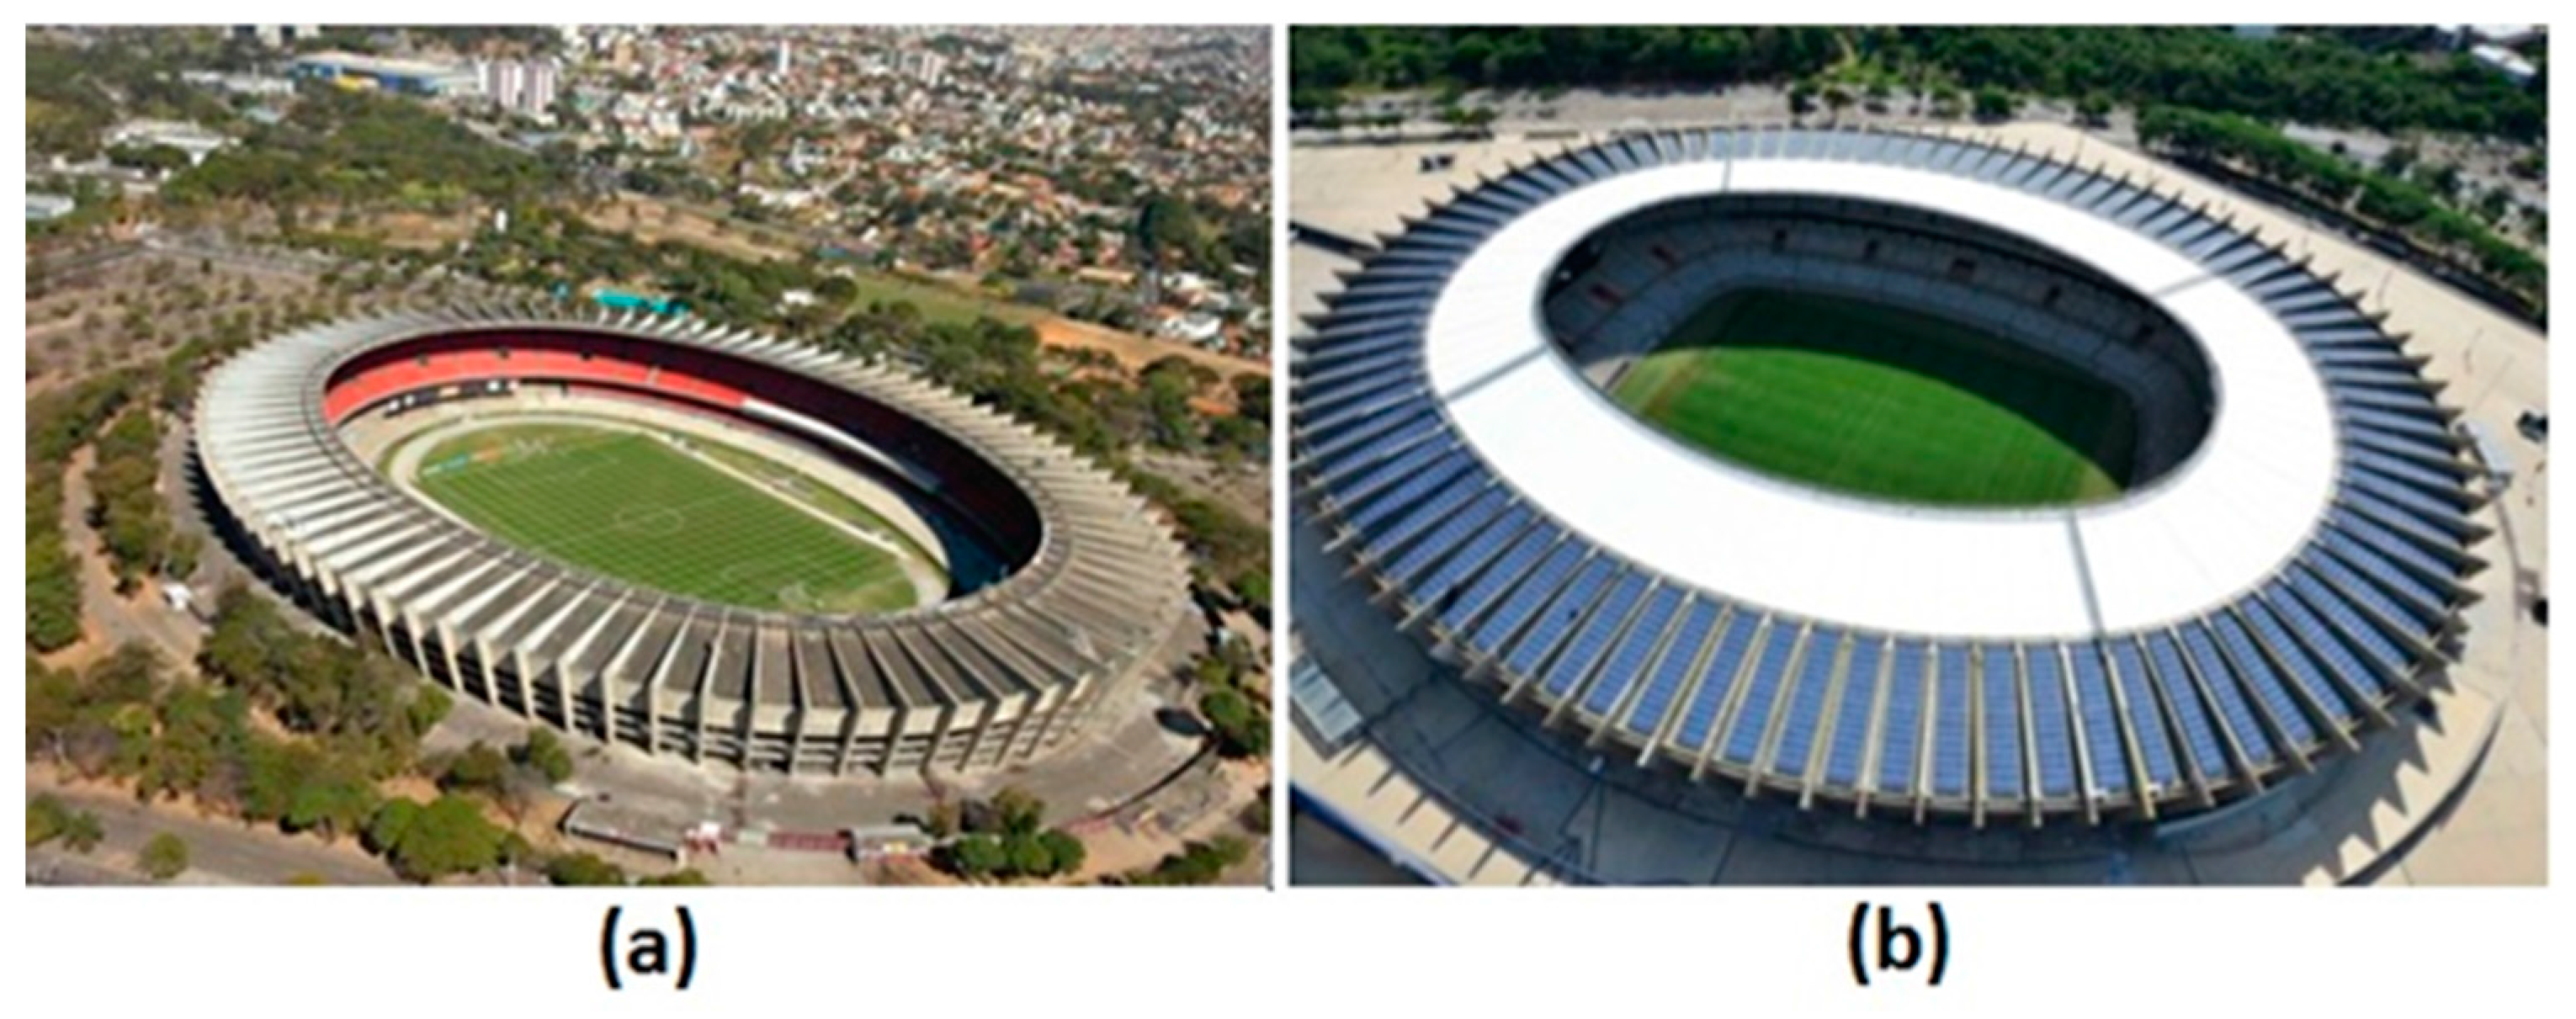
Figure 5 illustrates an aerial view of the stadium (
Figure 5a) before its modification (
Figure 5b) after its modification for the World Cup.
As one can see,
Figure 5b shows a PV system on the rooftop of the stadium received as part of its modernization efforts. The solar power plant is a partnership between German Technical Cooperation Agency (GTZ), the local utility company (Companhia Energética de Minas Gerais (CEMIG)) and the dealership Minas Arena. It was partially financed by KfW Development Bank, from Germany, and local state government through CEMIG. This PV system is the biggest rooftop PV installation in football stadium in Brazil and presents challenging conditions in order to achieve an optimal system performance, as described in next sections.
3. Solar Resource Characterization—Method, Results and Discussion
PV systems performance is strongly dependent on weather conditions [
17,
18,
19,
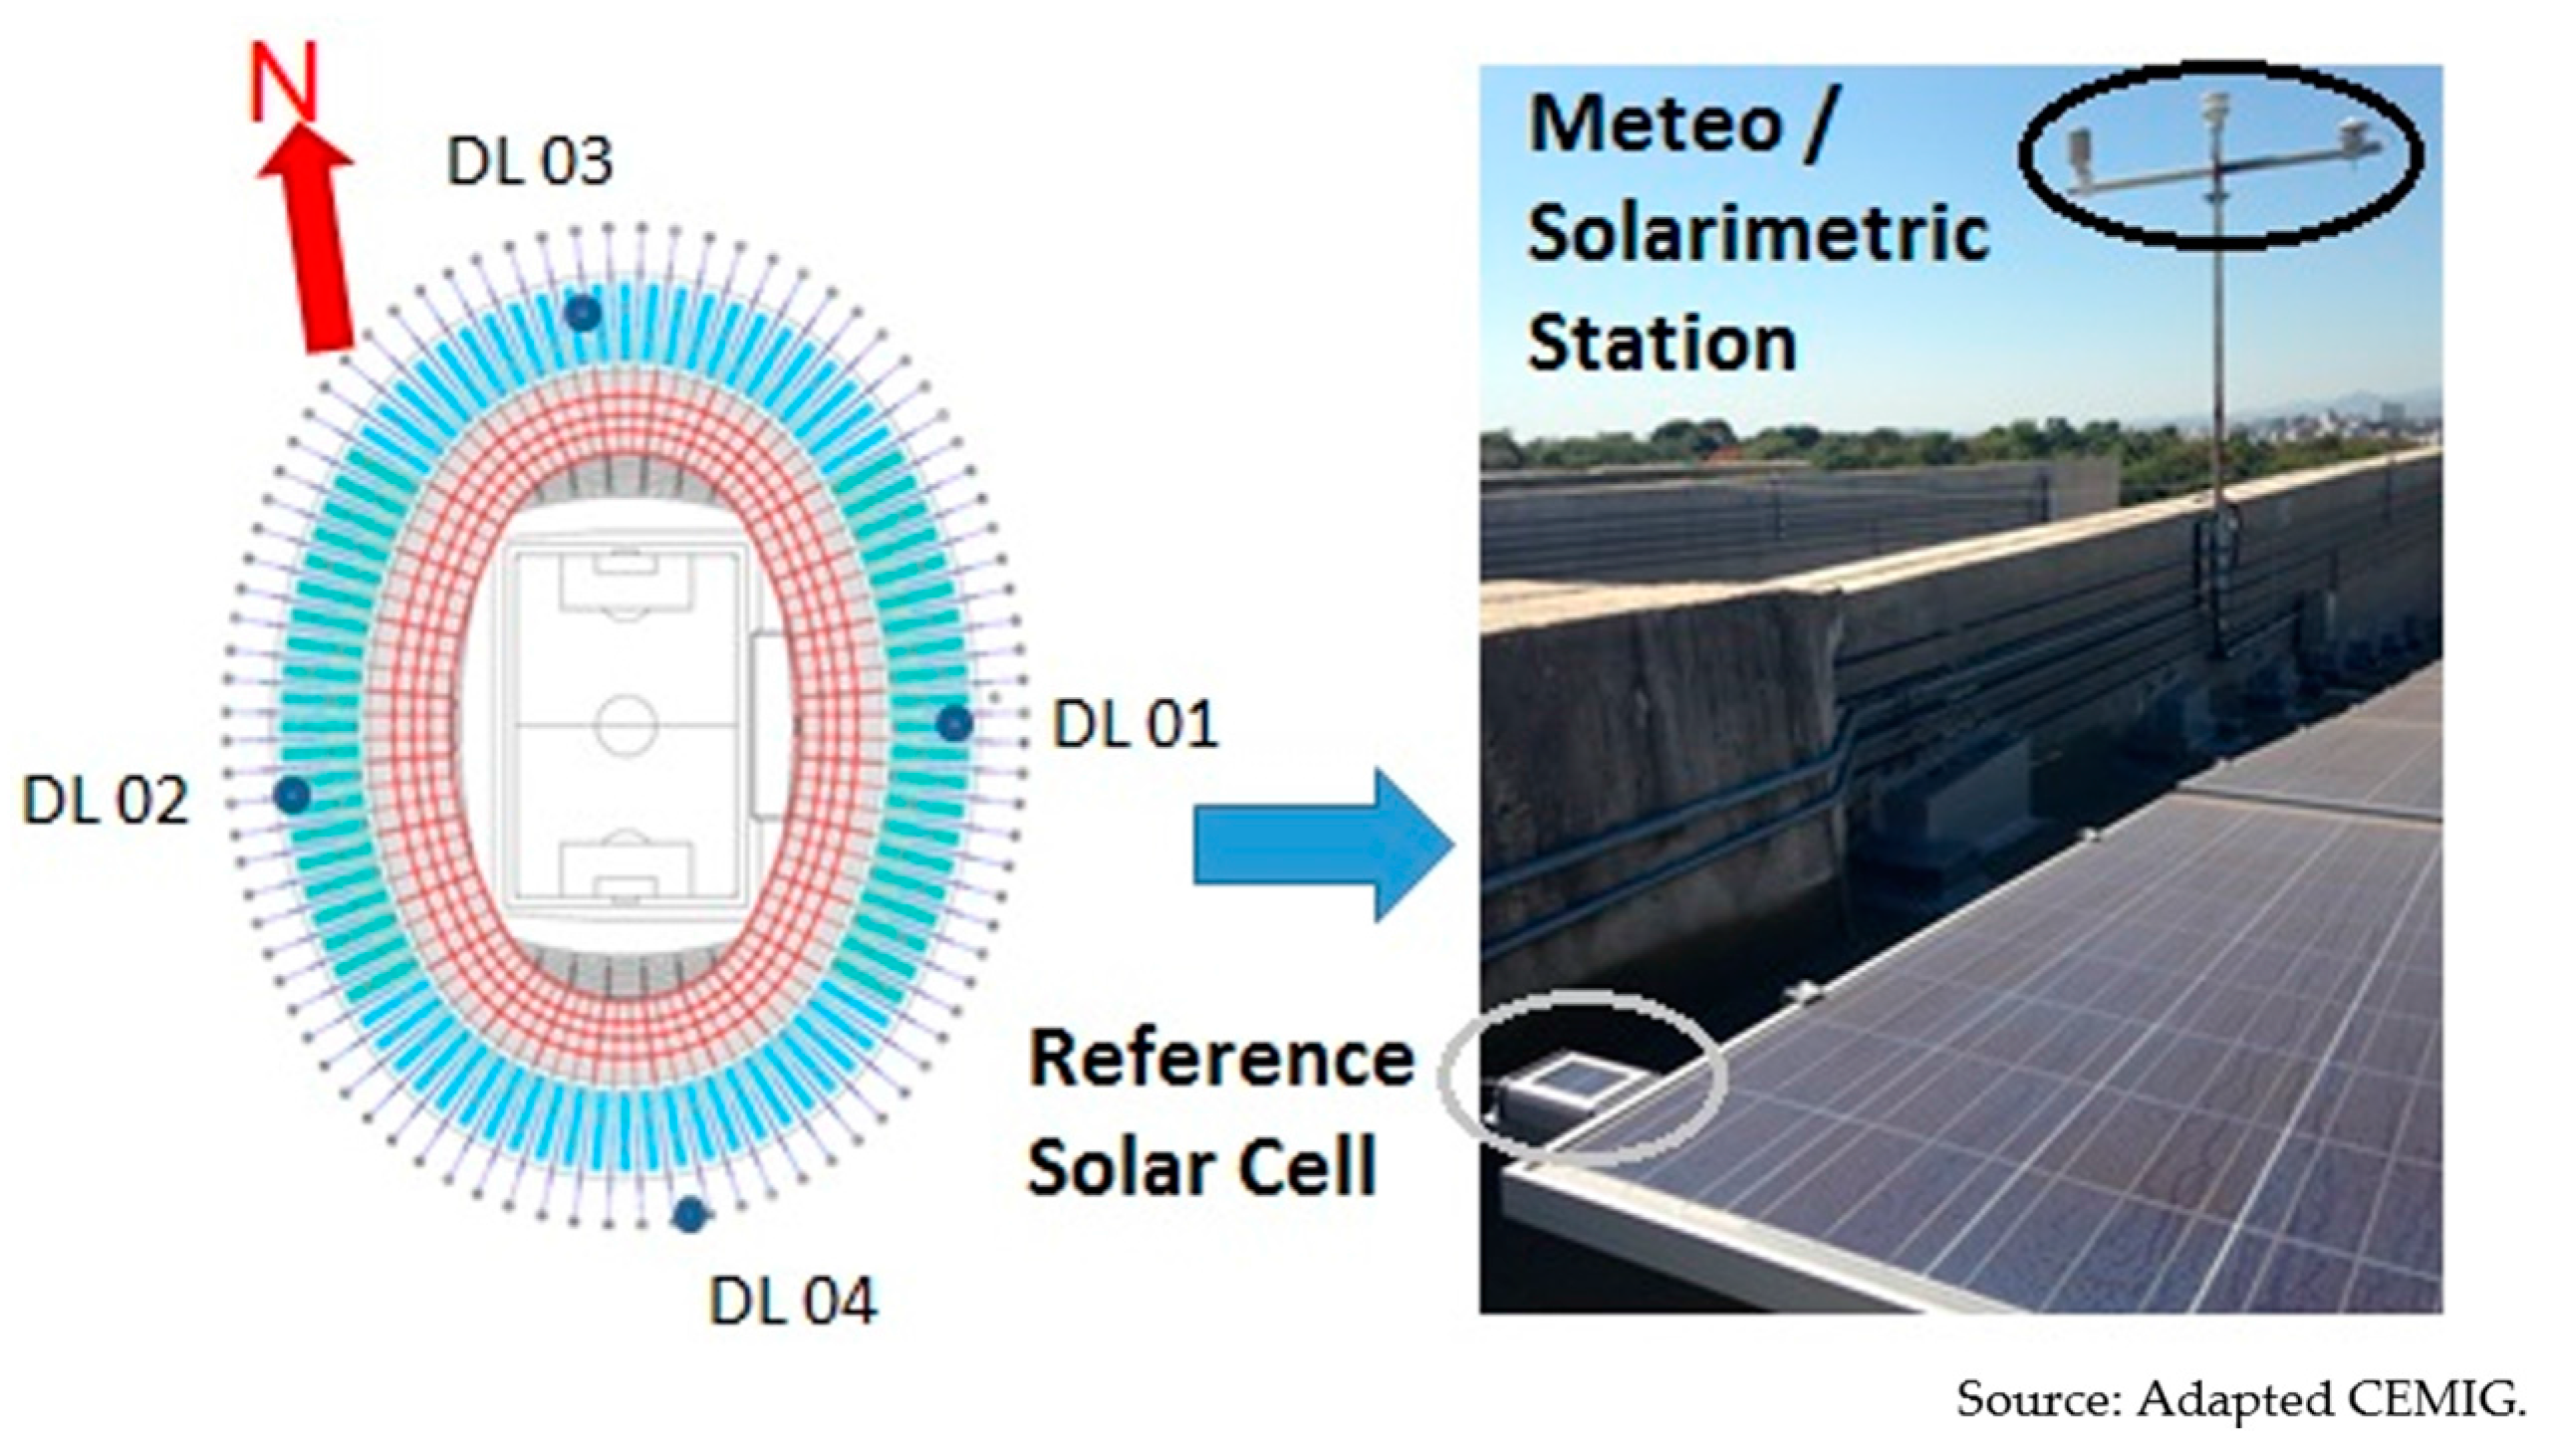
20]. Therefore, for the PV system at rooftop of Mineirão Football Stadium, four meteorological/solarimetric stations that measure global irradiance in horizontal plane (GHI) using a Kipp & Zonen pyranometers model CMP 21; ambient temperature/humidity using a PT-100 and humidity sensors; and wind speed/direction using ultrasonic anemometers Lufft, model 200A were installed. Furthermore, four crystalline silicon reference solar cells are also installed in the plane of arrays (POA). Stations and sensors (denominated as DL01-DL04) are located on the north, south, east and west of the stadium as shown in
Figure 9.
All data from sensor are collected by a programmable logic controller (PLC) and are supervised by a SCADA system that scans/integrates parameters every 15 min.
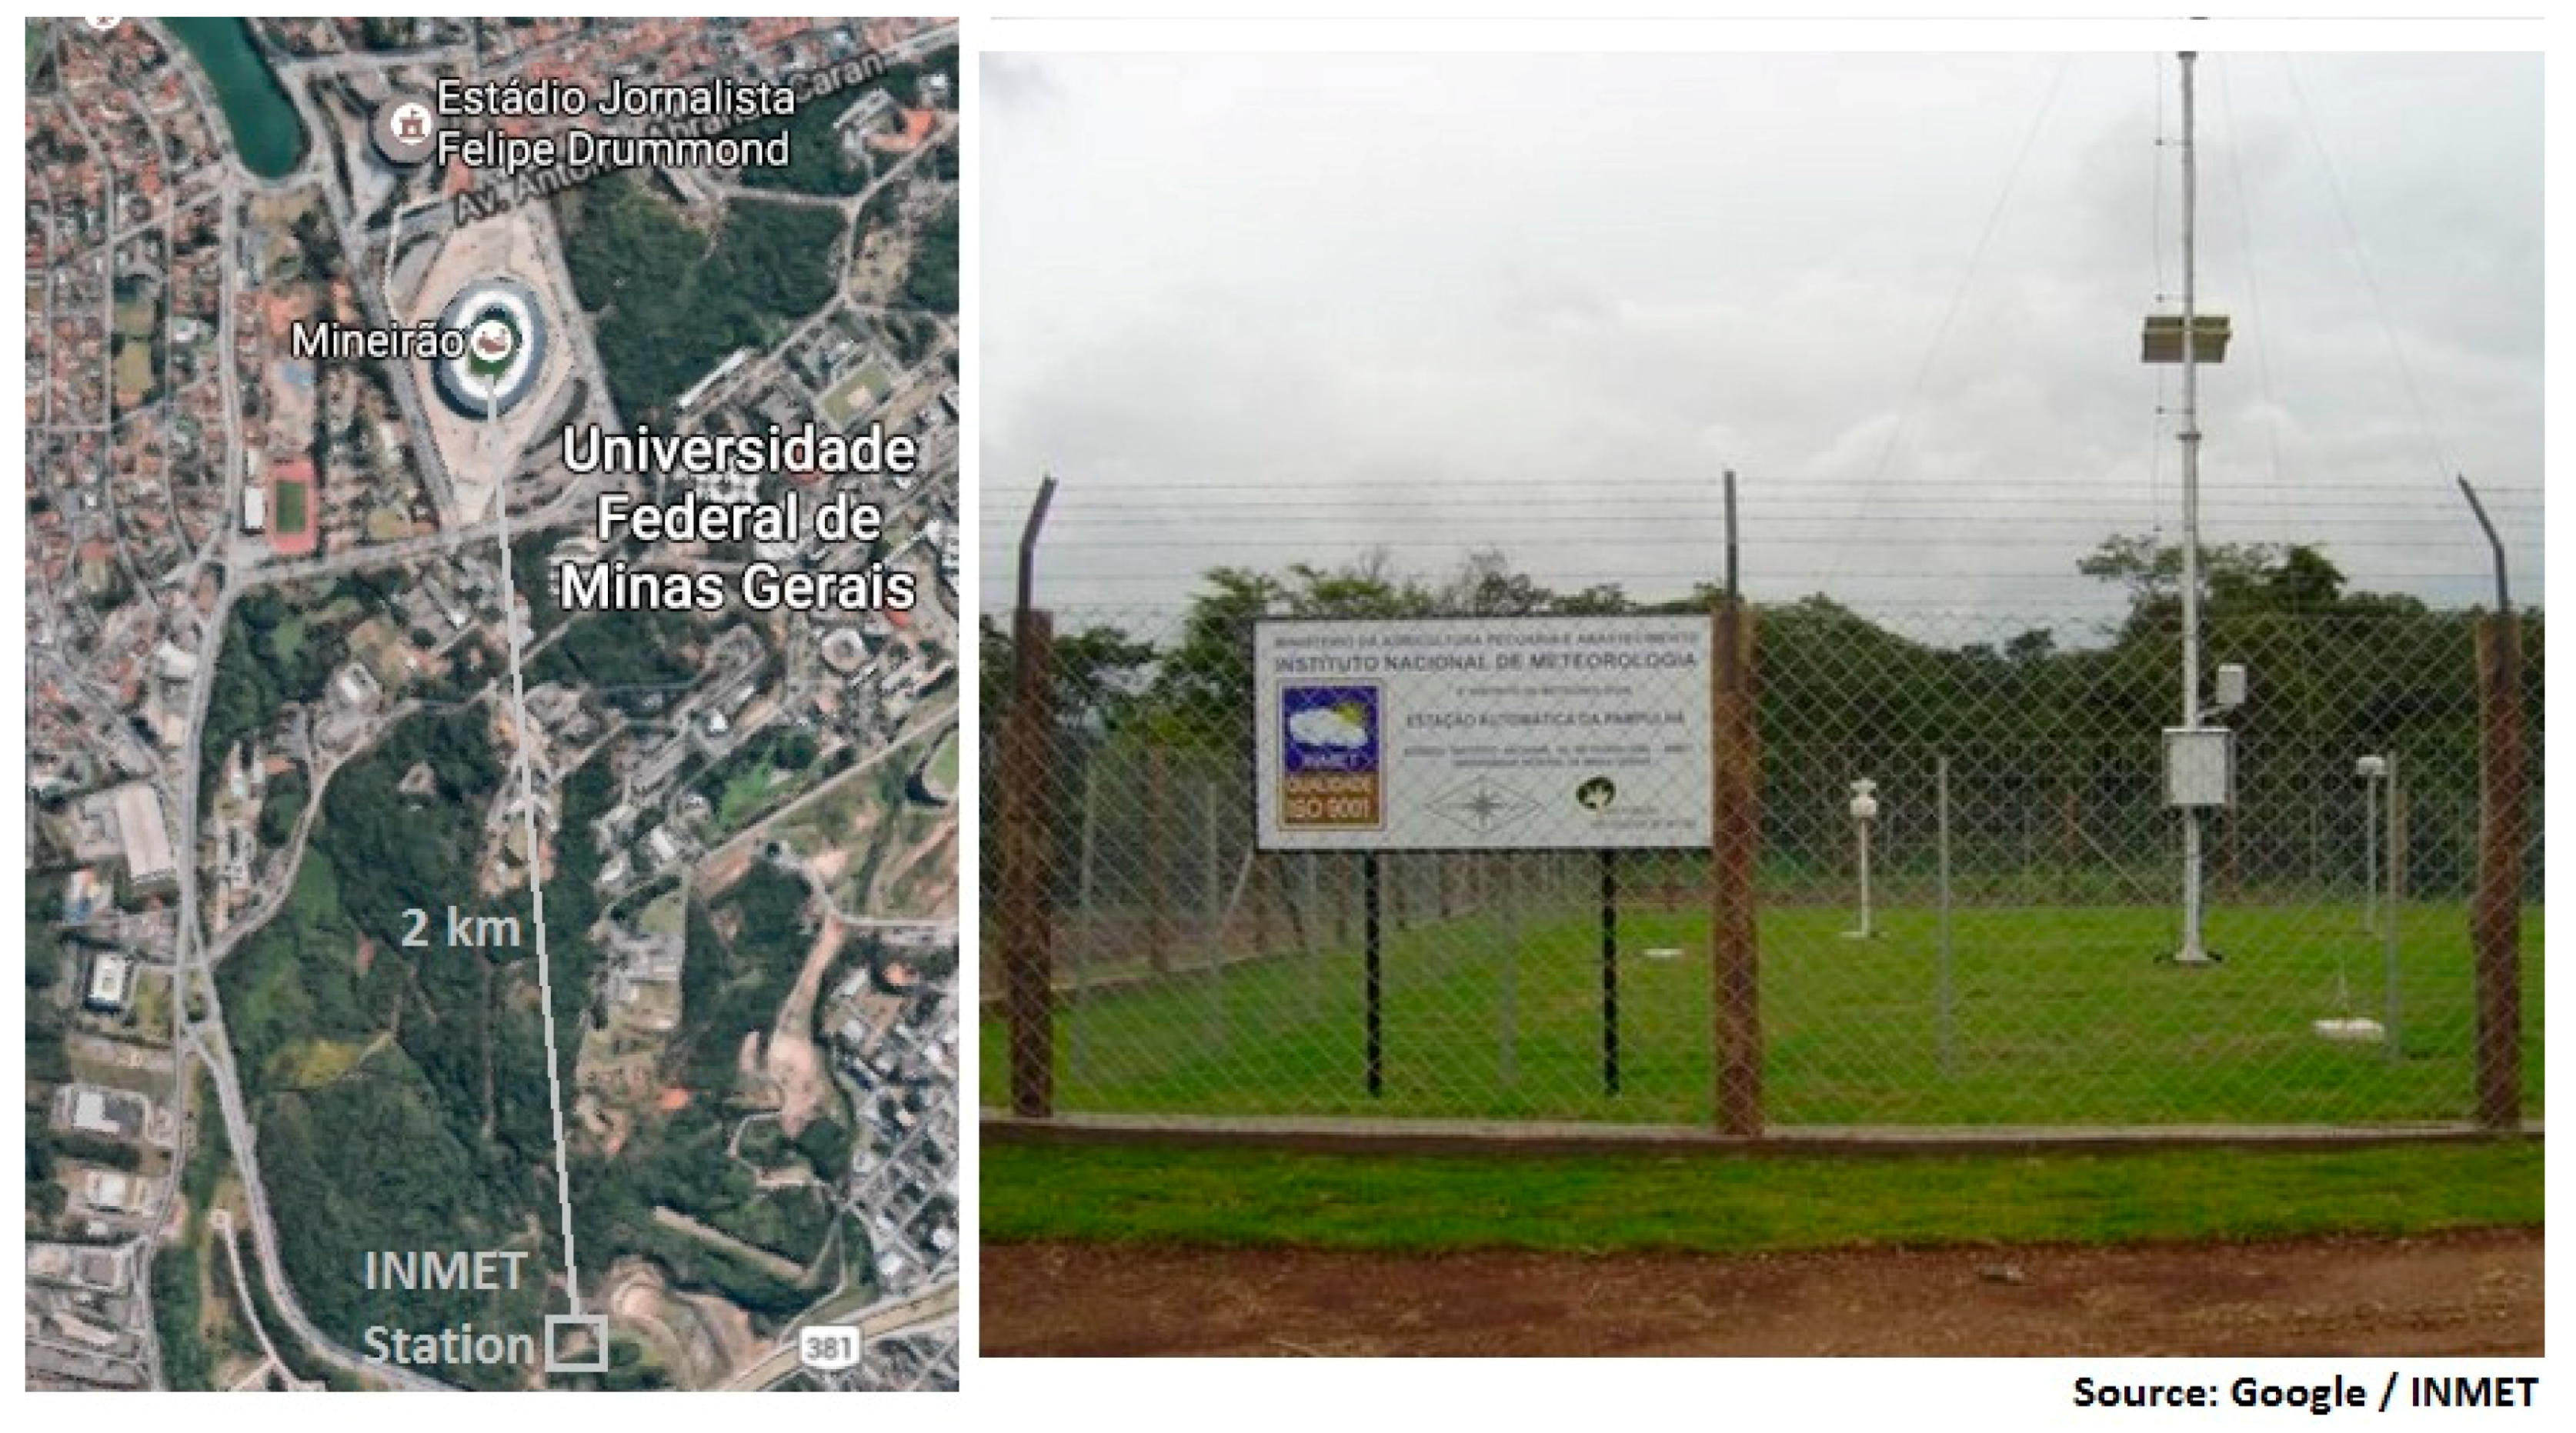
To validate irradiation data from Mineirão’s stations and sensors, nine years of historic GHI hourly data (2007–2015) were used. Hourly data were measured by a Kipp & Zonen pyranometer model CMP 21 from meteorological/solarimetric station of National Institute of Meteorology (INMET). This station is located at the Federal University of Minas Gerais (UFMG) campus and it is just 2 km away from Mineirão PV Plant.
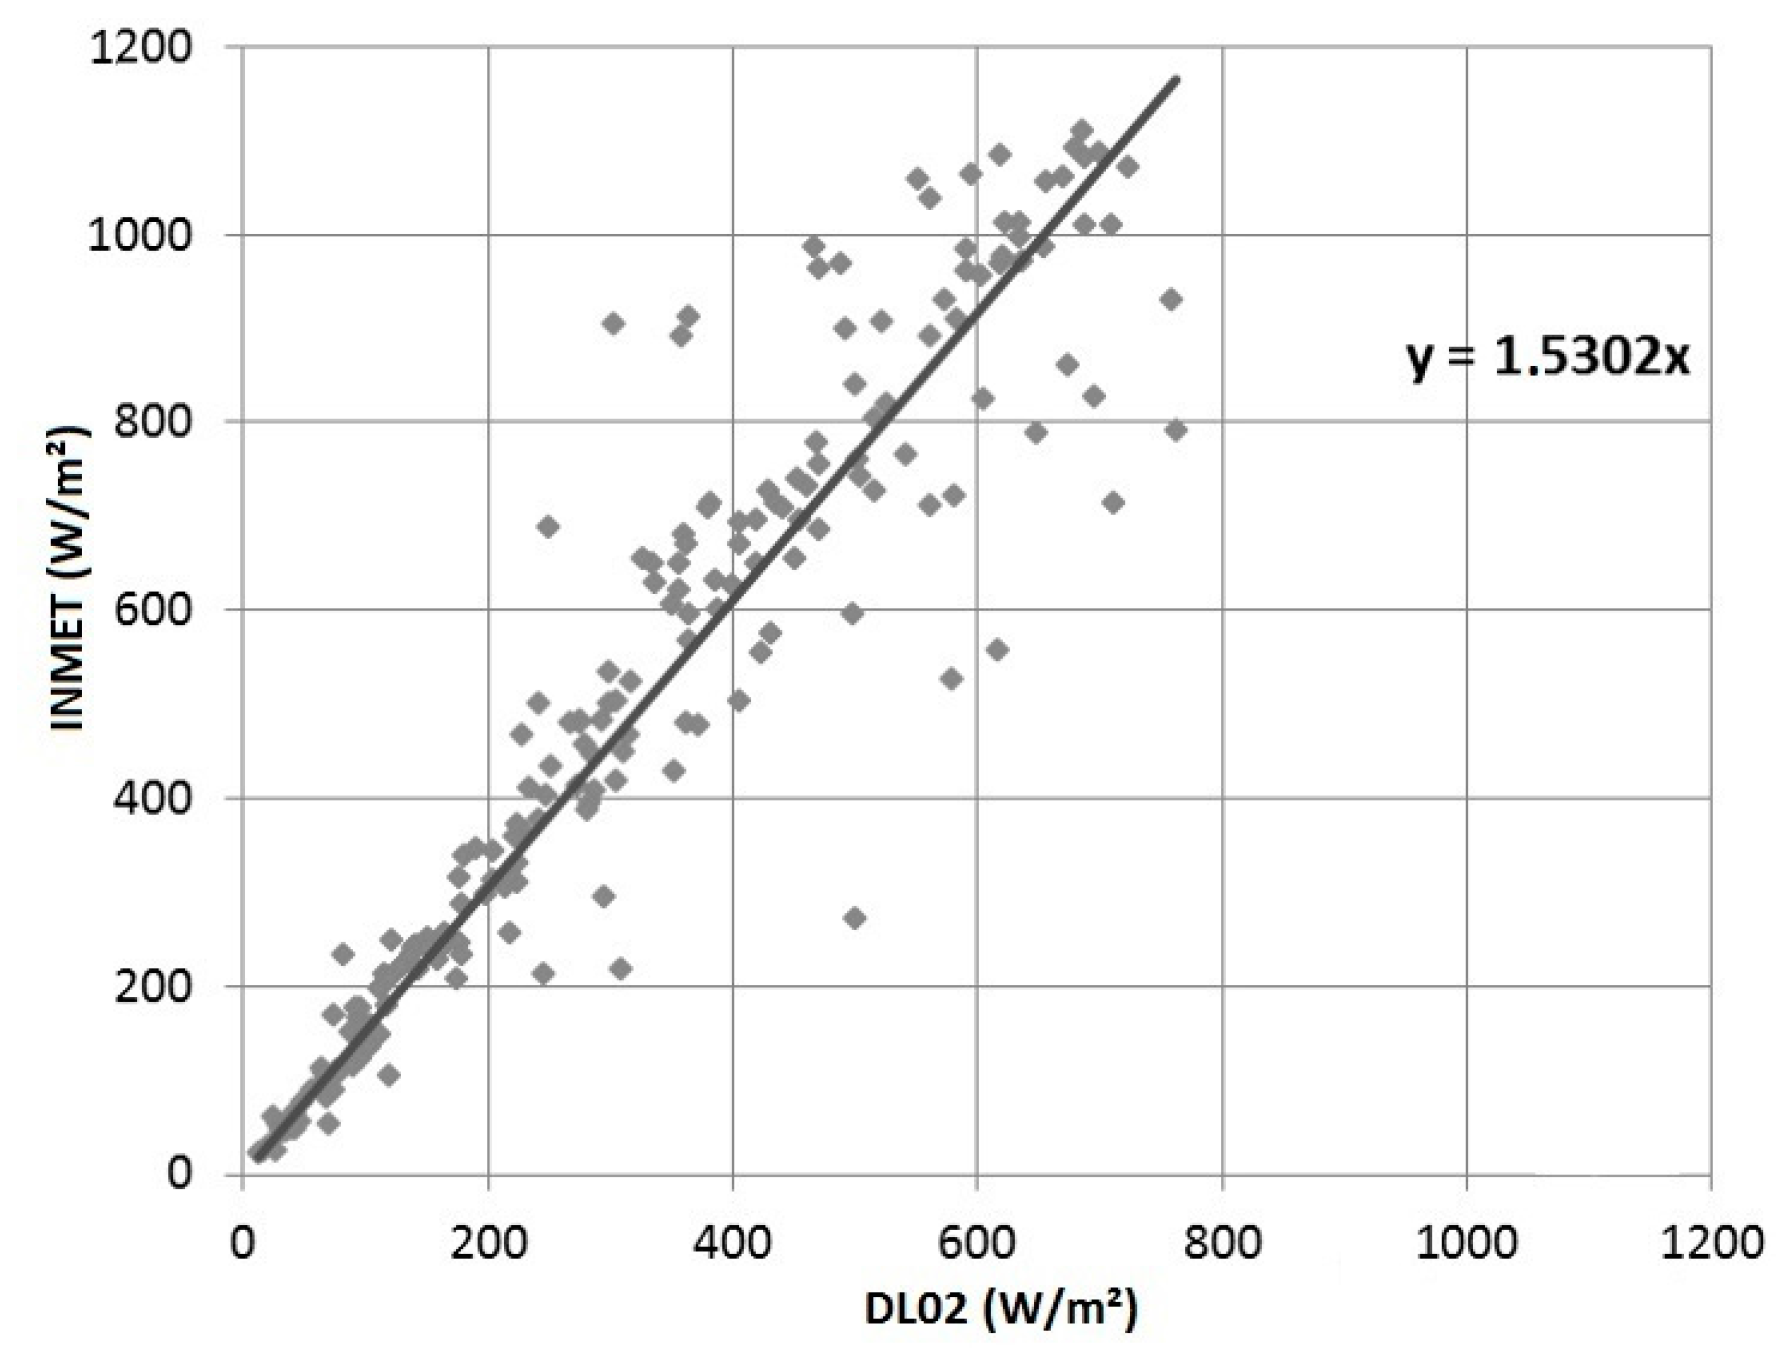
Figure 10 shows INMET meteorological/solar station at UFMG campus while
Figure 11 presents a GHI correlation from a set of data (May to November of 2014) between INMET station and DL02 stadium station.
Figure 11 shows that GHI data from INMET station have good correlation for the entire irradiance range to data from DL02 station, with a correlation factor of 1.53. Since the data from INMET station have a broader time range (historic GHI data), this dataset was chosen for the subsequent analysis to analyze the variation that occurs over time providing a better understanding on the characteristic profile of the solar energy resource in the region where Mineirão PV power plant is installed.
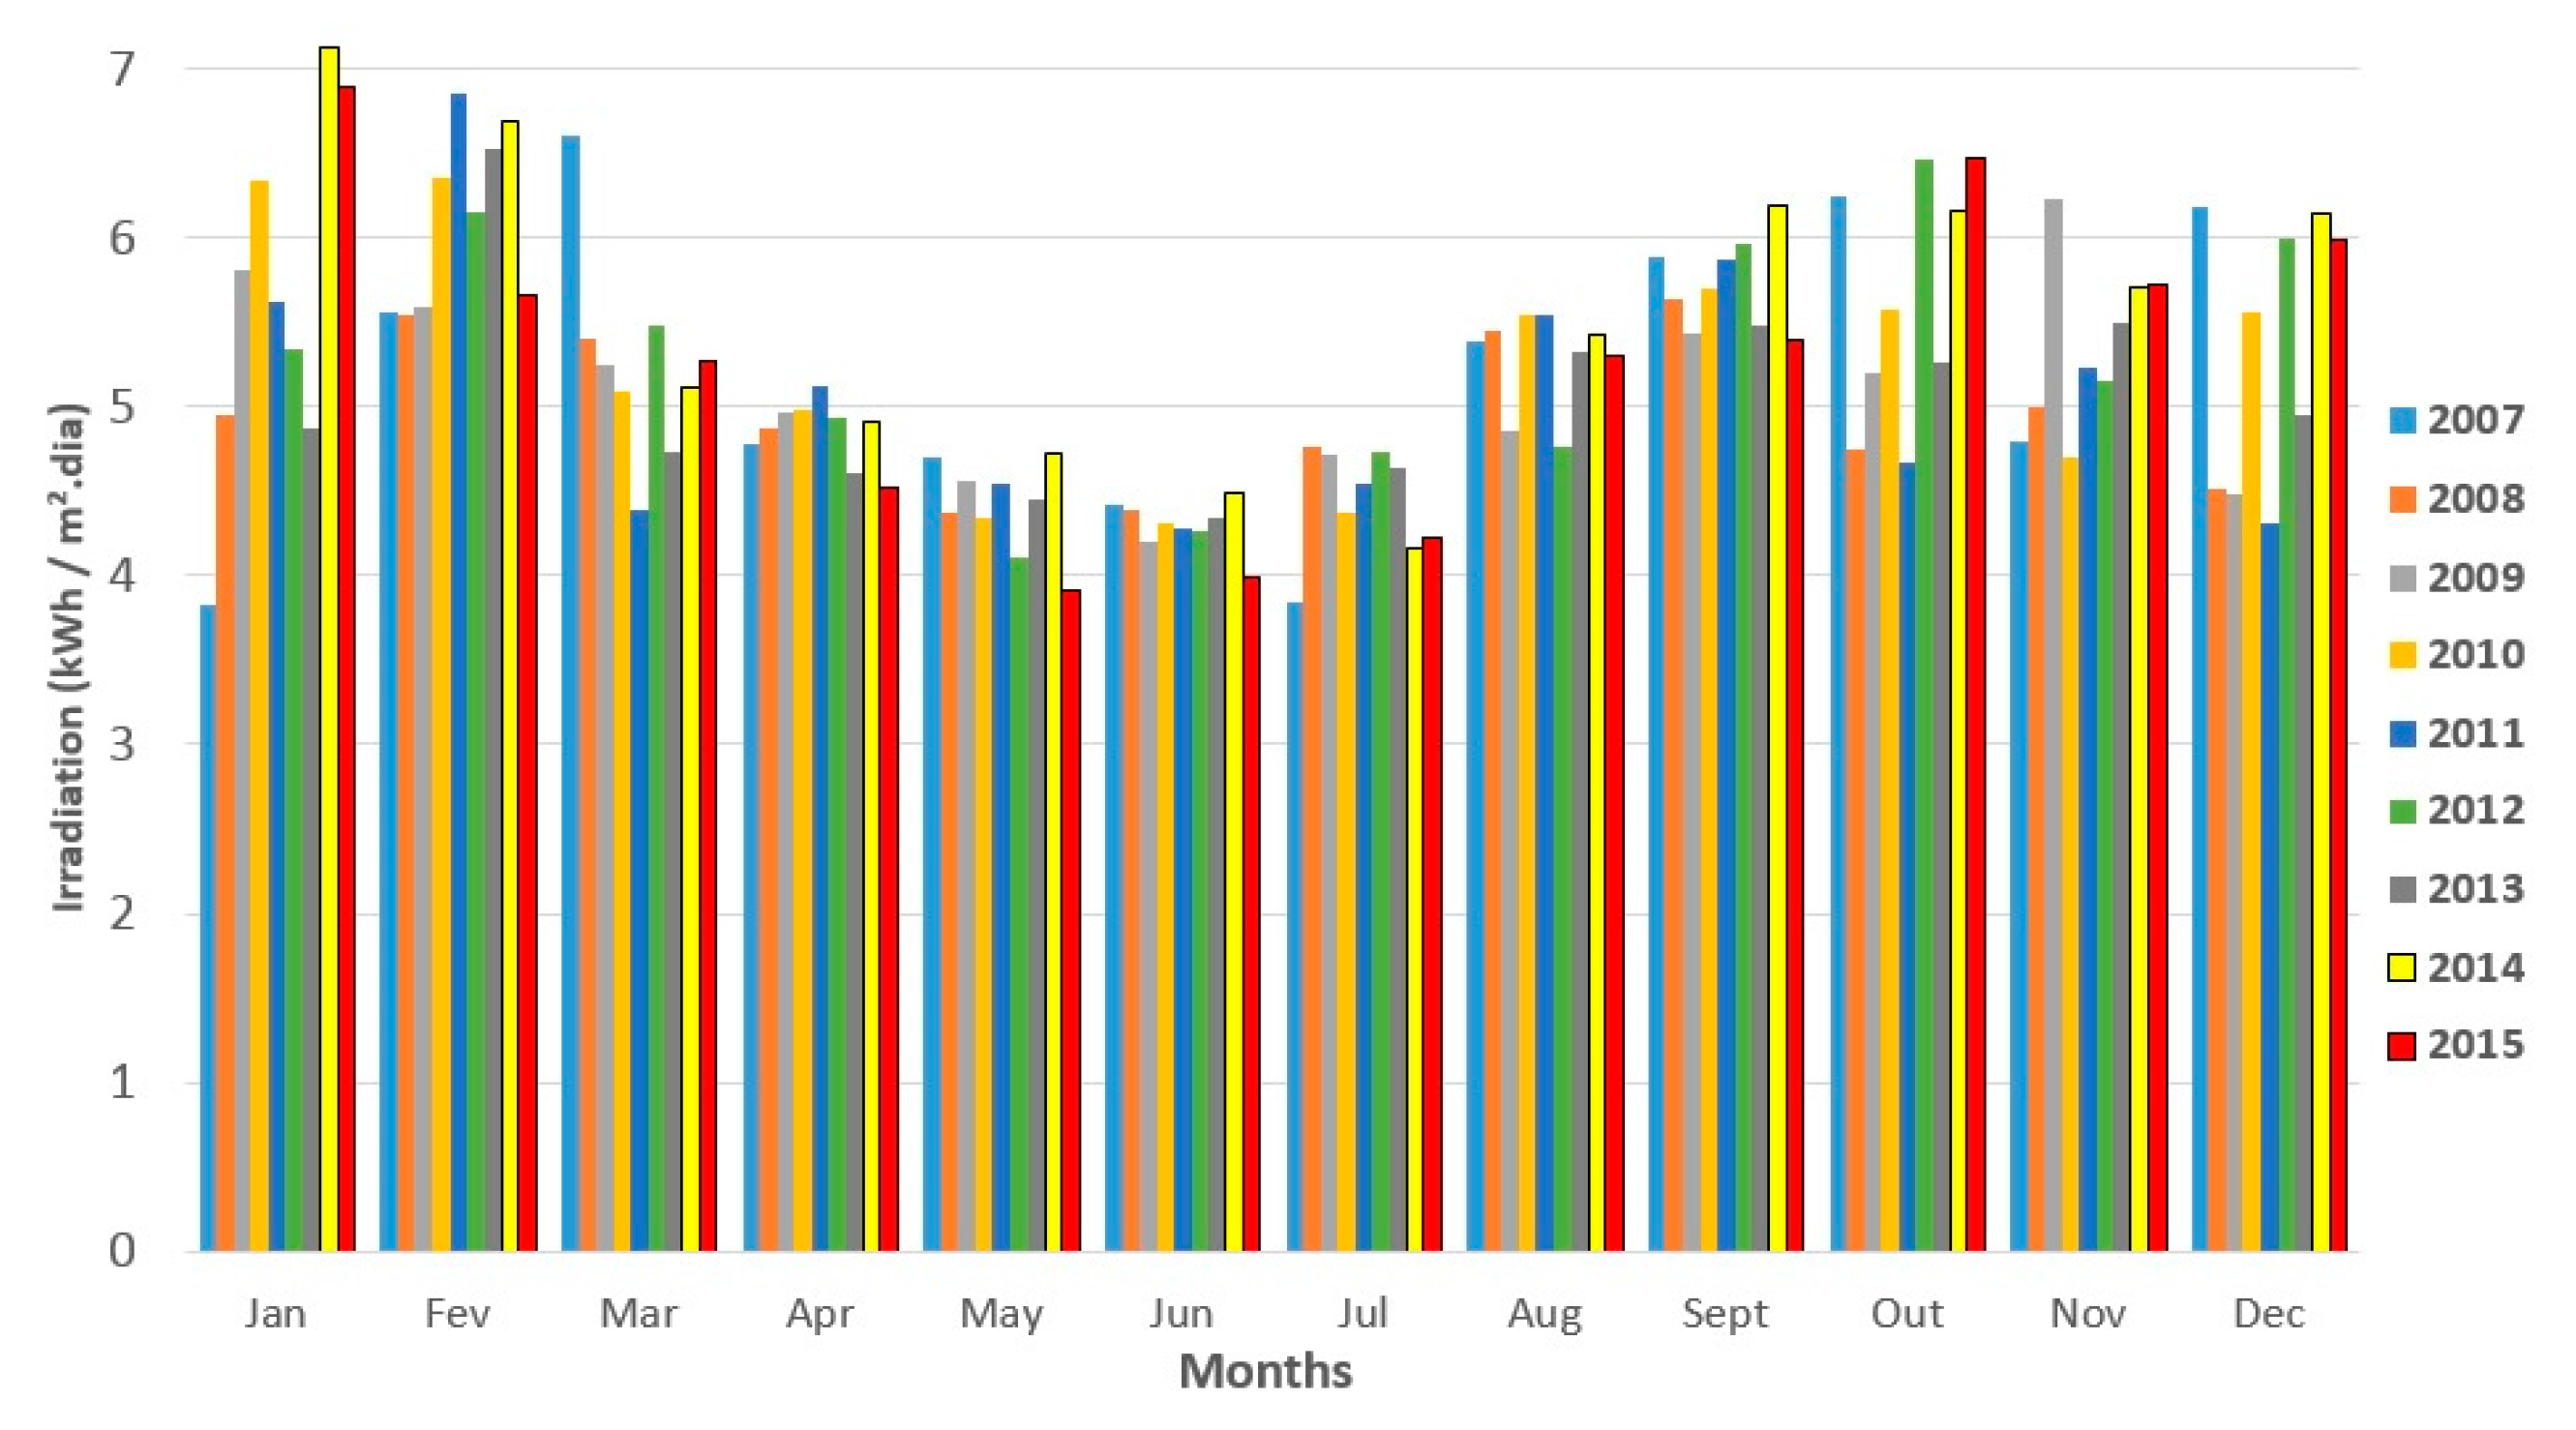
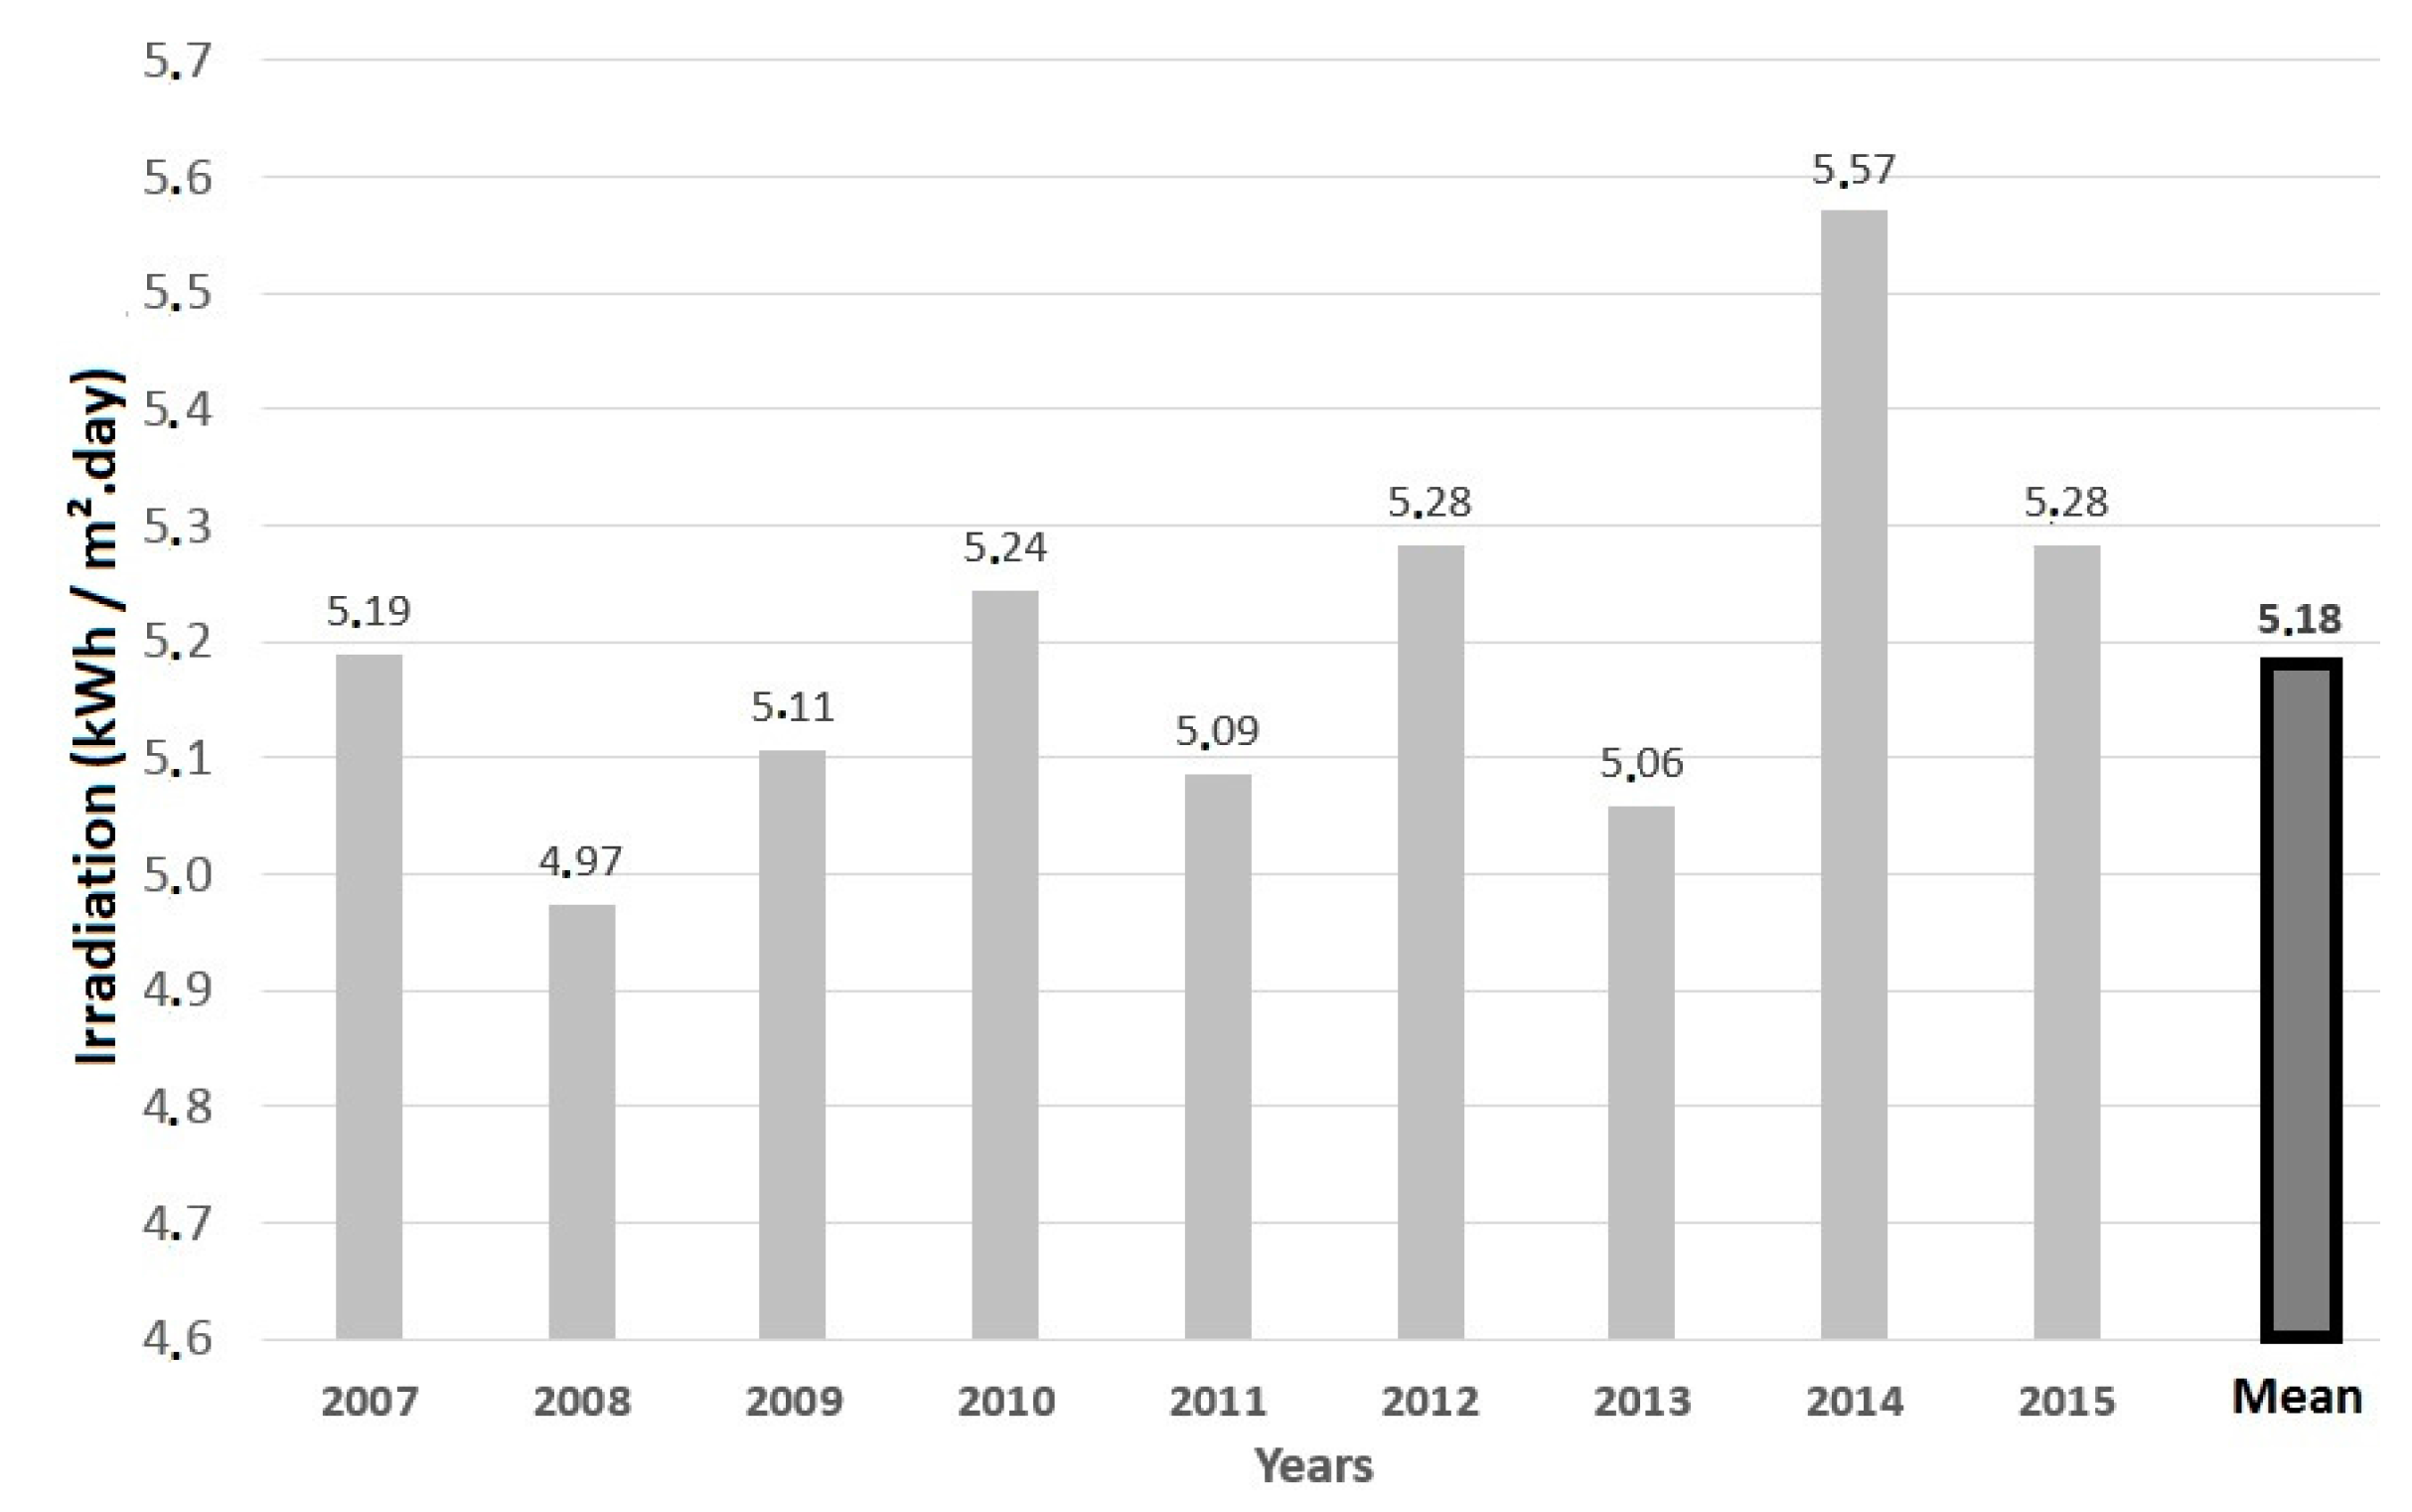
Figure 12 shows monthly average of daily horizontal global solar irradiation (by year) and
Figure 13 shows annual average of daily horizontal global solar irradiation.
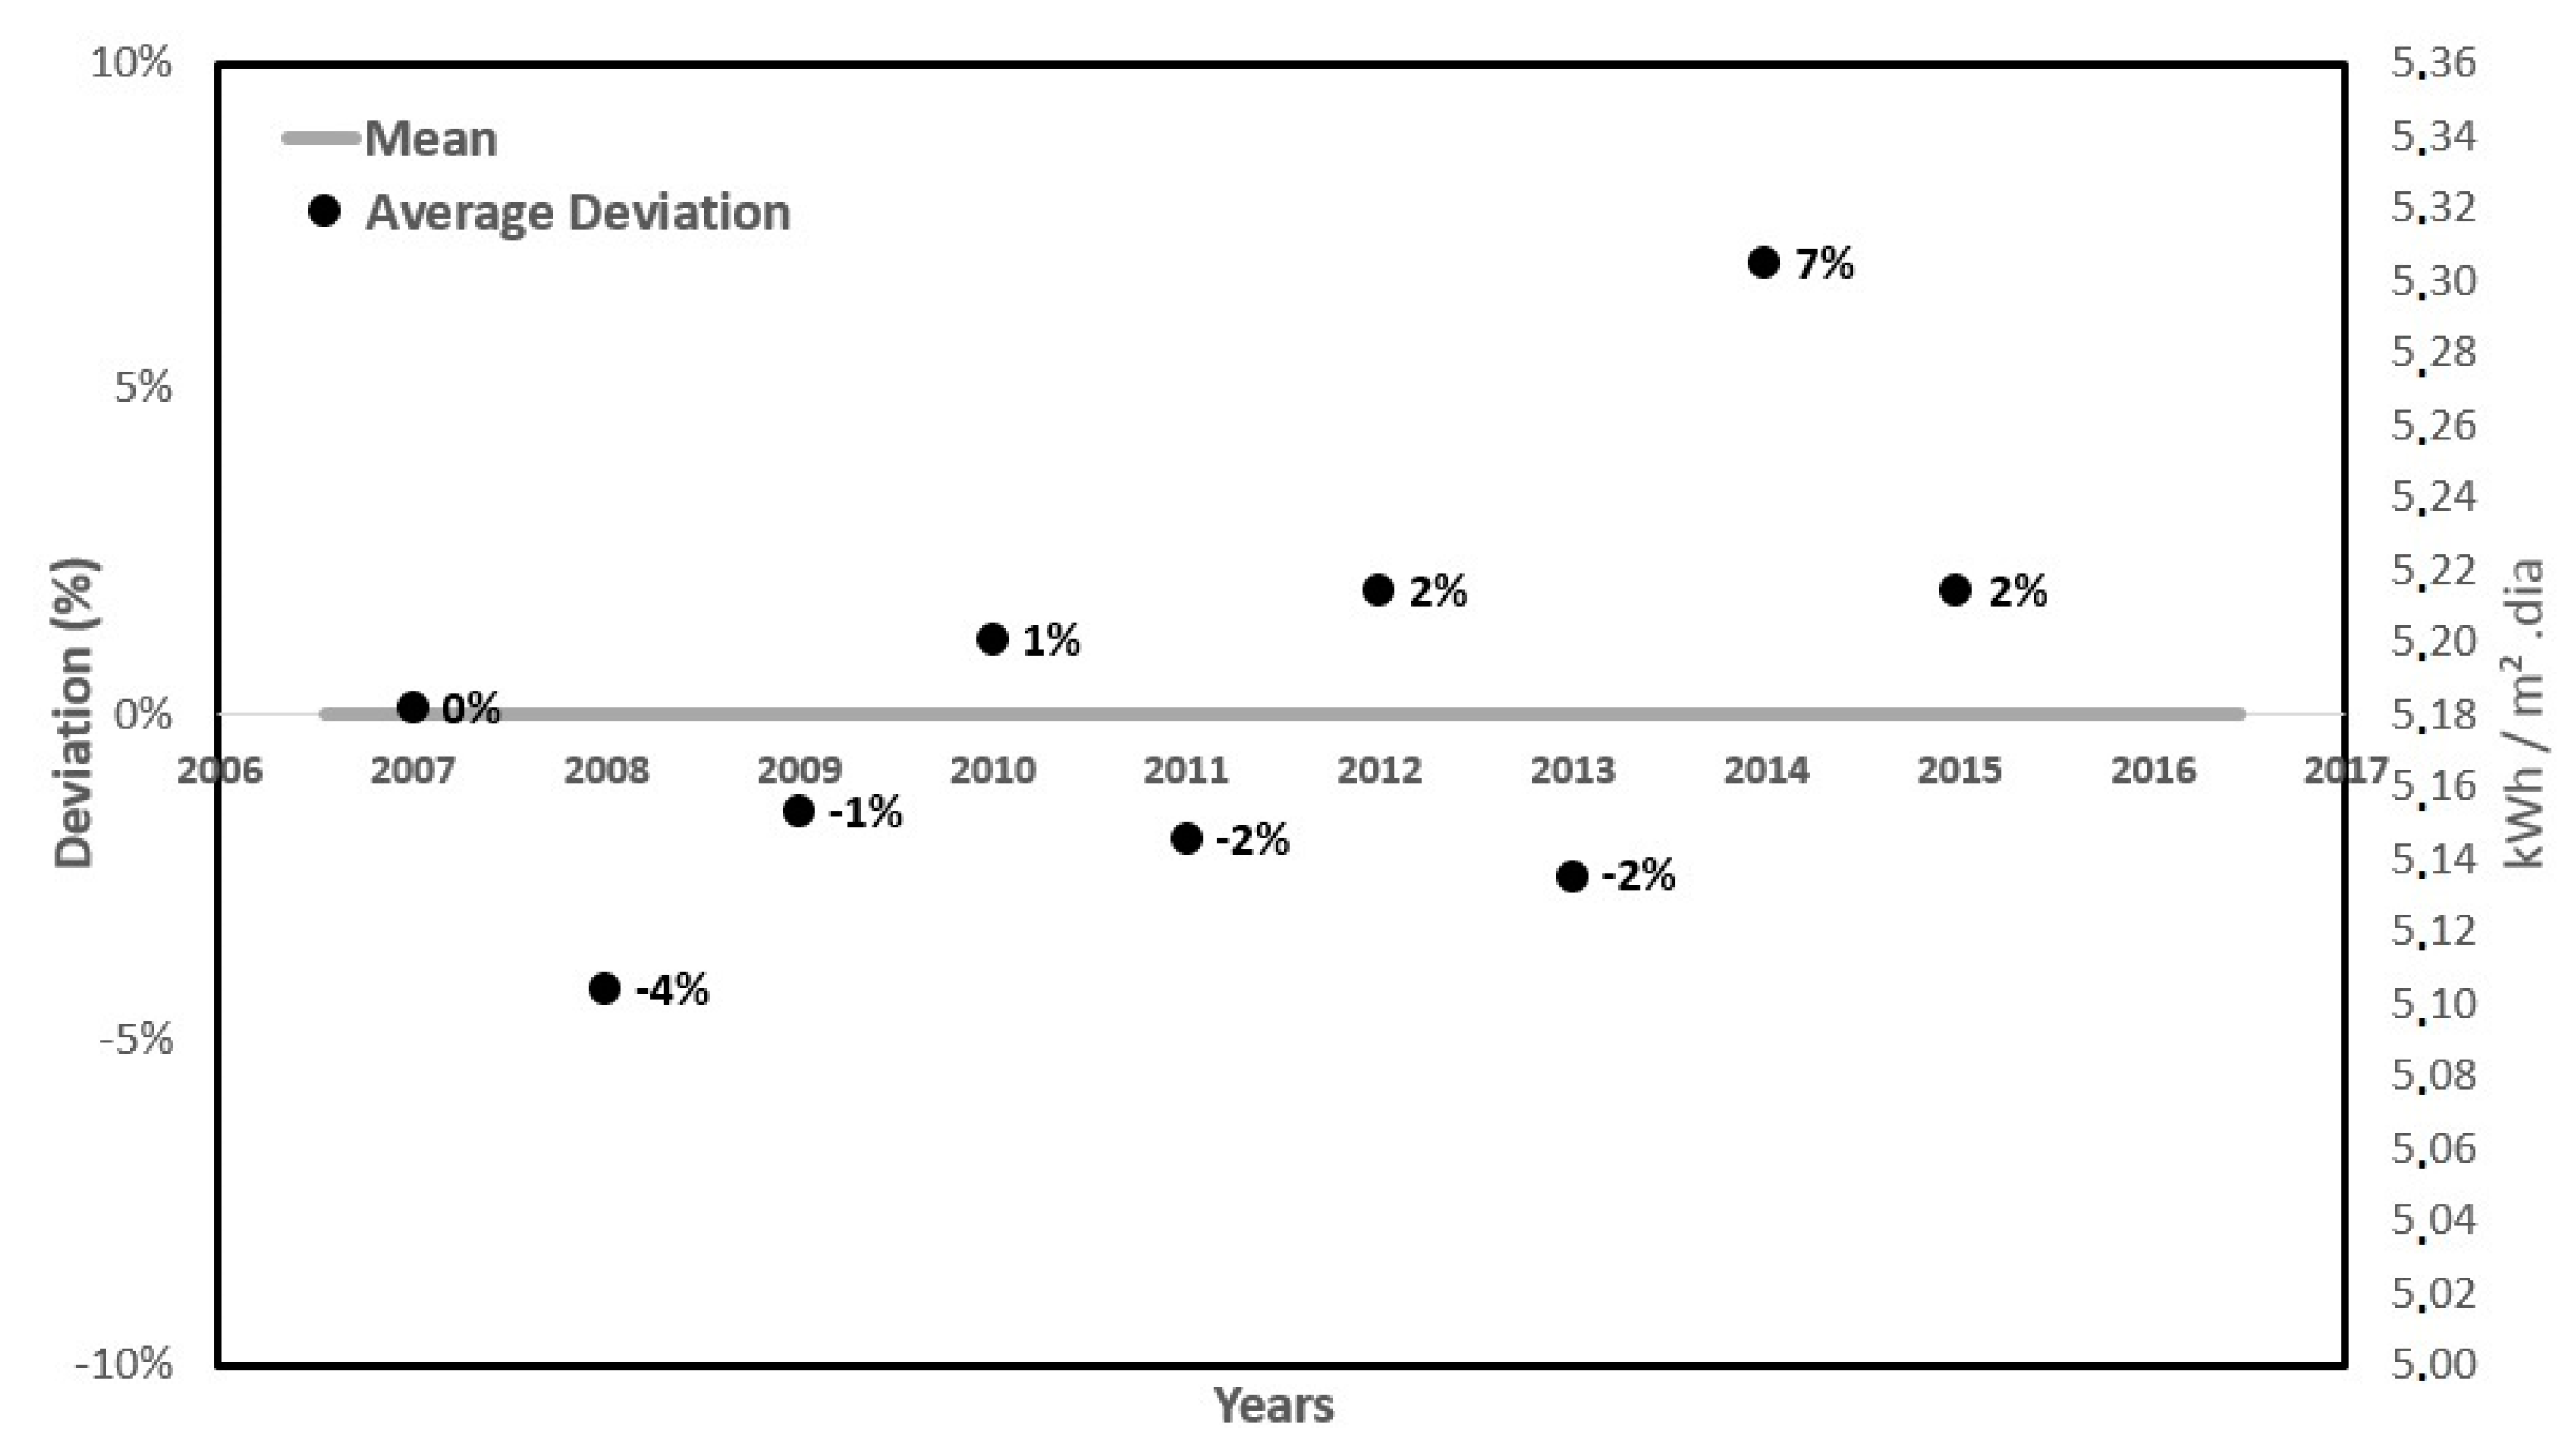
As can be seen in
Figure 12 and
Figure 13, daily, monthly and annual GHI varies throughout year demonstrating the stochastic behavior of the solar resource in location. Years such as 2014 and 2015 achieved the highest values for daily average, 5.57 and 5.28 kWh/m
2, respectively, standing 7% and 2% above the average presented in
Figure 14.
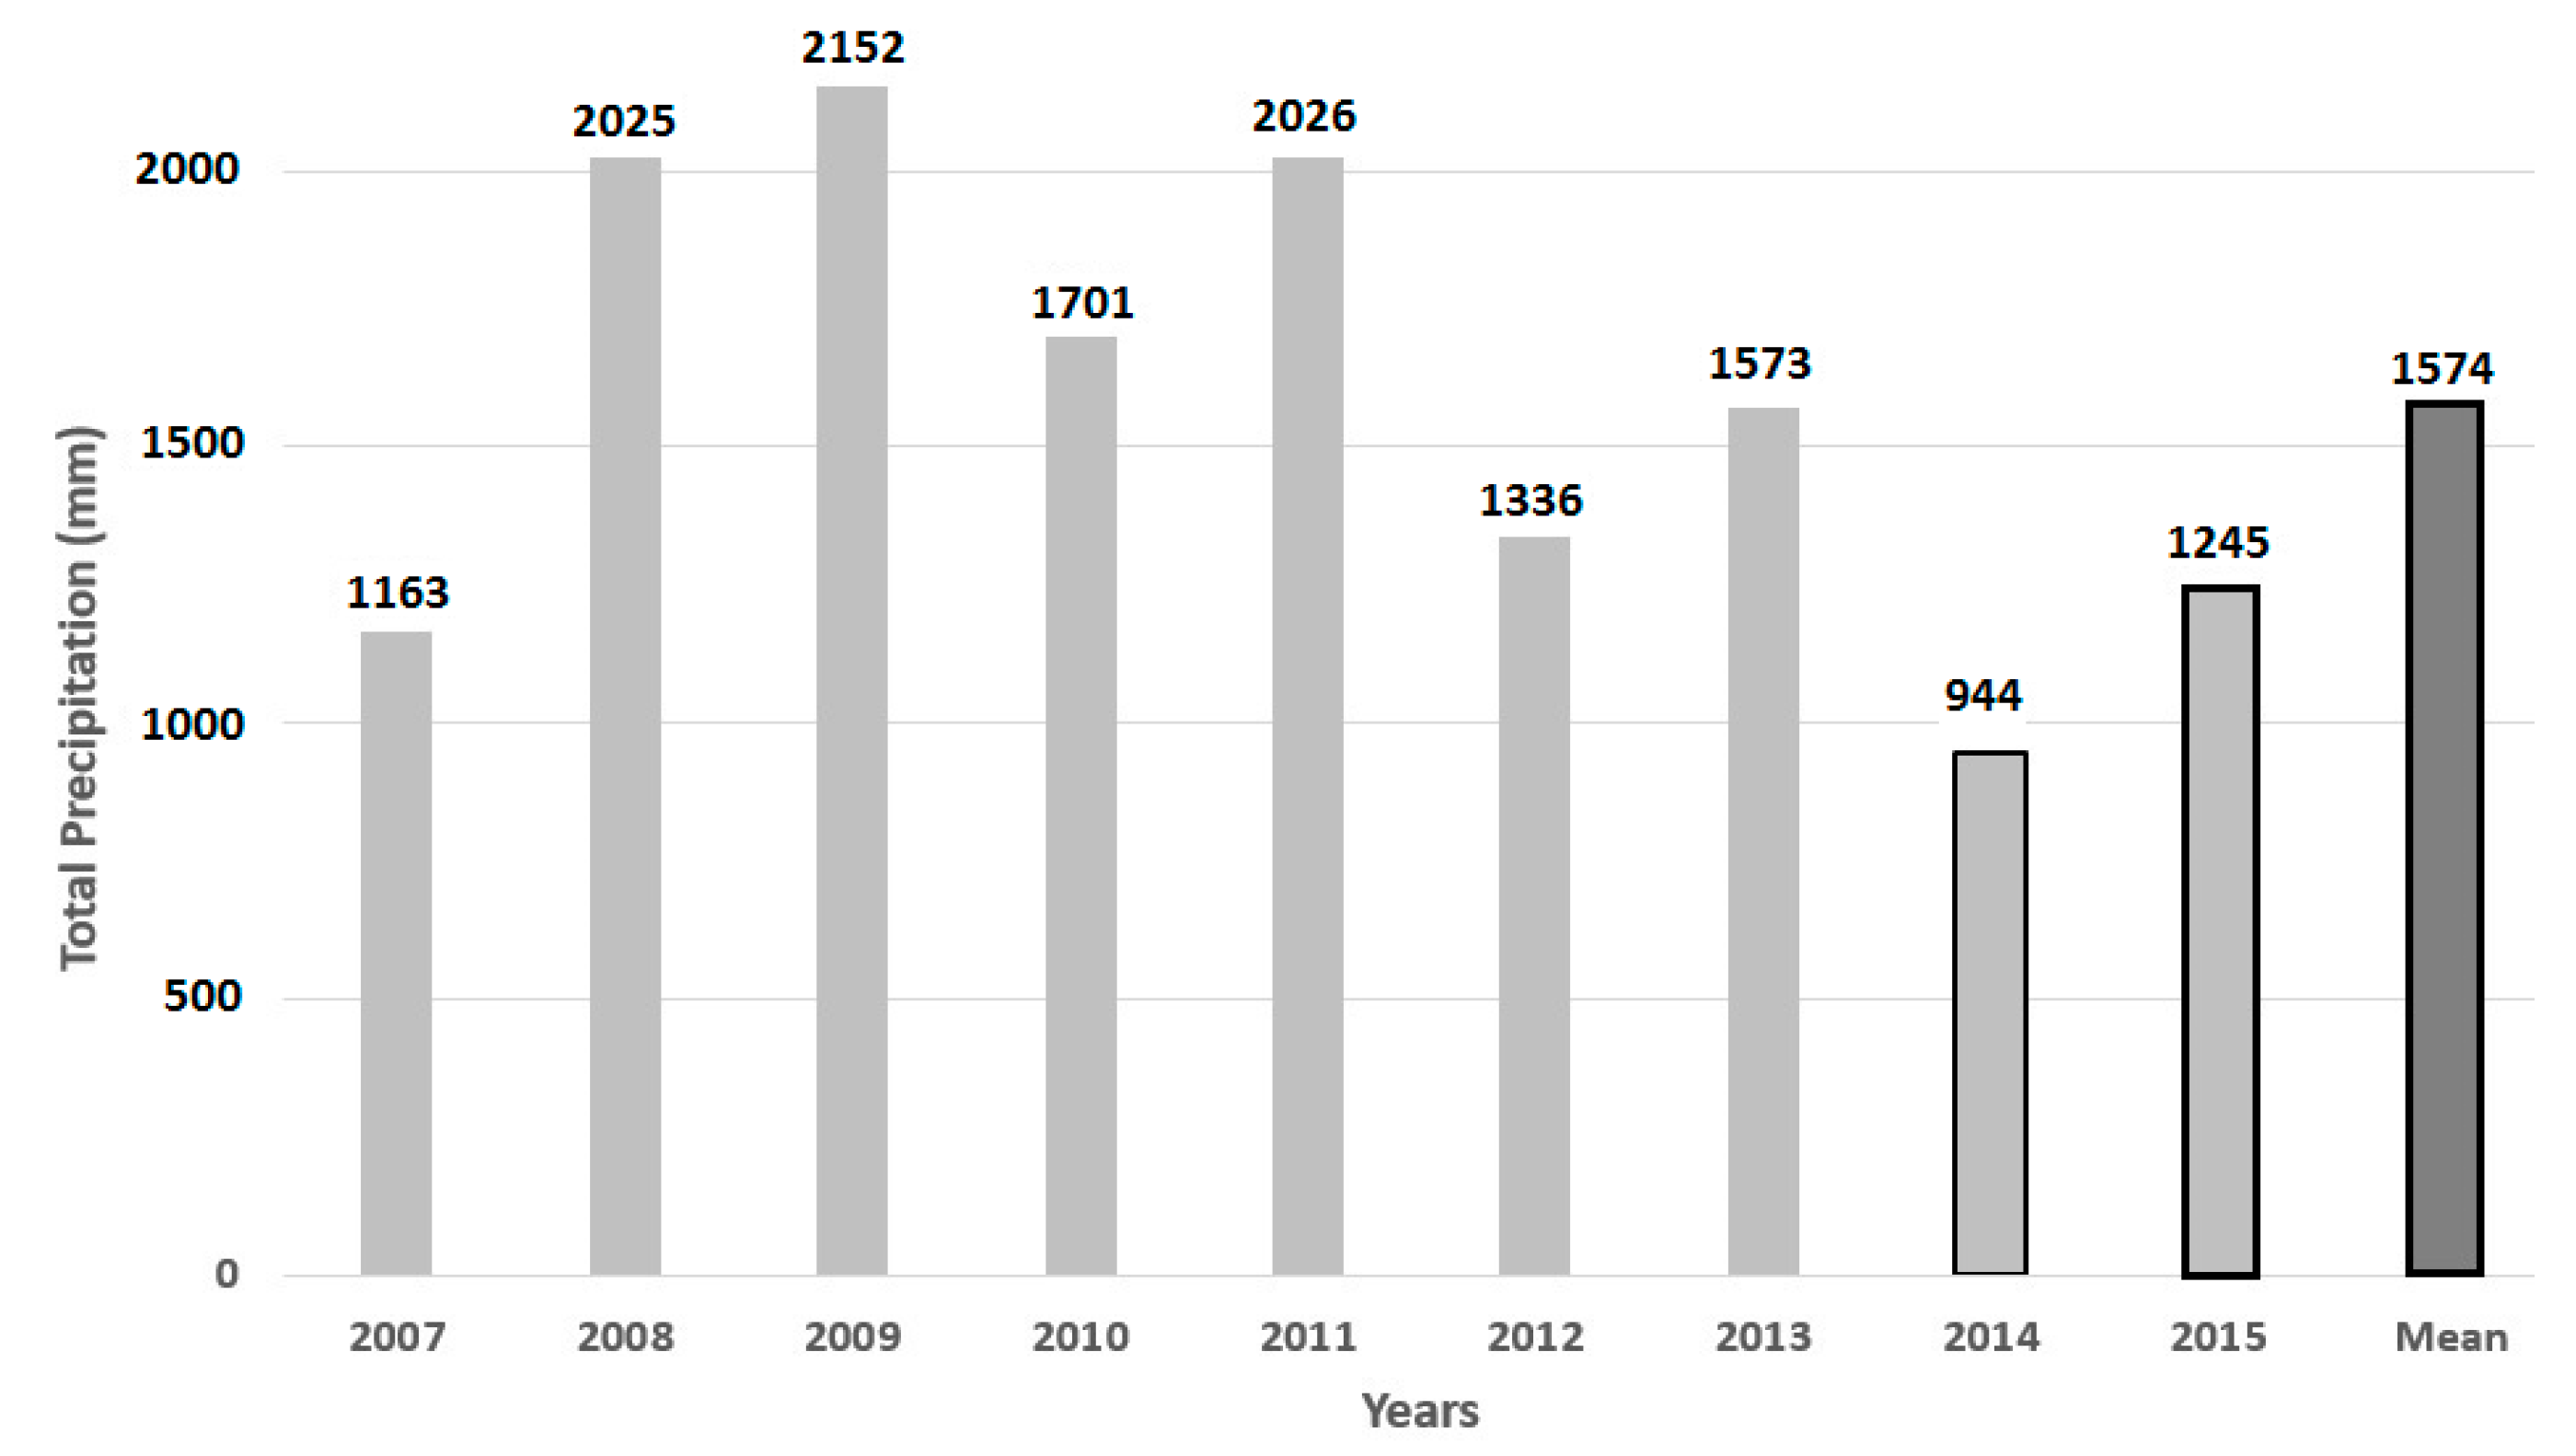
Years such as 2014 and 2015 were particularly very dry, 994 mm and 1245 mm of precipitation, respectively, compared to total annual precipitations from period 2007 to 2015. These values are lower than the average precipitation for the period (1574 mm). This fact can explain the high values found for global irradiation for these two years.
Figure 15 presents annual total precipitations for a series of nine years.
From the point of view of the irradiance’s frequency distribution, the period from October 2014 to September 2015 was considered. This kind of analysis ranks the data depending on the frequency that they are found in a certain range. For irradiance data, the analysis was based on the received energy and the occurrence time. Energy analysis indicates the total amount of solar irradiance available in each range, while time analysis indicates how long each irradiance range prevailed.
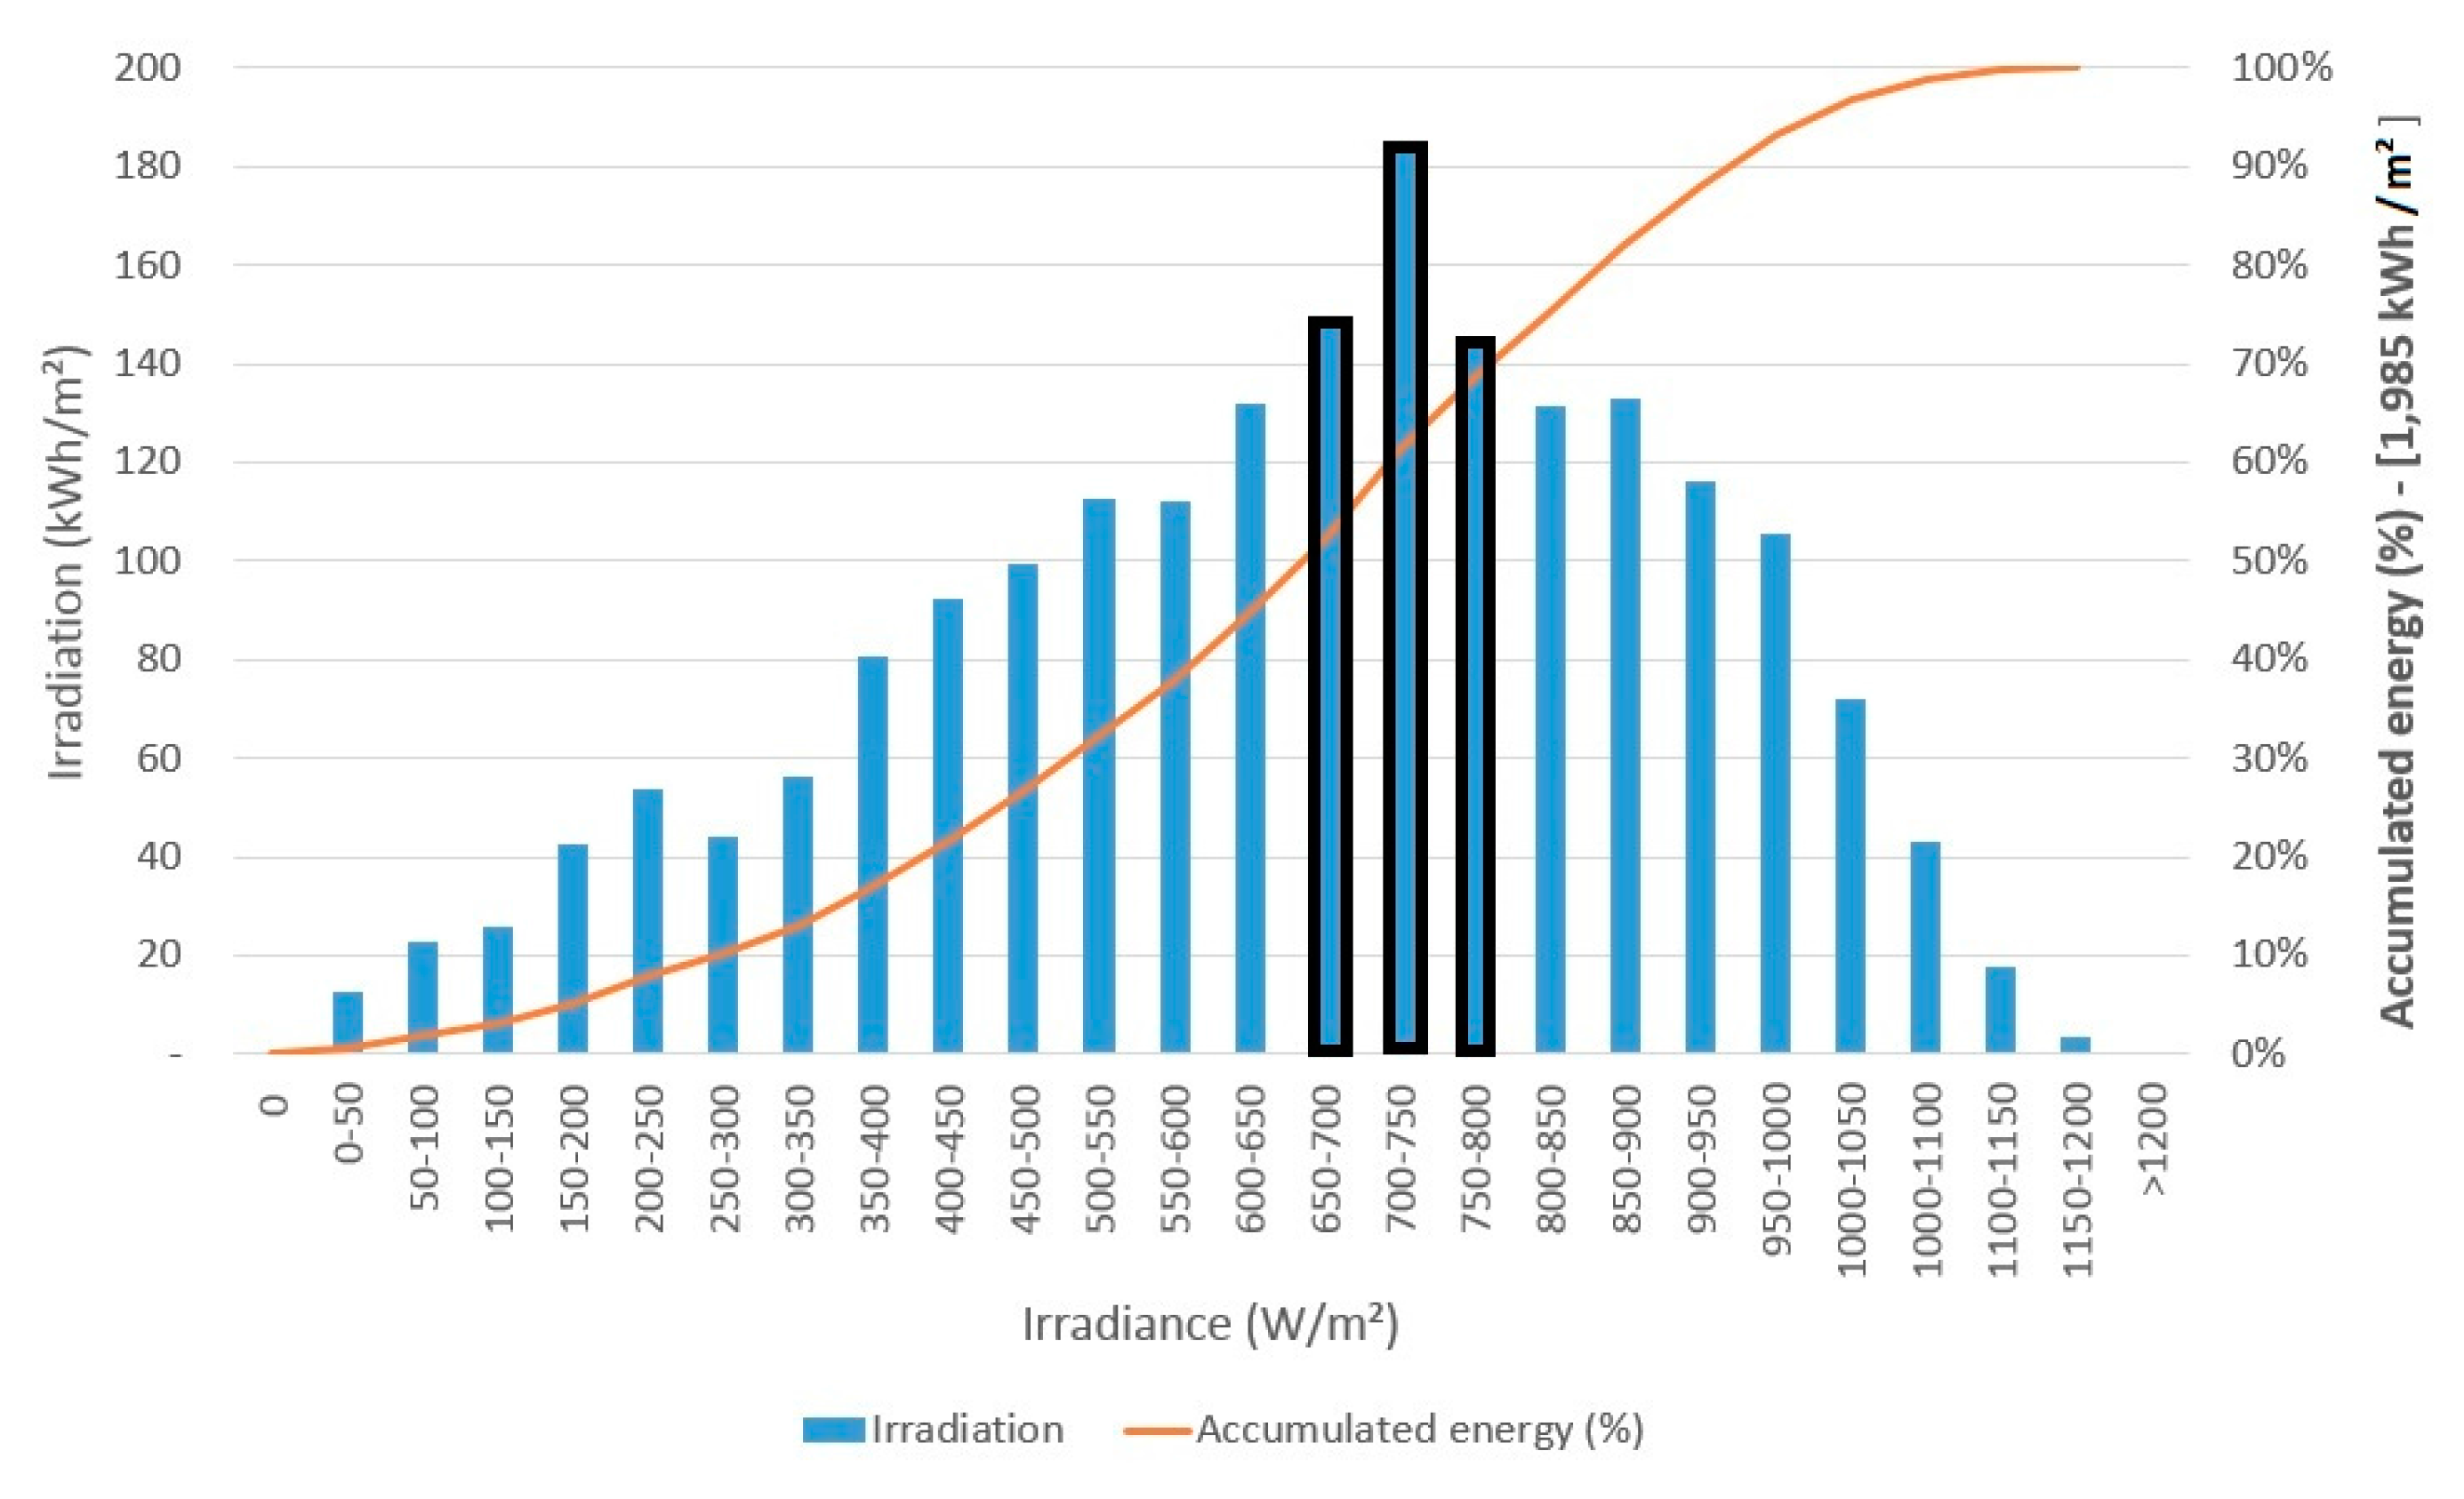
Figure 16 shows frequency distribution for energy (irradiation) as a function of irradiance.
In
Figure 16, the bar value corresponds to the left vertical axis and it indicates the annual amount of solar energy received per square meter for each irradiance range. Cumulative percentage value is shown in the solid line, right vertical axis. Total amount of annual energy available is 1985 kWh/m
2 (appears on the label of this axis) and this value is 5% above the total average amount of annual energy for the period of 2007 to 2015 (1885 kWh/m
2).
In
Figure 16, the irradiance ranges that contribute more are 650–700 W/m
2 (148 kWh/m
2), 700–750 W/m
2 (184 kWh/m
2) and 750–800 W/m
2 (145 kWh/m
2) as highlighted on black bars. Energy contribution of irradiances up to these ranges accounts for 69% of the energy measured by sensors, and these three ranges alone contribute about 23% (7%, 9% and 7%, respectively) of total incident irradiation on PV plant over the period.
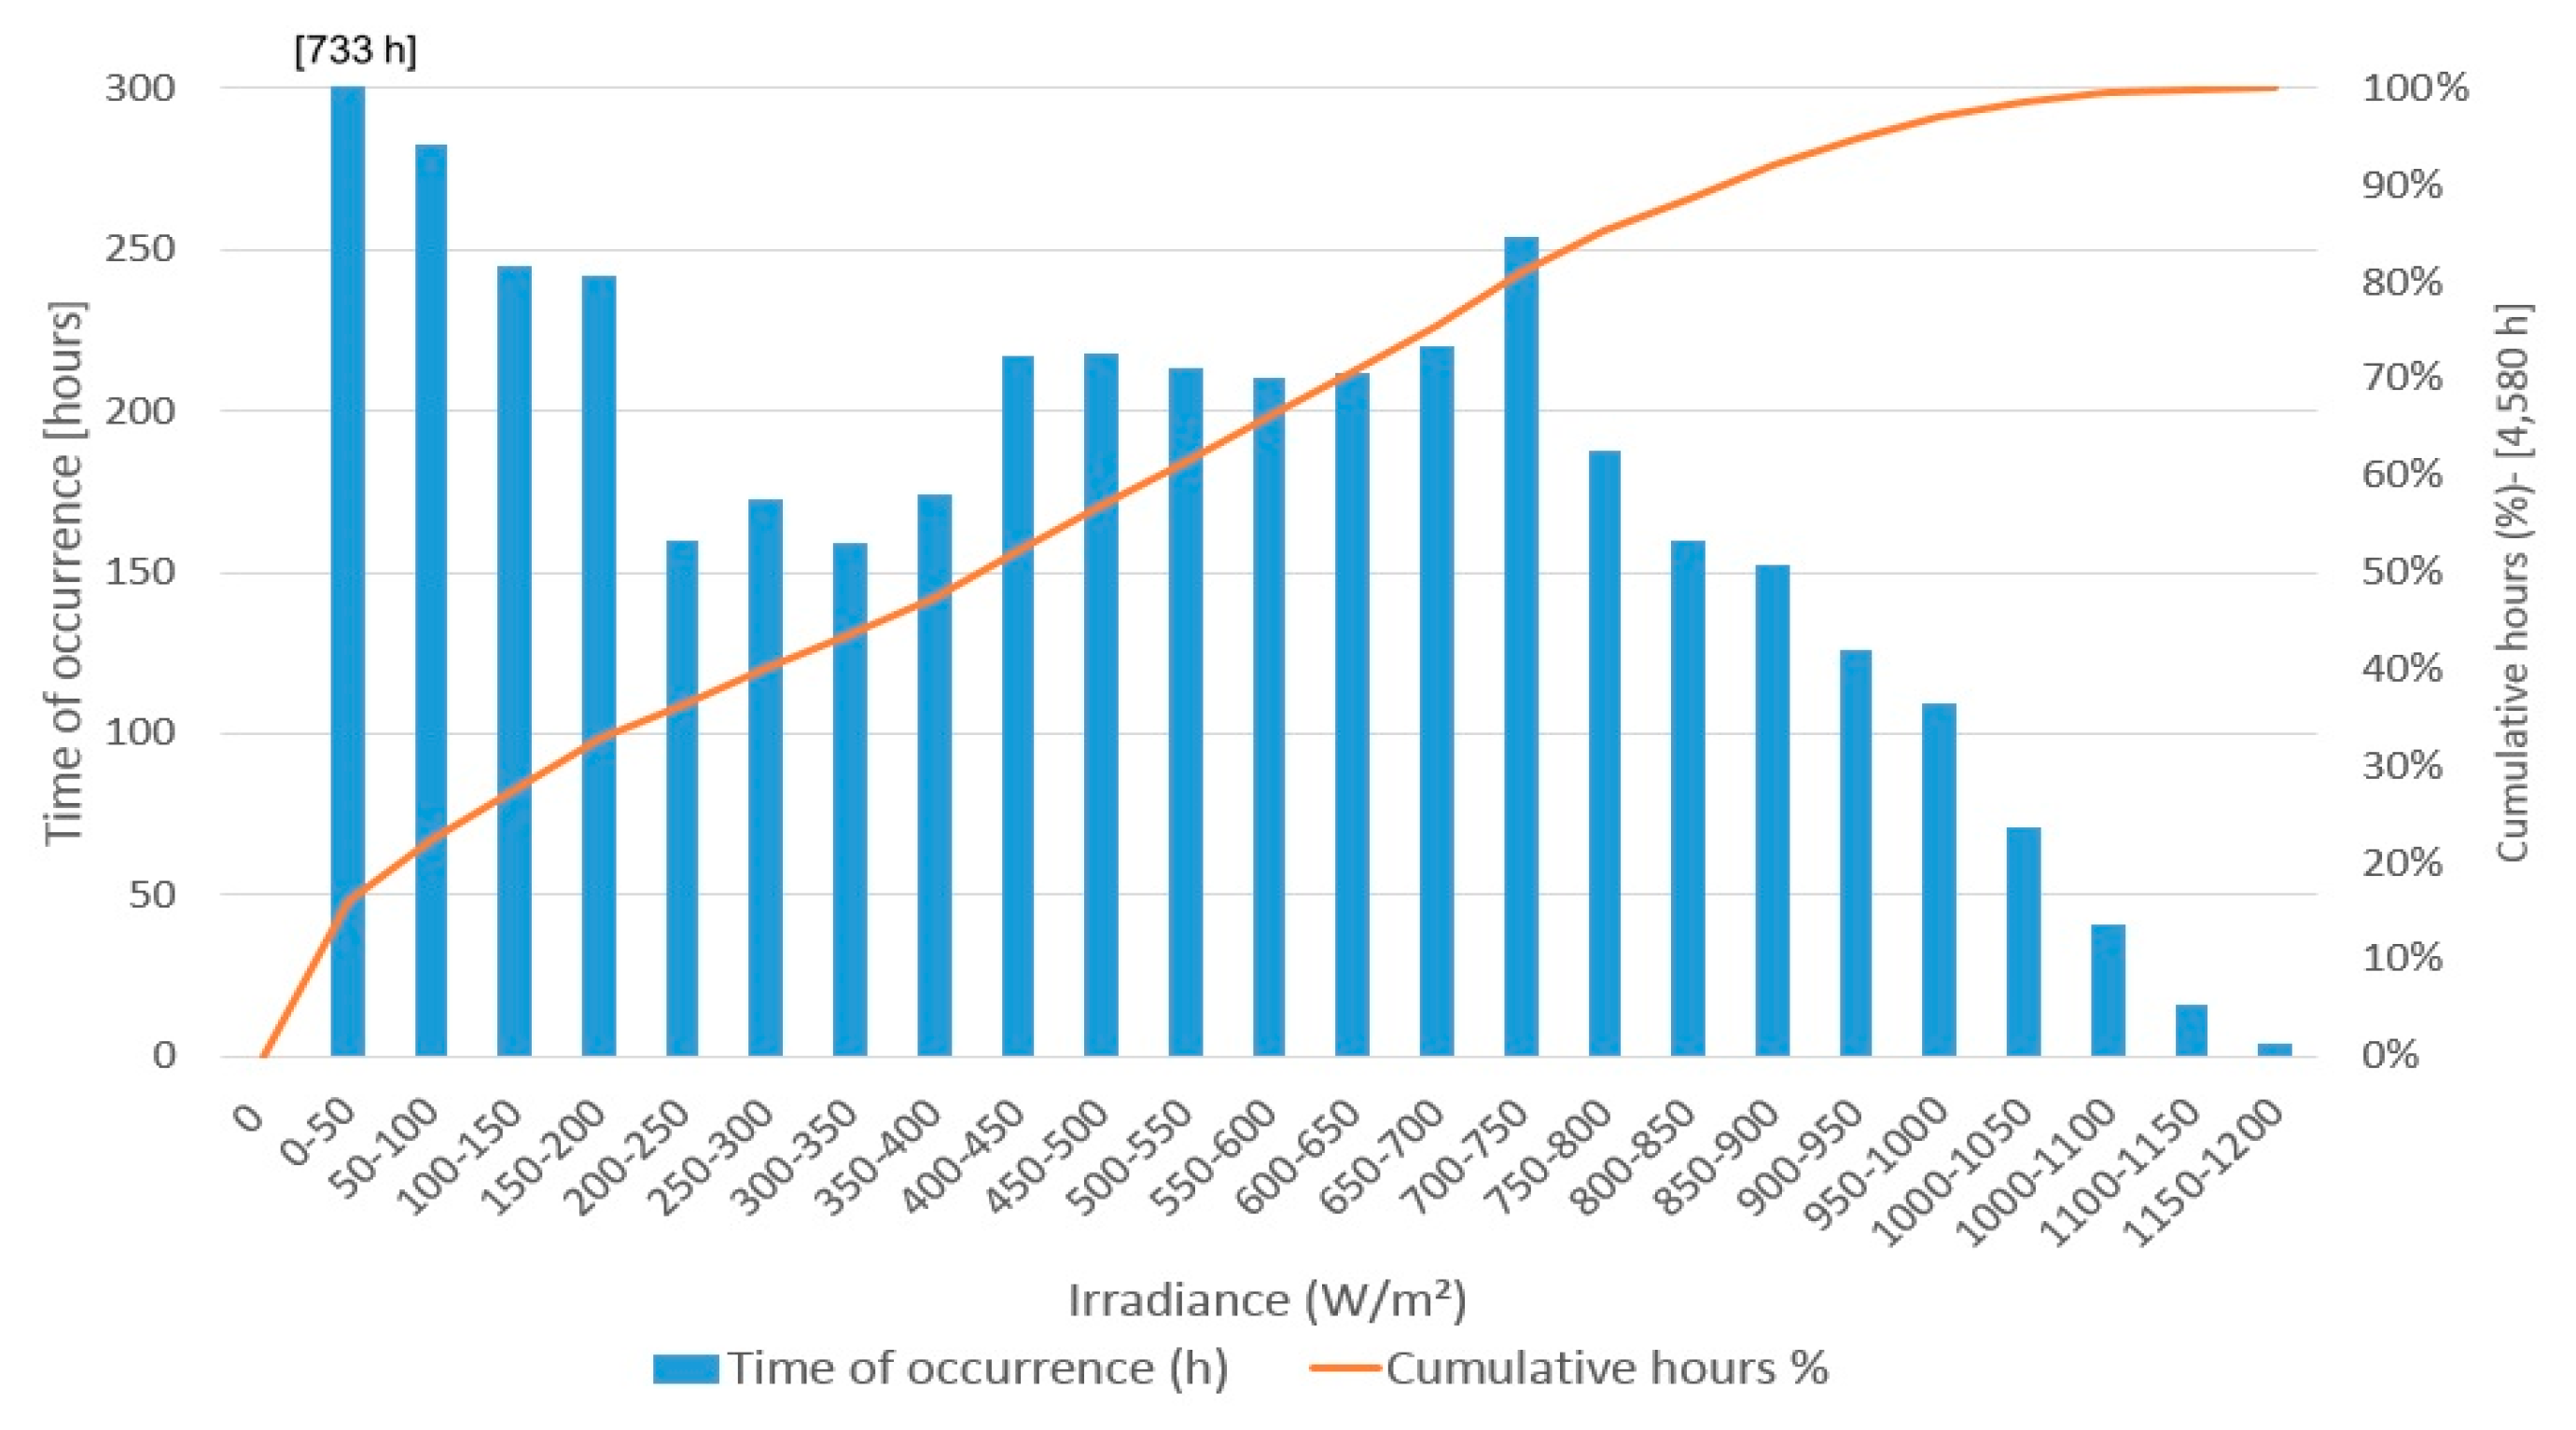
Another analysis is irradiance frequency distribution against occurrence time (
Figure 17).
Similar to energy distribution in
Figure 16, the time analysis in
Figure 17 presents time intervals in which solar irradiance was in certain ranges, considering daily measurements from 6:00 a.m. to 7:00 p.m.
In
Figure 17, considering the period from 2014 to 2015, the ranges of irradiance most frequent in the region of Mineirão Stadium are 50 to 200 W/m
2 (17% or 930 total hours) and from 400 to 750 W/m
2 (66% or 1544 total hours). Range of 700–750 W/m
2 must be highlighted, with 254 h, or 5.5% of total. Furthermore, the analysis shows that, for almost 81% of the time (cumulative hours), the irradiance is lower or equal to 750 W/m
2.
It is important to mention that the first range of irradiance (0–50 W/m2) has values out of range, but they can be read (733 h) at the top of bar. Even though this range has a substantial time of occurrence, its energy contribution is quite poor.
Considering both
Figure 16 and
Figure 17, despite the fact that irradiance prevailed at lower levels (0 to 350 W/m
2), energy generation is concentrated primarily on medium levels of irradiance (400 W/m
2 to 800 W/m
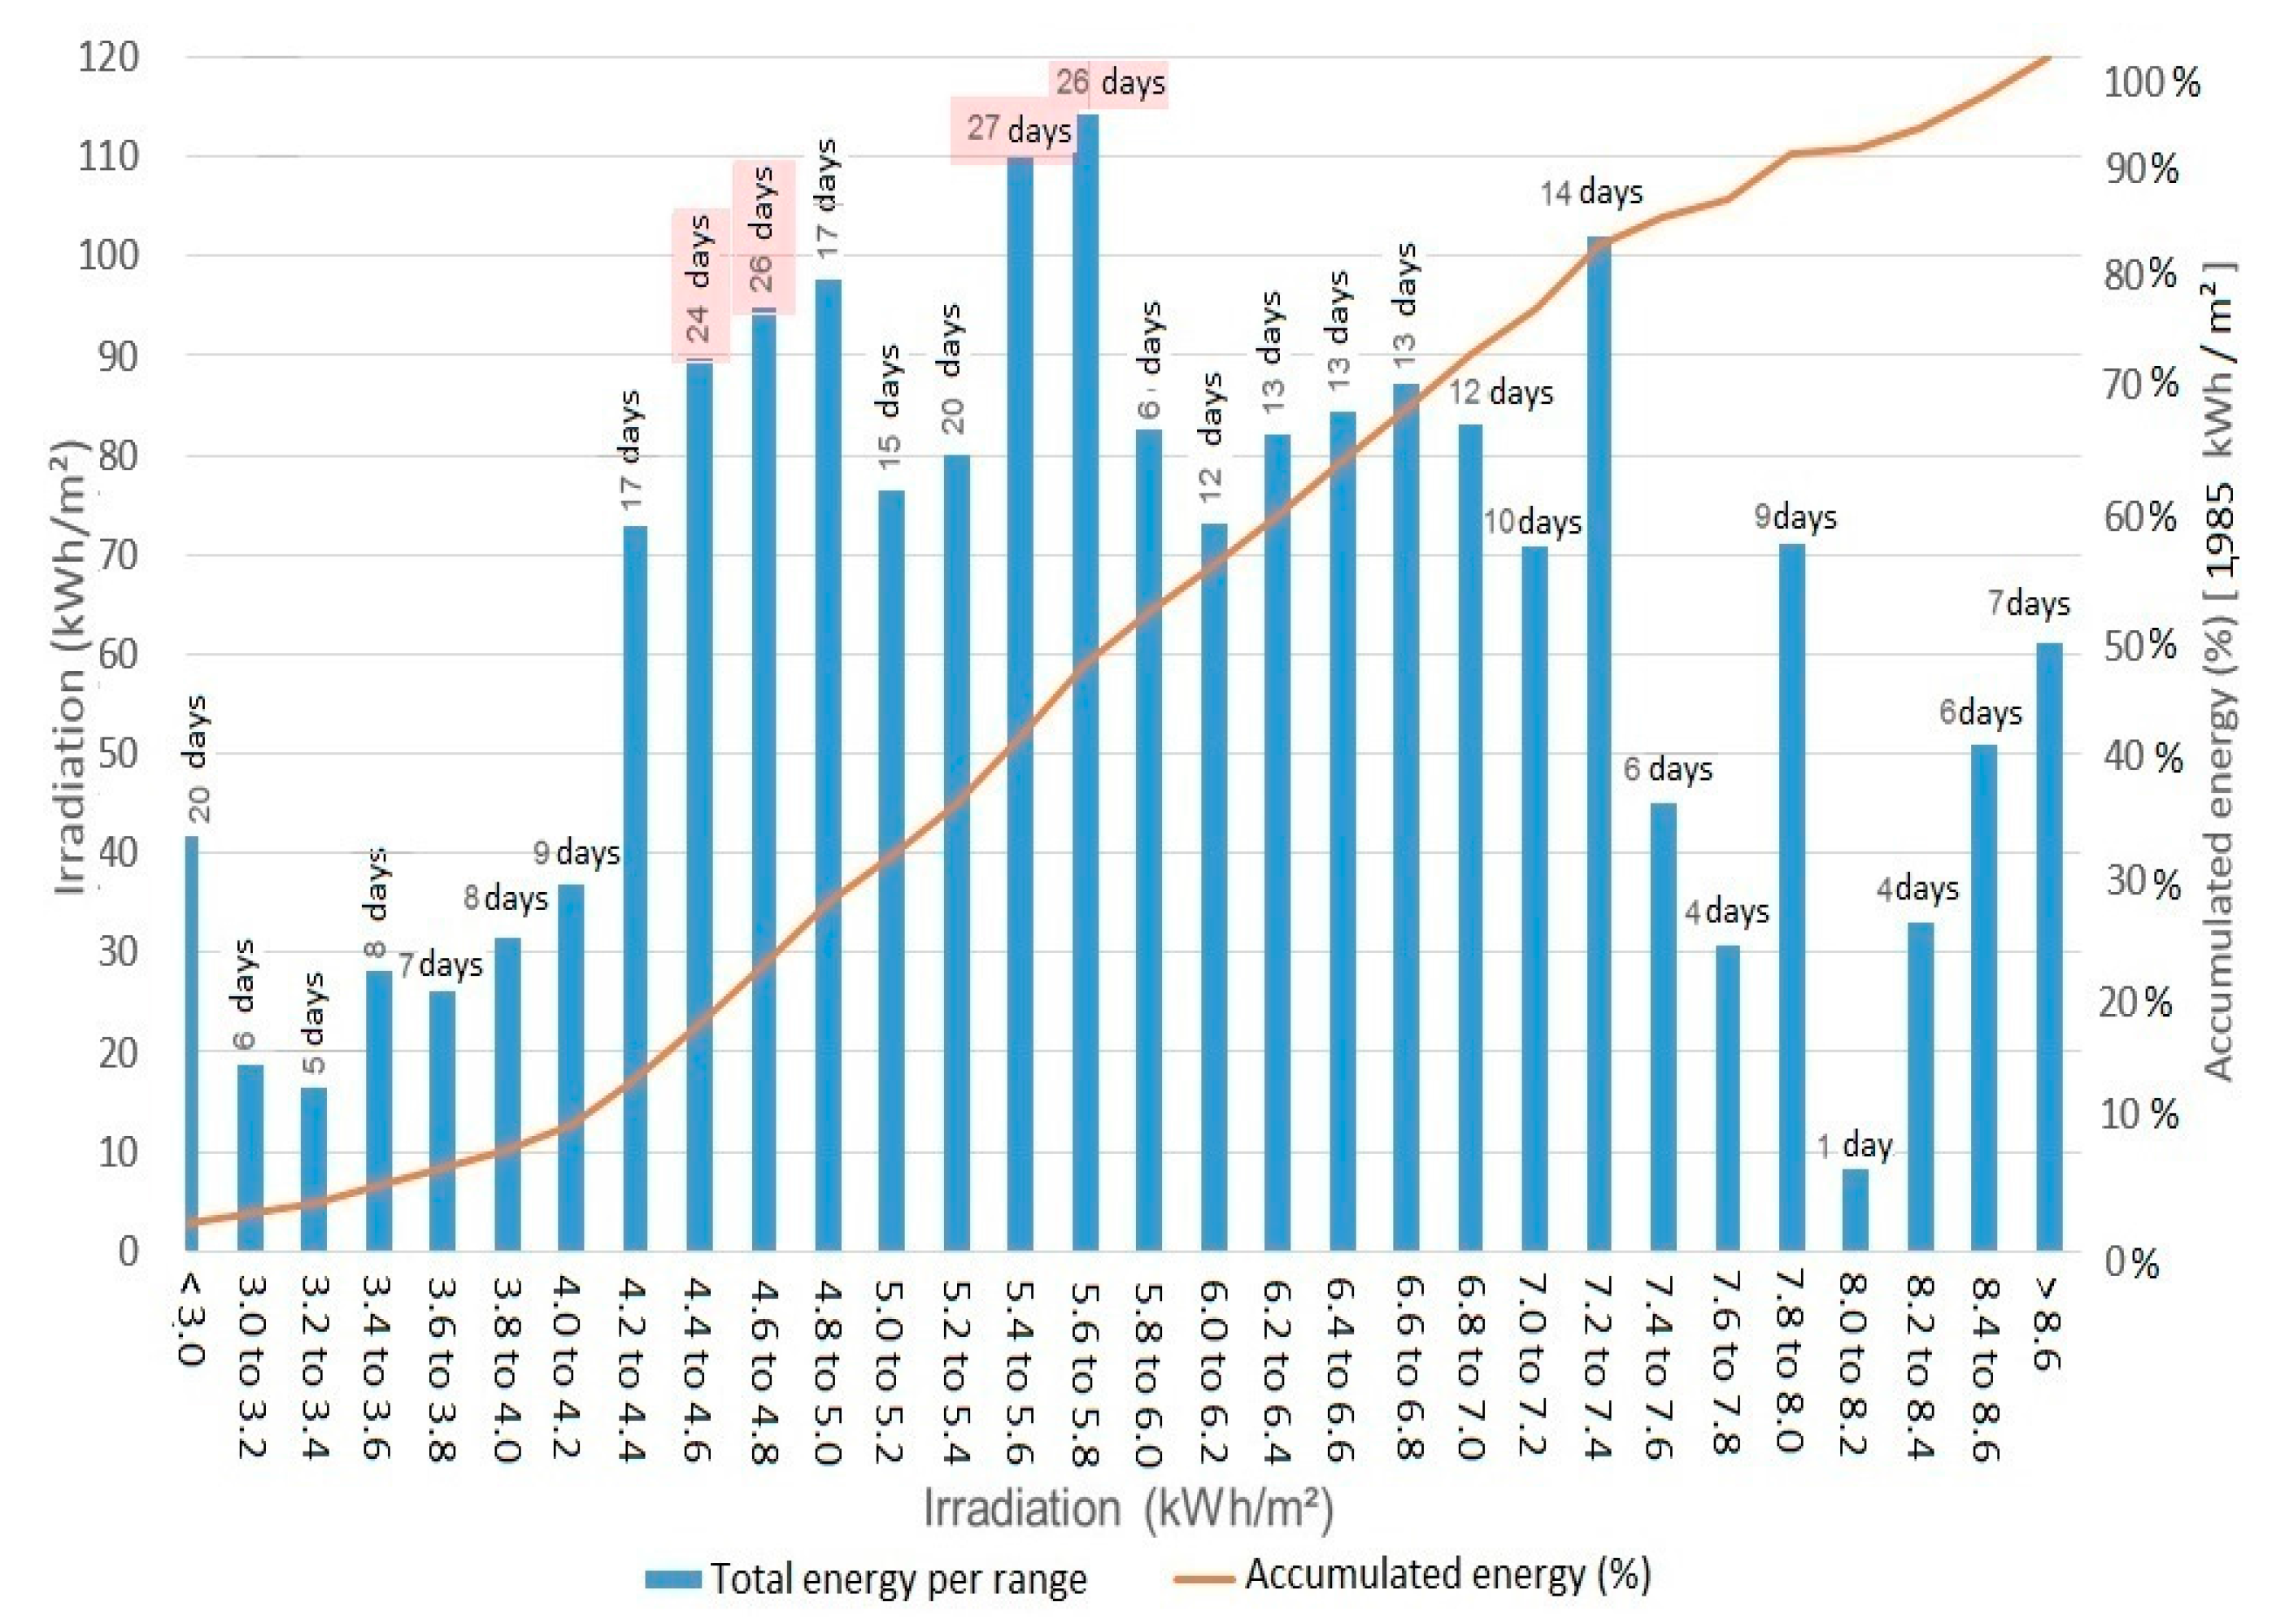
2). On these ranges, even the frequency distribution for time being average, energy transfer is high (for the whole range), causing these levels to present a higher energy contribution. Finally, to complete the frequency distribution analysis for solar radiation (from October 2014 to September 2015), in Mineirão Stadium Power Plant, the daily irradiation values were classified into energy ranges, as shown in
Figure 18.
Figure 18 shows number of days that irradiance occurred for each irradiation range. The bar lengths correspond to the amount of solar energy per square meter that is available by those days, shown on the left vertical axis. The solid line represents the total cumulative energy, shown on the right vertical axis, labeled total amount of energy (1985 kWh/m
2).
Furthermore,
Figure 18 illustrates a tendency of values concentrating on ranges starting from 4.4 kWh/m
2 up to 5.8 kWh/m
2 (35% of total energy). Since 49% of the total accumulated energy occurred over ranges up to 5.6 to 5.8 kWh/m
2 (contributes with 6% of total energy on this range), it demonstrates the good solar resource availability in the region.
4. Monitoring of PV Power Plant—Method, Results and Discussion
Monitoring a PV system is a well-known and widespread practice around world [
21,
22,
23,
24,
25,
26,
27,
28,
29,
30,
31,
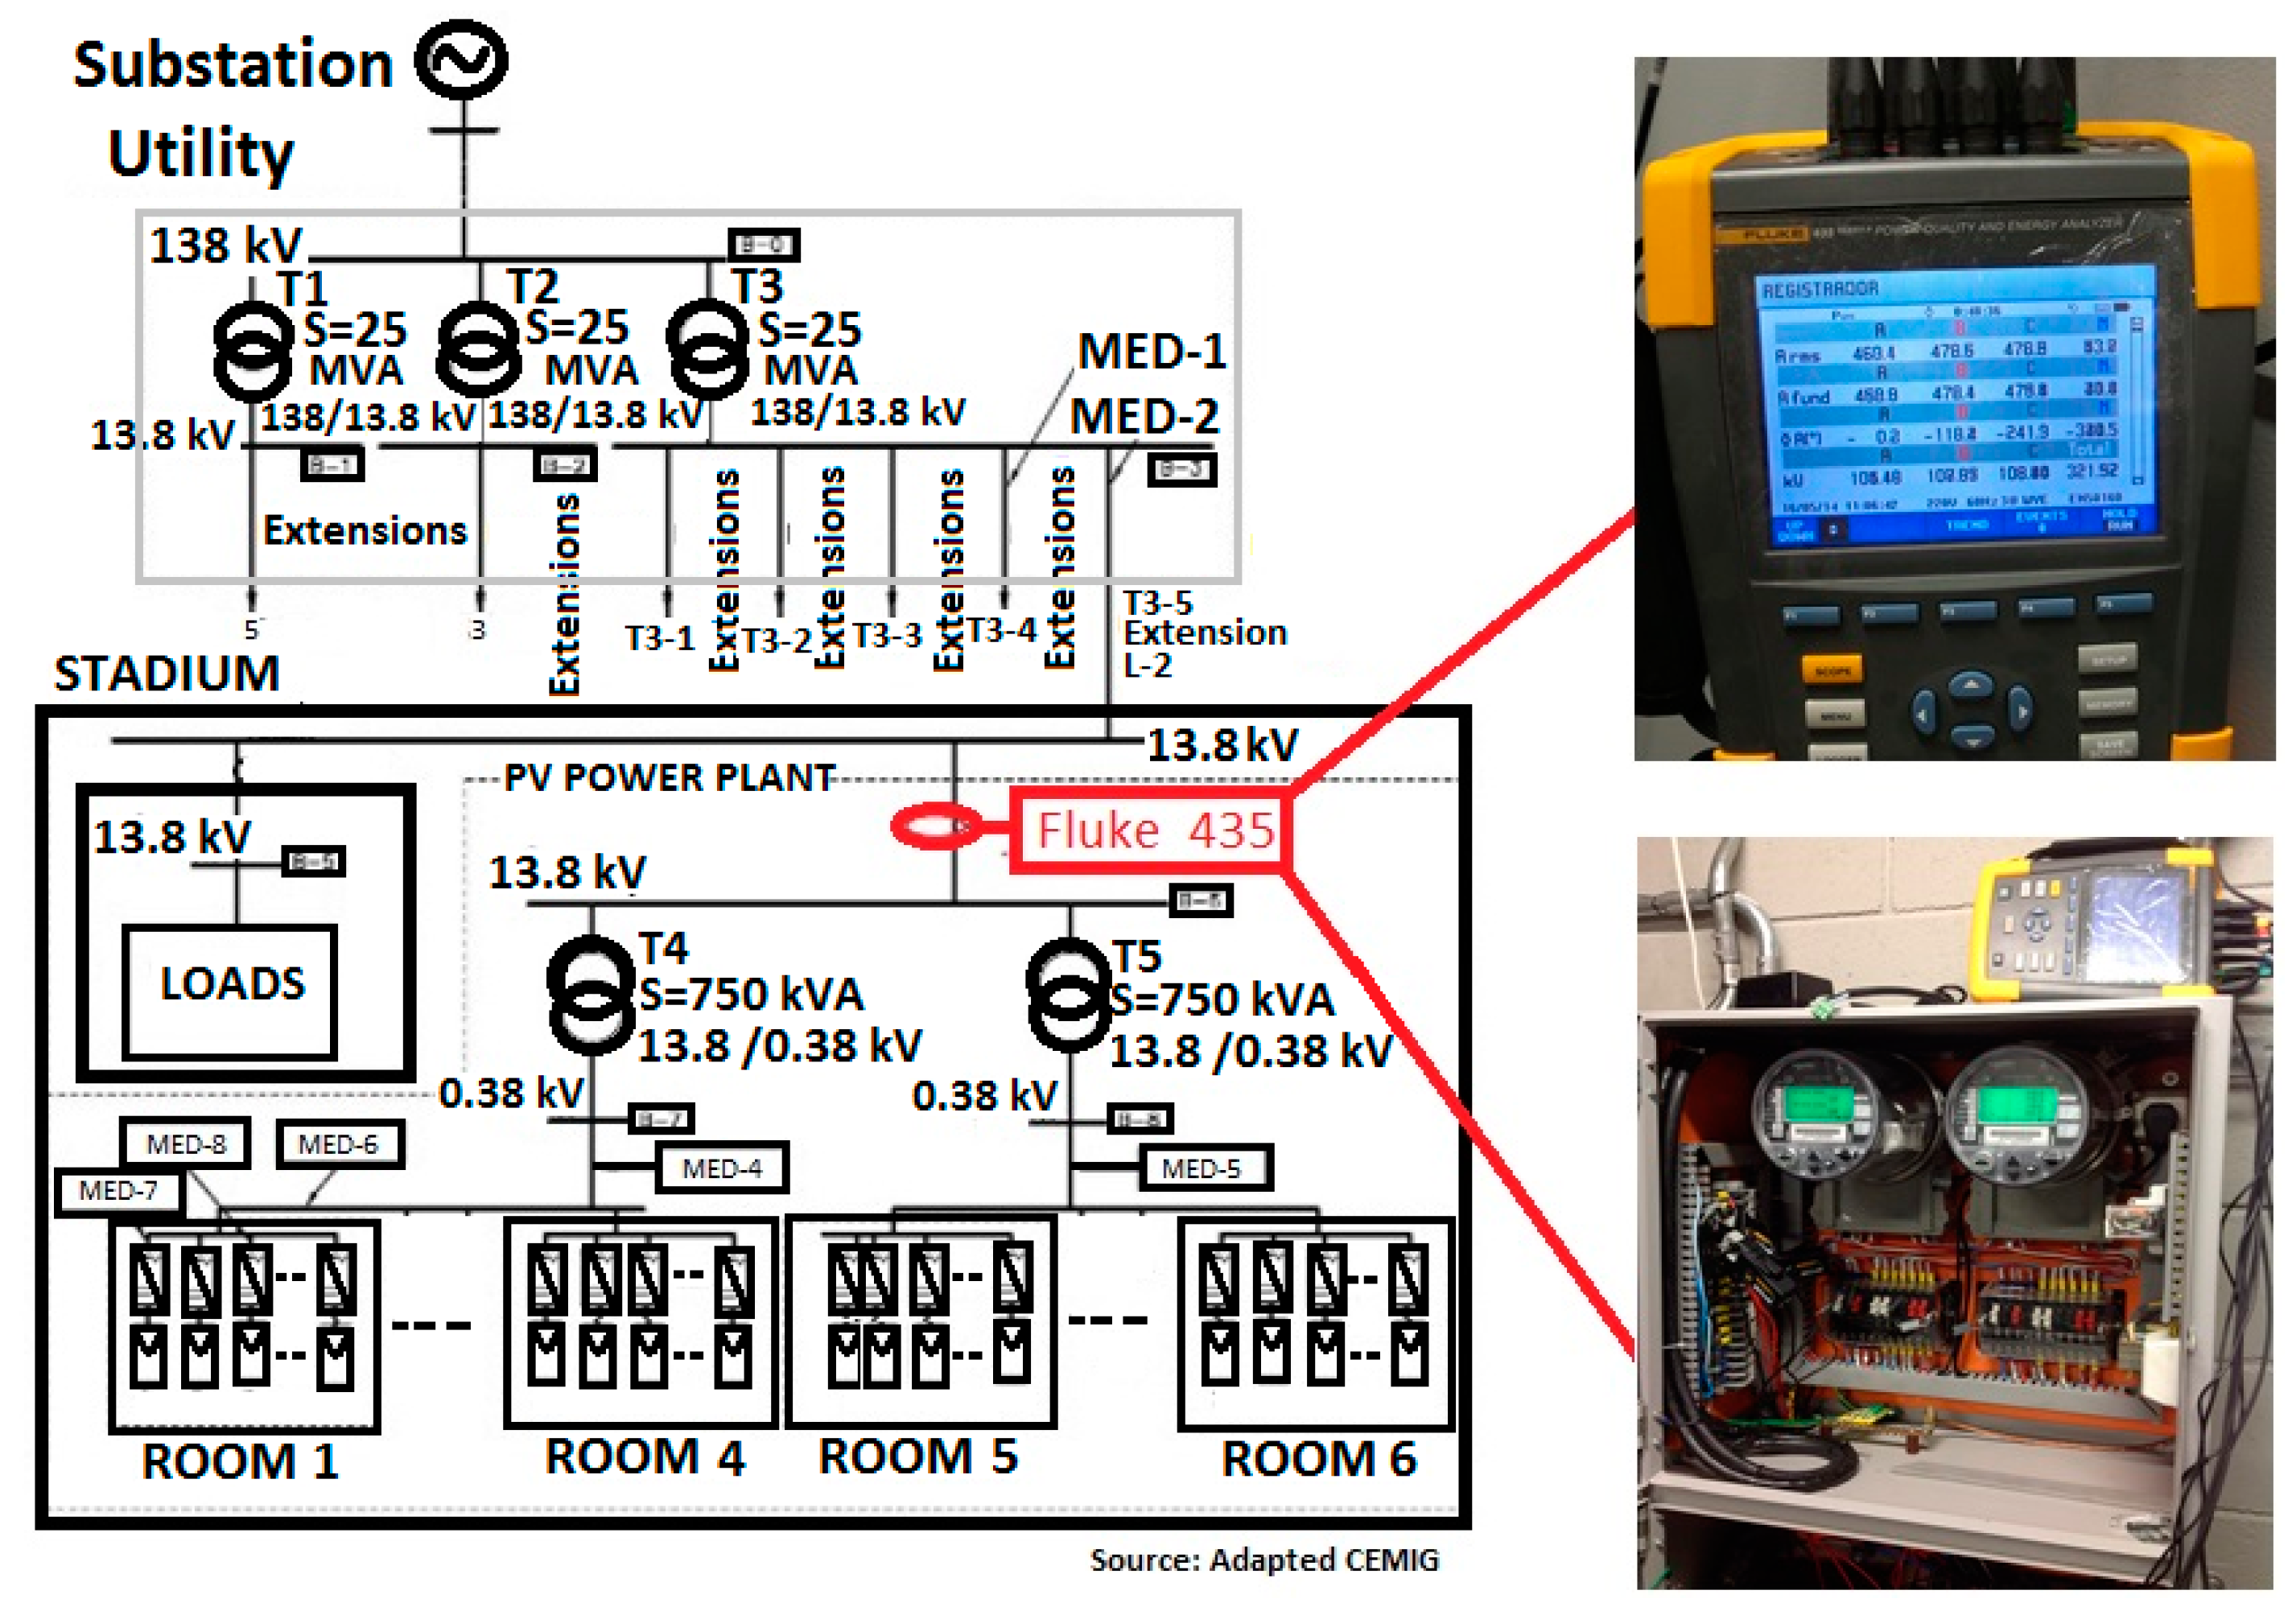
32]. Monitoring all operational parameters of a PV solar plant (e.g., DC-AC voltages, currents, power, solar radiation, etc.) is crucial for fault detection and energy production/yield evaluation. The AC side of Mineirão PV power plant was monitored for the period of October 2014 to September 2015, by Fluke 435 series II Power and Energy Quality Digital Analyzer.
Such equipment is used for commissioning and monitoring power plants [
22,
29] and also to measure many electrical parameters as voltage (up to 1000 V—phase to neutral—±0.1% Vnominal), current (5 A to 6000 A, CC + AC—±0.5%), power (W, VA, VAr, W up to 6000 MW—±1%), harmonics (THD’s voltage/current, 1 to 50th) and others.
In this study, average values of voltage, current, active (P), reactive (Q) and apparent (S) powers as well as THDs and other variables of interest were sampled per phase and stored at intervals of 5 min. The data acquisition device (Fluke 435) was connected to the point of common coupling (PCC) between utility grid and PV Power plant of Mineirão Football Stadium as illustrated in
Figure 19.
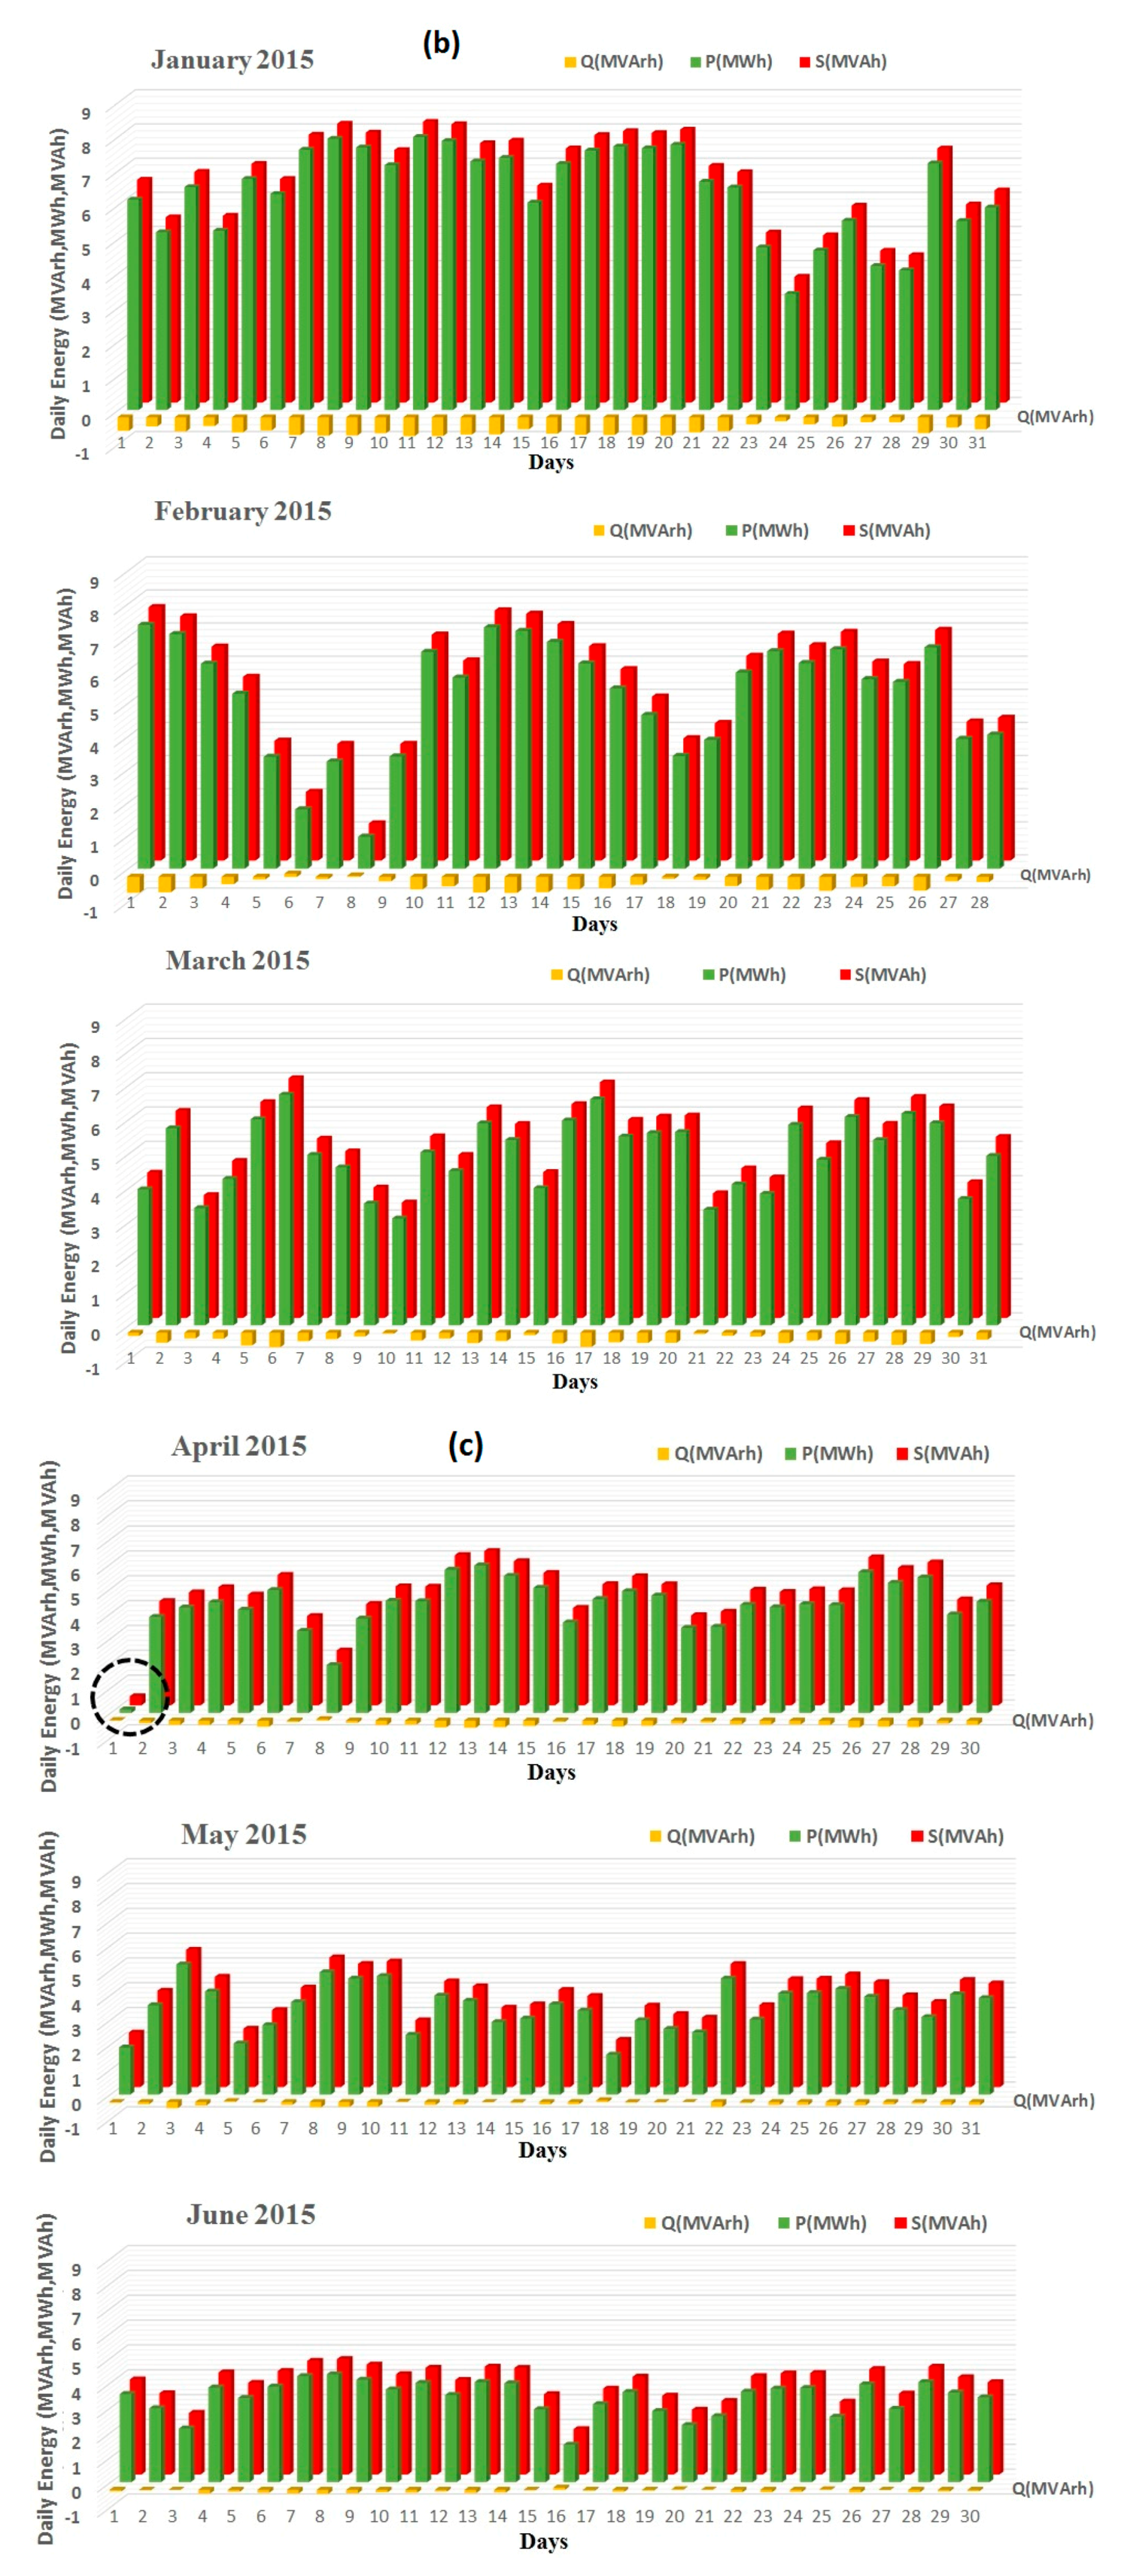
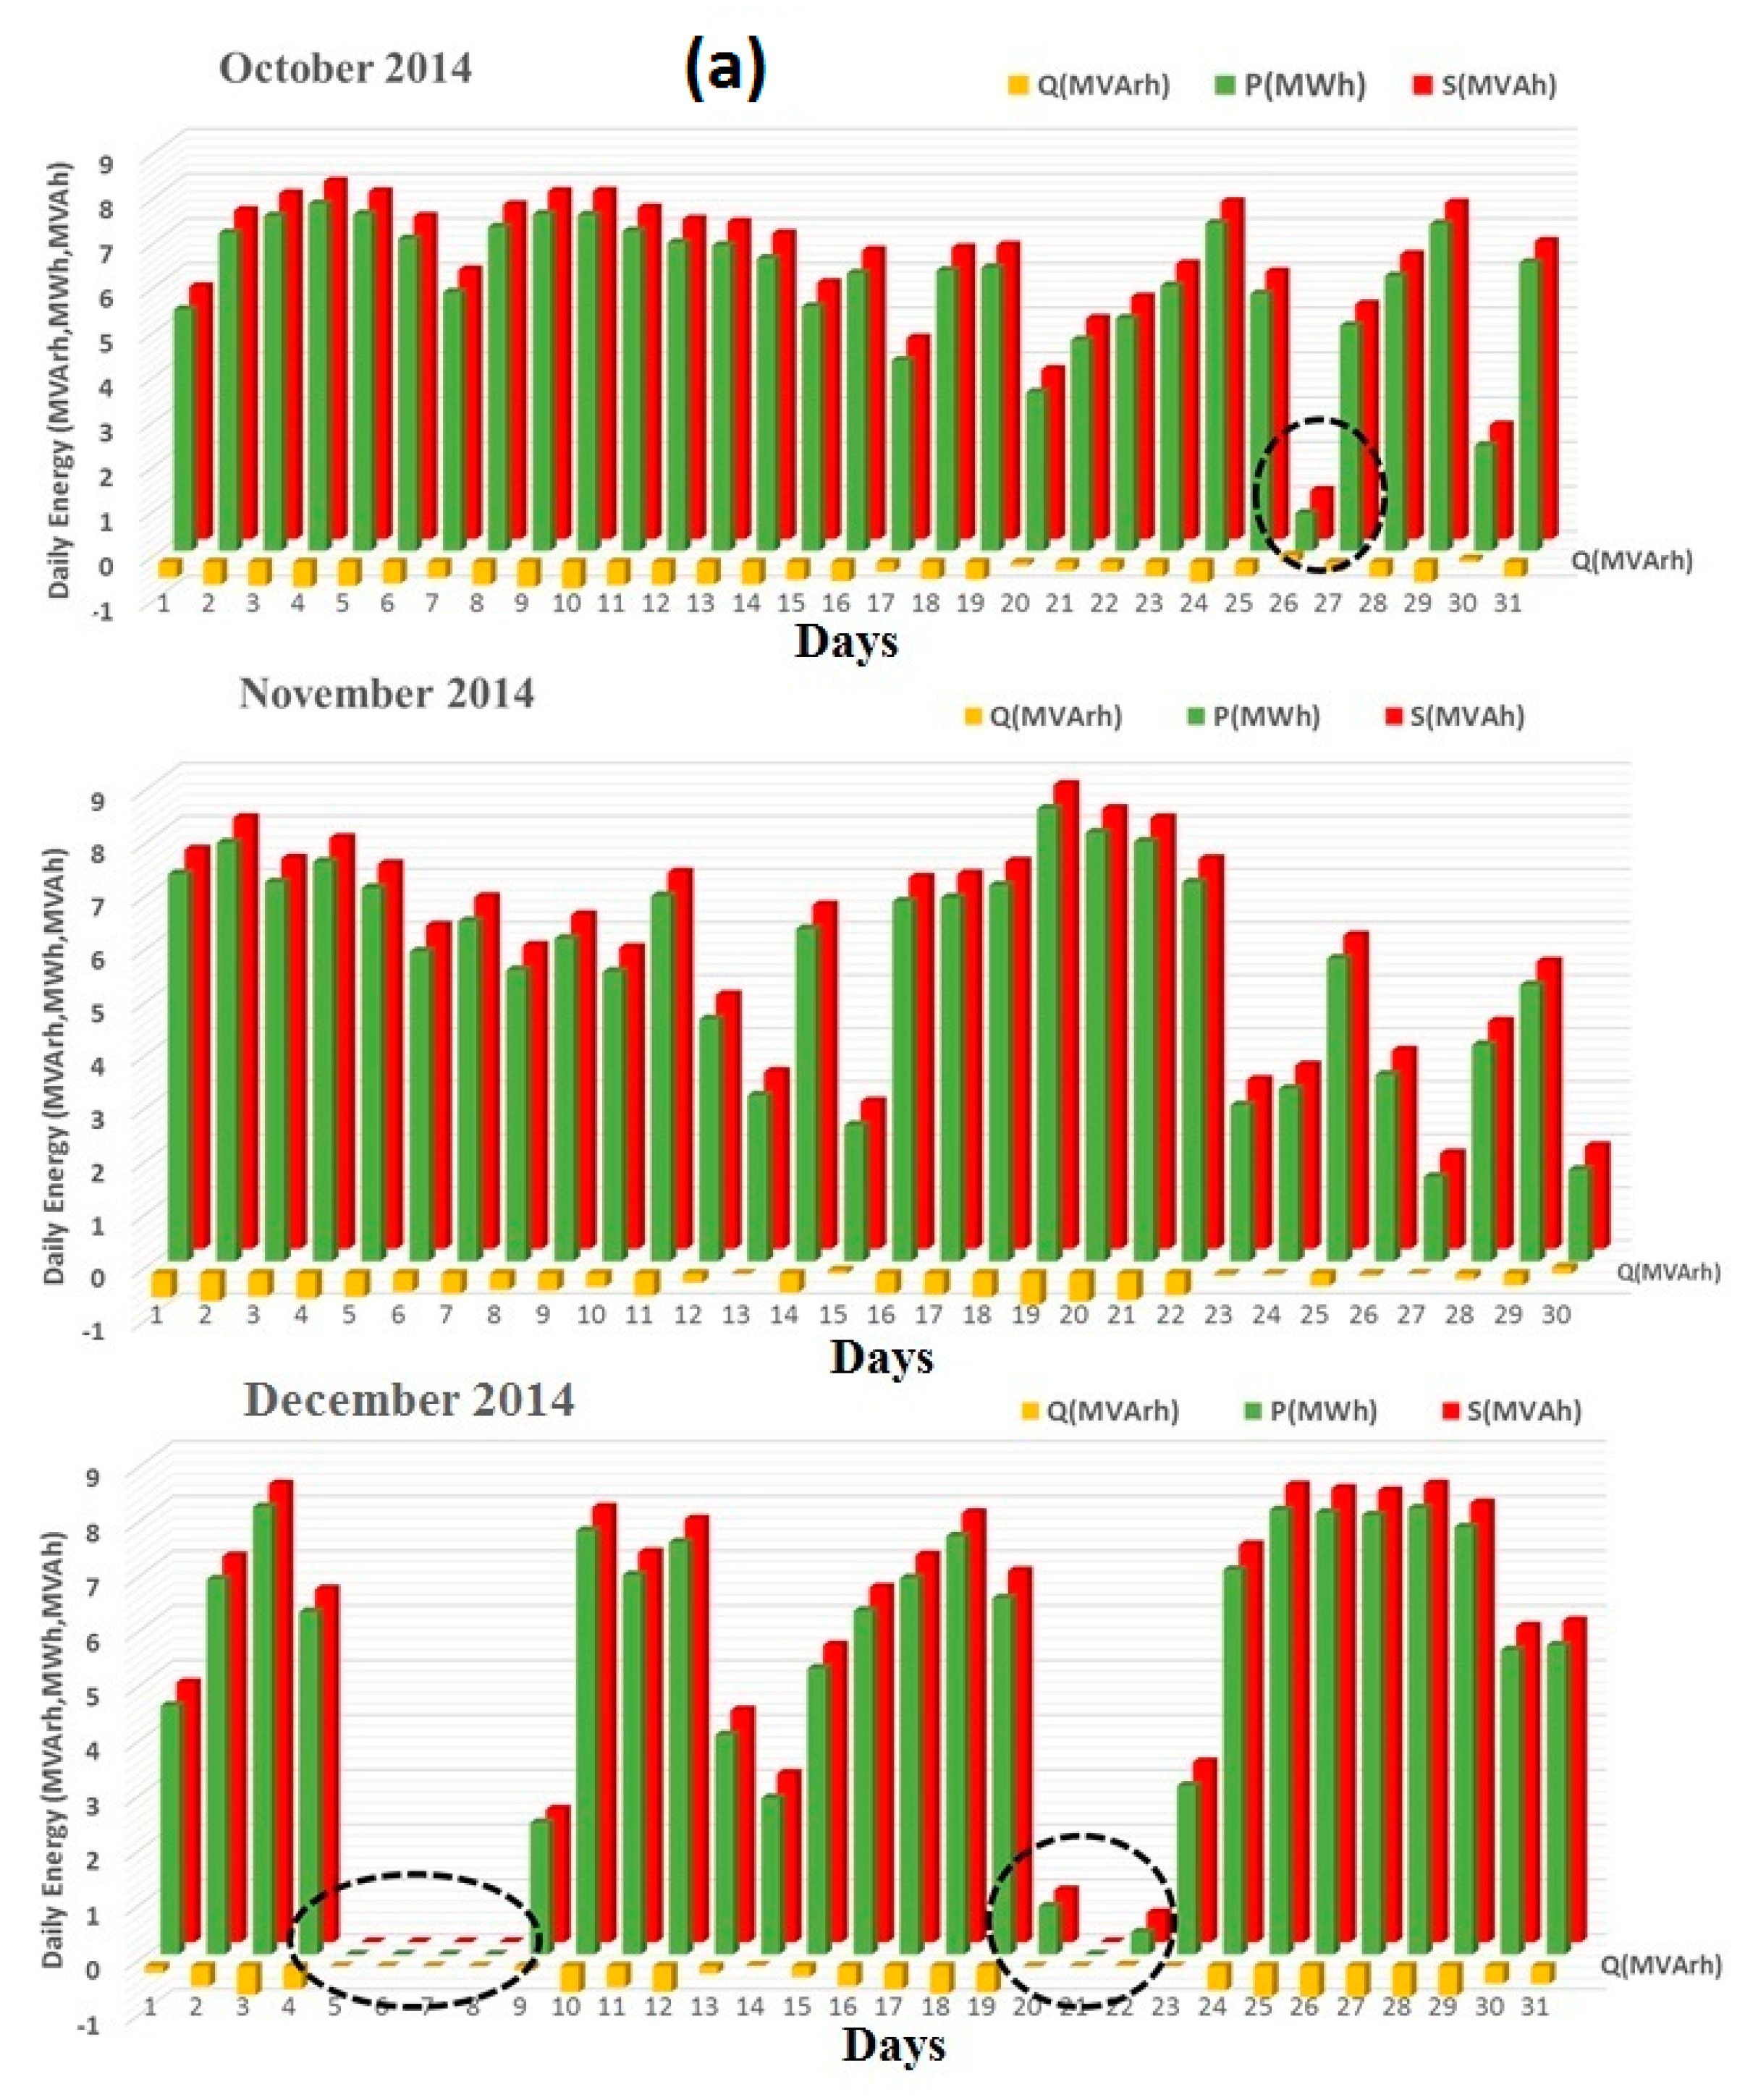
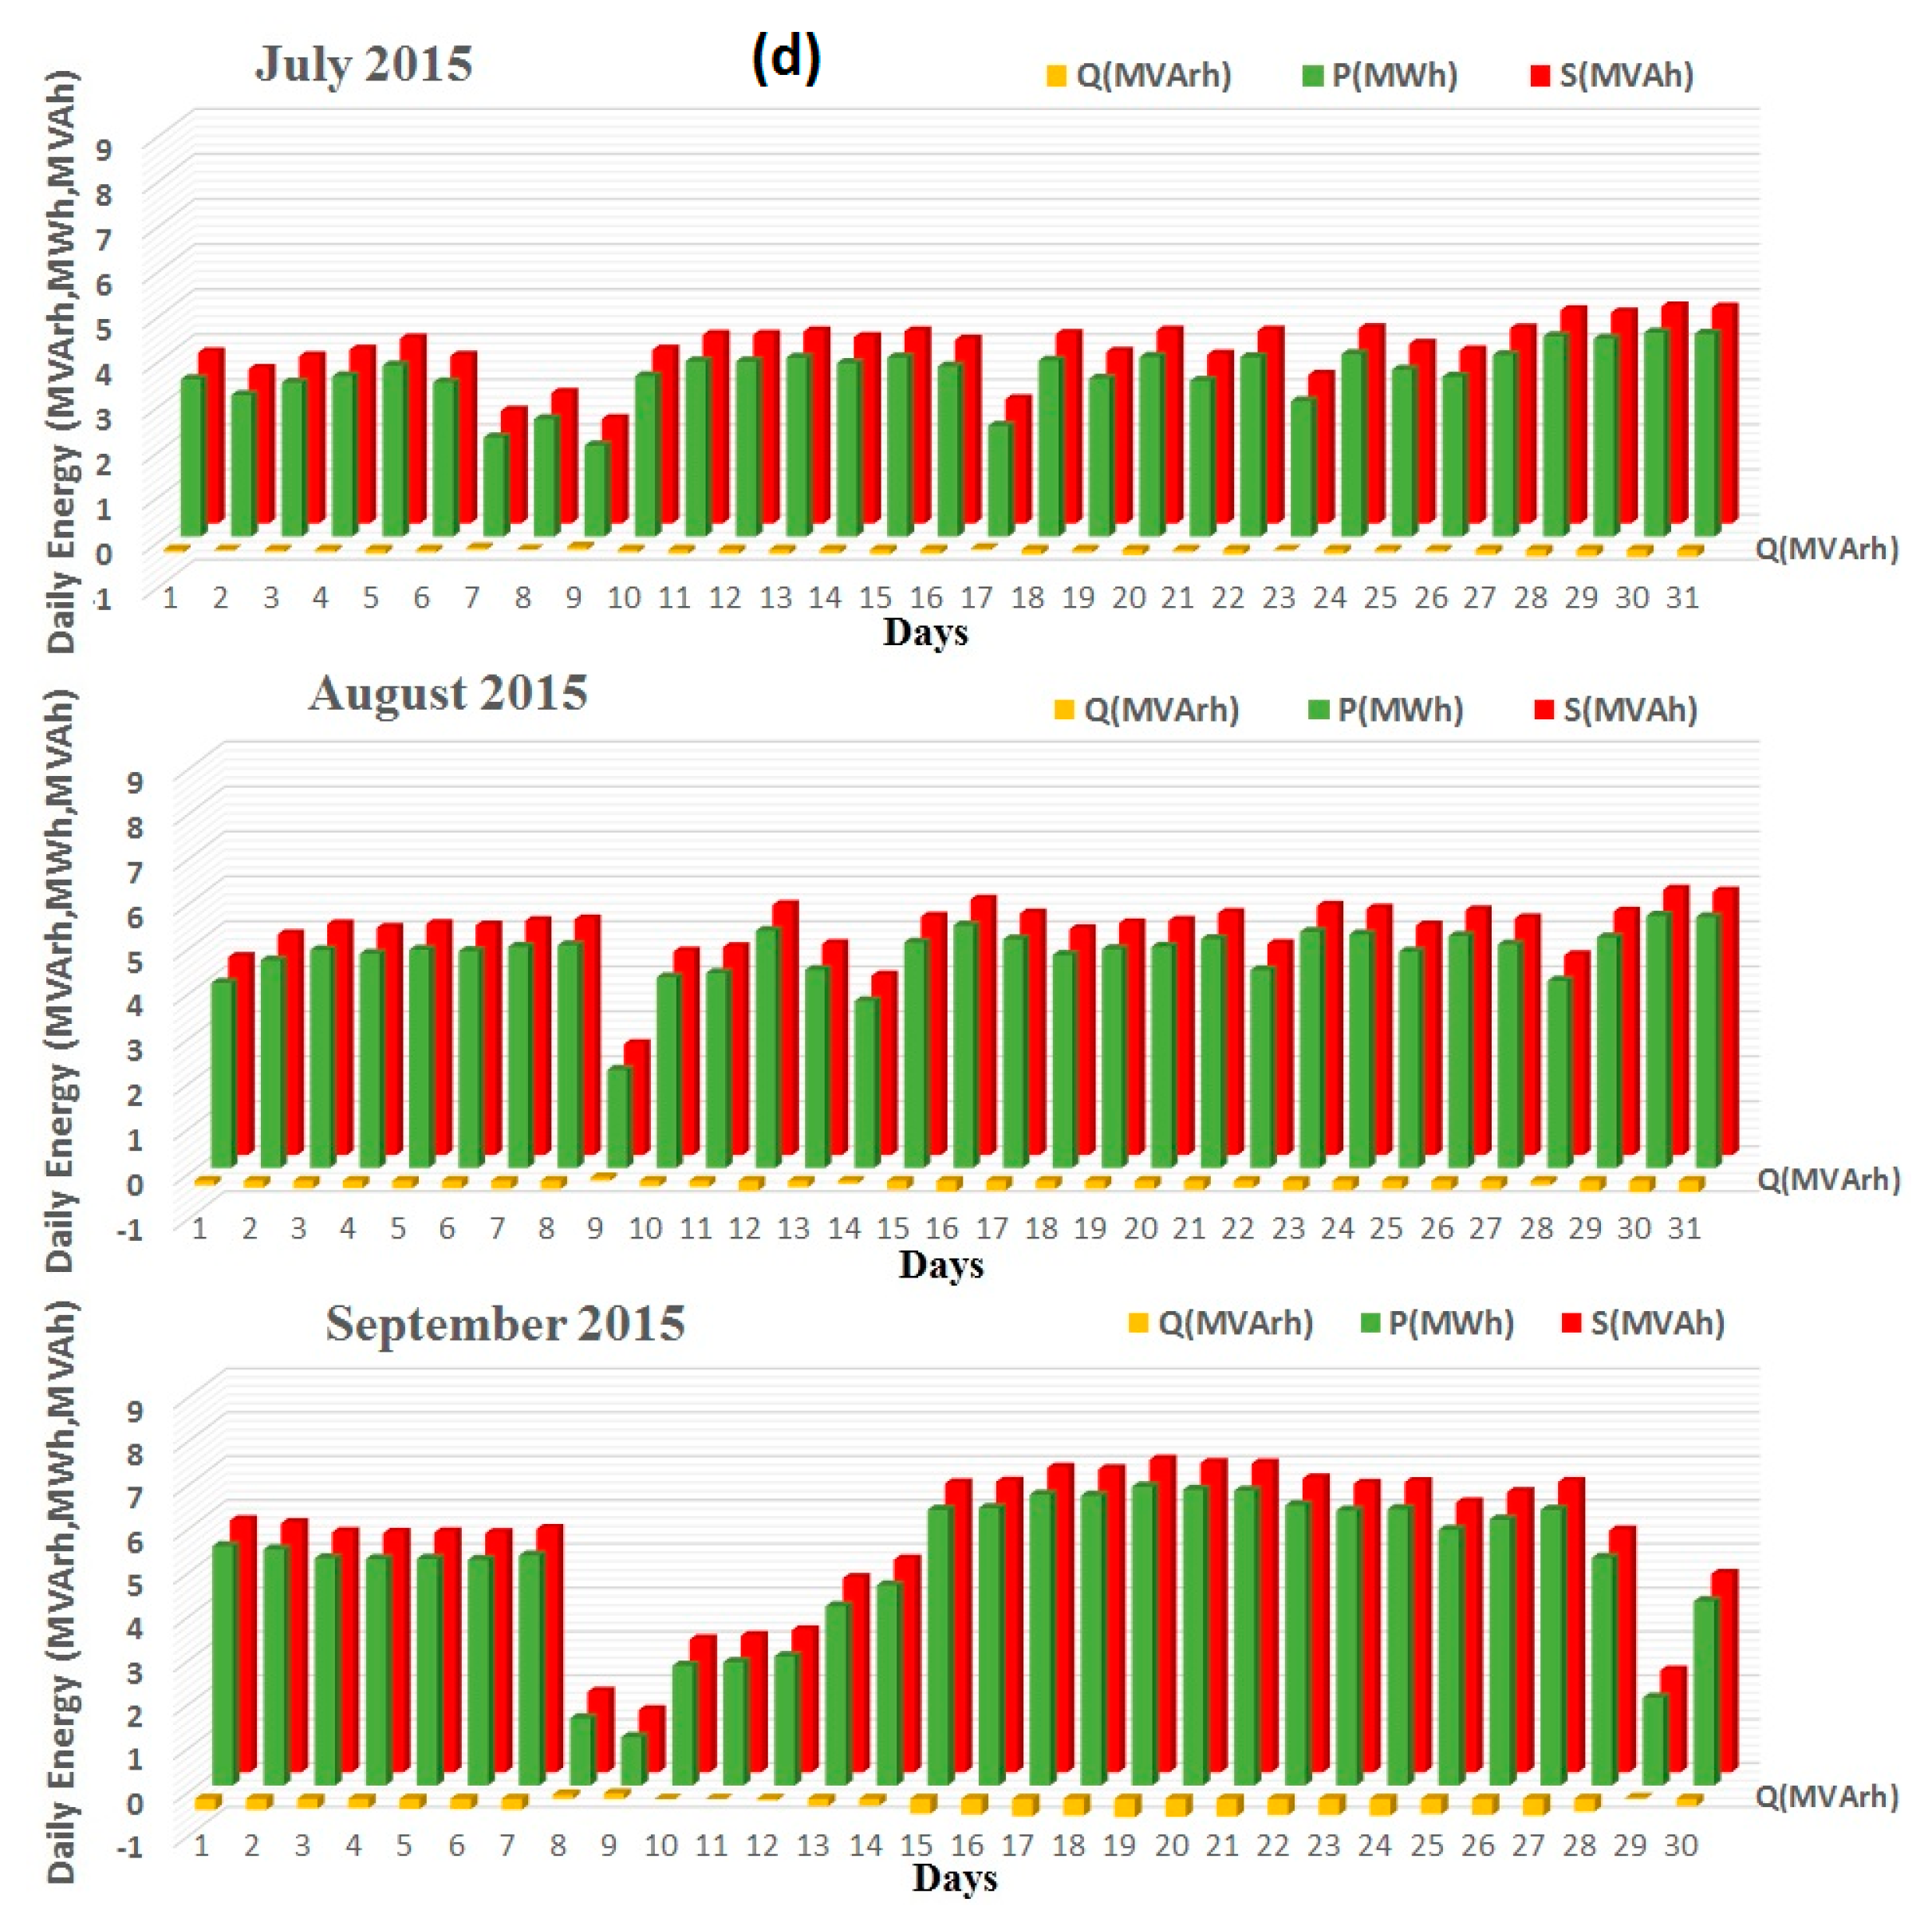
Figure 20 shows daily-accumulated energy (in MWh, MVArh and MVAh) measured for the period from October 2014 to September 2015.
As illustrated in
Figure 20, black dashed circles indicate days of data lost due to maintenance (5–8, 21 and 22 December 2014, just 1.6% of the observed period) and/or generation far below the expected (26 October 2014 and 1 April 2015, 1% of the observed period). For the one-year monitoring, the PV system presented a generation of 4.83 MWh/day, totalizing 1761 MWh over the period, resulting in an annual average productivity (annual yield (Y
F)) of 1240 kWh/kWp (with daily mean Y
F of 3.40 kWh/kWp), an annual average capacity factor (CF) about 14%.
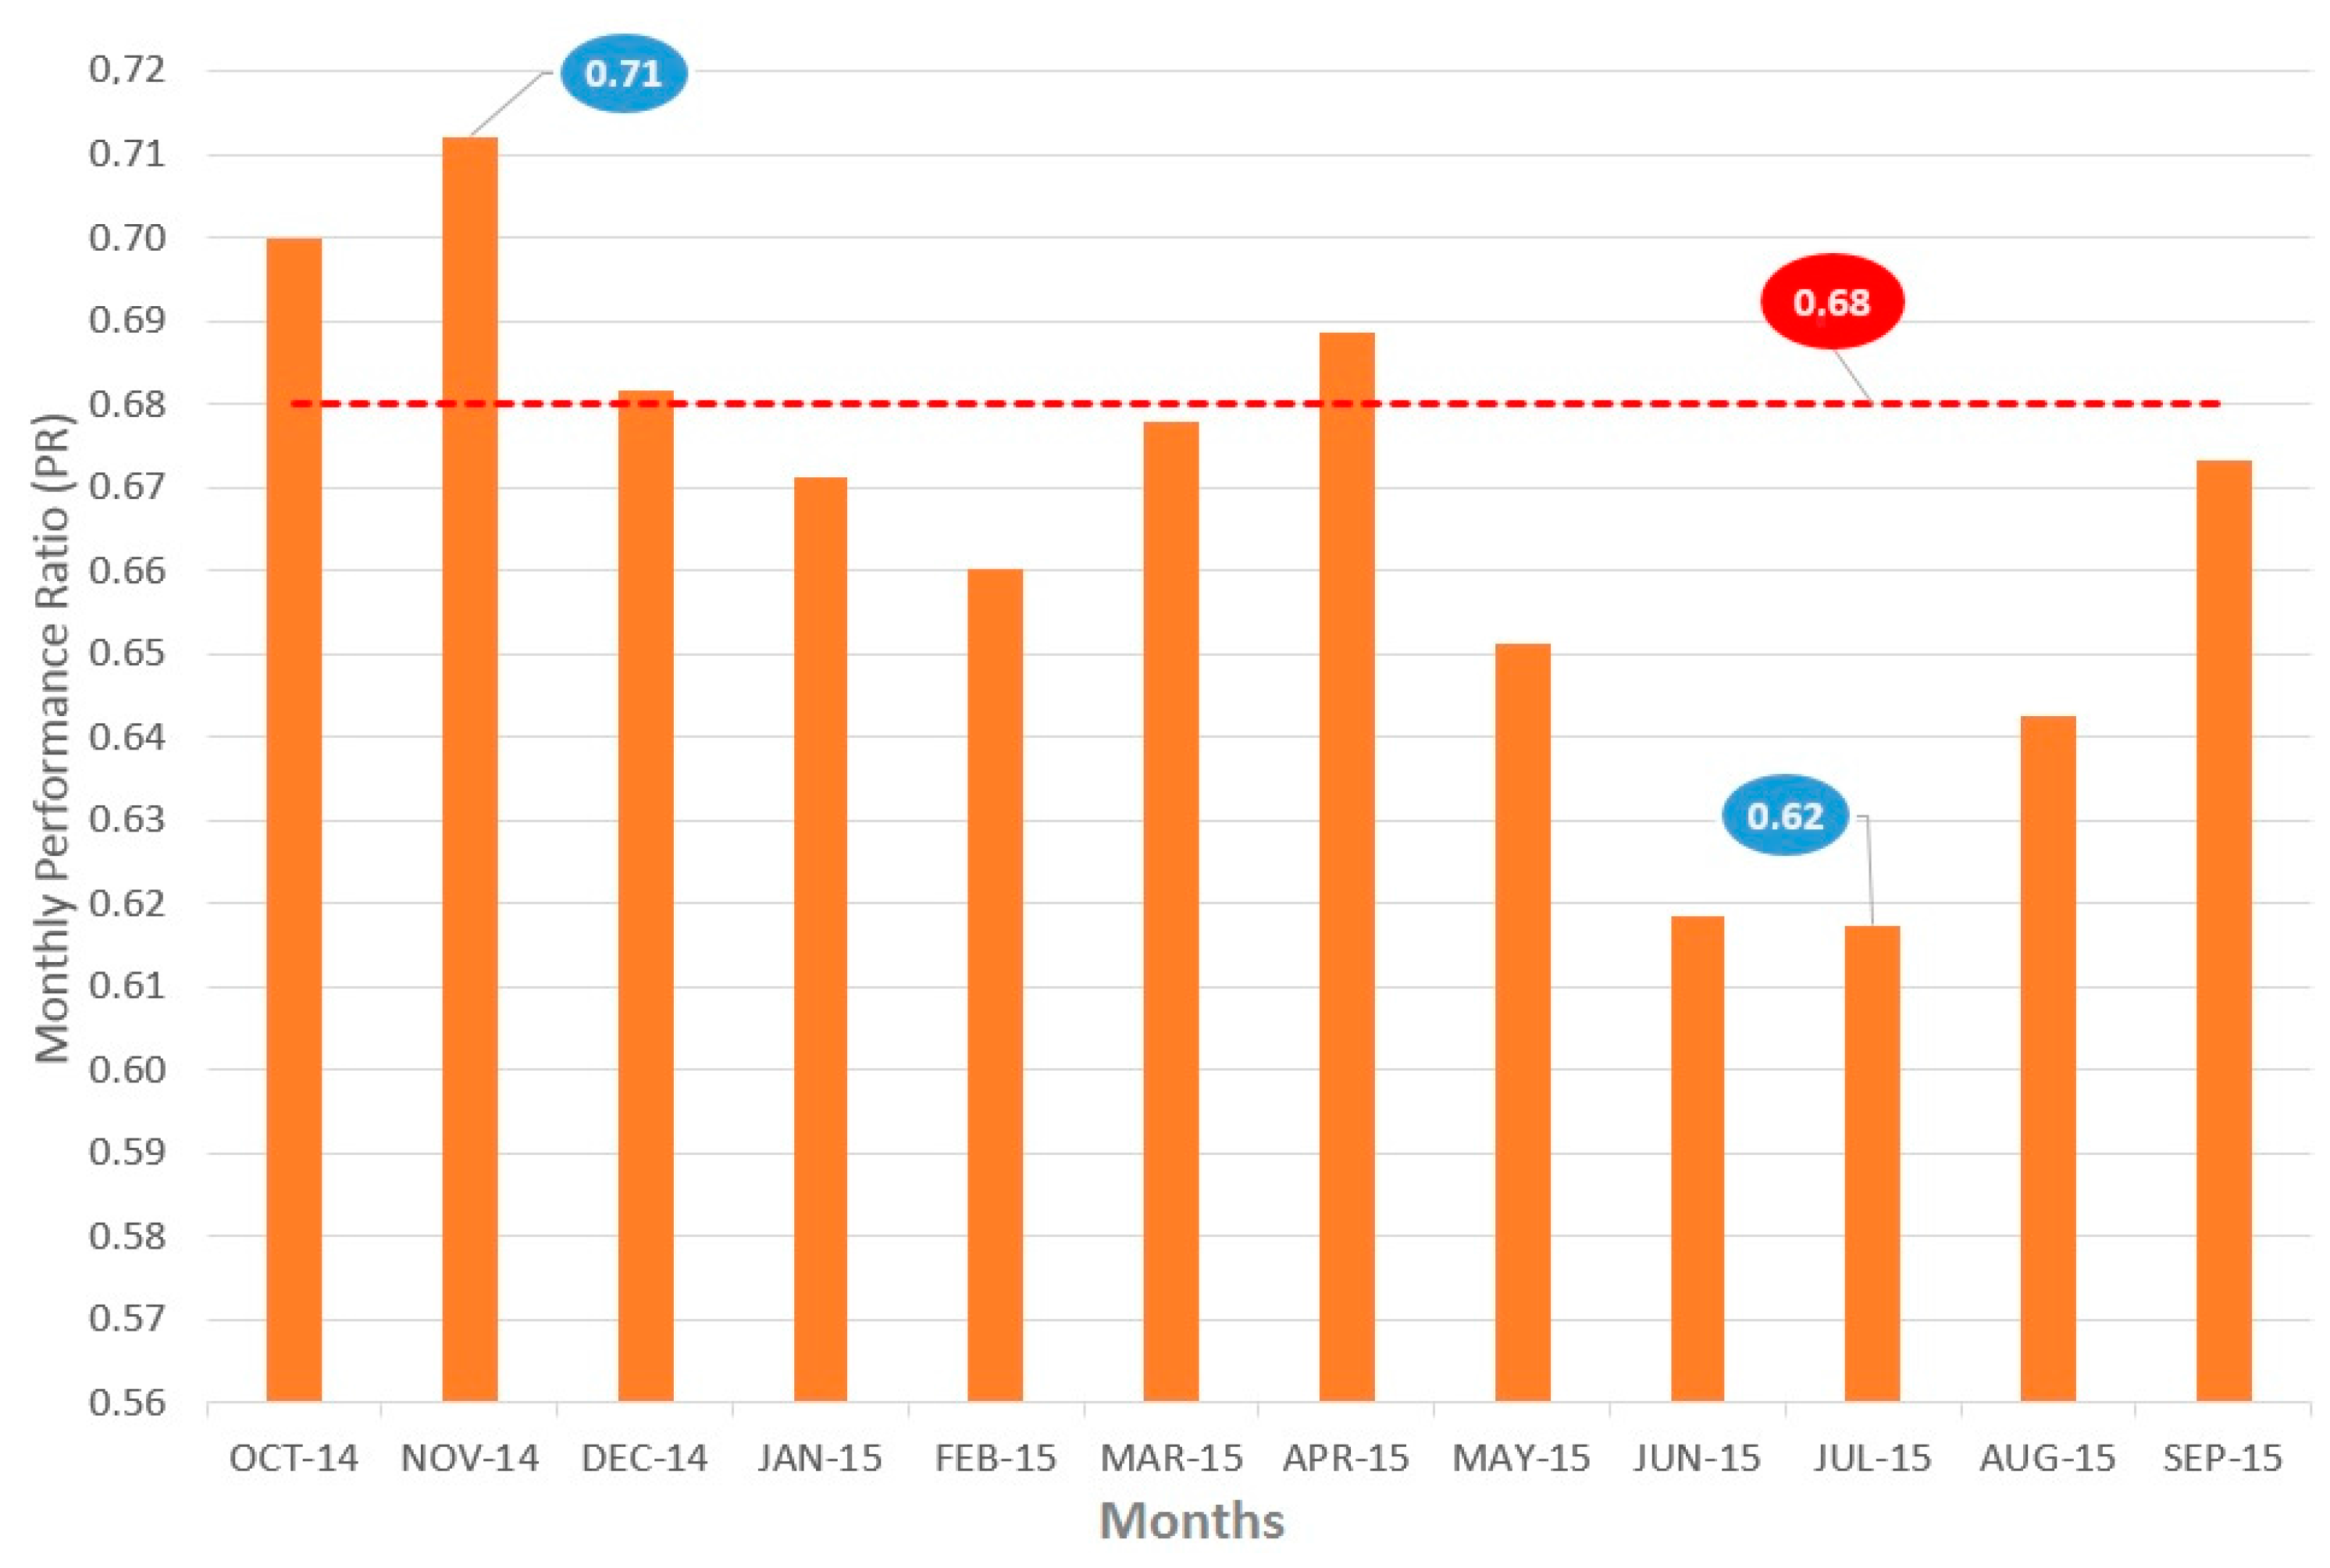
Figure 21 presents the average performance ratio (PR) for all the monitored months.
Figure 21 shows that the lowest values of PR happen in months with less solar radiation, hence low PV productivity, while reaches higher values in sunnier months. To calculate this parameter, the global irradiation data from the INMET meteorological station, described in the previous section, and PR equation defined in [
24] were used. It is possible to notice that system’s PR varies between 0.71 and 0.62 (blue circles) over the year, presenting an annual average of 0.68 (red dash line) for the 2014–2015 period.
In order to compare the energy results found by monitoring at PV power plant, a set of simulations using PVsyst software was performed [
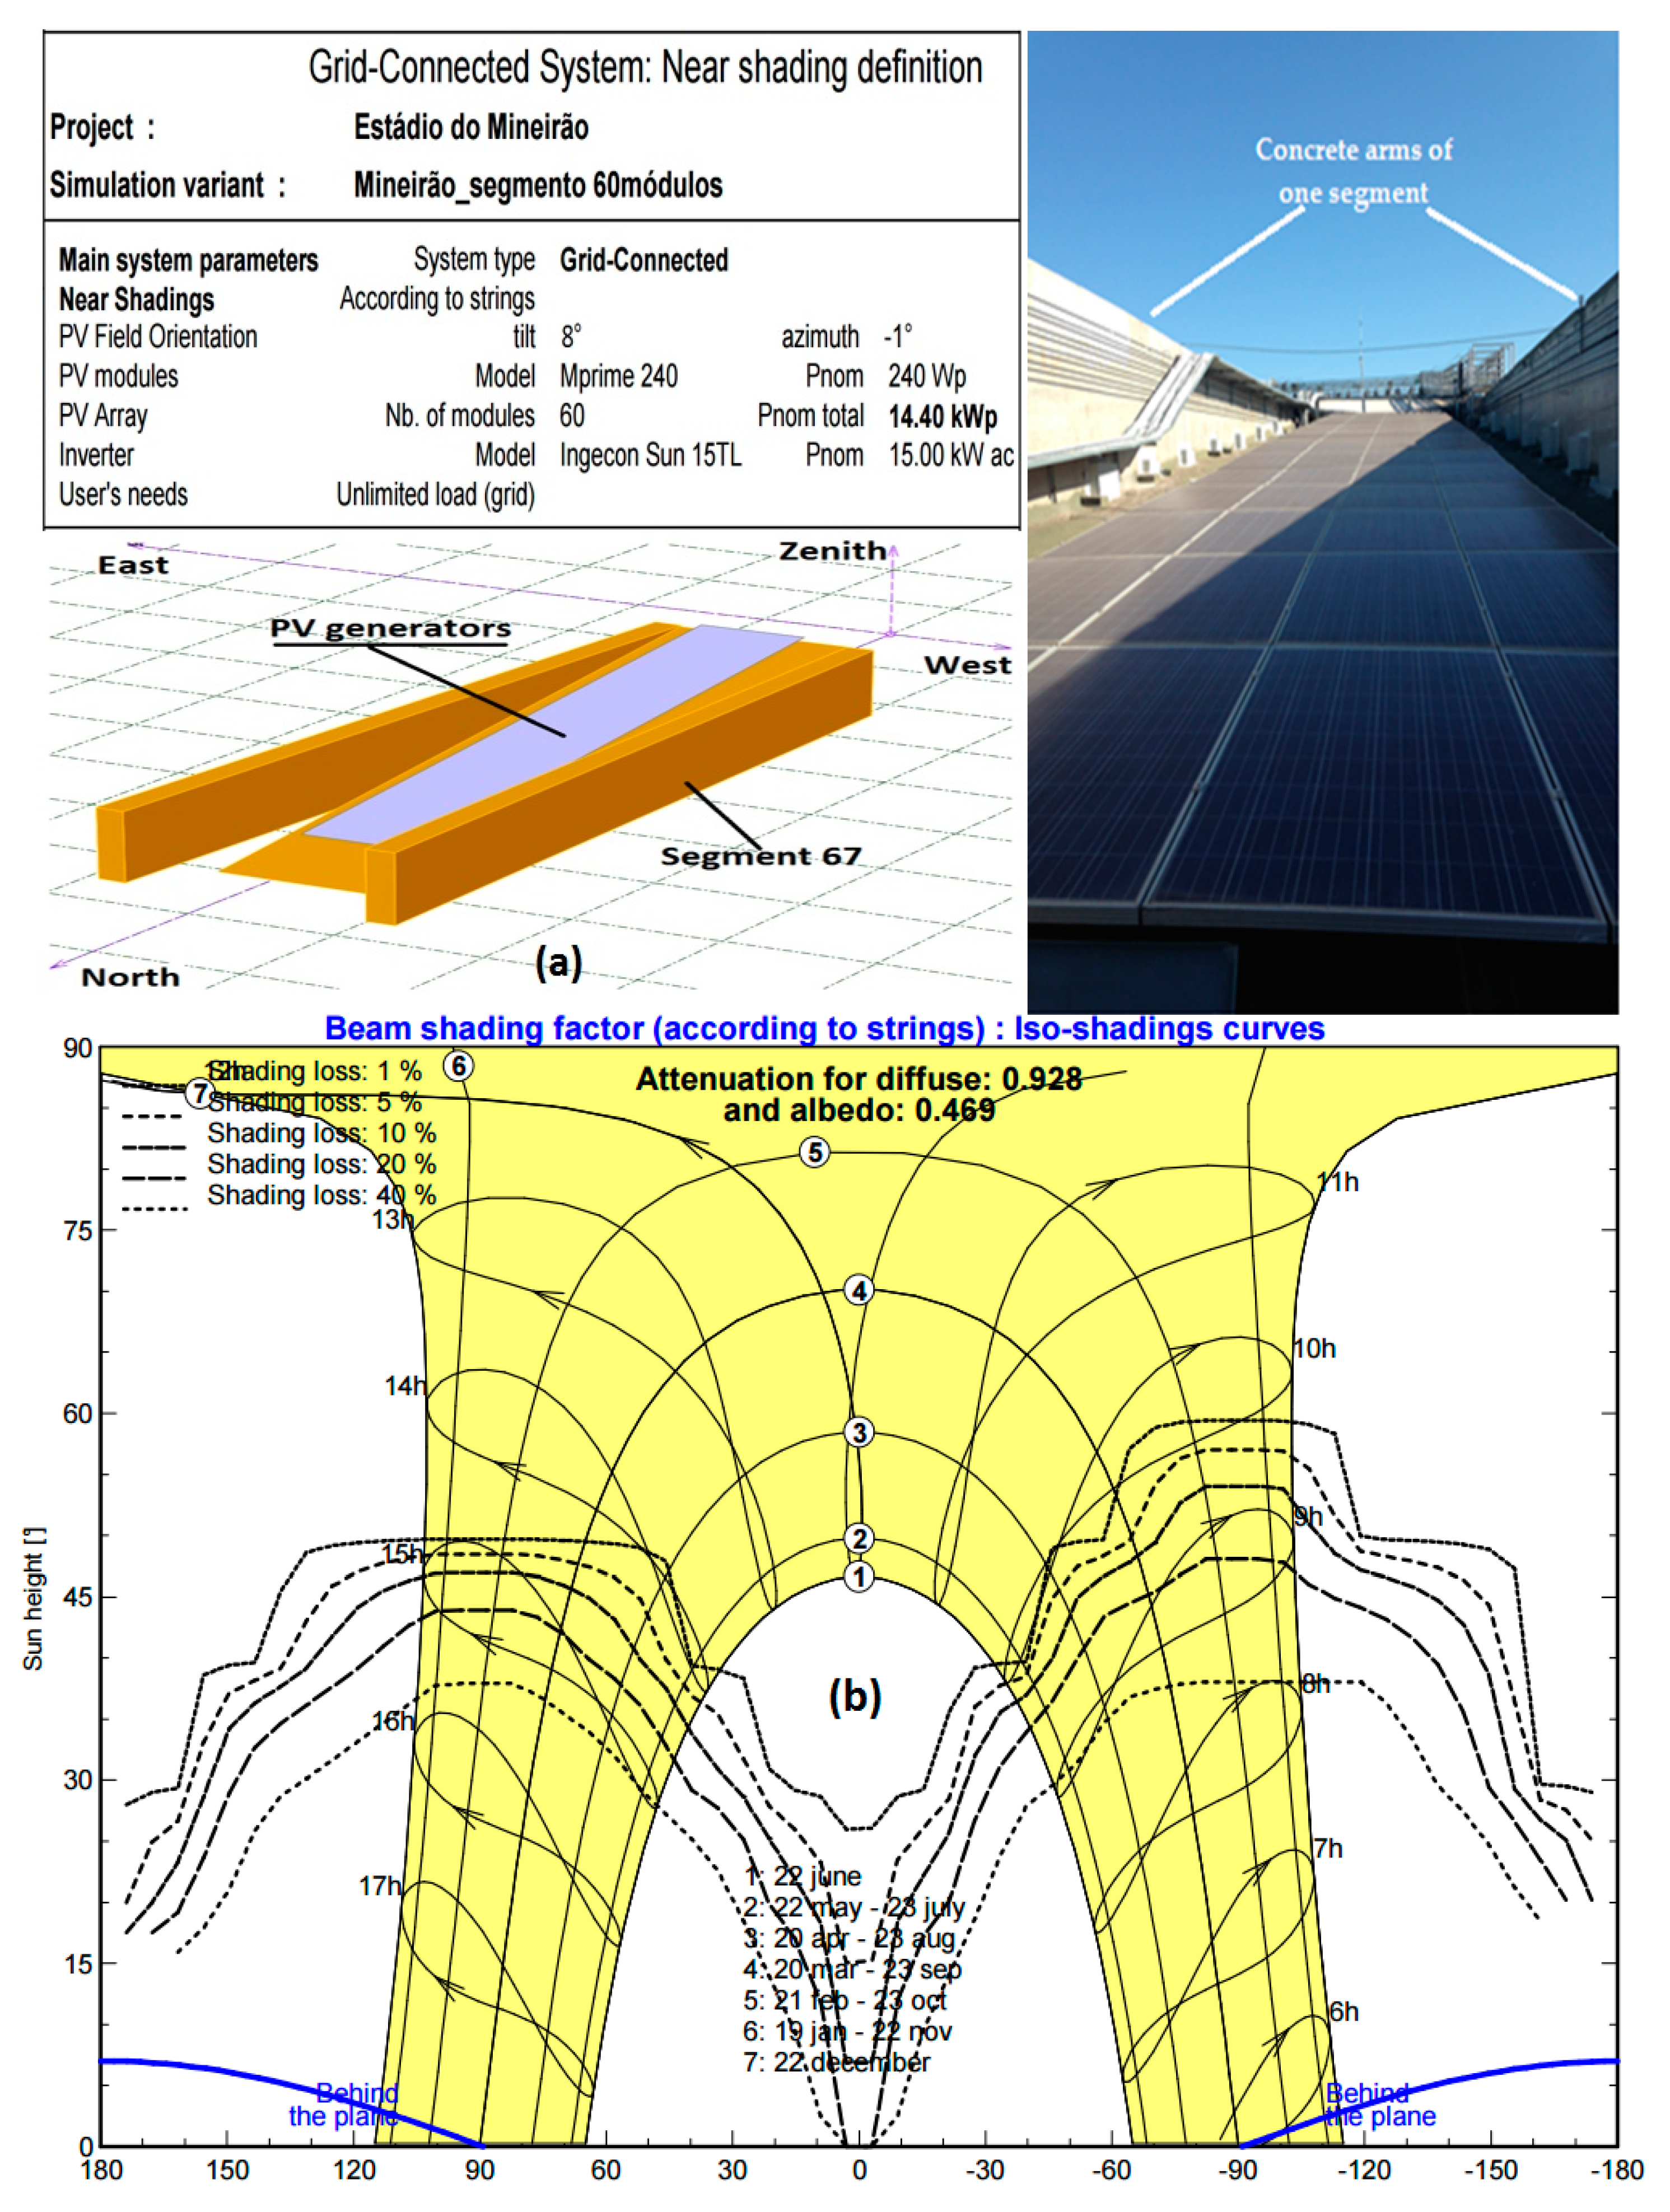
33]. All 88 segments were 3D modeled in software and for each one, losses due to shading were taken into account for energy production estimation. As an example,
Figure 22a presents data input/3D drawing in PVsyst for PV generators at segment 67, which is orientated to the north, as well as a photo.
Figure 22b presents the software generated shading diagram for this segment.
As
Figure 22a shows, shading over PV modules is causing by concrete arms of the segment. Shadows are representative in the morning (beginning around 8:00 a.m., with 40% shading loss, and ending about 9:30 a.m., with 1% shading loss) and late afternoon (beginning approximately 3:00 p.m., with 5% shading loss, and ending about 4:00 p.m., with 40% shading loss) throughout the year, as demonstrated by the shading diagram in
Figure 22b. For segment 67, which has 60 PV modules (14.4 kWp), the energy simulations results, made by PVsyst for PV generators, were: 16,641 kWh/year, annual Y
F = 1156 kWh/kWp, CF = 13.4% and PR = 0.71. Considering all 88 segments of the PV power plant, the overall energy simulations results, according to [
33], were: 1610 MWh/year; Y
F = 1134 kWh/kWp, CF = 12.9% and PR = 0.72.
Table 1 summarizes the overall energy results for monitoring period and PVsyst simulations for Mineirão’s PV system.
As illustrated in
Table 1, the monitoring results were better compared to the PVsyst simulations. The results for annual energy produced, Y
F and CF with a relative difference for these energy metrics were about 8.6%, 10% and 8%, respectively.
For performance ratio (PR) parameter, PVsyst presented a better value (72%) compared to PR from monitoring, i.e., 68%. However, if an annual reference irradiation of 5.18 kWh/m2 per day (the same utilized in monitoring PR) is considered for calculating PVsyst performance ratio, the new result for PVsyst PR will be 67% and the relative difference to monitoring PR will be just 1% greater. This demonstrates that it is important to use the same reference parameters when comparing reality to simulation to calculate energy metrics in a PV system.
According to
Figure 20, the best generation period occurs from September to February, months with higher incidence of solar radiation, as illustrated before in
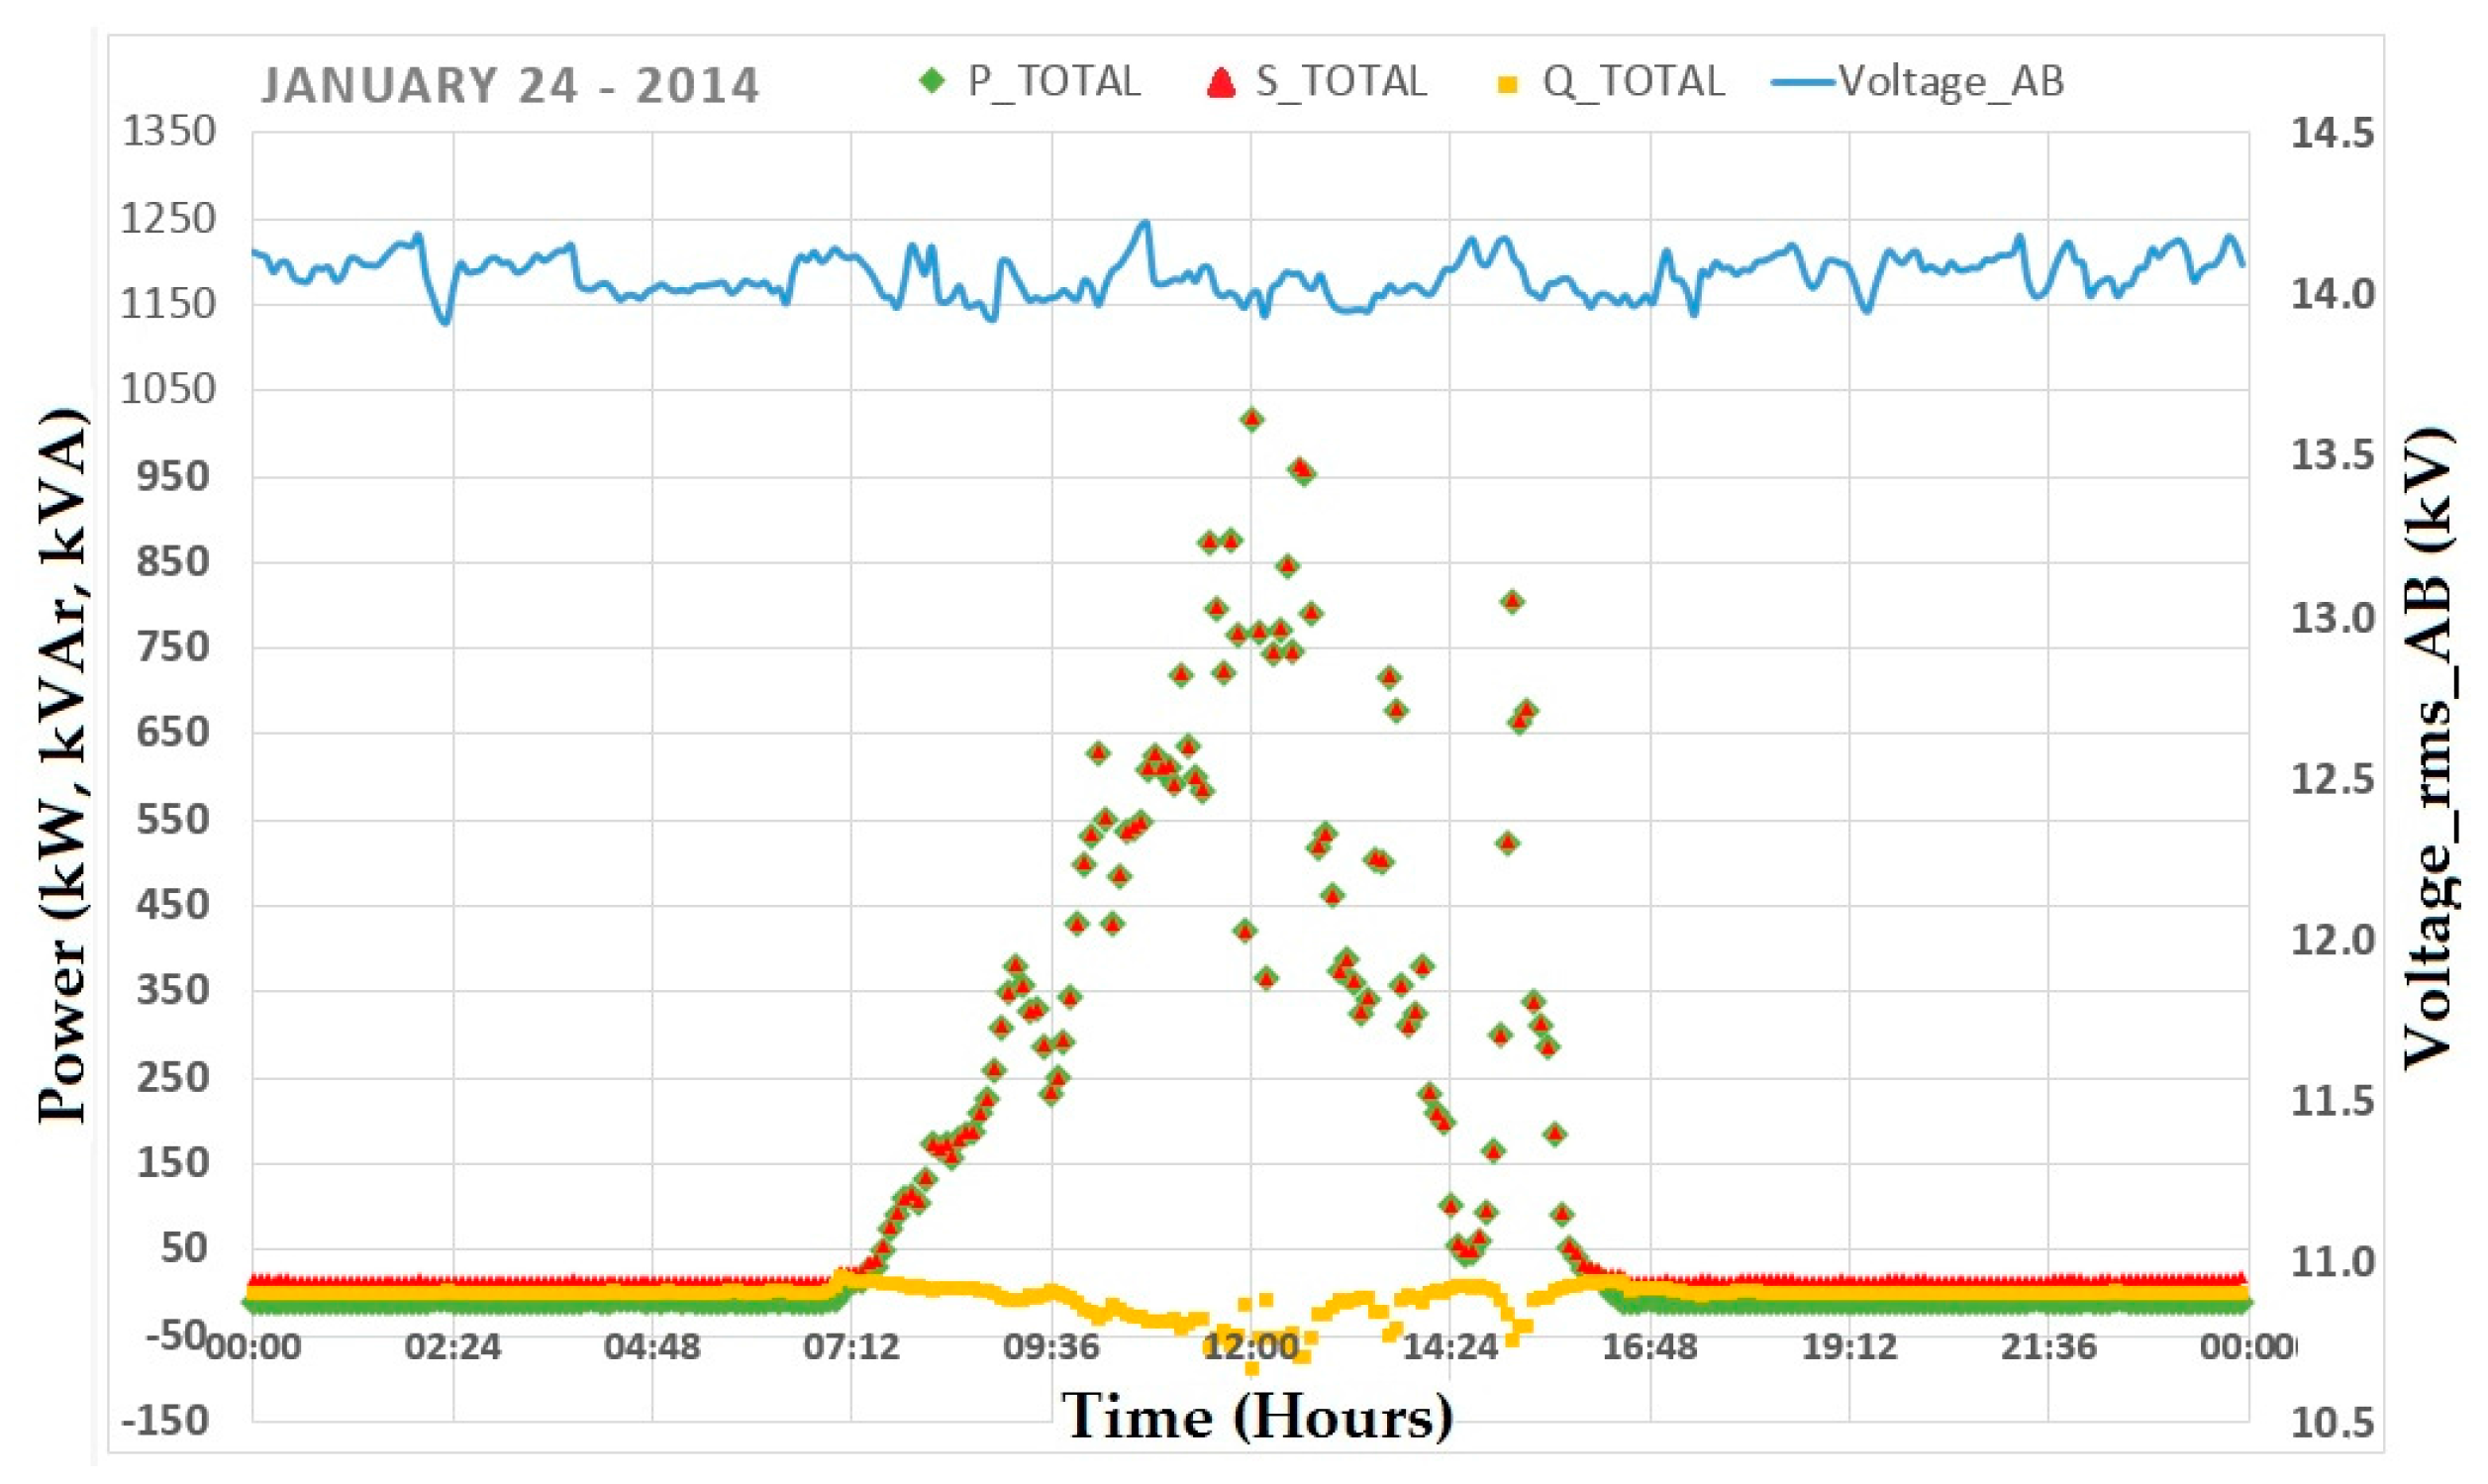
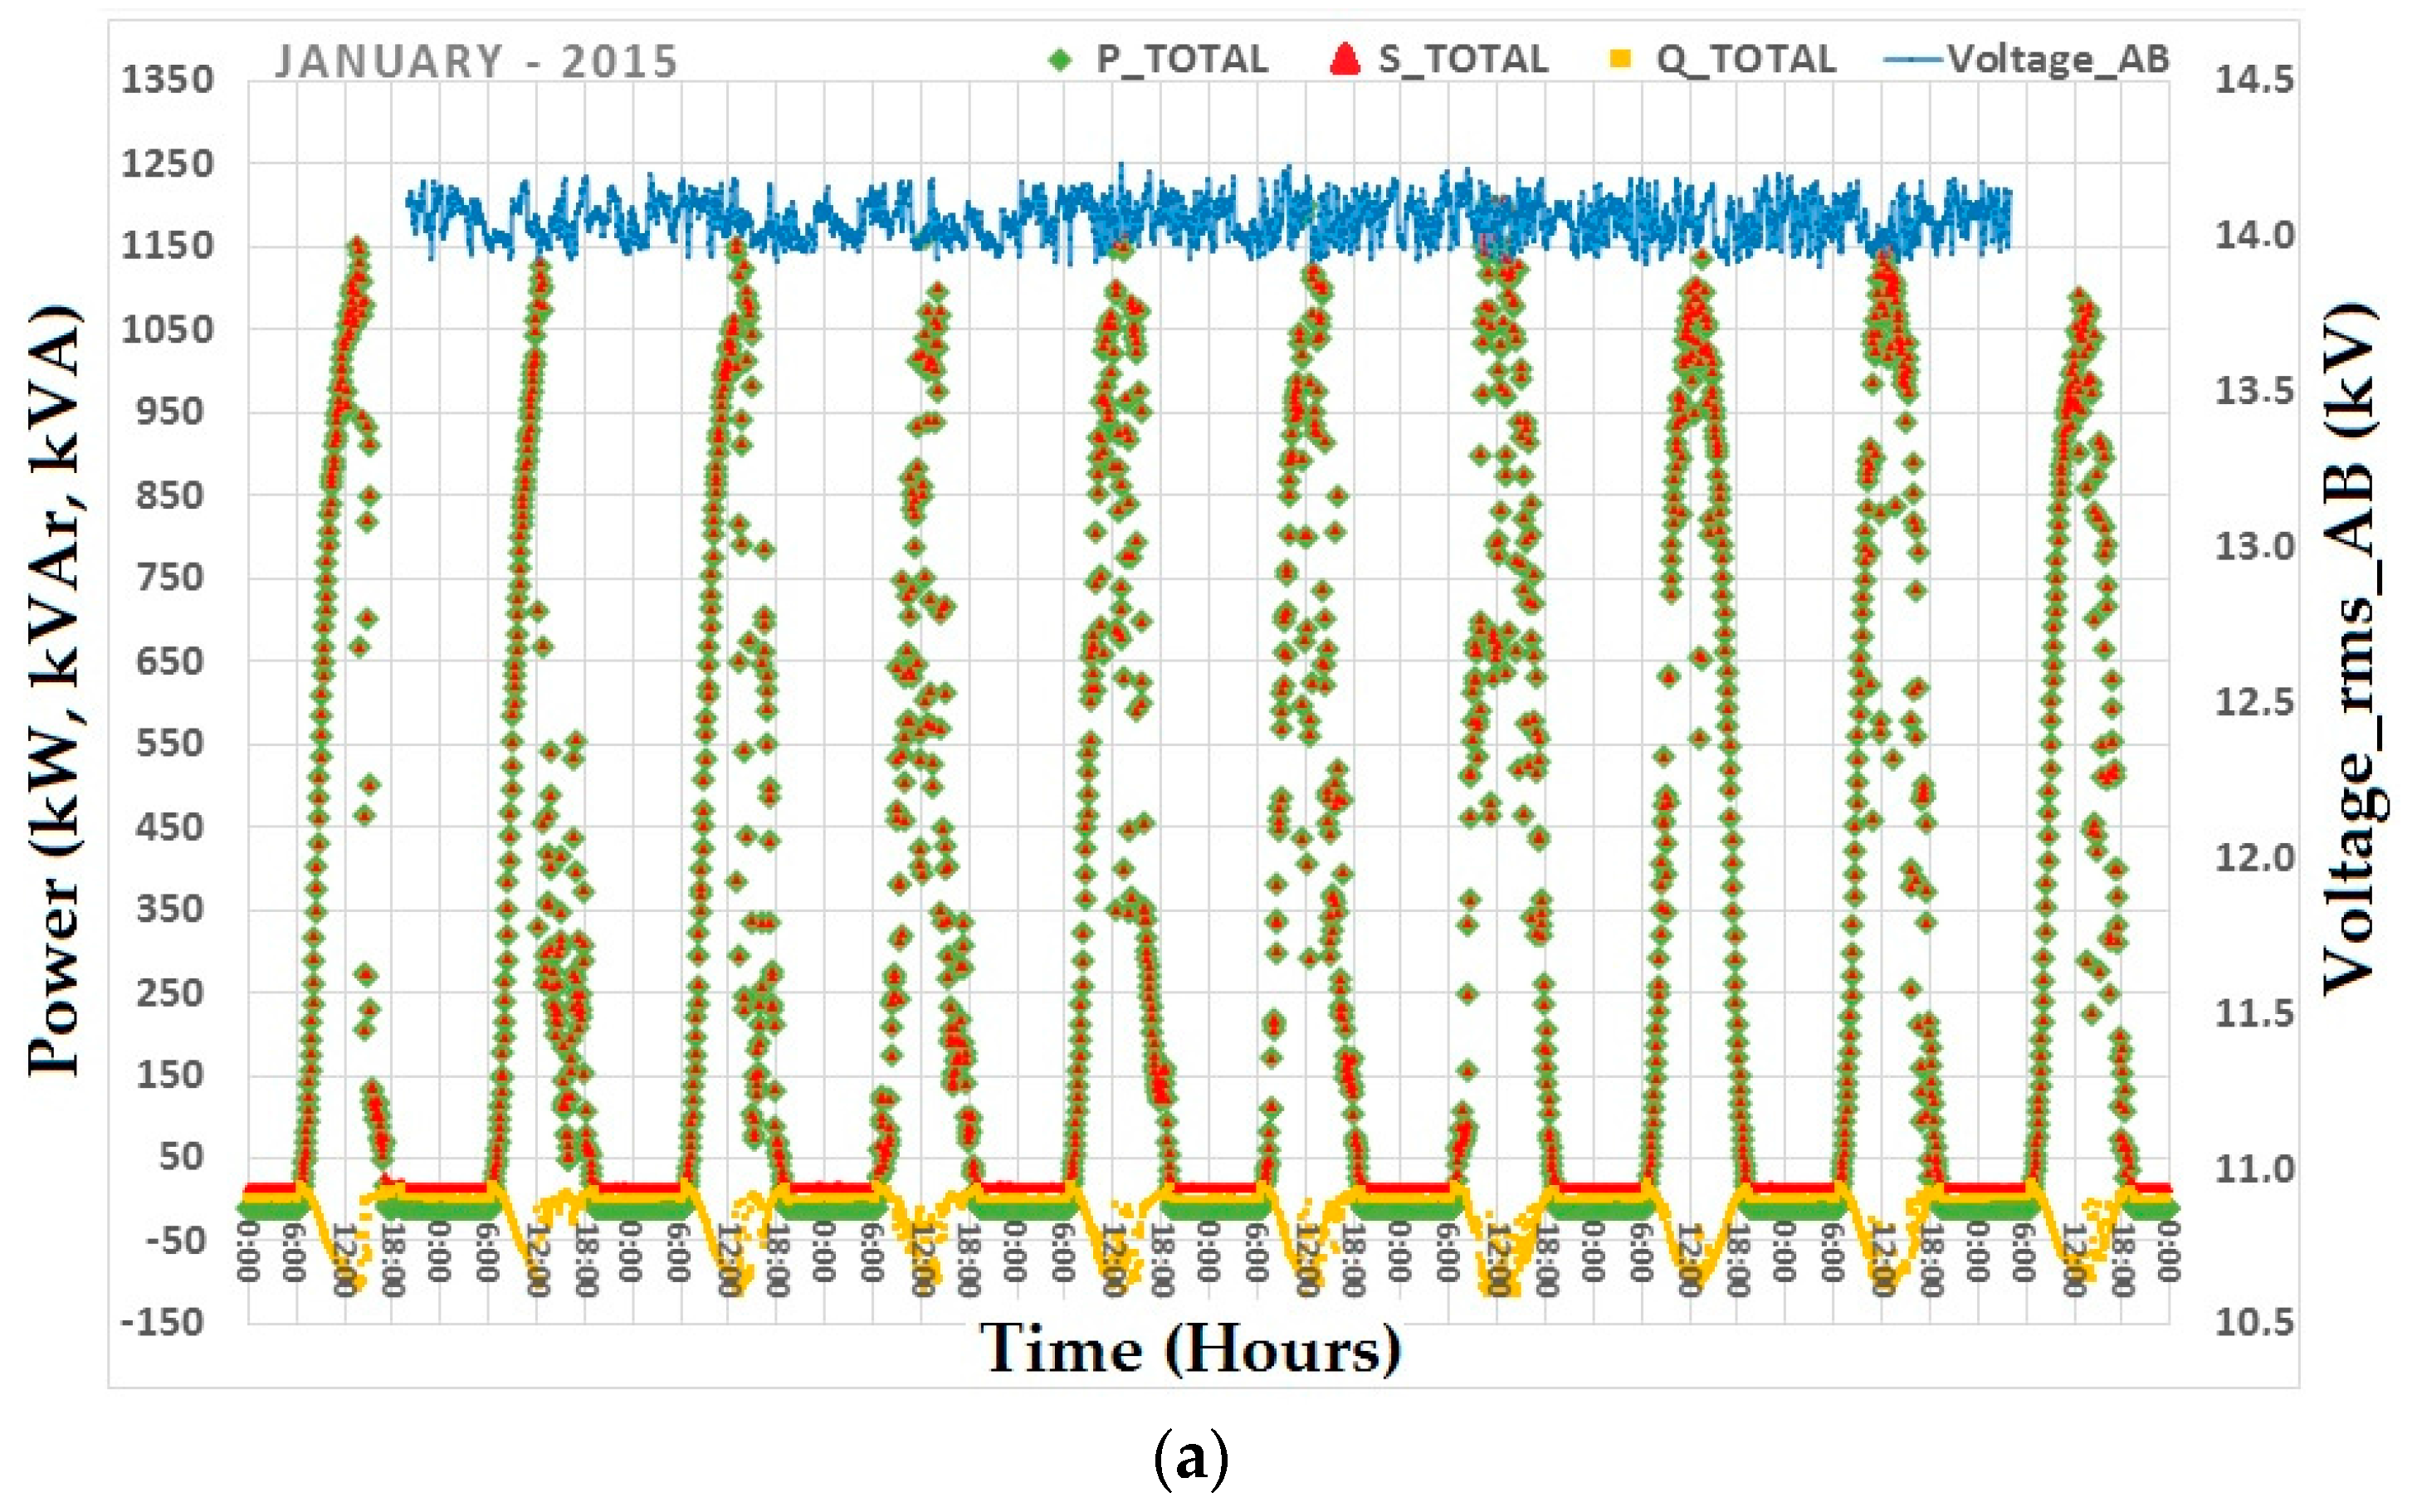
Figure 12. For the entire monitored period, reactive power (Q) is always negative, due to plant inductive power factor and is always related to active power (P) produced throughout day. As an example,
Figure 23a shows this behavior for active (green diamond, P_Total), reactive (yellow square, Q_Total), apparent power (grey triangle, S_Total) and line voltage (blue line) over 1–10 January 2015 (powers are expressed in kW, kVAr and kVA and voltage in kV, as presented in the secondary axis (right)).
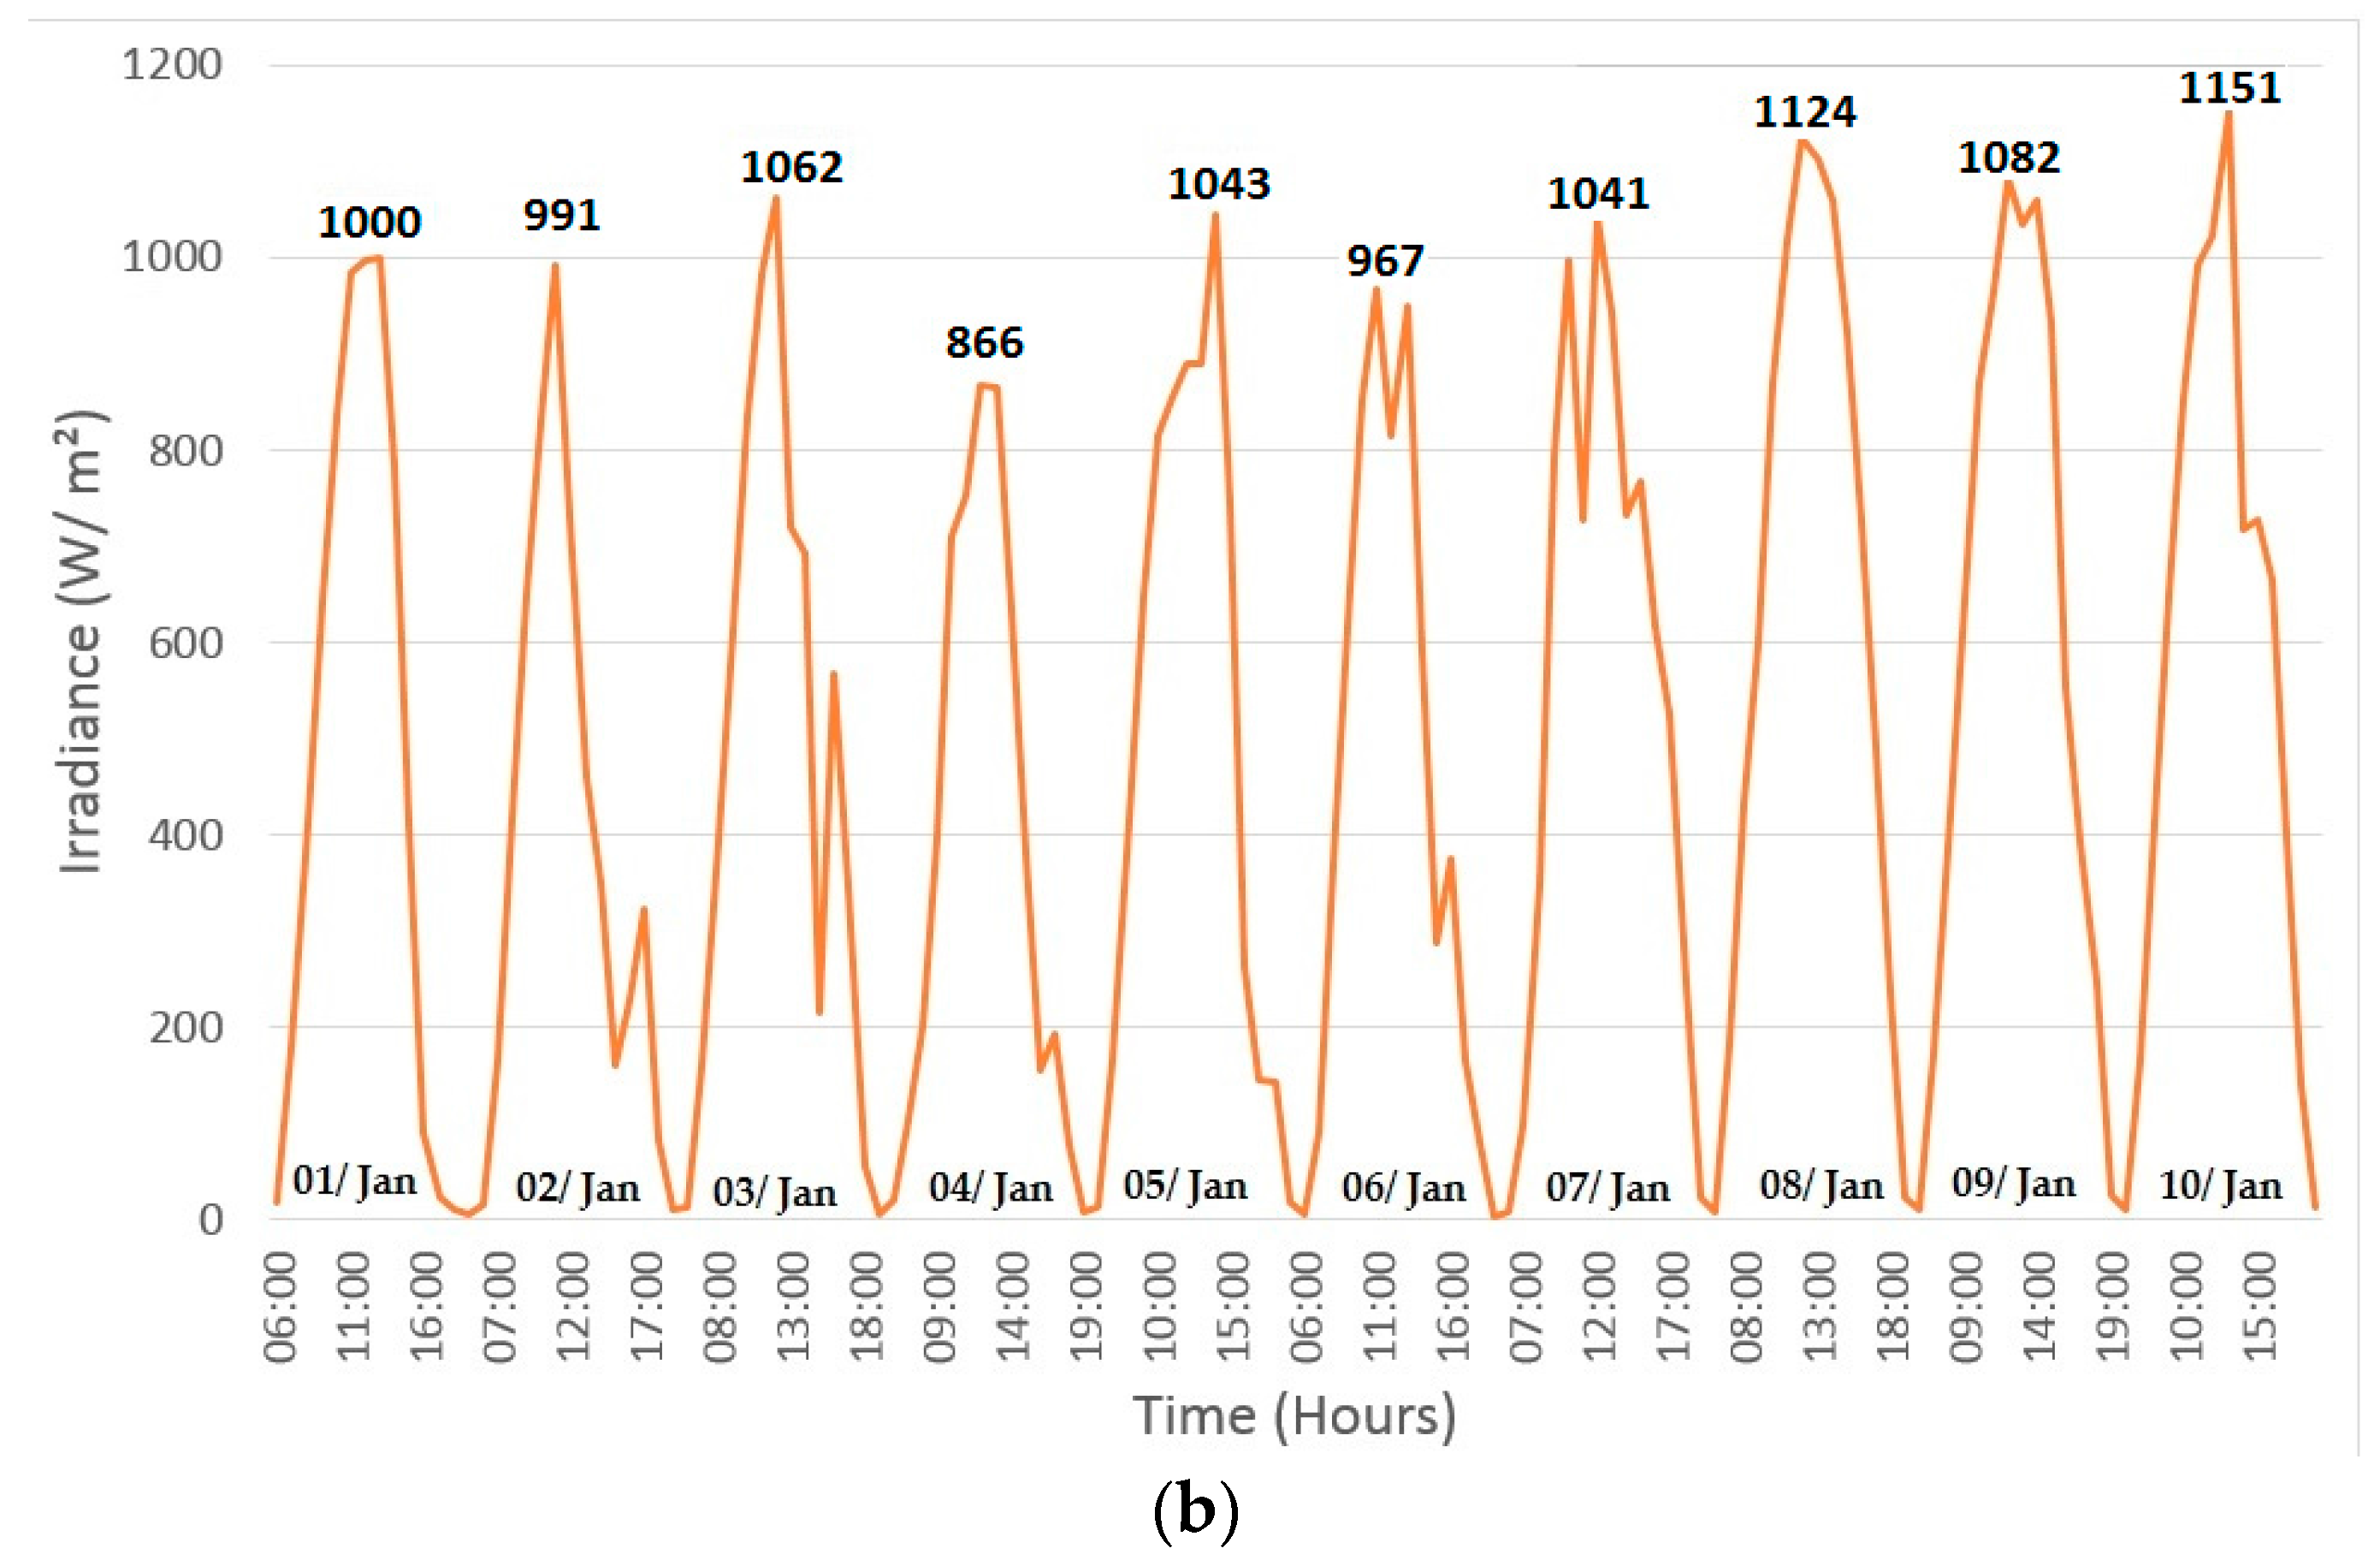
Figure 23b shows the irradiance profile (orange line), measured by INMET station for the same period.
As illustrated in
Figure 23a, active power (P) is close to apparent power (S) indicating a low reactive demand at the measurement point. In
Figure 23a, the increase of photovoltaic generation throughout the day increases consumption of reactive power. As the measurement point is located after transformers, one factor can be raised to explain the behavior of reactive power consumption: as the transformer load increases, there is a natural increased consumption of reactive power, which leads to a more intense inductive behavior of the transformer.
Figure 23b presents the very good irradiance profile for the first 10 days of January 2015, which are correlated directly with the solar PV plant generation and power. On these days, irradiance reached values between 866 W/m
2 (lowest) to 1151 W/m
2 (highest) with average of 1033 W/m
2 and the PV system had an average energy production of 6.55 MWh/day with a daily final yield of 4.61 kWh/kWp and a PR = 0.70 (with average nominal power of 1.14 MW).
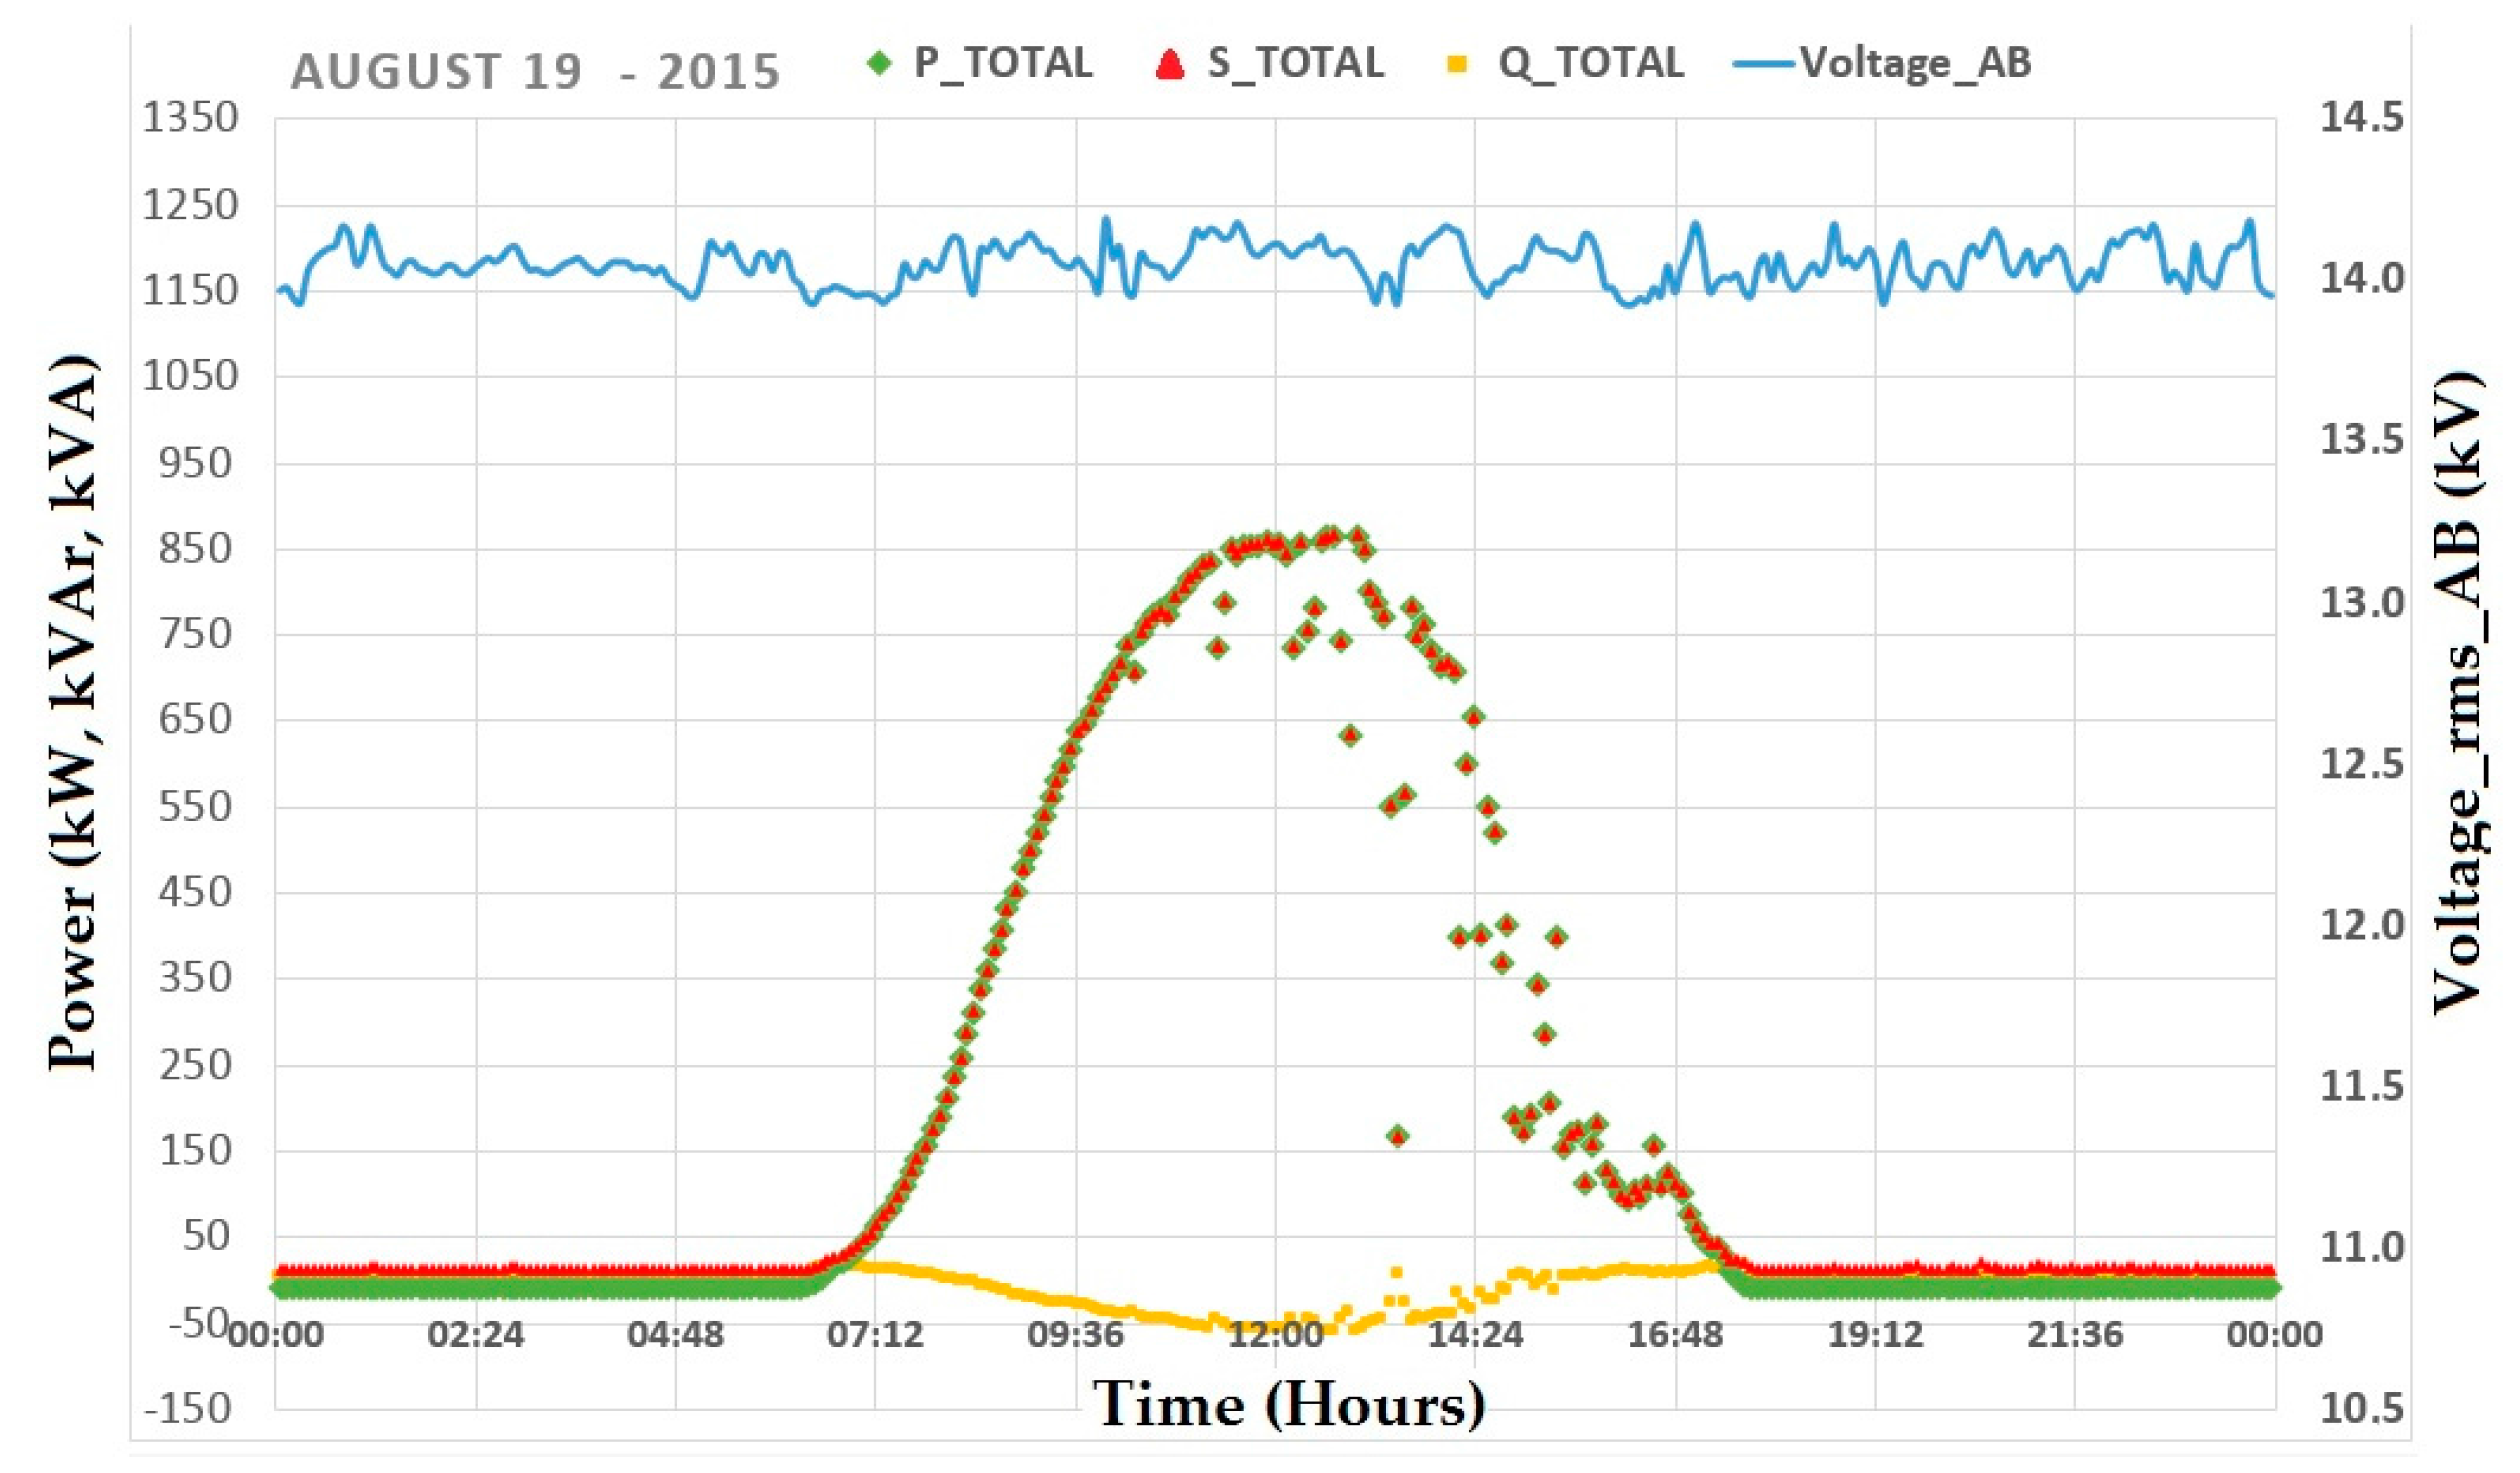
Figure 24,
Figure 25 and
Figure 26 present the same parameters and analysis done for data from
Figure 23a, but with better detail for days with different profiles.
As can be seen in
Figure 24,
Figure 25 and
Figure 26, the voltage (phase to phase) oscillates within the range from 14.0 to 14.25 kV, which is above nominal voltage of 13.8 kV (1.4% and 3.2% above nominal value, respectively). This is normal since the PV power plant is connected directly to the substation bus, by means of a dedicated feeder. As already described, for
Figure 24,
Figure 25 and
Figure 26, active power (P) is following apparent power (S), indicating a low reactive demand at the measurement point and the increase of photovoltaic generation throughout the day increases consumption of reactive power.
Figure 24 shows a power profile for a partly cloudy day. For this day, the irradiance achieved 865 W/m
2 at solar noon and had a 5.84 kWh/m
2·day of irradiation. For this meteorological condition, the PV power plant reached an average energy production of 5.03 MWh/day (with 866 kW for nominal power PV power plant) and a daily final yield of 3.60 kWh/kWp and PR = 0.62. In
Figure 25, cloudy day, the solar radiation values were 797 W/m
2 (at solar noon) and irradiation was 4.26 kWh/m
2·day. On this day, PV system generated 3.55 MWh/day (Y
F = 2.54 kWh/kWp/PR = 0.60) with a nominal PV power of 1.02 MW at solar noon.
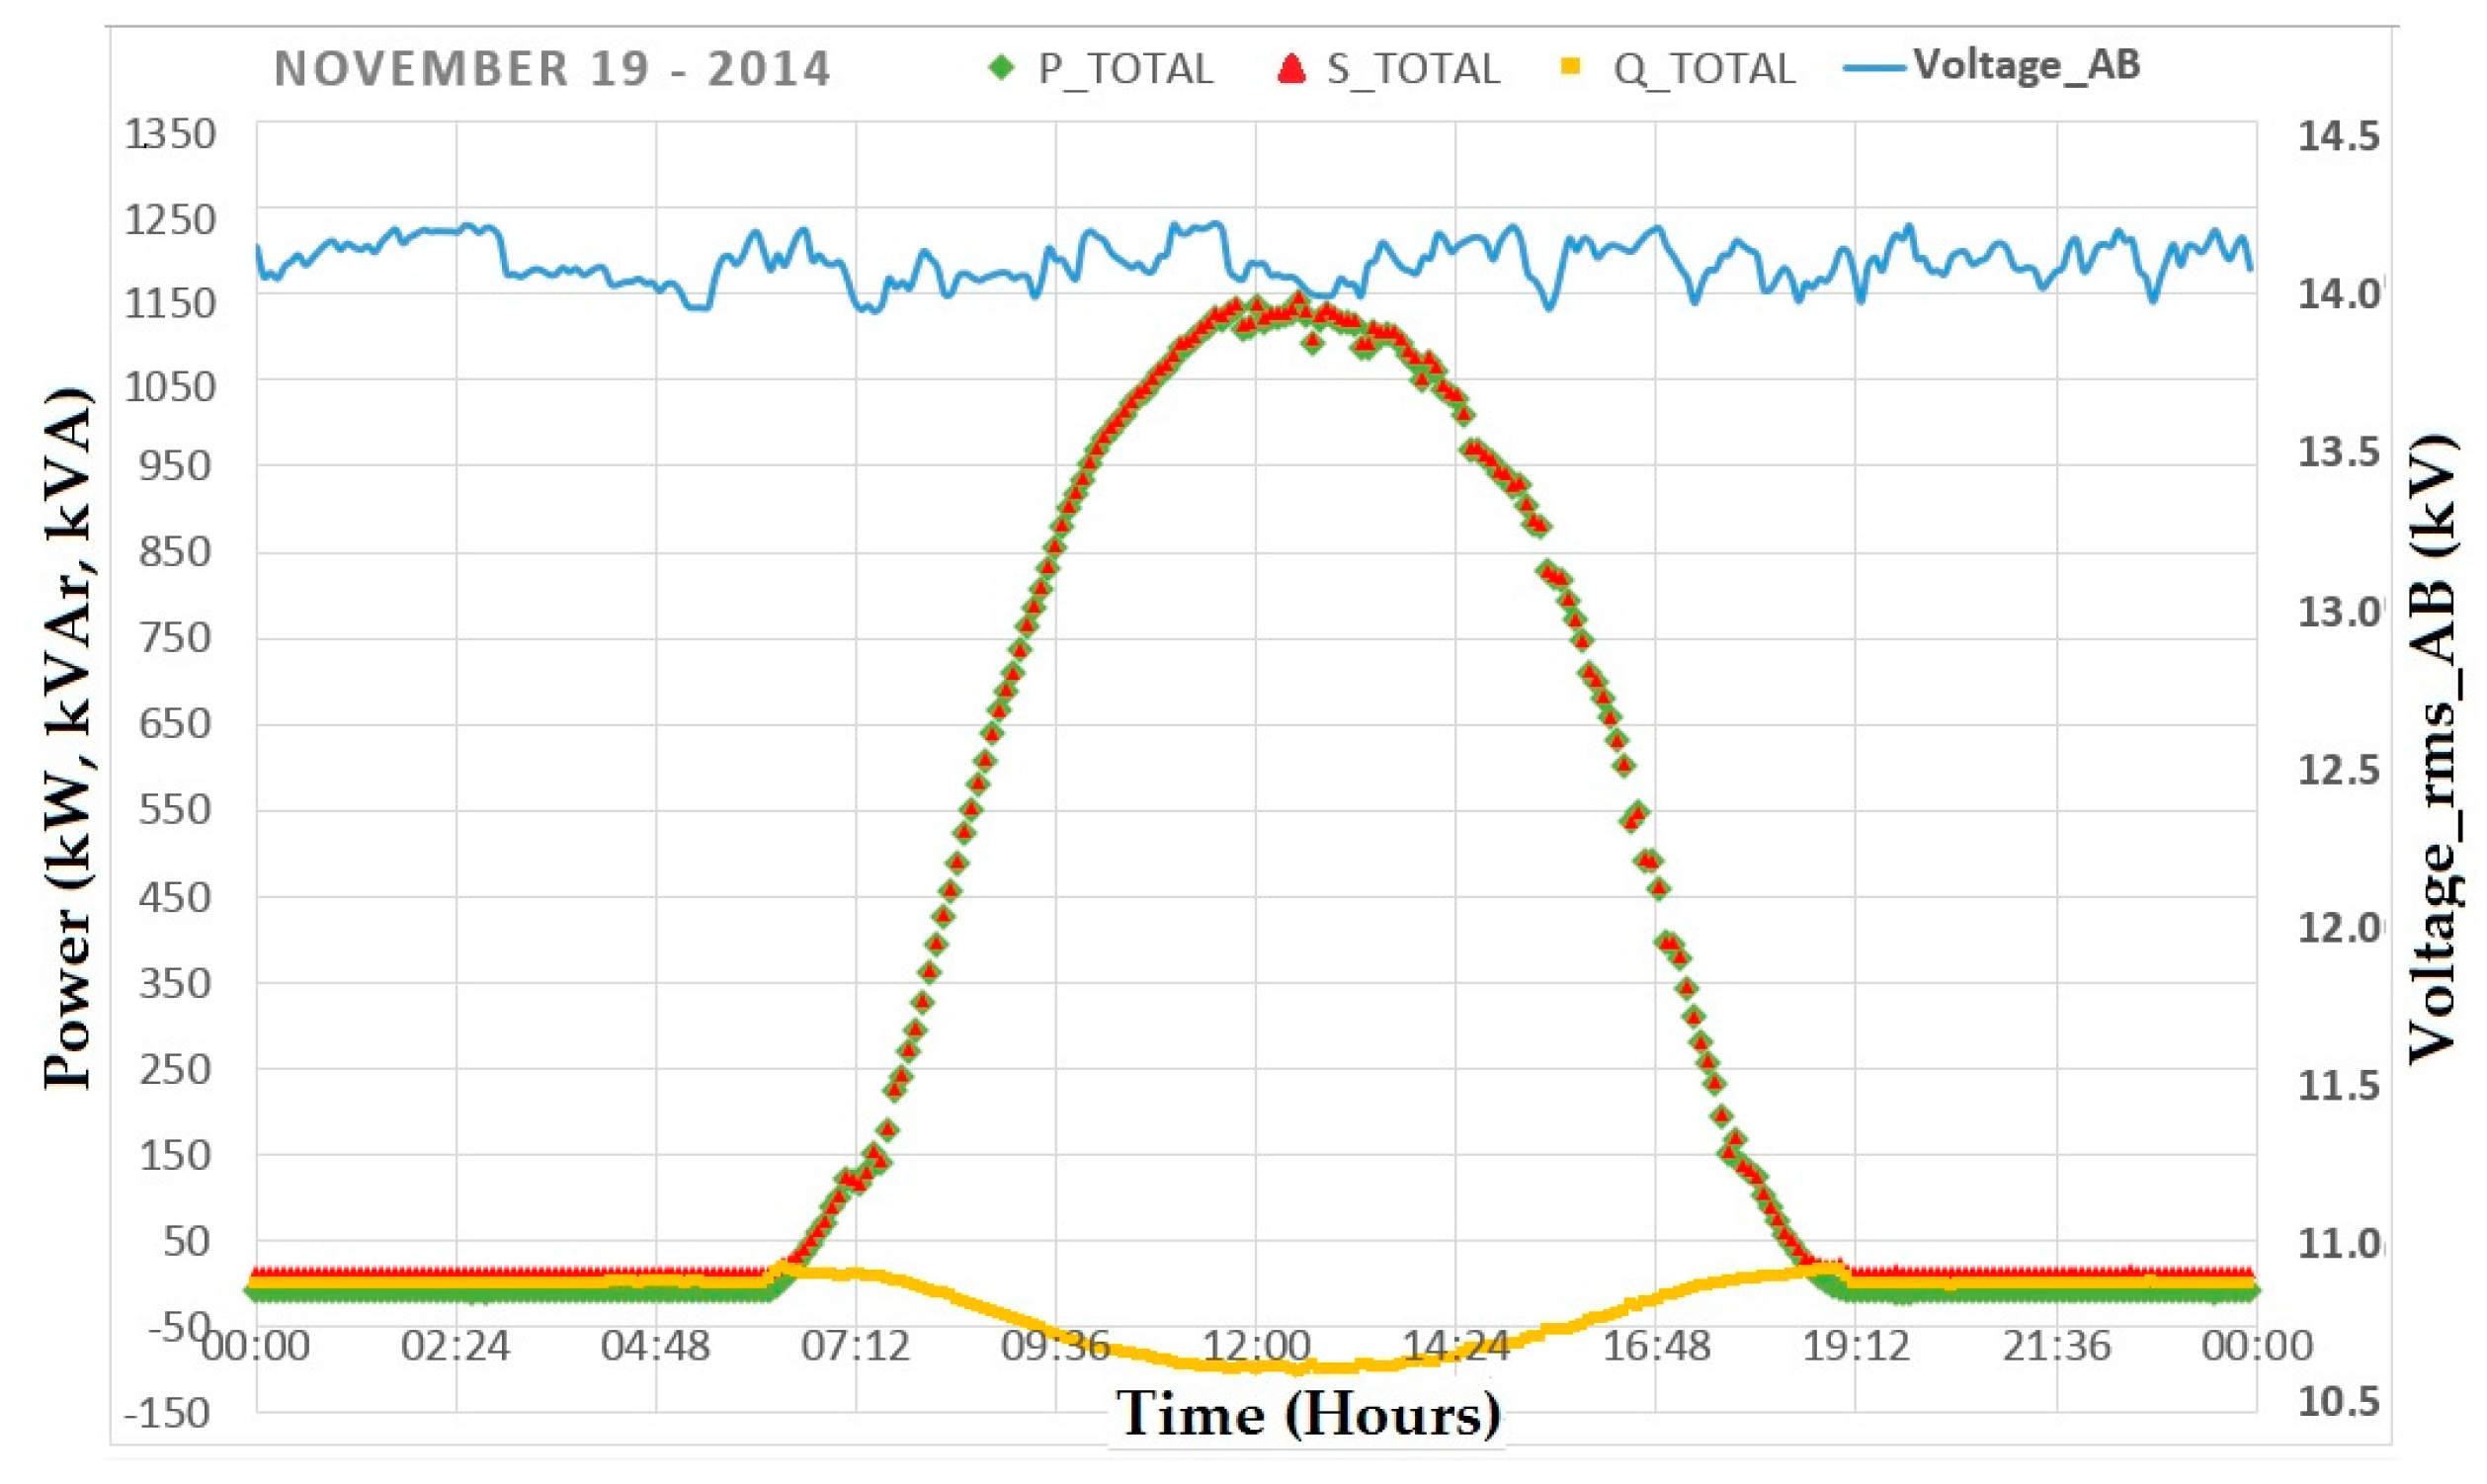
Figure 26 shows a day profile with the highest generation for the PV system among all monitored days, with nominal power of 1.15 MW at solar noon (1162 W/m
2, maximum recorded irradiance), generation of 8.66 MWh over the day (8.63 kWh/m
2.daily recorded irradiation), final daily yield of 6.20 kWh/kWp and PR = 0.72.
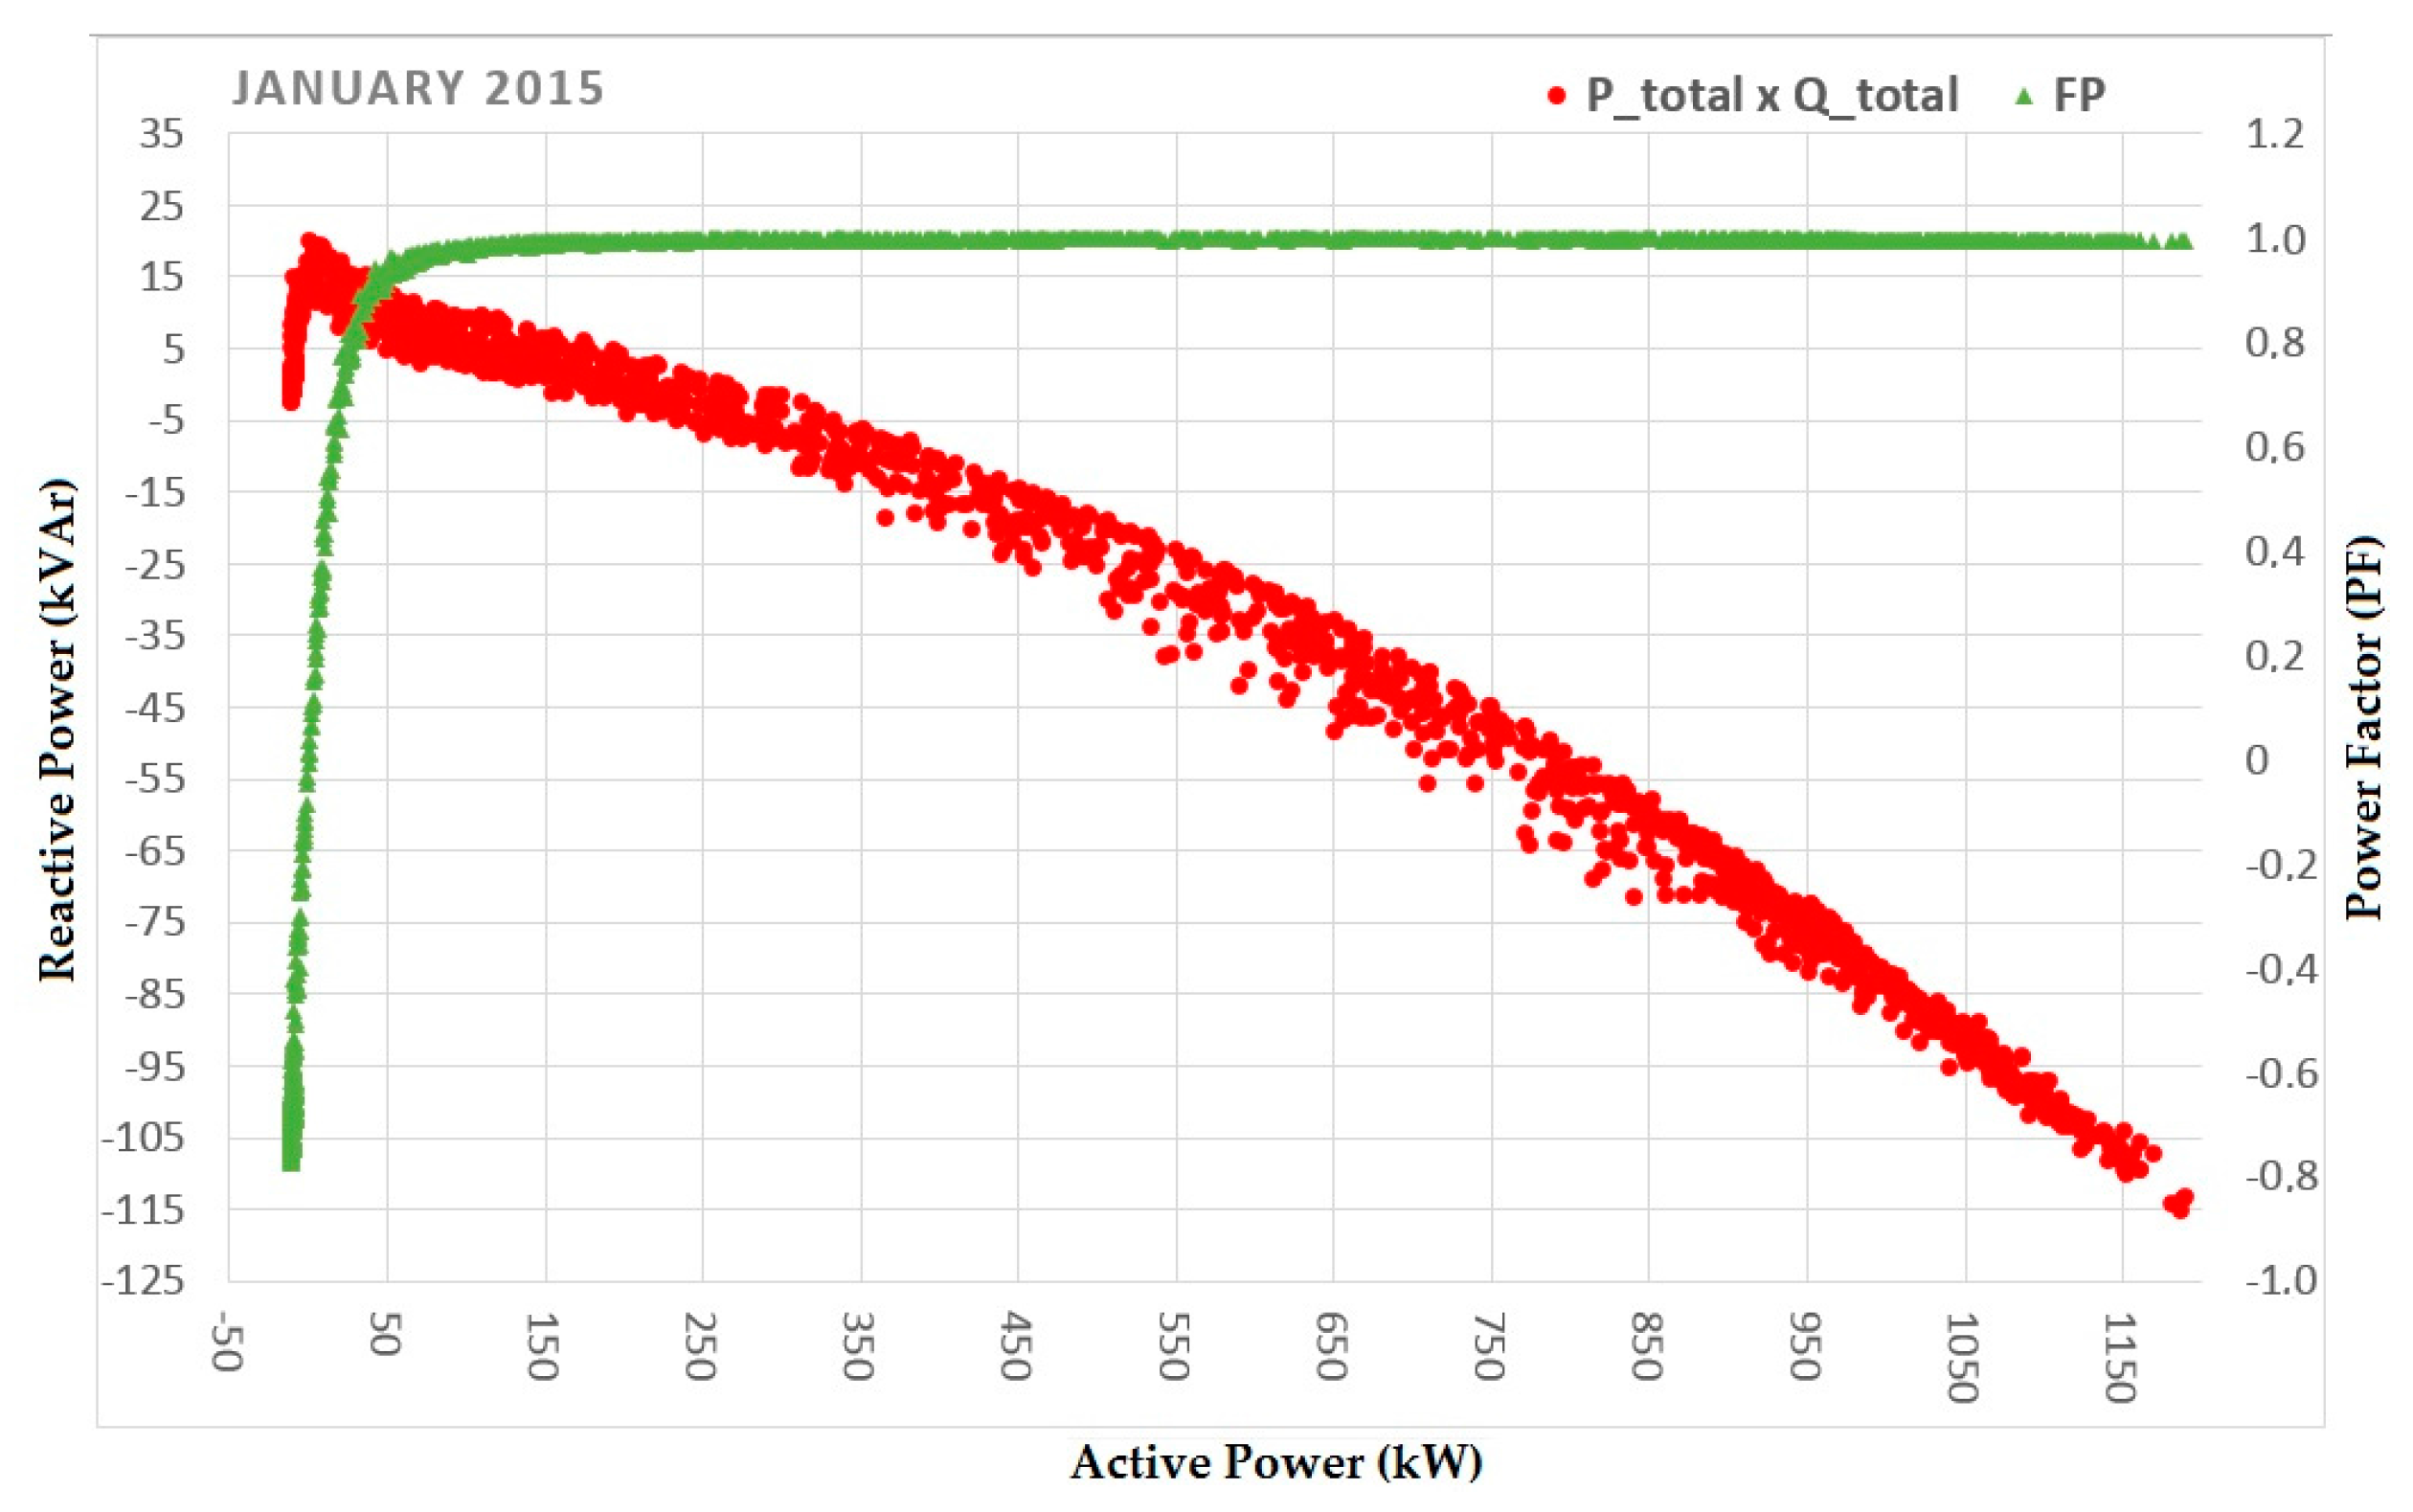
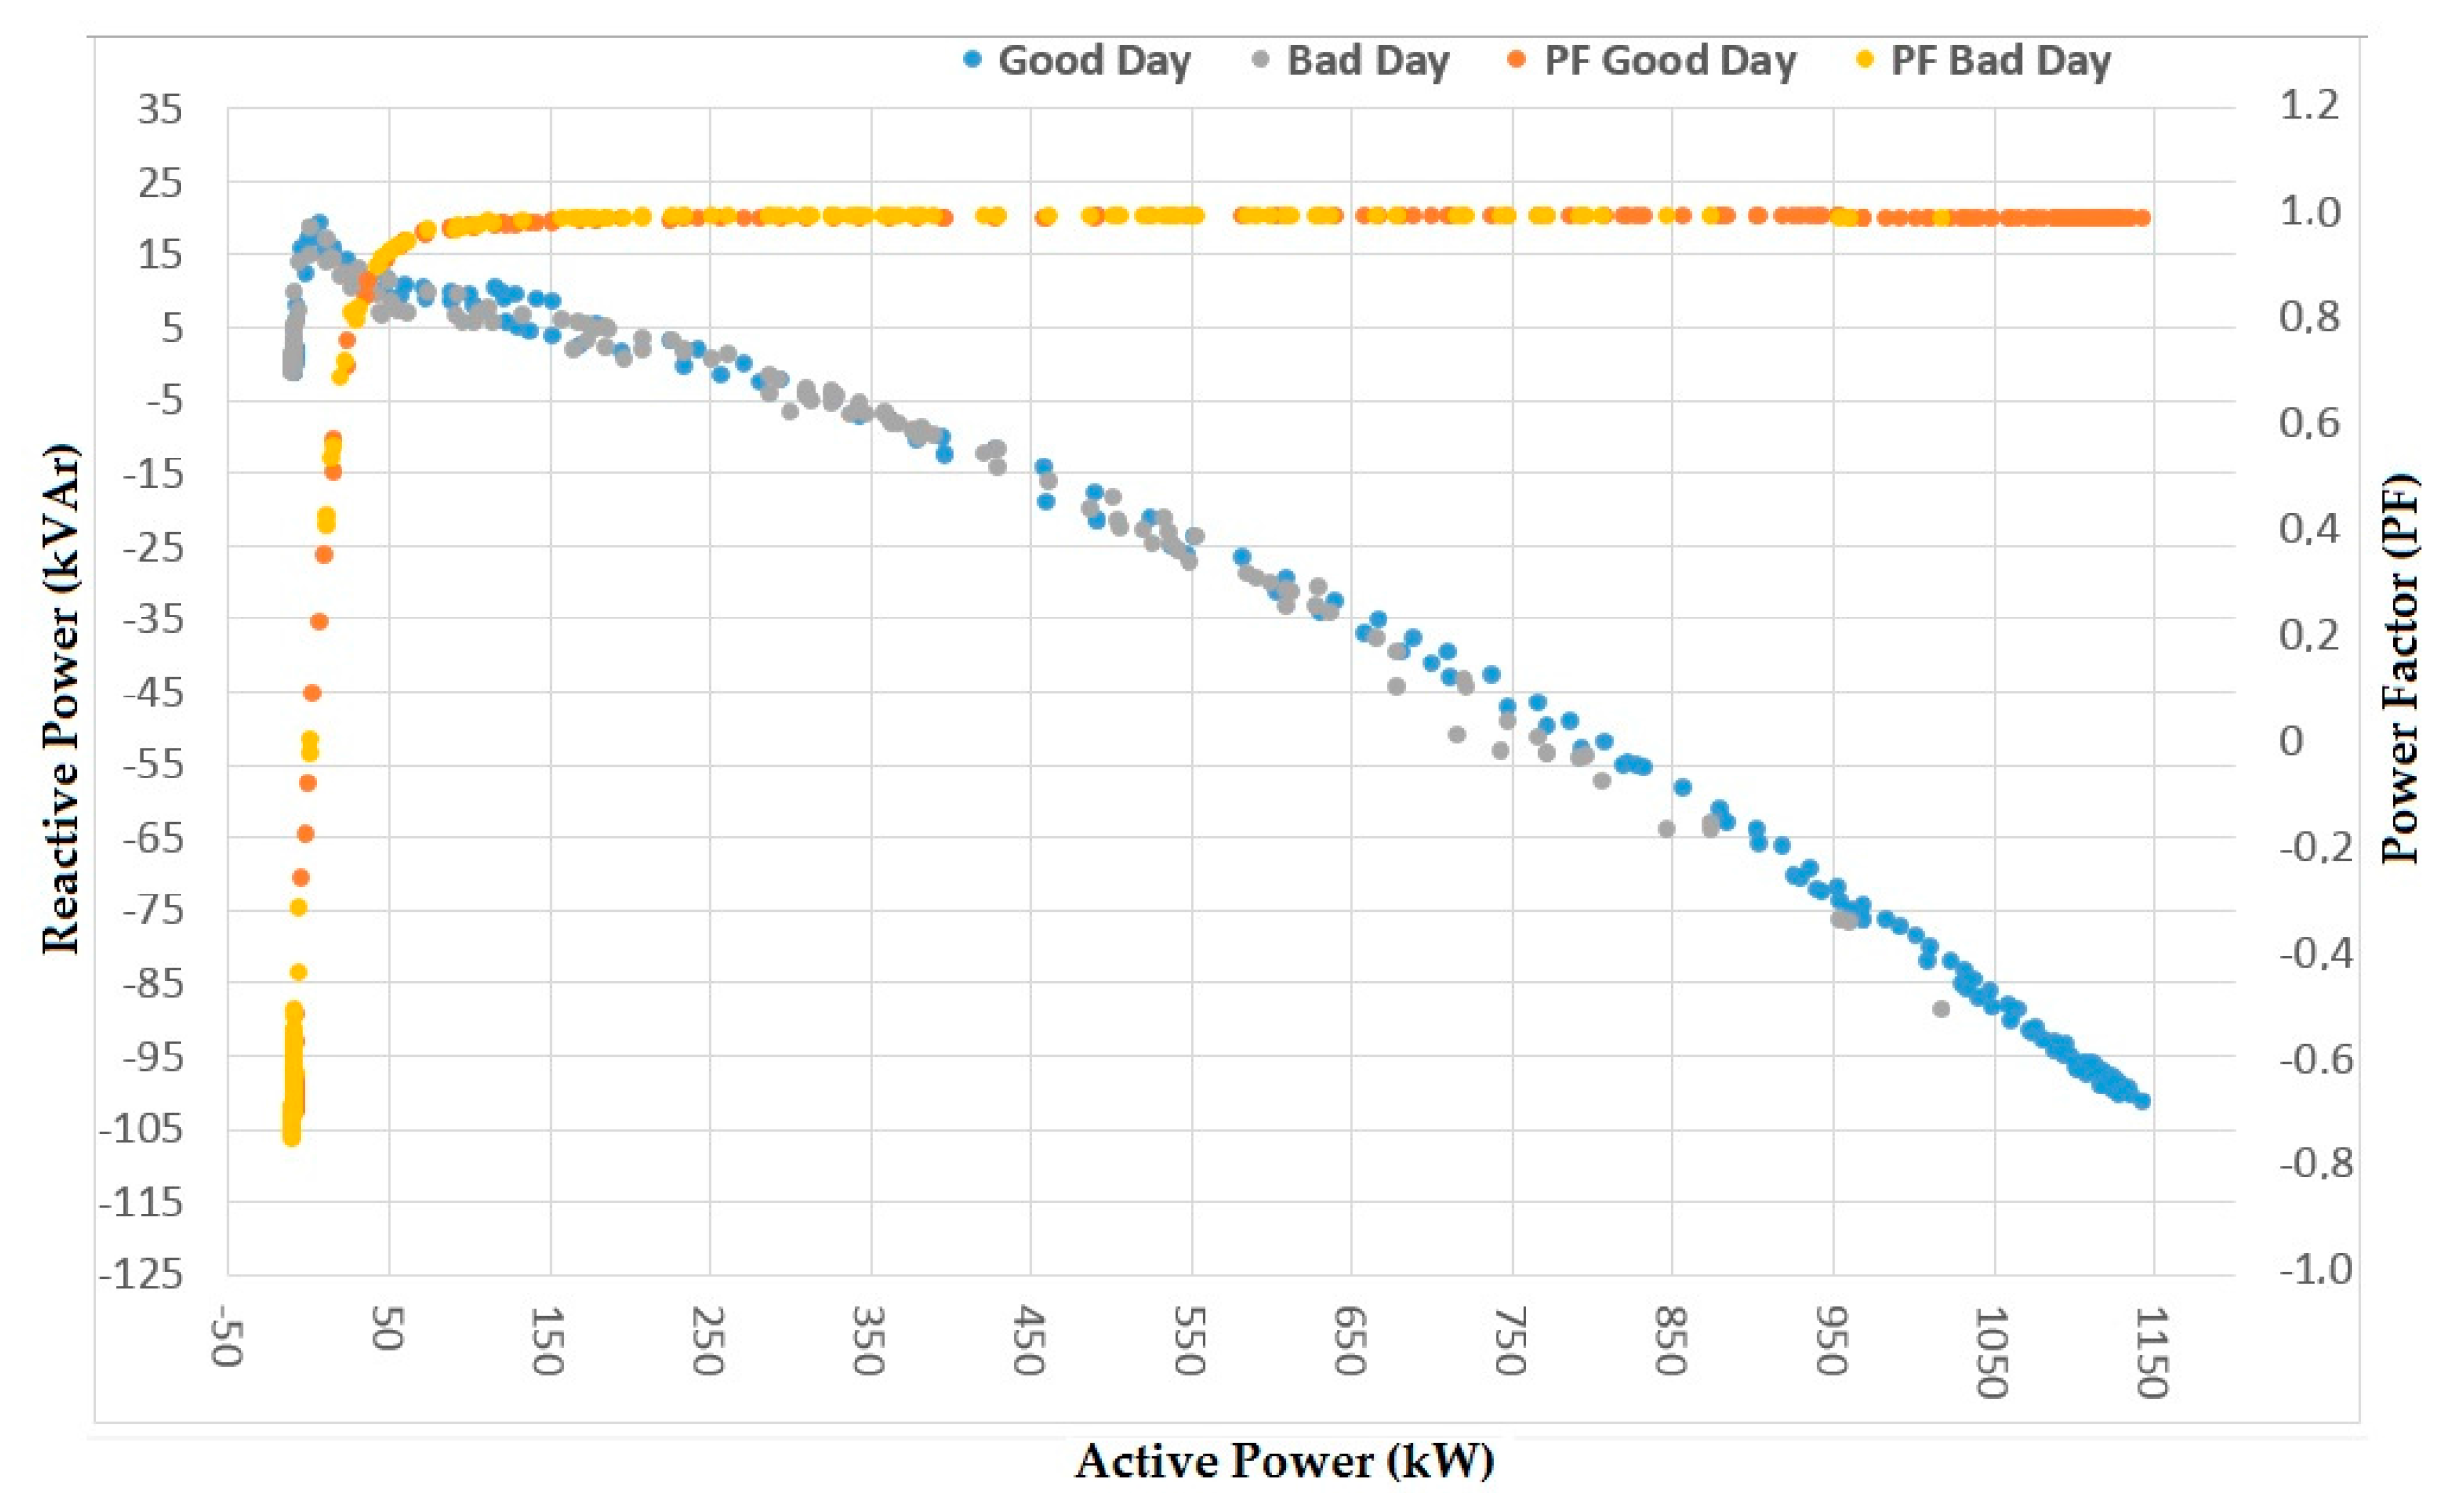
Figure 27 and
Figure 28 show active versus reactive power and power factors as a function of active power for different generation profiles.
Finally,
Figure 27 and
Figure 28 demonstrate that the PV power plant power factors are close to unity when it operates at nominal power. It is possible to notice a tendency to lower power factor values when submitted to partial loads. The decrease of power factor is important for the description of power quality [
28]. PV power plants operating with low power factor may pose problems to voltage regulation, the reason for the desired unity power factor. According to IEEE [
34], PF (power factor) of an inverter must always operate above 0.85 when its output exceeds 10% of nominal power. However, with the consent of utility grid, power factor can operate with values below 0.85 for compensation or correction. Nowadays, inverters have control mechanisms that can adjust reactive power flow in accordance with the needs of the utility grid.
5. Conclusions
In this paper, it was demonstrated one of applications (and distinguished application), which is increasing nowadays, that is, the use of PV grid connected systems on sports stadiums. Many countries have already installed solar PV power plant on rooftop, facades and ground mounted at sport stadiums (arena, facilities) to save and/or export energy to a local utility grid. Great international sport events such as the Olympics Games and Football World Cup are important to disseminate and encourage the use of solar power technologies as PV systems and solar heat collectors, thus they can accomplish their green goal agenda and provide a sustainable legacy.
In this direction, for the 2014 FIFA World Cup, Mineirão Stadium, located in Belo Horizonte City (Brazil), through the program “Estádios Solares”, installed a 1.42 MWp PV power plant on its rooftop in 2013. This paper presented results and analysis of one-year (October 2014 to September 2015) monitoring of electrical parameters (at AC side) and characterization of local solar radiation.
It was shown that the solar resource in the stadium region varies stochastically over the year but has a good annual average of daily horizontal global solar irradiation (5.18 kWh/m2·day). Besides that, 2014–2015 achieved high values of GHI, above average, those years being drier than usual.
For the period considered in this analysis, the total amount of annual energy available was found to be 1985 kWh/m2 (5% above average) and the solar irradiance ranges with higher energy contribution (23% of total energy) in the region are from 650 W/m2 to 800 W/m2. When considering the time length, ranges from 400 to 750 W/m2 have relevant contribution (1544 h, 66% of total time).
Furthermore, irradiation is concentrated in the range from 4.4 kWh/m2 to 5.8 kWh/m2 (35% of total energy) demonstrating a good availability of solar resource in the region and the importance of analyzing such availability over time, thus understanding the characteristic profile of the solar energy resource for a better gain of energy yield at the PV power plant.
Good results were found on monitoring the electrical data (AC side) of PV system, considering the significant influence of partial shading at certain periods and the days that the system was completely disconnected from the grid. Energy Generation results presented an average of 4.83 MWh/day, totalizing 1761 MWh in the period, with an annual YF of 1260 kWh/kWp, CF = 14% and annual PR = 68% (which varies from 62% to 71% over the year).
These results were compared with PVsyst annual simulations (1610 MWh/year; YF = 1134 kWh/kWp, CF = 12.9% and PR = 0.72) and the monitoring results for energy produced, YF and CF were better than PVsyst simulations. However, PVsyst simulations presented a better value for PR (for average irradiation of 4.32 kWh /m2·day). When a mean irradiation of 5.18 kWh/m2·day as a parameter in simulations (the same used in monitoring period) was considered, the new result for PVsyst PR was 67% and the relative difference to monitoring PR was just 1% greater. This demonstrates that it is important to use the same reference parameters when comparing reality to simulation to calculate energy metrics in a PV system.
Figure 26 shows the highest PV system generation, of all monitored days, that reached the mark of 1.15 MW of nominal power at solar noon (1162 W/m
2) and generated 8.53 MWh for a particular day with high solar irradiation 8.63 kWh/m
2. Therefore, the PV system reached a daily Y
F = 6.10 kWh/kWp and a PR about 71%.
Reactive power (Q) is always negative, characterized as inductive and is always related to active power (P) produced throughout the day. As the photovoltaic generation increases, consumption of reactive power increases. However, at night, system displays an approximate self-consumption of 10 kW associated with losses in transformers and supervision and control system.
On analysis, it was possible to observe that voltage between phases oscillates and it is above the nominal voltage of 13.8 kV. This fact is usual since the PV power plant is connected directly to the substation bus, by means of dedicated feeder.
The power factor control of inverters installed in plant can be used to absorb reactive power in order to avoid an increasing level of voltage at its output, which does not happen in this particular system where the power factor tends to one when power generation grows. In addition, power factor of the inverters, which works close to unity when operating at nominal power, have a tendency to lower value when submitted to a partial loads, which is important for the description of power quality.
Finally, this paper presented the beginning of a research work with some general results found about PV power plant installed at the rooftop of Mineirão football stadium. During monitoring period, many challenges arose (shading in segments, degradation of PV modules over years, power quality analysis and much more). Therefore, this kind of sport facilities is a great opportunity for the development of research with real problems that will contribute to the PV area.


