Review

A Proportional Resonant Control Strategy for Efficiency Improvement in Extended Range Electric Vehicles

1
Institute of Electrical Engineering & Automation, Tianjin University, No. 92 Weijin Road, Tianjin 300072, China
2
College of Engineering and Technology, Tianjin Agricultural University, Tianjin 300384, China
*
Authors to whom correspondence should be addressed.
Energies 2017, 10(2), 204; https://doi.org/10.3390/en10020204
Submission received: 14 November 2016 / Accepted: 22 January 2017 / Published: 10 February 2017

Abstract

:
The key to control the range extender generation system is to improve the efficiency and reduce the emissions of the electric vehicle (EV). In this paper, based on the purpose of efficiency optimization, both engine and generator are matched to get a public high efficiency region, and a partial power following control strategy was presented. The engine speed is constant in the defined power range, so the output power regulation of the range extender is only realized by the adjustment of the torque of the generator. Engine speed and generator torque were decoupled. An improved proportional resonant (PR) controller is adopted to achieve fast output power regulation. In order to ensure the response characteristics of the control system and to improve the robustness, the impacts on system’s characteristics and stability caused by PR controller and parameters in the inner-current loop were analyzed via frequency response characteristics. A pre-Tustin with deviation compensation is proposed for PR controller’s discretization. A stable and robust power following control method is obtained for the range extender control system. Finally, simulation and experiment of the proposed control strategy illustrated its feasibility and correctness.

1. Introduction

Due to the lower combustion efficiency of fuel and stricter regulations on the emissions of traditional vehicles, the automotive industry is actively developing environmentally friendly and green energy vehicles. Electric vehicles (EVs) are considered to be a green solution, due to their zero emissions advantages. Due to the restrictions of the current battery technology, the driving range is limited by their one-time charge cycle. In order to overcome the disadvantages of the pure EV, Extended Range Electric Vehicles (EREVs) were developed as a feasible and low cost solution [1].
The block diagram for the architecture of the widely used EREV is shown in Figure 1. The range extender (RE) is composed of an internal combustion engine, a permanent magnet synchronous generator (PMSG) and a pulse width modulation (PWM) voltage source converter (VSC). The propulsion of the EREV is provided only by the electric motor, so the RE is decoupled from the wheels of the EV, one benefit of this series parallel electric vehicle architecture is lower driving noise, and another is the higher efficiency due to the fact the RE is operating continuously in its high efficiency region. Compared with conventional hybrid electric vehicles (HEVs), EREVs have advantages in fuel economy, engine efficiency and emissions [2].
The key to control the RE generation system is to improve its efficiency and to reduce the emissions of the EV. At present, the Charge Depleting (CD) and Charge Sustaining (CS) mode are mainly used in EREV applications [2]. The vehicle operates in CD mode while the state of charge (SoC) of the battery is greater than a designed threshold. Once the battery depletes to some predefined threshold, the RE will be switched on and the vehicle operates in CS mode. There are two operating strategies in CS mode: one is the constant power control, which means that RE generates the maximum rated power, so that the system can be operated at the most efficient point, however the battery will be charged and discharged frequently, which reduces the service life of the battery as a drawback. The other strategy is the power following control, under which the output power of the RE is changed according to the driving power demands. The advantage of this mode is the minor fluctuation of the battery SoC, so the battery lifetime will be extended. Its disadvantage is that the efficiency of the RE generation system is low when the demand power is relatively small, because the RE cannot be maintained in the high efficiency region. In order to compare the characteristics of the two operating strategies, the performance of the EREV is analyzed over repeated new European driving cycle (NEDC). Figure 2 shows the battery SoC variation for the different strategies. The range RE is switched on when the SoC depletes to 22%. In Figure 2a, the blue line shows the SoC variation for the constant power control strategy and the red line shows the switch on/off signal of the RE. It can be seen that the RE was started six times and the SoC curve fluctuated cyclically. In Figure 2b, the blue line shows the SoC variation for the power following control strategy and the red line shows the switch on/off signal. It illustrates that the RE continuously operates in CS mode and the SoC fluctuates within a small range.
In this paper, the high efficiency operating region is determined by the engine fuel consumption curves and the generator efficiency map. A power following control strategy is adopted in the high efficiency region; constant power control is adopted in the external efficiency region. This strategy ensures that the engine and the generator operate in the high efficiency region together; at the same time it can also reduce the SoC fluctuations, preventing the battery from charging and discharging frequently and thus prolonging the battery lifetime.
There are two main structures in RE generation systems: one consists of the electrical excitation synchronous motor and uncontrolled rectifier, whose output power can be regulated by adjusting the excitation current of generator. Although this structure is a low cost solution, the electrical excitation machine does not meet the requirements of high power density in EV applications [3,4,5,6]. The other form is composed of a PMSG and PWM rectifier, which can control both the generator operating in motor state and the generator state [7,8,9]. This form features a simple structure, high power density and synchronous control of engine speed and motor torque, so it’s an ideal solution. At present, because of simple control and good stability of PI controllers, they is widely used in engine and synchronous motor control. In [10,11], a PI predictive control method was adopted to achieve the output voltage and power adjustment. As the current loop of PMSG control with coupled dq current, it had to add a compensation to improve the dynamic performance, which leads control structure complexity and a lack of robustness. Some references also designed robust, for instance, in [8], a global efficiency optimization of sliding mode control is proposed, in which two chattering-free sliding mode controllers are utilized to control engine speed and PMSG torque; in [12,13], adopts a fuzzy logic control; in [14,15,16] a Dynamic Programming (DP) technology is used to obtain an optimal solution. However, these control strategies such as DP algorithm are not suitable for EREV real-time control; because they are based on masses of driving cycle and a lot of data processing.
Mechanically coupled connection between engine and generator determines that the output power is related to engine speed and generator torque. Therefore, to design a control strategy which can decouple the engine and generator control and optimize power generation efficiency is the key to get an efficient RE generation system. In this paper, a fast response and high robustness control method is presented based on decoupling, simplifying algorithm and improving RE efficiency. The PR controller is introduced into RE power generation control. PR could simplify coordinate transformation and replace feed-forward compensation. The impacts on system characteristics and stability caused by PR controller and parameters in generator control were analyzed via frequency response characteristics, and the PR controller is discretized by pre-Tustin transform to obtain a stable and high robustness power following control strategy. Finally, simulation and experiment of the proposed control strategy illustrated its well dynamic response and steady state performance.

2. EREV Efficiency Improvement Design

The proposed RE generation system is design to satisfy with the requirement of the city’s compact EV, the requirement and performance of the EREV is shown in Table 1. A 17 kW engine model and a 13 kW PMSG are selected [17].
The mechanically decoupled structure between RE and the wheel of EV leads to a strong point whereby the output characteristics of the RE are not related to vehicle traction performance, and the output power is only needed to meet the driving requirements. Therefore, one of the main objectives is to keep the RE operating in the high efficiency region. Firstly, both the engine and the generator should be matched to achieve this common operating region. The PMSG efficiency map of the selected generator is shown in Figure 3, where it can be seen that the efficiency is more than 85% in almost 70% of the operating region. In the designed RE system, this region is defined as a high efficiency region where the speed is limited to 2000–4000 rpm, and the torque is limited to 15–40 N·m.
Both the efficiency and emissions of the engine are nonlinear, so online efficiency optimization calculations would take a lot of time. Therefore it is important to define an optimum operating region. The efficiency map of the selected engine is shown in Figure 4. The engine speed is between 2500 rpm and 4000 rpm, while the engine torque is between 25 N℘m and 45 N℘m, the region that is defined as the fuel economy region. The engine operating area is relative narrow compared with PMSG [18].
Considering the advantages and disadvantages of constant power control and power following control, a partial power following control strategy within efficiency region is proposed. When the demanded power is lower than Pthreshold, a constant power control strategy is adopted. The strategy splits the RE power output between the driving motor and battery. When the demanded power value is between Pthreshold and Pmax, a power following control is adopted. Pthreshold here is the threshold value that determines the RE is operating in power following mode. The Pthreshold is determined using the optimization method to minimize the fuel consumption.
The fuel consumption rate can be described as the function of the engine power and engine speed:
m e ( t ) = f [ P e n g ( t ) , ω e ( t ) ]
where me(t) is the fuel consumption, Peng(t) is the engine power, ωe(t) is the engine speed. The relation between me(t) and Peng(t) at defined ωe is shown in Figure 5. Although the engine has better fuel economy at a speed of 2000 rpm, the maximum output power is limited. Considering the engine output power range and economic fuel consumption, a speed of 3000 rpm is defined as the constant speed for the power following control.
The vehicle demand power can be expressed as following Equation (2):
P r e q ( t ) = υ ( t ) F d ( t )
The driving force Fd(t) can be expressed as Equation (3):
F d ( t ) = F f ( t ) + F w ( t ) + F i ( t ) + F j ( t )
where υ(t) is vehicle speed; Ff(t) is rolling resistance; Fw(t) is air resistance; Fi(t) is climbing resistance and Fj(t) is accelerating resistance. The total driving force can be calculated as follows:
F d ( t ) = M V g f r cos α + 1 2 ρ a C D A f υ 2 ( t ) + M V g sin α + M V δ d υ ( t ) d t
where g is gravity acceleration, ρa is air mass density and δ is the rotational inertia factor. According to the path of power flow, the demand power Preq at the t moment can be expressed as follows:
P r e q ( t ) = { a 0 a 2 P e n g ( t ) , P r e q > P t h r e s h o l d a 0 a 2 λ P e n g ( t ) + a 0 a 1 a 2 ξ P e n g ( t ) , P r e q P t h r e s h o l d
where λ is the driving power ratio of RE output power, ξ is charging power ratio, and there is λ + ξ = 1. The equivalent efficiency factor can be defined as follows:
{ a 0 = η e n g × η g e n × η c o n a 1 = η b a t 1 × η b a t 2 a 2 = η i n v × η m o t ,   P t h r e s h o l d
where ηeng, transmission efficiency of the engine; ηgen, generator efficiency; ηcon, PWM VSC efficiency; ηbat1, charge efficiency of the battery; ηbat2, discharge efficiency of the battery; ηinv, efficiency of the motor controller; ηmot, drive motor efficiency.
The instantaneous fuel consumption rate me(t) is not suitable for representing how economically the engine fuel is utilized. When the Preq is lower than Pthreshold, part of the engine power is transmitted to charge the battery and will be used by the driving motor in the future. Considering the charge and discharge consumption of the battery, the equivalent fuel consumption can be expressed as follows:
F C = 0 t m e ( t ) d t   [ η e n g η g e n η c o n ( η i n v η m o t λ ¯ + η b a t 1 η b a t 2 η i n v η m o t ξ ¯ ) ]
F C min = min ( 0 t f [ P e n g ( t ) , ω e ] d t [ a 0 a 2 ( 1 a 1 ) λ ¯ + a 0 a 1 a 2 ] )
where λ ¯ is an equivalent driving power ratio which can be calculated on a given driving cycle. When Pthreshold is set in the range [4,13], then the corresponding parameter λ ¯ can be calculated in the range (0.9, 0.6) under a given driving cycle. The value of λ ¯ is obtained through a data lookup table. The corresponding fuel consumption can be obtained when a different value of Pthreshold is set. The minimum fuel consumption is achieved when Pthreshold is closed to 8 kW.
The flow chart of the control is shown in Figure 6. The RE is switched on when the battery SoC falls to 22%. The controller determines whether to carry out power following control according to the power demand of the EV. The RE generation system constantly outputs 8 kW when the power demand is lower than 8 kW; when the power demand is greater than 8 kW, the power following control strategy is adopted to ensure minimum fuel consumption.

3. Development of the Control Strategy

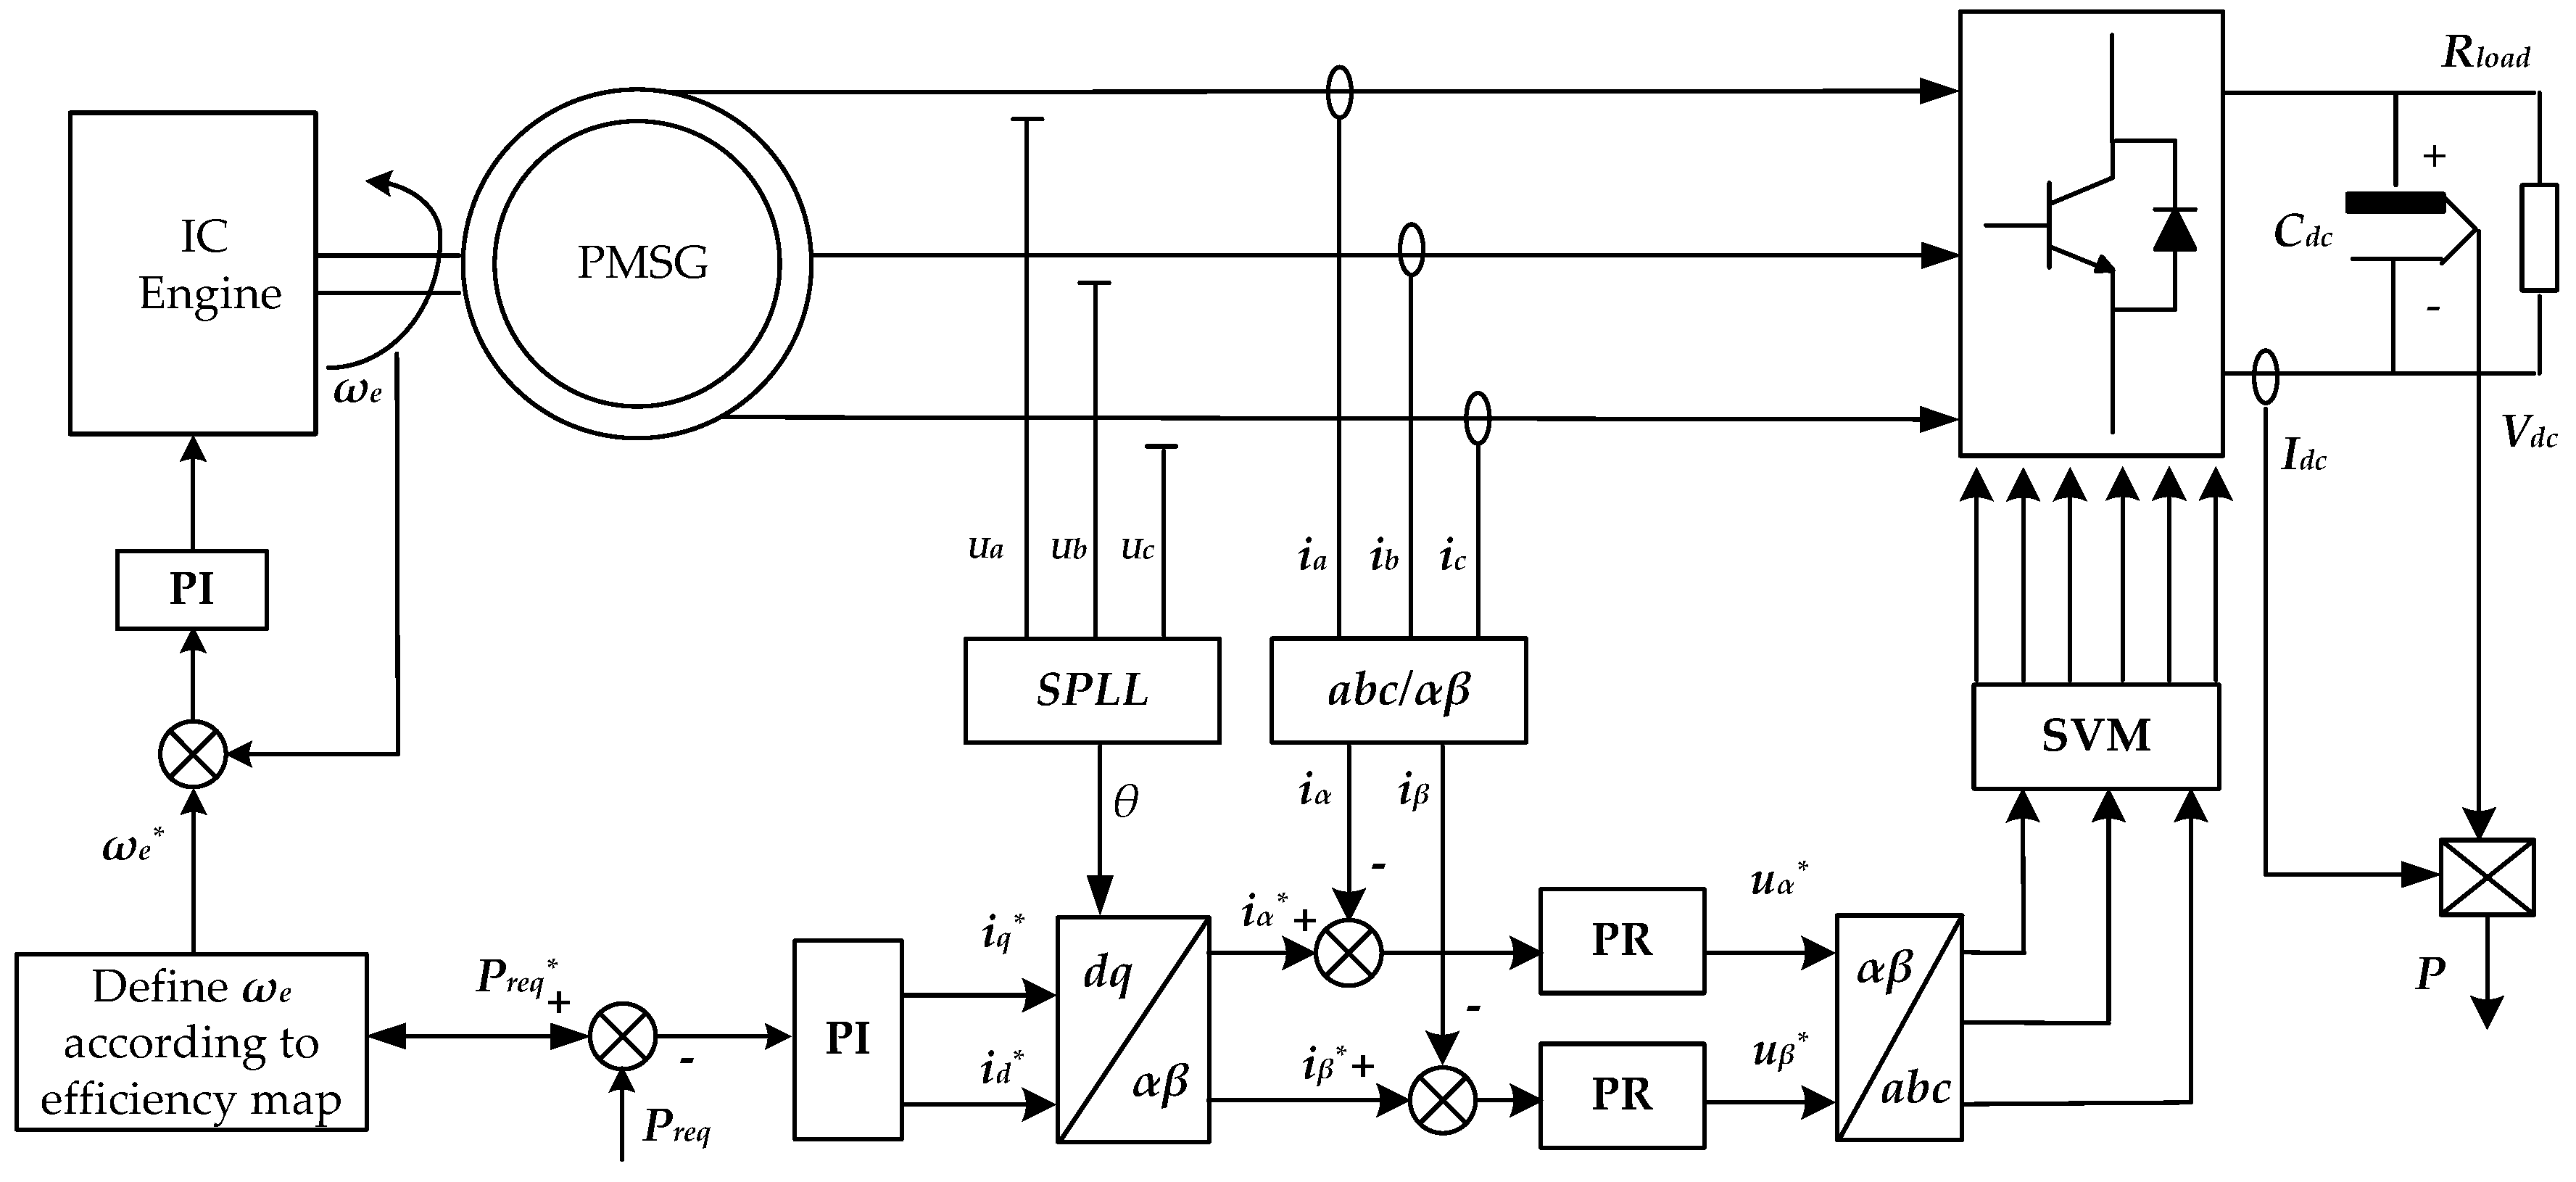
3.1. Modeling of the Generator Control

The optimal operating region is defined in the last section. The engine speed receives a fixed speed reference and the generator torque is regulated with the power demand. The output power regulation of the RE is realized by engine speed and generator torque control. The engine speed control is realized by adjusting the electronic throttle, and using an improved PR controller to achieve fast regulation of generator torque. The engine speed is constant in the defined power range, so the output power regulation of the RE is only realized by the adjustment of the torque of the generator. There is no coupling between engine speed control and generator torque control. To design the generator torque control algorithms for RE generation system, the mathematical model of generator will be introduced. The PMSG can be described as Equation (9) in a rotating dq coordinate linked with a rotor:
{ u q = R s i q L q d i q d t ω e L d i d + ω e ψ f u d = R s i d L d d i d d t + ω e L q i q
where ud, uq, id, iq are the stator voltage and current in d-axis and q-axis coordinates respectively; Ld, Lq are the d-axis and q-axis inductance; Rs is the stator resistance, ωe = pn·ωr is the angular frequency of the rotating field, ωr is the rotor speed; pn is the number of pole pairs.
The electromechanical torque:
T e m = 0.75 p n [ ψ f i q + ( L d L q ) i d i q ]
By controlling the d-axis current to be zero id = 0, then the electromechanical torque could be written as:
T e m = 1.5 p n ψ f i q
According to the above Equation (11) and mechanical characteristics, the output power control can be realized via adjusting the q-axis current:
i q = 2 k 1 P e 3 p n ψ f ω e
The next section will discuss how to realize RE output power/current control to diminish static errors and obtain a stable and high robustness control system.

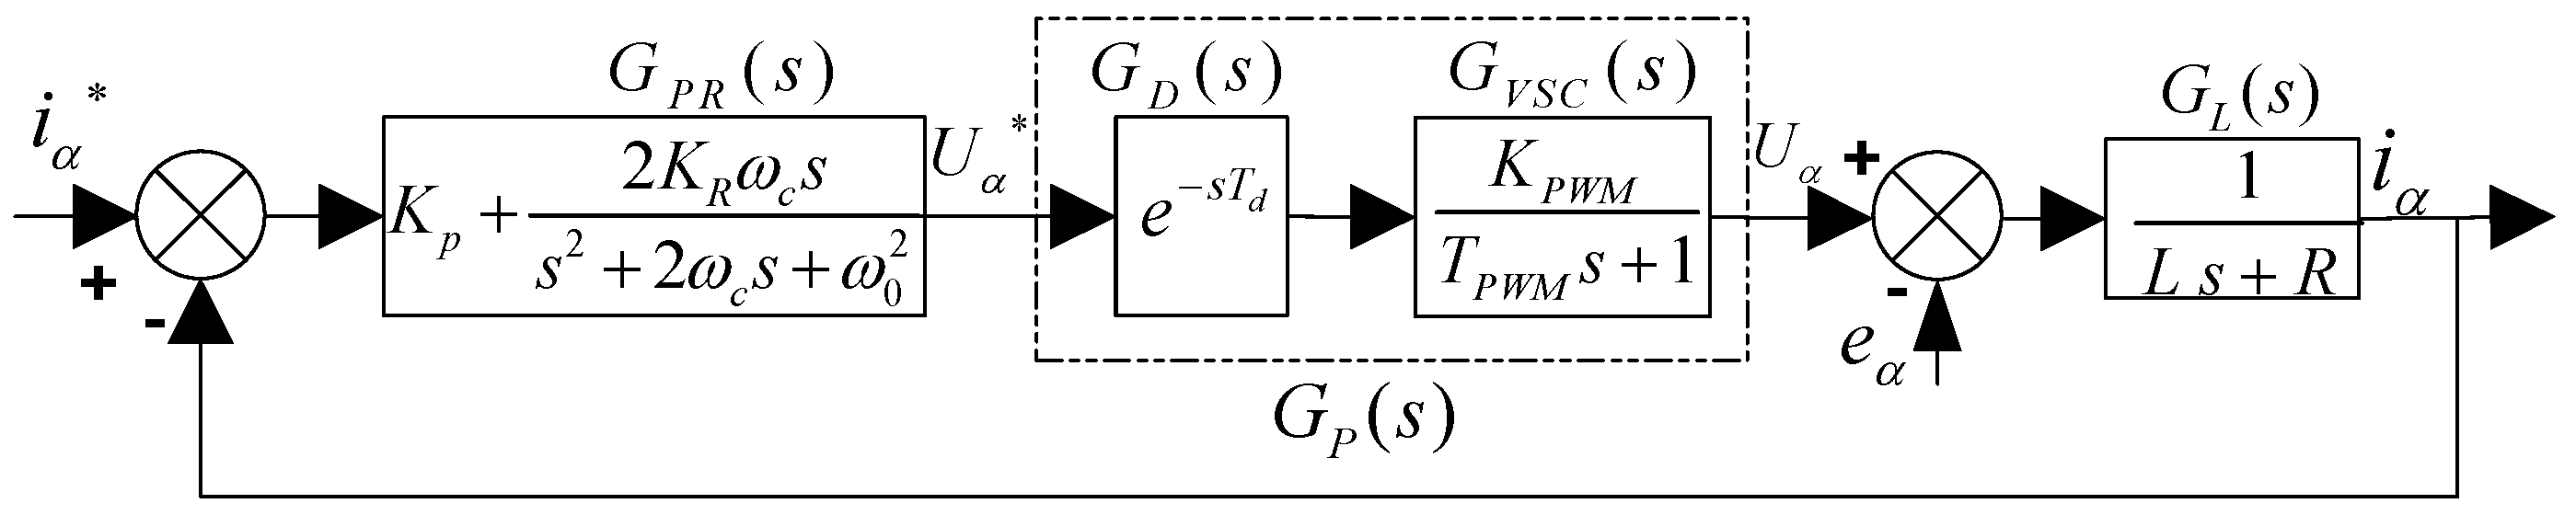
3.2. Design of PR Controller

The PR controller with power regulation is employed for the EREV, as shown in Figure 7. The reference Preq* in the outer loop is the required power, thus good dynamic and steady state characteristics can be obtained through real-time adjustment of the instantaneous power [19,20,21]. The controlled object in the inner loop is alternating current, and a PR regulator is introduced to eliminate the steady state errors of the control system, where iα* and iβ* are the given input current under the stationary αβ frame for the PWM converter.
The transfer function of an ideal PR controller is shown in the following Equation [22]:
G P R ( s ) = K p + 2 K R s s 2 + ω 0 2
where KP and KR are the proportional and resonant coefficients, and ω0 is the resonant frequency. Compared with a traditional PI controller, the PR regulator has an infinite gain and a 90° phase shift at the fundamental frequency ω0, and it has little gain magnitude at other frequencies. As to the closed-loop control system, it can achieve zero static error in phase and gain for tracking given an alternating signal with a specific frequency. However, when speed fluctuation of the engine occurs, the output current frequency of the generator will be variable and the bandwidth of the ideal PR controller isn’t sufficient, so that the gain magnitude of the open loop is reduced, and accordingly a non-error steady state can’t be achieved due to the bad stability. In order to solve the stability problems caused by an infinite gain, an optimized PR regulator can be used in practical implementations with a finite gain, but high enough to ensure a small static error. The improved PR controller is given in the following form [23]:
G P R ( s ) = K p + 2 K R ω c s s 2 + 2 ω c s + ω 0 2
Based on the control principle of the PMSG, the current loop of generator control is shown in Figure 8, iα* and iα are the generator current reference value and actual value, respectively, in α-β coordinates; eα is the stator voltage of the generator; GPR(s) is the transfer function of the PR controller; GP(s) is the transfer function considering signal sampling and PWM switch delay; GD(s) can be expressed as a time delay considering A/D sampling and transmission; GVSC(s) can be expressed as -ωTs/2 delay considering duty cycle updating of PWM waveform; GL(s) is the transfer function of the control objective.
Considering reference input and disturbance input simultaneously, the transfer function of current control loop can be written as follows:
i α = G P R ( s ) G P ( s ) G L ( s ) 1 + G P R ( s ) G P ( s ) G L ( s ) i α * G L ( s ) 1 + G P R ( s ) G P ( s ) G L ( s ) e α
As the gain of the control system is much greater than 1 at the resonant frequency point (GPR(sGP(sGL(s) >> 1), the coefficient of the first term on the right is approaching 1 and the other is approximately zero. Therefore, it can be seen from Equation (15) that iαiα*. It can be deduced that the PR controller can eliminate the static error.
The control effect is mainly determined by the parameters of the controller. Therefore, the influence of each parameter on the control effect was analyzed in detail. The variables KP and KR were adjusted respectively to observe the influence by Bode diagram.
From Figure 9a, the amplitude margin at the resonant frequency does not change significantly with the increase of the KP, while the amplitude margin increases at other frequencies. This indicates that the excess KP will weaken the advantage of the PR control at resonant frequency and affect the bandwidth and stability of the controller. It can be seen from Figure 9b that the amplitude gain at resonant frequency increases with increasing KR which serves to eliminate the steady-state error. Therefore, the PR controller parameter design needs to take into account the various parameters on the influence of the dynamic and static performance. The rule of parameter design is that KP and KR are adjusted to meet the dynamic, static performance and stability demands; the cut-off frequency ωc is adjusted to suppress the disturbances caused by the signal fluctuation. ωc reflects the ability of the controller to track signals in real time, the bandwidth should be wide enough to achieve fast dynamic response. However, the excessive bandwidth will introduce high-frequency noise such as PWM switching frequency, so parameter design need to consider the mutual influence on the control effect.

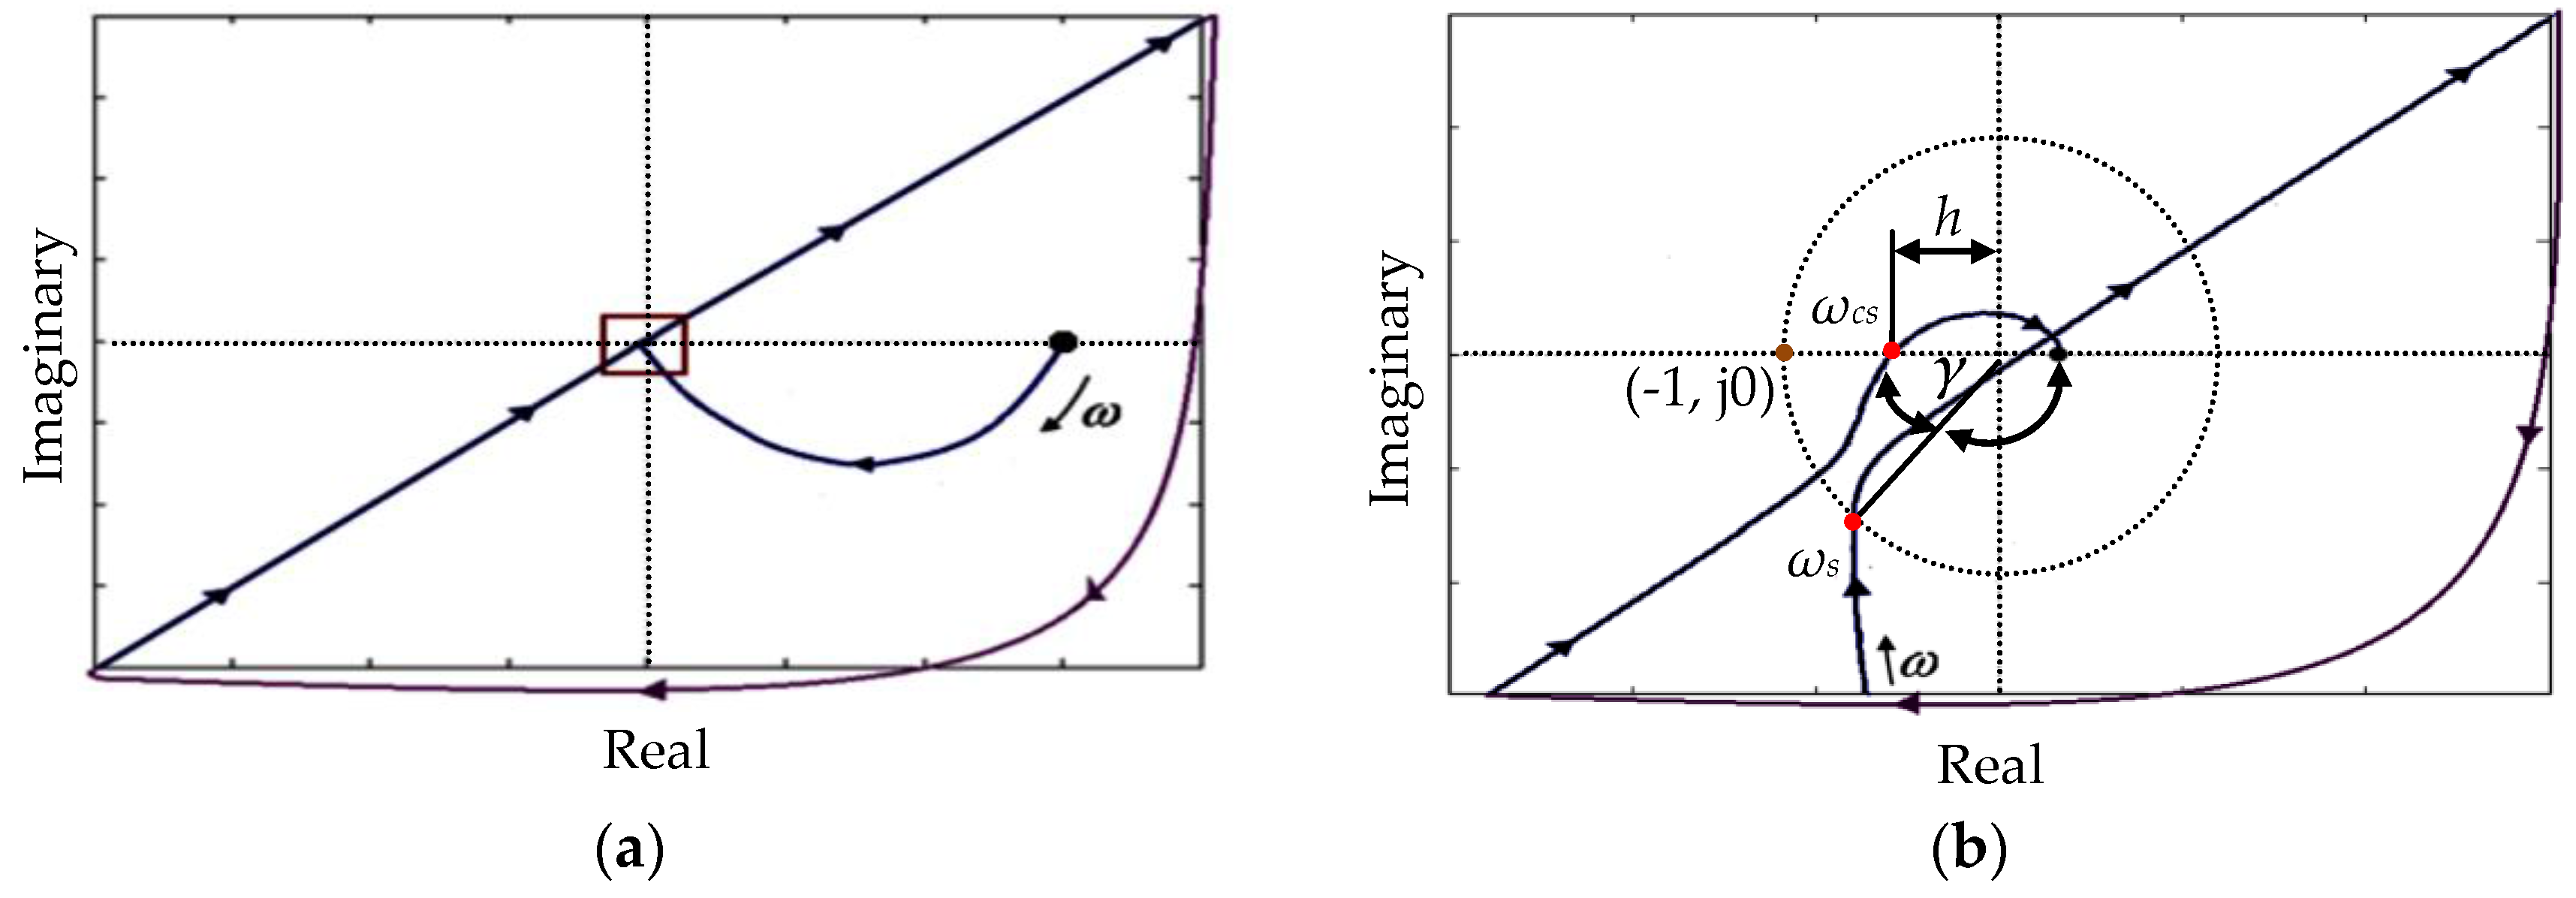
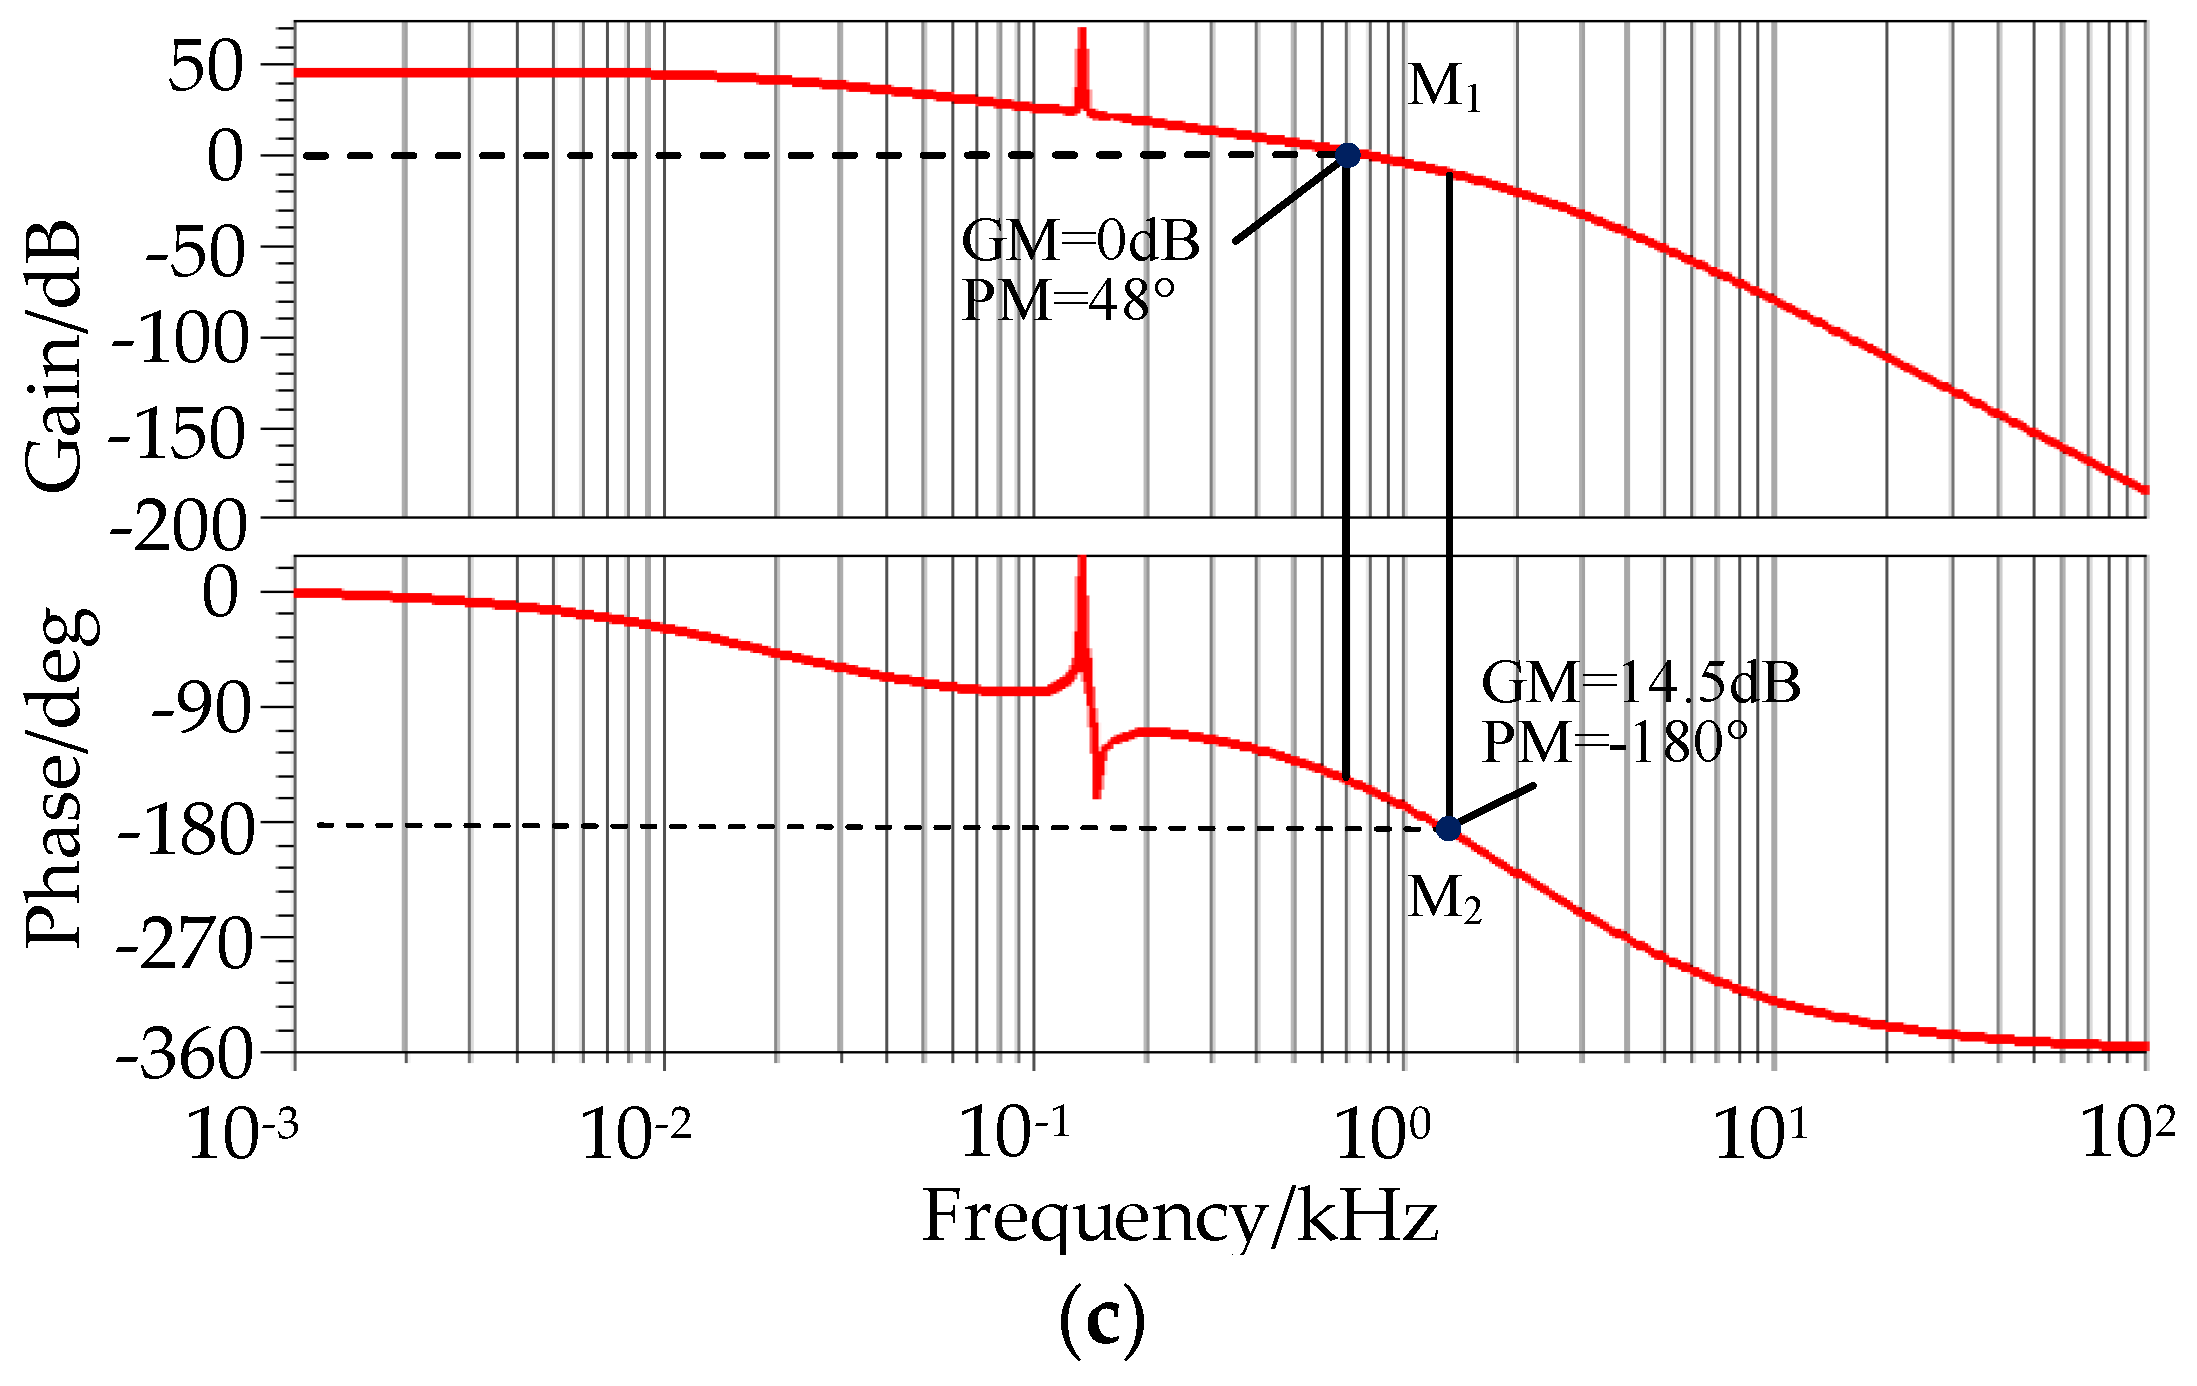
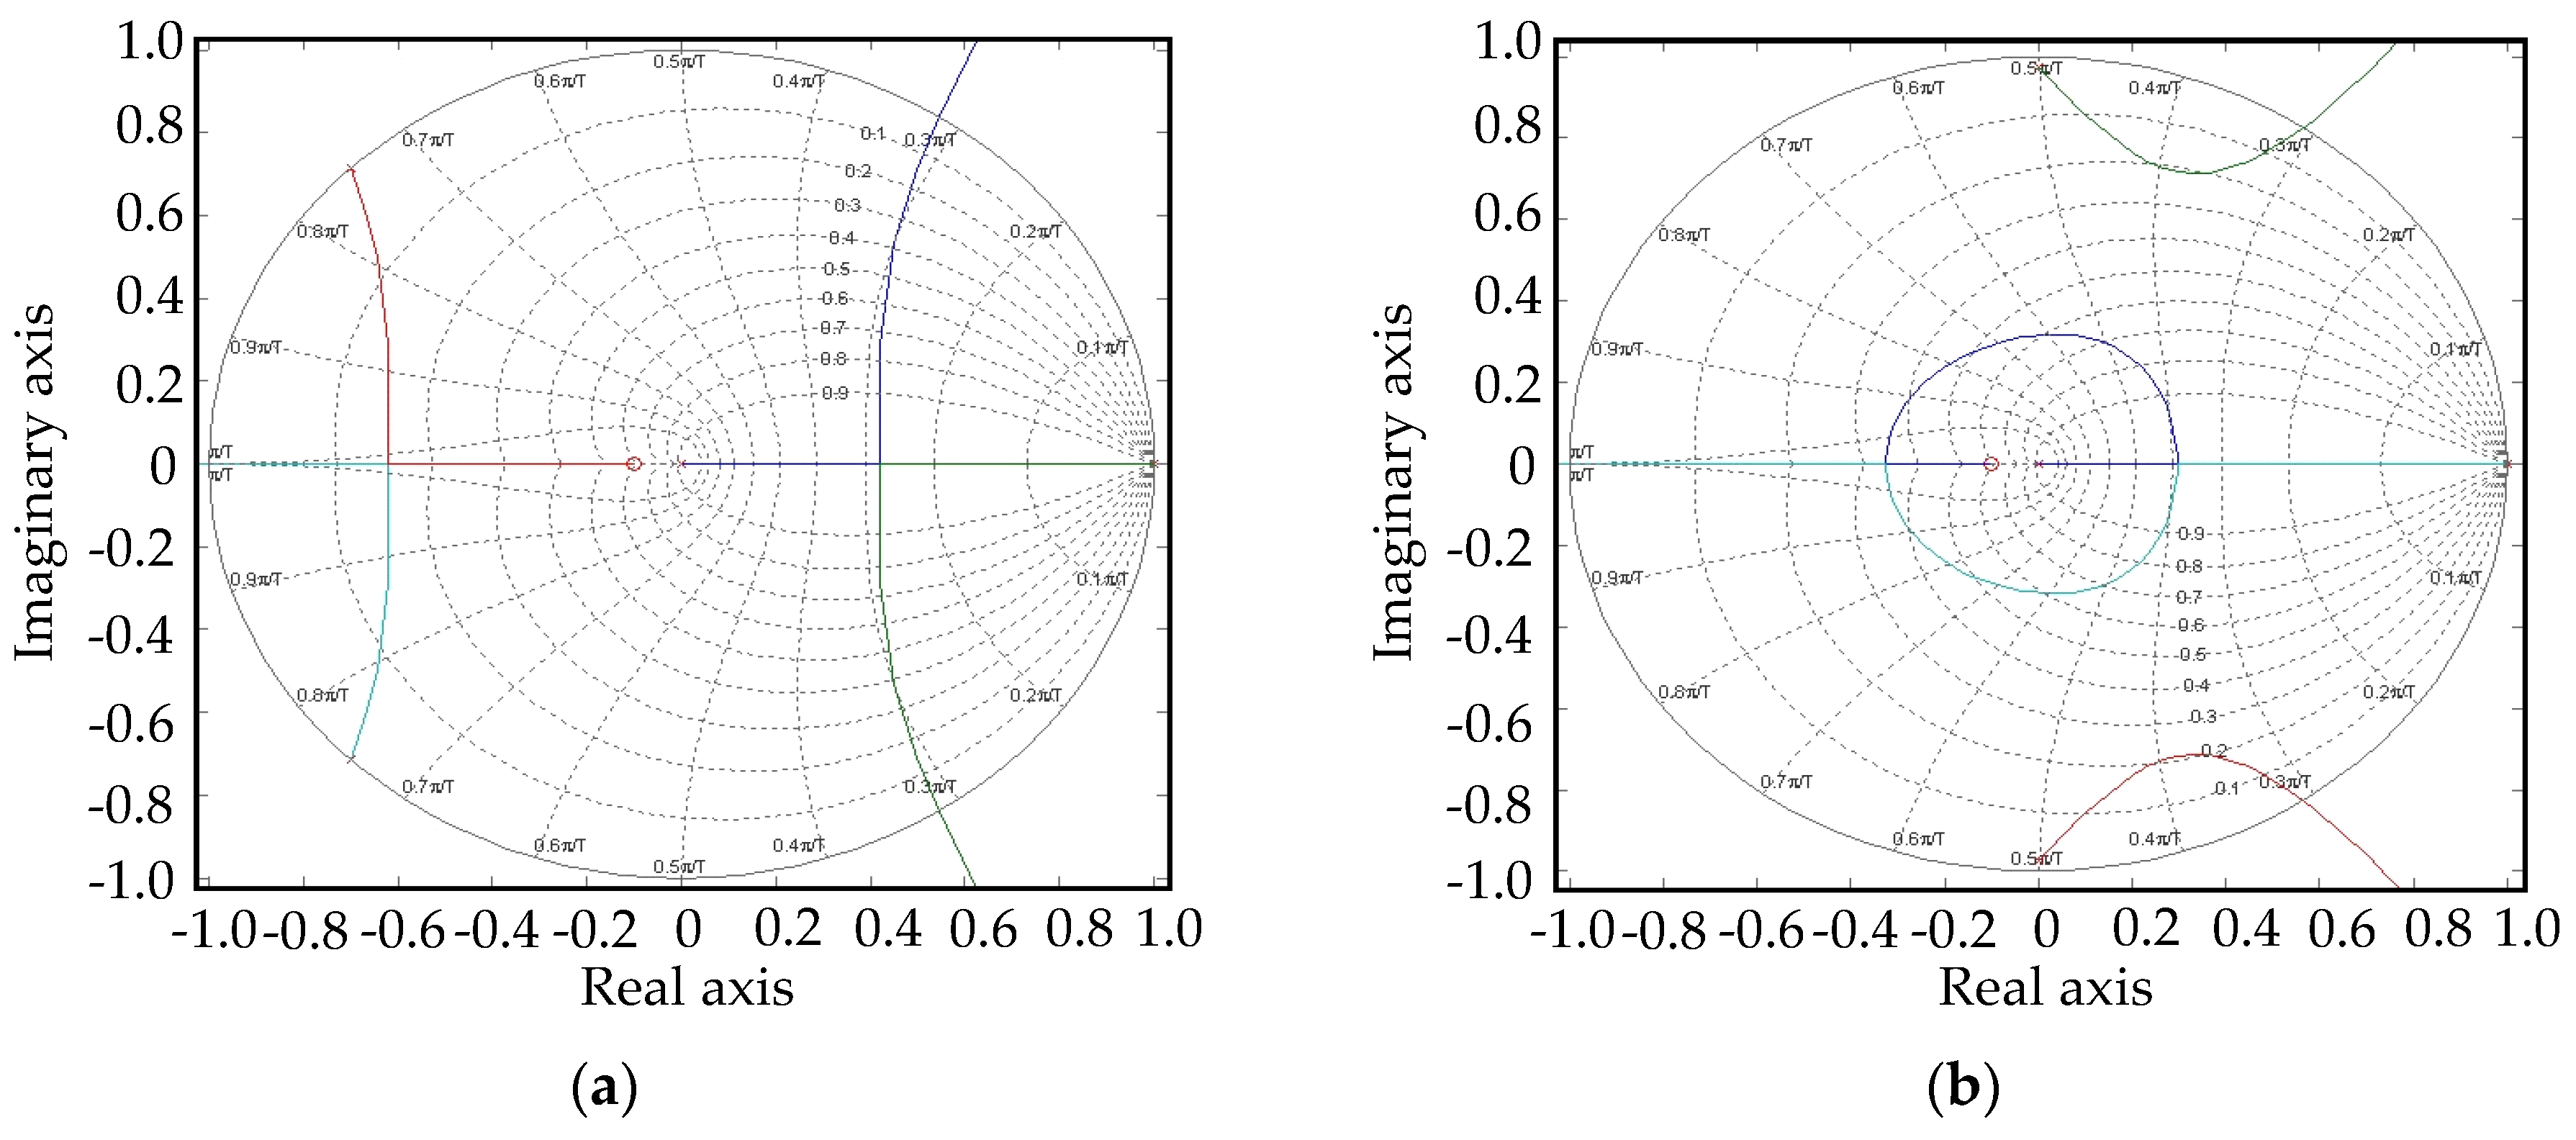
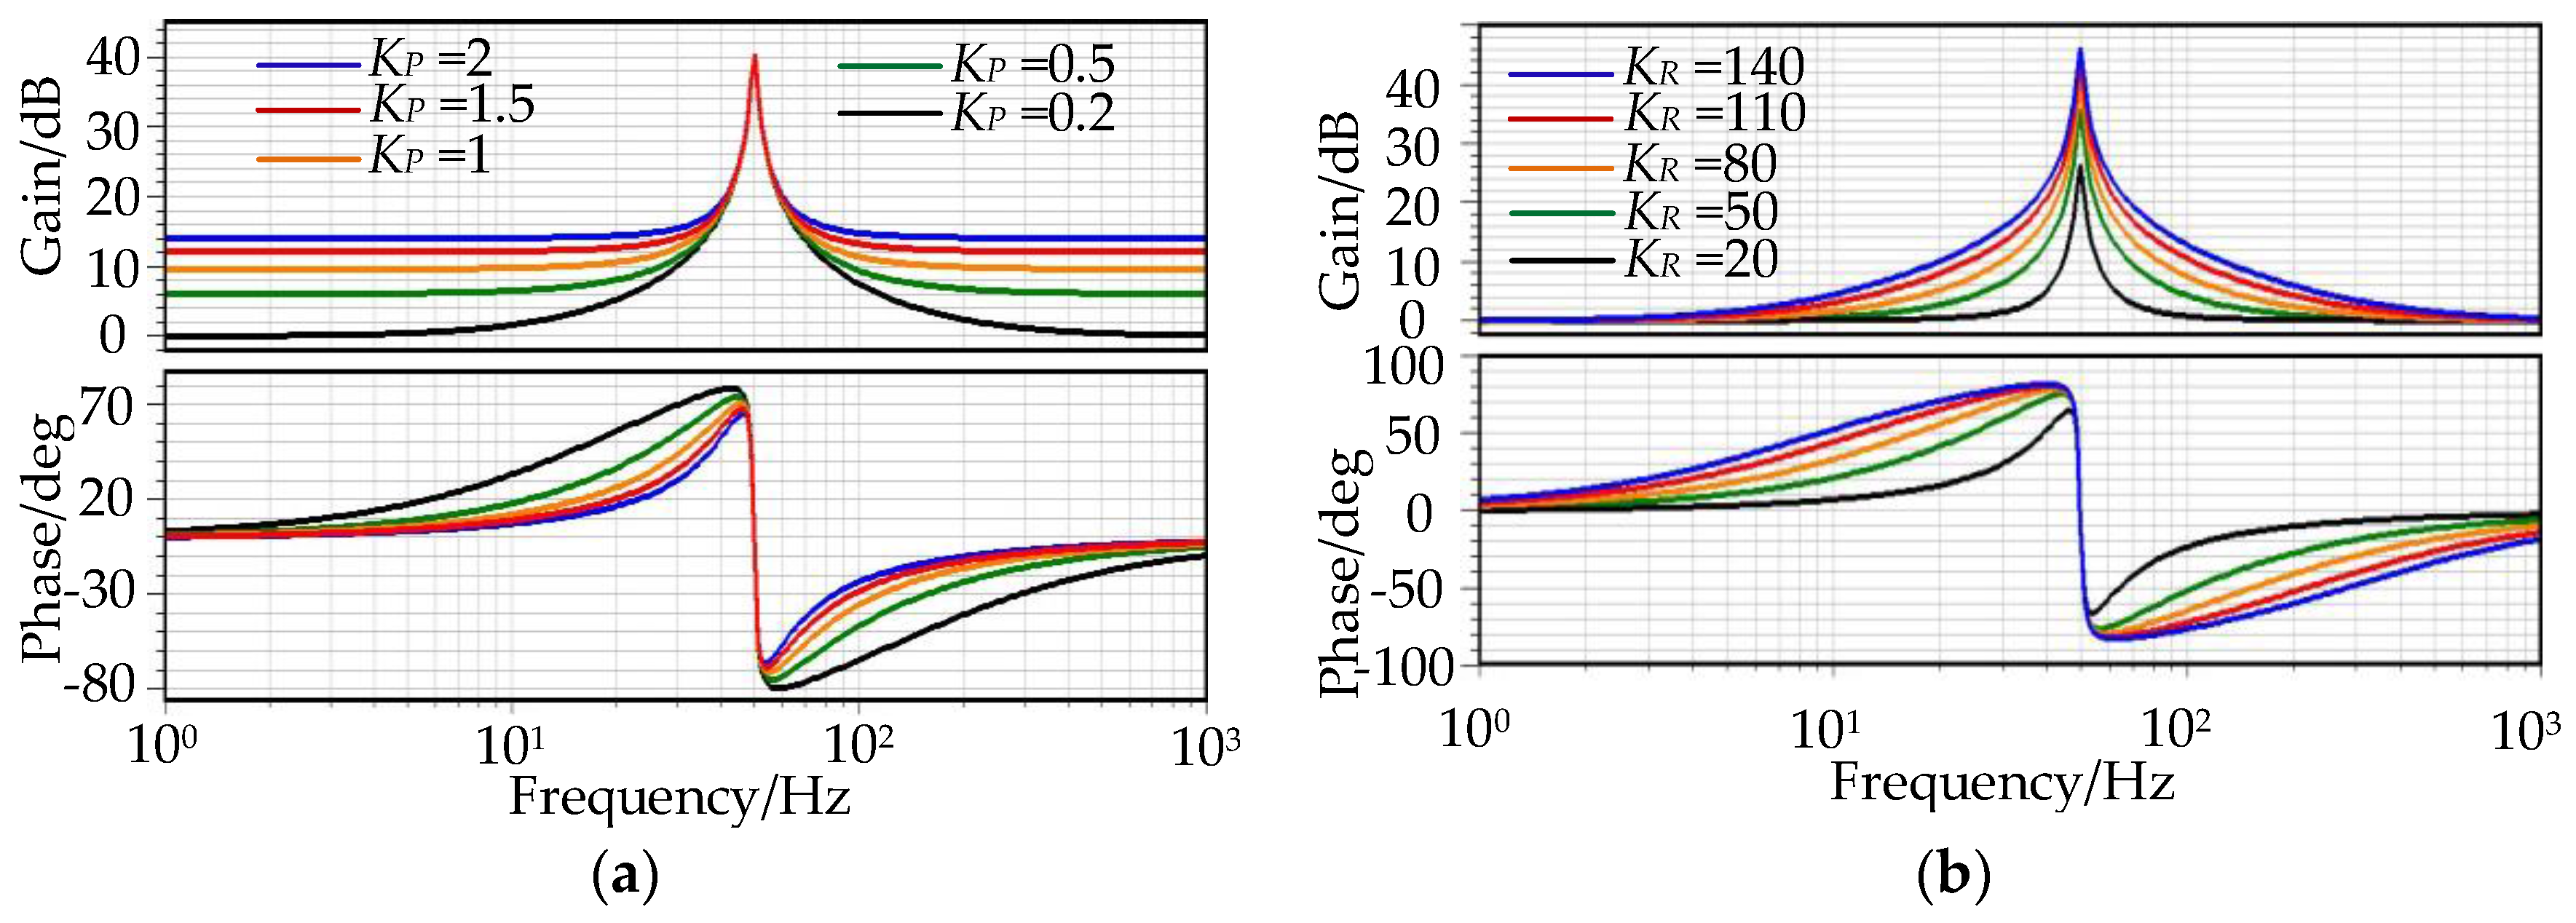
3.3. Design of Control Stability

To improve the dynamic and static behavior of the converter, it is important to analyze the stability of the presented control system [24,25]. According to the current loop model in Figure 8 and Equation (15), the transfer function of current control loop can be written as follows:
G ( s ) = i a i a * i a = G P R ( s ) G D ( s ) G V S C ( s ) G L ( s )
GD(s) is the transfer function of signal sampling and hold. As A/D sampling and transmission will lead to a time delay of calculation, GD(s) can be expressed as follows:
G D ( s ) = K d e T d s
It can be expressed by Taylor expansions:
G D ( s ) = K d e T d s = K d e T d s = K d 1 + T d s + 1 2 ! ( T d s ) 2 + 1 3 ! ( T d s ) 3 +
In Equation (18), s is replaced by , and then GD() can be expressed as:
G D ( j ω ) = K d [ 1 1 2 ! ( T d ω ) 2 + 1 4 ! ( T d ω ) 4 ] + j [ T d ω 1 3 ! ( T d ω ) 3 + 1 5 ! ( T d ω ) 5 ]
Because the frequency of sampling signal is much higher than the frequency of controlled current, the following relationship can be derived:
1 2 ! ( T d ω ) 2 < < 1 , 1 3 ! ( T d ω ) 3 < < T d ω
Based on the above analysis, the GD(s) can be written as a first-order delay function:
G D ( s ) K d T d s + 1
At the same time, duty cycle updating of the PWM waveform also brought a ωTs/2 delay, so the Taylor series expansion is used for modeling approximations of the Gp(s) as follows:
G P ( s ) = e T d s K P W M T P W M s + 1 K d T d s + 1 K P W M T P W M s + 1 K D T i s + 1
where is the ∑Ti is the equivalent delay factor; KD is the equivalent gain coefficient; Td is time delay of sample and hold; Kd is time delay coefficient of sample and hold; TPWM is the delay time of the pulse width modulation; KPWM is the delay coefficient of the pulse width modulation. The time delay including the sampling and transport delay is generally given by ∑Ti = 1.5 Ts, it will have a significant impact on the control stability. The influence of the delay factor on the current control is depicted in Figure 10. It’s shown that the design needs to consider a sufficient stability margin to enhance the robustness and avoid side effects.
Figure 11 shows the frequency response characteristic curve of closed-loop control. It can be used to discuss the stability margin of the control system. Angular frequency ωs is the crossover frequency of the amplitude gain at point M1; angular frequency ωcs is the crossover frequency of the phase gain at point M2. It can be seen from Figure 11a,b that the point (−1, j0) isn’t encircled in the Nyquist curve as ω increases, and no poles appear in the right coordinate plane. In Figure 11c, the amplitude margin is h = −20lg | G j ω c s | = 14.5 dB and the phase margin is γ = π + G ( j ω c s ) = 48°. Considering the parameter deviation between the real system and the physical model, the requirements of the stability margin are 30° ≤ PM ≤ 60° and GM > 6 dB. As shown in the Bode diagram, it is found that the bandwidth is wide enough to meet the stability margin requirements for the generator output current control, even if the generator output current frequency is between 100 Hz and 200 Hz.

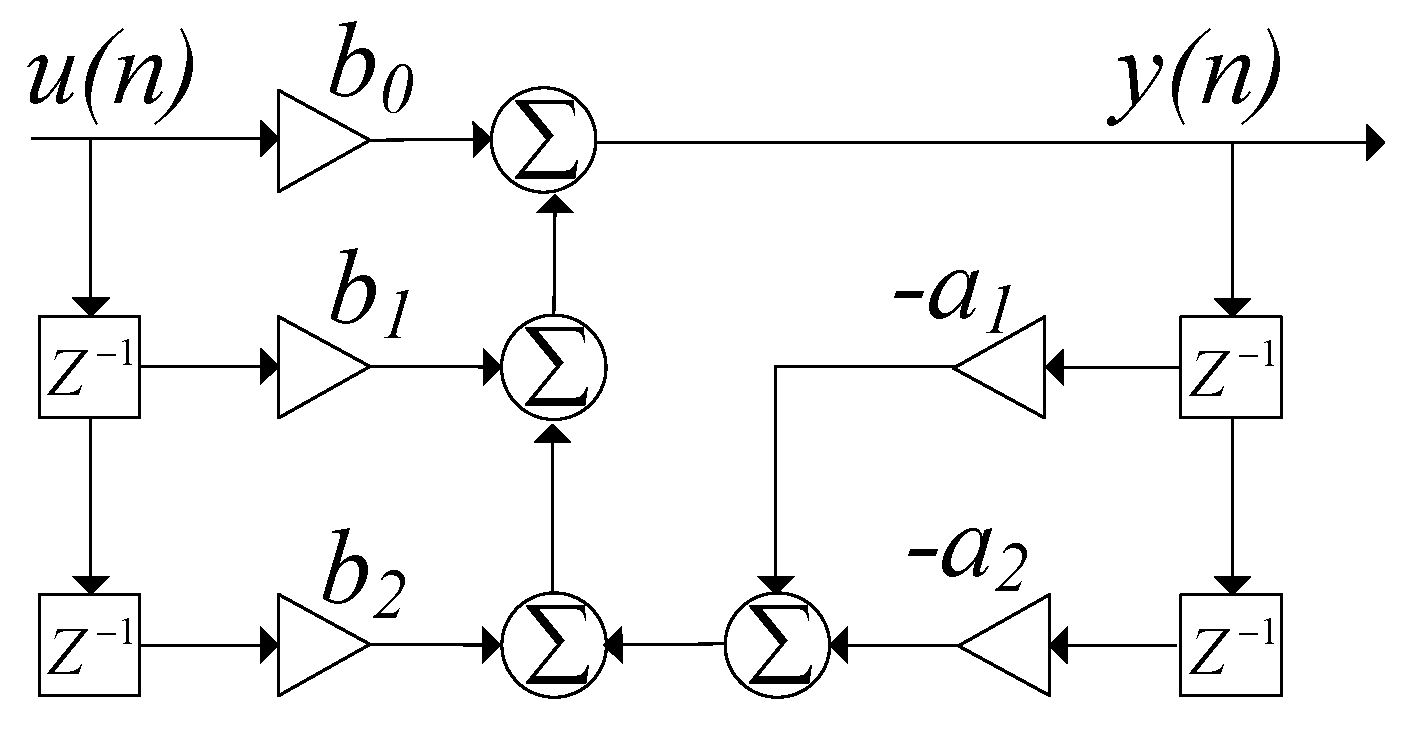
3.4. Implementation of PR Controller

In order to realize digital control, the proposed PR controller is discretized using the pre-Tustin transformation method which can realize the mapping between s-domain and the z-domain [26,27]:
s = ω tan ( ω T s / 2 ) 1 z 1 1 + z 1
Ts and ω are sampling time and resonant frequency, respectively. Compared with the traditional Tustin discretization, the correction factor ω/tan(ωTs) is used to replace 2/Ts to avoid frequency aliasing distortion and phase shift. Substituting Equation (23) into GPR(s), the transfer function of PR regulator in z-domain can be deduced as follows:
G P R ( z ) = b 2 z 2 + b 1 z 1 + b 0 a 2 z 2 + a 1 z 1 + 1
where
a 1 = 2 ω 0 2 2 γ 2 γ 2 + 2 ω c γ + ω 0 2
a 2 = γ 2 2 ω c γ + ω 0 2 γ 2 + 2 ω c γ + ω 0 2
b 0 = K P + 2 K R ω c γ γ 2 + 2 ω c γ + ω 0 2
b 1 = ( 2 ω 0 2 2 γ 2 ) K P γ 2 + 2 ω c γ + ω 0 2
b 2 = ( γ 2 2 ω c γ + ω 0 2 ) K P 2 ω c γ K R γ 2 + 2 ω c γ + ω 0 2
γ = ω 0 tan ( ω 0 T s 2 )
Above Equation (24) can be transformed into differential analytic function as follow:
y ( n ) = a 1 y ( n 1 ) a 2 y ( n 2 ) + b 0 u ( n ) + b 1 u ( n 1 ) + b 2 u ( n 2 )
Equation (25) is implemented by using digitization. It is shown in Figure 12 where u(n) and y(n) are input and output of the PR regular at the nth sampling time.
It’s important to select the optimum sampling frequency during discretization. The performance of the controller is poor when the selected sampling frequency is low. It’s better to set the frequency as large as possible. However higher sampling rates imply a higher data rate. In order to select an optimum sampling frequency, an oversampling method whose sampling frequency is greater than the Nyquist frequency is adopted to keep the sampling frequency away from the resonant frequency. As shown in Figure 13, the influence of the sampling frequency on the performance of the designed PR controller is discussed by root locus plots.
From the root plot we can see that the high or low sampling frequency will lead to poor stability of the control system. When the sampling frequency is selected in the range of 2 kHz to 3 kHz, even if the gain coefficient changes over a wide range, it can meet the requirement of system stability margin, and reduce aliasing distortion.

4. Simulation and Experimental Results

4.1. Simulation Results

According to the control strategy of Figure 7, a simulation system is built to verify the effectiveness of the designed control method. The speed of the engine-generator set is defined based on generator torque to realize the RE in the most efficient region when the RE is running in power following mode, then control the output power regulation. The outer loop obtained the actual power value by detecting the DC bus voltage and current; the inner loop introduced the PR controller. Figure 14a,b depict the proposed PR strategy compared with the traditional Space Vector Modulation (SVM) of the generator output current tracking reference value, respectively. The reference current is almost exactly the same as the actual output current using the PR strategy.
The simulation system tests the dynamic performance when the power demand changes to ensure the dynamic response performance. According to the control state chart of Figure 6, RE maintains a constant 8 kW when the vehicle power demand value is lower than 8 kW. When the vehicle power demand is more than 8 kW, the current reference is obtained via the power demand. As shown in Figure 15, the current varies fast when the power demand changes, and the system reaches a steady state in a short time without overshoot appearing.

4.2. Experimental Results

Experiments with the designed PR controller were conducted on a lab sample. The test bench is shown in Figure 16. As shown in Figure 17, a dynamic response of the generator control is observed. The proposed method realizes generator current control with fast response. This is due to the direct current control by the current loop of Figure 8 and the high gain of the PR controller at the resonant frequency. Figure 17b depicts the actual power tracking reference, where there is no significant fluctuation. It is shown that the power following control by the fast current loop improves the system response. Figure 18 shows the generator efficiency at different speed settings with the proposed PR controller. When the output power value is lower than 8 kW, the operating points are outside of the high efficiency region; but when the output power value is more than 8 kW, the generator efficiency is more than 90%. The generator efficiency trend under different speed settings is basically the same.

5. Conclusions

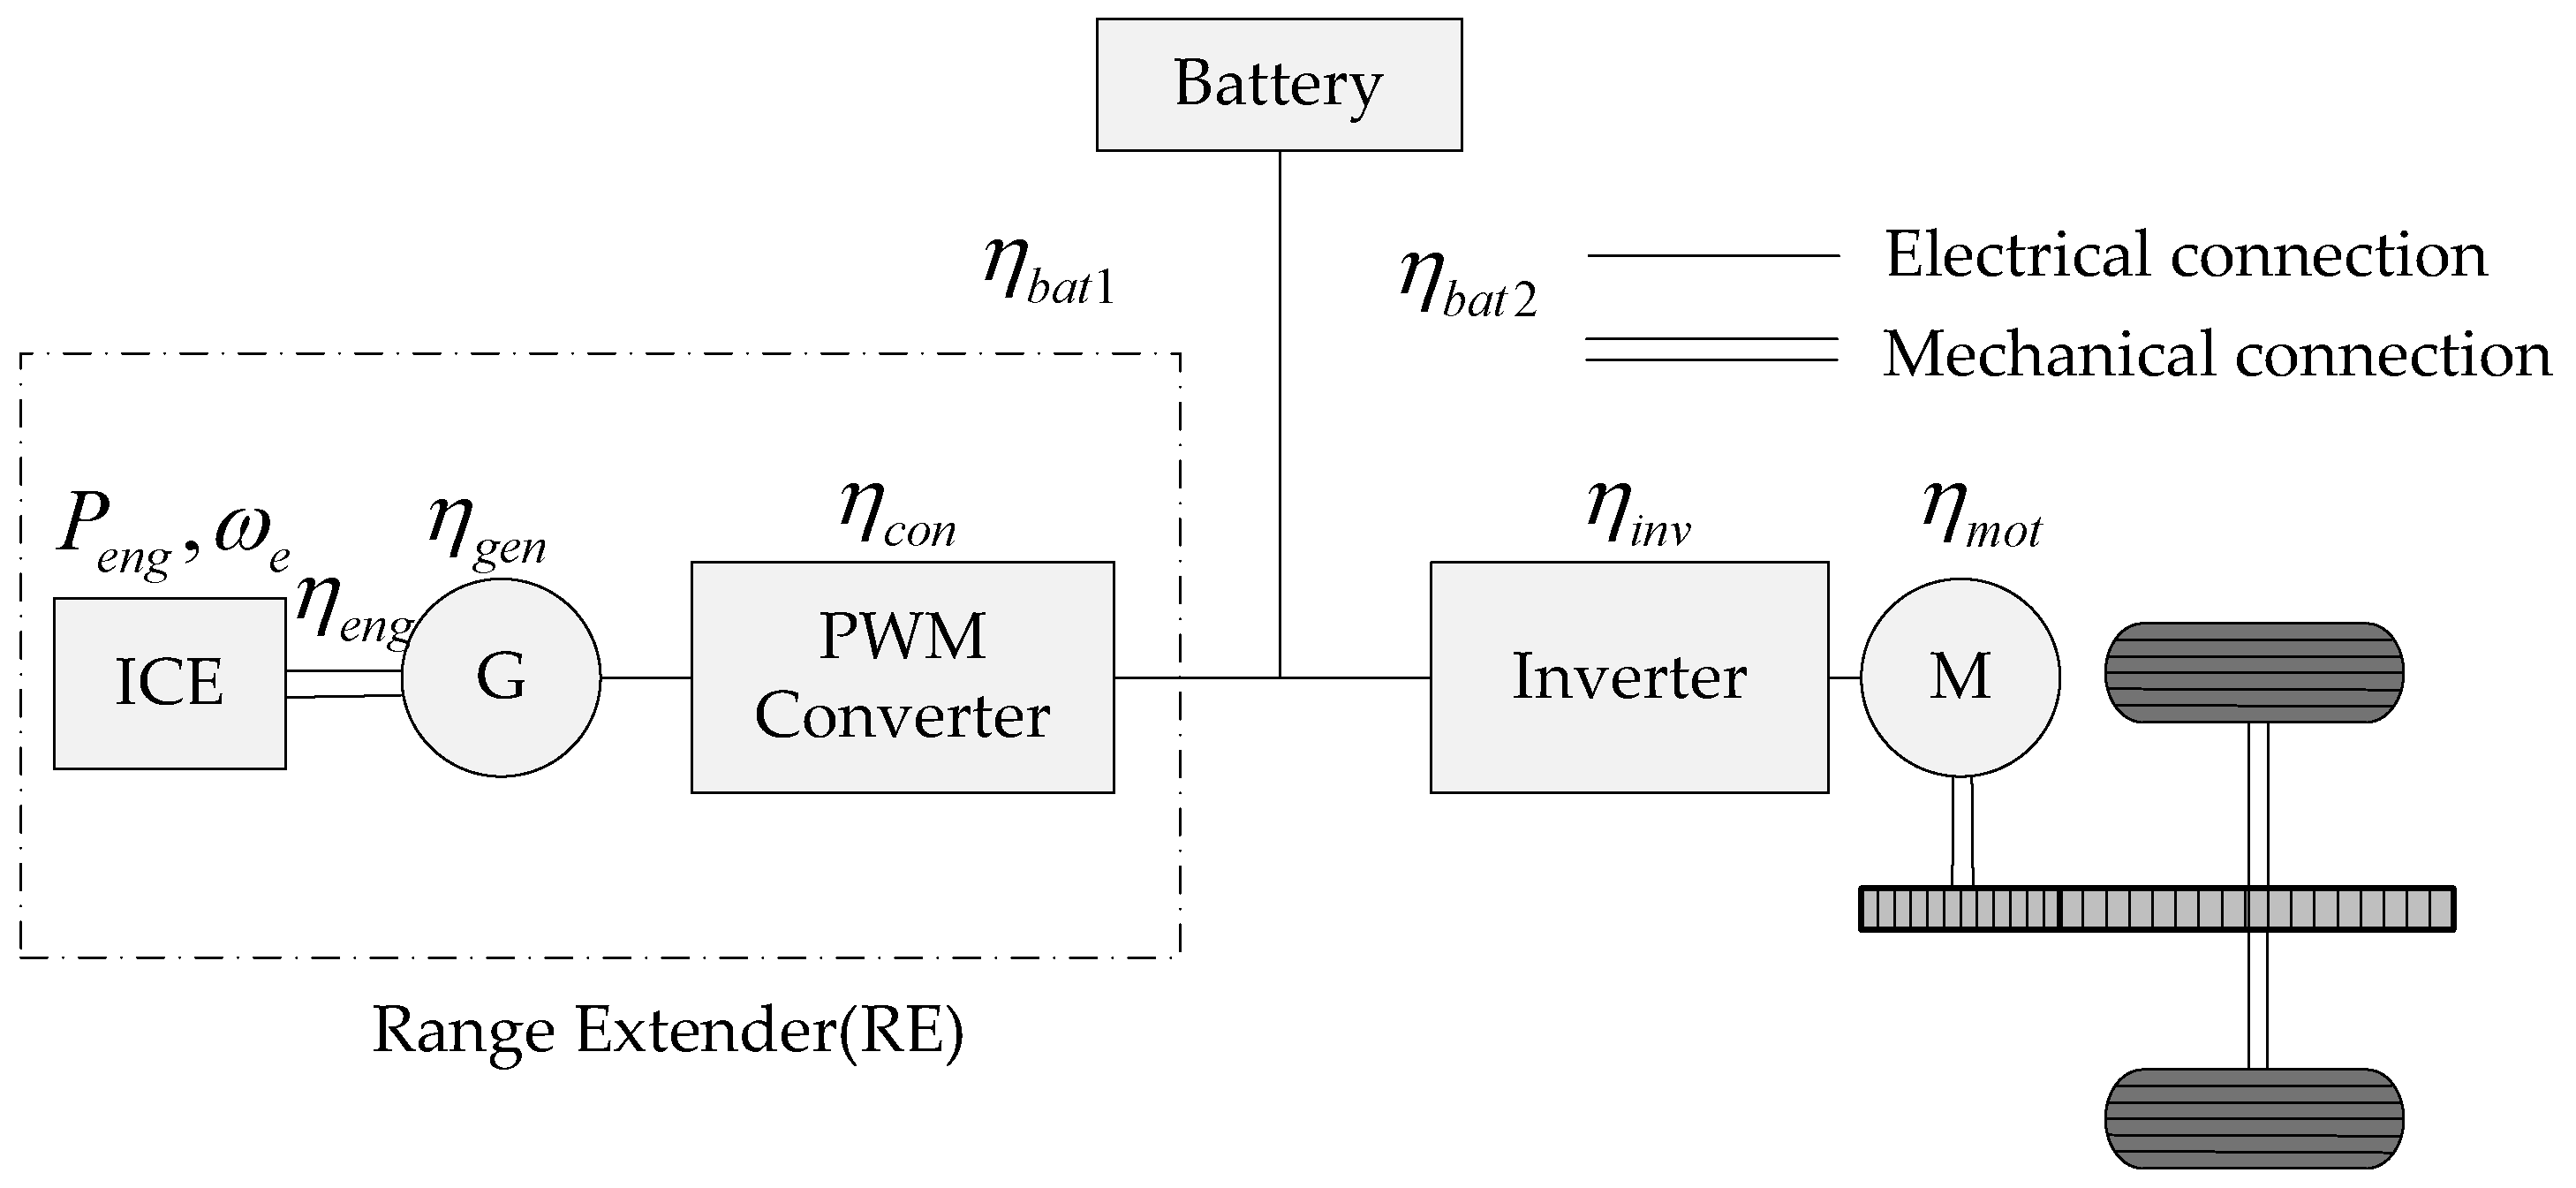
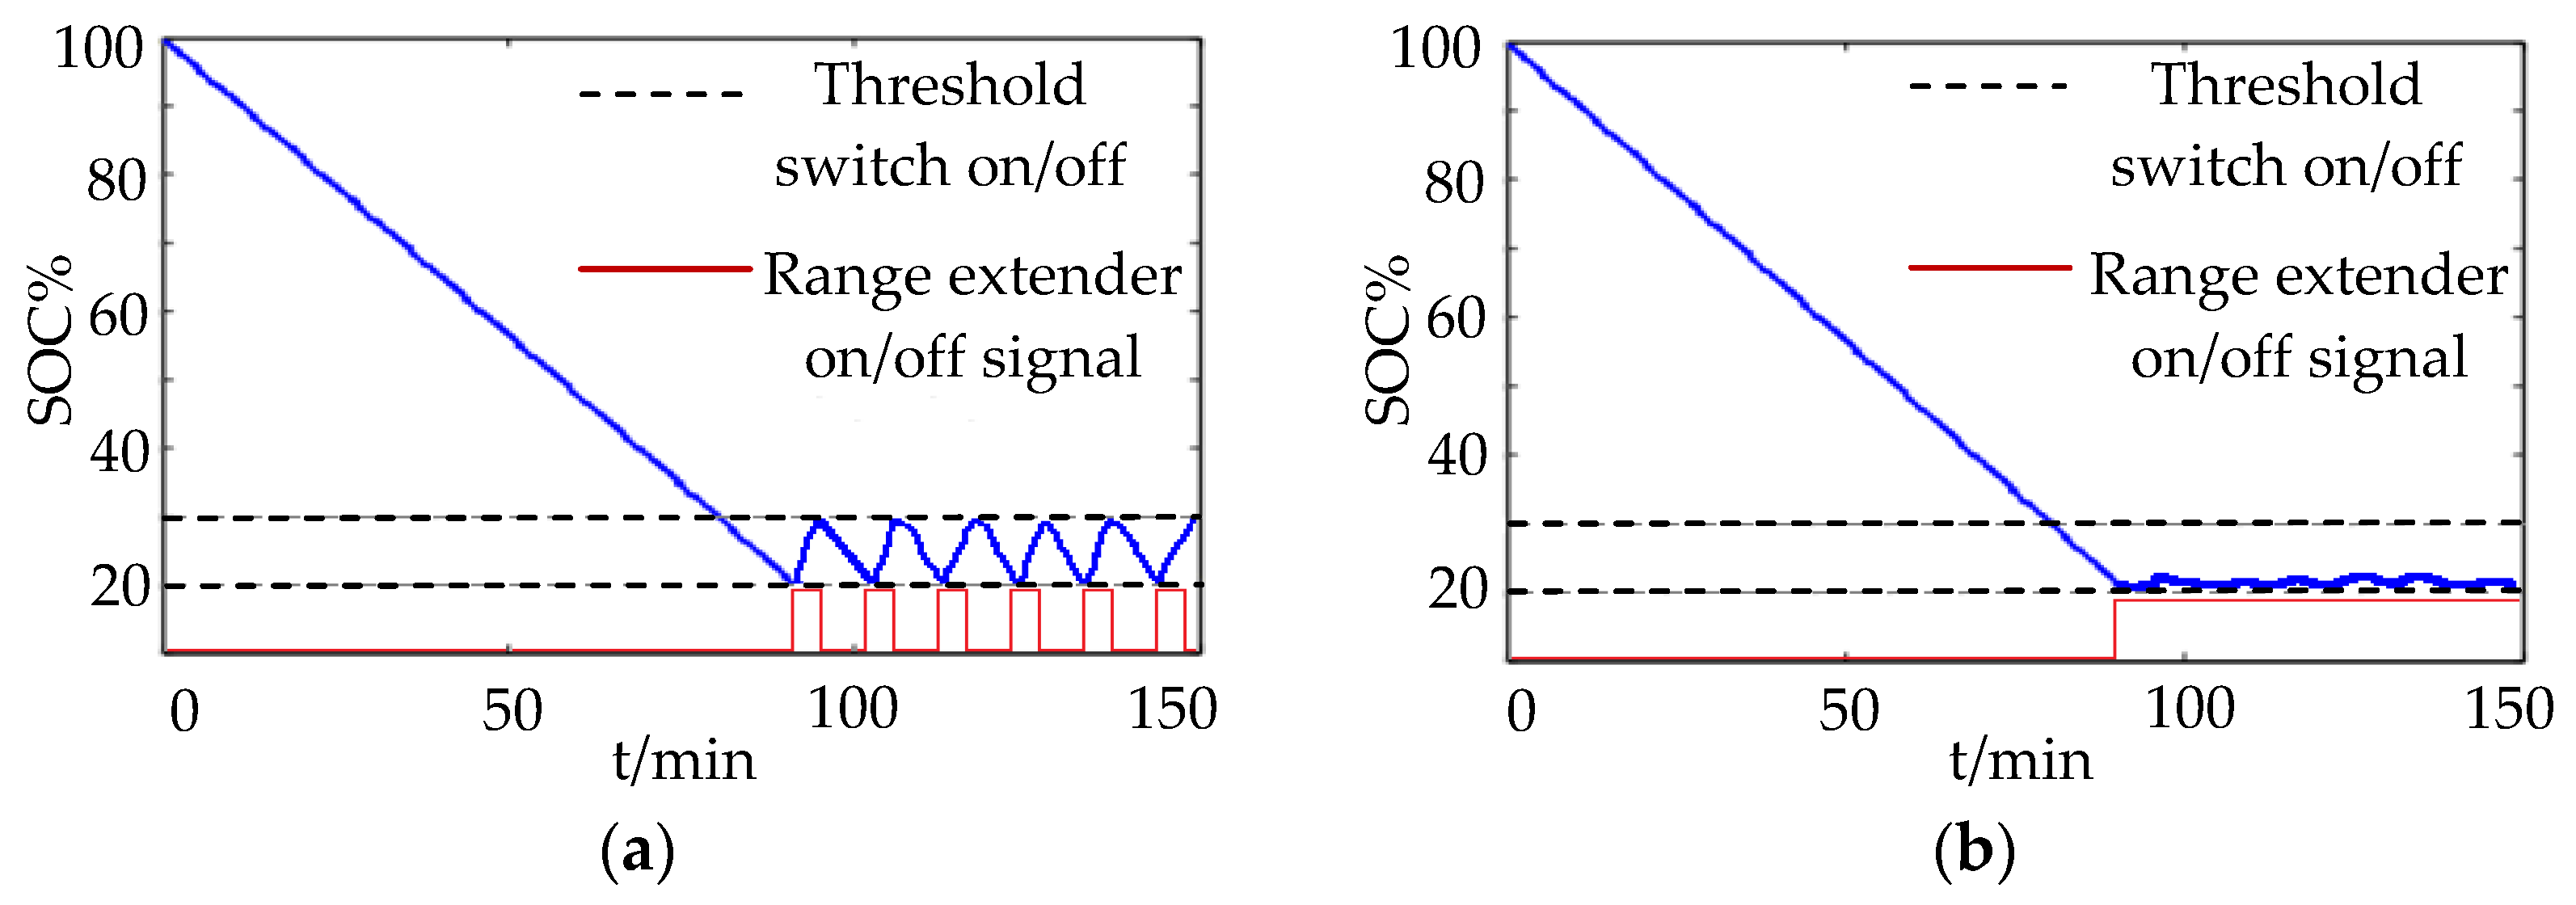
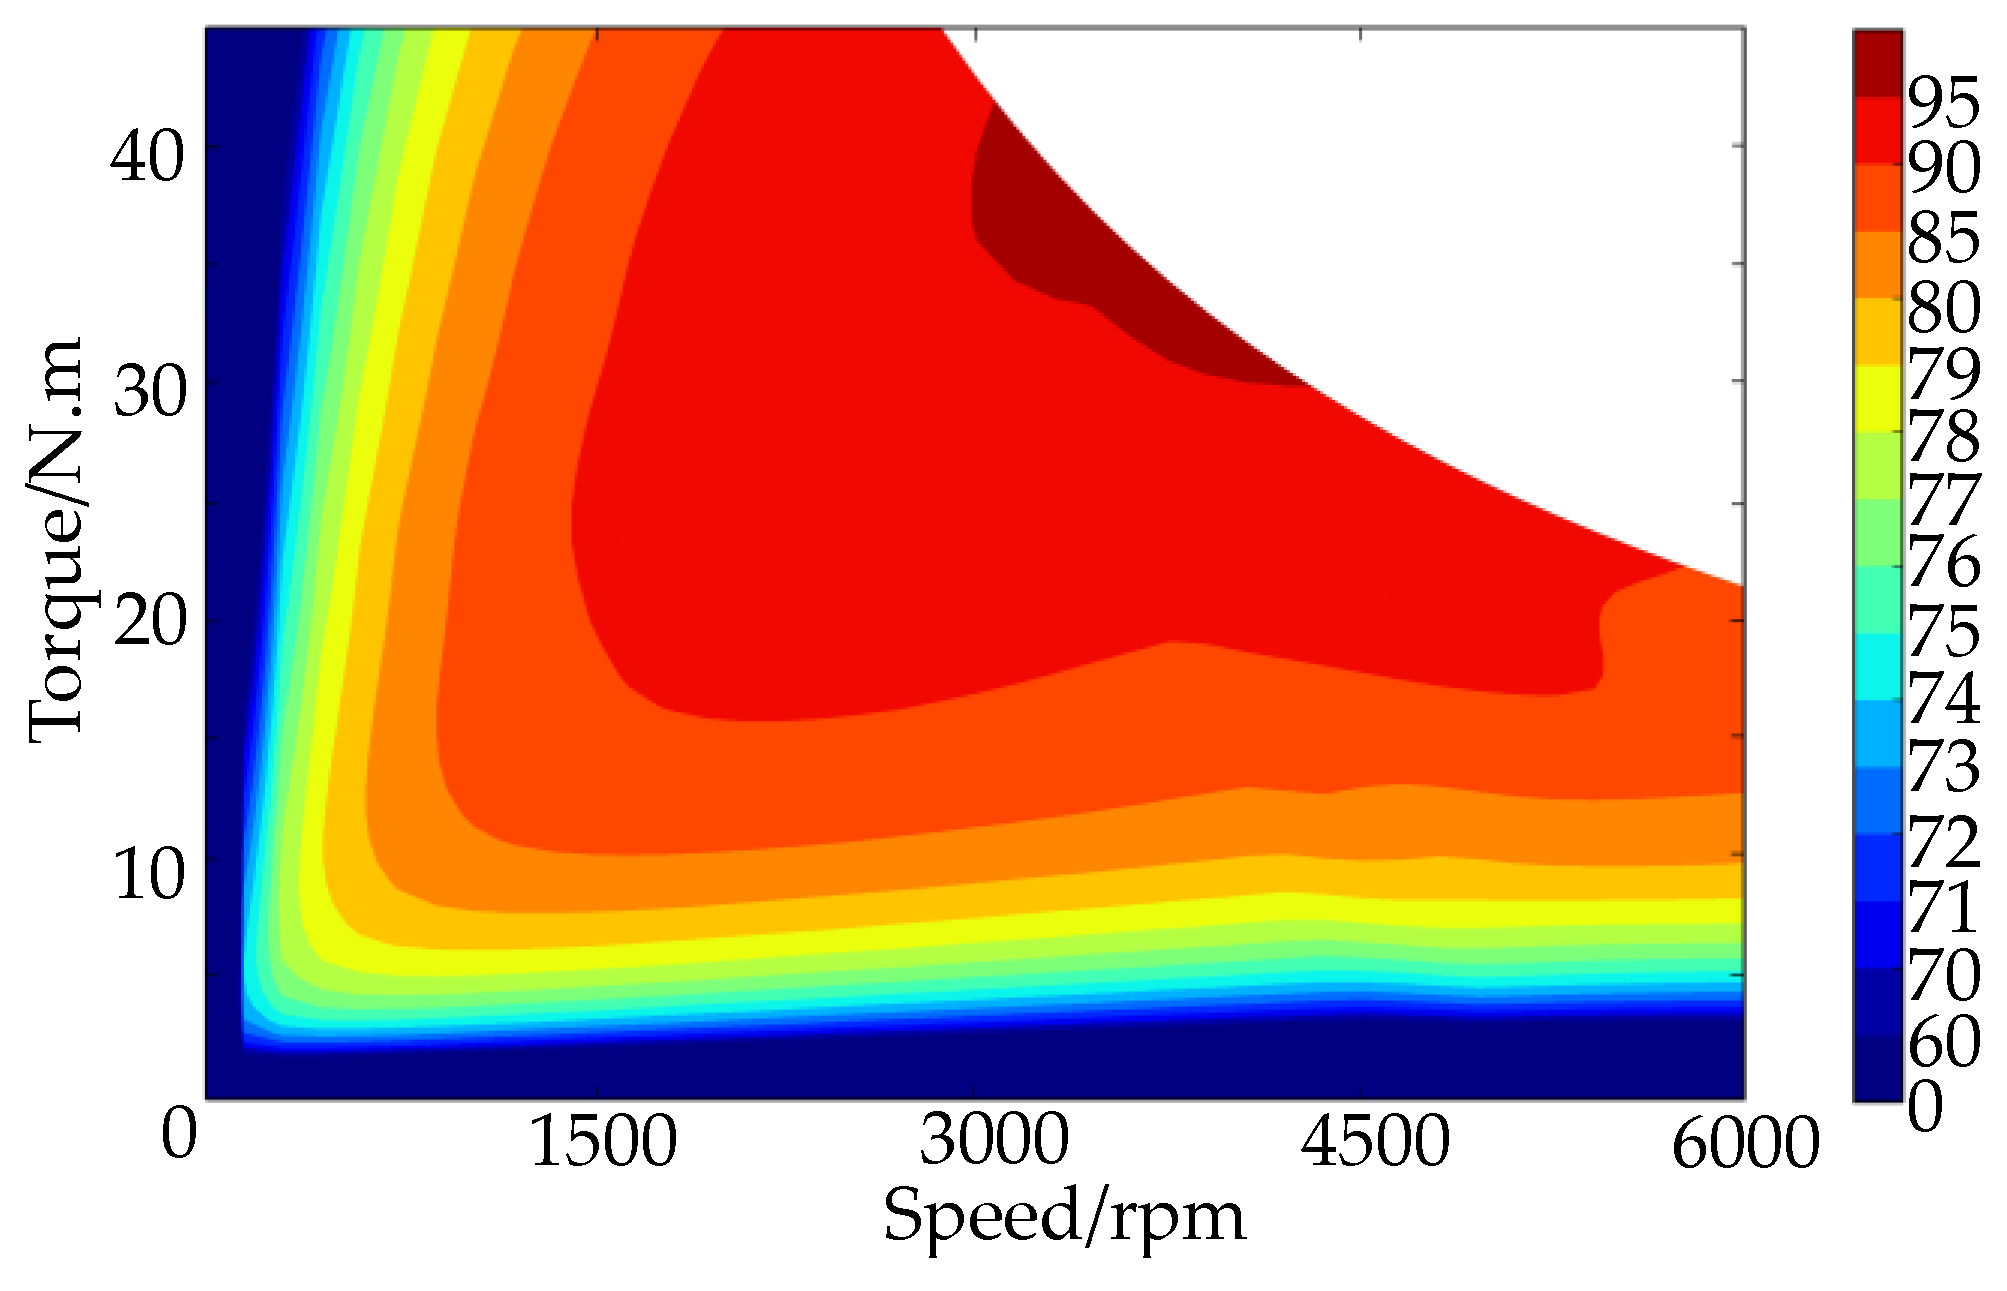
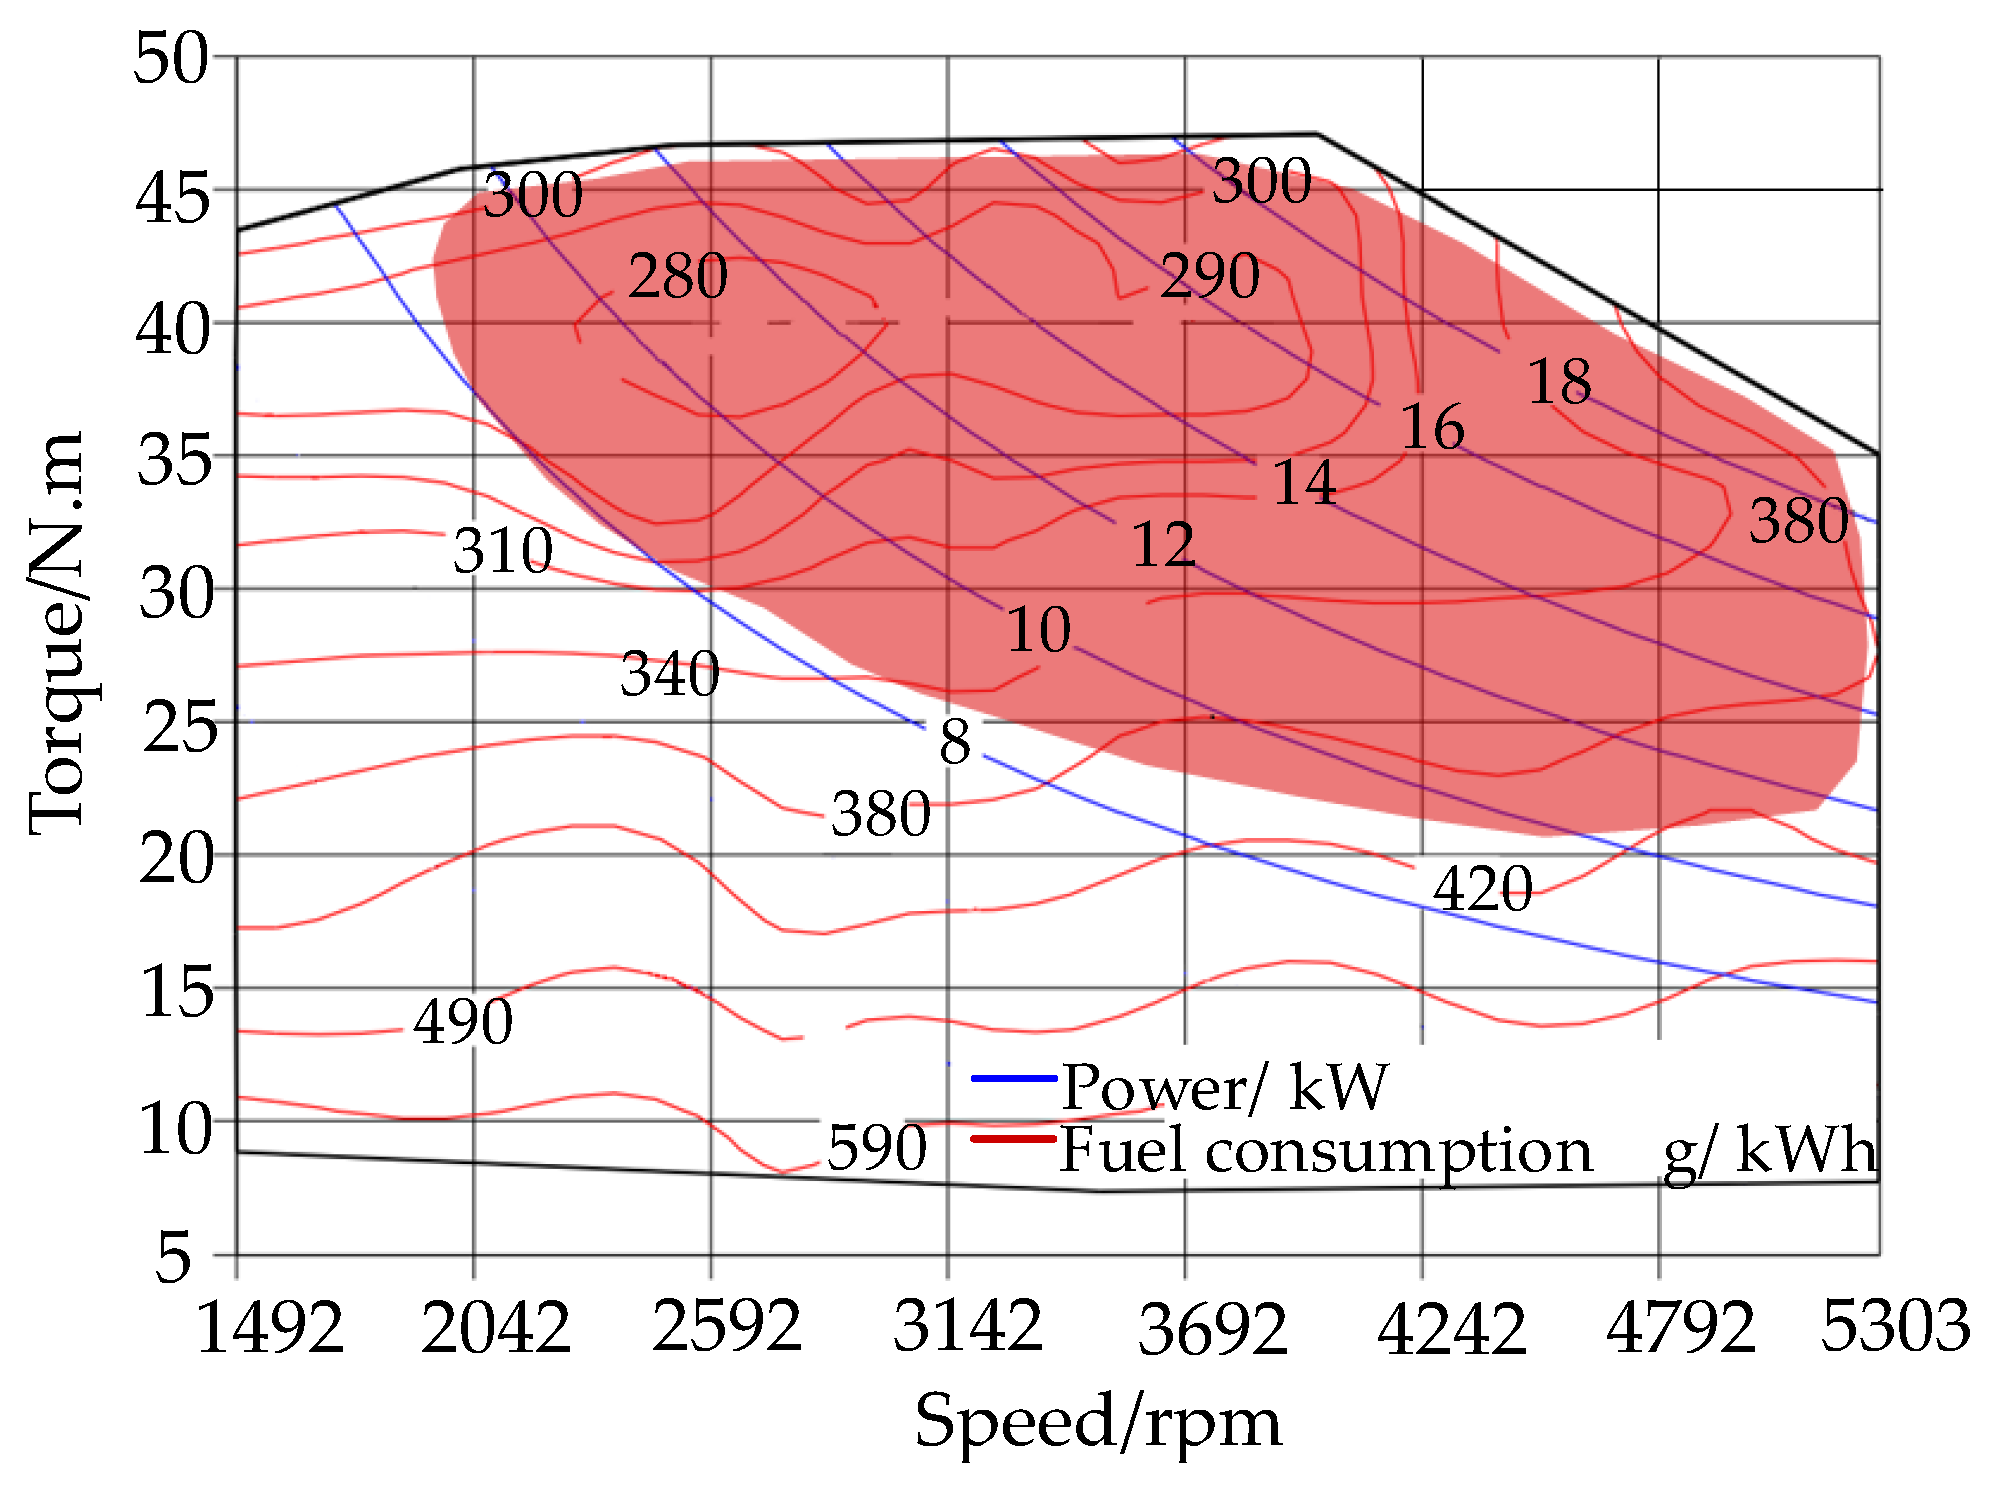
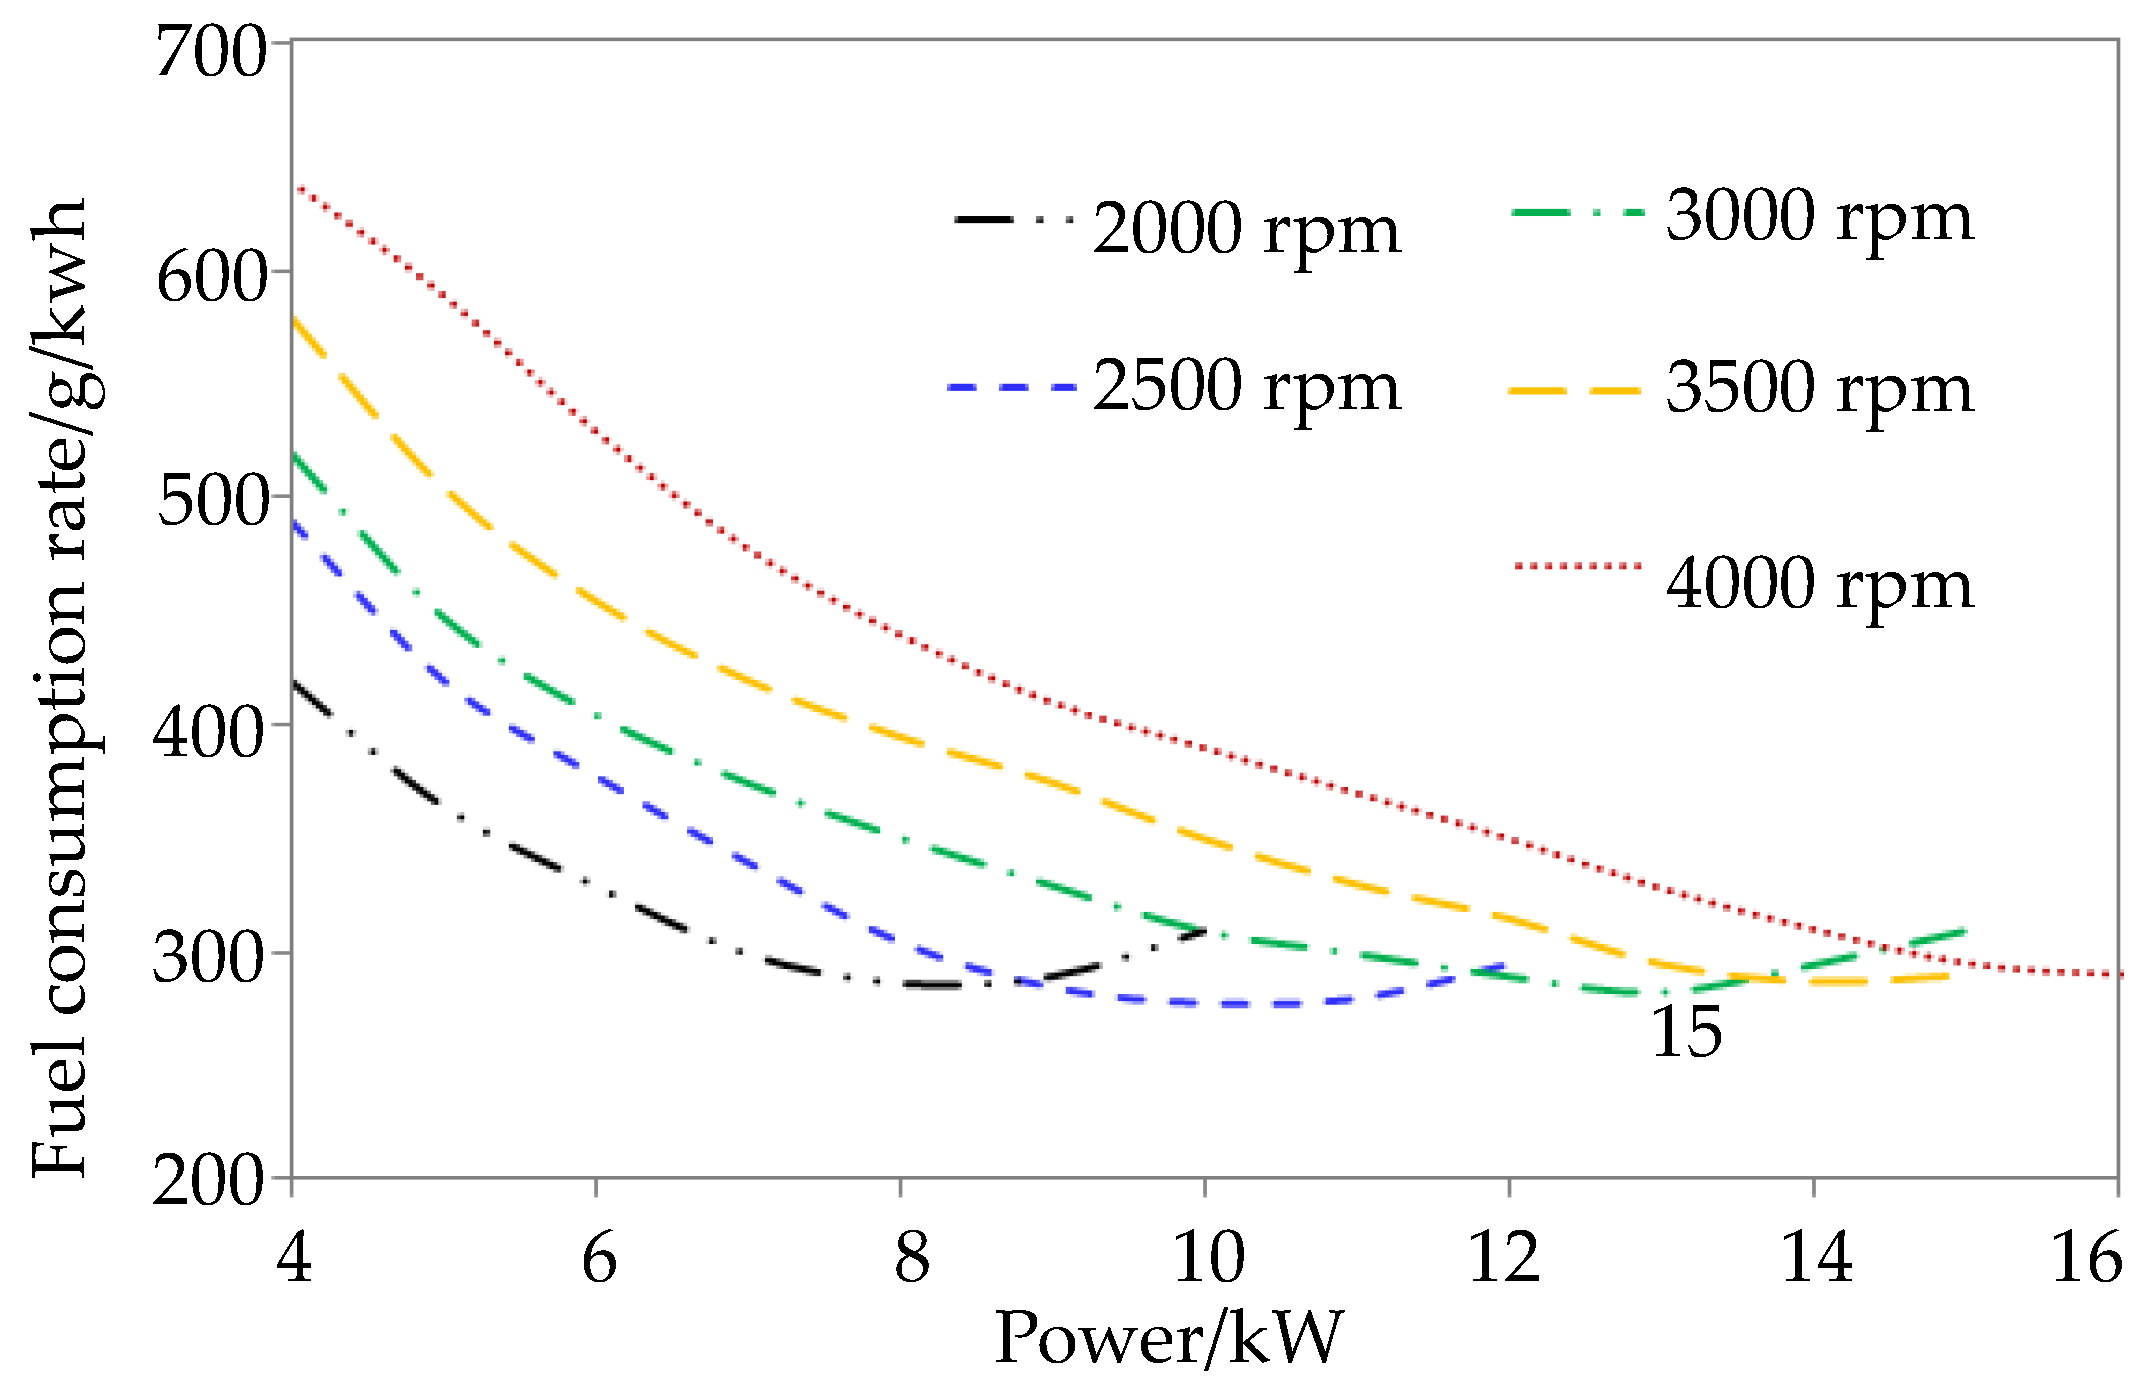
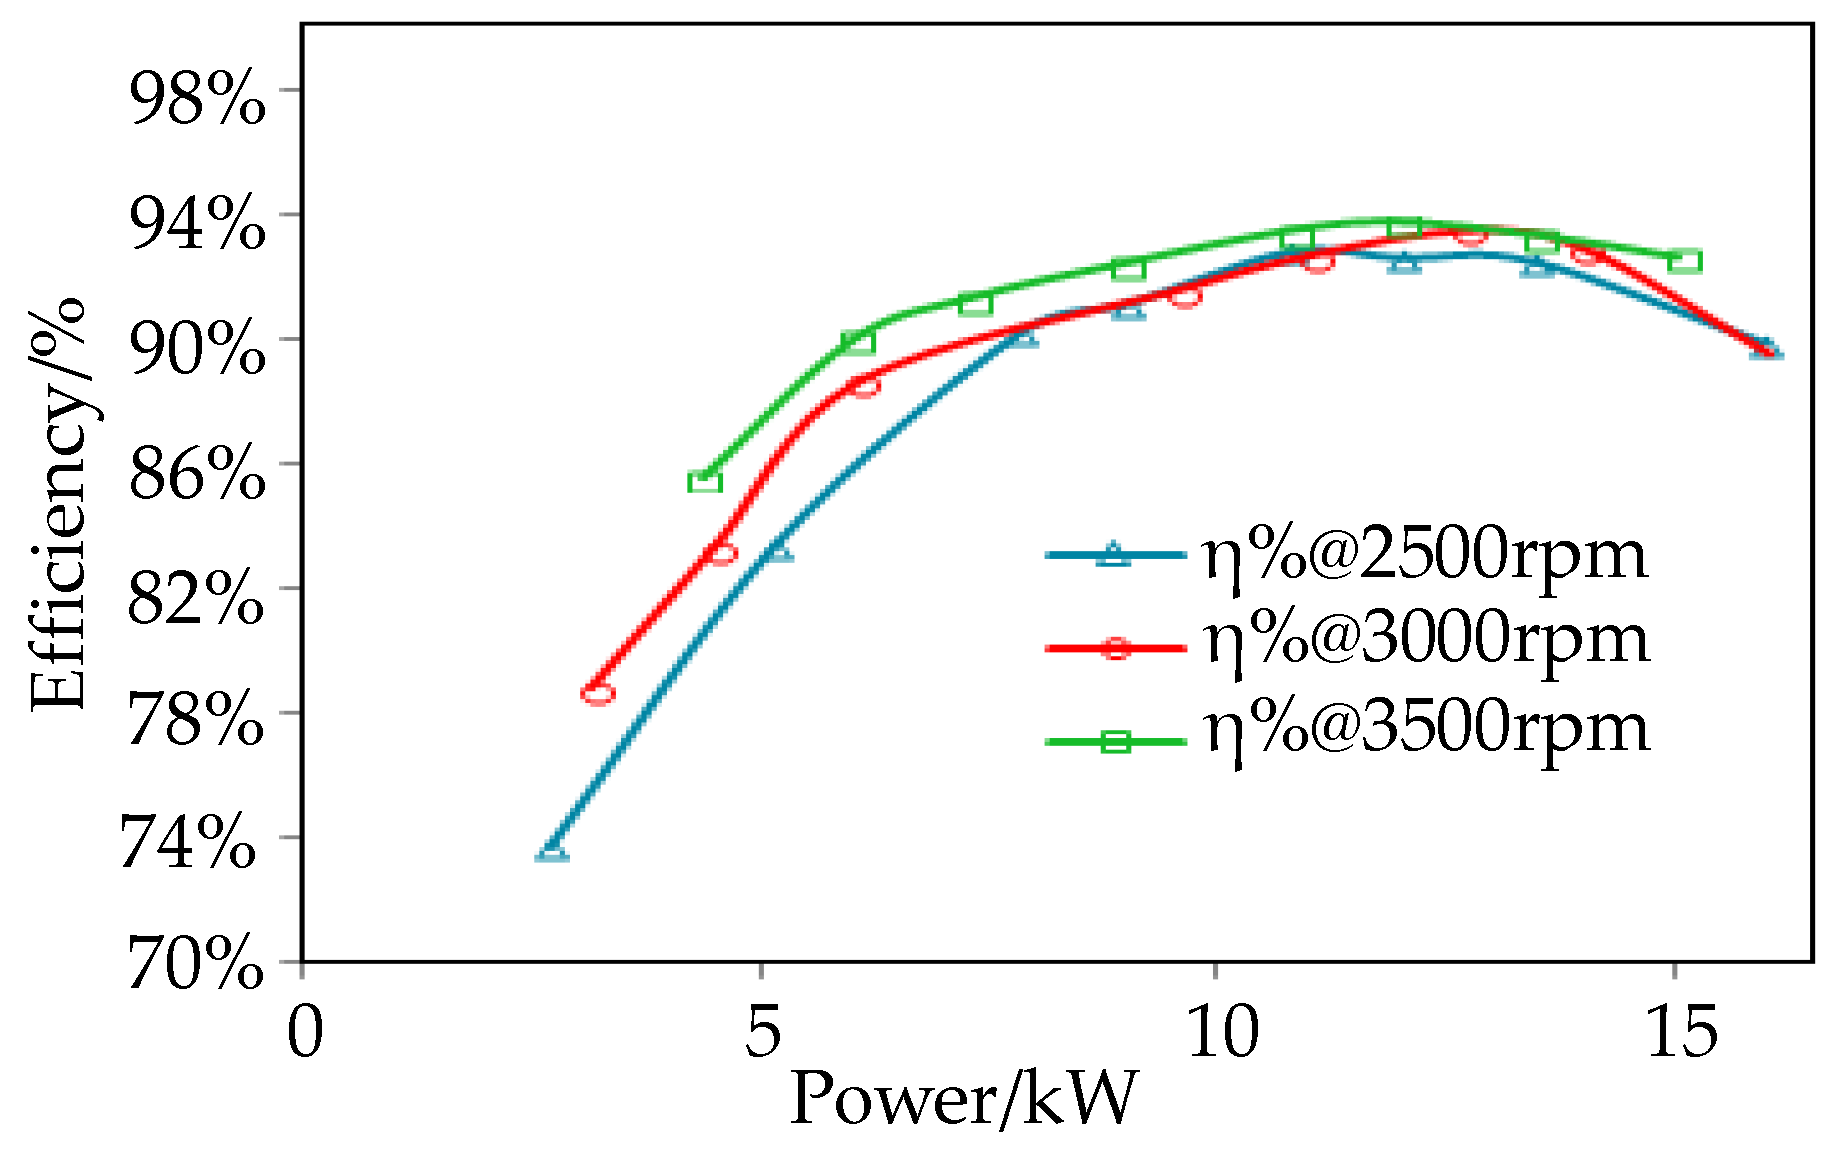
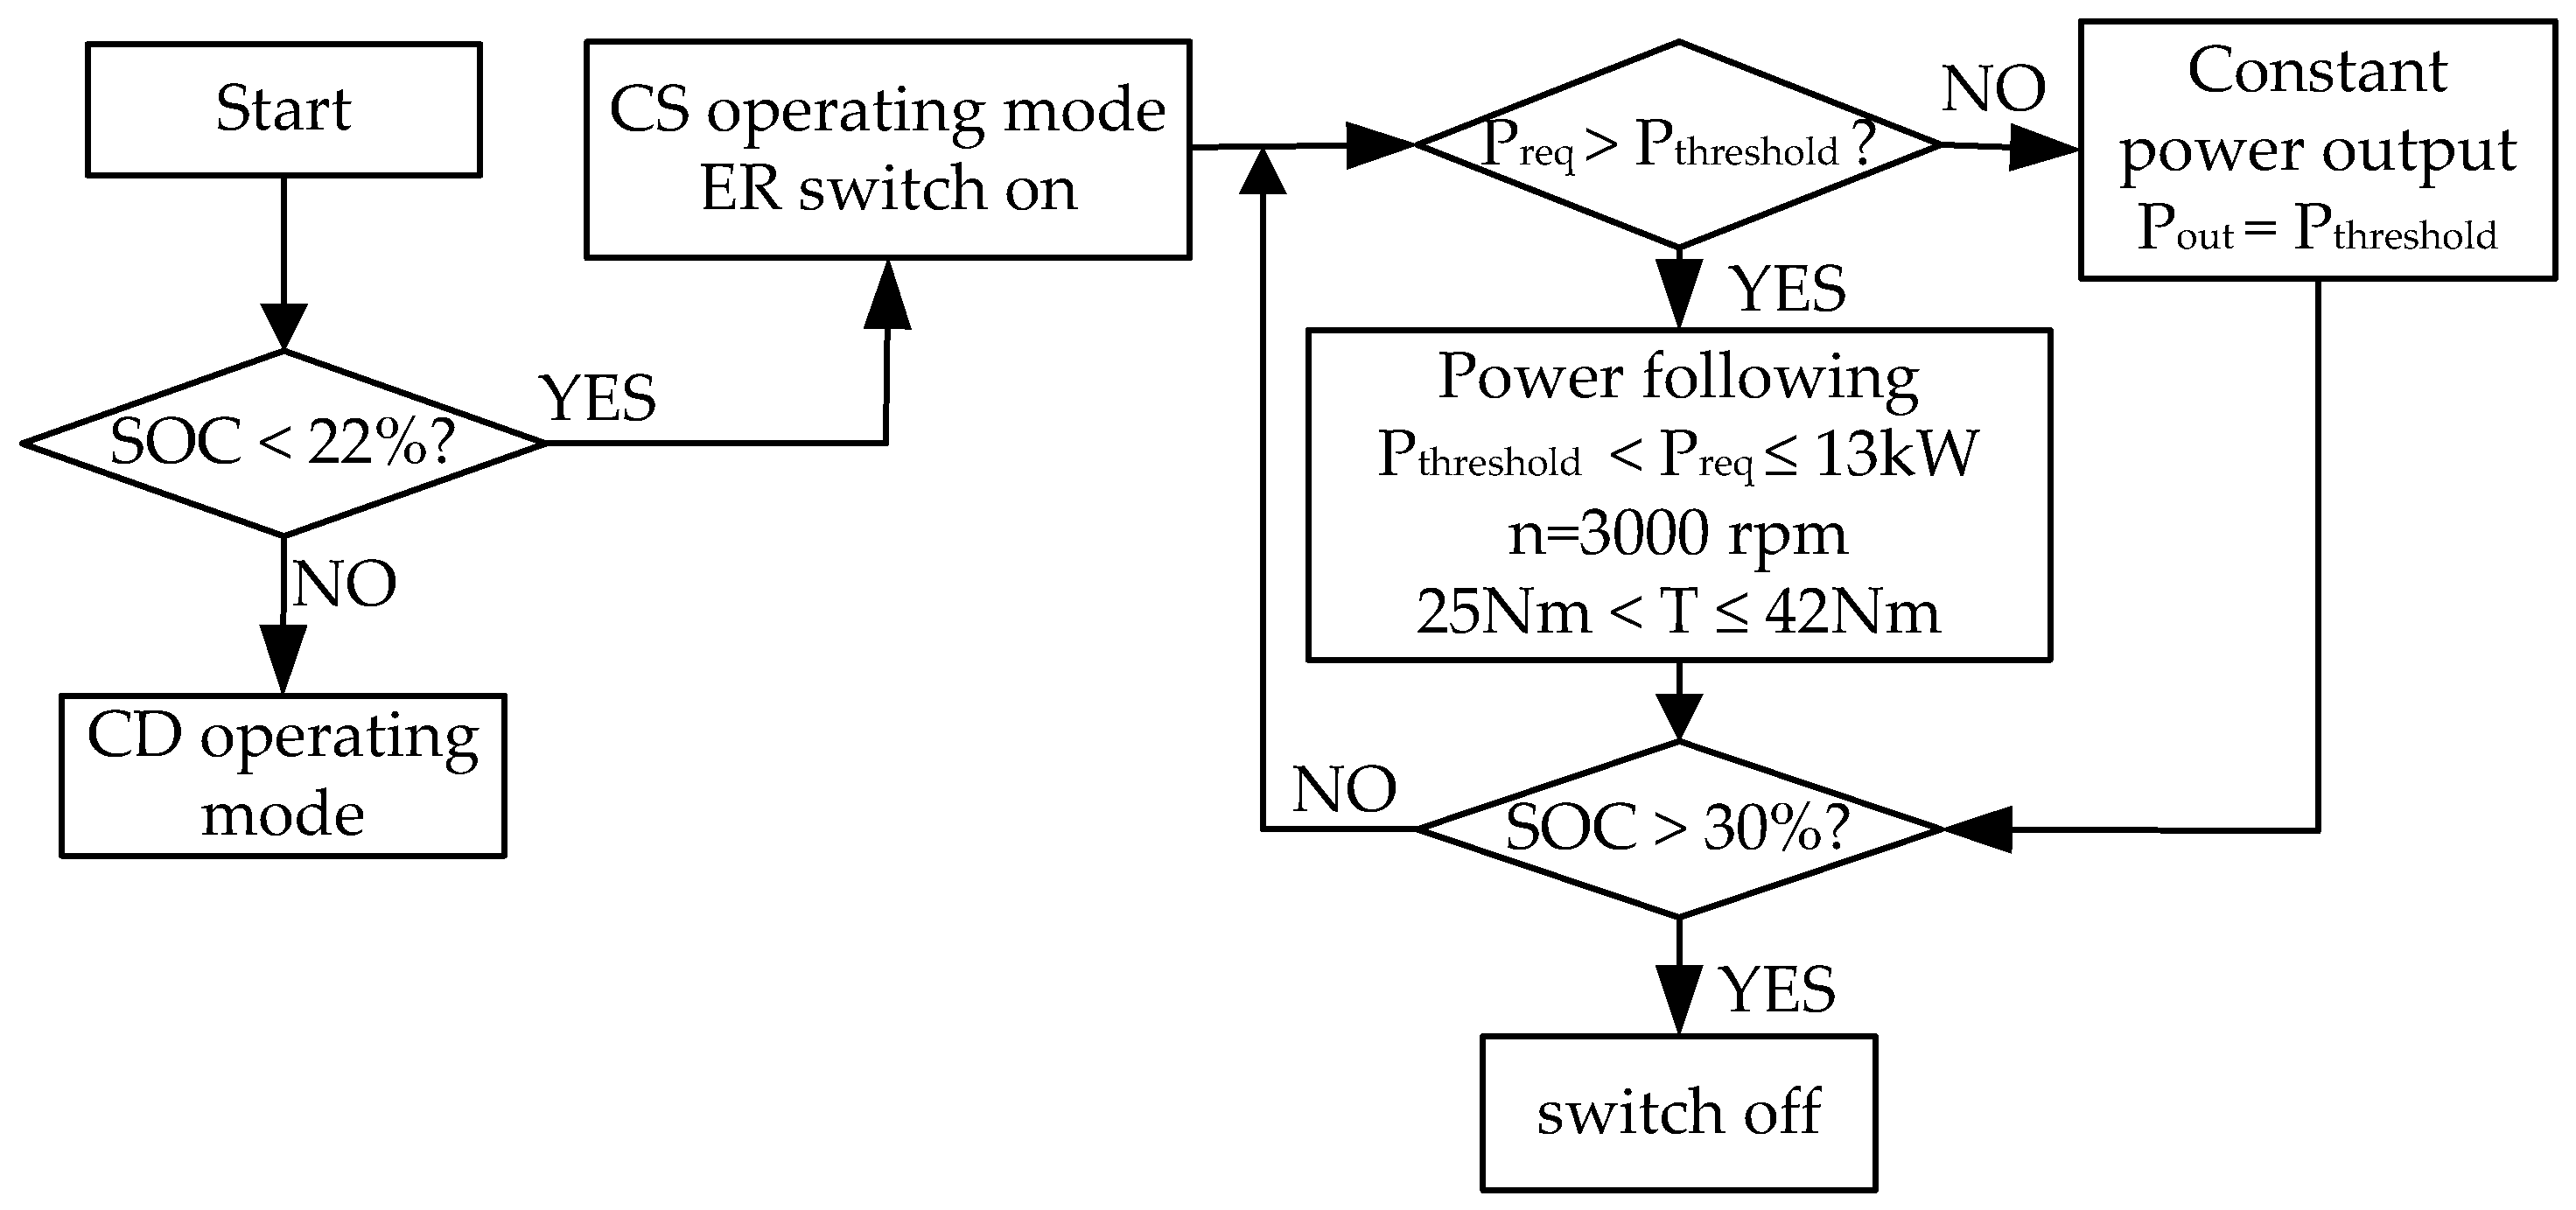
  • In this study, to optimize the overall efficiency of RE, the efficient operating region is determined, and a partial power following control strategy is designed for an urban EREV application. The threshold power that determines the RE operation in power following mode is obtained using the evaluation of minimum fuel consumption. The control strategy achieved electrical decoupling between the engine speed control and generator torque control. The engine was controlled to operate at constant speed within the high efficiency region, and the generator current was regulated to achieve power following control.
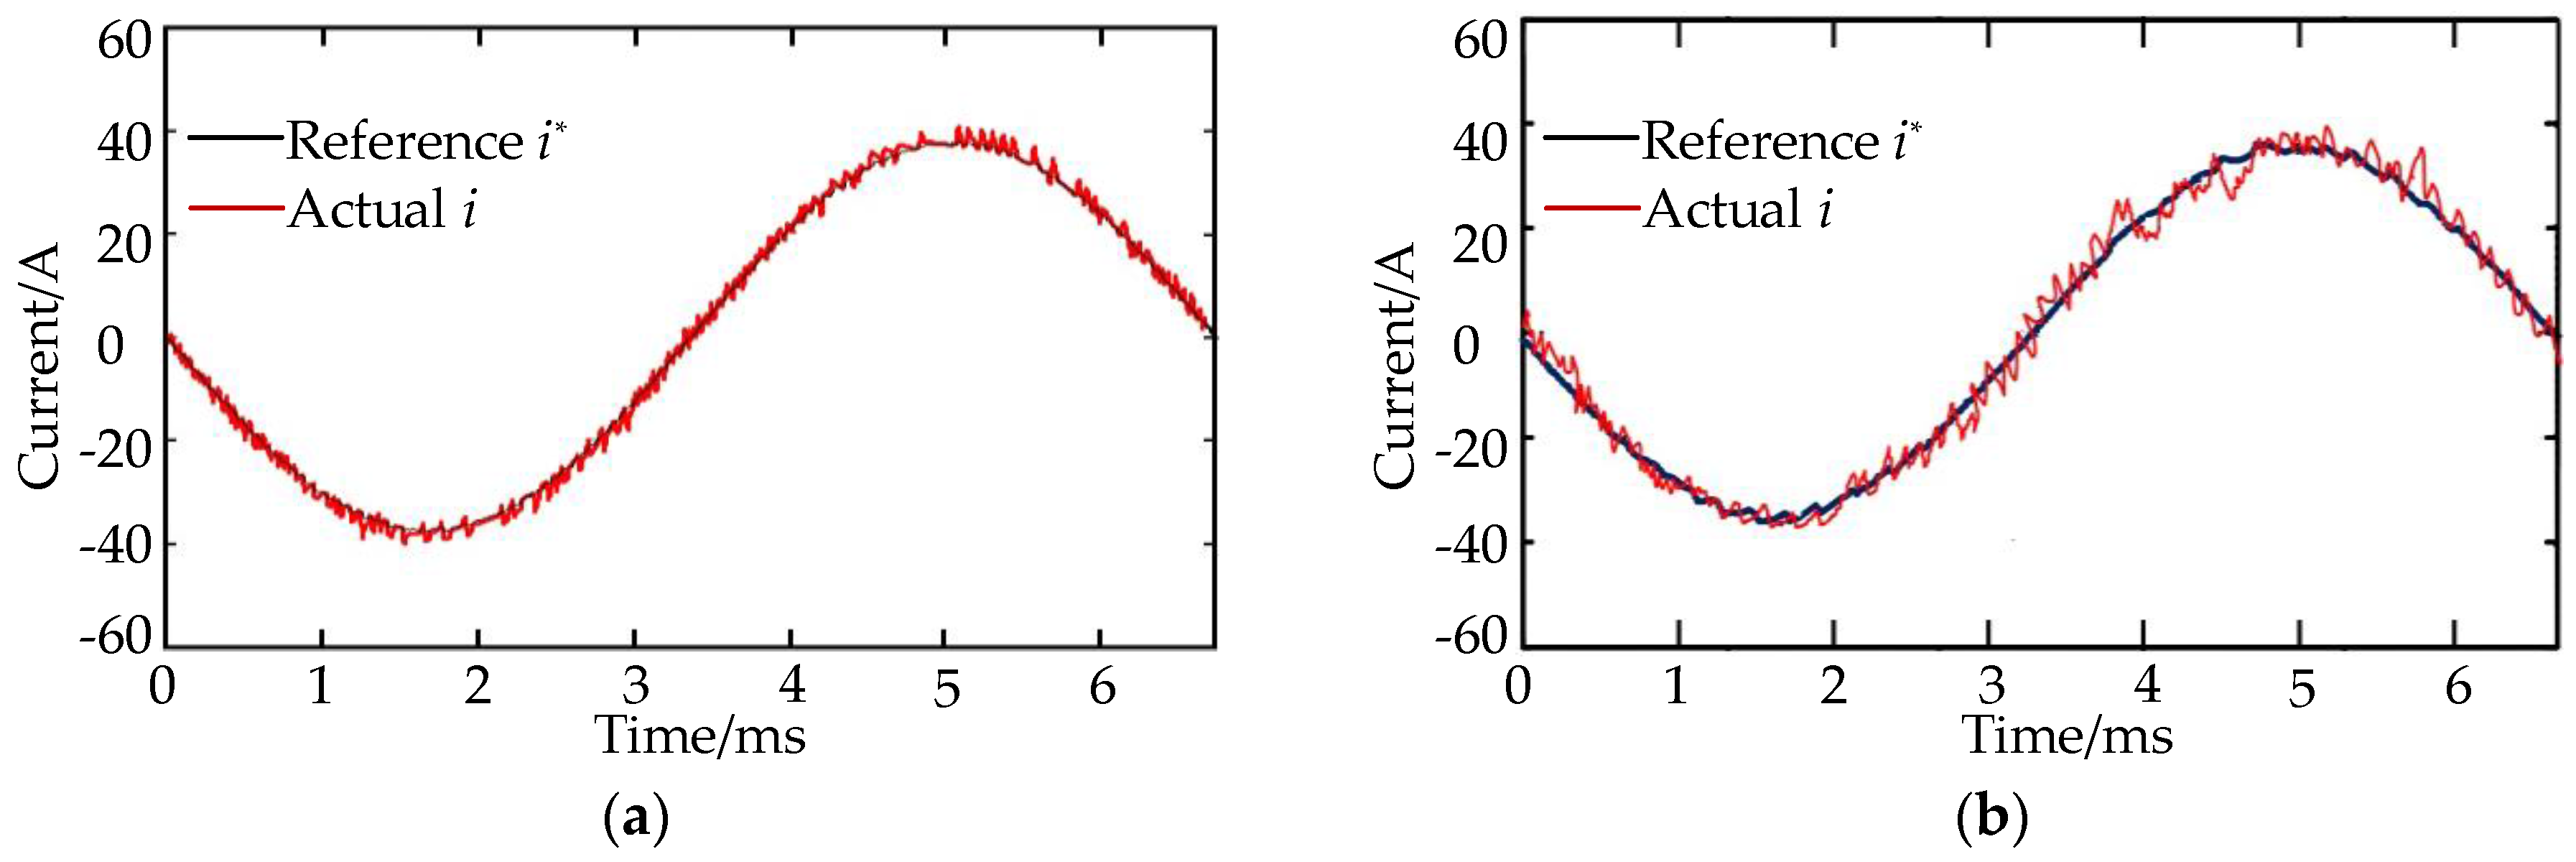
  • A proportional resonance controller based on α-β coordinates is introduced into the current control loop to realize RE power following control. It has fast response and strong robustness characteristics.
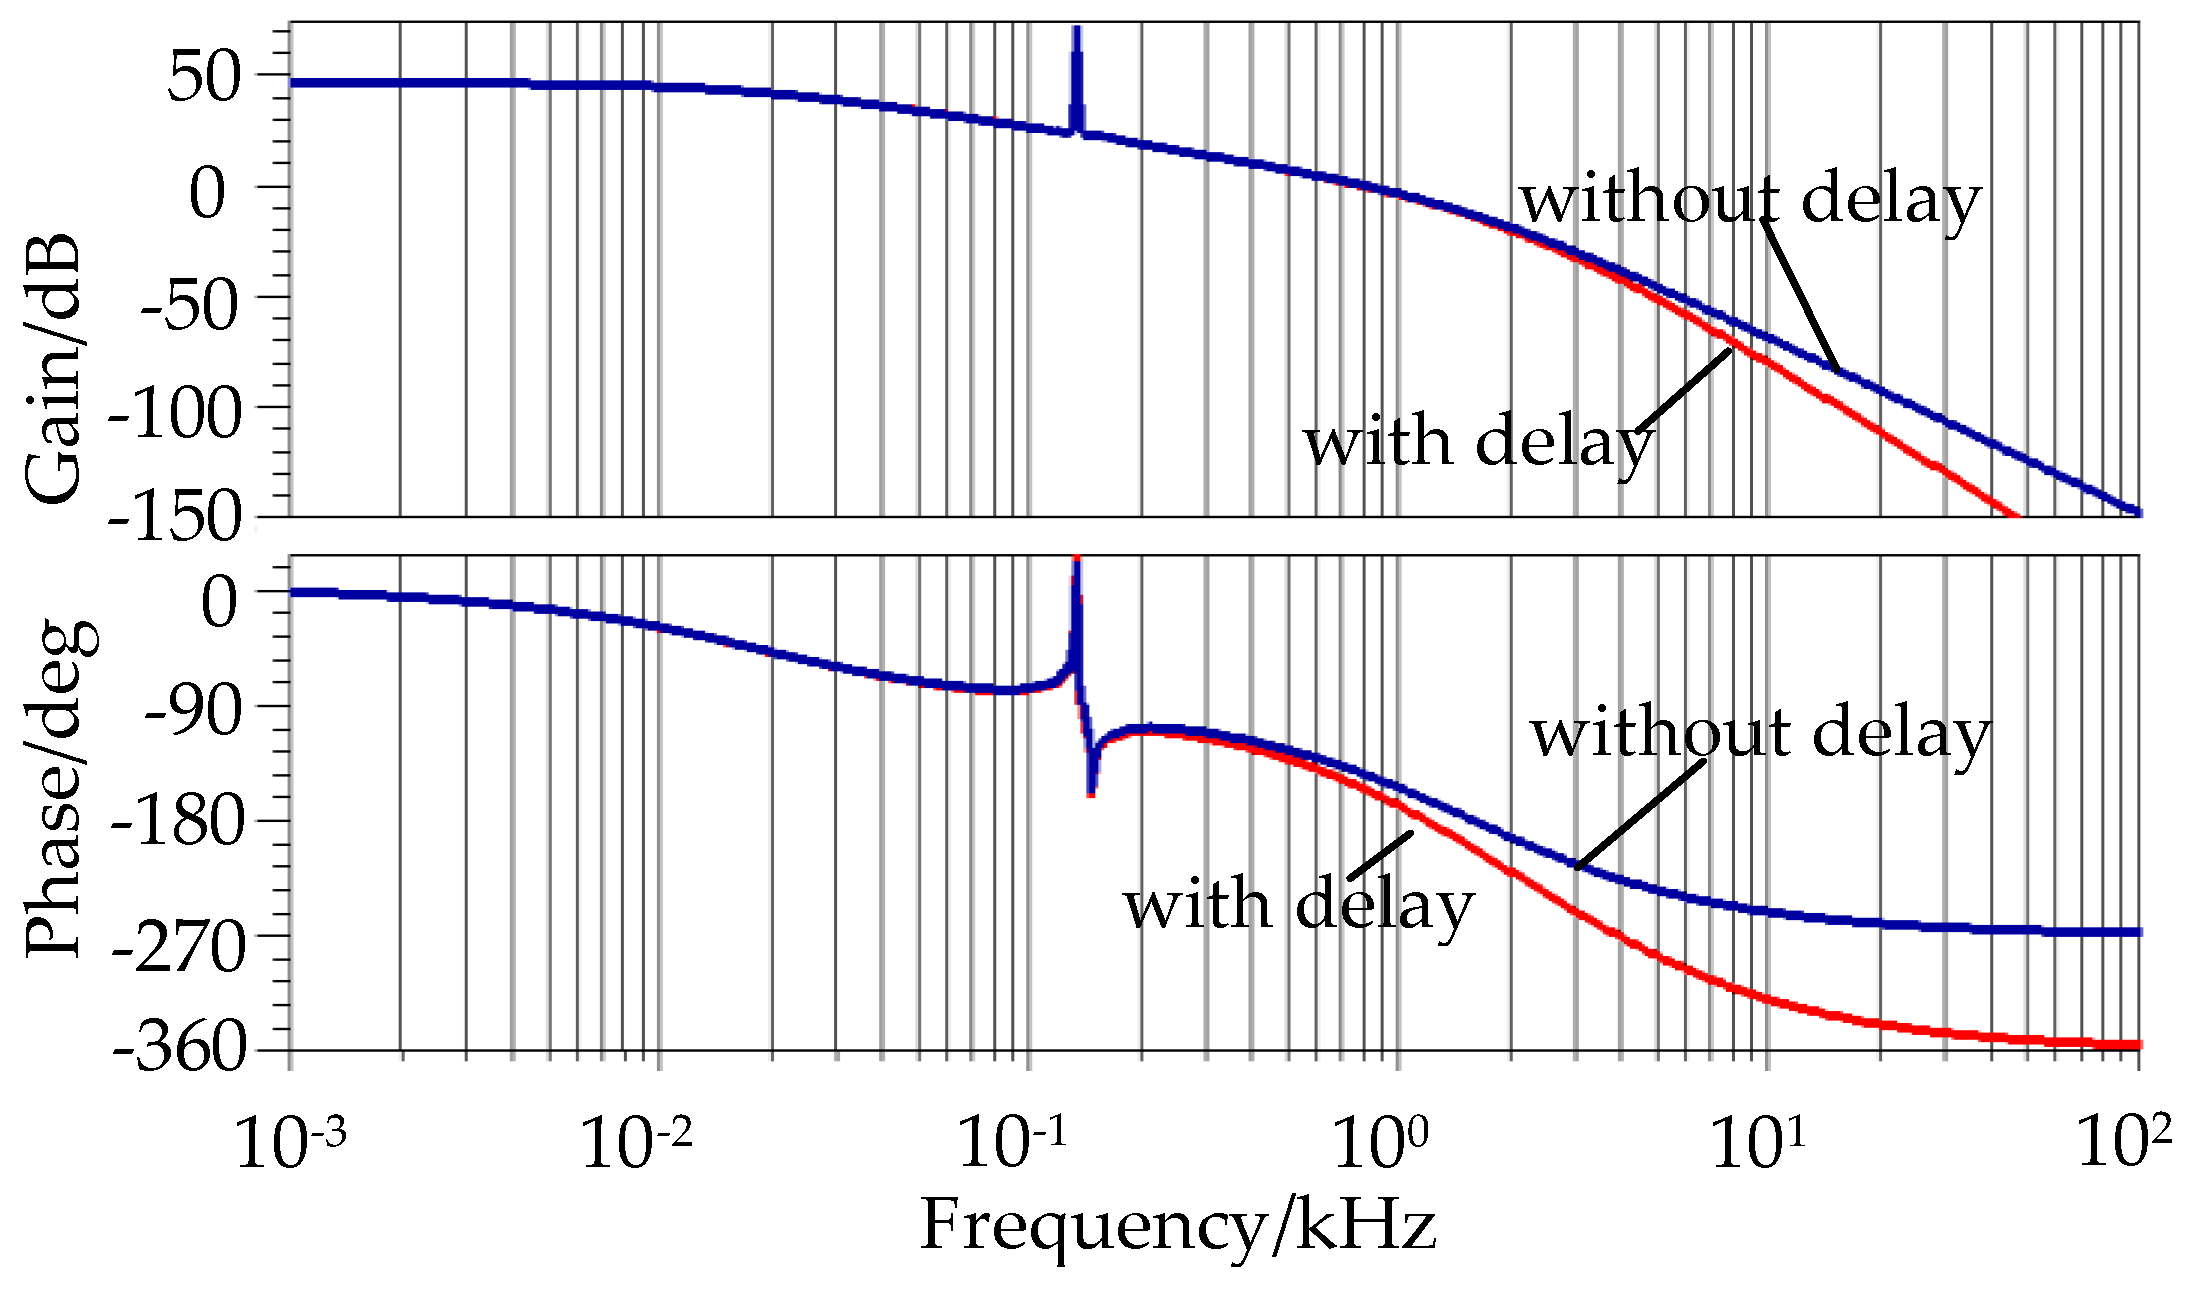
  • Using frequency response analysis, the relationship between the main parameters of the proposed control strategy and the stability margin were discussed and summarized. A general method for control system parameter design and stability design is proposed by using the control theory criterion, and the pre-Tustin is used for discretization of the PR controller.
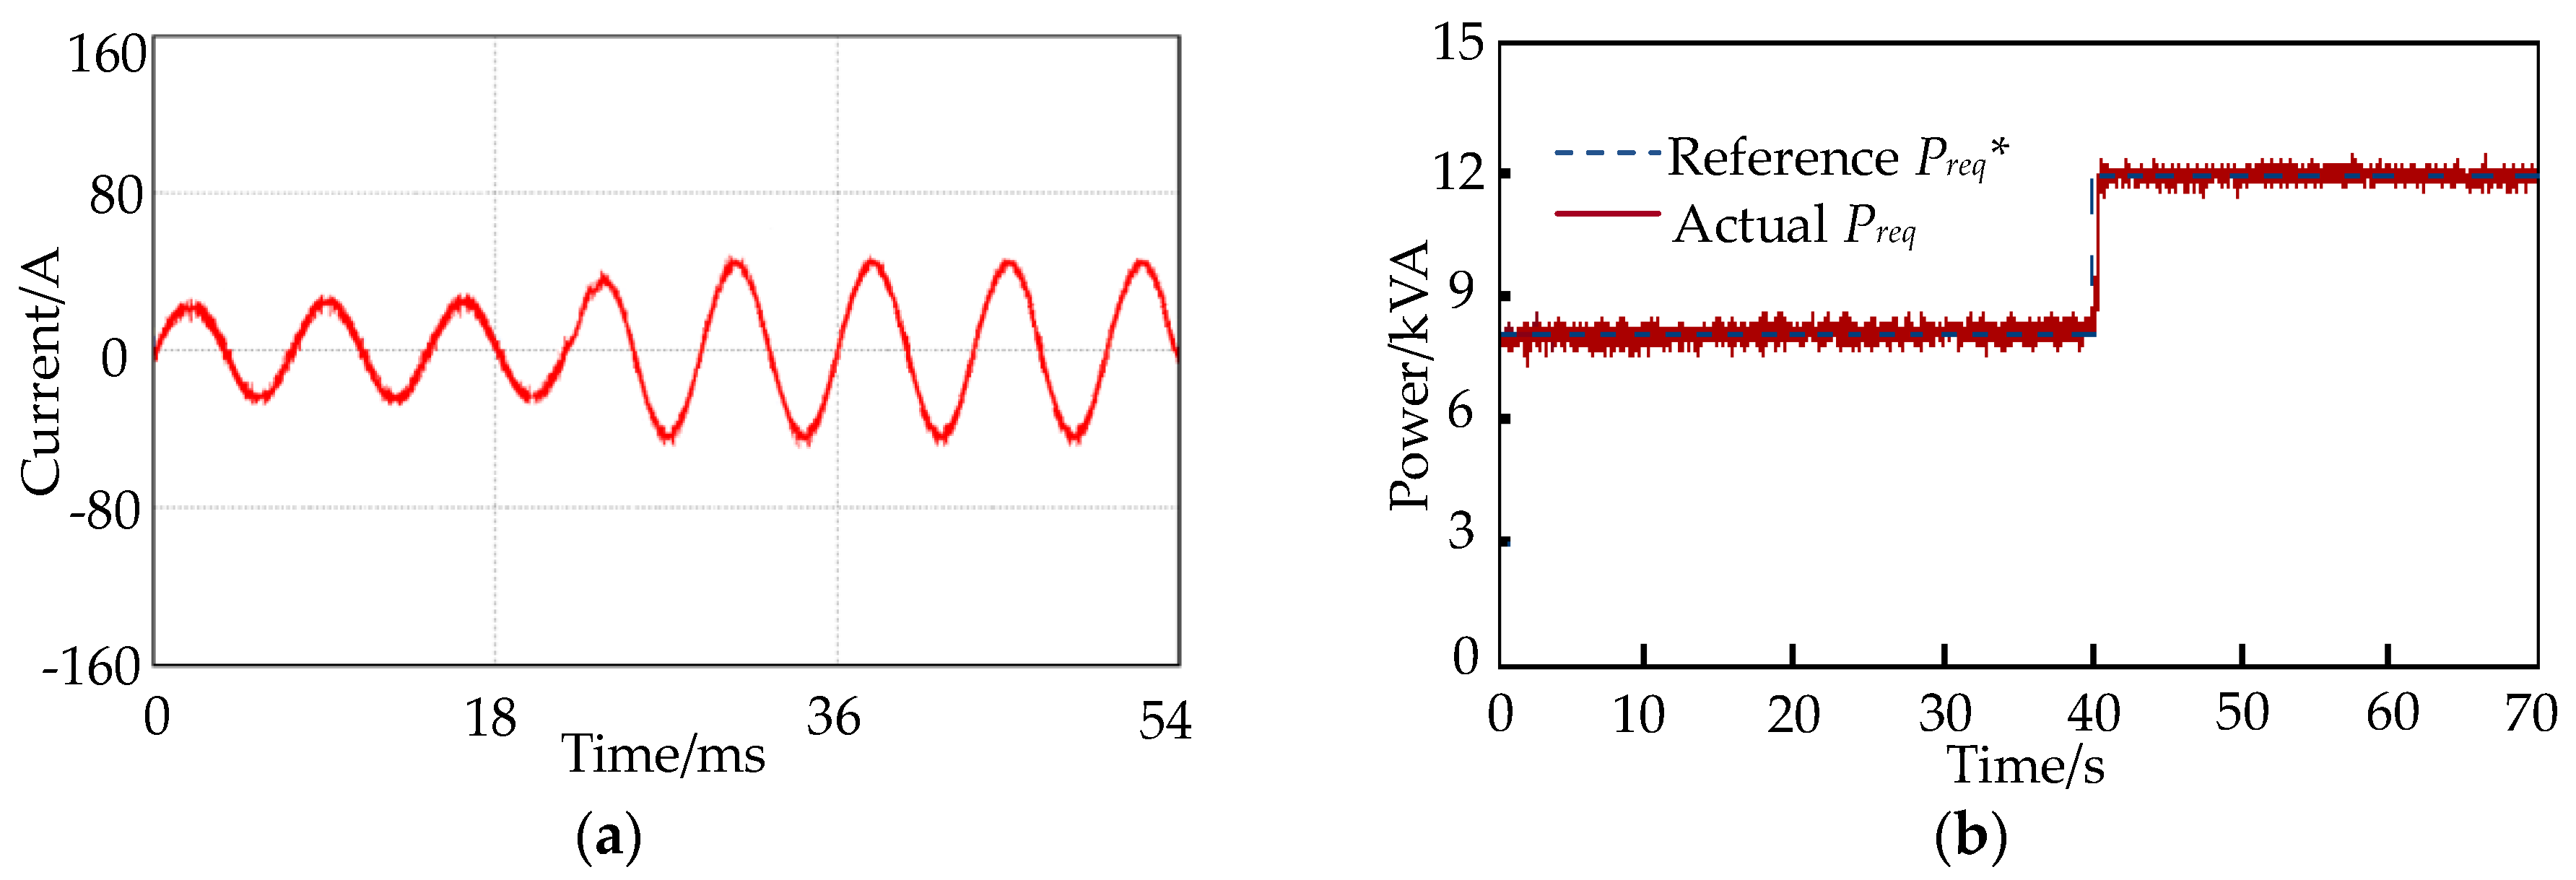
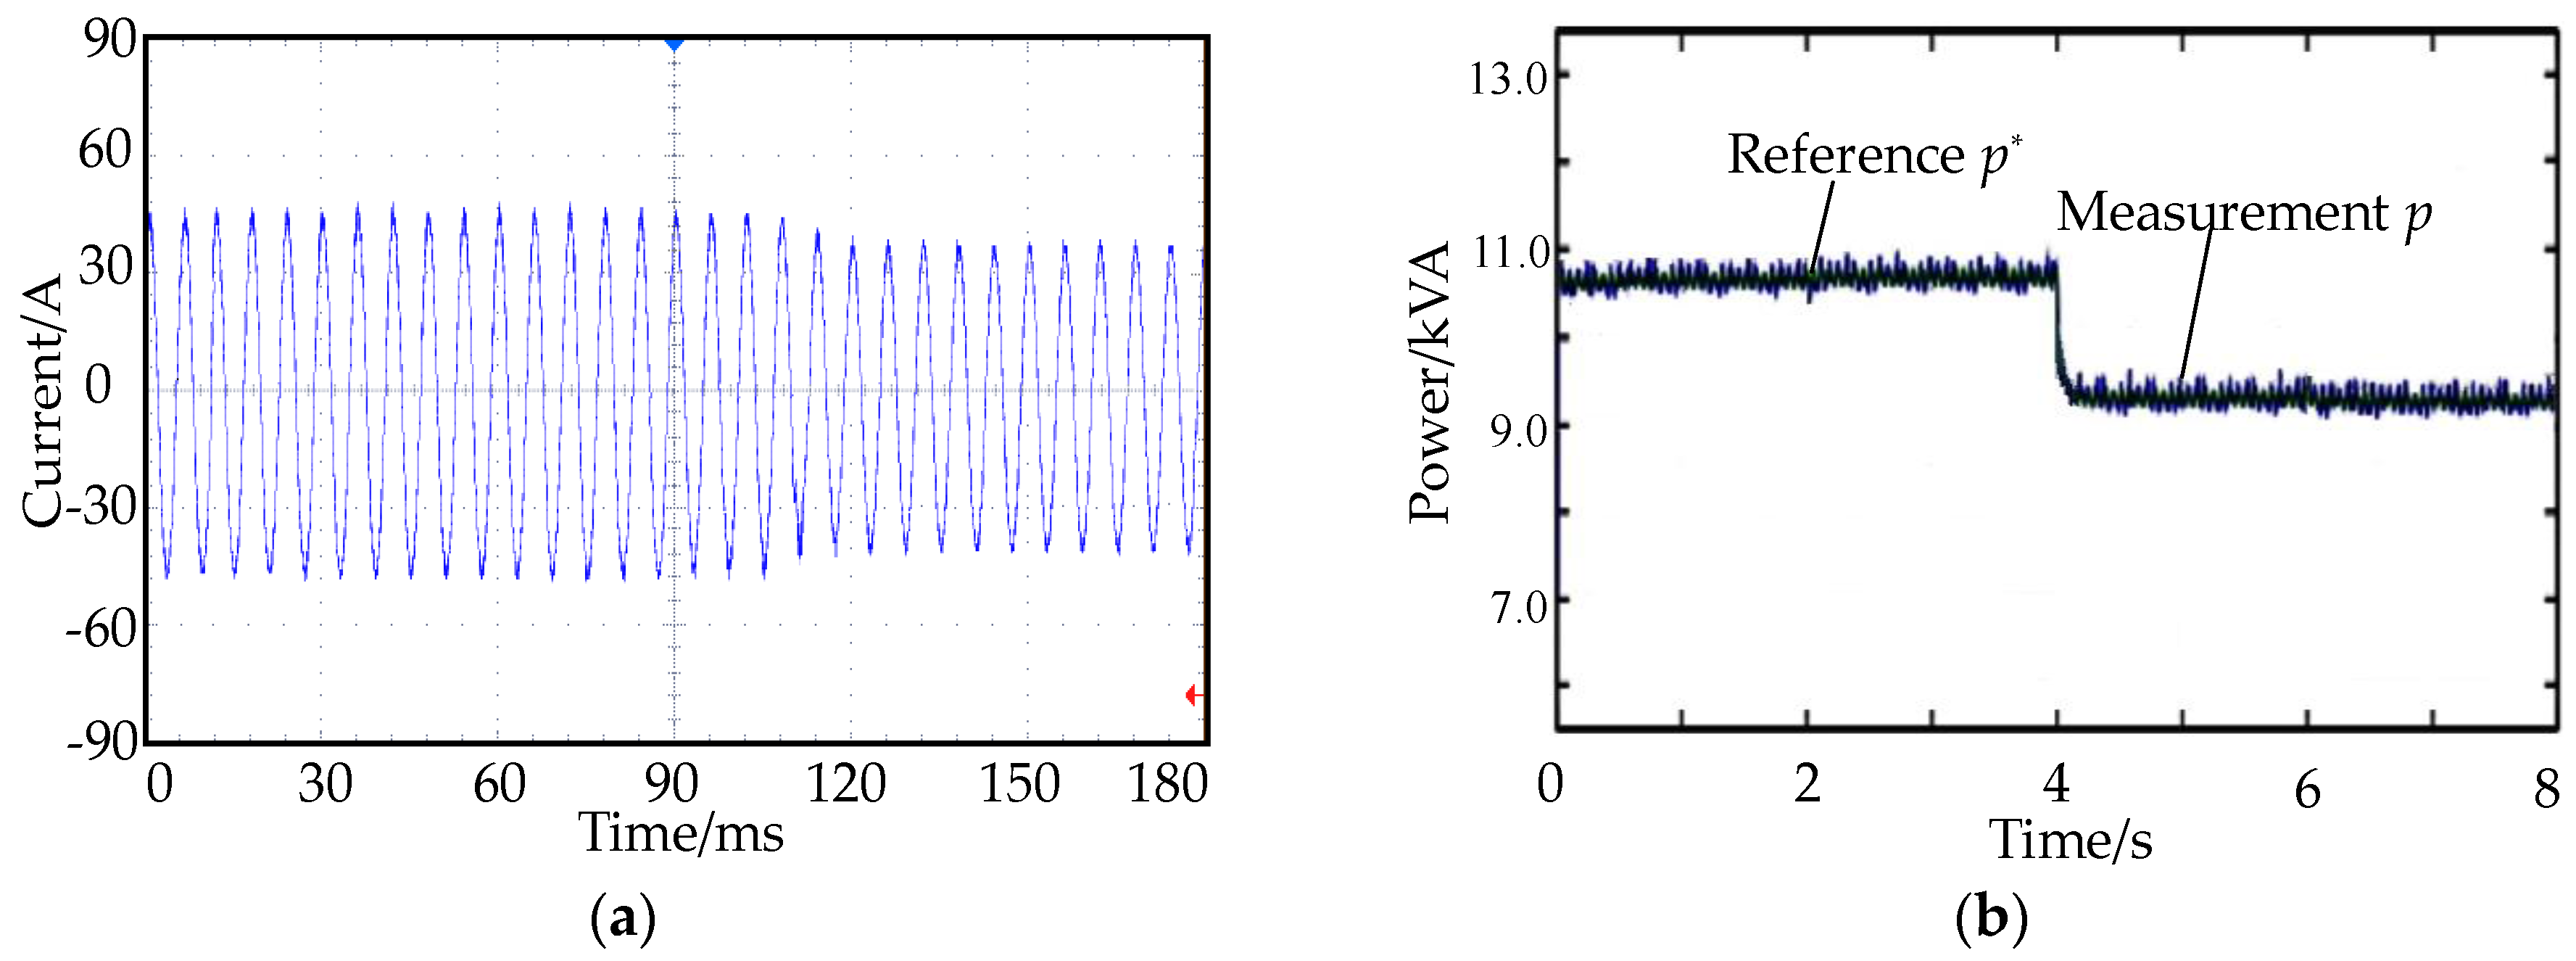
  • Simulation and experimental results show that the proposed control strategy has excellent stability and robustness. It can effectively balance the stability margin and transient performance to achieve better real-time tracking effects.

Acknowledgments

The research work described in this paper is supported by the National High Technology Research and Development Program of China (2011aa11a239).

Author Contributions

Xiaoyuan Wang and Haiying Lv proposed the concrete idea of the described strategy, Haiying Lv conducted the main work of the systematic process of design and simulation and also drafted the paper. Qiang Sun and Peng Gao provided insightful suggestions on the research and simulation results analysis. Yanqing Mi designed the experiments.

Conflicts of Interest

The authors declare no conflict of interest.

References

  1. Chen, M.; Sun, L.; Giuseppe, B.; Song, L.H. Advanced Electrical Machines and Machine-Based Systems for Electric and Hybrid Vehicles. Energies 2015, 8, 9541–9564. [Google Scholar] [CrossRef]
  2. Wu, X.G.; Du, J.Y. The economic analysis of a plug-in series hybrid electric vehicle in different energy management strategy. In Proceedings of the IEEE Vehicle Power & Propulsion Conference 2013, Beijing, China, 15–18 October 2013; pp. 1–5.
  3. Cheng, X.M.; Sun, F.C.; Ouyang, M.G. Output control of an auxiliary power unit of series hybrid electric vehicle. Trans. China Electrotech. Soc. 2007, 22, 69–76. [Google Scholar]
  4. Tian, S.; Cao, G.J.; Han, Q.; Li, J.; Yang, M. Modeling and Decoupling Control of ICE APU with Uncontrolled Rectifier in Series Hybrid Vehicle. In Proceedings of the IEEE Vehicle Power & Propulsion Conference, Windsor, UK, 6–8 September 2006; pp. 1–6.
  5. Dai, C.; Zhang, Z.R.; Qian, L. A new Range Extender with Doubly Salient Brushless DC Generator and Its Control Strategy. Trans. China Electrotech. Soc. 2013, 28, 138–144. [Google Scholar]
  6. Dorrell, D.G.; Knight, A.M.; Popescu, M.; Evans, L.; Staton, D.A. Comparison of different motor design drives for hybrid electric vehicles. In Proceedings of the Energy Conversion Congress and Exposition 2010, Atlanta, GA, USA, 12–16 September 2010; pp. 3352–3359.
  7. Wang, C.F.; Jin, M.J.; Shen, J.X.; Yuan, C. A permanent magnet integrated starter generator for electric vehicle onboard range extender application. IEEE Trans. Magn. 2012, 48, 1625–1628. [Google Scholar] [CrossRef]
  8. Gokasan, M.; Bogosyan, S.; Goering, D.J. Sliding mode based powertrain control for efficiency improvement in series hybrid-electric vehicles. IEEE Trans. Power Electron. 2006, 21, 779–790. [Google Scholar] [CrossRef]
  9. Liu, C.H.; Chau, K.T.; Jiang, J.Z. A permanent magnet hybrid brushless integrated starter-generator for hybrid electric vehicles. IEEE Trans. Ind. Electron. 2010, 57, 4055–4064. [Google Scholar] [CrossRef] [Green Version]
  10. Nemec, M.; Bajec, P.; Ambrozic, V. Power Converter Topology for Range Extender Module. In Proceedings of the Education and Reach Conference 2012, Amsterdam, The Netherlands, 13–14 September 2012; pp. 238–241.
  11. Choi, U.D.; Kim, K.T.; Kim, Y.N.; Kwak, S.H.; Kim, K.M.; Lee, S.D.; Jang, S.J.; Becksteard, K. Development of the Power Generator for Series Hybrid Electric Vehicle. In Proceedings of the International Forum on Strategic Technology 2006, Ulsan, Korea, 18–20 October 2006; pp. 447–450.
  12. Baumann, B.M.; Washington, G.; Glenn, B.C.; Rizzoni, G. Mechatronic design and control of hybrid electric vehicles. IEEE ASME Trans. Mechatron. 2000, 5, 58–72. [Google Scholar] [CrossRef]
  13. Schouten, N.J.; Salman, M.A.; Kheir, N.A. Fuzzy logic control for parallel hybrid vehicles. IEEE Trans. Control Syst. Technol. 2002, 10, 460–468. [Google Scholar] [CrossRef]
  14. Lin, C.C.; Peng, H.; Grizzle, J.W.; Kang, J.M. Power management strategy for a parallel hybrid electric truck. IEEE Trans. Control Syst. Technol. 2003, 11, 839–849. [Google Scholar]
  15. Perez, L.V.; Bossio, G.R.; Moitre, D.; Garcia, G.O. Optimization of Power Management in a Hybrid Electric Vehicle Using Dynamic Programming. Math. Comput. Simul. 2006, 73, 244–254. [Google Scholar] [CrossRef]
  16. Chen, R.; Luo, Y.G. Control System Development for the Diesel APU in Off-Road Hybrid Electric Vehicle; Society of Automotive Engineers Technical Paper: Warrendale, PA, USA, 2007; Volume 20, pp. 35–40. [Google Scholar]
  17. Zhu, Z.Q.; Howe, D. Electrical Machines and Drives for electric, Hybrid and Fuel Cell Vehicles. Process. IEEE 2007, 95, 746–765. [Google Scholar] [CrossRef]
  18. Shen, Y.P.; He, Z.D.; Liu, D.Q.; Xu, B. Optimization of Fuel Consumption and Emissions for Auxiliary Power Unit Based on Multi-Objective Optimization Model. Energies 2016, 9, 90. [Google Scholar] [CrossRef]
  19. Hu, J.B. Improved Dead-Beat Predictive DPC strategy of grid-connected DC–AC converters with switching loss minimization and delay compensations. IEEE Trans. Ind. Inform. 2013, 9, 728–738. [Google Scholar] [CrossRef]
  20. Malinowski, M.; Jasinski, M.; Kazmierkowski, M.P. Simple direct power control of three-phase PWM rectifier using space-vector modulation (DPC-SVM). IEEE Trans. Ind. Electron. 2004, 51, 447–454. [Google Scholar] [CrossRef]
  21. Huang, J.J.; Zhang, A.M.; Chen, X.J.; Zhang, H.; Wang, J. A double switching table based Direct Power Control strategy for three-phase voltage source PWM rectifiers. Autom. Electr. Power Syst. 2012, 36, 128–133. [Google Scholar]
  22. Wu, Z.; Liu, C.H. Nonlinear PI control of DC/DC boost power converters based on current mode. Proc. CSEE 2011, 31, 31–36. [Google Scholar]
  23. Deng, C.; Huang, S.D.; Li, Z.Q.; Hu, J. Research on PMSM-SVM-DTC System Based on the Proportional Resonant Control. Trans. China Electrotech. Soc. 2013, 28, 501–507. [Google Scholar]
  24. Guo, Q.; Liu, H.P.; Peng, D.L.; Liu, P.; Zhang, Y. A novel control strategy and its parameter design of the current-loop in a Stationary Frame for current-source PWM rectifiers. Proc. CSEE 2014, 34, 2353–2361. [Google Scholar]
  25. Liserer, M.; Blaabjerg, F.; Hansen, S. Design and control of an LCL filter-based three-phase active rectifier. IEEE Trans. Ind. Appl. 2005, 41, 1281–1291. [Google Scholar] [CrossRef]
  26. Yepes, A.G.; Freijedo, F.D.; Gandoy, J.D.; Lopez, O.; Malvar, J.; Fernandez-Comesana, P. Effects of discretization methods on the performance of resonant controllers. IEEE Trans. Power Electron. 2010, 25, 1692–1712. [Google Scholar] [CrossRef]
  27. Harnefors, L.; Yepes, A.G.; Vidal, A.; Doval-Gandoy, J. Passivity-based controller design of grid-connected VSCs for prevention of electrical resonance instability. IEEE Trans. Ind. Electron. 2015, 62, 702–710. [Google Scholar] [CrossRef]
Figure 1. Block diagram for the architecture of an EREV.
Energies 10 00204 g001
Figure 2. EREV control methods in CD-CS operation mode (a) Constant power control strategy; (b) Power following control strategy.
Energies 10 00204 g002
Figure 3. Permanent magnet synchronous generator efficiency map.
Energies 10 00204 g003
Figure 4. Engine efficiency map.
Energies 10 00204 g004
Figure 5. Fuel consumption rate of the engine at defined engine speeds.
Energies 10 00204 g005
Figure 6. State chart of the partial power following strategy.
Energies 10 00204 g006
Figure 7. Power following vector control strategy with PR controller.
Energies 10 00204 g007
Figure 8. Control block diagram of the inner current loop.
Energies 10 00204 g008
Figure 9. Frequency response considering parameter variation of PR controller. (a) Bode diagram at KP variation; (b) Bode diagram at KR variation.
Energies 10 00204 g009
Figure 10. Frequency response influence on current control performance for variation of time delay.
Energies 10 00204 g010
Figure 11. Frequency response. (a) Nyquist curves; (b) Enlarged drawing of the Nyquist curves; (c) Bode diagram.
Energies 10 00204 g011aEnergies 10 00204 g011b
Figure 12. Digital implementation diagram of controller.
Energies 10 00204 g012
Figure 13. Root locus plot of control system at different sampling frequency. (a) Sampling frequency is 2.0 kHz; (b) Sampling frequency is 4.0 kHz.
Energies 10 00204 g013
Figure 14. Vector waveform of generator’s output current. (a) Proposed strategy; (b) Traditional SVM strategy.
Energies 10 00204 g014
Figure 15. Simulation waveforms of transient response at Preq* change. (a) Generator output current; (b) Output power.
Energies 10 00204 g015
Figure 16. The test bench for RE power generation system.
Energies 10 00204 g016
Figure 17. Dynamic response at load change. (a) generator output current; (b) reference and measurement power.
Energies 10 00204 g017
Figure 18. Generator efficiency curves at different rotating speed with designed control stretagy.
Energies 10 00204 g018
Table 1. Required EREV performance characteristics.
SymbolDescriptionValuesReference
MVTotal mass≤1400 kgGB/T 19596
V1Maximum velocity at ER switch on≥80 km/hGB/T28382 4.5.1
tAcceleration time (0–50 km/h)≤7 sGB/T 28382 4.5.2
V2Maximum velocity at 4% slope≥70 km/hGB/T28382 4.5.3
V3Maximum velocity at 12% slope≥40 km/hGB/T28382 4.5.3
αGradeability≥20%GB/T 28382 4.5.3
frRolling resistance coefficient0.013Asphalt pavement
CDAerodynamic drag coefficient0.4
AfFront area of the vehicle1.96 m2

