Numerical Investigation of the Air-Steam Biomass Gasification Process Based on Thermodynamic Equilibrium Model


1
School of Energy and Power Engineering, Beihang University, Beijing 100191, China
2
The 41st Research Institute, the Sixth Academy of CASIC, Hohhot 010010, China
*
Author to whom correspondence should be addressed.
Energies 2017, 10(12), 2163; https://doi.org/10.3390/en10122163
Submission received: 20 November 2017
/
Revised: 13 December 2017
/
Accepted: 14 December 2017
/
Published: 18 December 2017
(This article belongs to the Special Issue Biofuel and Bioenergy Technology)
Abstract
:In the present work, the air-steam biomass gasification model with tar has been developed based on the equilibrium constants. The simulation results based on two different models (with and without tar) have been validated by the experimental data. The model with tar can well predict the tar content in gasification; meanwhile, the predicted gas yield (GY), based on the model with tar, is much closer to the experimental data. The energy exchange between the gasifier and the surrounding has been studied based on the dimensionless heat transfer ratio (DHTR), and the relationship between DHTR and the process parameters is given by a formula. The influence of process parameters on the syngas composition, tar content, GY, lower heating value (LHV), and exergy efficiency have been researched.
1. Introduction
Biomass gasification is a thermochemical conversion method [1,2], which converts biomass into combustible gases through partial oxidation. Decomposition, partial oxidation, and various other chemical reactions occur during gasification, involving heat and mass transfer processes. Biomass gasification has gained attention worldwide due to its capacity to handle a wide range of biomass feedstocks and its high efficiency of energy conversion [3,4,5].
Due to its inherent complexity, simulating the gasification process and predicting the process performance is still at a preliminary stage [6]. In the simulation of gasification, thermodynamic equilibrium modeling does not consider the mechanism of transformation; meanwhile, it is independent of gasifier geometry and not limited to a specified range of operating conditions. Equilibrium model represents the gasification process as a single reaction, so it is useful to predict the exit gas composition and estimate the trend of the gasifier output with variations in process parameters [7].
Equilibrium models can be categorized into stoichiometric models based on equilibrium constants of the most important reactions [8] and non-stoichiometric models based on minimization of the Gibbs free energy [9,10,11,12,13]. Some researchers [14,15,16] simulated the gasification process based on non-stoichiometric models, whereas other researchers [17,18,19] paid more attention to stoichiometric models. However, both the approaches are essentially equivalent [20]. Air, steam, and air-steam are the generally used gasifying agents in gasification. Air is comprehensively used [21,22], since it is cheap. Steam gasification was found to produce gas with a high heating value [23,24] compared to air gasification due to the high content of H2 in the syngas. The pure steam gasification process requires an indirect or external heat supply for endothermic gasification reaction, which increases the cost of gasification. Alternatively, air-steam gasification [25,26] decreases the cost, since the partial combustion reaction provides the heat. Meanwhile, the heating value of the syngas is still acceptable, so this process has received a lot of attention.
In the air-steam gasification process, when the energy balance equation is introduced to the equilibrium model, the value of energy exchange between the gasifier and the surrounding should be given. If this value is inaccurate, the simulation results are very likely to be misleading. However, this value is usually determined through experiments, which causes the data to be insufficient. If the relationship between the energy exchange and the process parameters can be determined by a formula, the value will be obtained accurately and conveniently. Tar is generally neglected in the simulation study based on the stoichiometric models [18,27]. In fact, tar is invariably present in the gasification process, especially at low gasification temperatures [28,29]. The components of tar are very complex, and the primary tars are generally obtained at temperatures below 973 K. As temperature increases, primary tars continue to decompose with the formation of secondary tars, comprising phenolics and olefins [30]. In some simulations of gasification, phenol was used as the model compound for tars [31].
Hence, in this study, the air-steam biomass gasification model with tar has been developed based on the equilibrium constants, and phenol is used as the model compound for tars. The effects of process parameters on the syngas composition, tar content, gas yield, the lower heating value of the syngas, and the exergy efficiency of gasification have been studied. Moreover, the relationship between the energy exchange and the process parameters has also been researched.
2. Thermodynamic Equilibrium Model
For the present air-steam thermodynamic equilibrium model, some assumptions have been made for the biomass gasification process: (1) temperature of the products is equal to the gasification temperature; (2) oxygen is consumed completely; (3) the gas mixture is in equilibrium and is homogeneous; (4) the residence time is long enough, and all the chemical reactions can reach an equilibrium state; (5) nitrogen does not take part in the reactions; (6) the biomass is composed of C, H, and O; (7) the solid products include only the char, which is composed of entirely of carbon; (8) ash is not considered in the simulation; (9) phenol is regarded as tar; (10) atmospheric pressure is assumed in the gasifier.
The overall gasification reaction with air and steam can be written as follows:
where x and y are the number of atoms of hydrogen and oxygen for each atom of carbon in the biomass, respectively. m and n are the molar amounts of air and steam, respectively, fed per mole of biomass. x1, x2, x3, x4, x5, x6, and x7 are the number of moles of the corresponding products, respectively.
The element balances of carbon, hydrogen, and oxygen elements are given below:
2.1. Equilibrium Constants and Non-Equilibrium Factor
When biomass is added to the gasifier, the pyrolysis reactions occur instantaneously. This is followed by a number of competing intermediate reactions, including both heterogeneous reactions and homogeneous gas phase reactions. Char, tar, and other gases (CO, CO2, H2O, H2, and CH4) are produced during the gasification process. The three independent equilibrium reactions used for equilibrium calculation are considered to be:
The above three reactions are water gas reaction, methane generation reaction, and water gas shift reaction, respectively. The equilibrium constants for these three reactions can be shown as follows:
where K and P are equilibrium constant and pressure, respectively. xtotal is the total number of moles of syngas.
The equilibrium constant can be calculated based on the Gibbs free energy; meanwhile, the standard Gibbs function of the reaction is dependent on the standard enthalpy change. Through mathematical conversion, the equilibrium constant is associated with the standard enthalpy change and a constant of integration, which can be found from the related reference [32]. From the data of standard enthalpy of formation and standard Gibbs function of formation, also shown in that paper, this constant of integration can be calculated. Thus, the correlations between the equilibrium constants and the temperatures for the Reactions (5)–(7) are obtained shown below:
In the actual gasification system, it is a fact that methane generation reaction is not at equilibrium state. Some researchers [17,27] found that the methane yield was underestimated in the simulation based on the conventional thermodynamic equilibrium model. Hence, it is necessary to consider the non-equilibrium behavior. According to the linear regression analysis of many experimental data sets, the dependency of CH4 with respect to the process parameters was obtained [17]. It was observed that the methane yield had a significant relationship with ER, and that was consistent with the results in the literature [33,34]. Meanwhile, the tar is formed in pyrolysis stage accompanied with H2, CO, CO2, H2O, and CH4, and it can also convert to these gases according to the decomposition reactions. So, it is reasonable to believe that the equilibrium relationship between these gases will not change, and the effect of the tar on these gases is just revealed from Equation (9). Hence, the non-equilibrium modification is needed to apply to K2, which is shown below:
where ER is equivalence ratio, and it is defined as the ratio of the actual amount of air fed to the gasifier to the stoichiometric amount of air necessary for the combustion of biomass.
Meanwhile, the Equations (8) and (9) can be combined to give the Equation (15) as shown below:
In the gasification process, the carbon in biomass gets partially converted into gas and the rest is converted into char. Hence, the carbon conversion ratio is defined as the ratio of total number of moles of carbon in syngas to the number of moles of carbon in the biomass feed. Many studies [34,35,36] have found that carbon conversion ratio cannot be calculated directly, and the empirical formula obtained based on experimental data sets will be suitable. Generally, the carbon conversion ratio can be fitted as a function of process parameters, such as ER [34], or both ER and temperature [17,37]. It has been found that the temperature has a small effect on carbon conversion ratio. An empirical formula was proposed by Lim et al. [17] based on many experimental data points under different experimental conditions, and the temperature influence had been considered. So, this formula can be considered as a representative one, and it is shown as follows:
2.2. Energy Balance in the Gasification Process
Based on the first law of thermodynamics, the equation for energy conservation of the reactants and products of gasification can be written as follows:
where Cp is the specific heat at constant pressure, and T1 and T2 are the inlet temperature of reactants and the outlet temperature of products, respectively. H0 is the standard enthalpy of formation, and the value for the gas can be found in the literature [8,32]. Q is the energy exchange between the gasifier and the environment, which is positive for the endothermic reaction and negative for the exothermic reaction. w is the molar amount of the corresponding material. The subscript “in” corresponds to the reactants and the subscript “out” corresponds to the products.
The equation for the complete combustion reaction of biomass is shown below:
The standard enthalpy of formation for biomass can be calculated as follows:
where LHVbiomass is the lower heating value of the biomass in MJ/kg.
2.3. Exergy Efficiency of Gasification
Exergy is the maximum amount of theoretically available energy, which is used for evaluating the quality of energy. The conversion of exergy before and after gasification is controlled by the second law of thermodynamics, which considers the loss due to increase in entropy. The quality of energy could not be considered in the first law of thermodynamics during the gasification process. Hence, it is highly necessary to analyze the exergy efficiency.
Exergy includes two components [8]: chemical exergy and physical exergy.
The chemical exergy of the compound is calculated as follows [38]:
The physical exergy of a component is calculated as follows [41]:
where h and s are the enthalpy and entropy, respectively.
The exergy of biomass is calculated from its lower heating value as follows:
where β is a multiplication factor [8], which is expressed in terms of oxygen-carbon and hydrogen-carbon ratios.
The exergy balance of the reaction process is as follows:
where the exergy of reactants, Ereactants, comprises biomass exergy and the exergy of the inlet gas mixture. The exergy of products, Eproducts, comprises syngas exergy and unconverted carbon exergy. Eloss is the exergy loss during the gasification process. W is the exergy accompanying the energy exchange, which is positive for the endothermic reaction and negative for the exothermic reaction.
Exergy efficiency (η) corresponding to the endothermic reaction is defined as follows:
Exergy efficiency corresponding to the exothermic reaction is defined as follows:
2.4. Other Parameters
Steam to biomass ratio (SBR) is defined as the ratio of the steam mass flow rate to the biomass mass flow rate on dry basis.
Gas yield (GY) is calculated by dividing the rate of production of dry syngas, excluding nitrogen, by the biomass feeding rate, and its unit is Nm3/kg.
When the combustible components of the syngas are CO, H2, and CH4, the lower heating value (LHV) of the syngas is calculated as follows [42]:
where LHV is expressed in MJ/Nm3. φ is the corresponding molar fraction of combustible gas species in the dry syngas, which includes nitrogen.
3. Model Validation
In order to validate the equilibrium model, the experimental results reported by some researchers have been used as comparison, and the operating conditions of the samples chosen to validate the model are presented in Table 1. The validation results are shown through Figure 1, Figure 2, Figure 3, Figure 4, Figure 5 and Figure 6.
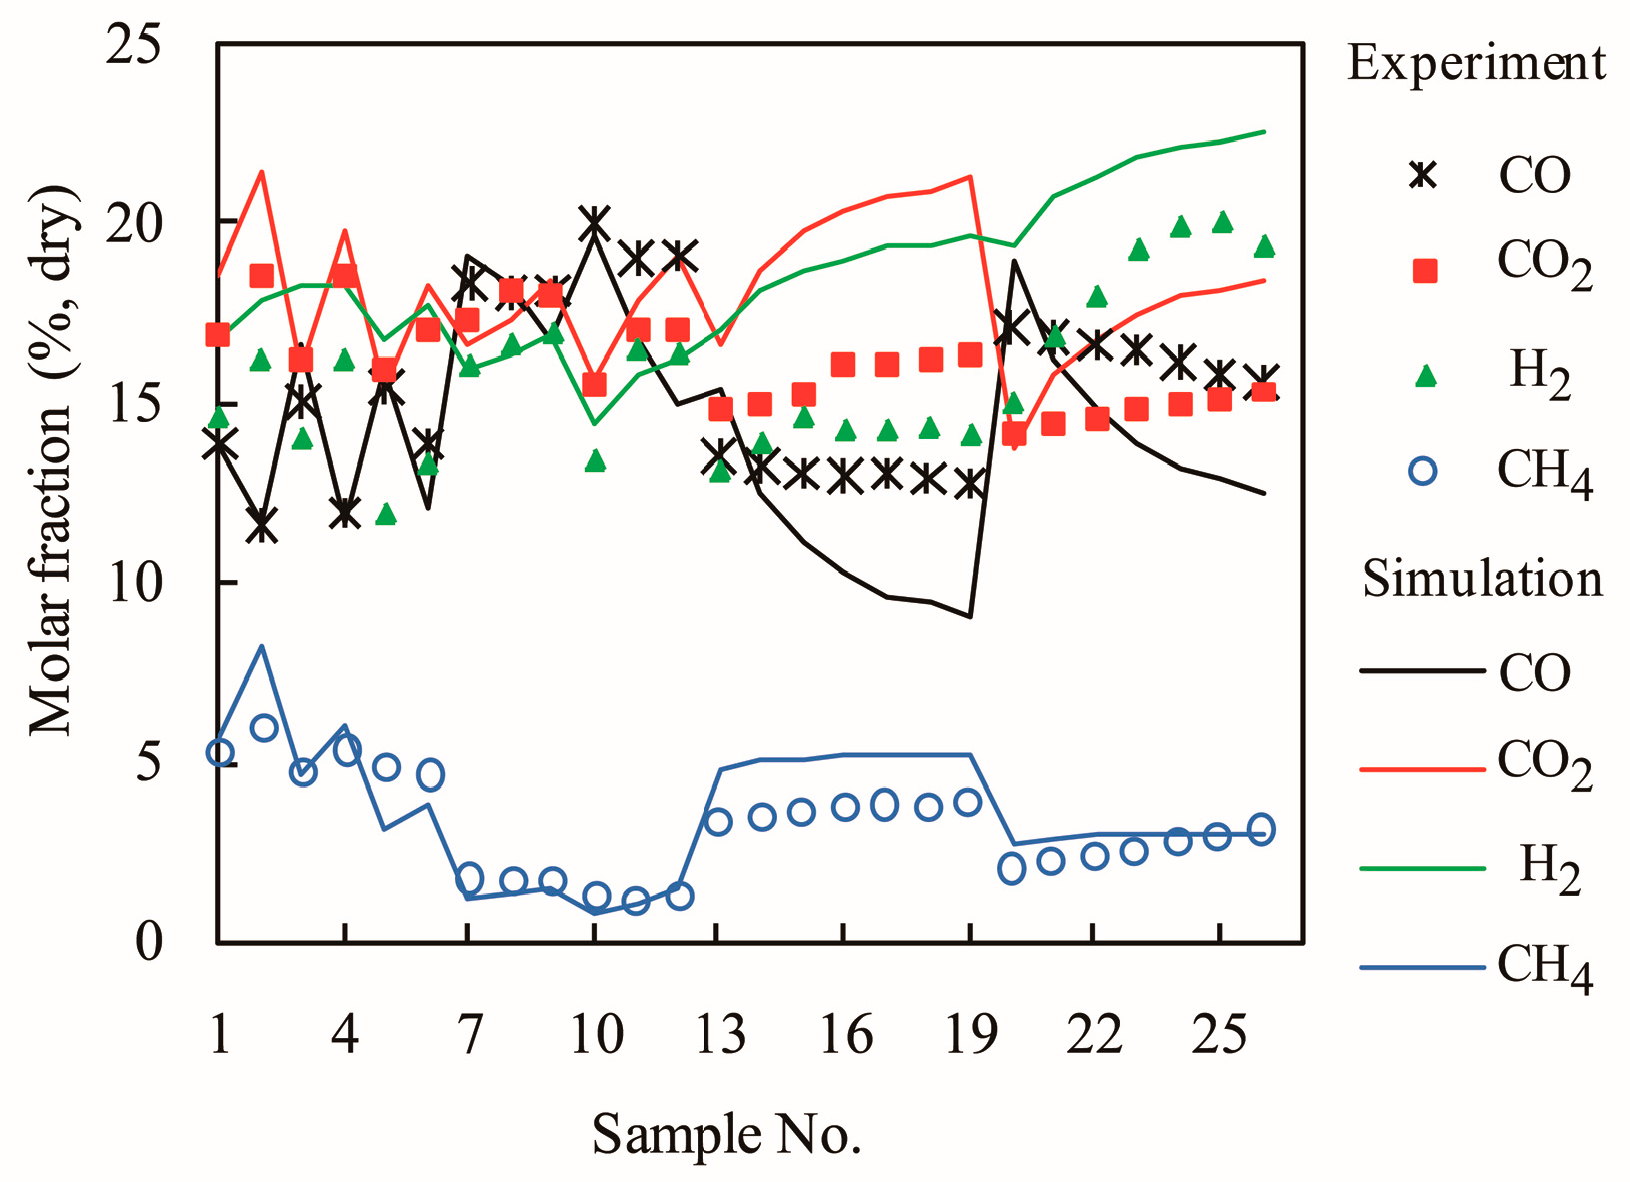
The comparisons between the experimental results and numerical results for syngas composition, LHV, and GY are shown in Figure 1 and Figure 2. The molar fraction of individual component of syngas is defined as the number of moles of individual component divided by the total number of moles of dry syngas, which includes nitrogen.
The error between experimental results and predicted results is estimated using the statistical parameter of root mean square (RMS) error, and it is defined as follows:
where Exp and Mod are the experimental molar fractions and the predicted molar fractions of syngas species, respectively. N is the number of data.
The RMS errors are calculated for each set of data point, and the maximum value of RMS error is 0.041 for sample No. 19, as shown in Figure 3.
For the first 6 data points, the simulation values for syngas composition well fit the experimental data. Only the molar fraction of H2 is slightly above the experimental data, so the predicted LHV and GY are just above the experimental data, as shown in Figure 2. For the next 6 data points, the predicted syngas composition also very well fits the experimental data. From sample No. 13 to 19, it shows that there is a difference in composition between the model results and the experimental data, as shown in Figure 1 and Figure 3. However, at high gasification temperature, from sample No. 20 to 26, the RMS error increases less obviously with increasing SBR, as shown in Figure 3. Meanwhile, it is also observed that the predicted LHV is closer to the experimental data at high gasification temperature, as shown in Figure 2. The effect of SBR on the accuracy of calculation depends on the gasification temperature. When the same value of SBR is choosen, the difference between the simualtion result and experimental result at low gasification temperature is greater than the value at high gasification temperature. Through the present results, it is evident that the predicted molar fraction of CH4 well fits with the experimental data at all the data set points.
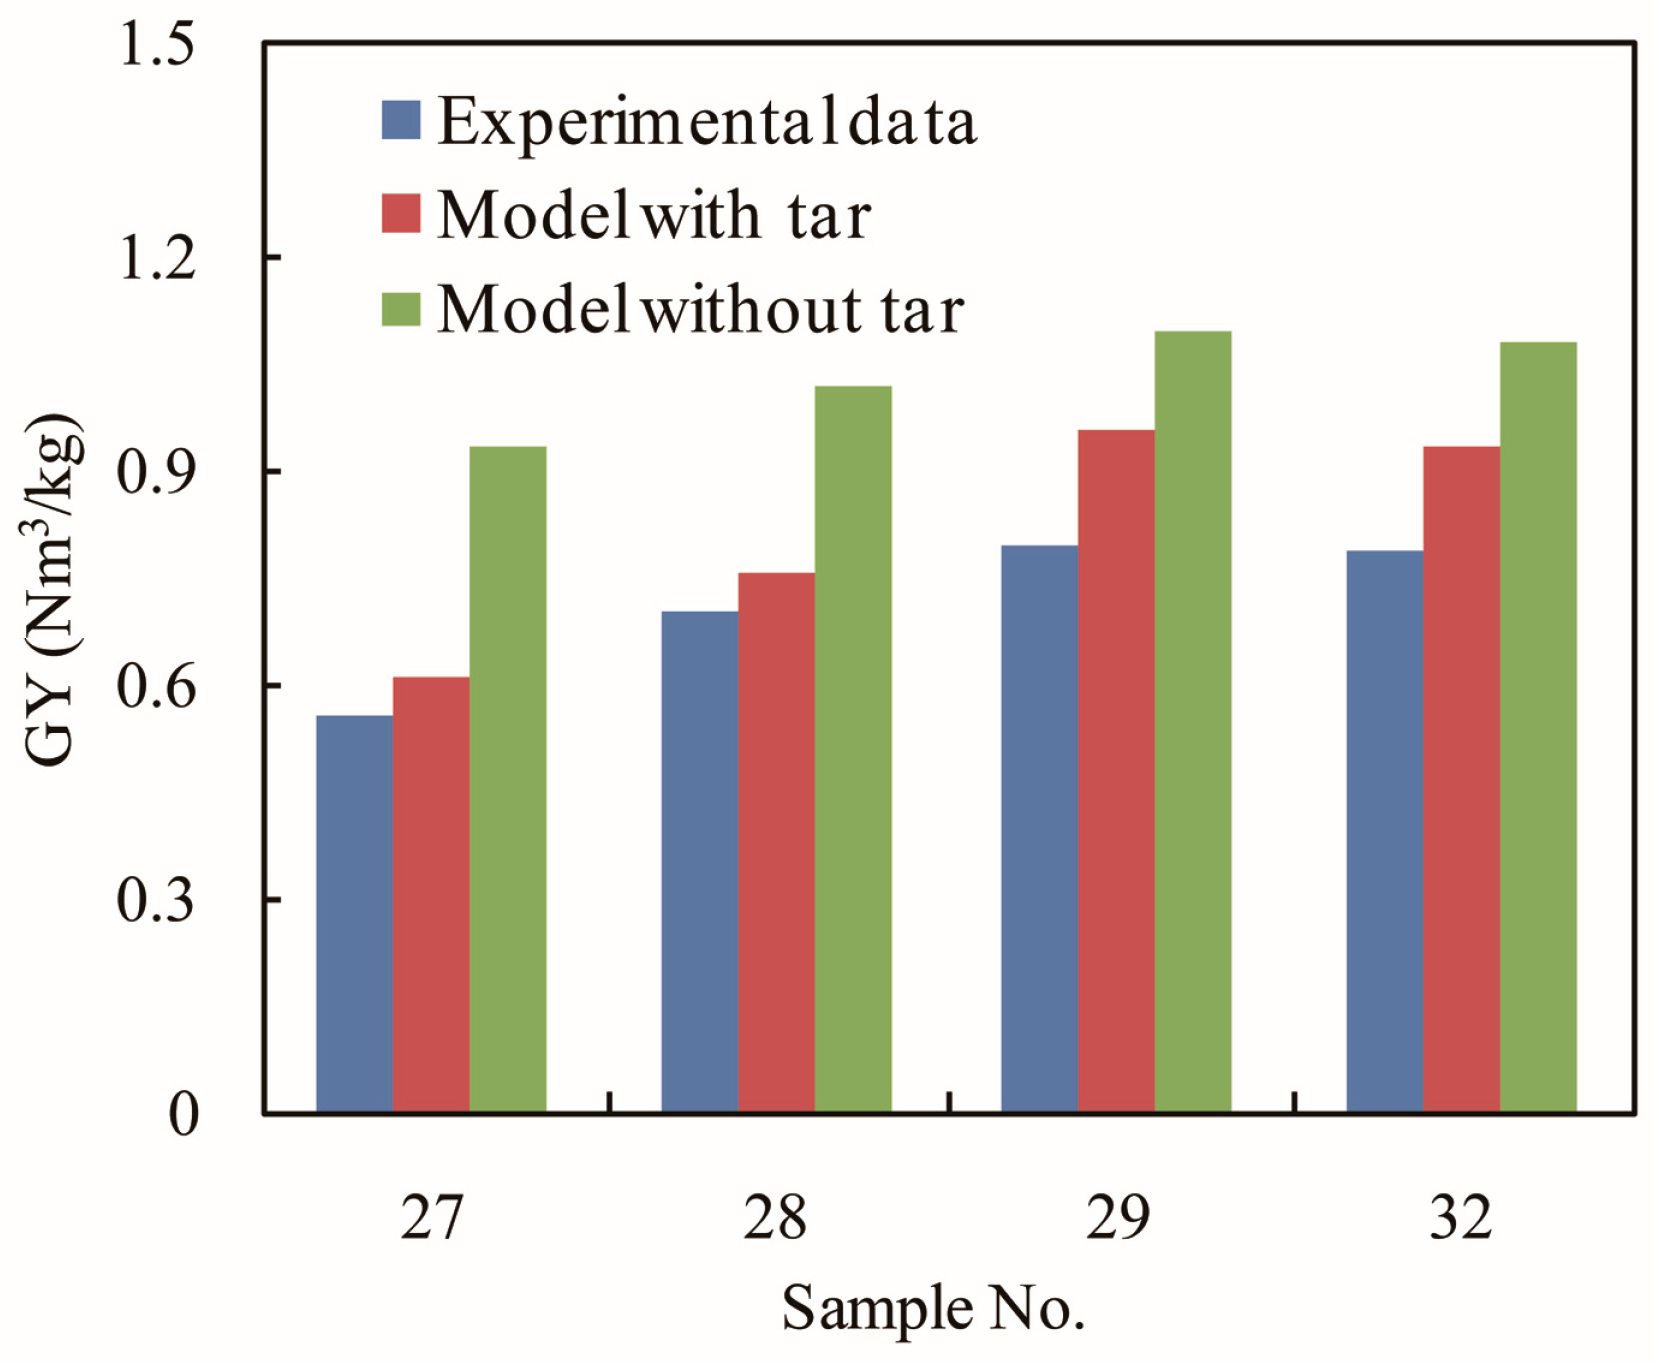
The comparisons between the experimental results and the numerical results for tar content and GY are shown in Figure 4 and Figure 5. Effects of the models, with or without tar, on the simulation results are also researched. The tar content in g/Nm3 is the weight of the tar divided by the volume of dry syngas, which includes nitrogen. From Figure 4, the tar content can be predicted very well. Moreover, the predicted GY based on the model with tar are much closer to the experimental data. For the model without tar, all the tar gets converted into syngas; hence, the predicted GY is larger than the value calculated from the model with tar.
From Figure 6, the predicted total molar fraction of the combustible gases based on the model without tar is larger than the predicted value based on the model with tar. From Figure 4, Figure 5 and Figure 6, the predicted values based on the model with tar are closer to the experimental data. This shows that the gasification model with tar is reasonable and effective. At low gasification temperature with small ER and SBR, the tar content is very high, as shown in Table 1 and Figure 4. In this case the simulation result will be inaccurate if the tar is not considered in the gasification model.
Considering the effects of the process parameters on syngas composition, tar content, LHV, and GY, the proposed equilibrium model with tar is suitable for the simulation of gasification at relatively low gasification temperature with small ER and SBR.
4. Results and Discussion
In this study, gasification of woody biomass is studied with ER varying from 0.1 to 0.5, SBR from 0.15 to 0.6, and the gasification temperature from 900 K to 1100 K. The molecular formula for woody biomass is CH1.4O0.64 on the basis of an earlier reference [43]. The temperature of the inlet biomass is 298.15 K, and the temperatures of inlet air and steam are 673.15 K. The LHV of woody biomass from the same reference work is 17.1 MJ/kg, and the biomass is completely dry in the simulation study.
4.1. The Effect of Gasification Temperature
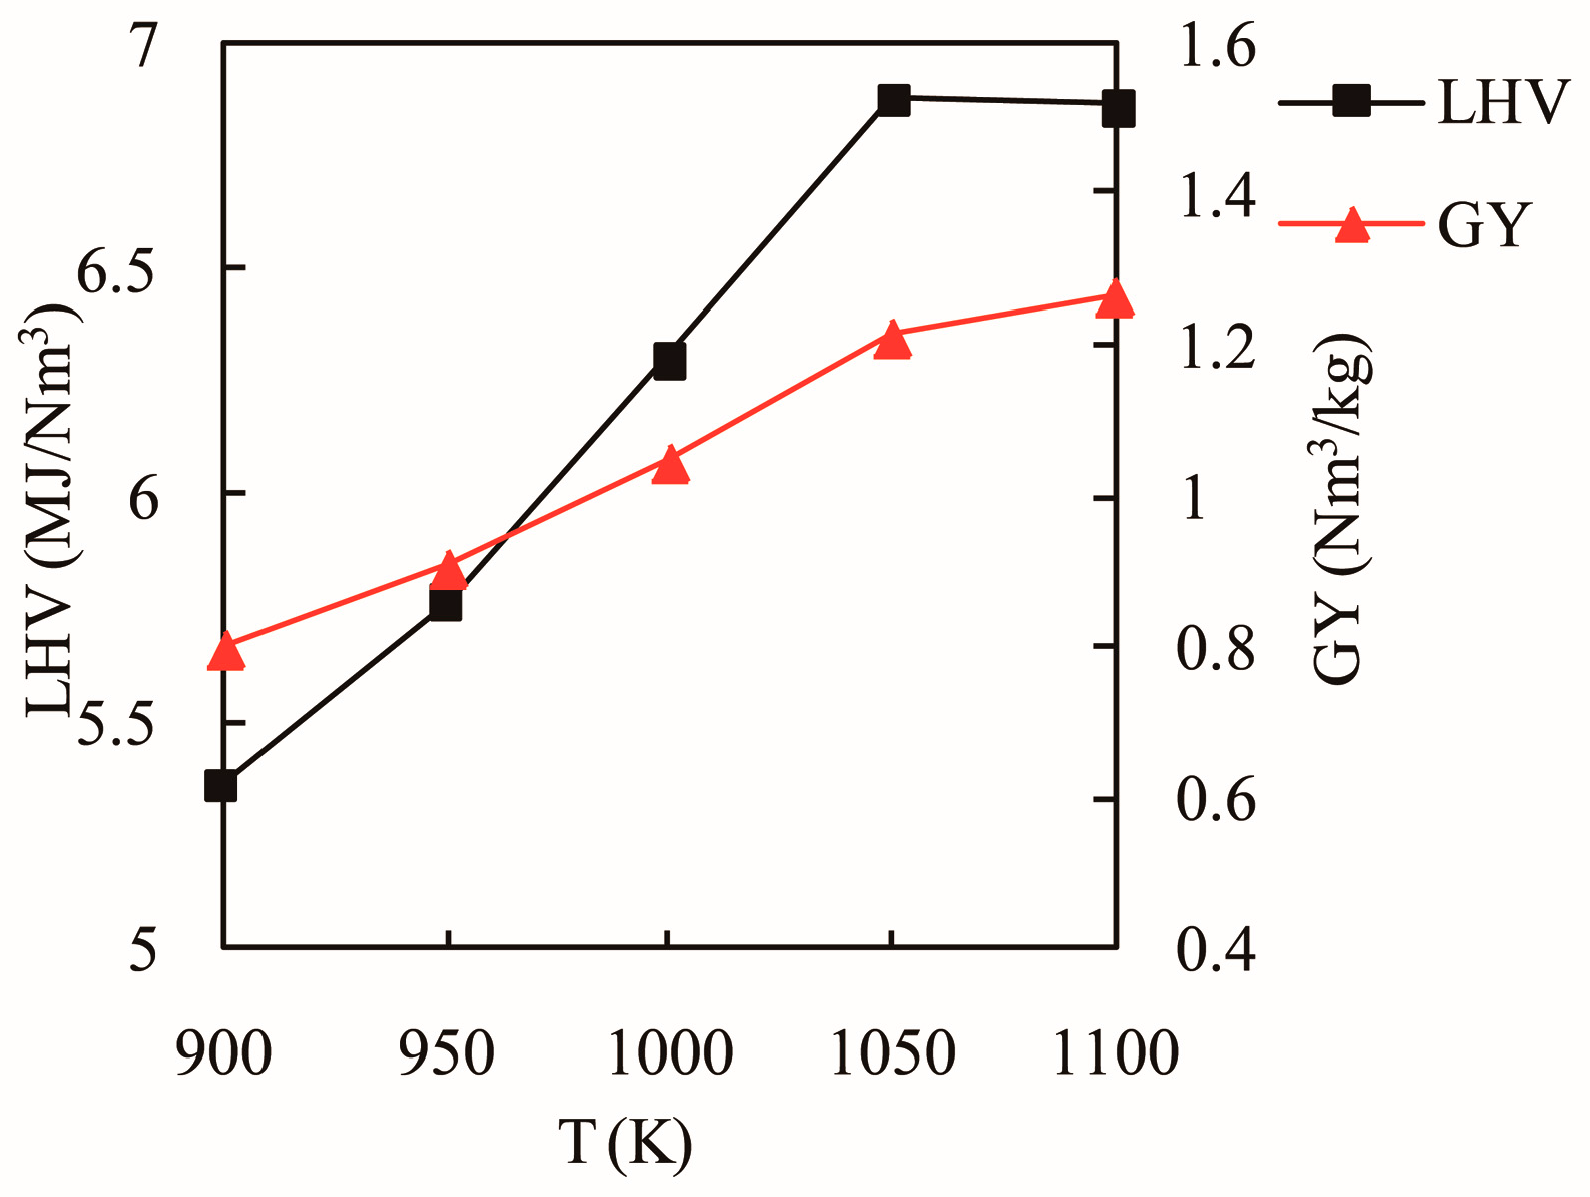
The effects of gasification temperature on syngas composition and tar content are shown in Figure 7. The tar content in g/kg is the weight of the tar divided by the weight of biomass. The result from Figure 7 reveals the expected strong effect of temperature on the gasification products. The molar fractions of CO and H2 increase significantly as gasification temperature increases, whereas the molar fractions of CO2 and CH4 show an opposite trend, as mentioned in the literature [35,42]. Meanwhile, with increase in temperature, the tar content decreases with the value changing from 137 g/kg at 900 K to 0 g/kg at 1050 K. The value of 0 shows that the tar cannot be predicted based on the proposed model in some calculation conditions, which does not agree with the fact. Hence, from this perspective, the model has a certain application scope, which is consistent with the conclusion of previous section of this article. As the tar content decreases and the syngas volume increases with increase in temperature, GY increases with increase in temperature, as shown in Figure 8. Meanwhile, LHV also increases with increase in temperature due to the formation of large molar fractions of CO and H2.
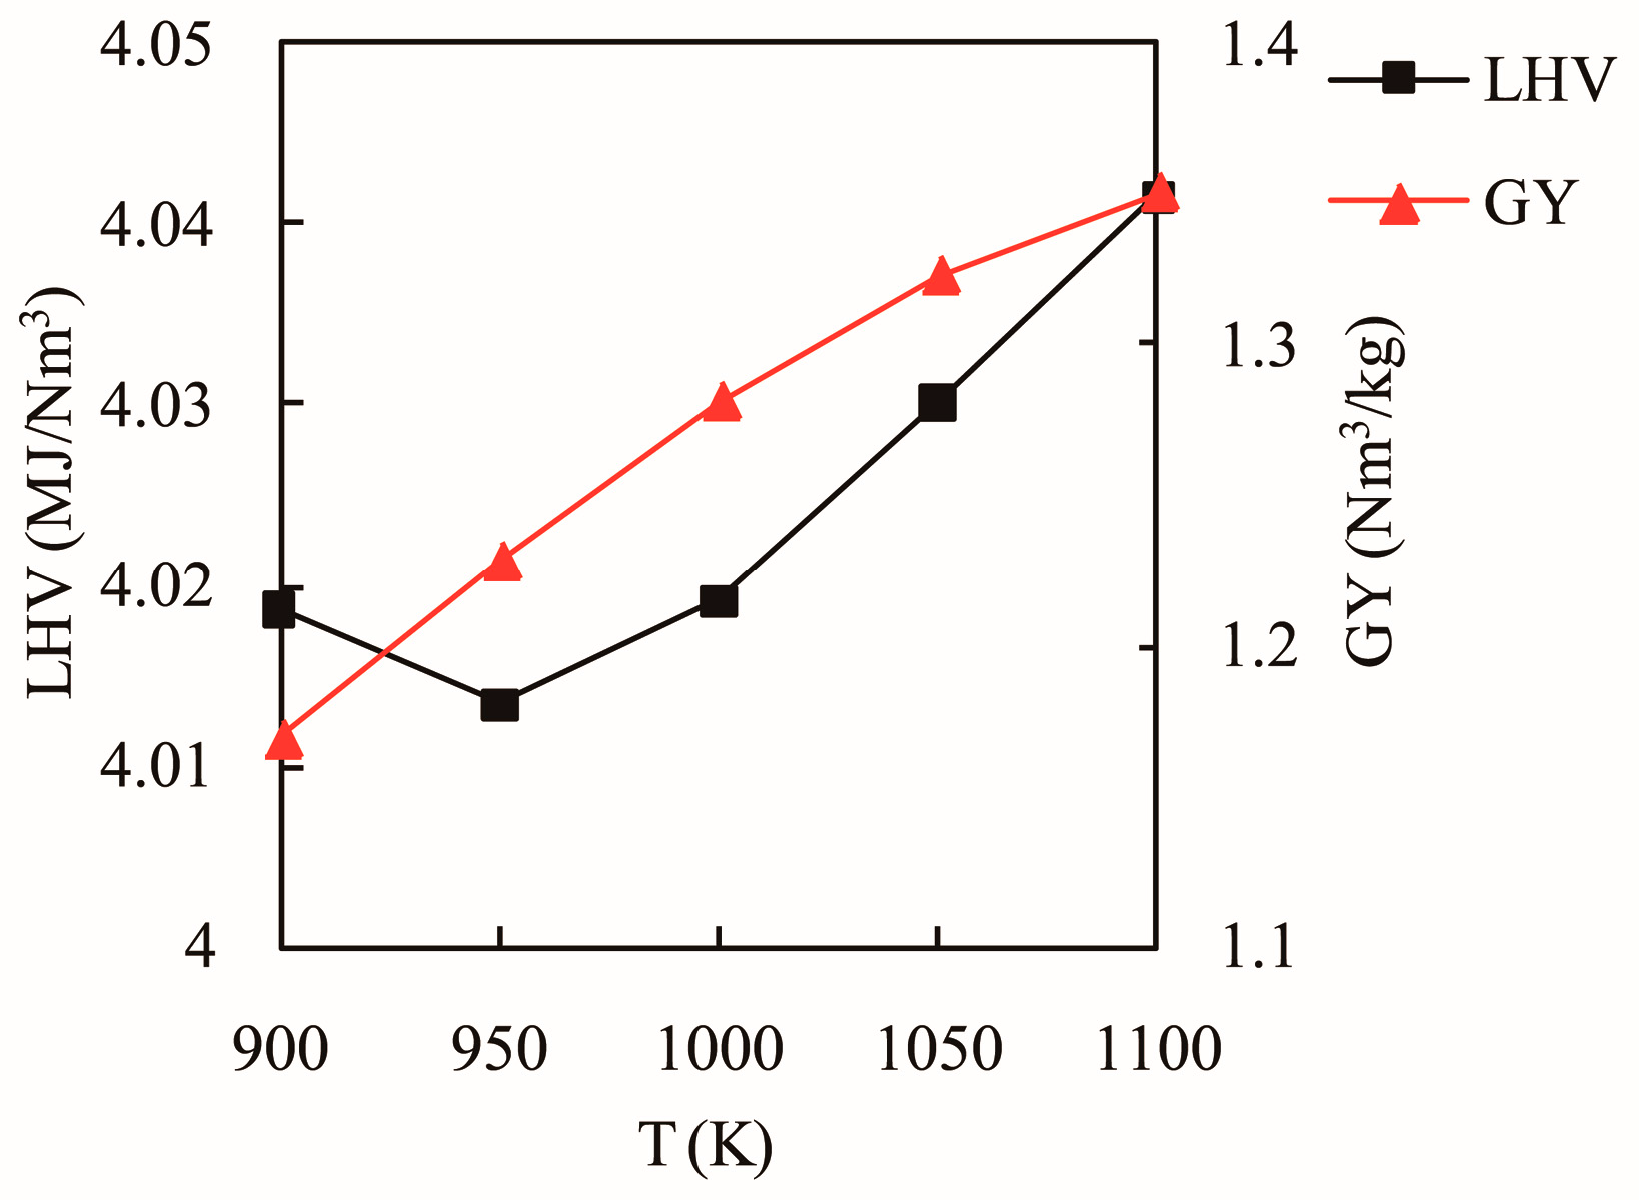
At high ER, the influence of the gasification temperature on the syngas composition is shown in Figure 9. The varying trend of syngas composition shown in Figure 9 is similar to the trend shown in Figure 7, with increase in gasification temperature. However, the total molar fraction of the combustible gases decreases, and this results in the small value of LHV when comparing 4.04 shown in Figure 10 with 6.86 shown in Figure 8 at the same temperature of 1100 K. Meanwhile, tar is not formed throughout the range of temperature, so it is advisable to decrease the tar content by increasing ER.
4.2. The Effect of ER
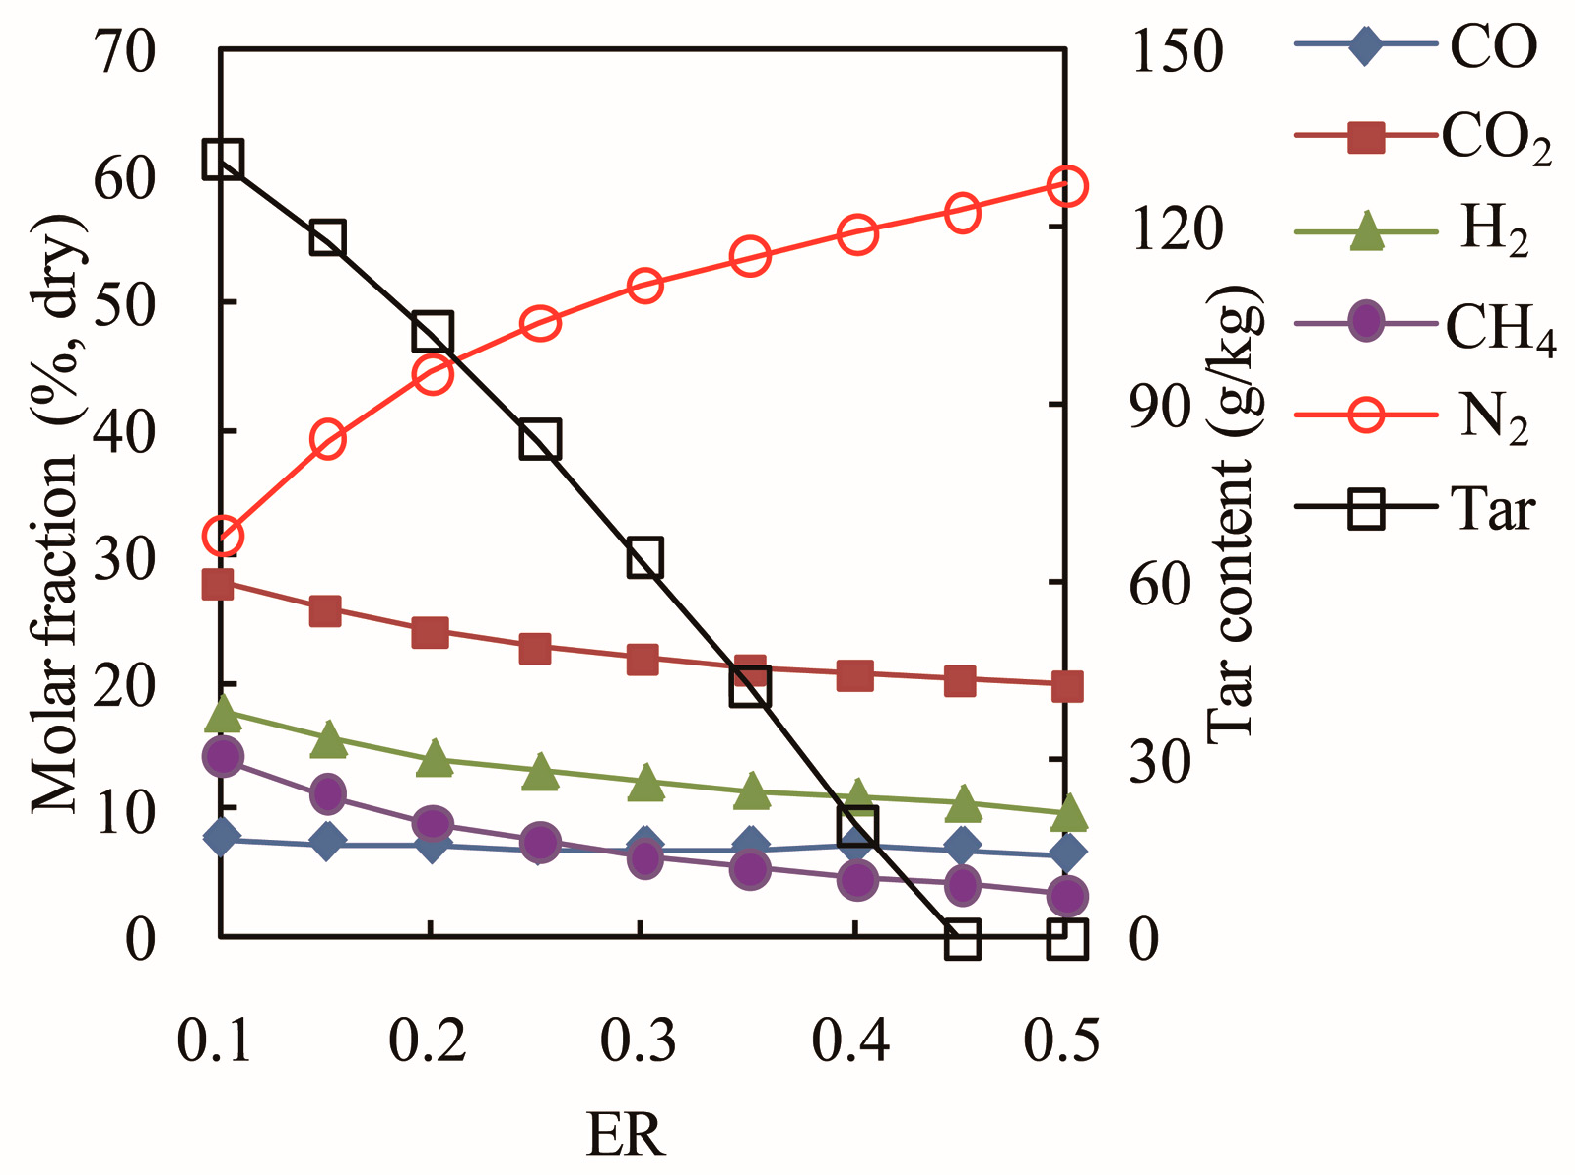
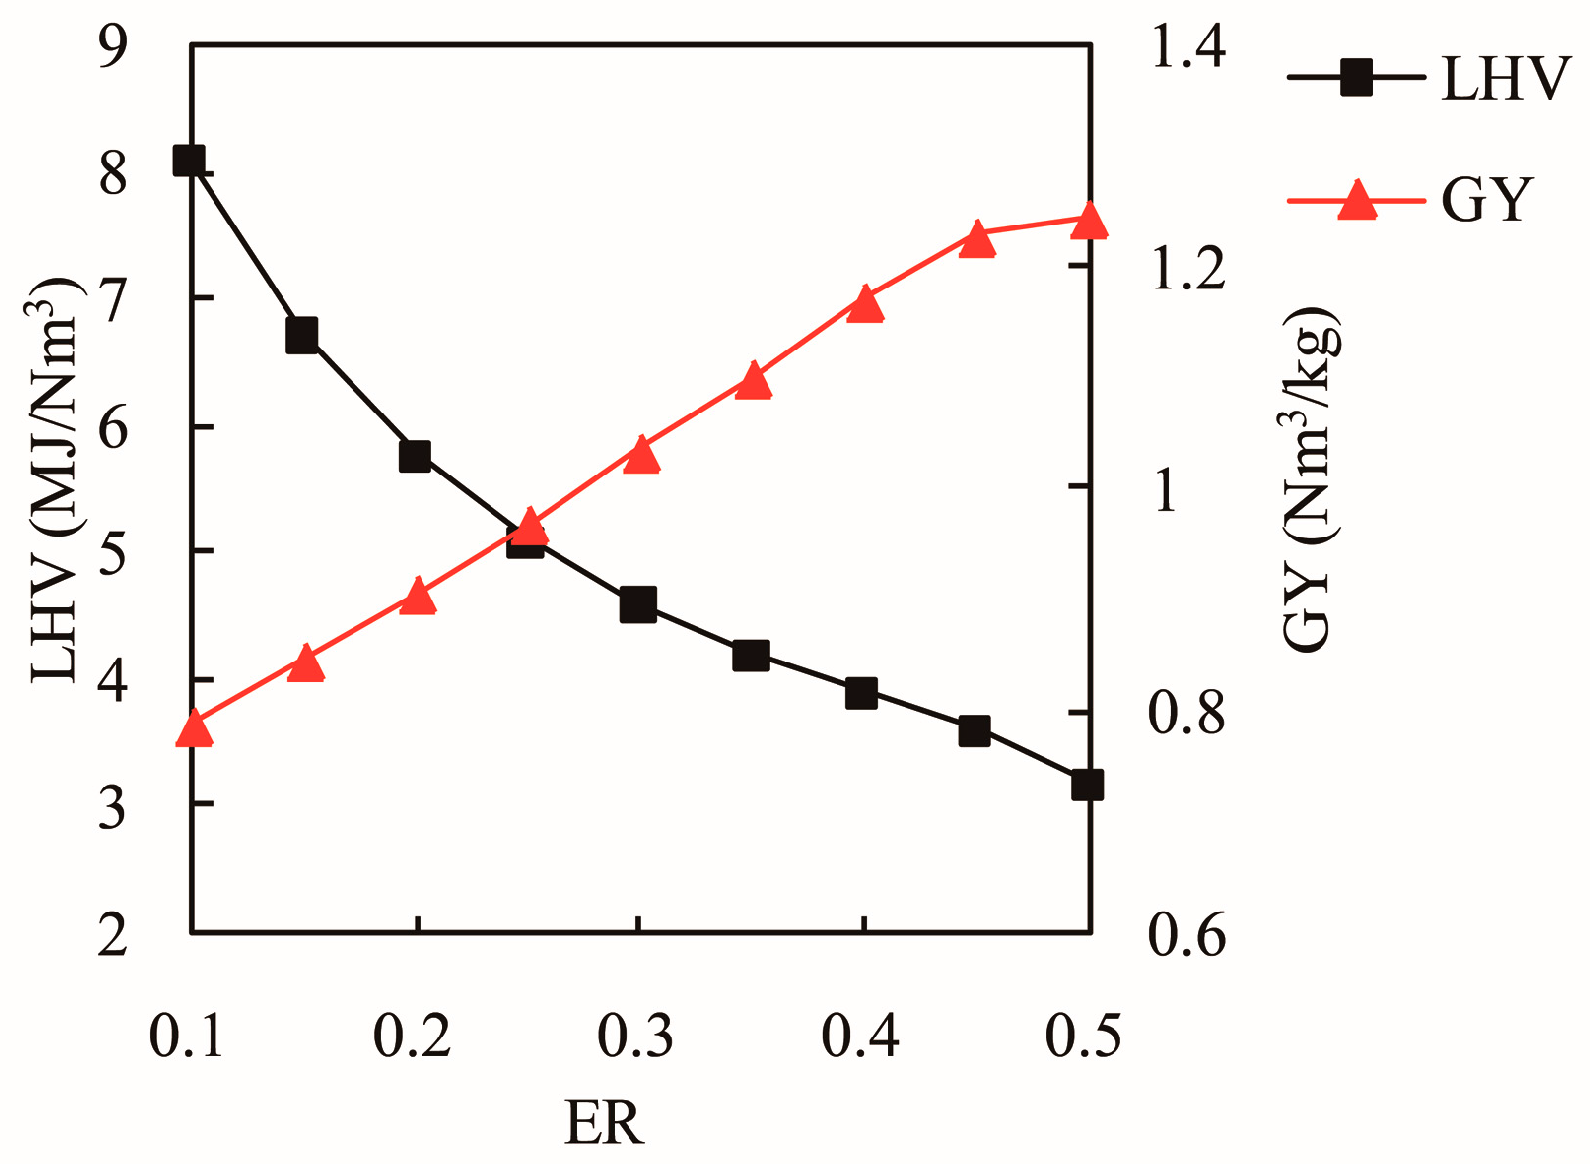
At the gasification temperature of 950 K, the effects of ER on syngas composition and tar content are shown in Figure 11. The molar fractions of the combustible gases decrease with increase in ER due to increase in N2 content, so LHV decreases, as shown in Figure 12. With the conversion of tar and participation of oxygen in the gasifier, GY increases with increase in ER.
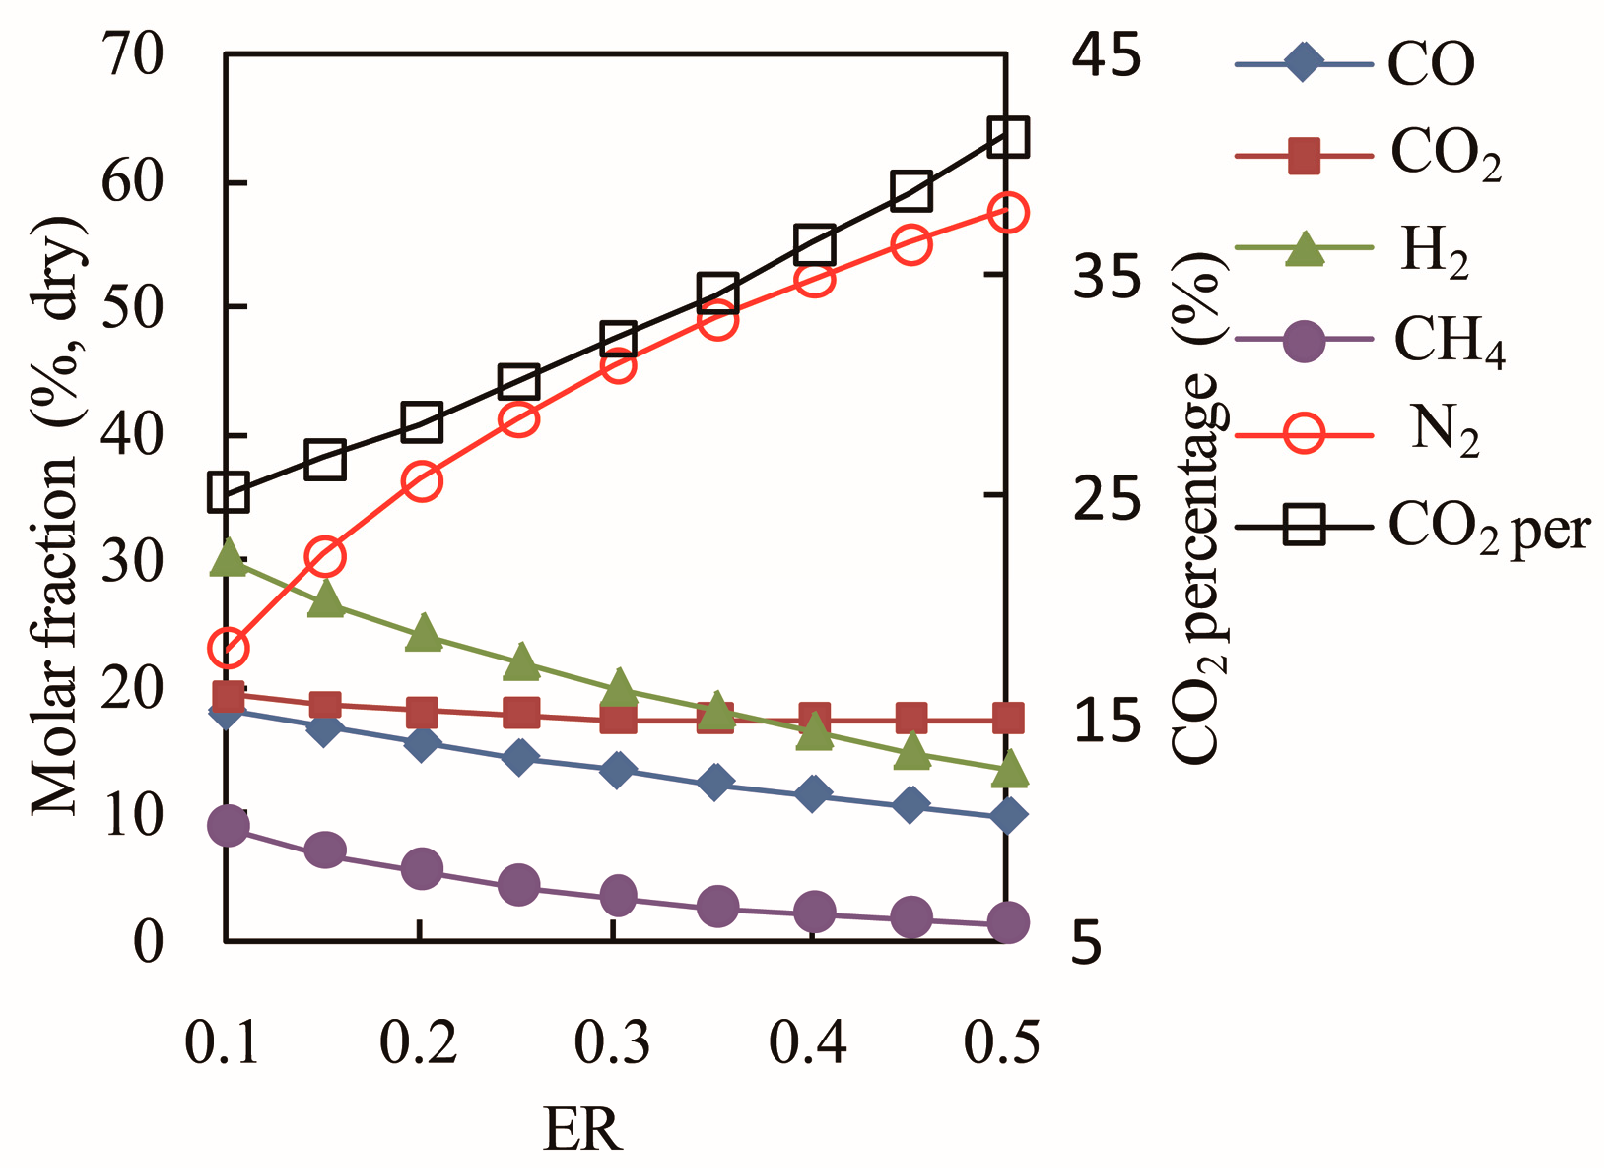
At the gasification temperature of 1100 K, the influence of ER on syngas composition is shown in Figure 13. The percentage of CO2 is defined as the ratio of the molar quantity of CO2 to the total molar quantity of CO, CO2, H2, and CH4 products. The varying trend of the syngas composition shown in Figure 13 is similar to the trend shown in Figure 11. The percentage of the CO2 increases sharply with increase in ER due to combustion of more carbon into CO2, and this is consistent with previous reports [17,34]. The molar fraction of CO2 does not differ much with increasing ER, as seen in Figure 13, and in some studies this value increases slightly [9]. At high temperatures tar is not formed in the entire range of ER. This shows that temperature has an important effect on tar conversion in the gasification process. The effects of ER on LHV and GY shown in Figure 14 are similar to that shown in Figure 12. The GY increases as ER increases, whereas LHV decreases with increase in ER.
4.3. The Effect of SBR
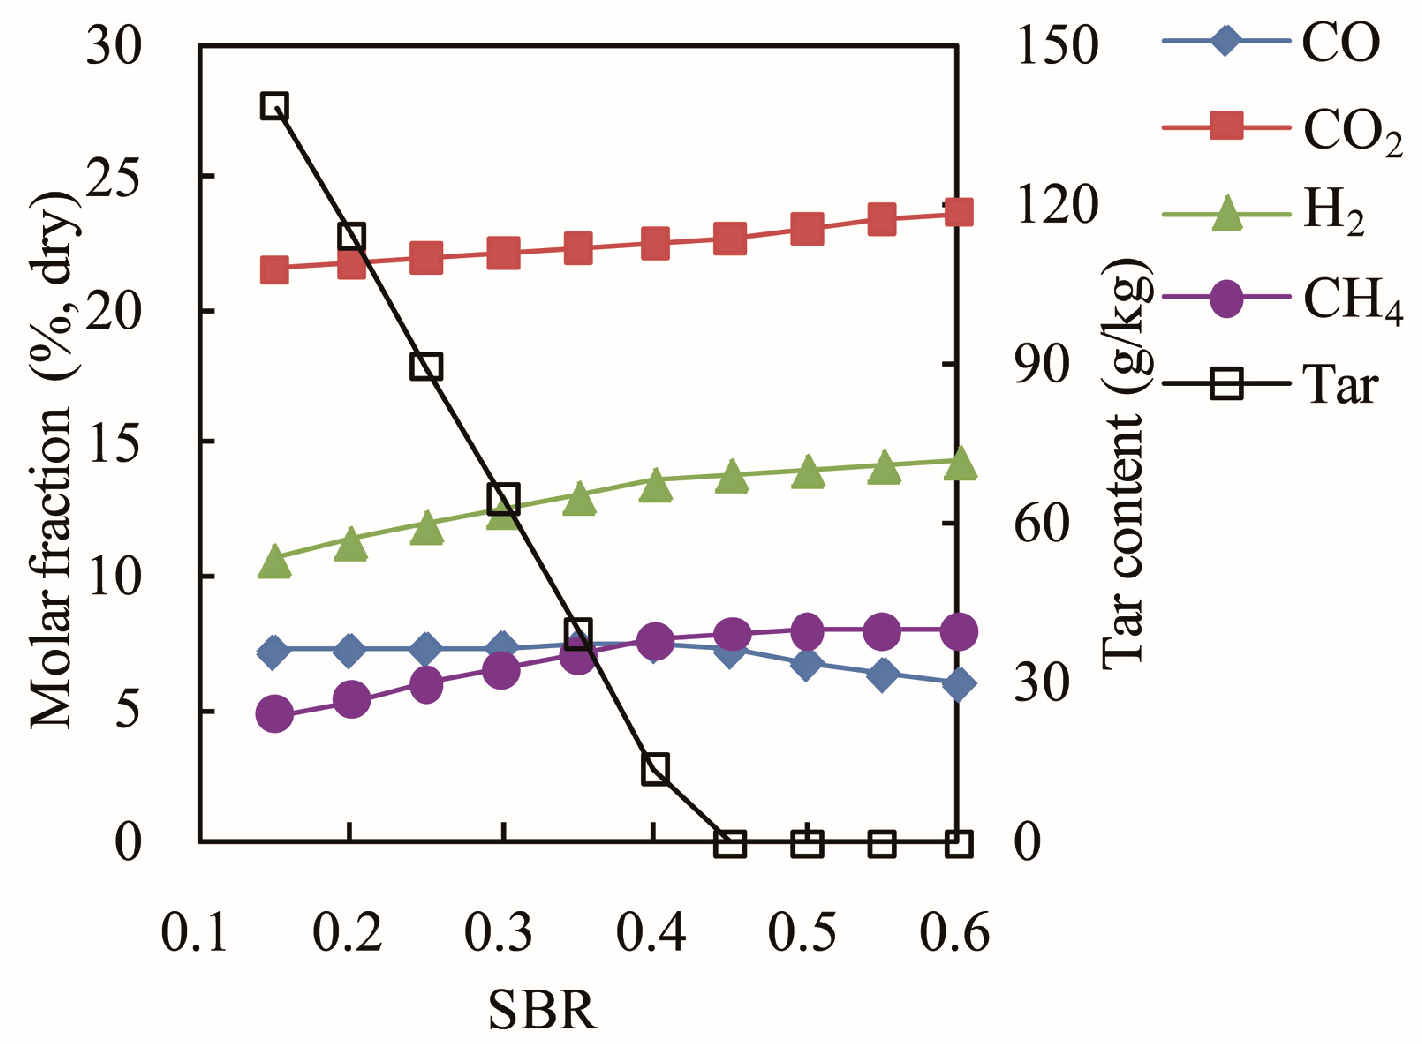
Due to the significant influence of Reaction (7), the molar fractions of H2 and CO2 increase as SBR increases, whereas the value of CO decreases at the same time, as shown in Figure 15. The tar content decreases as SBR increases, which shows the same trend as that reported earlier [45]. Since the trend for the decrease in molar fraction of CO is not evident when SBR is below 0.4, the LHV increases as SBR increases over a maximum range of SBR, followed by a slight decrease, as shown in Figure 16. The GY increases as SBR increases, since Reaction (7) is favored as also mentioned earlier [17].
From Figure 17, the molar fraction of CH4 varies very less with increasing SBR, and the increase in the molar fraction of H2 is not significant. However, at high gasification temperature the molar fraction of CO decreases apparently as SBR increases, which is very different to the trend shown in Figure 15. The result is consistent with earlier studies [9,43]. Meanwhile, in the formula for calculating LHV (Equation (26)), the coefficient corresponding to the molar fraction of CO is larger than that of H2. Therefore, the LHV decreases as SBR increases, as shown in Figure 18 for wide range of SBR. This is different from the trend at low temperature, as shown in Figure 16. It can also be seen that increase in H2 is always accompanied with a decrease in CO and an increase of CO2. Hence, the value of SBR should not be too big, especially at high gasification temperature.
4.4. The Effect of Process Parameters on Energy Exchange
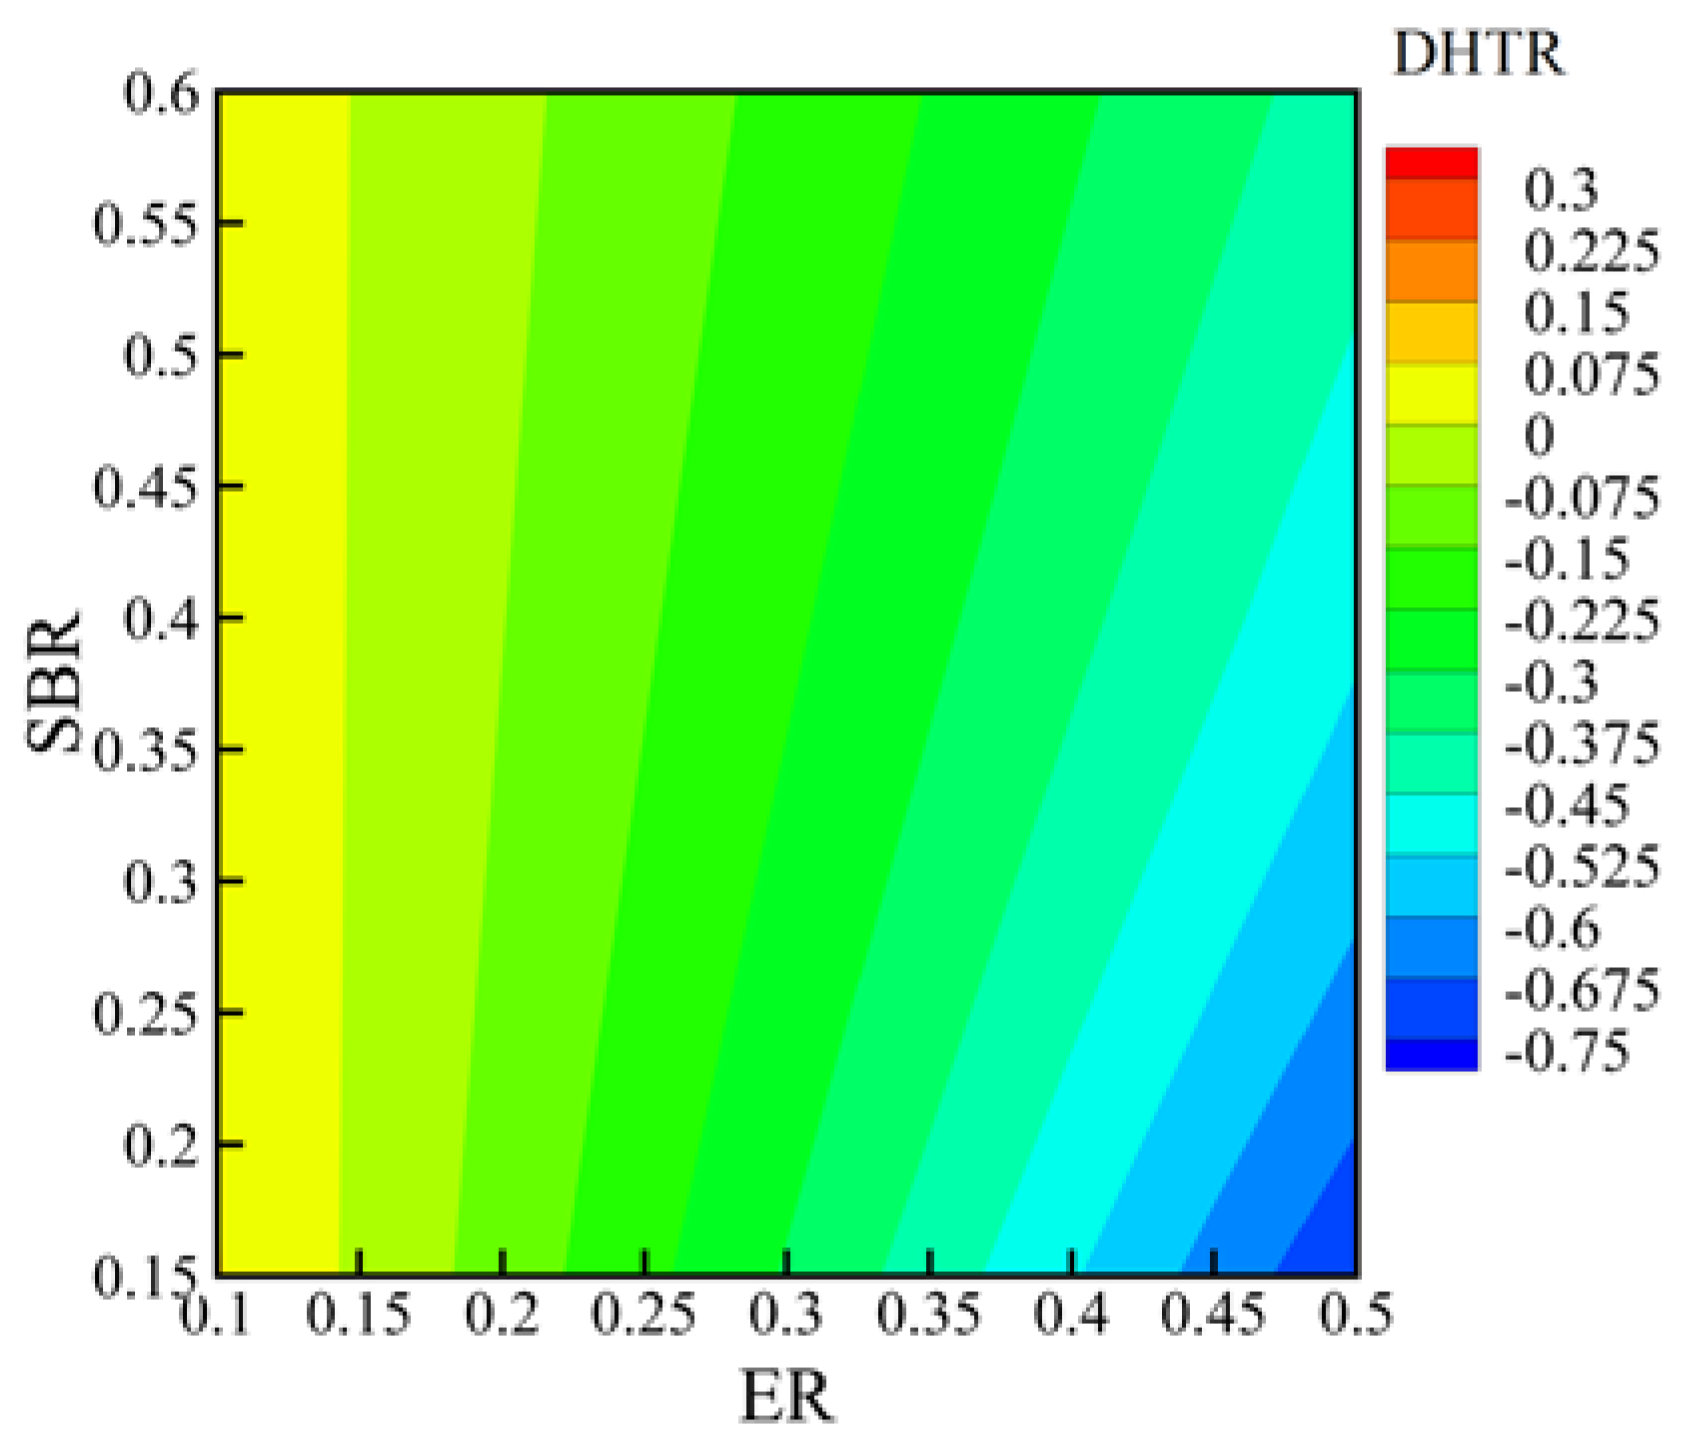
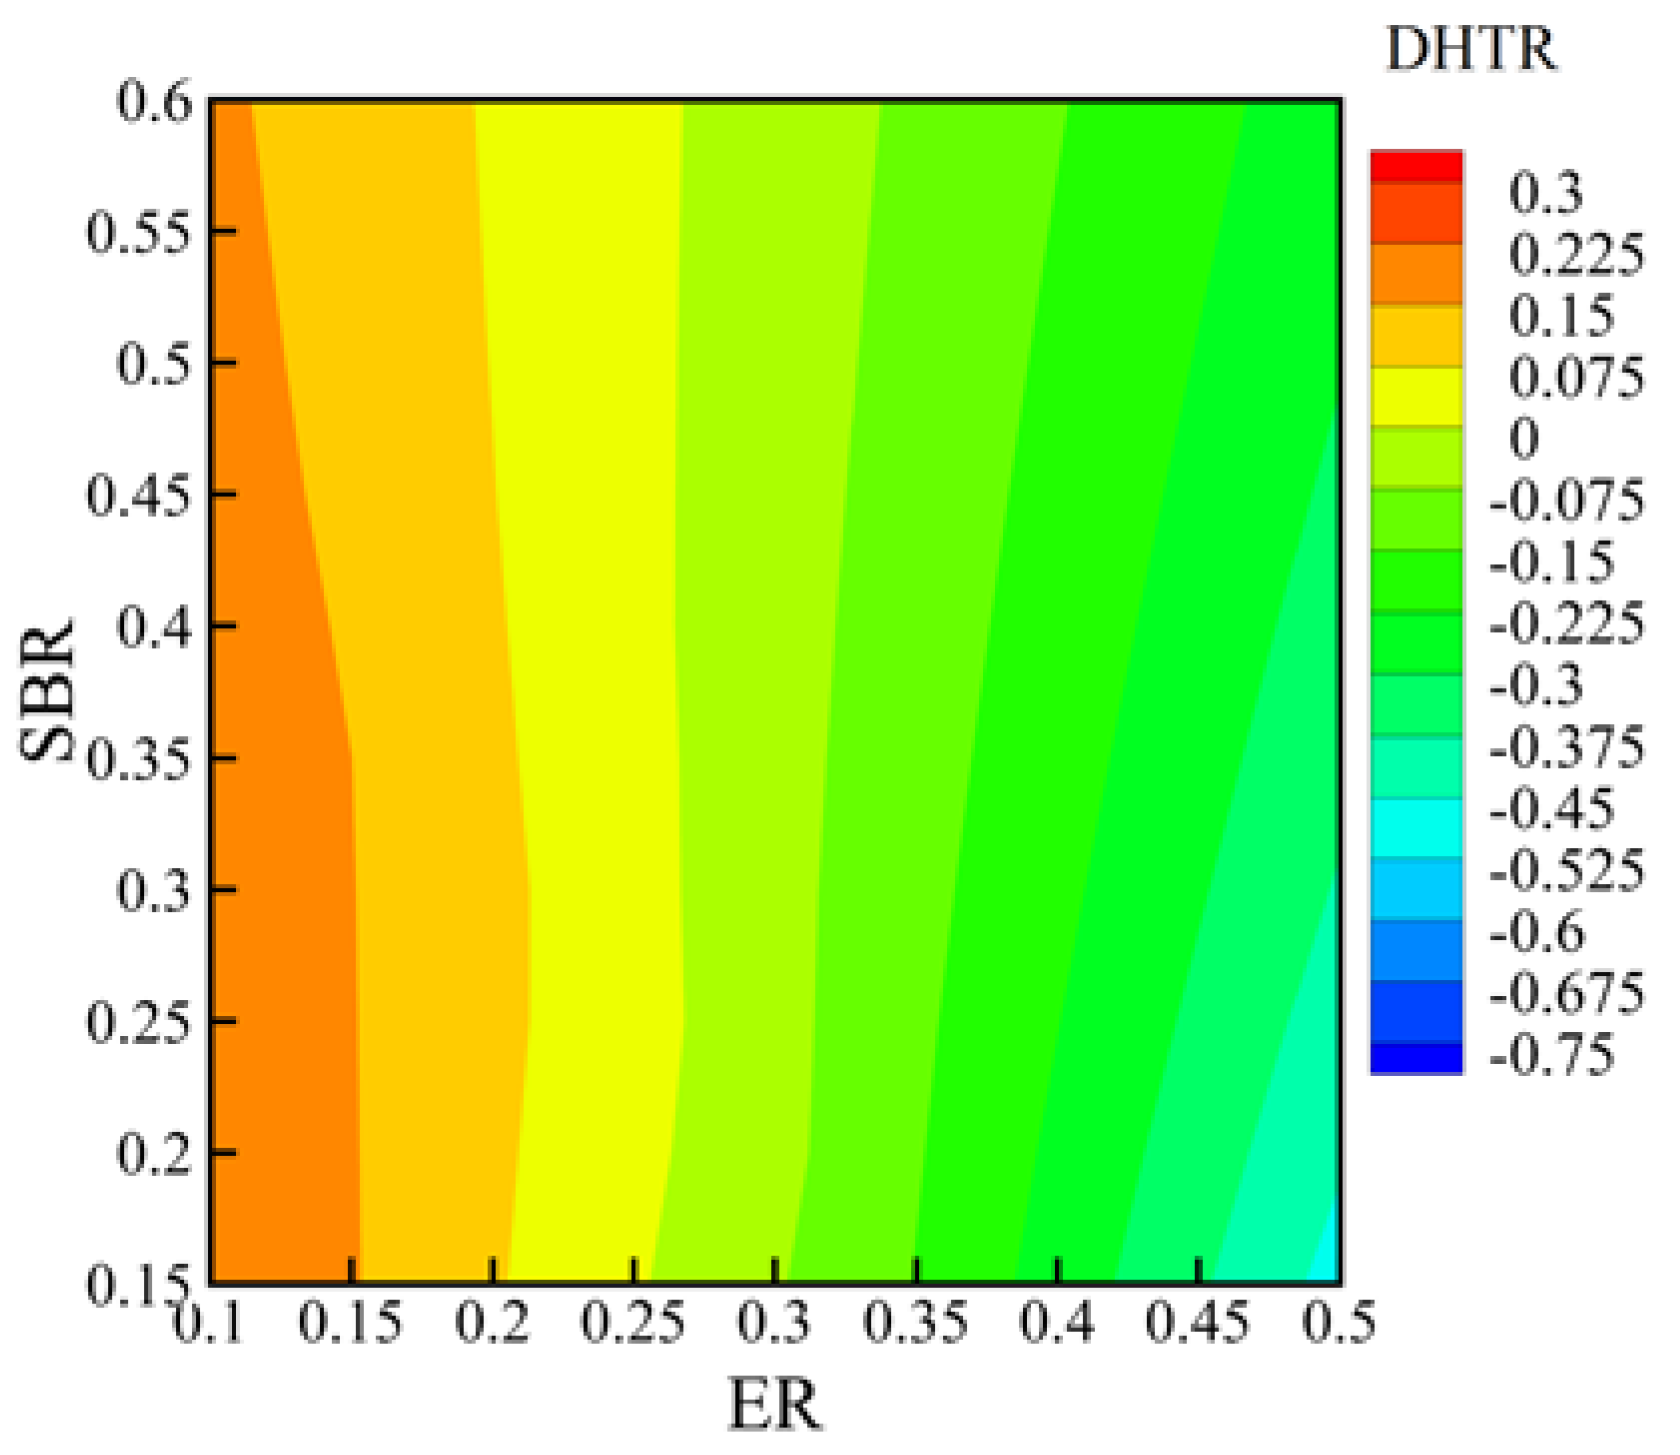
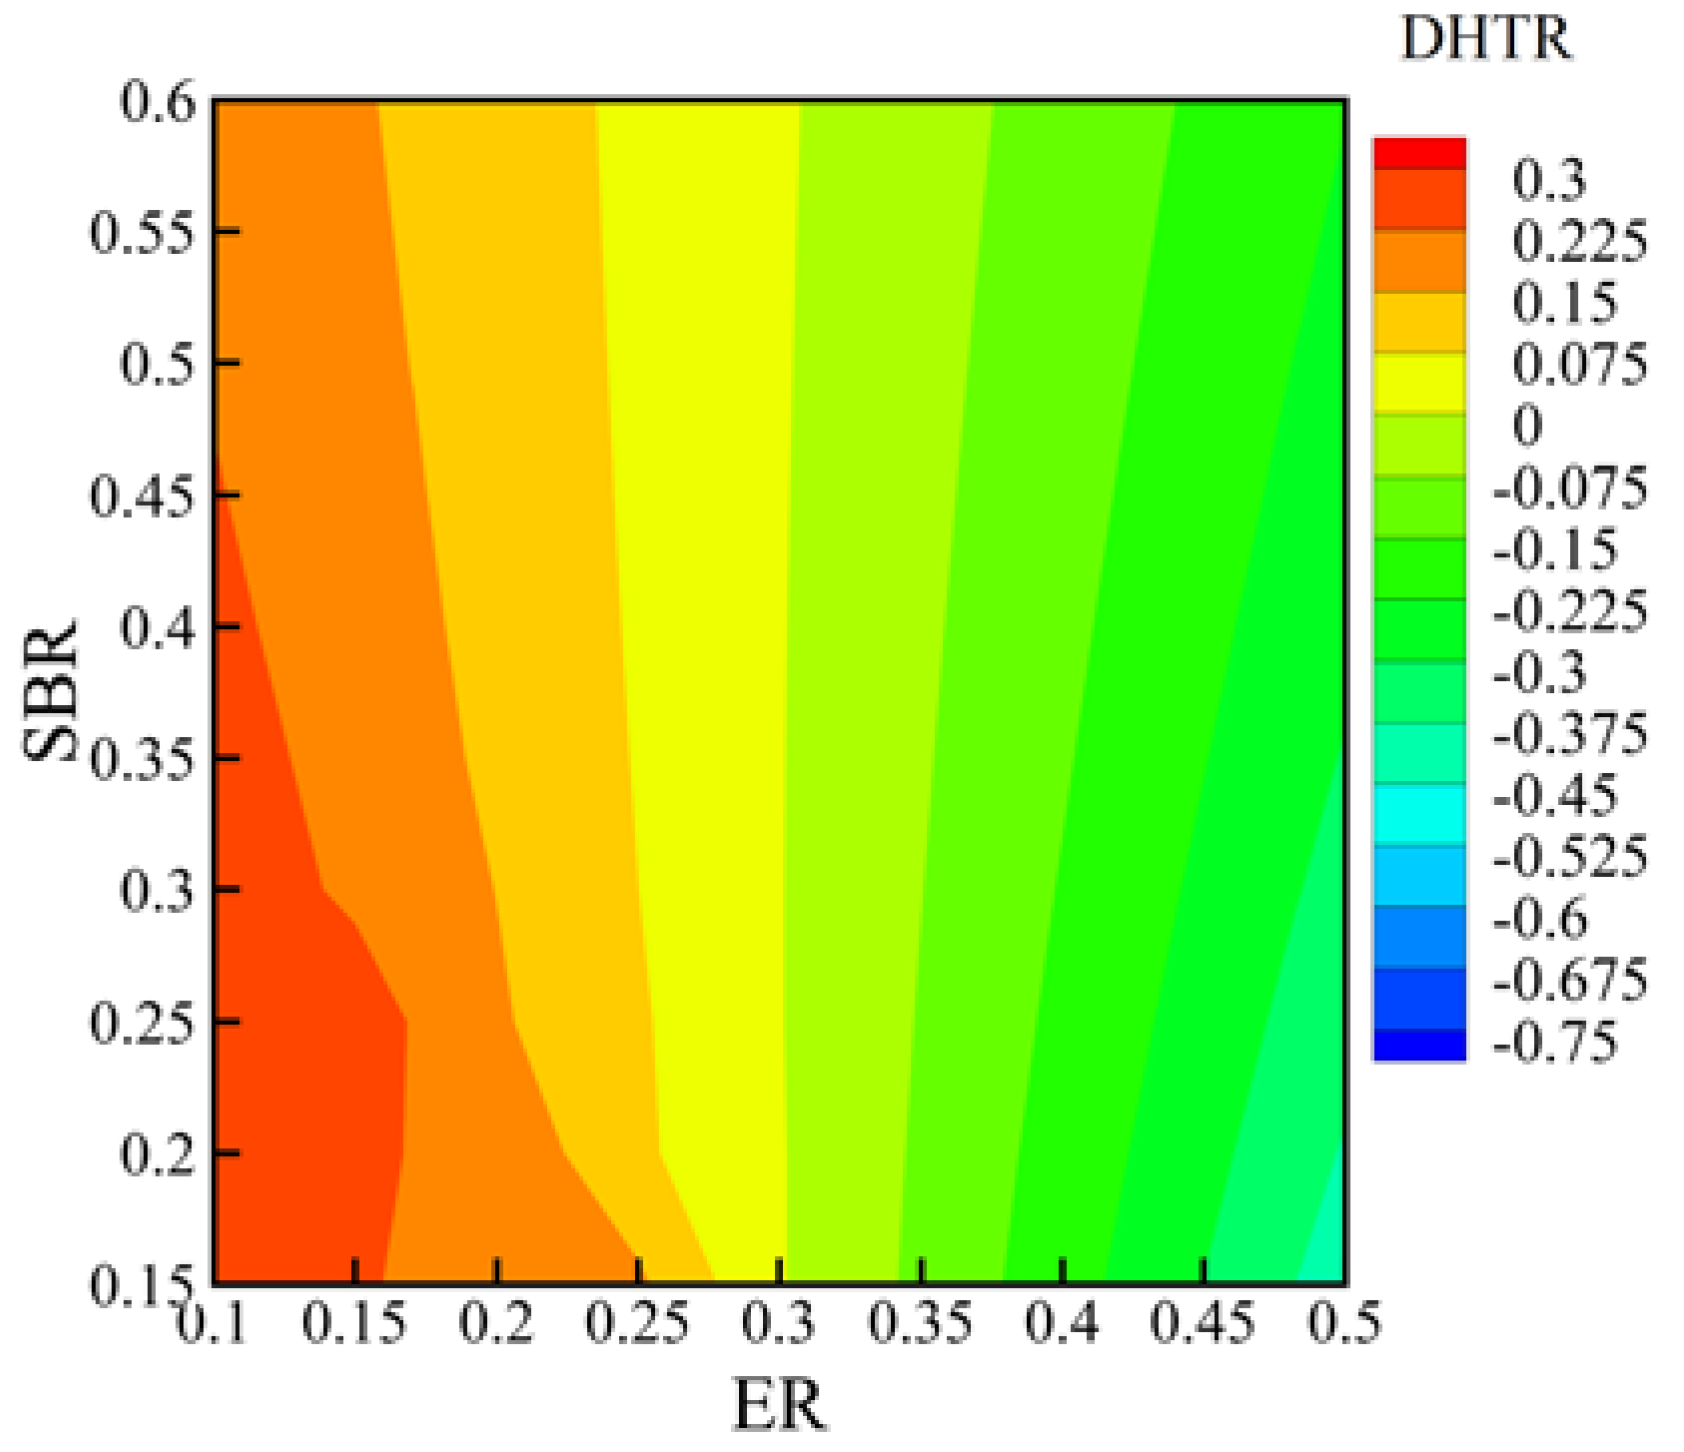
In the air-steam gasification process, the dimensionless heat transfer ratio (DHTR), which can be affected by the process parameters, is adopted to represent the value and direction of energy exchange between the gasifier and the environment, and it is defined as follows:
A DHTR value of zero corresponds to an auto-thermal reaction, which means there is no energy exchange between the gasifier and the environment. The value of more than zero corresponds to an endothermic reaction, whereas the value below zero corresponds to an exothermic reaction.
The distributions of DHTR are shown in Figure 19, Figure 20, Figure 21 and Figure 22, and the air-steam biomass gasification is not an auto-thermal reaction process for most of the process parameters that are shown in the figures. At the same temperature and ER, the effect of SBR on DHTR is not evident, except when the temperature is low and ER is high, as shown in Figure 19. The influence of ER on DHTR is obvious, and the system changes from the endothermic state to the exothermic state as ER increases. This is attributed to an increase in the released heat due to a more complete combustion reaction. With increase in gasification temperature, the auto-thermal reaction zone moves from low ER area to high ER area. ER corresponding to the auto-thermal reaction zone changes from about 0.15 at 900 K temperature to about 0.3 at 1100 K gasification temperature.
Based on 450 numerical data of DHTR, the relationship between DHTR and the process parameters, which is evaluated in terms of the correlation coefficient, is determined as follows:
The correlation coefficient is 0.983, which is a very high value, so it clearly shows that the formula is accurate. According to this formula, the value of energy exchange can be determined conveniently. In some cases, the energy balance equation is introduced to the equilibrium model. Based on Equation (29), the energy exchange can change with the changes of the process parameters, so the predicted results obtained by solving the simultaneous equations will be more reasonable.
4.5. The Effect of Process Parameters on Exergy Efficiency
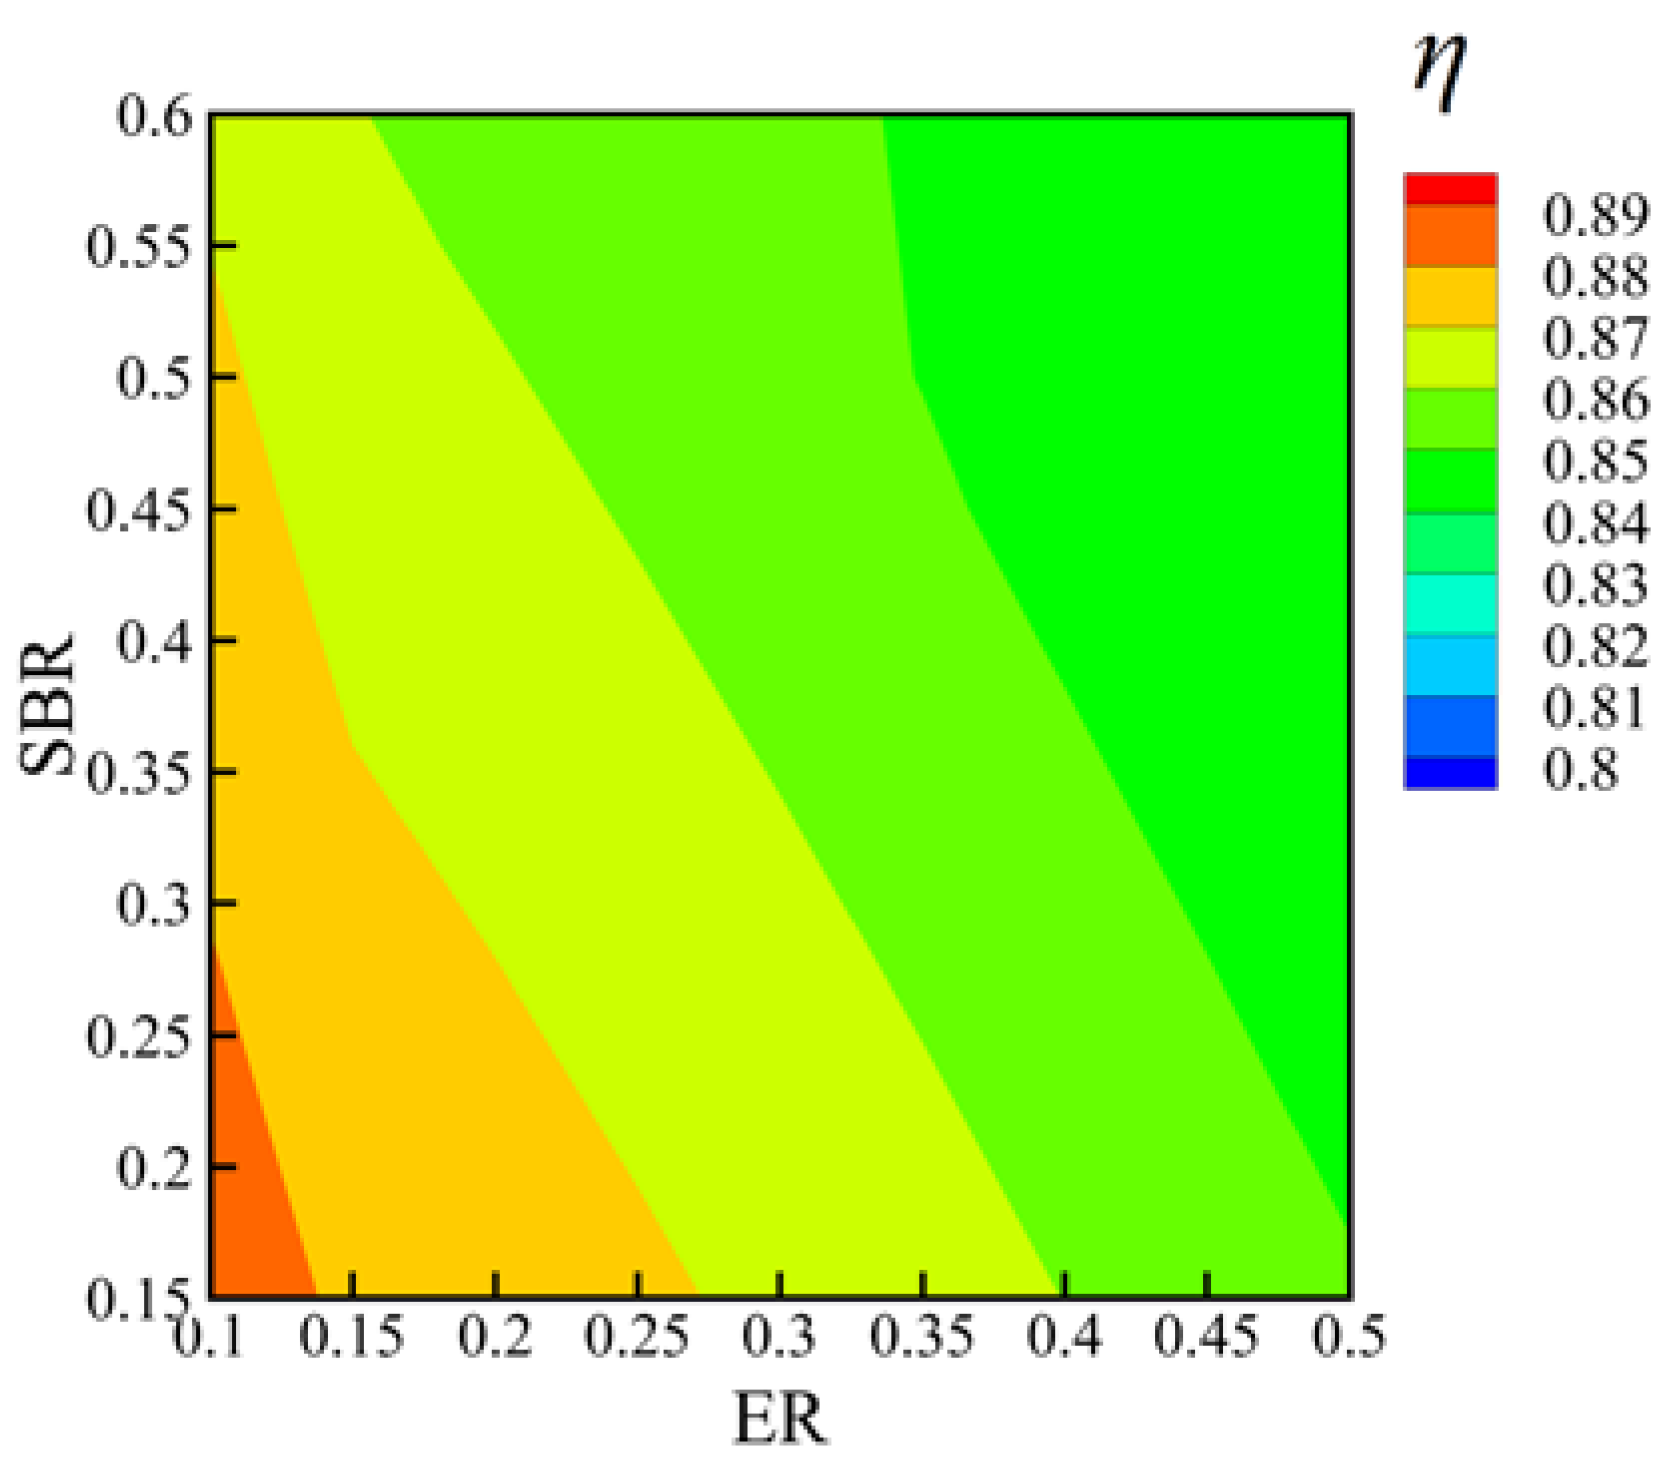
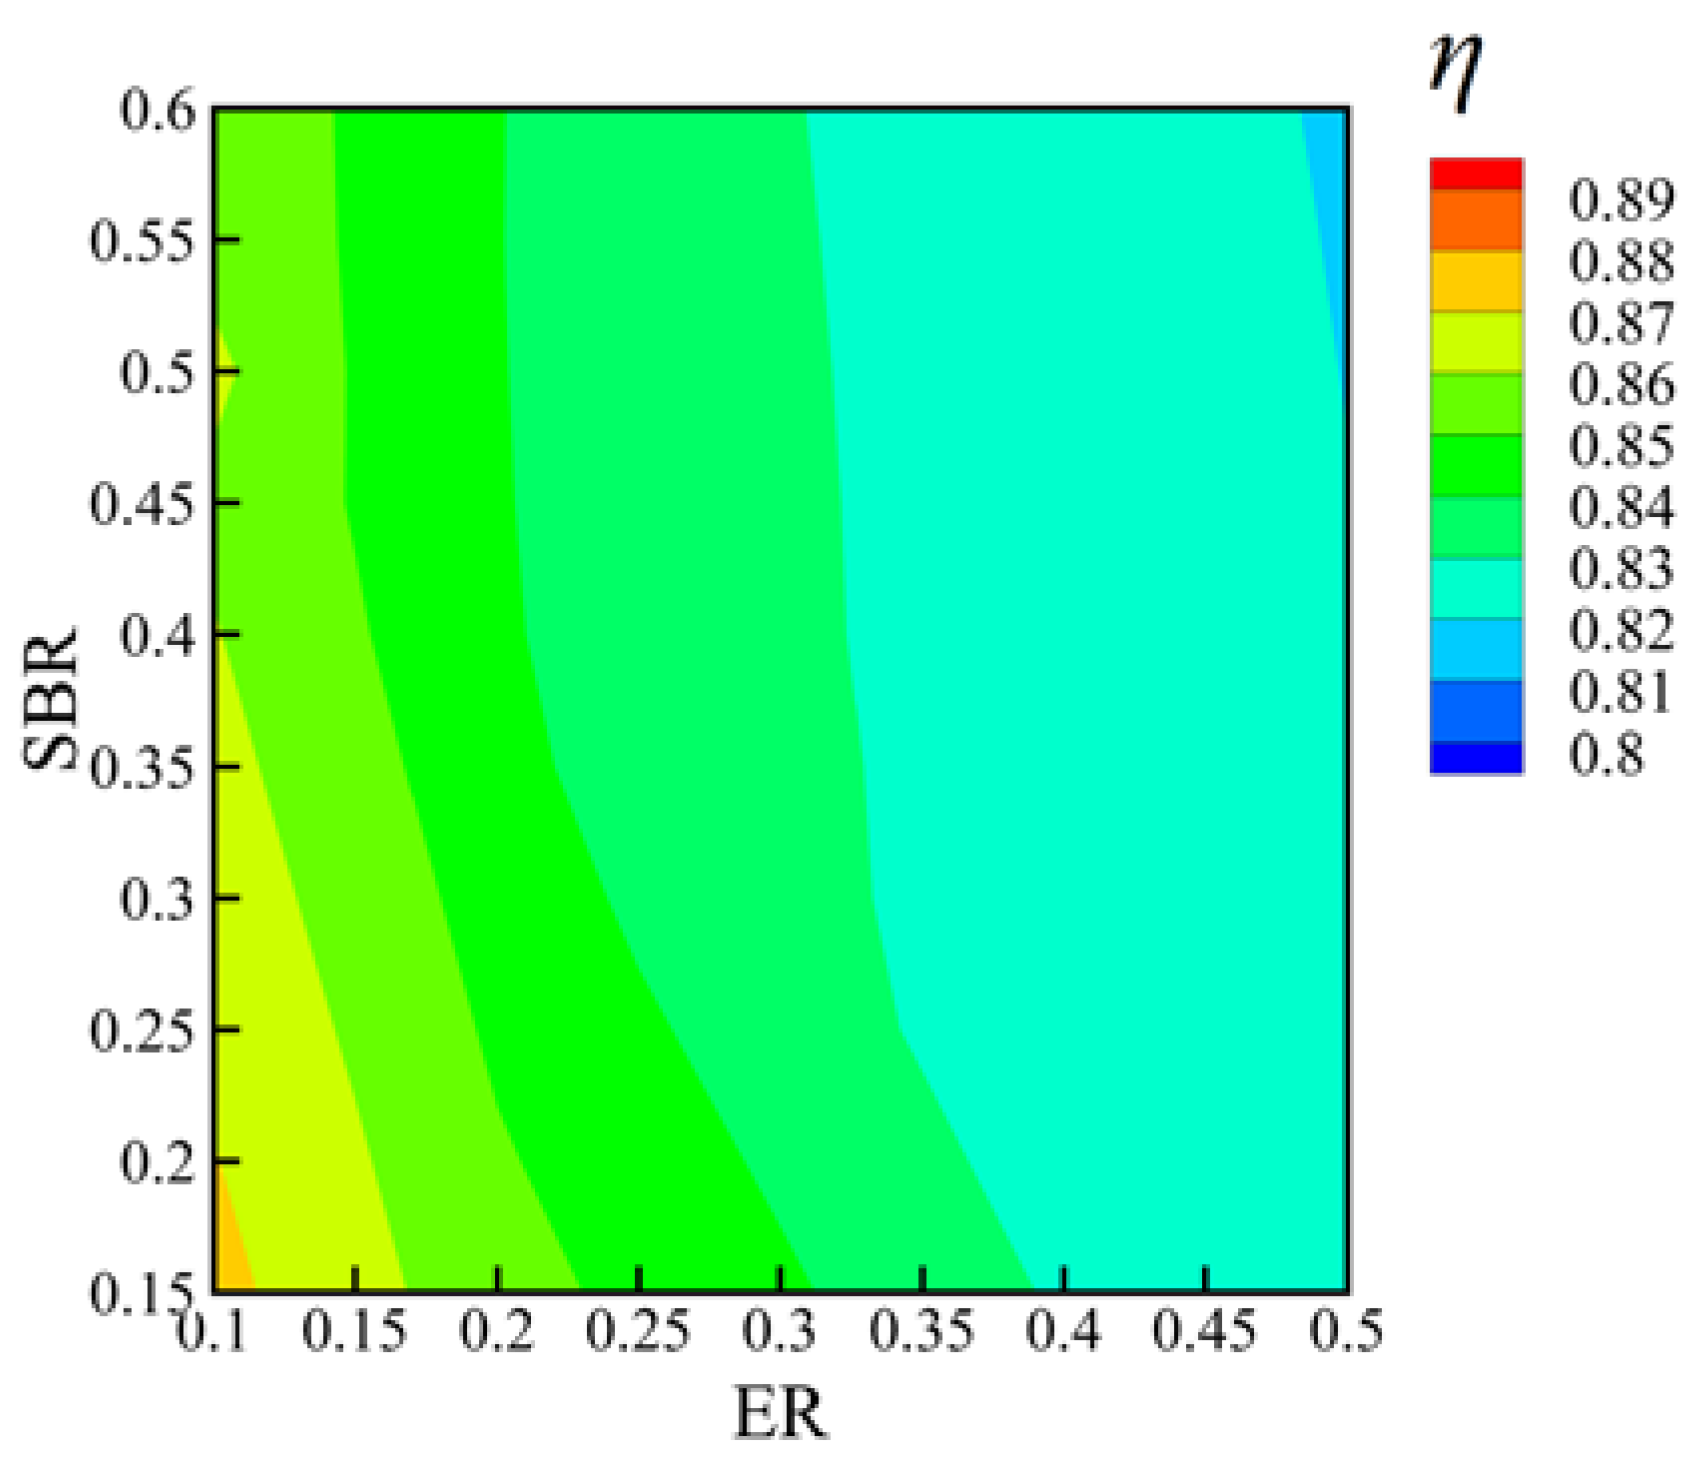
The distributions of exergy efficiency are shown in Figure 23, Figure 24 and Figure 25. The exergy efficiency decreases slightly as SBR increases when both gasification temperature and ER are small. From the figures, the exergy efficiency is between 0.8 and 0.9 under all simulation conditions. The effect of ER on exergy efficiency is obvious, and the exergy efficiency decreases as ER increases.
In exothermic state, based on Equation (25), the exergy efficiency (η) can also be expressed as follows:
where ηp is the exergy efficiency of products, which is termed as the overall exergy efficiency in some studies [9], and ηe is the exergy efficiency of energy exchange.
For the exothermic reaction, the DHTR value decreases with increase in ER, as shown in Figure 19, Figure 20, Figure 21 and Figure 22. By comparing the formulas of these two parameters, DHTR and ηe, the trends are just inverse as ER increases. So, the exergy efficiency of energy exchange increases with increase in ER. However, the total exergy efficiency decreases, as shown in Figure 23, Figure 24 and Figure 25. So the exergy efficiency of products decreases rapidly, and this is the reason for the obvious decrease of exergy efficiency as ER increases in some studies [9].
5. Conclusions
In the present work, the air-steam biomass gasification model with tar has been developed based on the equilibrium constants, and phenol is used as the model compound for the tar. The simulation results based on two different models (with and without tar) have been validated by the experimental data reported in the references, and the model with tar can well predict the tar content in the gasification. Meanwhile, the predicted GY and total molar fraction of the combustible gases, based on the model with tar, agree better with the experimental data. So, the simulation results are much less accurate if the tar is not considered in the gasification model. Considering the effects of the process parameters on syngas composition, tar content, LHV, and GY, the proposed equilibrium model with tar is suitable for the simulation of the gasification process at a relatively low gasification temperature with a small ER and SBR.
The energy exchange between the gasifier and its surroundings has been studied based on DHTR. The influence of SBR on DHTR is not obvious, whereas the effects of ER and temperature on DHTR are evident. Moreover, the relationship between DHTR and the process parameters is given by a formula.
The influence of process parameters on syngas composition, tar content, GY, LHV, and exergy efficiency has also been parametrically researched. With increasing gasification temperature, the total molar fraction of combustible gases, GY, and LHV all increase, whereas the tar content and exergy efficiency all decrease. GY increases as ER increases, whereas tar content, total molar fraction of combustible gases, LHV, and exergy efficiency all decrease. With increasing SBR, the total molar fraction of combustible gases and GY increase, whereas tar content and exergy efficiency all decrease.
Author Contributions
Xinjun Zhao did the simulation and wrote the paper. Qitai Eri and Wenzhen Wu analyzed the data.
Conflicts of Interest
The authors declare no conflict of interest.
References
- Pereira, E.G.; da Silva, J.N.; de Oliveira, J.L.; Machado, C.S. Sustainable energy: A review of gasification technologies. Renew. Sustain. Energy Rev. 2012, 16, 4753–4762. [Google Scholar] [CrossRef]
- Jayathilake, R.; Rudra, S. Numerical and Experimental Investigation of Equivalence Ratio (ER) and Feedstock Particle Size on Birchwood Gasification. Energies 2017, 10, 1232. [Google Scholar] [CrossRef]
- Baruah, D.; Baruah, D.C. Modeling of biomass gasification: A review. Renew. Sustain. Energy Rev. 2014, 39, 806–815. [Google Scholar] [CrossRef]
- Purohit, P. Economic potential of biomass gasification projects under clean development mechanism in India. J. Clean. Prod. 2009, 17, 181–193. [Google Scholar] [CrossRef]
- González-Vázquez, M.; García, R.; Pevida, C.; Rubiera, F. Optimization of a Bubbling Fluidized Bed Plant for Low-Temperature Gasification of Biomass. Energies 2017, 10, 306. [Google Scholar] [CrossRef]
- Ahmed, T.Y.; Ahmad, M.M.; Yusup, S.; Inayat, A.; Khan, Z. Mathematical and computational approaches for design of biomass gasification for hydrogen production: A review. Renew. Sustain. Energy Rev. 2012, 16, 2304–2315. [Google Scholar] [CrossRef]
- Sharma, S.; Sheth, P.N. Air–steam biomass gasification: Experiments, modeling and simulation. Energy Convers. Manag. 2016, 110, 307–318. [Google Scholar] [CrossRef]
- Loha, C.; Chattopadhyay, H.; Chatterjee, P.K. Thermodynamic analysis of hydrogen rich synthetic gas generation from fluidized bed gasification of rice husk. Energy 2011, 36, 4063–4071. [Google Scholar] [CrossRef]
- Tapasvi, D.; Kempegowda, R.S.; Tran, K.-Q.; Skreiberg, Ø.; Grønli, M. A simulation study on the torrefied biomass gasification. Energy Convers. Manag. 2015, 90, 446–457. [Google Scholar] [CrossRef]
- Jangsawang, W.; Klimanek, A.; Gupta, A.K. Enhanced yield of hydrogen from wastes using high temperature steam gasification. J. Energy Resour. Technol. 2006, 128, 179–185. [Google Scholar] [CrossRef]
- Rodríguez-Olalde, N.; Mendoza-Chávez, E.; Castro-Montoya, A.; Saucedo-Luna, J.; Maya-Yescas, R.; Rutiaga-Quiñones, J.; Ortega, J. Simulation of Syngas Production from Lignin Using Guaiacol as a Model Compound. Energies 2015, 8, 6705–6714. [Google Scholar] [CrossRef]
- Suwatthikul, A.; Limprachaya, S.; Kittisupakorn, P.; Mujtaba, I. Simulation of Steam Gasification in a Fluidized Bed Reactor with Energy Self-Sufficient Condition. Energies 2017, 10, 314. [Google Scholar] [CrossRef]
- He, J.; Göransson, K.; Söderlind, U.; Zhang, W. Simulation of biomass gasification in a dual fluidized bed gasifier. Biomass Convers. Biorefin. 2012, 2, 1–10. [Google Scholar] [CrossRef]
- Rofouie, P.; Moshkelani, M.; Perrier, M.; Paris, J. A modified thermodynamic equilibrium model for woody biomass gasification. Can. J. Chem. Eng. 2014, 92, 593–602. [Google Scholar] [CrossRef]
- Meng, W.X.; Banerjee, S.; Zhang, X.; Agarwal, R.K. Process simulation of multi-stage chemical-looping combustion using Aspen Plus. Energy 2015, 90, 1869–1877. [Google Scholar] [CrossRef]
- Chutichai, B.; Patcharavorachot, Y.; Assabumrungrat, S.; Arpornwichanop, A. Parametric analysis of a circulating fluidized bed biomass gasifier for hydrogen production. Energy 2015, 82, 406–413. [Google Scholar] [CrossRef]
- Lim, Y.-i.; Lee, U.-D. Quasi-equilibrium thermodynamic model with empirical equations for air–steam biomass gasification in fluidized-beds. Fuel Process. Technol. 2014, 128, 199–210. [Google Scholar] [CrossRef]
- Karmakar, M.K.; Datta, A.B. Generation of hydrogen rich gas through fluidized bed gasification of biomass. Bioresour. Technol. 2011, 102, 1907–1913. [Google Scholar] [CrossRef] [PubMed]
- Mendiburu, A.Z.; Carvalho, J.A.; Coronado, C.J.R. Thermochemical equilibrium modeling of biomass downdraft gasifier: Stoichiometric models. Energy 2014, 66, 189–201. [Google Scholar] [CrossRef]
- Jarungthammachote, S.; Dutta, A. Thermodynamic equilibrium model and second law analysis of a downdraft waste gasifier. Energy 2007, 32, 1660–1669. [Google Scholar] [CrossRef]
- Kim, Y.D.; Yang, C.W.; Kim, B.J.; Kim, K.S.; Lee, J.W.; Moon, J.H.; Yang, W.; Yu, T.U.; Lee, U.D. Air-blown gasification of woody biomass in a bubbling fluidized bed gasifier. Appl. Energy 2013, 112, 414–420. [Google Scholar] [CrossRef]
- Sahoo, A.; Ram, D.K. Gasifier performance and energy analysis for fluidized bed gasification of sugarcane bagasse. Energy 2015, 90, 1420–1425. [Google Scholar] [CrossRef]
- Umeki, K.; Yamamoto, K.; Namioka, T.; Yoshikawa, K. High temperature steam-only gasification of woody biomass. Appl. Energy 2010, 87, 791–798. [Google Scholar] [CrossRef]
- Fremaux, S.; Beheshti, S.-M.; Ghassemi, H.; Shahsavan-Markadeh, R. An experimental study on hydrogen-rich gas production via steam gasification of biomass in a research-scale fluidized bed. Energy Convers. Manag. 2015, 91, 427–432. [Google Scholar] [CrossRef]
- Gil-Lalaguna, N.; Sánchez, J.L.; Murillo, M.B.; Rodríguez, E.; Gea, G. Air–steam gasification of sewage sludge in a fluidized bed. Influence of some operating conditions. Chem. Eng. J. 2014, 248, 373–382. [Google Scholar] [CrossRef]
- Ruoppolo, G.; Ammendola, P.; Chirone, R.; Miccio, F. H2-rich syngas production by fluidized bed gasification of biomass and plastic fuel. Waste Manag. 2012, 32, 724–732. [Google Scholar] [CrossRef] [PubMed]
- Huang, H.J.; Ramaswamy, S. Modeling biomass gasification using thermodynamic equilibrium approach. Appl. Biochem. Biotechnol. 2009, 154, 14–25. [Google Scholar] [CrossRef] [PubMed]
- Mayerhofer, M.; Fendt, S.; Spliethoff, H.; Gaderer, M. Fluidized bed gasification of biomass—In bed investigation of gas and tar formation. Fuel 2014, 117, 1248–1255. [Google Scholar] [CrossRef]
- Martínez-Lera, S.; Pallarés Ranz, J. On the development of a wood gasification modelling approach with special emphasis on primary devolatilization and tar formation and destruction phenomena. Energy 2016, 113, 643–652. [Google Scholar] [CrossRef]
- Morf, P.; Hasler, P.; Nussbaumer, T. Mechanisms and kinetics of homogeneous secondary reactions of tar from continuous pyrolysis of wood chips. Fuel 2002, 81, 843–853. [Google Scholar] [CrossRef]
- Ji, P.; Feng, W.; Chen, B. Production of ultrapure hydrogen from biomass gasification with air. Chem. Eng. Sci. 2009, 64, 582–592. [Google Scholar] [CrossRef]
- Zainal, Z.A.; Ali, R.; Lean, C.H.; Seetharamu, K.N. Prediction of performance of a downdraft gasifier using equilibrium modeling for different biomass materials. Energy Convers. Manag. 2001, 42, 1499–1515. [Google Scholar] [CrossRef]
- Gómez-Barea, A.; Leckner, B. Estimation of gas composition and char conversion in a fluidized bed biomass gasifier. Fuel 2013, 107, 419–431. [Google Scholar] [CrossRef]
- Li, X.T.; Grace, J.R.; Lim, C.J.; Watkinson, A.P.; Chen, H.P.; Kim, J.R. Biomass gasification in a circulating fluidized bed. Biomass Bioenergy 2004, 26, 171–193. [Google Scholar] [CrossRef]
- Meng, X.; de Jong, W.; Fu, N.; Verkooijen, A.H. M. Biomass gasification in a 100 kWth steam-oxygen blown circulating fluidized bed gasifier: Effects of operational conditions on product gas distribution and tar formation. Biomass Bioenergy 2011, 35, 2910–2924. [Google Scholar] [CrossRef]
- Lv, P.M.; Xiong, Z.H.; Chang, J.; Wu, C.Z.; Chen, Y.; Zhu, J.X. An experimental study on biomass air-steam gasification in a fluidized bed. Bioresour. Technol. 2004, 95, 95–101. [Google Scholar] [CrossRef] [PubMed]
- Li, X.; Grace, J.R.; Watkinson, A.P.; Lim, C.J.; Ergudenler, A. Equilibrium modeling of gasification: A free energy minimization approach and its application to a circulating fluidized bed coal gasifier. Fuel 2001, 80, 195–207. [Google Scholar] [CrossRef]
- Srinivas, T.; Gupta, A.V.S.S.K.S.; Reddy, B.V. Thermodynamic equilibrium model and exergy analysis of a biomass gasifier. J. Energy Resour. Technol. 2009, 131, 98–105. [Google Scholar] [CrossRef]
- Demirel, Y. Thermodynamic analysis. Arab. J. Sci. Eng. 2013, 38, 221–249. [Google Scholar] [CrossRef]
- Pellegrini, L.; Deoliveirajr, S. Exergy analysis of sugarcane bagasse gasification. Energy 2007, 32, 314–327. [Google Scholar] [CrossRef]
- Datta, A.; Ganguly, R.; Sarkar, L. Energy and exergy analyses of an externally fired gas turbine (EFGT) cycle integrated with biomass gasifier for distributed power generation. Energy 2010, 35, 341–350. [Google Scholar] [CrossRef]
- Wang, R.; Huang, Q.; Lu, P.; Li, W.; Wang, S.; Chi, Y.; Yan, J. Experimental study on air/steam gasification of leather scraps using U-type catalytic gasification for producing hydrogen-enriched syngas. Int. J. Hydrogen Energy 2015, 40, 8322–8329. [Google Scholar] [CrossRef]
- Campoy, M.; Gómez-Barea, A.; Vidal, F.B.; Ollero, P. Air-steam gasification of biomass in a fluidized bed under simulated autothermal and adiabatic conditions. Ind. Eng. Chem. Res. 2008, 47, 5957–5965. [Google Scholar] [CrossRef]
- Jarungthammachote, S.; Dutta, A. Experimental investigation of a multi-stage air-steam gasification process for hydrogen enriched gas production. Int. J. Energy Res. 2012, 36, 335–345. [Google Scholar] [CrossRef]
- Salami, N.; Skála, Z. Use of the steam as gasifying agent in fluidized bed gasifier. Chem. Biochem. Eng. Q. J. 2015, 29, 13–18. [Google Scholar] [CrossRef]
- Cheng, G.; Li, Q.; Qi, F.; Xiao, B.; Liu, S.; Hu, Z.; He, P. Allothermal gasification of biomass using micron size biomass as external heat source. Bioresour. Technol. 2012, 107, 471–475. [Google Scholar] [CrossRef] [PubMed]
- Cerone, N.; Zimbardi, F.; Villone, A.; Strjiugas, N.; Kiyikci, E.G. Gasification of wood and torrefied wood with air, oxygen, and steam in a fixed-bed pilot plant. Energy Fuels 2016, 30, 4034–4043. [Google Scholar] [CrossRef]
- Ruoppolo, G.; Miccio, F.; Brachi, P.; Picarelli, A.; Chirone, R. Fluidized bed gasification of biomass and biomass/coal pellets in oxygen and steam atmosphere. Chem. Eng. Trans. 2013, 32, 595–600. [Google Scholar]
Figure 1.
Comparison between experimental data and predicted data for syngas composition.

Figure 2.
Comparisons between experimental data and predicted data for lower heating value (LHV) and gas yield (GY).
Figure 2.
Comparisons between experimental data and predicted data for lower heating value (LHV) and gas yield (GY).
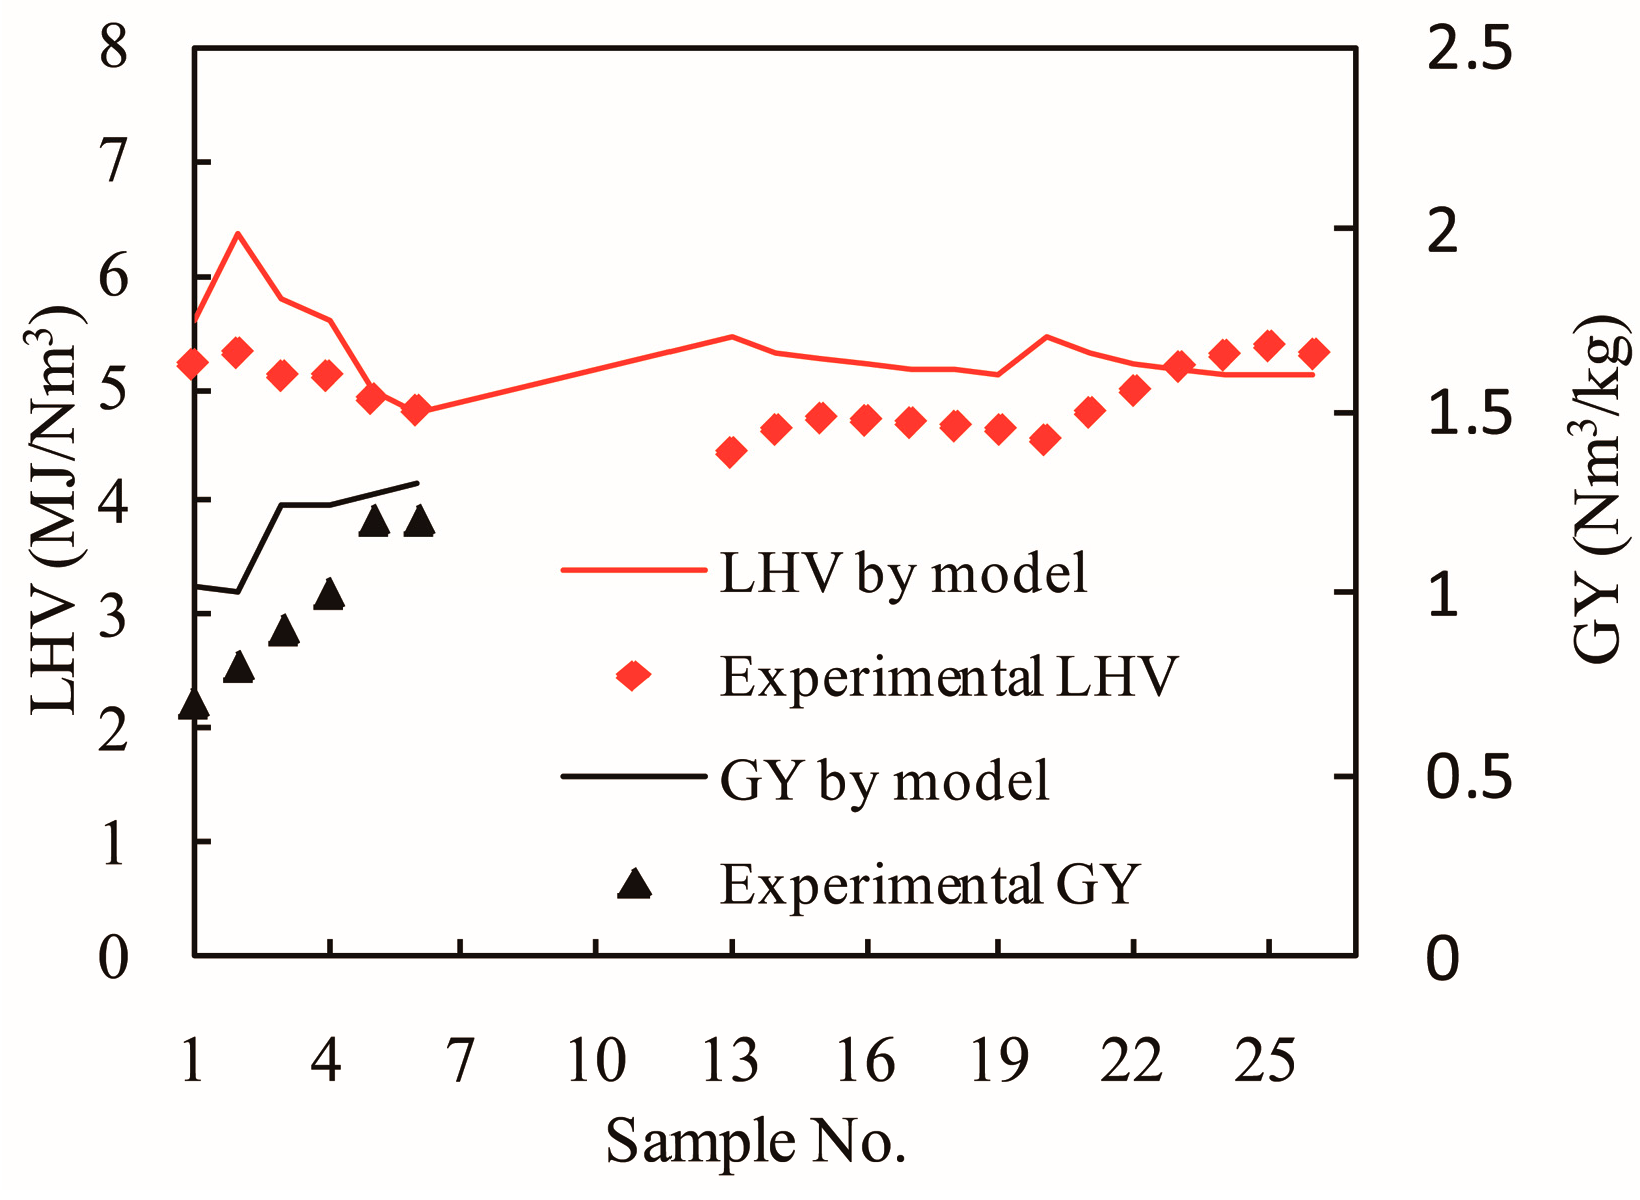
Figure 3.
RMS errors from comparisons between experimental data and predicted results.
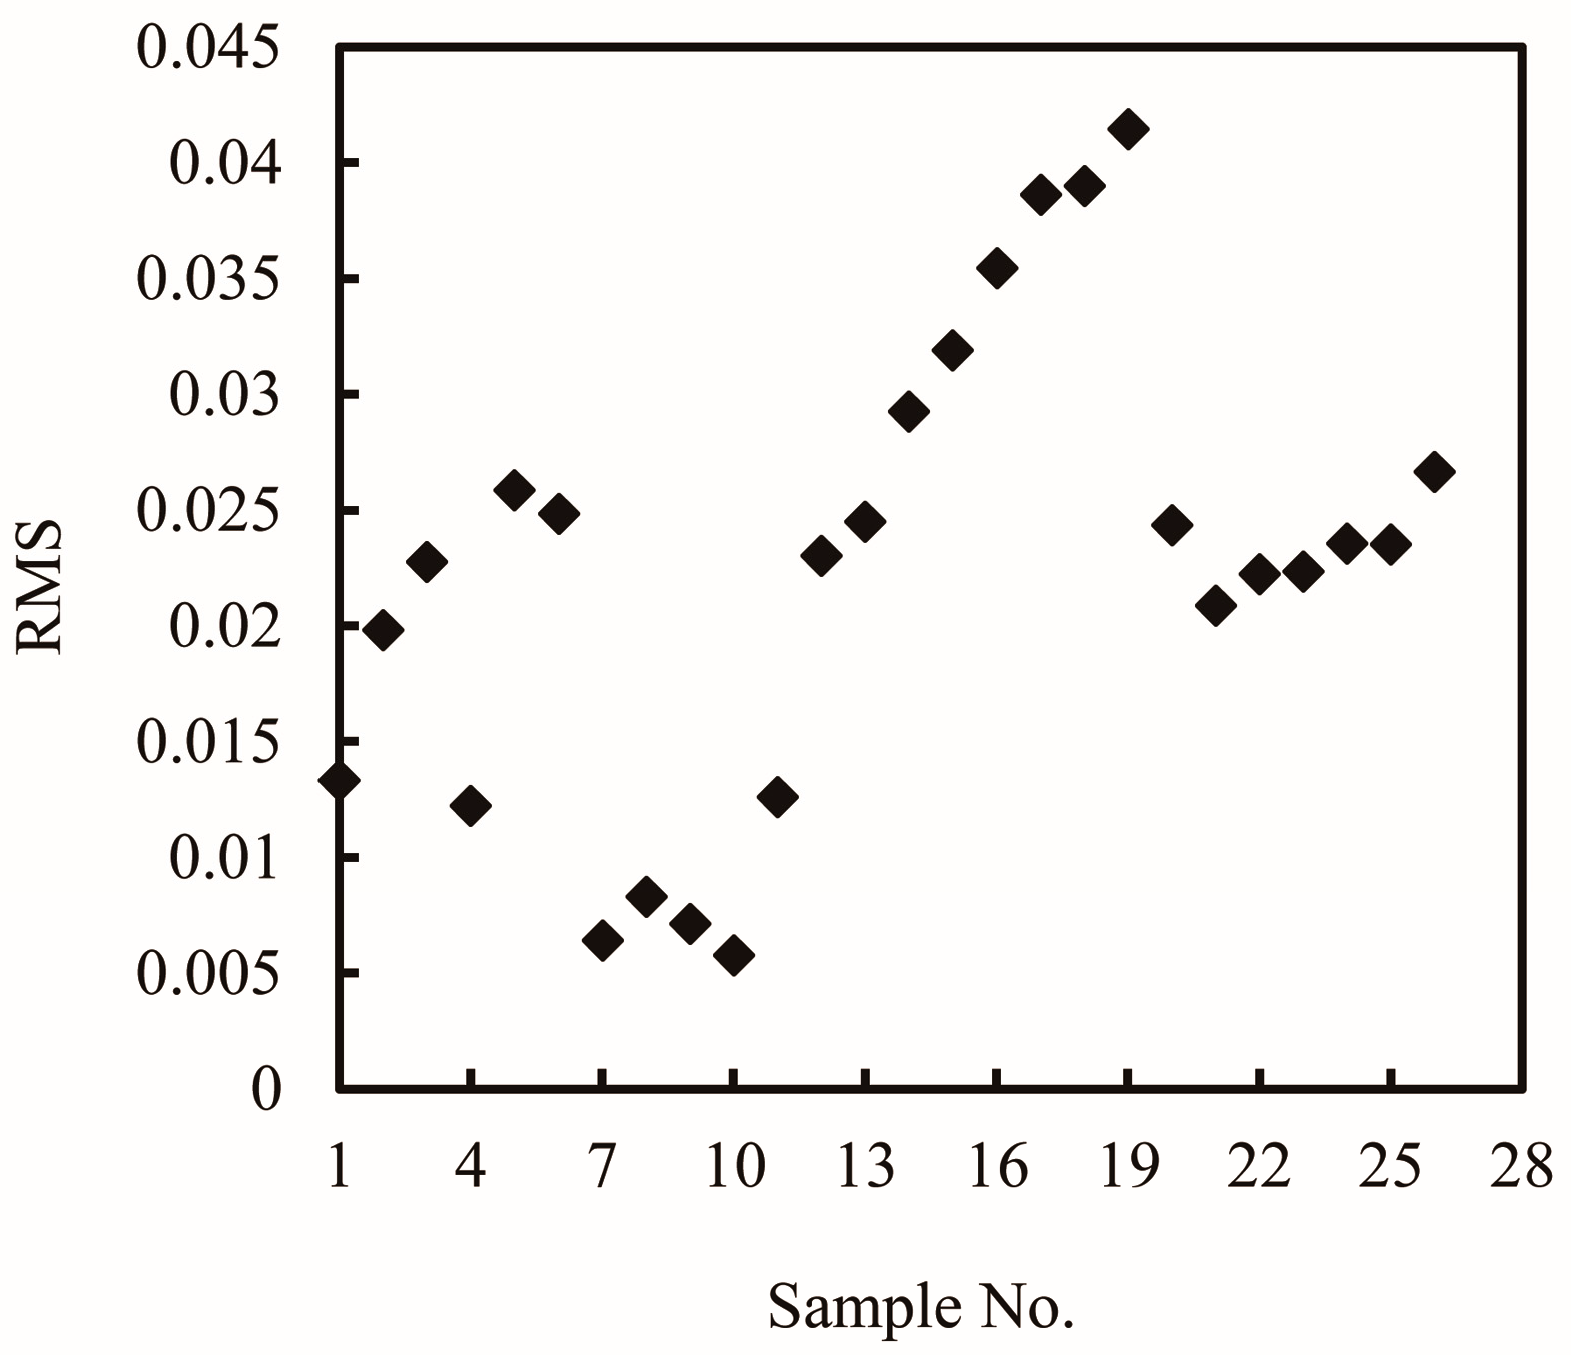
Figure 4.
Comparison between experimental data and predicted date for tar content.
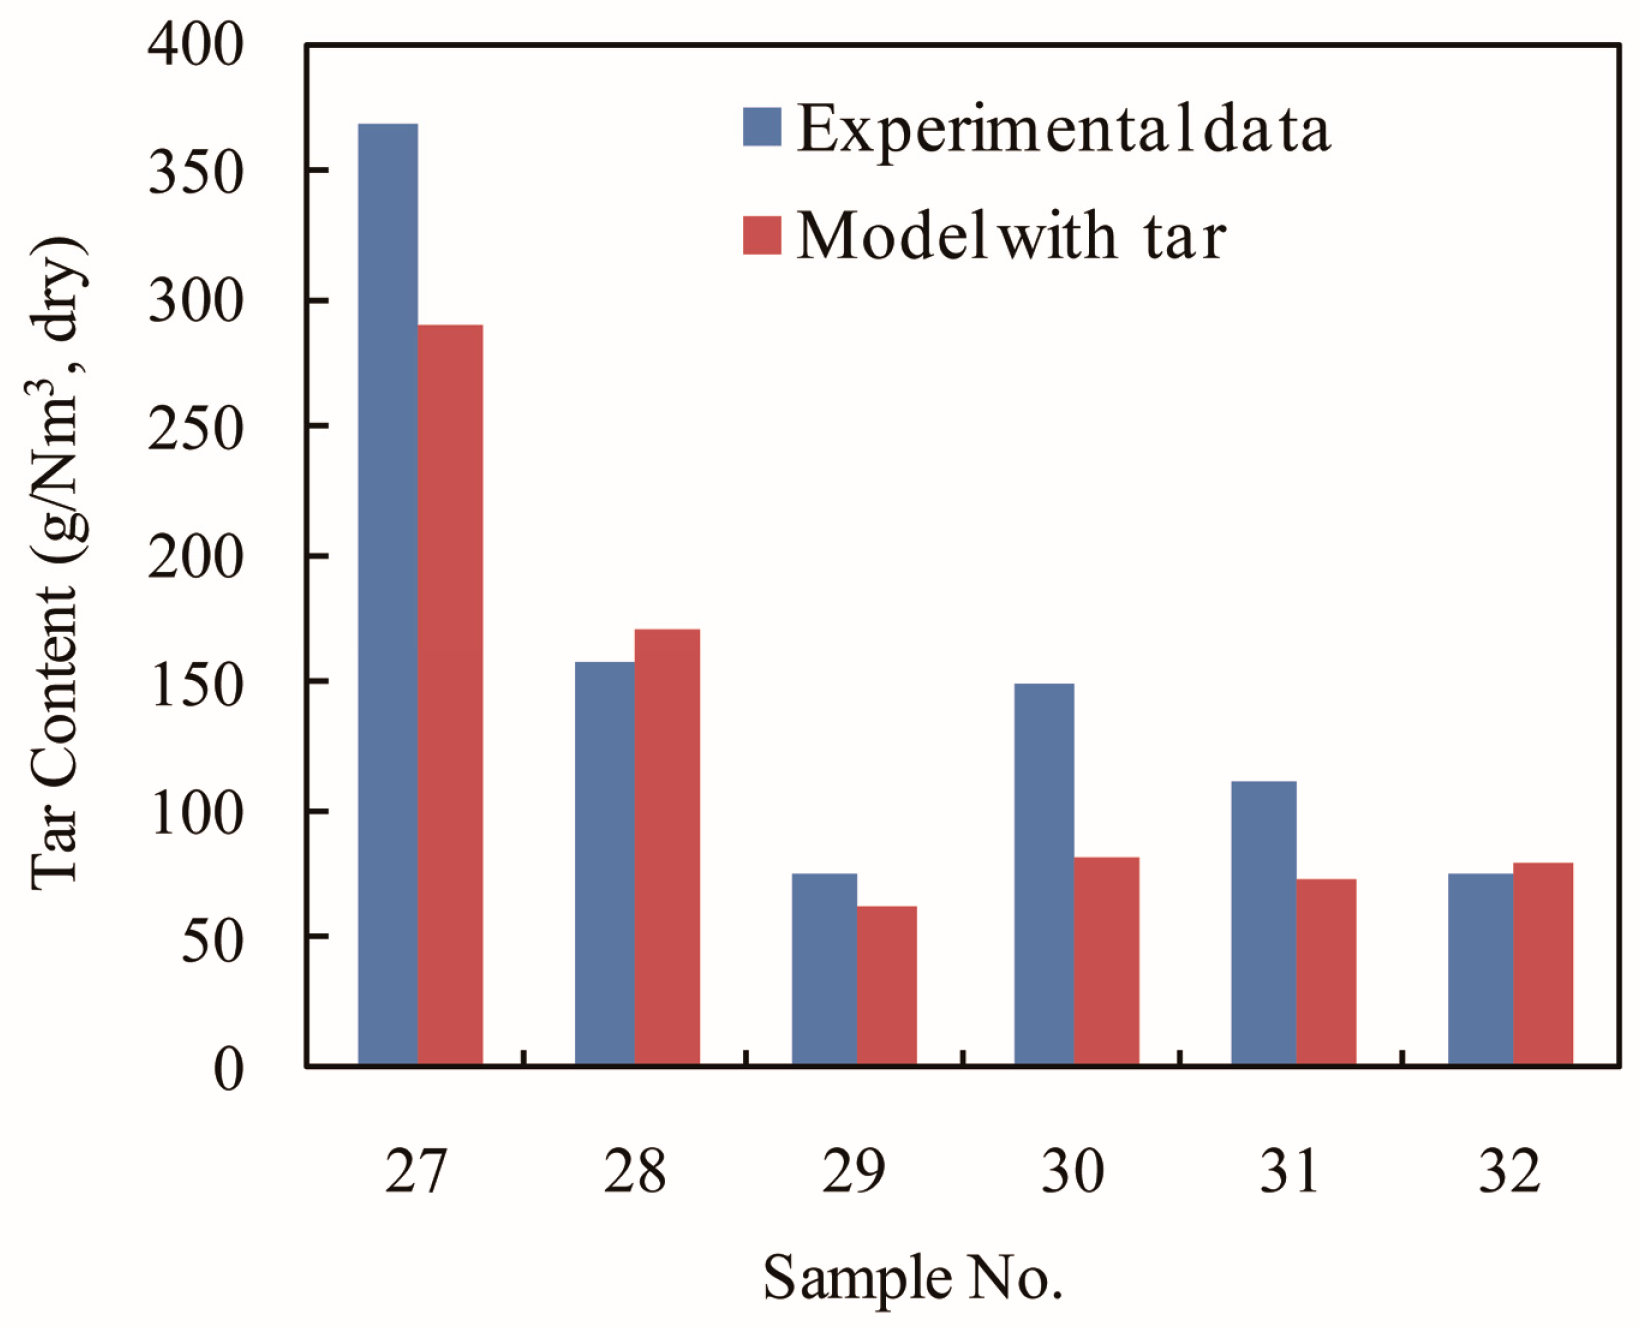
Figure 5.
Comparison between experimental data and predicted data based on different models for GY.

Figure 6.
Comparison between experimental data and predicted data based on different models for syngas composition (E-experimental data, M1-model with tar, M2-model without tar).
Figure 6.
Comparison between experimental data and predicted data based on different models for syngas composition (E-experimental data, M1-model with tar, M2-model without tar).
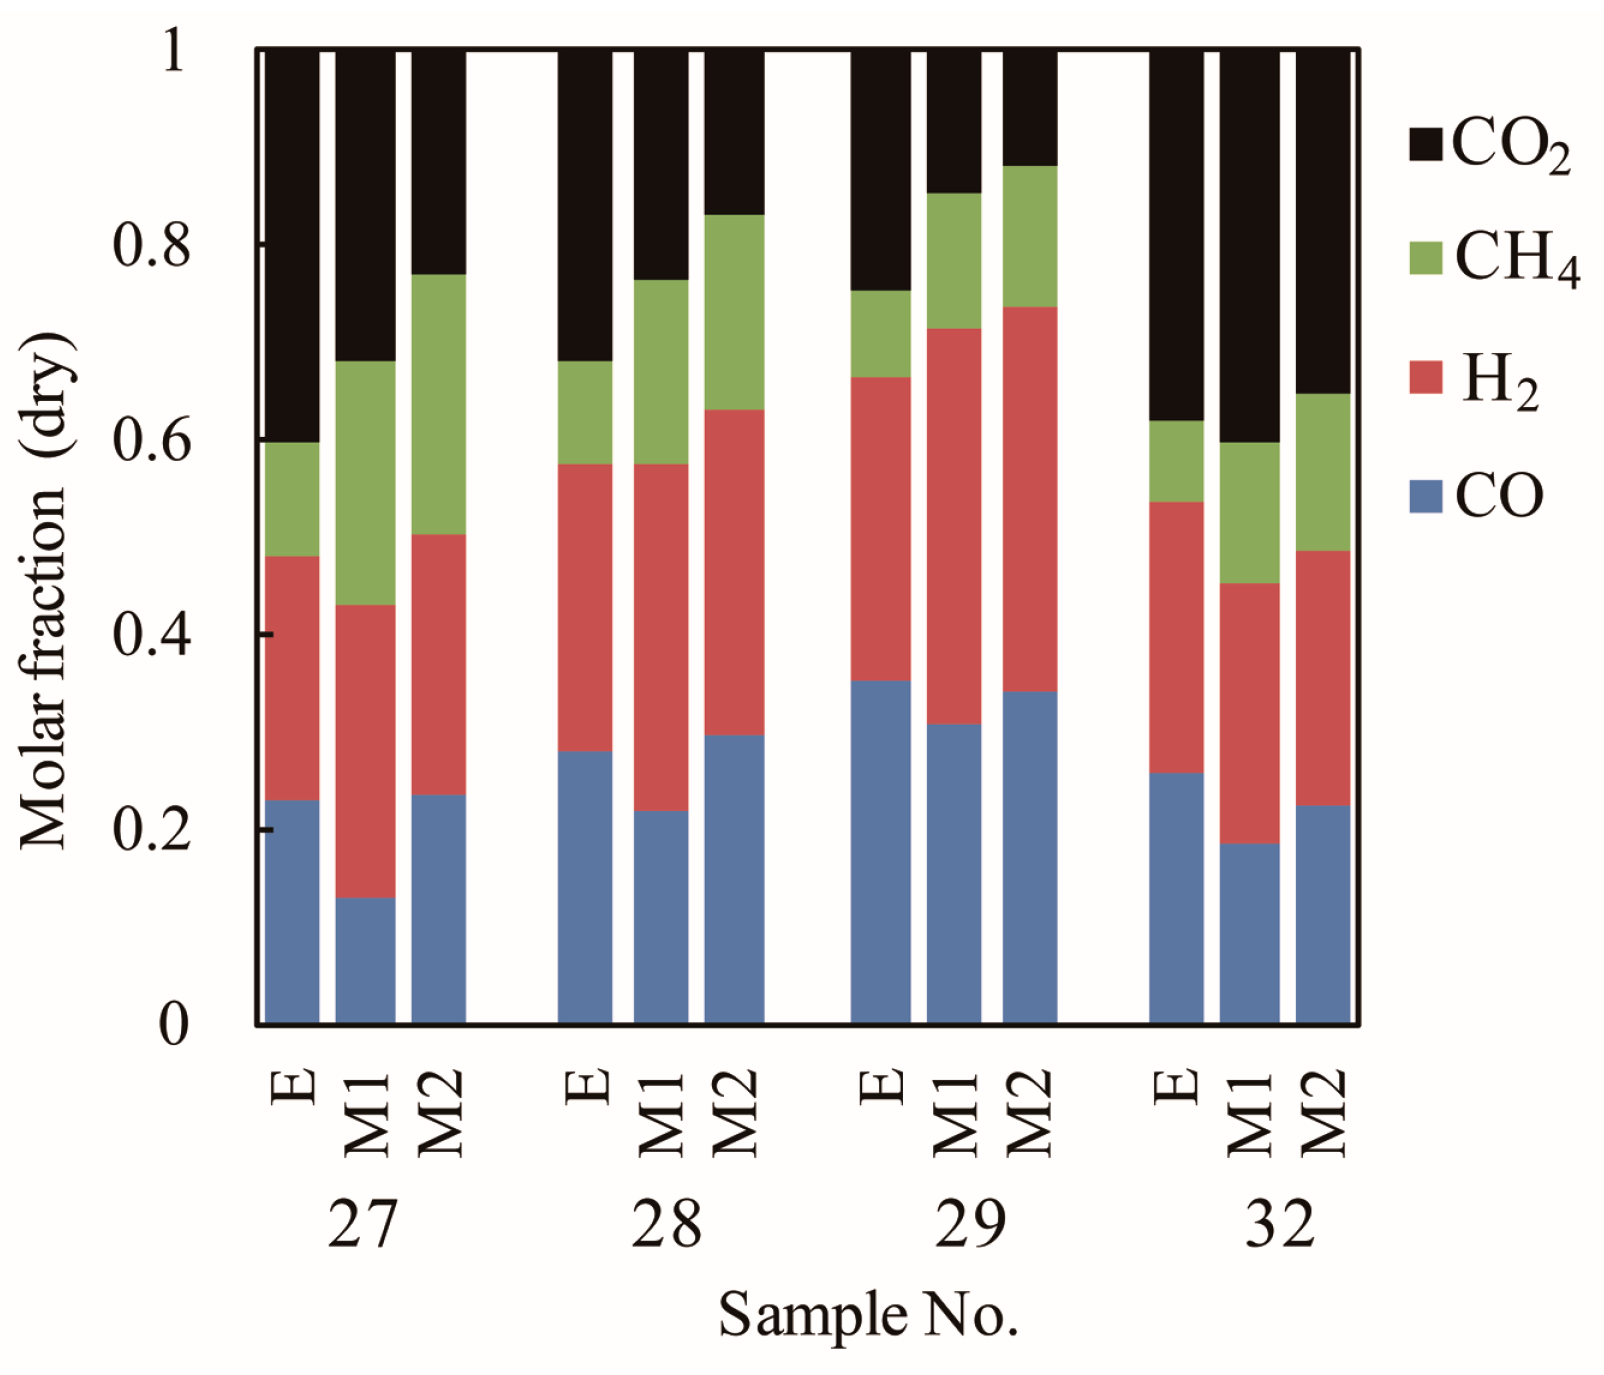
Figure 7.
Effects of gasification temperature on syngas composition and tar content at ER = 0.2 and SBR = 0.3.
Figure 7.
Effects of gasification temperature on syngas composition and tar content at ER = 0.2 and SBR = 0.3.
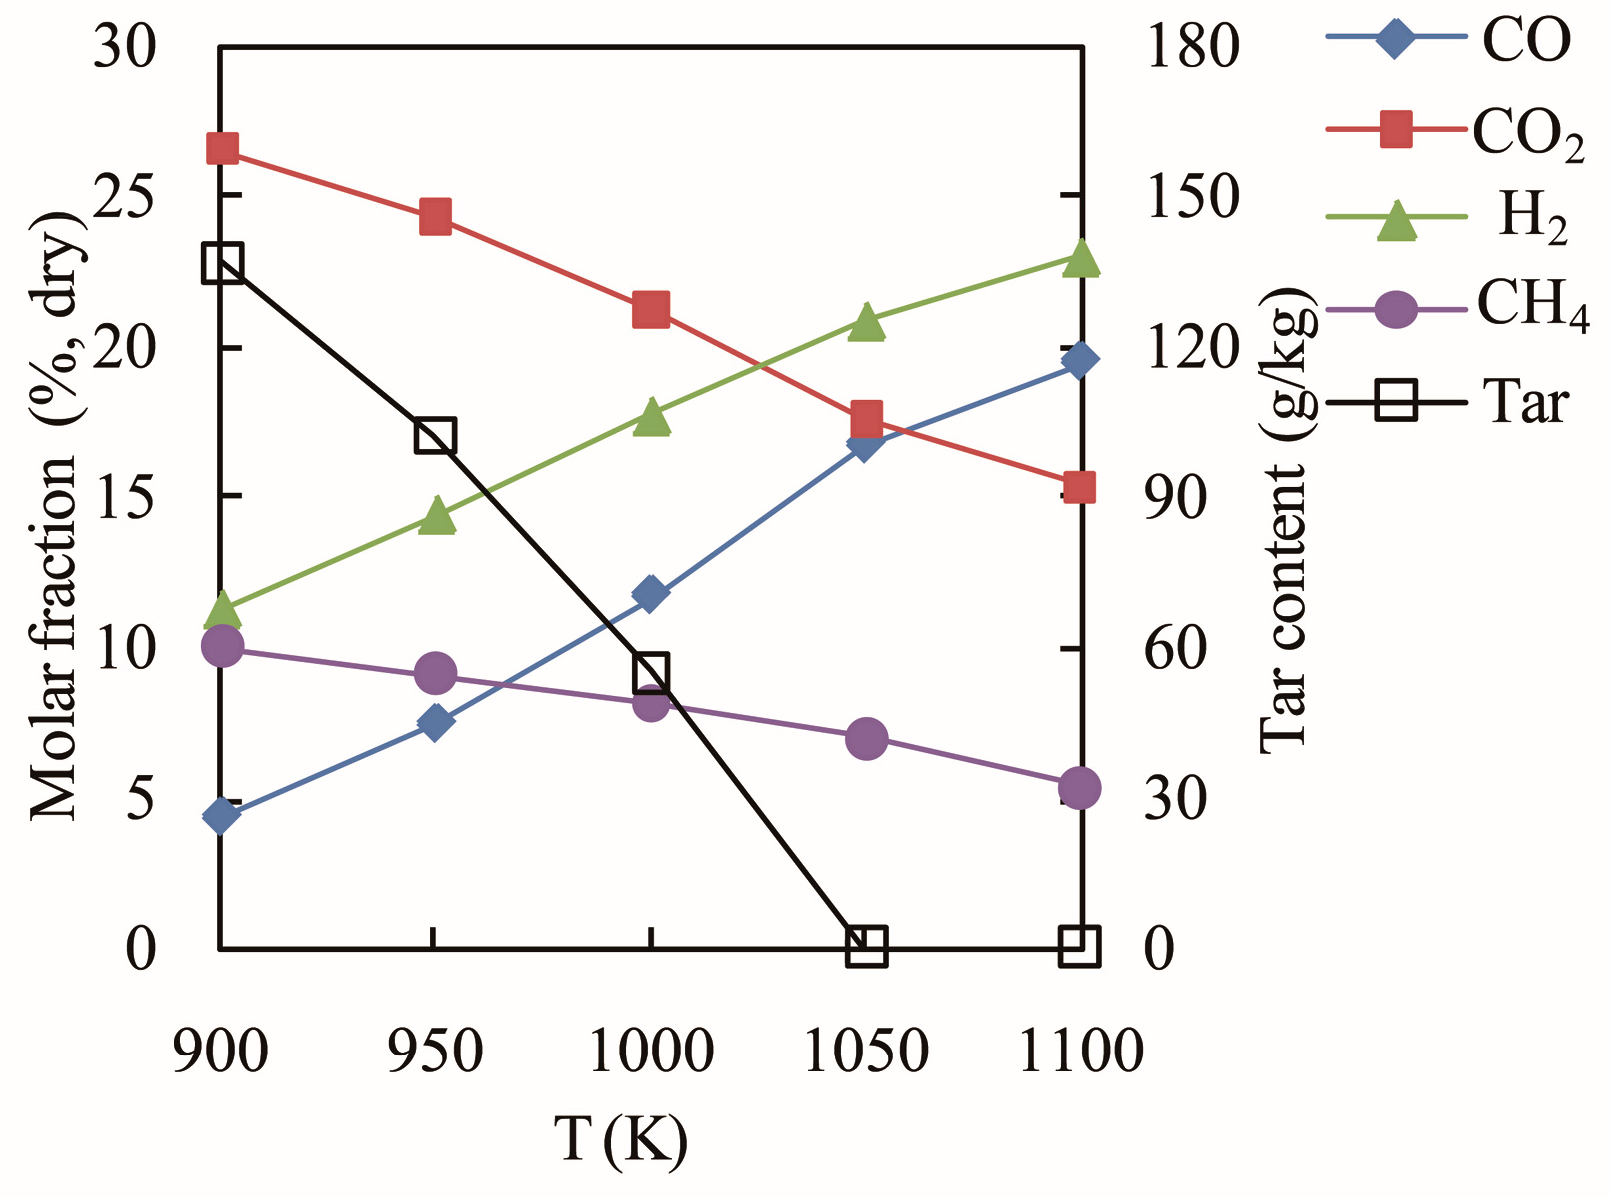
Figure 8.
Effects of gasification temperature on LHV and GY at ER = 0.2 and SBR = 0.3.

Figure 9.
Effect of gasification temperature on syngas composition at ER = 0.4 and SBR = 0.5.
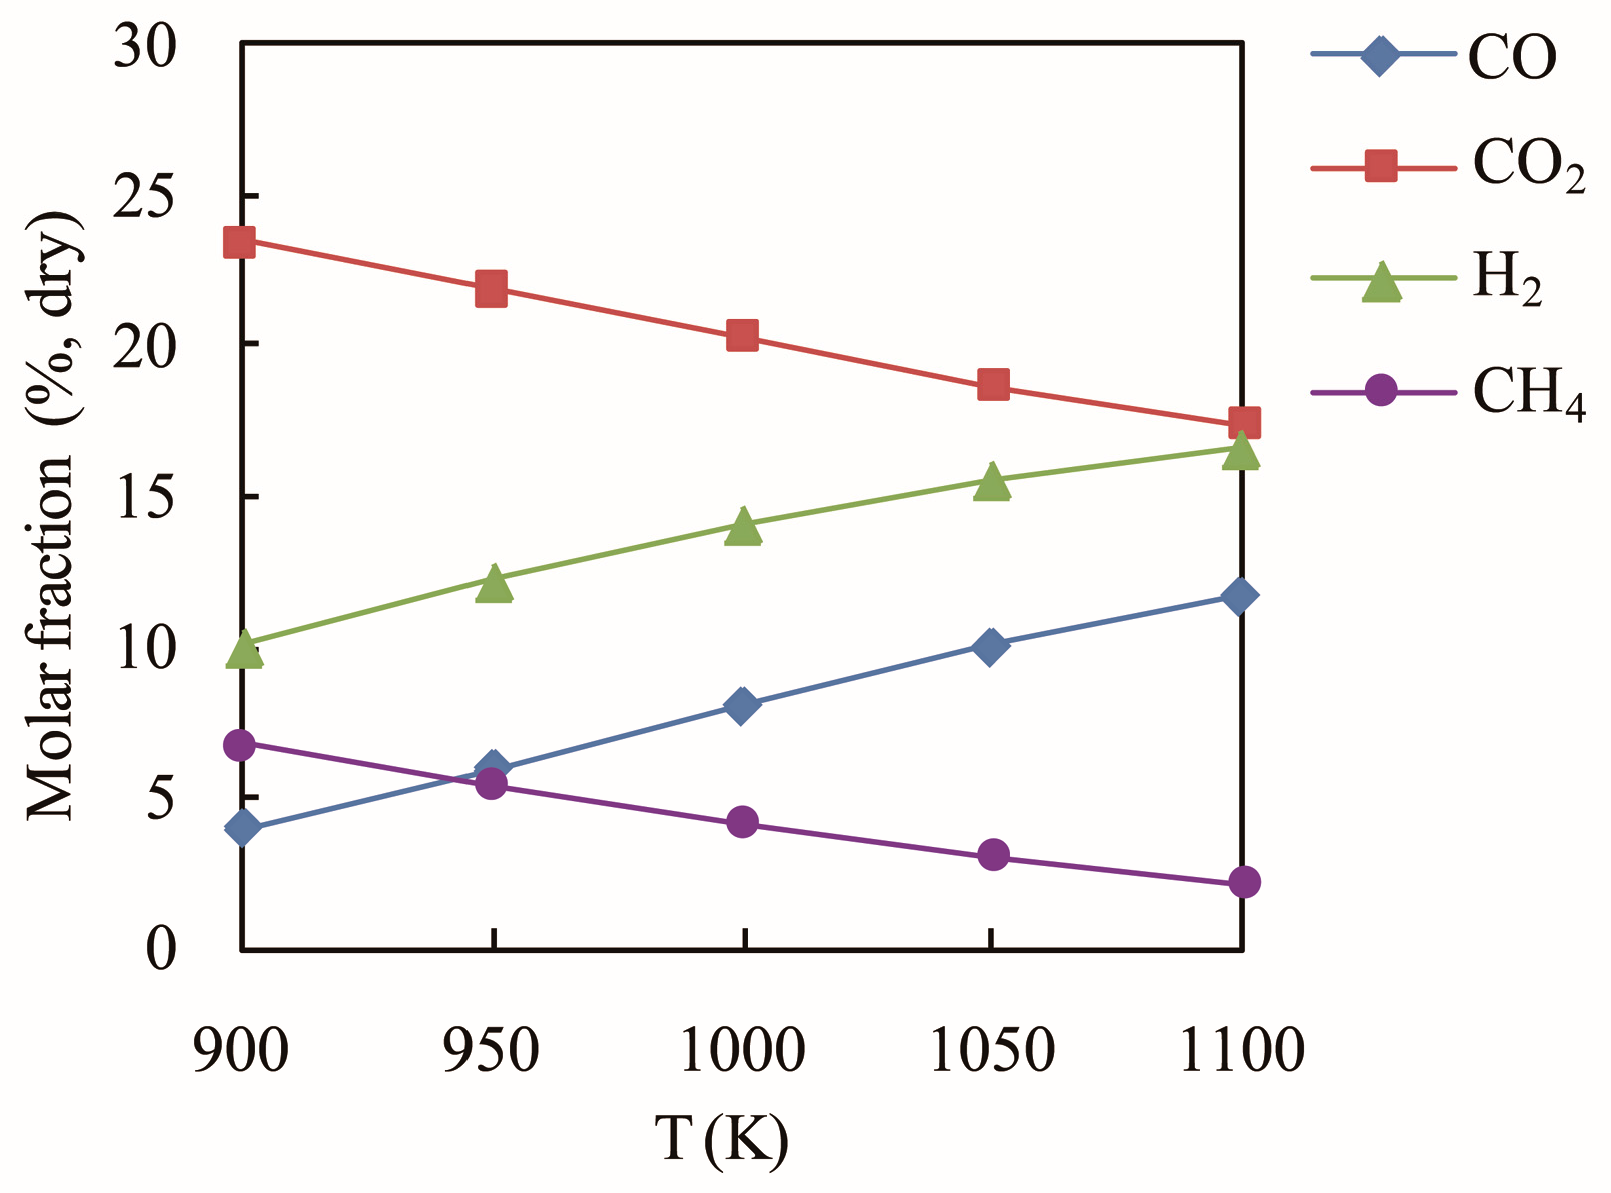
Figure 10.
Effects of gasification temperature on LHV and GY at ER = 0.4 and SBR = 0.5.

Figure 11.
Effects of ER on syngas composition and tar content at T = 950 K and SBR = 0.3.

Figure 12.
Effects of ER on LHV and GY at T = 950 K and SBR = 0.3.

Figure 13.
Effect of ER on syngas composition at T = 1100 K and SBR = 0.5.

Figure 14.
Effects of ER on LHV and GY at T = 1100 K and SBR = 0.5.
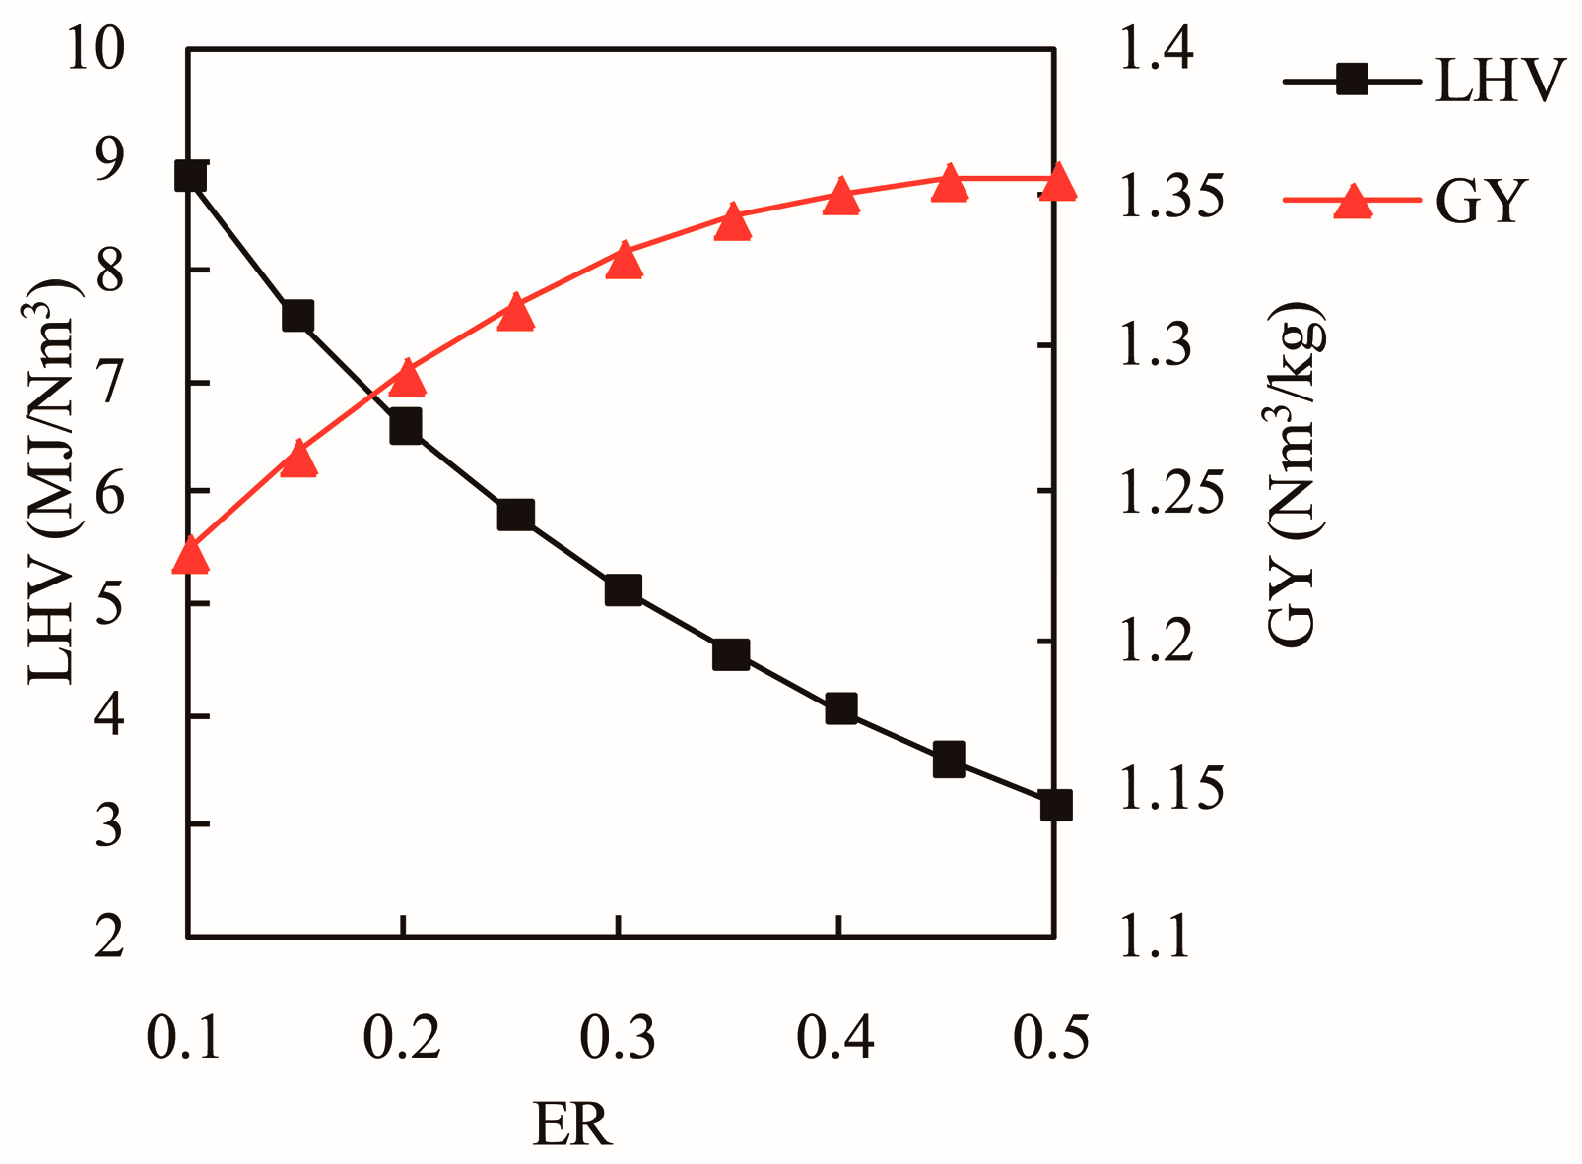
Figure 15.
Effects of SBR on syngas composition and tar content at T = 950 K and ER = 0.3.

Figure 16.
Effects of SBR on LHV and GY at T = 950 K and ER = 0.3.
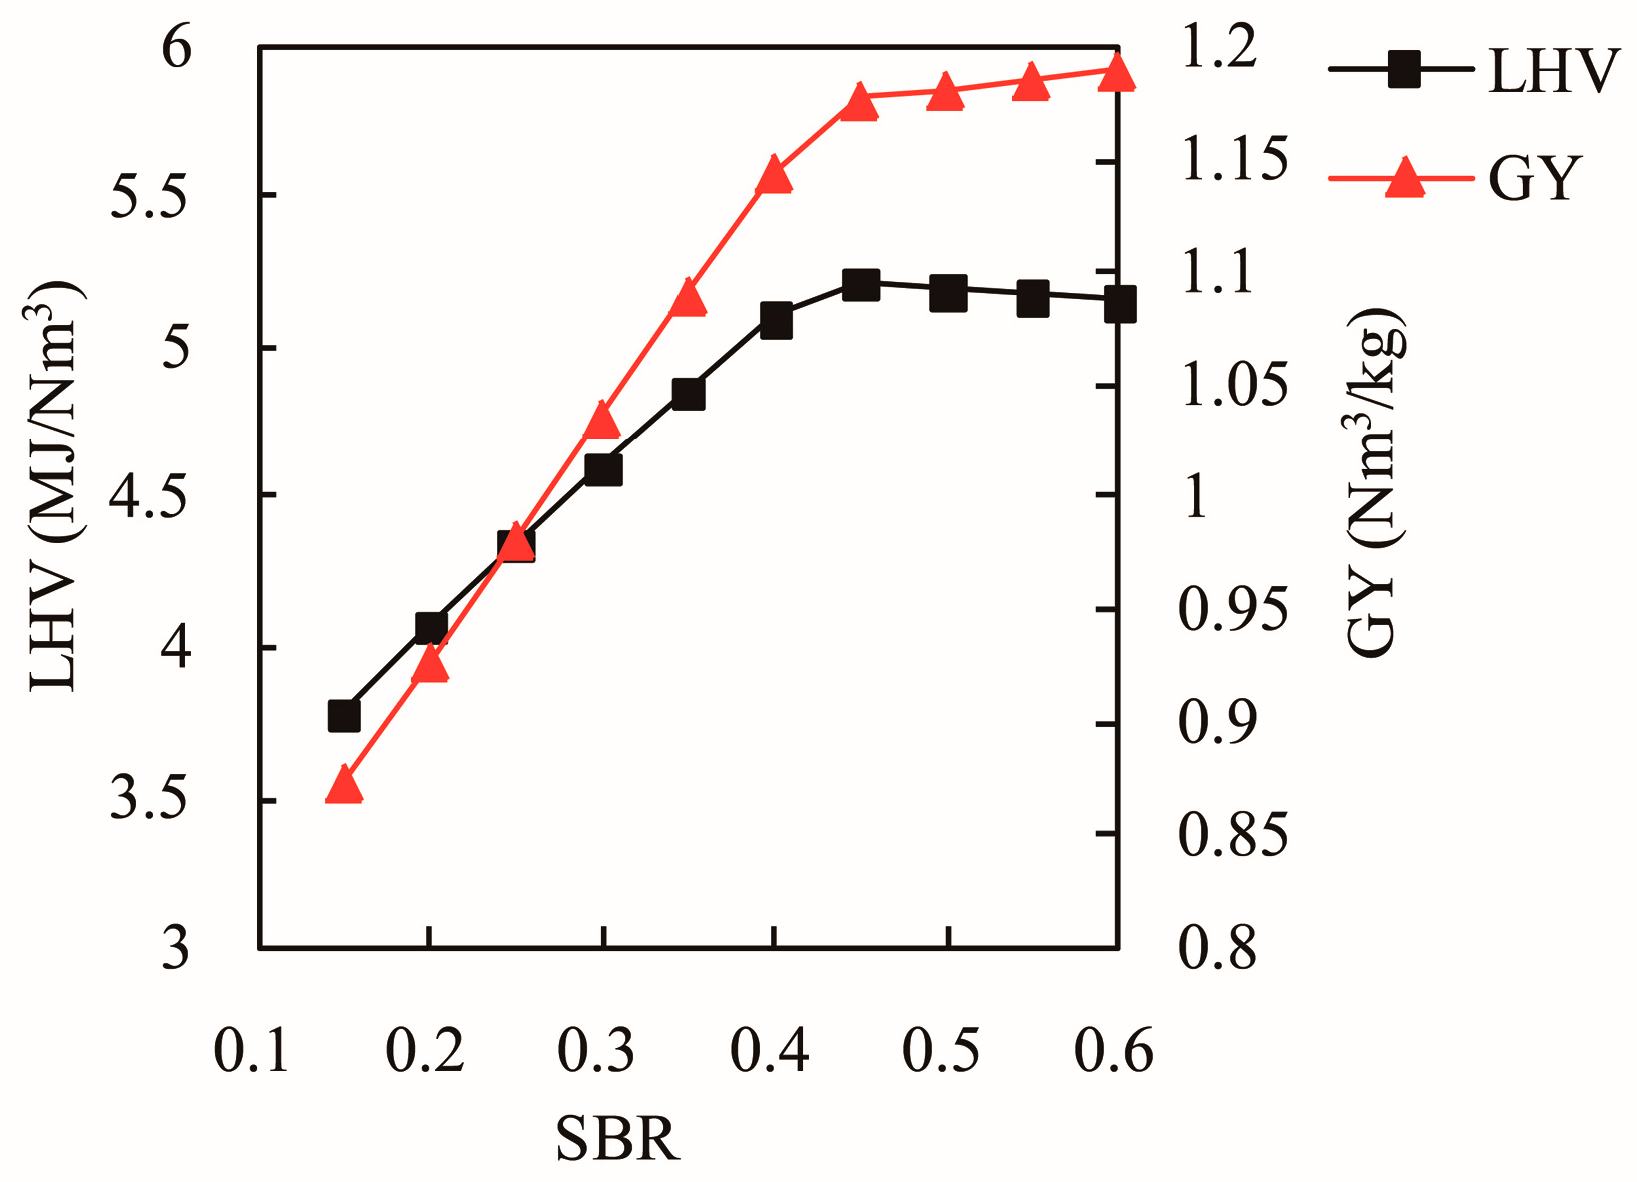
Figure 17.
Effect of SBR on syngas composition at T = 1100 K and ER = 0.2.
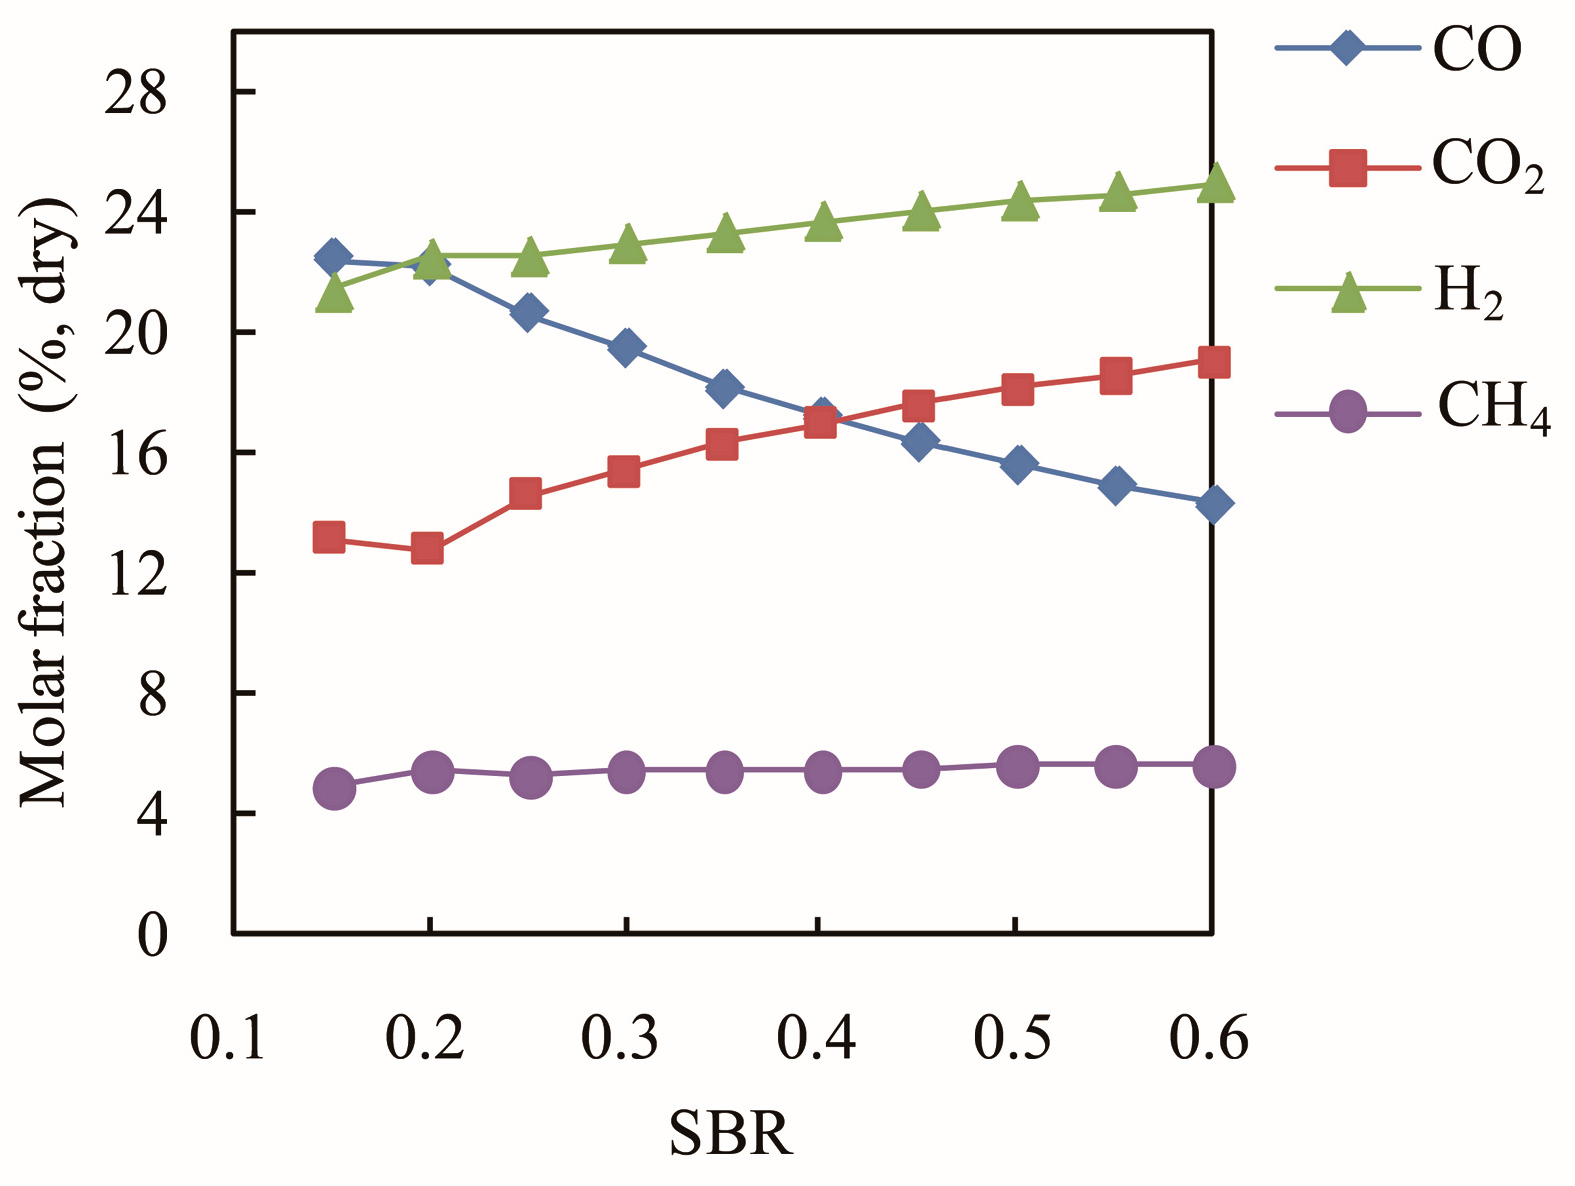
Figure 18.
Effects of SBR on LHV and GY at T = 1100 K and ER = 0.2.
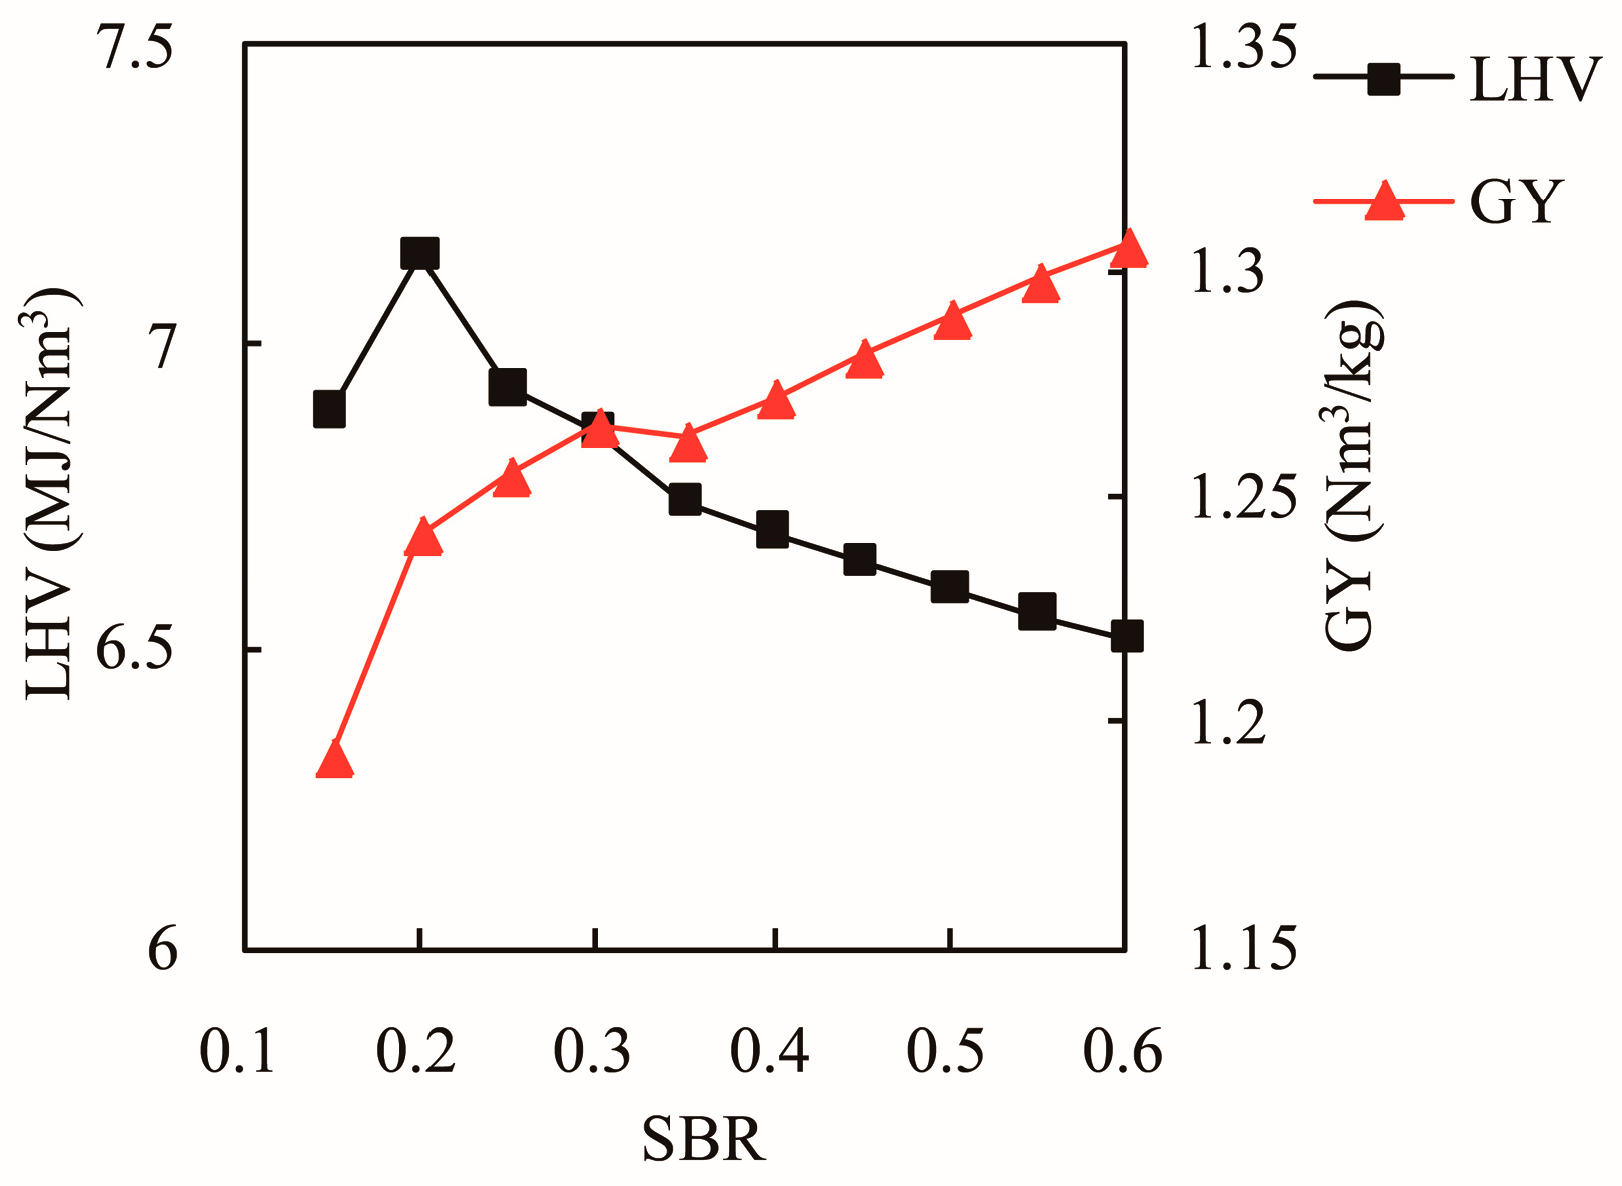
Figure 19.
Dimensionless heat transfer ratio (DHTR) distribution at T = 900 K.

Figure 20.
DHTR distribution at T = 950 K.
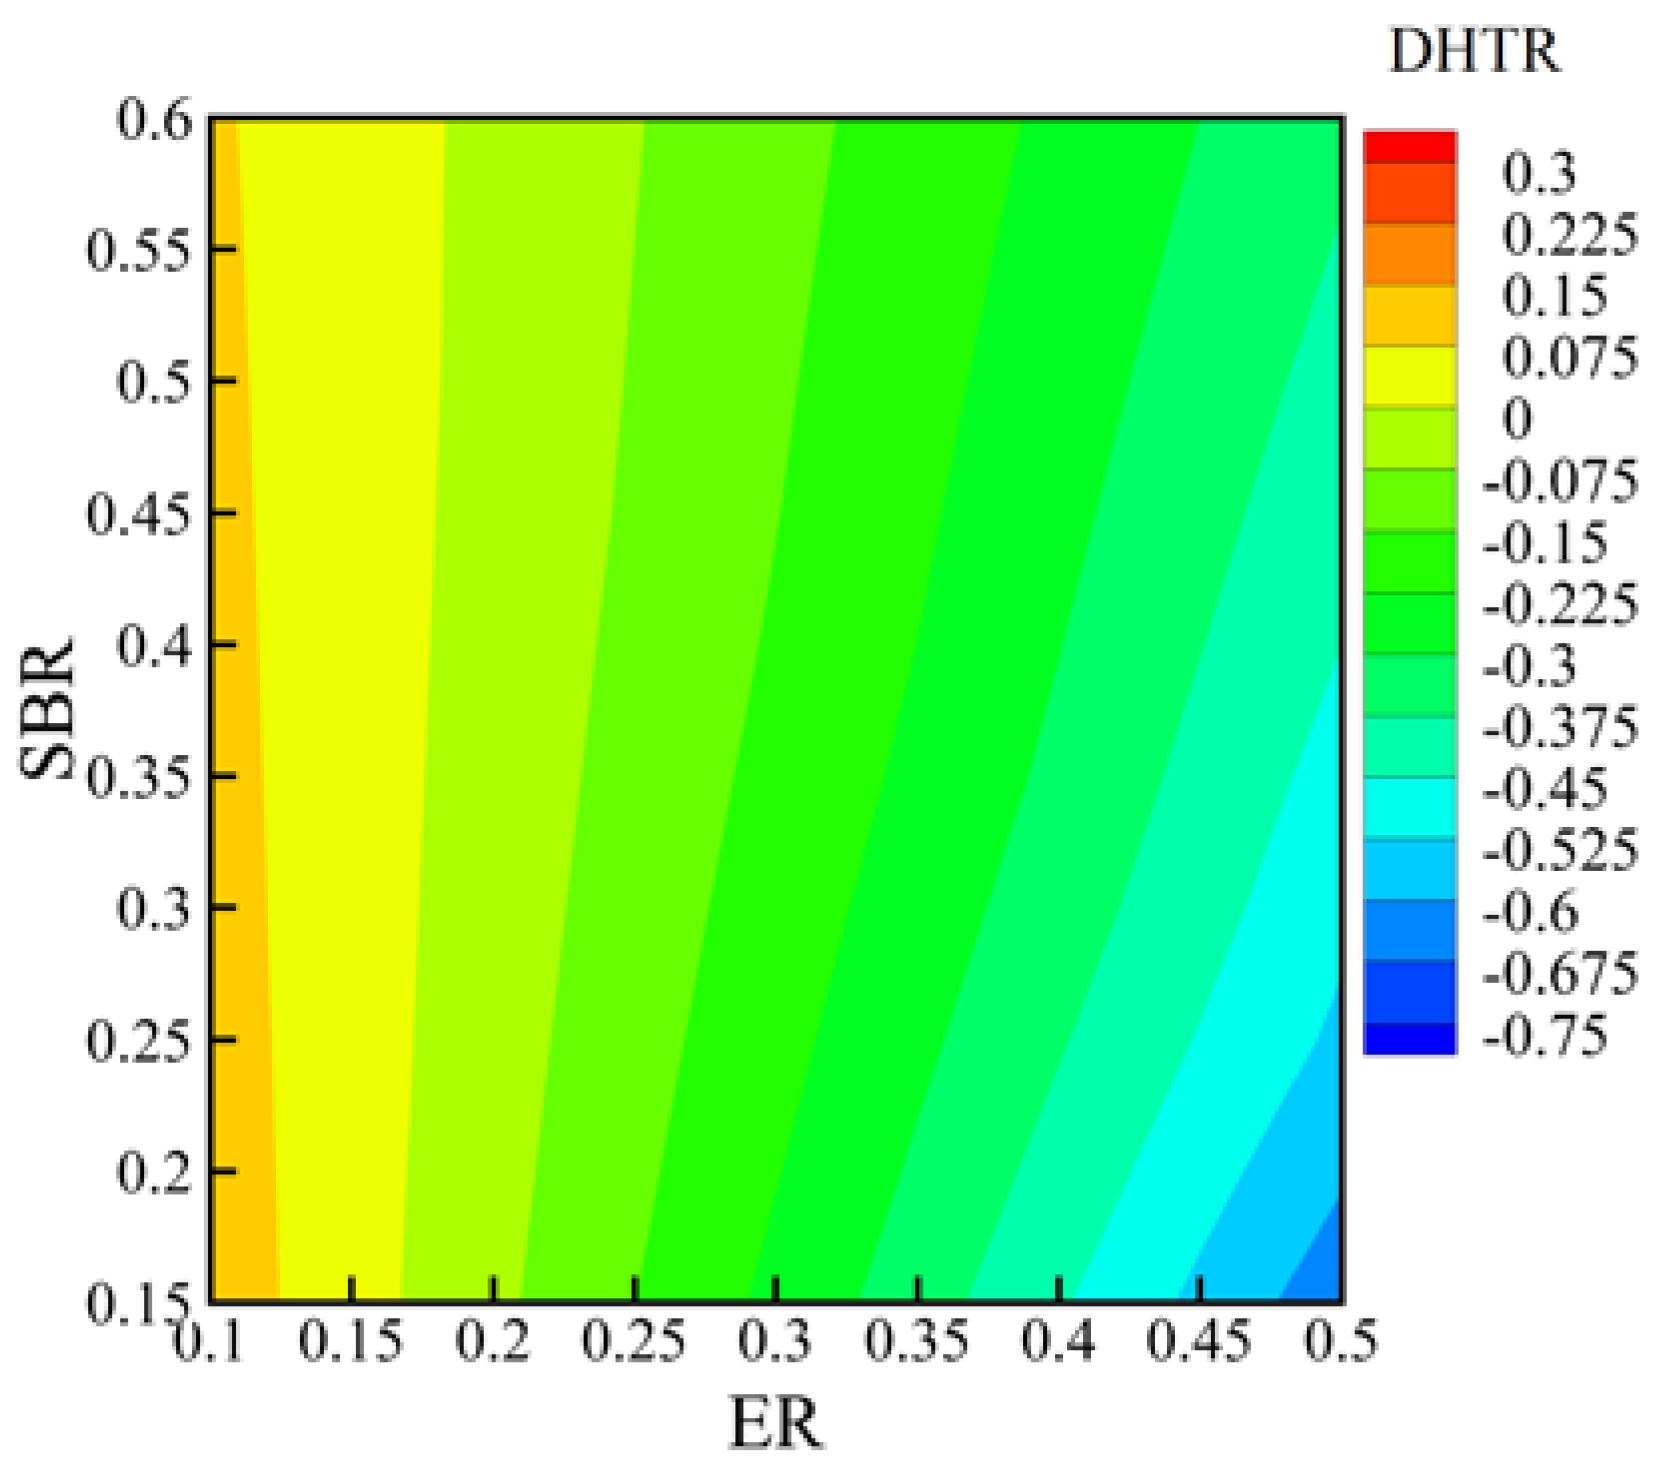
Figure 21.
DHTR distribution at T = 1050 K.

Figure 22.
DHTR distribution at T = 1100 K.

Figure 23.
Exergy efficiency distribution at T = 900 K.

Figure 24.
Exergy efficiency distribution at T = 1000 K.

Figure 25.
Exergy efficiency distribution at T = 1100 K.


Table 1.
Operating conditions for the experimental runs of gasification.
| Expt. Sample No. | Author(s) | Gasification Agent | T (°C) | SBR | ER |
|---|---|---|---|---|---|
| 1 | Campoy et al. [43] | Steam + Air | 752 | 0.18 | 0.23 |
| 2 | Campoy et al. | Steam + Air | 727 | 0.28 | 0.19 |
| 3 | Campoy et al. | Steam + Air | 786 | 0.23 | 0.27 |
| 4 | Campoy et al. | Steam + Air | 755 | 0.43 | 0.27 |
| 5 | Campoy et al. | Steam + Air | 804 | 0.22 | 0.33 |
| 6 | Campoy et al. | Steam + Air | 789 | 0.45 | 0.33 |
| 7 | Jarungthammachote et al. [44] | Steam + Air | 909 | 0.17 | 0.34 |
| 8 | Jarungthammachote et al. | Steam + Air | 903 | 0.21 | 0.34 |
| 9 | Jarungthammachote et al. | Steam + Air | 887 | 0.28 | 0.34 |
| 10 | Jarungthammachote et al. | Steam + Air | 937 | 0.12 | 0.37 |
| 11 | Jarungthammachote et al. | Steam + Air | 911 | 0.26 | 0.37 |
| 12 | Jarungthammachote et al. | Steam + Air | 878 | 0.33 | 0.37 |
| 13 | Salami et al. [45] | Steam + Air | 770 | 0.23 | 0.29 |
| 14 | Salami et al. | Steam + Air | 770 | 0.4 | 0.29 |
| 15 | Salami et al. | Steam + Air | 770 | 0.51 | 0.29 |
| 16 | Salami et al. | Steam + Air | 770 | 0.6 | 0.29 |
| 17 | Salami et al. | Steam + Air | 770 | 0.67 | 0.29 |
| 18 | Salami et al. | Steam + Air | 770 | 0.7 | 0.29 |
| 19 | Salami et al. | Steam + Air | 770 | 0.75 | 0.29 |
| 20 | Salami et al. | Steam + Air | 861 | 0.23 | 0.29 |
| 21 | Salami et al. | Steam + Air | 861 | 0.4 | 0.29 |
| 22 | Salami et al. | Steam + Air | 861 | 0.51 | 0.29 |
| 23 | Salami et al. | Steam + Air | 861 | 0.6 | 0.29 |
| 24 | Salami et al. | Steam + Air | 861 | 0.67 | 0.29 |
| 25 | Salami et al. | Steam + Air | 861 | 0.7 | 0.29 |
| 26 | Salami et al. | Steam + Air | 861 | 0.75 | 0.29 |
| 27 | Cheng et al. [46] | Steam | 714 | 0.15 | 0 |
| 28 | Cheng et al. | Steam | 788 | 0.15 | 0 |
| 29 | Cheng et al. | Steam | 863 | 0.15 | 0 |
| 30 | Cerone et al. [47] | Steam + Air | 702 | 0.233 | 0.19 |
| 31 | Cerone et al. | Steam + Oxygen | 742 | 0.3 | 0.18 |
| 32 | Ruoppolo et al. [48] | Steam + Oxygen + Nitrogen 1 | 732 | 0.23 | 0.22 |
1 The proportion of nitrogen is not presented in the experiment, so nitrogen is not considered for simulation.
© 2017 by the authors. Licensee MDPI, Basel, Switzerland. This article is an open access article distributed under the terms and conditions of the Creative Commons Attribution (CC BY) license (http://creativecommons.org/licenses/by/4.0/).
Share and Cite
MDPI and ACS Style
Eri, Q.; Wu, W.; Zhao, X. Numerical Investigation of the Air-Steam Biomass Gasification Process Based on Thermodynamic Equilibrium Model. Energies 2017, 10, 2163. https://doi.org/10.3390/en10122163
AMA Style
Eri Q, Wu W, Zhao X. Numerical Investigation of the Air-Steam Biomass Gasification Process Based on Thermodynamic Equilibrium Model. Energies. 2017; 10(12):2163. https://doi.org/10.3390/en10122163
Chicago/Turabian StyleEri, Qitai, Wenzhen Wu, and Xinjun Zhao. 2017. "Numerical Investigation of the Air-Steam Biomass Gasification Process Based on Thermodynamic Equilibrium Model" Energies 10, no. 12: 2163. https://doi.org/10.3390/en10122163
Note that from the first issue of 2016, this journal uses article numbers instead of page numbers. See further details here.