3.1. Solar and Wind Energy Potential in Urban Area
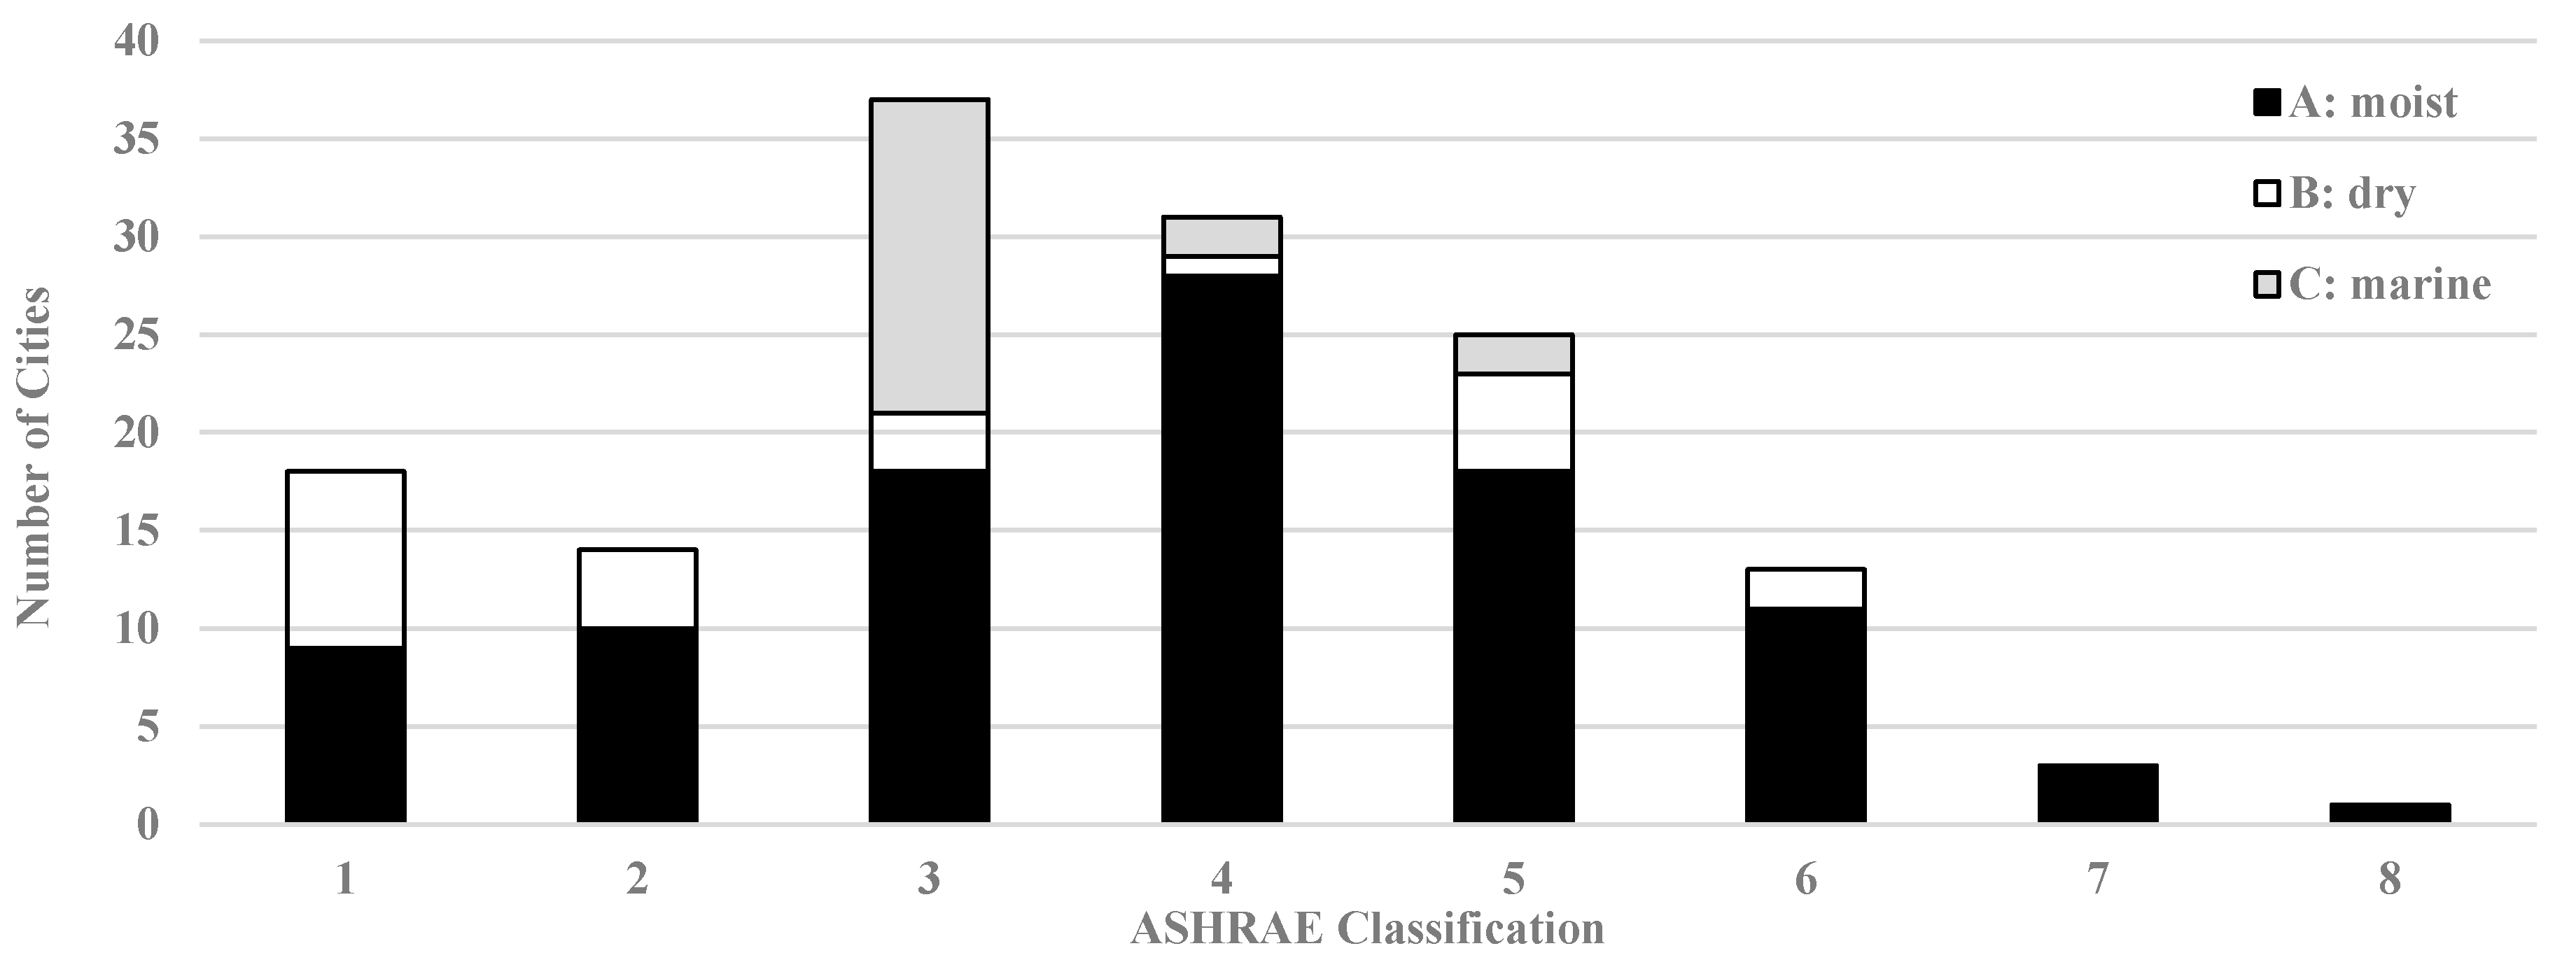
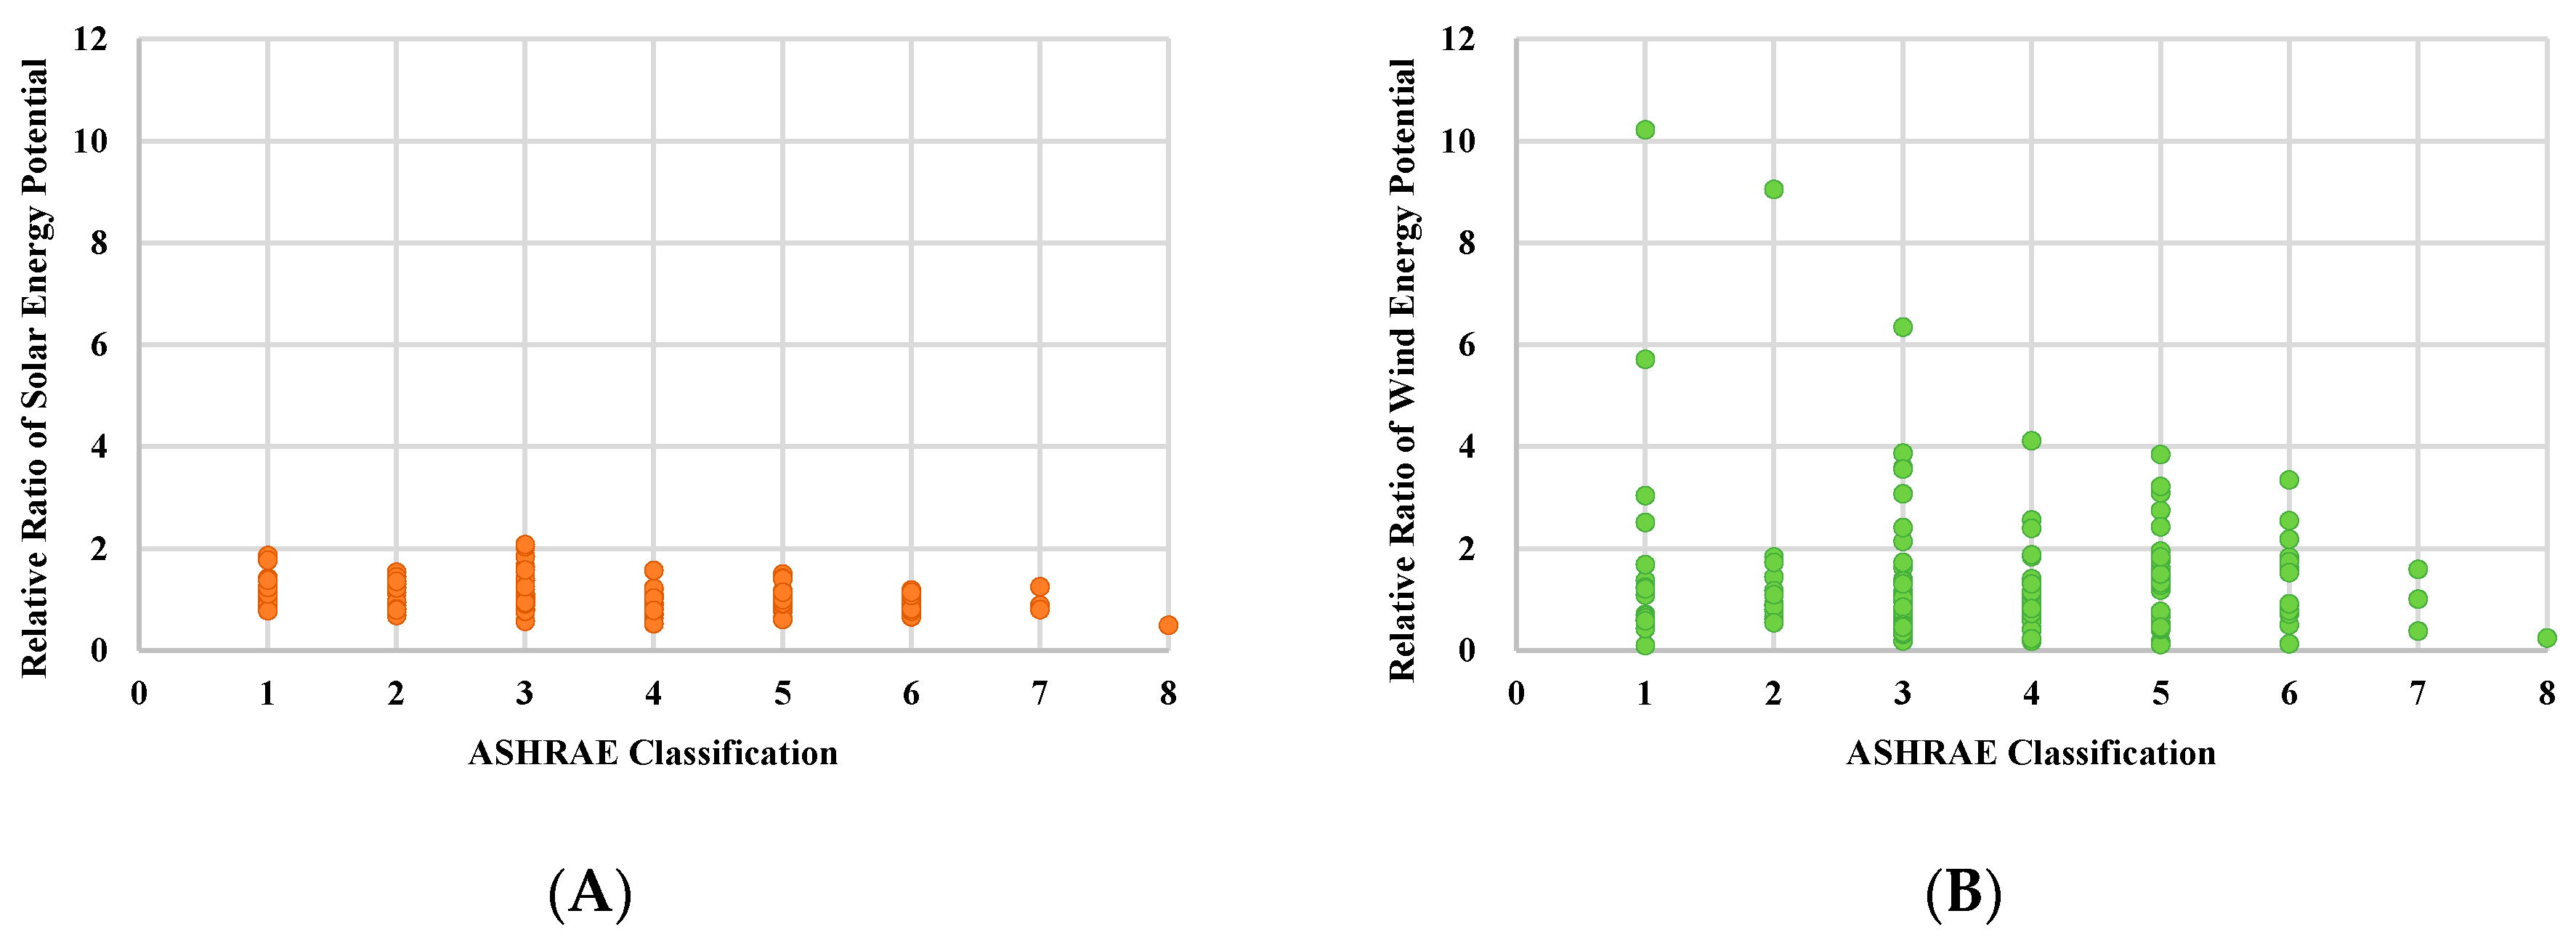
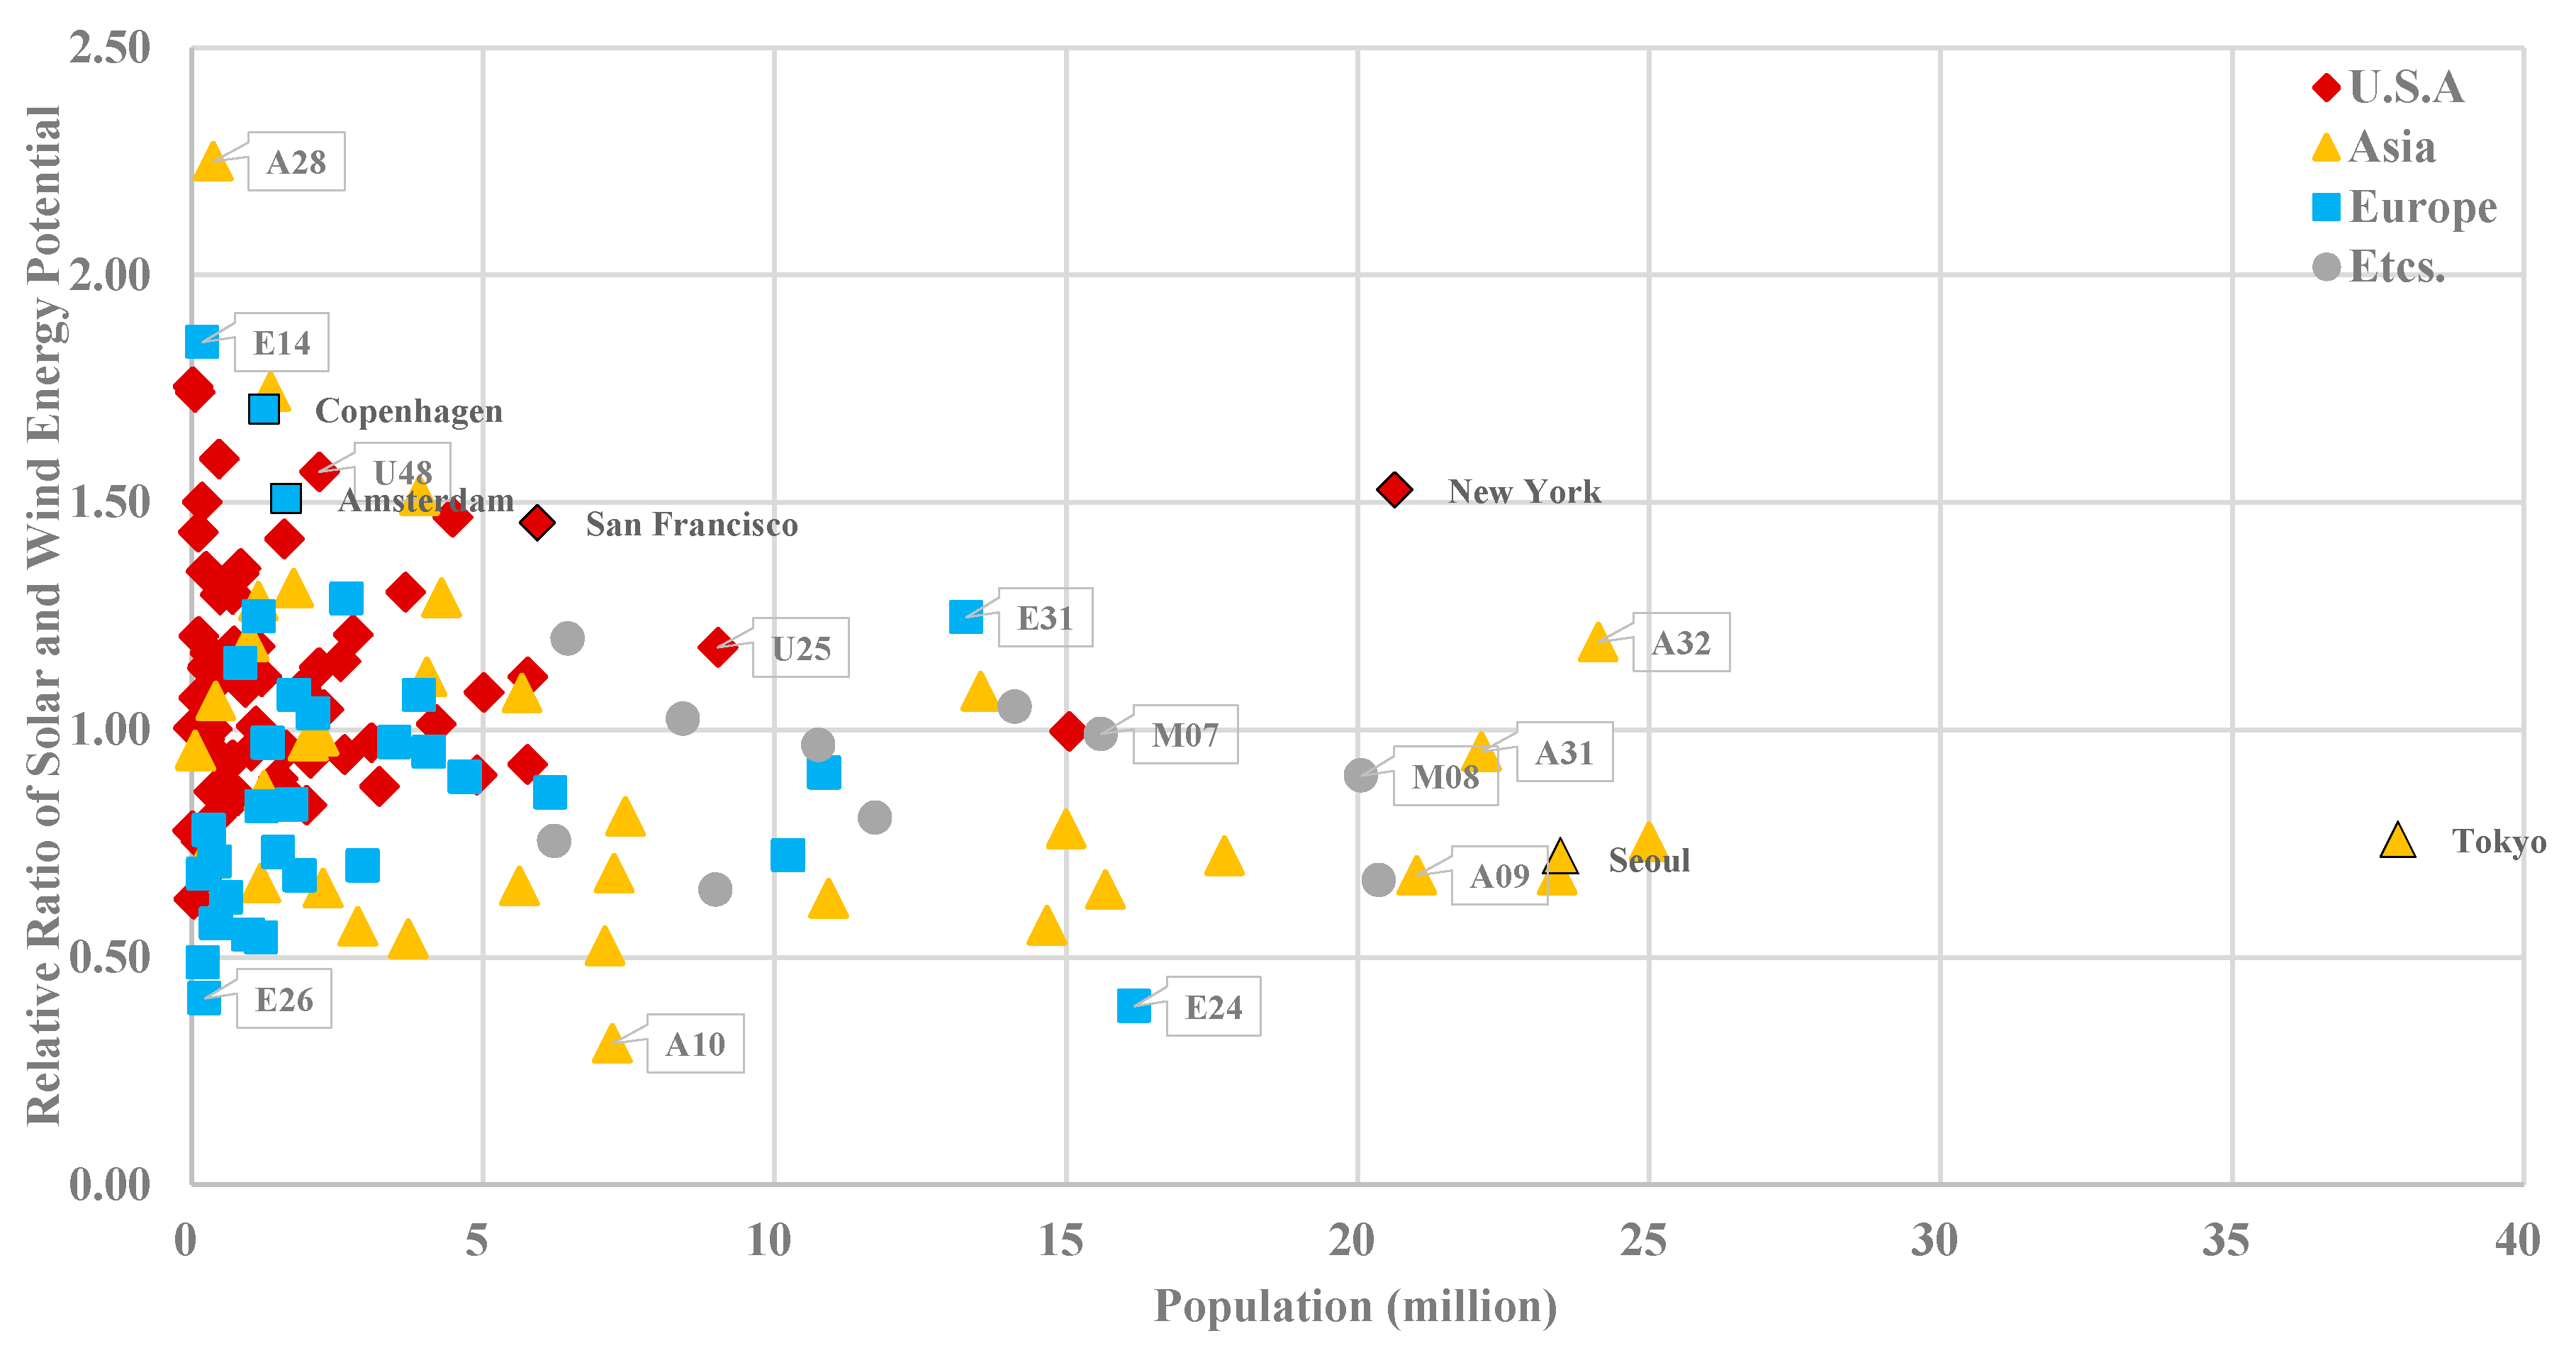
The solar and wind energy generation potential based on the solar irradiation and wind speed and direction were analyzed. A unit, relative ratio (average value: 1.00), was used to compare the renewable energy potential. The climate data of 142 cities were considered to represent the energy generation in a typical major city. For example, the average value was calculated based on the data from 142 targeted cities among a total 1042 locations, which is provided in the weather data set. A relative ratio of 1 means that the city has an average value of the 142 cities. Therefore, the average level of solar irradiation and wind speed in each city was selected as 1. If the value is greater than 1, there is a high potential for energy generation. Conversely, if the value is less than 1, there is a low potential of energy generation. Initially, the solar and wind energy potentials were compared by the ASHRAE international climate classification to determine the regional similarity and difference in each energy potential. As shown in
Figure 4, the solar energy potential showed some analogy in the same climate classification compared to the wind case. These results can be explained by the characteristics of the ASHRAE standard, which originate from the division of the thermal and humidity criteria [
44]. In the wind energy cases, however, the variation is dispersed irregularly in a similar climate or adjacent cities.
Based on the energy potential data set,
Table 4 and
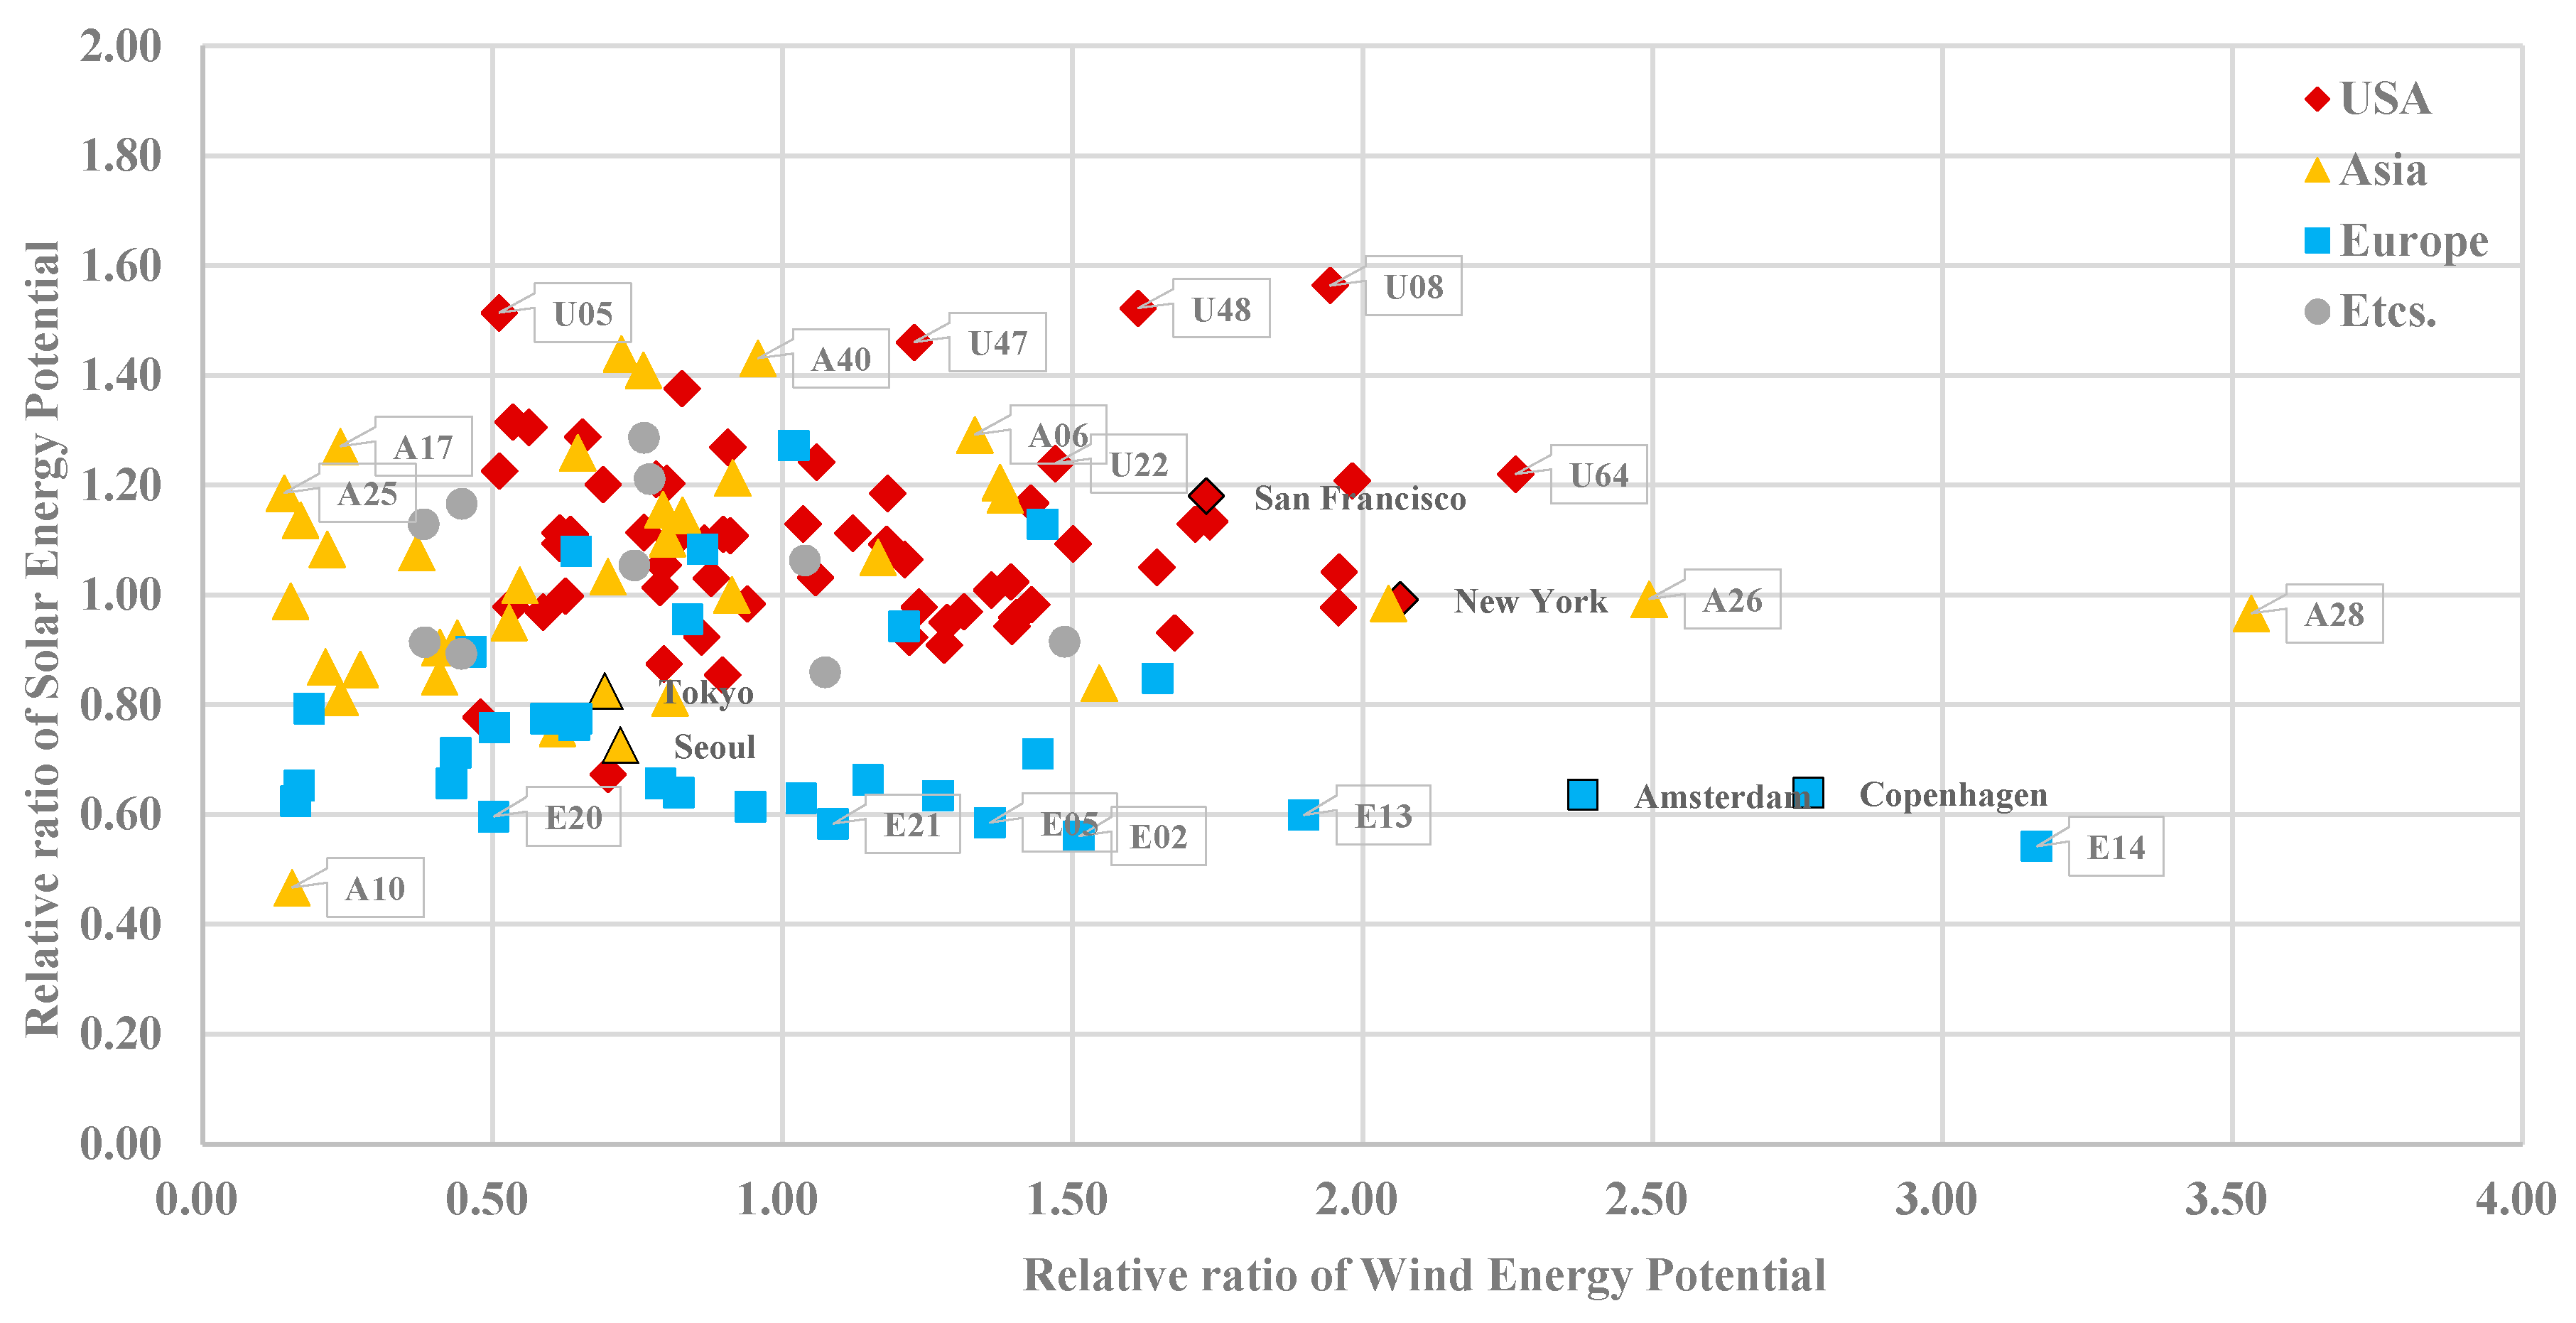
Figure 5 and
Figure 6 provide a statistical summary and a diagram of the distribution of the solar and wind energy potential, respectively. In addition, the basic abbreviated terms are the maximum value (Max), minimum value (Min), average value (AVG), and standard deviation (S.D.). In the case of Wellington, New Zealand, its energy potential has a maximum value (total: 2.25, solar: 0.97, and wind: 3.53), which has common characteristics in a wind dominated region (average wind energy potential in Australia is 1.15 and New Zealand is 2.31). On the other hand, in the case of Chongqing located in China, its potential has a minimum value (total: 0.31, solar: 0.47, and wind: 0.15), which can explain the regional features of a basin.
In terms of data analysis based on the solar irradiation and wind speed, cities in the U.S. have a relatively high average (AVG) value than other regions. AVG in U.S. is 1.11, which has a high solar and wind energy potential; cities in Asia and Europe have an AVG value of 0.92 and 0.91, respectively. Cities in Asia are low wind speed cities, which have a 0.81 AVG value in wind energy potential. In cities in Europe, however, the wind energy potential (1.06 AVG value) is dominant compared to the solar energy potential (0.75 AVG value).
From the point of view of deviation, there are differences between the solar and wind energy potential. The standard deviation (S.D.) in solar energy is in the range, 0.17, 0.21, and 0.19, and the wind energy is in the range, 0.46, 0.69, and 0.72, respectively. Those distinctions can explain why the wind direction and speed are much more random and highly erratic compared to the solar case [
60].
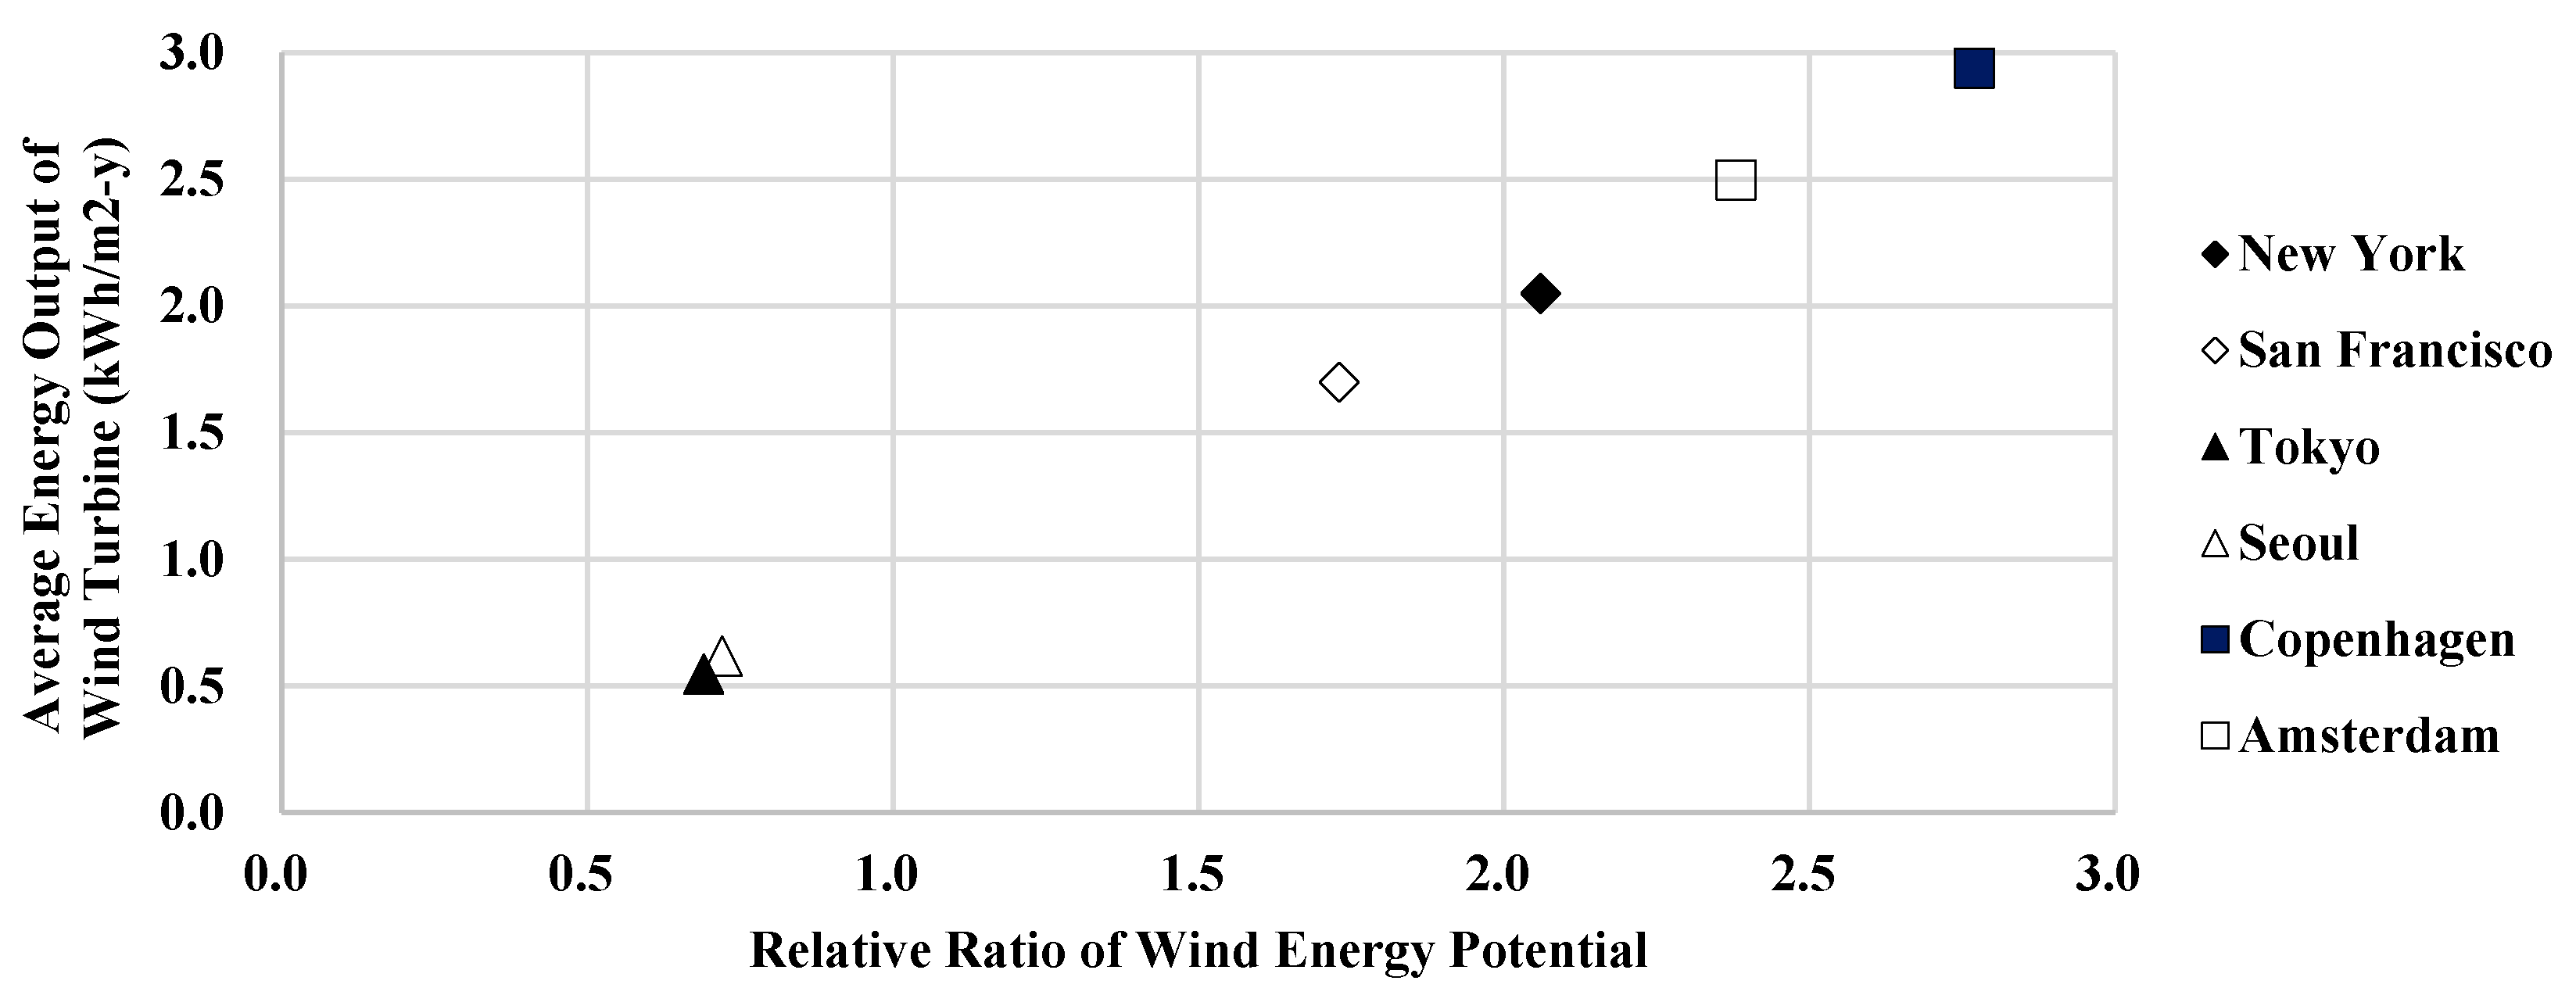
Among the three exemplary regions, two cities representative of the population and high-energy potential were selected and are marked in
Figure 5 and
Figure 6.
Table 5 lists the potential data for the six cities chosen. The main criteria for cities selection are (1) the relative range of energy potentials are between 0.7 and 1.5, which are lower 15% and upper 15% bound, and (2) large population and high density are the main consideration for future energy demand. In the next part, the detailed energy simulations in specific cities were tested based on the energy potential data source.
3.2. Building Energy Balance Simulation in Specific Office Module in Global Urban Areas
Six cities, which are listed in
Table 5, (
A) New York City (N.Y.), (
B) San Francisco (S.F.), (
C) Tokyo-Yokohama (Tokyo), (
D) Seoul-Incheon (Seoul), (
E) Copenhagen, and (
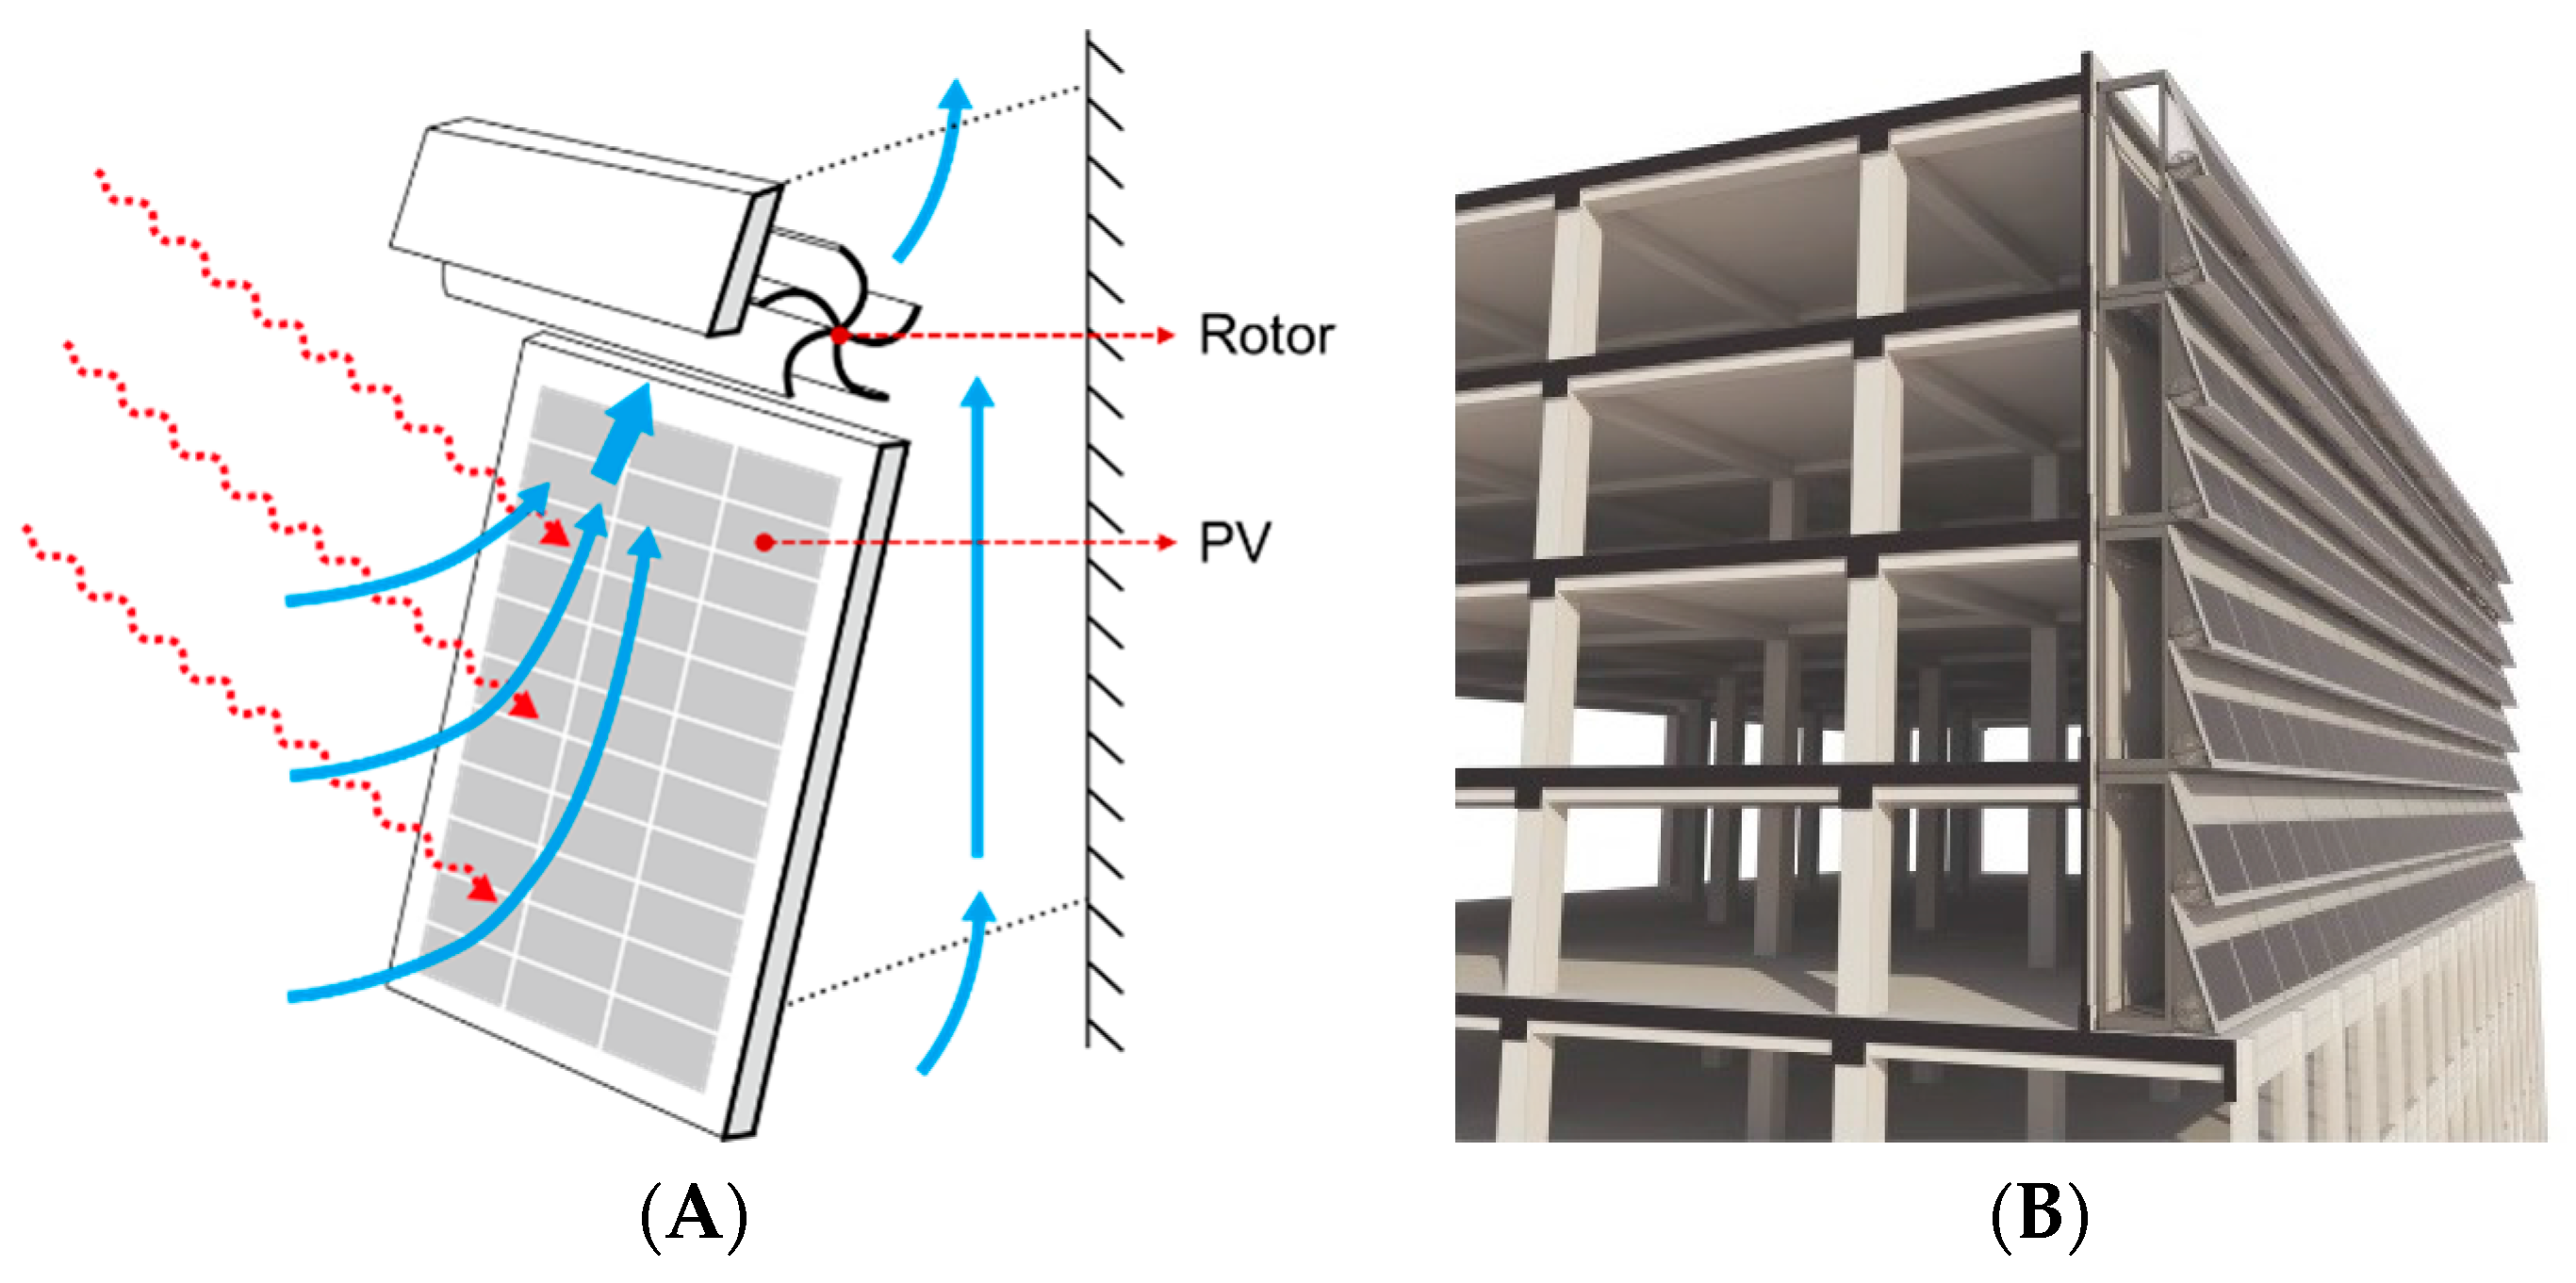
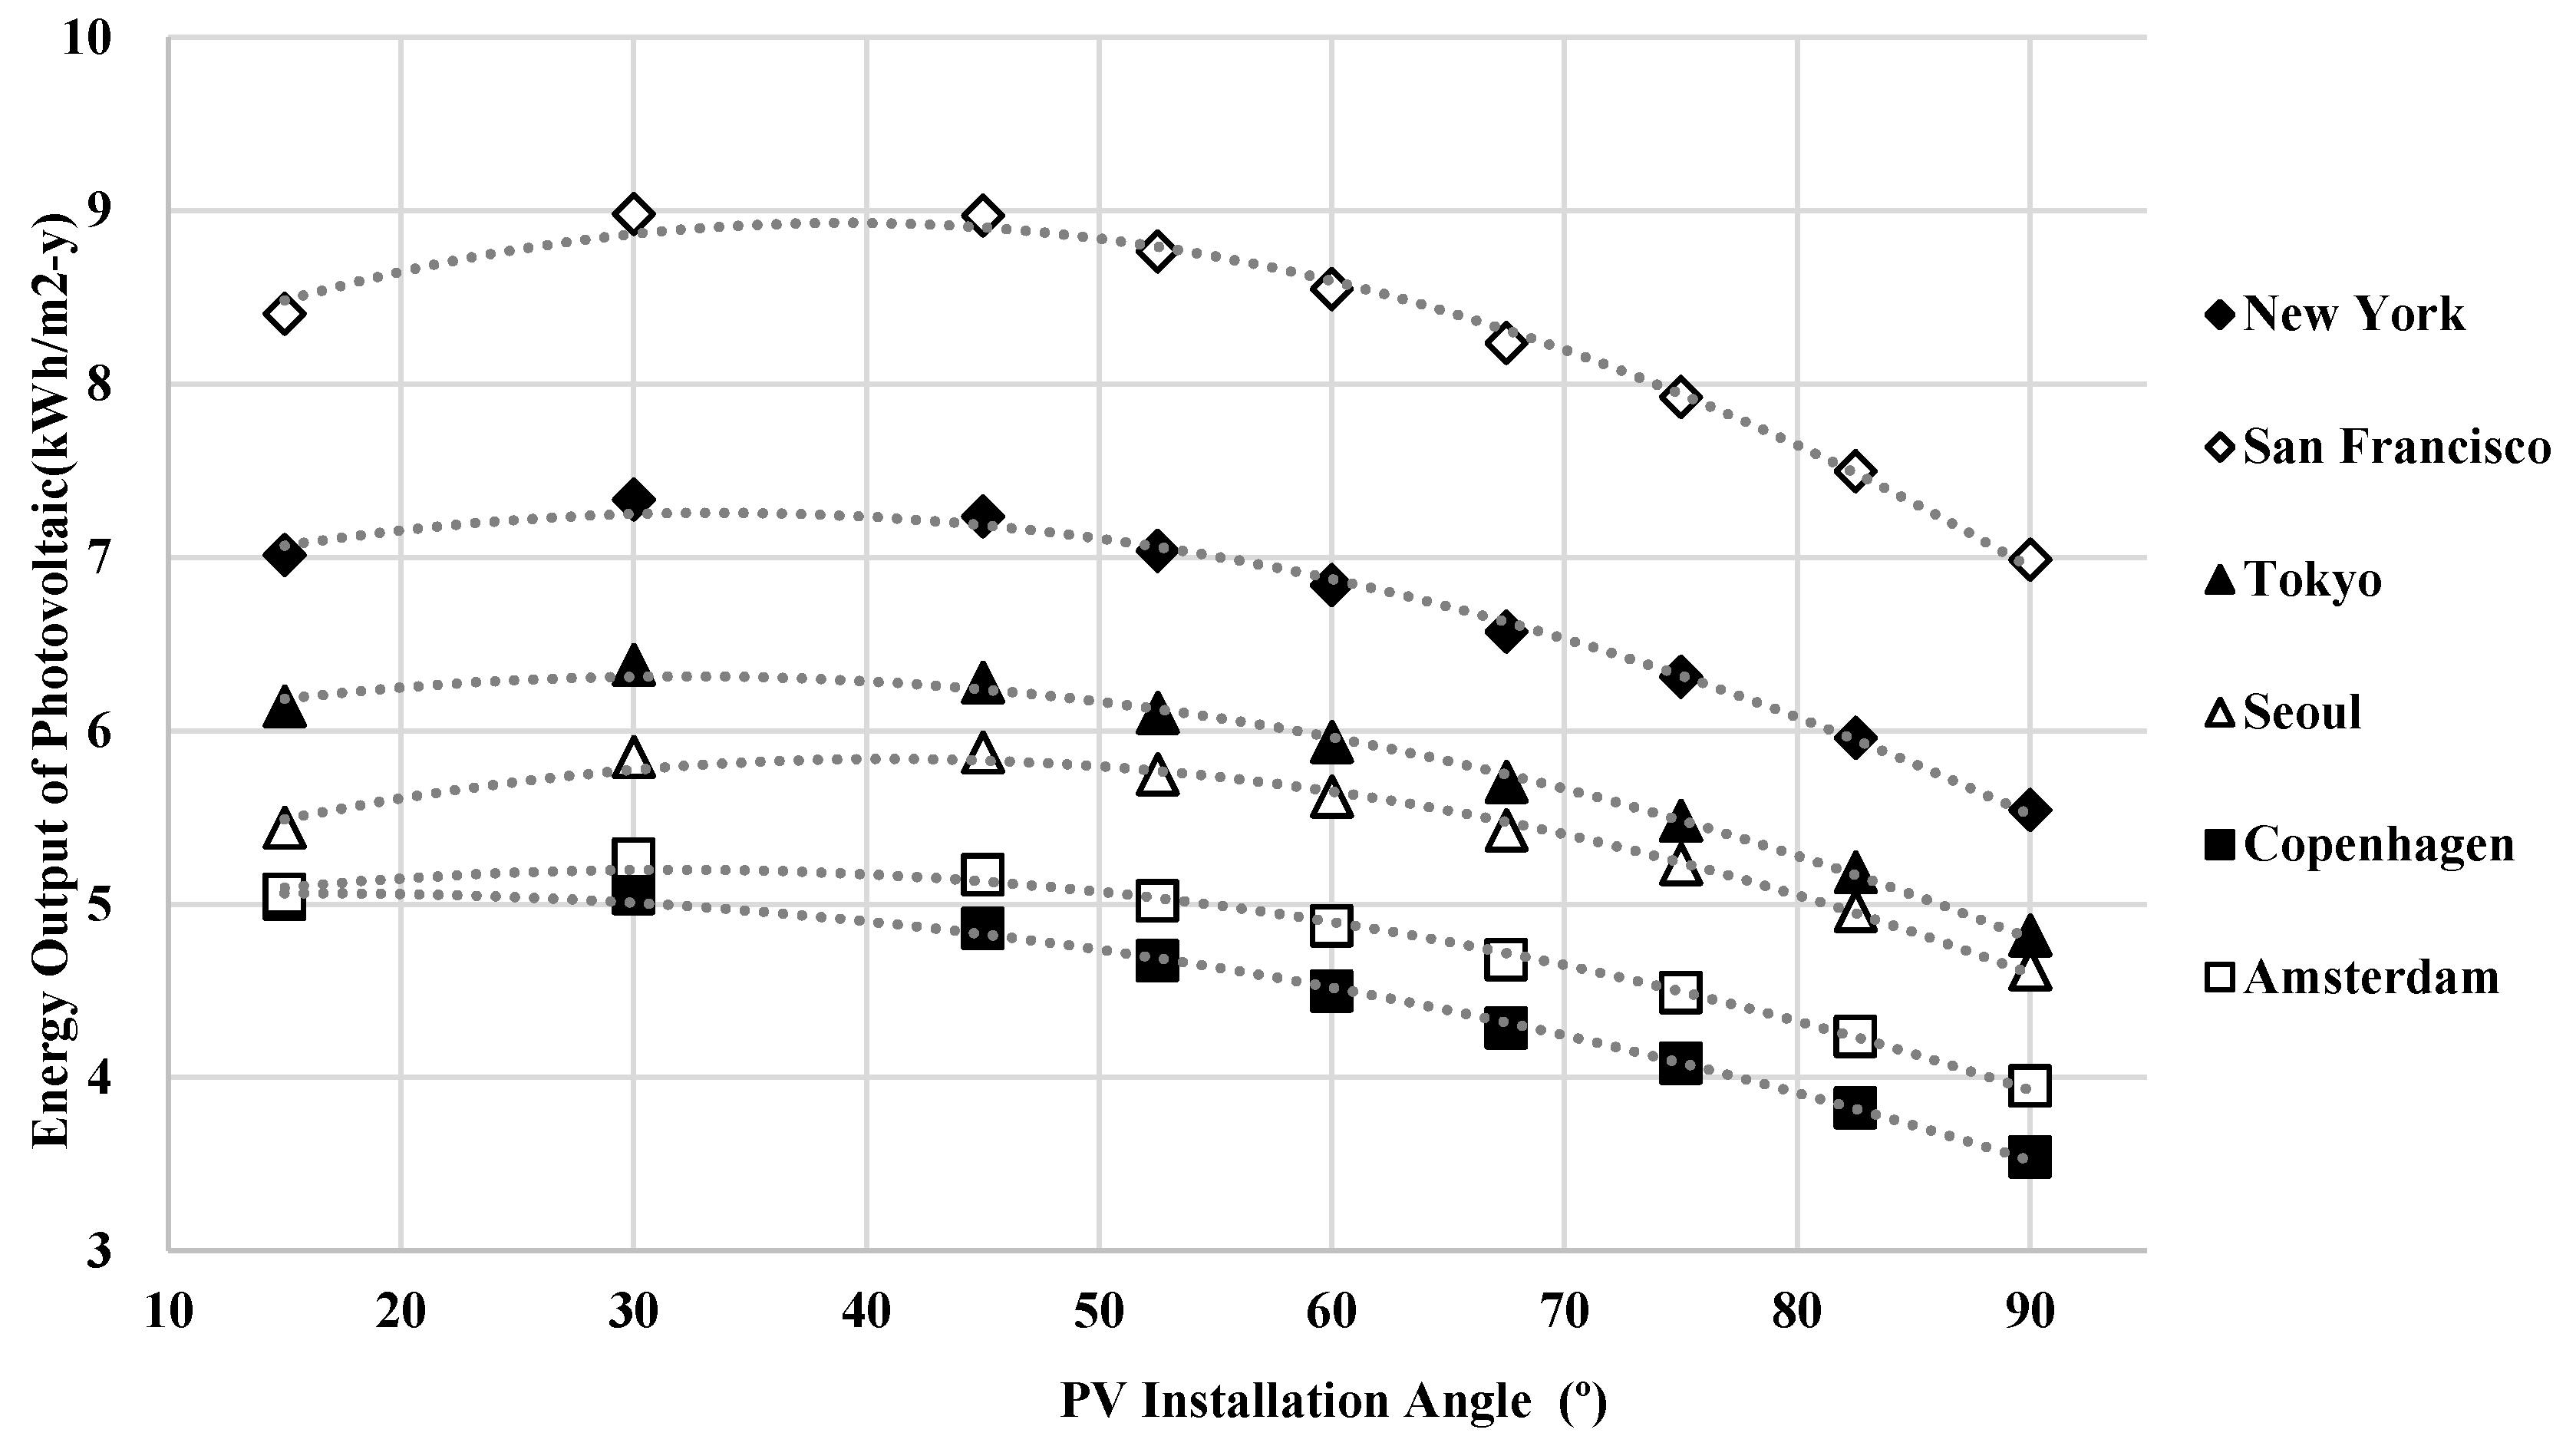
F) Amsterdam, were simulated to compare the energy balance of the building modules. First, in the part of solar and PV, the variation of the angle of incidence and its effects on energy generation were examined. In terms of the exterior design, solar panels installed parallel to the elevation can have an integrated design and a sophisticated feel. On the other hand, the PV angle of incidence can also vary the input wind speed as well as the efficiency of the PV.
Figure 7 shows the results of the PV angle and its energy generation. Based on the data from six cities, the optimal angle in the PV output might be in the range of 30 to 45° of the roof side. In addition, the reduction ratio in energy generation at a 90° angle of the roof side compared to the best performance angle (30° of the roof side) appears to be an average of 24.4% (21% to 30%). PV energy production is closely related to the climatic conditions, and it tends to be proportional to the solar irradiance. For example, in the case of an angle of 67.5° from the roof, the PV energy output is approximately 8.24 kWh/(m
2·y) (San Francisco), 6.57 kWh/(m
2·y) (New York), 5.7 kWh/(m
2·y) (Tokyo), 5.42 kWh/(m
2·y) (Seoul), 4.68 kWh/(m
2·y) (Amsterdam), and 4.29 kWh/(m
2·y) (Copenhagen), respectively. This shows that the energy production can vary by up to 1.92 times using the same module within different climate conditions.
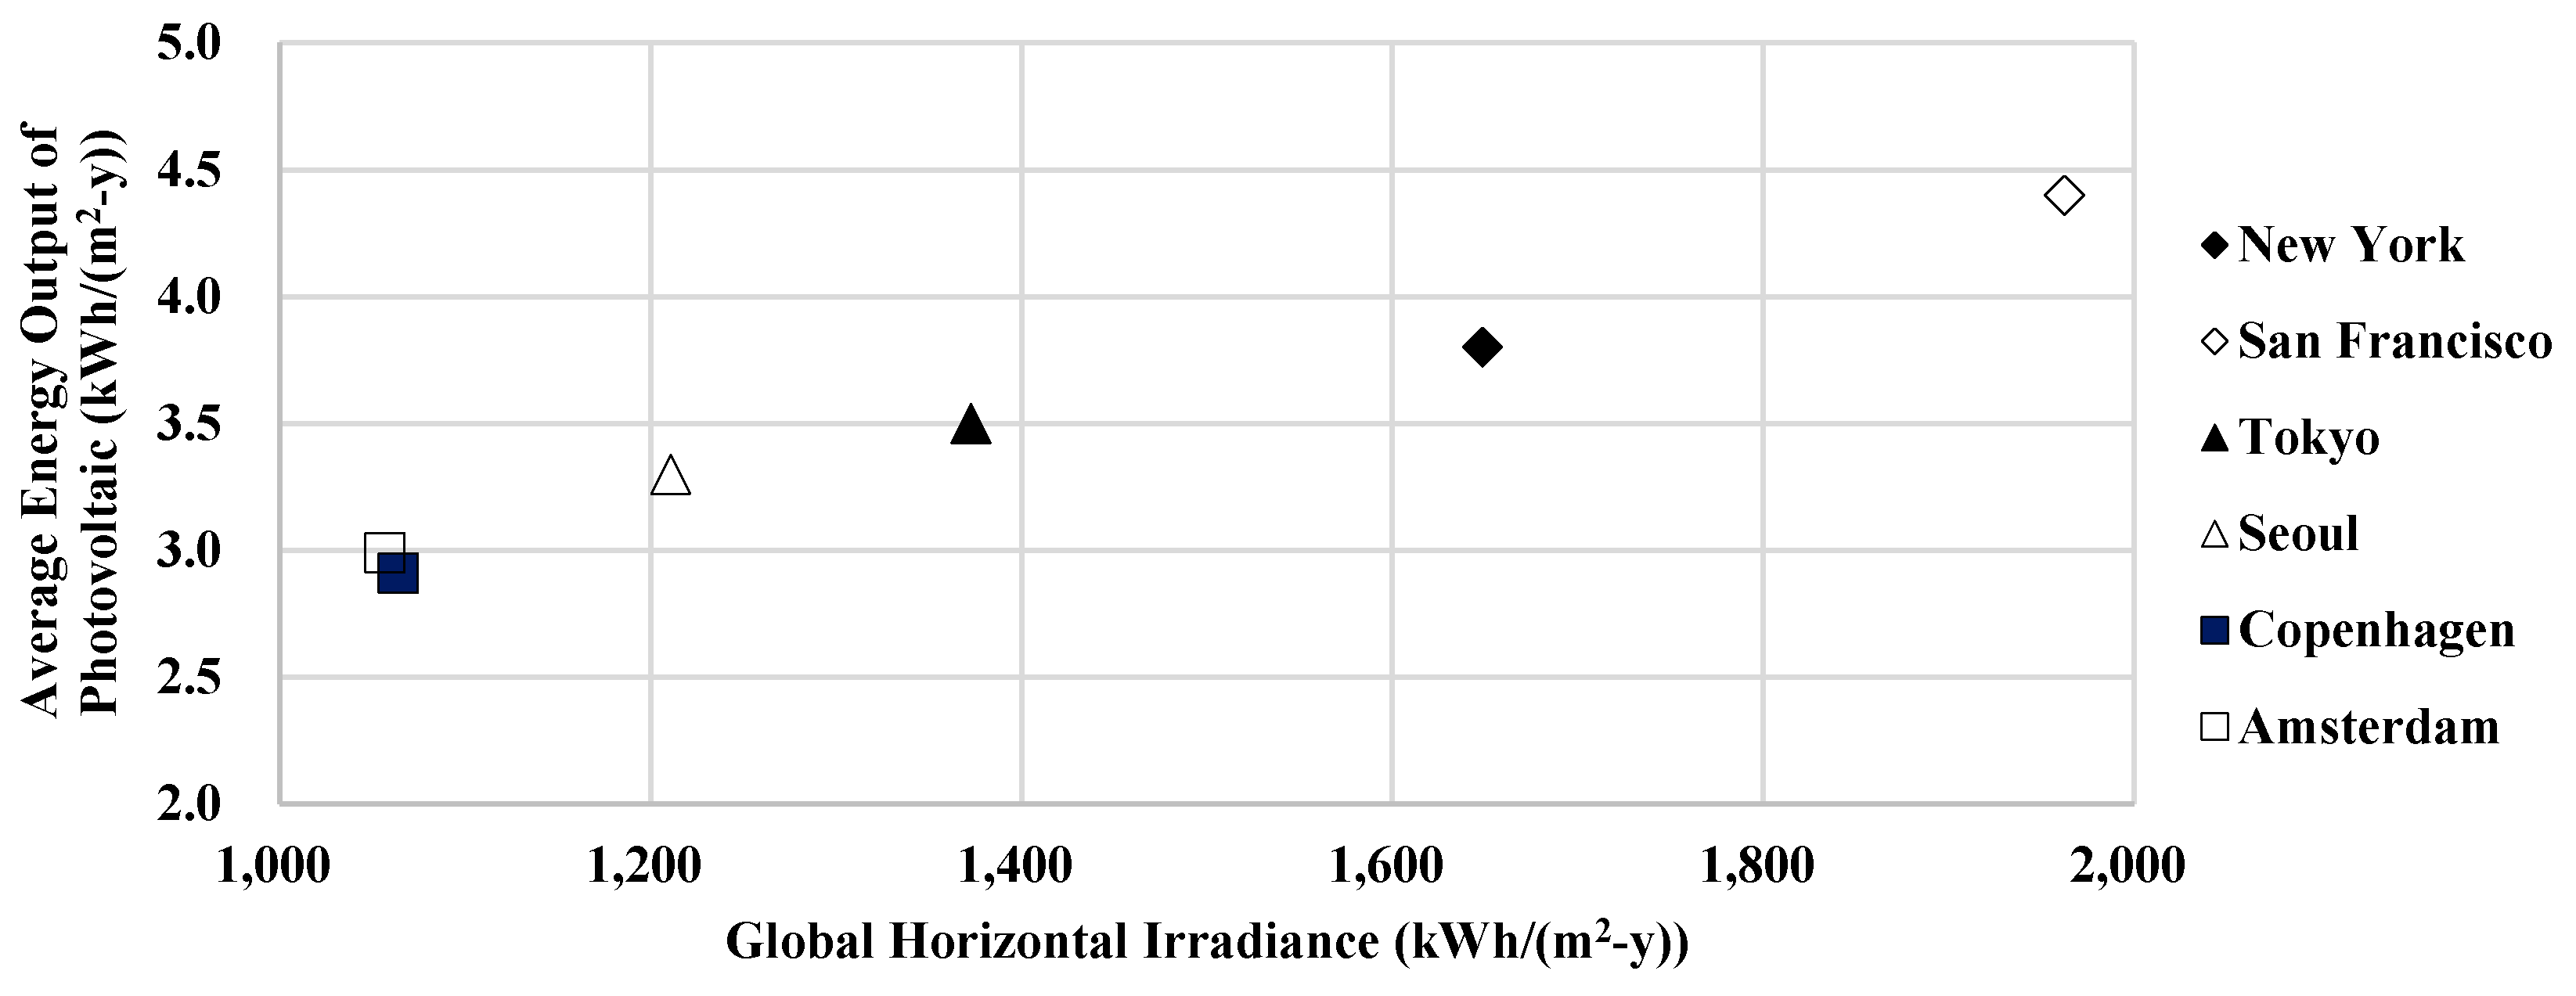
Solar irradiation has a decisive influence on PV energy production.
Figure 8 shows the yearly energy output of PV by global horizontal irradiance based on an energy simulation of the 90° angle of a roof side PV application. According to the data, the energy outputs have a linear relationship according to the change in solar irradiation, which suggests that comparing the solar energy potential with solar irradiation is an appropriate method.
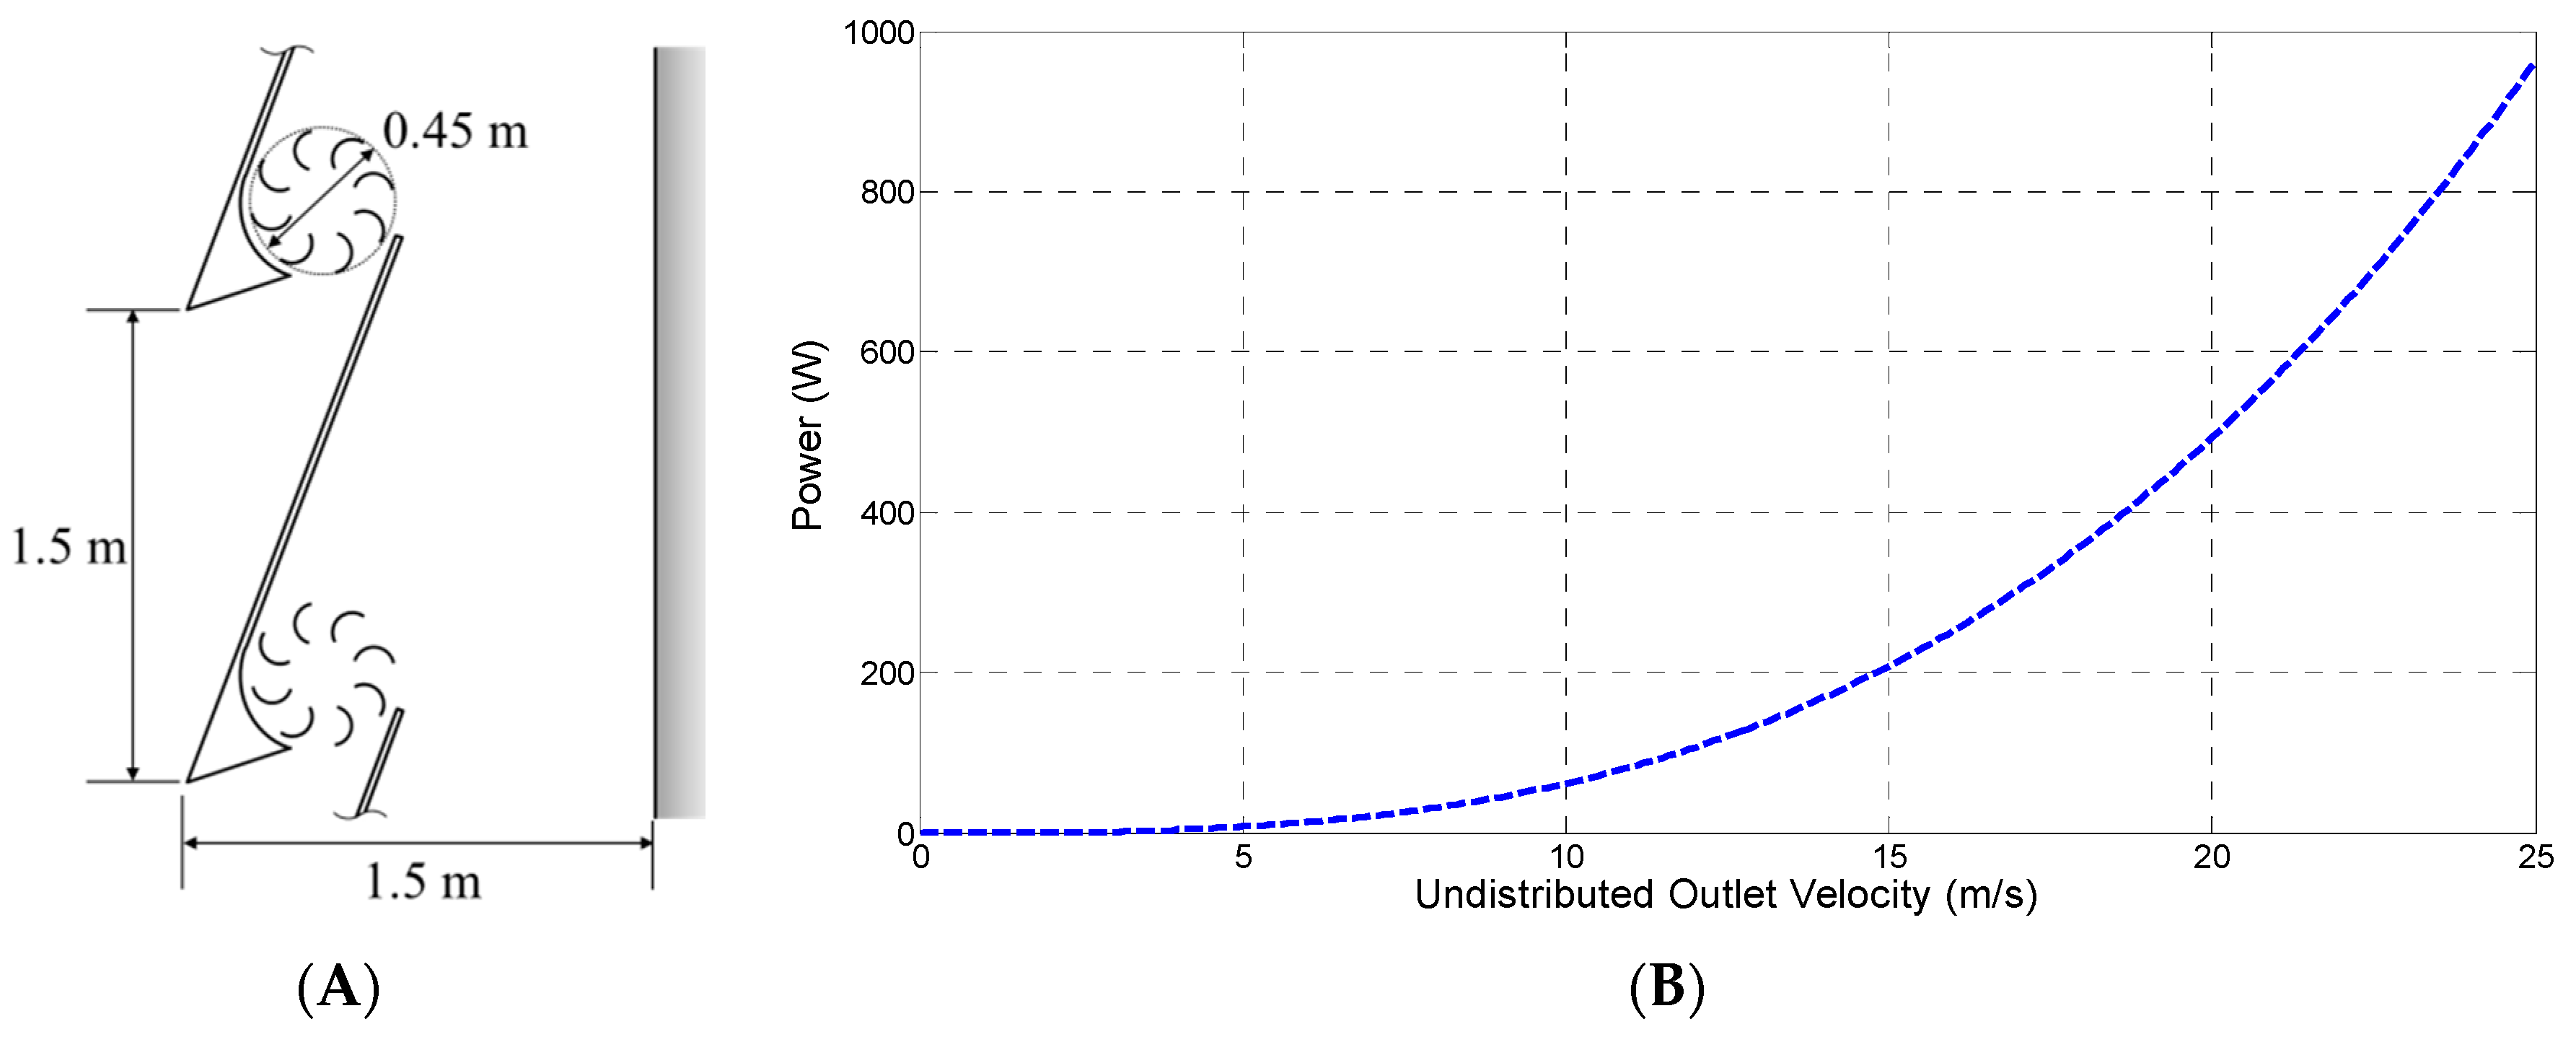
In the case of the wind related data,
Figure 9 shows the generated power output of a wind turbine performed by a wind tunnel test. As the inlet velocity increases, the energy generation of a wind turbine is intensified.
Figure 10 presents the yearly energy output of a wind turbine by the wind related climate data, such as speed and direction. According to the graph, to some extent, the energy output has a linear relationship with the change in wind climate data, which suggests that a comparison of the wind energy potential with the wind speed and direction is an appropriate method.
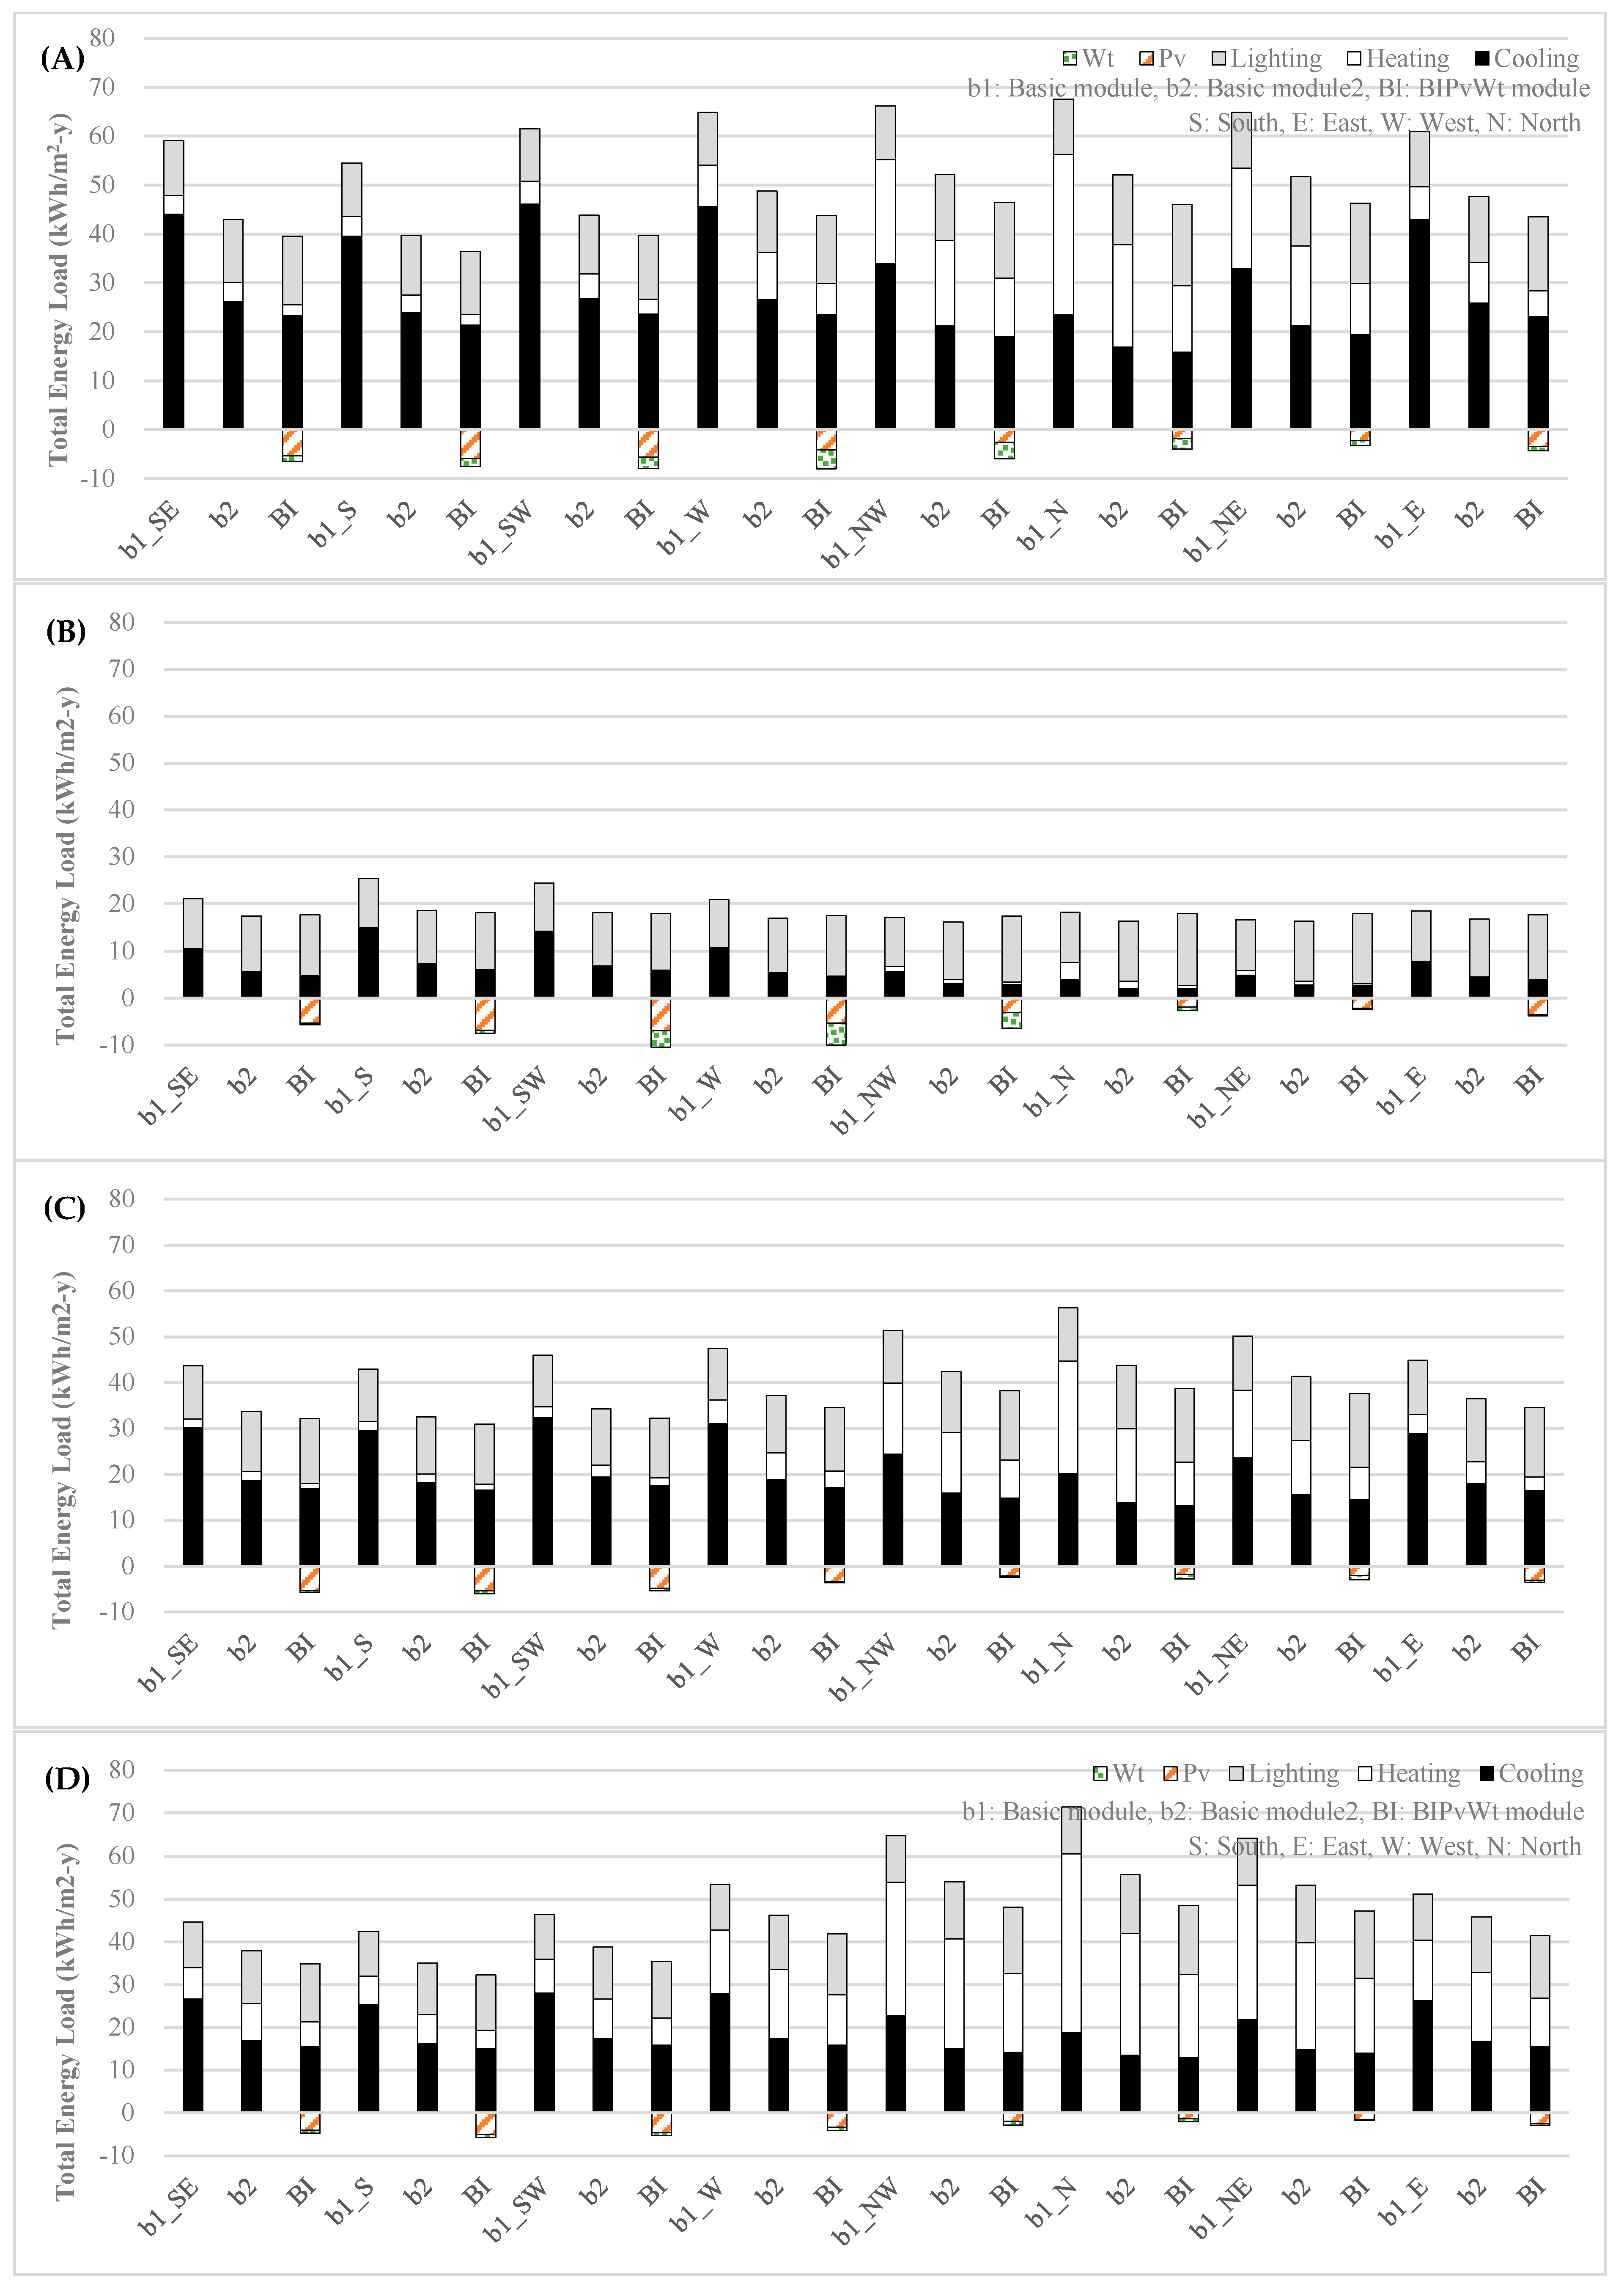
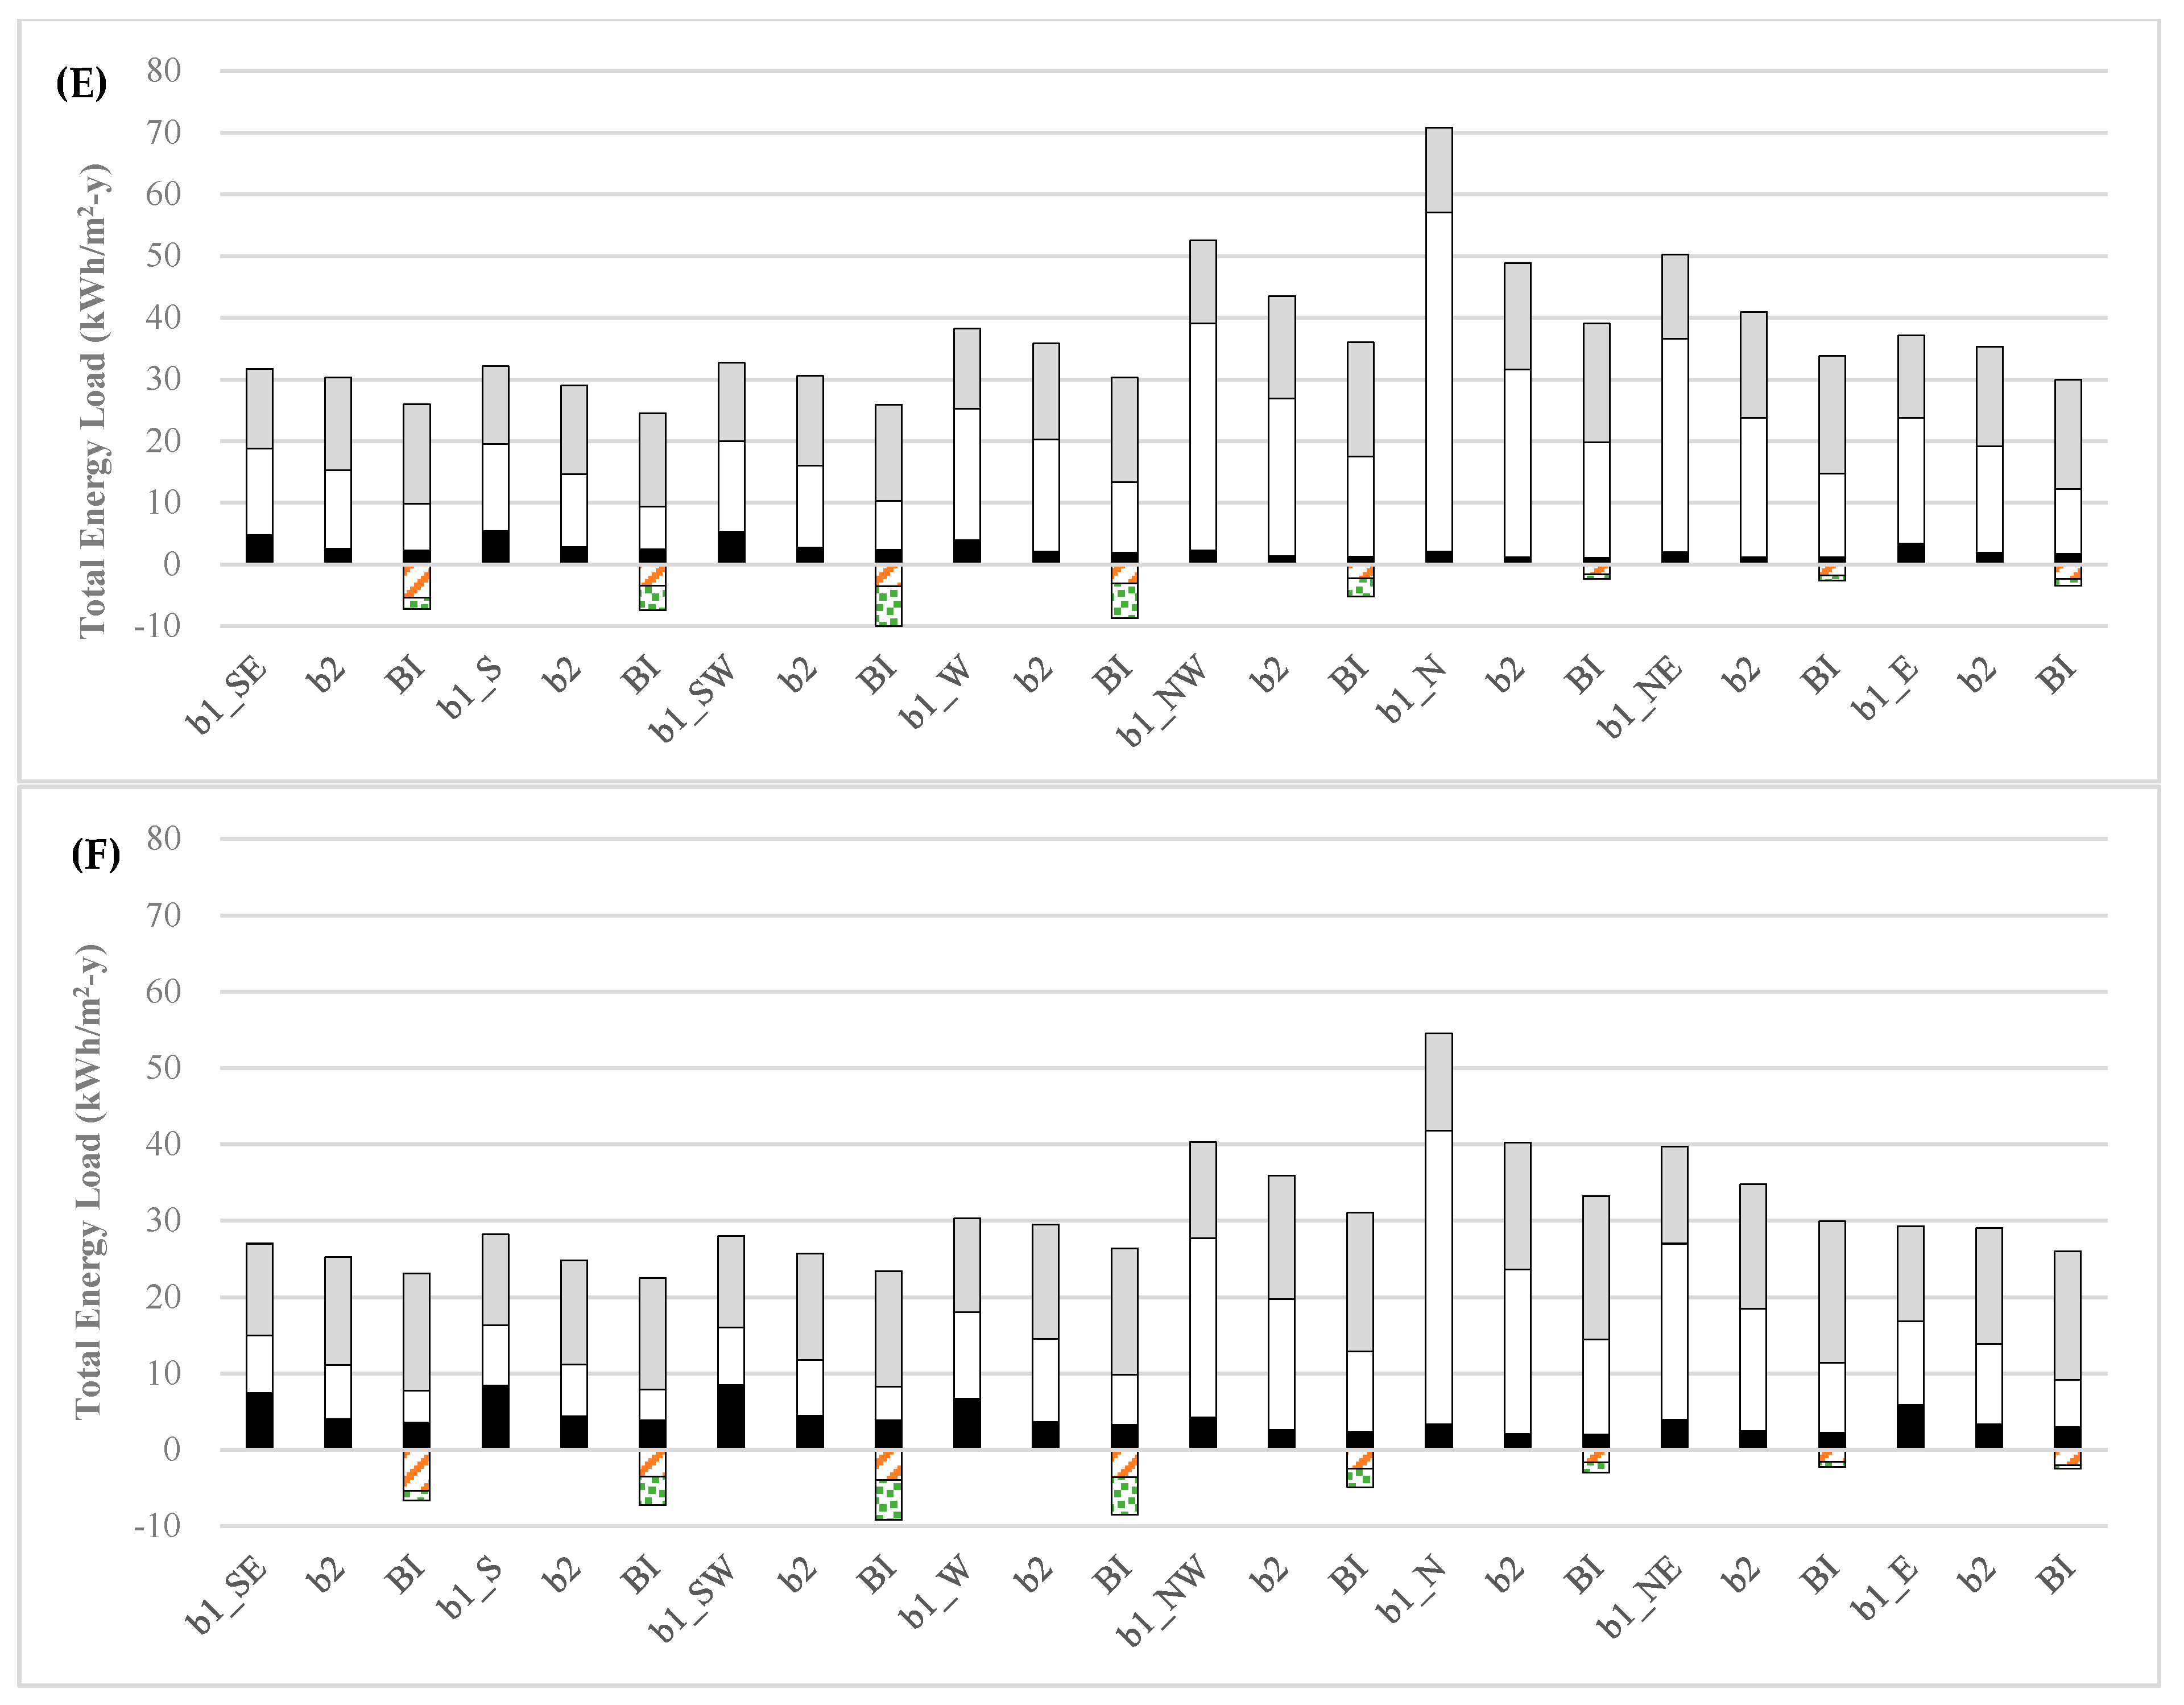
Evaluating the energy consumption and generation output by the application of a BIPvWt system in building envelope differs according to the climate conditions and building design and type. The energy output from the office buildings in the six selected cities was analyzed, as shown in
Table 6 and
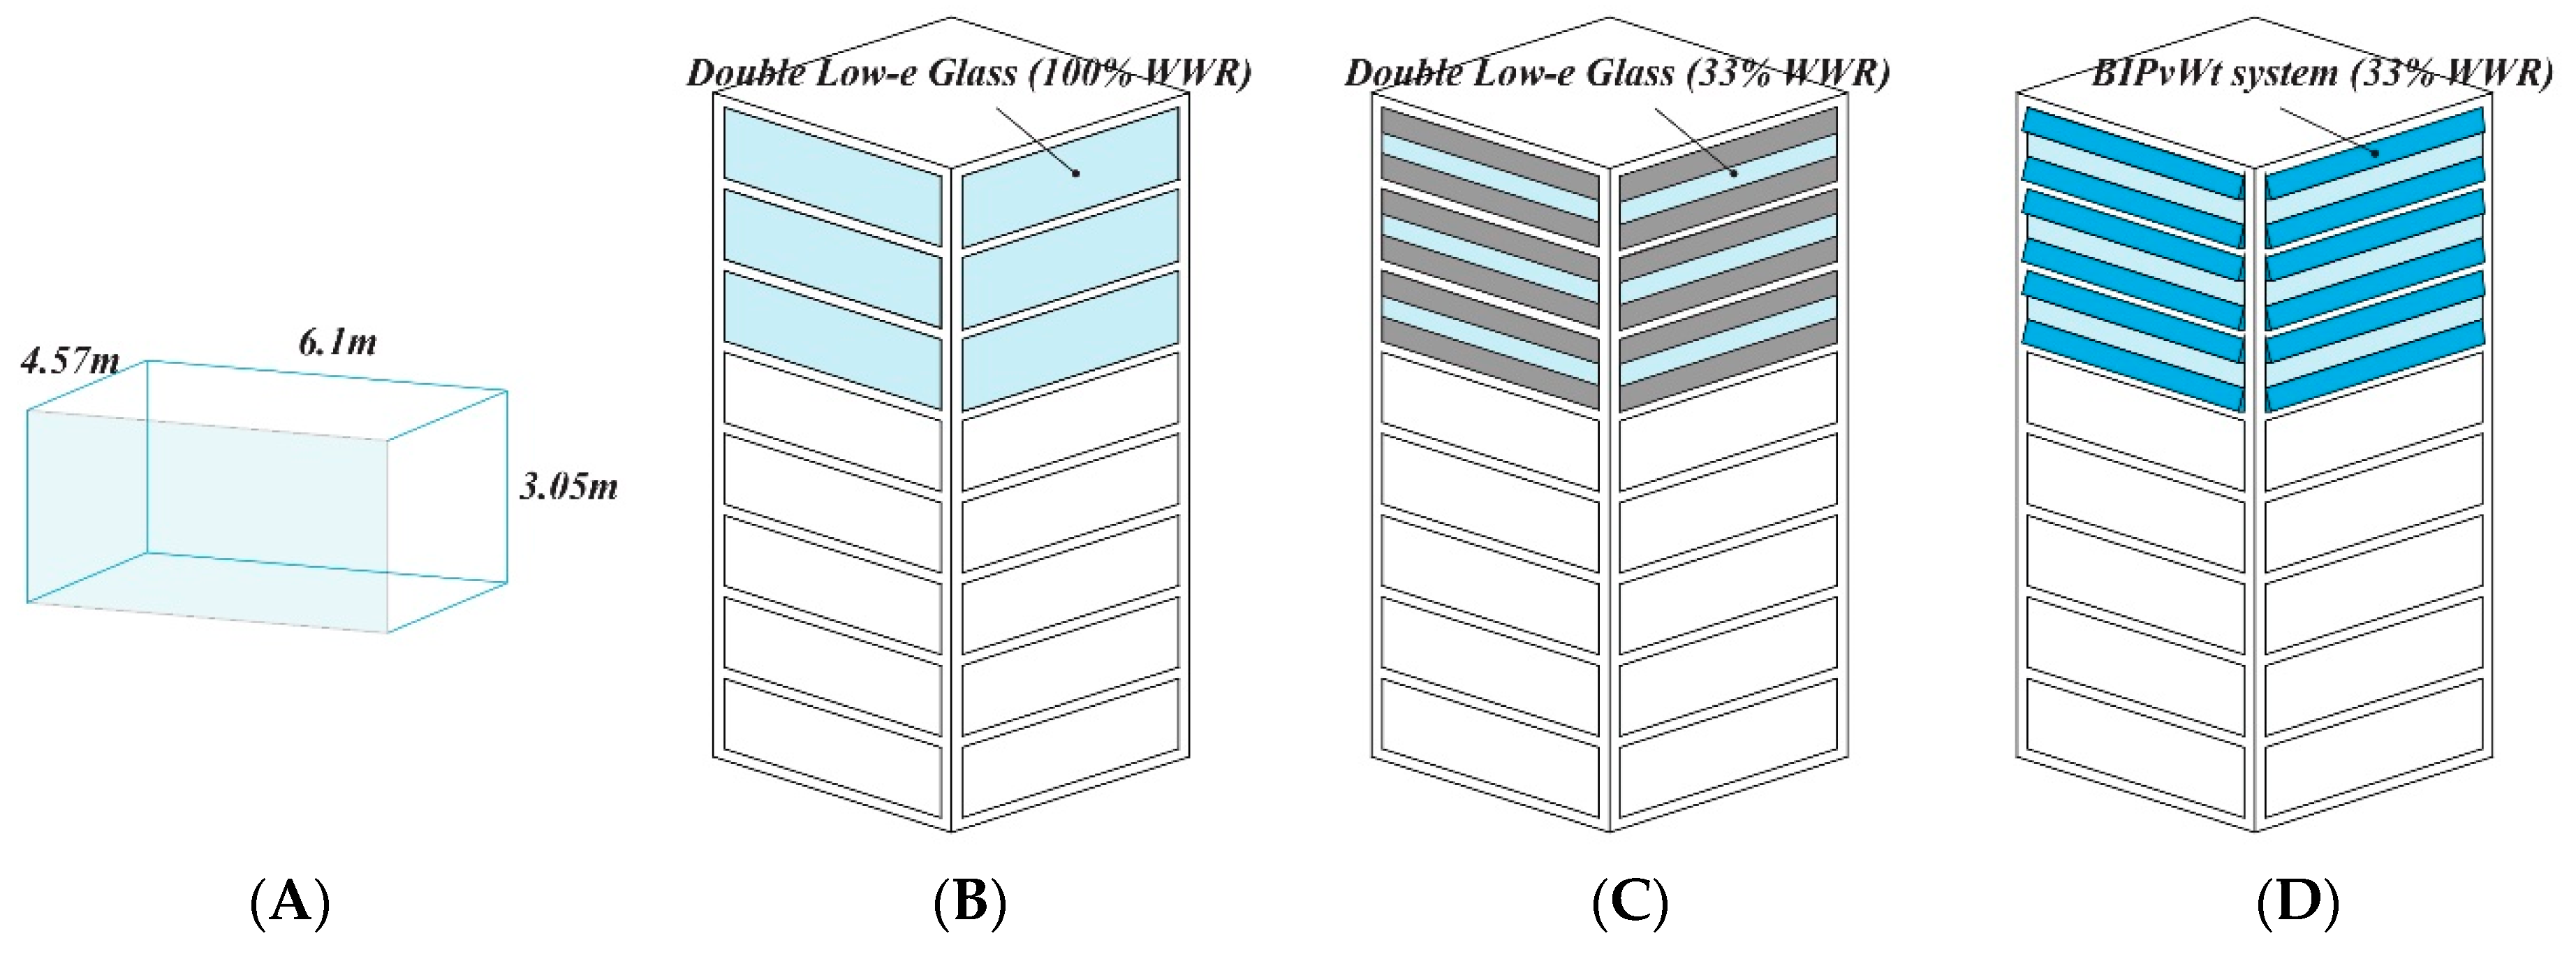
Figure 11. The energy generation by PV and wind power differs according to the orientation that the building is facing. In addition, the energy consumption (heating, cooling, and lighting energy load) are different in terms of orientation and building material. In this evaluation, eight different orientations (South East, SE; South, S; South West, SW; West, W; North West, NW; North, N; North East, NE; and East, E) and three different types of envelopes (b1, Basic module; b2, Basic module2; and BI, BIPvWt module) in the six selected cities (N.Y., S.F., Tokyo, Seoul, Copenhagen, and Amsterdam) were simulated and drawn as a graph. In
Figure 11, “+” in the
y axis stands for the energy consumption, and “−“ stands for the energy generation.
The experimental results are presented in the following order: total energy consumption, WWR changes, orientation effect, total energy balance with PV, and wind energy generation. Before that, details and a thorough investigation of N.Y. was performed. N.Y. has the largest area, with a population ranked 8th and population density ranked 76th in the 142 target cities. PV and wind energy potential occupy a considerably higher 9th place. Hence, installation of the proposed BIPvWt system will have a considerable influence. Based on the average energy data shown in
Figure 11, the cooling, heating, and lighting energy consumption ratios were estimated to be 20%, 55%, and 25%, respectively. When the proposed system is installed, it is expected it will not only reduce the energy consumption by approximately 25% as the WWR is lowered, but also produce energy reserves of up to 32% in terms of 3.8 kWh/(m
2·y) in PV and 2.05 kWh/(m
2·y) in wind energy generation. On the other hand, this shows a large deviation for each orientation. For example, the north orientation consumes the most energy and the south the least, with a ratio of approximately 1:0.79. In particular, the difference in heating energy consumption in relation to the orientation is significant (approximately 22.4 kWh/(m
2·y) in the north orientation, and 3.23 kWh/(m
2·y) in the south orientation). The difference in energy consumption according to the orientation requires further consideration in building design and renovation. In addition, the west and southwest are the most efficient in energy production, which can replace approximately 18% and 20% of the building energy consumption, respectively. Overall, significantly different results can be obtained in terms of energy consumption and generation depending on where the office is placed, how the layout is organized, and whether the proposed system is installed.
In the total energy consumption, the portion of the cooling and heating loads in the buildings in S.F., which have relatively small needs, had the lowest energy balance (16.0 kWh/(m
2·y)) among the cities tested. On the other hand, the buildings in N.Y. required the highest total energy output (49.7 kWh/(m
2·y)) because the N.Y. case consumes considerable energy in cooling and heating. Although 4 cities without S.F. (3C) and Copenhagen (5C) are in a similar climate classification (4A) based on the ASHRAE (
Table 5), the absolute total energy consumption, and the fact that the ratio between heating, cooling, and lighting energy vary in each city. In addition, depending on the region, the dominance of heating, cooling, and lighting may be different. Of the data in
Figure 11, the ratio of energy usage is compared using the mean value of 100% (b1) and 33% (b2) WWR. For example, cooling is relatively dominant in N.Y. (approximately 56% of the total, up to 75%), lighting is relatively dominant in S.F. (approximately 60% of the total), cooling is slightly dominant in Seoul and Tokyo (approximately 40% and 52% of the total), while heating is dominant in Copenhagen and Amsterdam (approximately 57% and 44% of the total, up to 75%). This can vary depending on the changes in input parameters, such as building type, orientation, and HVAC (heating, ventilation, and air-conditioning) schedule. In particular, the ratio may vary significantly depending on orientation of the same area, indicating that the role of orientation in building design and layout can be considerable.
When the WWR changes from 100% to 33%, all cases showed that both the heating and cooling loads decrease and the lighting load increases. On the other hand, the total energy consumption decreases, because the plus amount of heating and cooling load is far outweighed compared to the minus amount of lighting load. As the WWR decreases from 100% (b1) to 30% (BI), 44.8% of the heating, cooling, and lighting load is decreased in the north of the Copenhagen area and 28% is decreased in the south of S.F. In other regions, a 39% (Amsterdam, northeast), 32.1% (Seoul, north), 28.6% (Tokyo, north), and 35.4% (N.Y., southwest) decrease in energy is observed when the WWR changes. This may be characterized by the interaction between the general climatic conditions (temperature or irradiation) and heating or cooling. In other words, in S.F., where the cooling is dominant, energy losses are reduced greatly in relation to the south, and in Copenhagen and Amsterdam, where the heating is dominant, the energy losses are influential in the north. Between cases “b2” and “BI”, they have the same condition of WWR, but there is an additional attachment of the BIPvWt system, which strengthens the thermal performance, and there are also some shading effects of the BIPvWt system. Therefore, most cases show a decrease in total energy consumption, except for S.F., which has a mild climate (3C in the ASHRAE classification) compared to other cities. In the case of S.F., in some cases, “BI” consumes more energy compared to “b2”, which is explained by the shading effect of the additional installation.
From an orientation and energy consumption point of view, six cities showed common results. A south and southeast (SE) facing building consumes the least energy, but a north-oriented building requires the highest energy load because the heating energy loads in the six cities increase considerably. In addition, the deviation in N.Y. (14.0) and Copenhagen (14.3) far overweighs the other cities. In the case of N.Y., the effects of a BIPvWt installation on reducing the energy loads is significant because the WWR changes from 100% to 33%. On the other hand, in the case of Copenhagen, the deviation in each orientation is critical and highlights the need for careful consideration in an urban layout in the design guideline. Tokyo and Seoul, which show opposite aspects in south and north orientations, require discreet analysis in heating and cooling control.
In the case of PV energy generation, most cities tend to generate much more energy in a south-related face installation and the trend of the distribution is commonly predictable. In addition, in a detailed point of installation, the PV output can cover at least 3.9% (N.Y., north orientation) and at most 37.6% (S.F., south orientation) of the total energy consumption.
In the case of wind energy generation, the trend of the distribution appears to be irregular and varies according to the city and orientation. Therefore, in a detailed point of installation, the wind energy output can cover at least 0.8% (Seoul, northeast orientation) and at most 26.5% (S.F., west orientation) of the total energy consumption. In addition, compared to the PV cases, most cities have a relatively large standard deviation in each orientation, which explains why the wind direction and speed are much more random and highly erratic compared to the PV cases.
The total energy balance results show that each city can cover the following proportion of its energy consumption as an application of the BiPvWt system in average value: N.Y., 14.4%; S.F., 38.0%; Tokyo, 11.8%; Seoul, 8.9%; Copenhagen, 21.0%; and Amsterdam, 22.4%. Given the energy potential data, which ranges from 0.72 to 1.70 (
Table 5), most urban areas may reduce their energy consumption briefly by approximately 8–38% after applying the BIPvWt system. Therefore, as a design guideline, a south facing layout of the energy consumption and PV output is required. On the other hand, the distribution of wind speed and direction differs from most cities and the urban layout even causes differences in the wind energy potential. Therefore, careful consideration and computer-aid approaches, such as CFD analysis, are needed to identify the most suitable turbine location prior to installation.


