Measuring Renewable Energy Development in the Eastern Bloc of the European Union


Faculty of Entrepreneurship, Business Engineering and Management, Department of Economic Engineering, University POLITEHNICA of Bucharest, Spl. Independentei, No. 313, S6, Bucharest RO-060042, Romania
Energies 2017, 10(12), 2120; https://doi.org/10.3390/en10122120
Submission received: 29 October 2017
/
Revised: 19 November 2017
/
Accepted: 8 December 2017
/
Published: 13 December 2017
(This article belongs to the Section L: Energy Sources)
Abstract
:This paper aims to investigate the energy development in terms of renewable energy in the Eastern Bloc European Union member states. Energy is a topic of planetary implications and the analysis of the development of renewable energy sources (RES) in parts of the world where the fossil fuels are scarce is of tremendous importance. In the first section, the paper concisely explores the energy landscape of the European Union (EU), revealing important concerns. The second section introduces an index of renewable energy development (IRED) which captures the complexity of the development of RES and is based on two components, each containing three factors built on efforts and outcomes in RES development. IRED is further applied on a cross-country analysis based on the Eastern Bloc of the EU member states for 2005–2015 interval, revealing the best and worst performers. The application of IRED might contribute to a better understanding of the needed efforts required by different countries in their quest towards energy security, efficient energy use and emissions control. The findings of this paper might conduct to the identification of the best practices which could be spread throughout EU and might contribute to a more rigorous development of policymaking in the energy area.
1. Introduction
Sufficient, stable, safe and affordable energy constitutes the main driver of wellbeing worldwide. Energy makes the world go round and it was at the centre of the industrial revolutions of the past. Fossil fuels have fed the world since then, and today the fossil fuels still remain the first choice in consumption, all over the world. The global proven reserves of oil showed an increase of 22% over the 2005–2015 interval, from 1388 thousand million barrels to 1691 thousand million barrels [1]. The same is true for natural gas, which recorded a worldwide increase of 18%, from 157 trillion cubic meters in 2005, to 185 trillion cubic meters in 2015 [1].
The world still relies on fossil fuels, the energy consumption based on fossil fuels being of about 80% of the total energy consumption both in 2005 and 2015 (80.73% in 2005 and 80.81% in 2015) [2]. The global primary energy consumption was of 10,939 million tonnes of oil equivalent (Mtoe) in 2005, which rose to 13,105 Mtoe in 2015 [1], recording an increase of about 20% in the last 11 years. This increasing energy demand, coupled with effects of energy use on the environment showed a need of change in the way in which humans are using the energy products towards a more sustainable manner. Today, the world is changing and is on the verge of another energy revolution, with the renewable energy sources (RES) playing the main part in the transition towards a sustainable energy, especially in developed countries. The investments in clean energy exploded from 88 billion USD in 2005, to 349 billion USD in 2015, scoring an increase of about 300% [3]. From these, the investments in new RES capacities (except large hydro developments) increased steadily from 63 billion USD in 2005, to 293 billion in 2015, registering a global increase of 365% [3], with wind and solar investments at the top. However, at a closer look, the picture does not look so bright, as the global clean energy index NEX, calculated by New York Stock Exchange, decreased from 184 in 2005 to 170 in 2015 (NEX index is calculated based on reports from 94 global innovative companies with investments in clean energy measures—energy conservation, RES development and energy efficiency) [4]. The highest value for NEX was of 451 in 2008 and since then it has recorded a drop mainly due to the collapse of oil and gas prices. Therefore, some specialists spoke about the premature death of renewable energy [5]. This is also sustained by the fact that, despite a strong increase in global clean energy, the improvements rate in clean energy is disappointing and far behind the needed emissions targets [6].
The EU is poor in fossil energy resources, presently possessing only 0.3% of the total world proven oil reserves, only 0.7% of the total world proven natural gas reserves and 6.6% of the total world proven coal reserves [1]. This energy resources scarcity lead to massive imports, as the EU cannot cover from internal sources the energy demand. In 2005, about 65% of all fossil fuels were imported, whereas in 2015 about 75% of all fossil fuels were coming from import sources. Therefore, in order to assure the energy security and climate change control, some measured were implemented by the European institutions, like the common framework for promotion of RES [7,8].
The EU have registered a strong increase in RES consumption, recording a share of RES in gross final energy consumption of 16.4% in 2015, from 9% in 2005 (82% increase) [9]. This shows that EU has the potential to reach its own target of 20% RES in gross final energy consumption by 2020. Yet, a glance over the entire EU shows a mixed picture, with countries lagging behind like Luxembourg, Malta and Netherlands which in 2015 met values below half of their national targets of 2020, and countries that already surpassed their own targets, like Croatia, Lithuania and Sweden. Eleven member states of the EU already surpassed their national targets established for 2020, from which seven belong to the Eastern Bloc of the EU (Bulgaria, Croatia, Czech Republic, Estonia, Hungary, Lithuania and Romania). This is the reason why this article tackles the issue of RES development in Eastern Bloc of the EU, as these countries are leading in the effort of implementing RES developments in EU and are sharing a common political background and a former centralized economy.
The world needs a new view on renewable energy, but the path towards this goal is very complex. To reveal the complexity of this issue, many complicated indices and indicators were developed over the years. Dashboard indicators like the energy indicators for sustainable development (EISD) developed by the International Atomic Energy Agency (IAEA), are best known [10]. Unfortunately, EISD contains 30 indicators, which are very difficult to monitor and to be used in cross-country analysis. Composite indicators, like environmental sustainability index (ESI) developed by Socioeconomic Data and Applications Center (SEDAC) which contains more than 20 performance indicators, are confronted with obstacles in identifying sufficient and reliable data for all themes [11]. Energy metrics have been developed for various audiences [12,13,14], with their limitations, but the conclusion was that more research is needed in this area. Moreover, none of the previous researchers, to the author’s knowledge, tried to merge the complexity of the renewable energy field into dimensions related to each country efforts, associated with the best use of the existent energy endowment and the best mechanisms in the deployment of RES. Therefore, the current research introduces a straightforward, easily applicable index in order to assess the best and worst performs within a part of the EU in the deployment of renewable energy, considering that the governances are mainly responsible for the transformation of their economies from fossil fuels based ones to low-carbon ones.
Governance is an important driver of the distribution of the benefits of new technologies within society and the political interventions are crucial for the transition towards a sustainable energy [15,16]. The best way to implement a more sustainable energy path is through energy and environmental policymaking, but this is often based on immediate interests and lacks scientific rigor. To address this issue and to help identifying the best known practices to develop RES in EU, the present paper introduces a new composite index of renewable energy development (IRED) which is based on a straightforward yet accurate methodology, where two components, each based on three factors, are considered. The components have in view the efforts recorded in developing RES (component 1) and the registered outcomes (component 2) for each country of the geographic focus. IRED is assessed and is used on a cross-country analysis for 11 member states of the EU, belonging to the Eastern Bloc, to reveal the progress in the RES development. IRED is then used to indicate the best and the worst performers in order to identify the best practices that might be replicated by other countries from the Eastern Bloc in their effort to reach a more sustainable energy path. The present paper describes a study which part of a project which examines IRED on a larger scale, which is a work in progress, but the information gathered so far shows important findings worth publishing.
The rest of the paper is structured as follows: the second part briefly investigates the EU energy landscape, the third part presents the methods, the fourth part comprises the results, the fifth part is concerned with the discussion of the results and the sixth part contains the conclusions.
2. Concise Investigating of the EU Energy Landscape
The proven oil reserves of the 28 member states belonging to EU (EU28) dropped from 6.6 thousand million barrels in 2005 to 5.2 thousand million barrels in 2015 [1]. The same is true for natural gas, where a decrease was recorded, from 3 trillion cubic meters in 2005 to 1.3 trillion cubic meters in 2015 [1]. The production for all fossil fuels dropped within the studied interval with 59%, from 516 Mtoe in 2005 to 324 Mtoe in 2015 (see Table 1), mainly due to limited fossil fuels in the region. The primary energy production dropped in EU28 since 2005, from 904 Mtoe to 766 Mtoe in 2015, mainly due to a scarcity in supply of domestic energy resources and the producers opinion on considering the exploitation of the unconventional fossil fuels uneconomical [17]. However, the production from RES increased by 71% over the period 2005–2015, out of the total primary energy production the energy production from RES being of about 26% in 2015.
The objective of clean and secure energy is the key of the European current strategy for growth [18] and the transition towards it is in progress and irreversible. Research has proven that the increase in the primary energy production from RES in a given country has a positive impact on its energy security, energy efficiency, environment and economic growth [19].
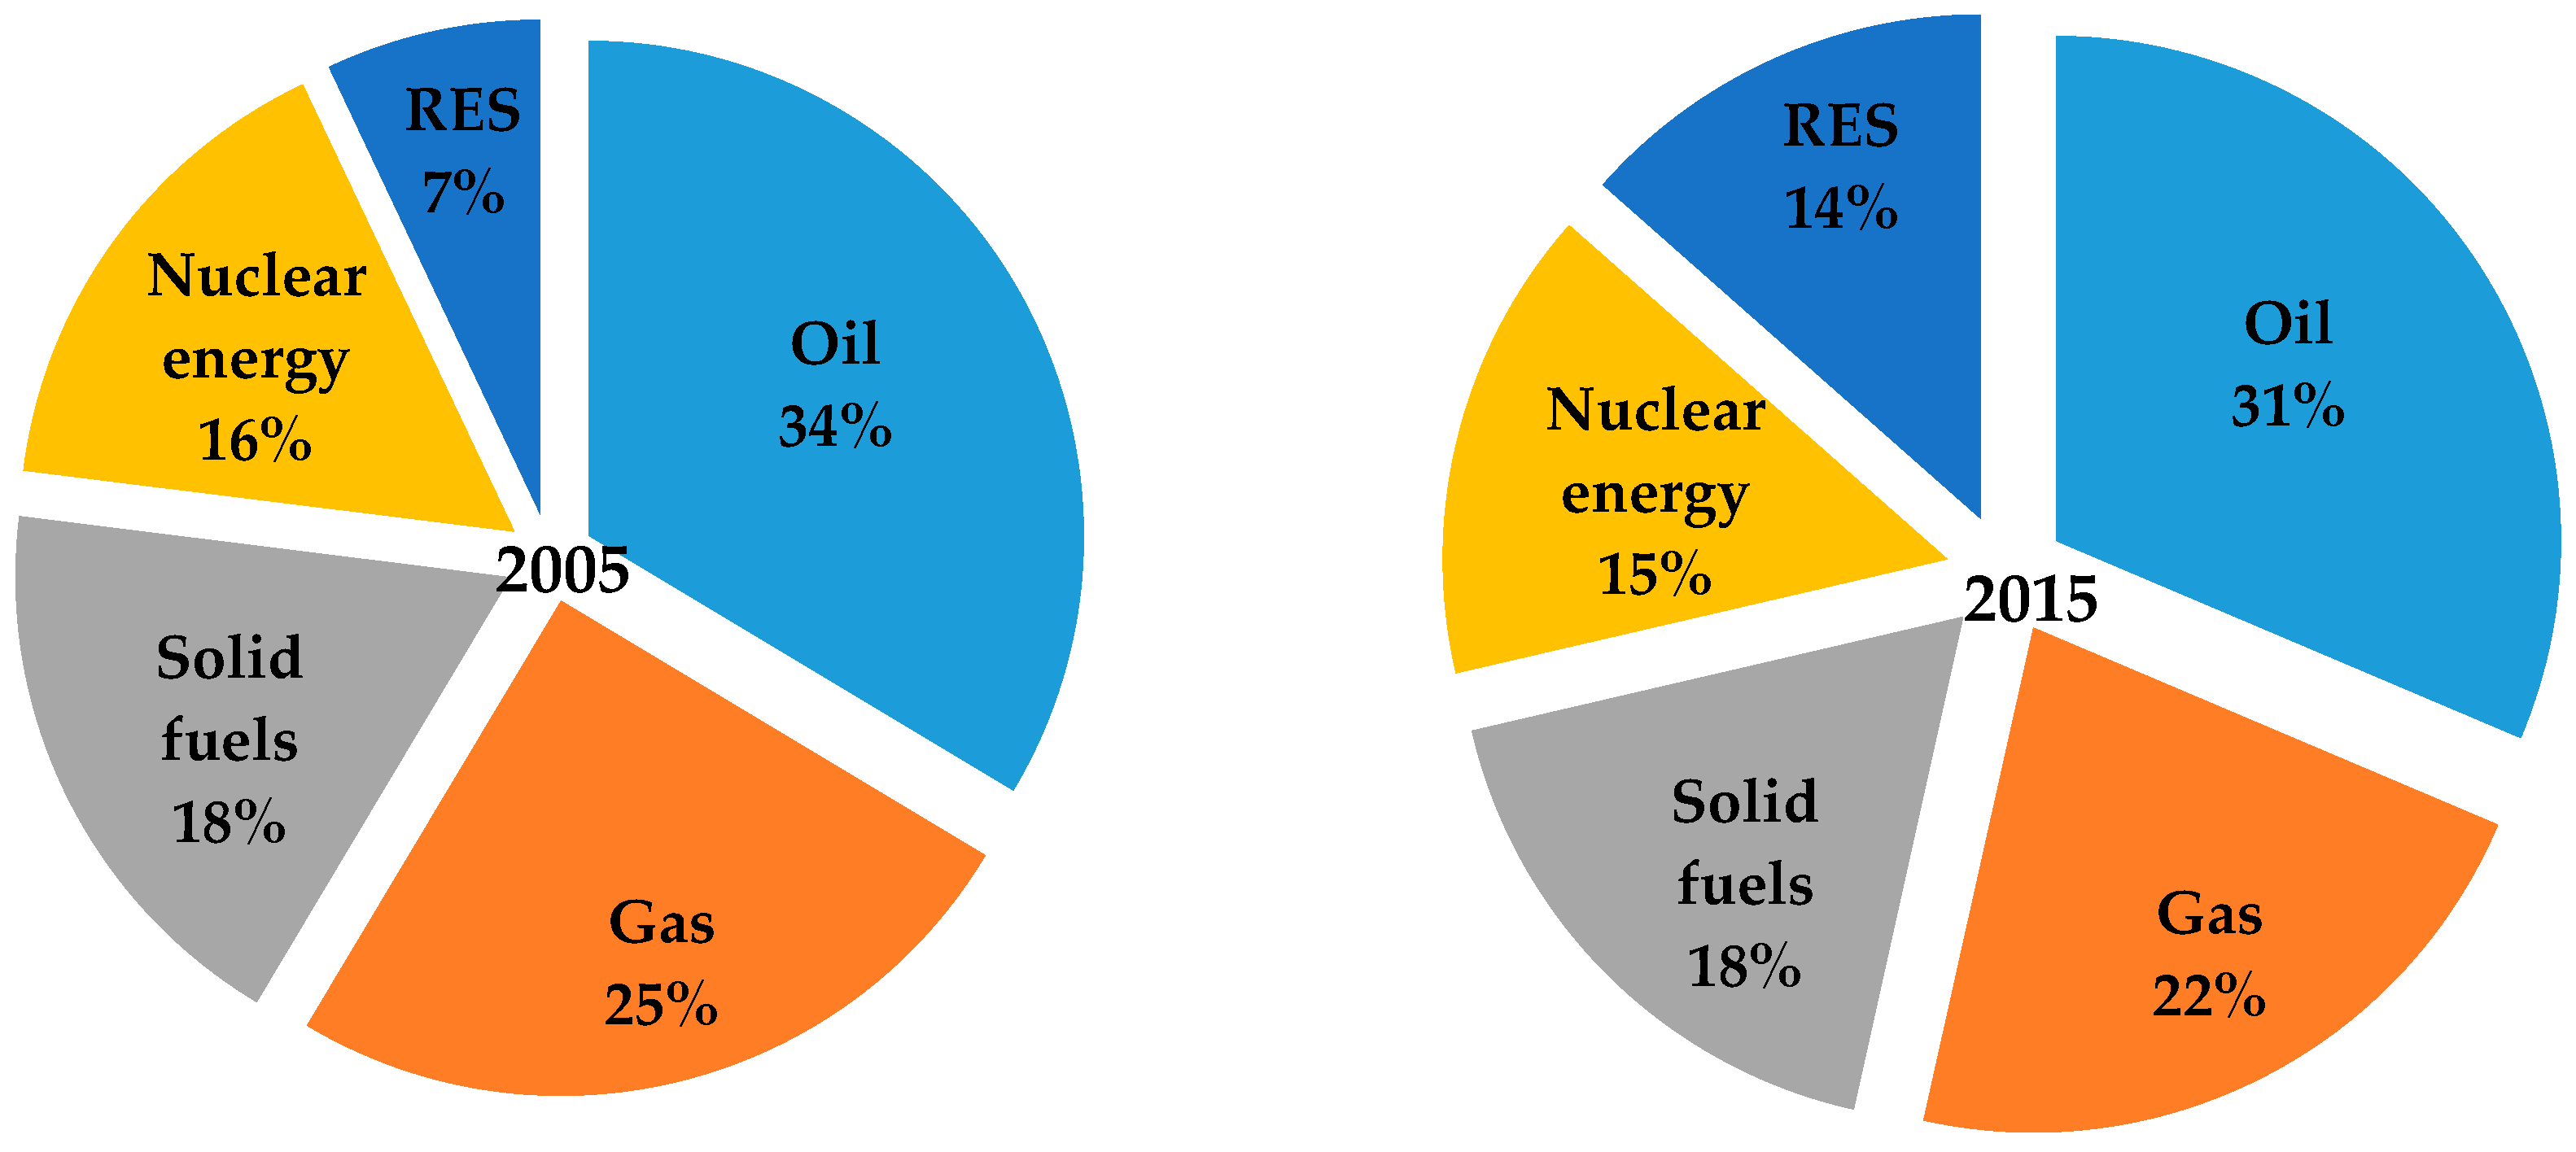
The energy consumption looks different in the EU28 compared with the rest of the world, where a decrease of primary energy consumption was recorded, from 1819 Mtoe in 2005 to 1627 Mtoe in 2015 (a decrease of about 11% within the studied interval) [1]. This decrease was due to a myriad of factors associated with the economic crisis and a decrease in consumption, an increase of share of RES in energy products (mainly hydro, solar and wind) and efficiency improvements. The primary consumption by fuel still shows a domination of the fossil fuels, with 77% of fossil fuels in the primary energy mix of 2005 and 71% in the primary energy mix of 2015. However, the RES share increased from 7% in 2005, to 14% in 2015, recording a doubling in only 11 years (see Figure 1).
The final energy consumption decreased as well through the EU space during 2005–2015 interval. The Renewable Energy Directive [7] established the national targets for RES in final energy consumption for all member states of the EU and the countries have committed to achieve their own targets until 2020. The targets were set depending on the countries’ specificities and range from 49% shares of RES in final energy consumption in Sweden to 10% shares of RES in final energy consumption in Malta. The share of RES in the final energy consumption rose in the entire EU, some of the countries already over passing their national targets of 2020 (see Table 2). However, the low performace in RES development of some countries should not be confused with their technical efficiency [21].
Major EU economies like France, Netherlands, United Kingdom, Spain and Germany did not meet their targets and are still far from the 2020 target. The countries from Eastern Bloc of the EU already surpassed or are very close to their own targets. Therefore, in order to identify the best practices, the next part is focused on the Easter Bloc of the EU and the countries’ performances are judged against each other.
3. Methods
Despite the fact that some countries have surpassed their own targets, the overall RES development should be better captured for each country. To this end, an architecture based on two components has been developed, each component resting on three factors (2 × 3) (see Table 3). The first component is referring to the efforts of the national Governments to support, with consistency and firmness, the deployment of RES, whereas the second one refers to the registered outcomes, in terms of energy.
Component 1: the efforts put in renewable energy development at national level, based on:
Factor 1 (FRT): measuring the development of RES in transport, by considering data available on share of RES consumption in transportation [23];
Factor 2 (FRE): measuring the development of RES in electrical energy, by considering data available on share of RES consumption in electricity [24];
Factor 3 (FET): measuring the legislative effort to diminish unsustainable products and practices by considering data available on environmental taxes [25];
Component 2: the registered outcomes at national level, based on:
Factor 4 (FED): the increase in energy security by considering data available on energy dependence [26];
Factor 5 (FEI): the increase of the efficiency of economy by considering the data available on energy intensity of the economy [27];
Factor 6 (FGE): the increase of environmental parameters by considering the data available on GHG emissions/capita [28].
A methodology is introduced to identify a new indicative index of renewable energy development (IRED). The IRED is determined by a methodology that aims to be easily used and understood by interested users in energy field and policymakers, with a focus set on RES development. The IRED is computed based on a selection of 11 countries from Eastern EU (Bulgaria, Croatia, Czech Republic, Estonia, Hungary, Latvia, Lithuania, Poland, Romania, Slovakia and Slovenia), for the interval 2005–2015.
Step 1: data selection and data validation from dedicated databases of all factors (FRT, FRE, FET, FED, FEI and FGE). Only data for the first and last year of the analysis (2005 and 2015) are presented.
Step 2: data normalization using utilities theory [29], given the fact that the data are different in units. Each factor was transposed into a utility, considering that three factors (FRT FRE and FED) require maximum condition, while other three (FED, FGE and FEI) require minimum condition:
- max: Uhj = (aij − ajmin)/(ajmax − ajmin), 0 < Uij < 1 (1 for the best, 0 for the worst)
- min: Ugj = (ajmax − aij)/(ajmax − ajmin), 0 < Uij < 1 (1 for the best, 0 for the worst)i is for the countries (e.g., i = 1 for Bulgaria) and j is for the factors (e.g., j = 1 for FRT in 2005).
where U stands for the utility of a given factor, i the number of values for each factor (i = 11) and j are the factors for 2005 and 2015 (j = 12) (for instance, U11 represents the utility of FRT for 2005 for Bulgaria, U12 represents the utility for FRT for 2015 for Bulgaria, U21 the utility for FRE for 2005 for Czech Republic and U22 is the utility for 2015 for Czech Republic, etc.).
Step 3: construction of IRED, based on the normalized factors previously identified, taking into consideration that the components have the same importance and the factors have the same weight: IRED = (FRT + FRE + FED + FED + FEI + FGE)/6.
Step 4: country ranking based on IRED and selection of appropriate groups.
Group I: IRED > 0.60; Group II: 0.45 < IRED < 0.60; Group III: IRED < 0.45.
4. Results
The analysis of the six factors reveals a complex picture in country focus group. The actual values of the factors are given in Table 4.
The values for factor 1 (share of renewable energy in fuel consumption of transport) varied from 2.4% in Latvia (best) and 0.2% in Estonia (worst) in 2005, whereas in 2015, the values increased to 8.5% in Slovakia (best) and 0.4% in Estonia (worst).
The values for factor 2 (share of electricity generated from renewable sources) varied largely across the Eastern Bloc of the EU, from 43% in Latvia (best) and 1.1% in Estonia (worst) in 2005 to 52.5% in Latvia (best) and 7.3% in Hungary (worst) for 2015.
The values for factor 3 (total environmental taxes) varied from 3.9% in Croatia (best) and 1.9% in Romania (worst) in 2005 to 4.1% in Croatia (best) and 1.8% in Slovakia (worst) in 2015.
The values for factor 4 (energy dependence for all fuels) varied largely across the Eastern Bloc of the EU, from 17.2% in Poland (best) and 65.3% in Slovakia (worst) in 2005 to 7.5% in Estonia (best) and 78.4% in Lithuania (worst) in 2015.
The values for factor 5 (gross inland consumption of energy/GDP) varied from 220.2 kg of oil equivalent/1000 EUR in Slovenia (best) and 614.0 kg of oil equivalent/1000 EUR in Bulgaria (worst) in 2005 to 177.9 kg of oil equivalent/1000 EUR in Slovenia (best) and 448.5 kg of oil equivalent/1000 EUR in Bulgaria (worst) in 2015.
The values for factor 6 (GHG emissions/capita) varied largely across the Eastern Bloc of the EU, from 5.1 tons of CO2 equivalent/capita in Latvia (best) and 14.57 tons of CO2 equivalent/capita in Czech Republic (worst) in 2005 to 5.7 tons of CO2 equivalent/capita in Croatia (best) and 13.8 tons of CO2 equivalent/capita in Estonia (worst) in 2015.
The utilities of the six factors were calculated as presented in step 2 of the methodology and are shown in Table 5. The values vary from 1 (the best in each category) to 0 (the worst in each category).
The utilities allowed the finding of IRED for each country for 2005 and 2015, respectively, as presented by step 3 of the methodology. Table 6 contains the values of IRED for the 11 countries belonging to the Easter Bloc of the EU, ranked from best to worst, for 2005 and 2015 respectively. During the analyzed interval only two countries regressed as absolute values and ranking, namely Latvia and Poland.
5. Discussion
IRED is a composite index being represented by a mix of 2 × 3 factors which are mathematically linked to reveal a single number that reflects a large concept, namely renewable energy development in a given region, Eastern Bloc of the EU in this case. IRED allows the determination of the differences recorded across time and space in the domain of renewable energy development (11 years and 11 countries were considered). IRED was built to summarize the complexity of renewable energy development and to better interpret the progress/regress registered so far, in terms of countries’ efforts and outcomes. The analysis took into consideration the countries’ efforts within the current institutional framework.
The IRED is based on simple, transparent and accurate methodology, covering consistent data collection and offering an unambiguous communication to interested parties. Initially, the design of the IRED was much more complex, but the actual one based on two components, each with three factors, has been considered feasible, given the limited data accessibility. The data for all factors were available on reliable databases and the analysis took into consideration quantitative representation of all factors. At the same time, despite its apparent straightforwardness, IRED is comprehensive and captures the most important quantifiable efforts and outcomes recorded at national level. IRED offers the possibility to identify best performers in terms of renewable energy development, in order to improve the national future policy path by addressing the shortcomings and by replicating the best practices. However, IRED is not a perfect index, as the data were selected from relevant indicators that fitted the desired architecture, available for all countries and all studied years. Some indicators would have been more appropriate like Government interventions in energy market for efforts, and economy competitiveness for outcomes, but unfortunately the data were not available for all selected countries and all the desired years. The IRED was indented as a measure of progress in RES, therefore it does not contain the topic of heating and cooling because this is not sufficiently developed, as the contribution of RES in this sector continues to be very small, fossil fuels being responsible for 75% of all heating and cooling for EU [30]. However, the selected factors of each component suitably cover the intended outcomes and were available on reliable international databases.
Factor 1: RES shares in consumption in transport is a measure of the efforts put by a given country in diversifying the fuels for transport. In 2009, the Council of the EU established a common framework for promotion of RES [7] and set a target of 10% share of RES for energy consumption by transport to be achieved by 2020 by all member states. The 10% target for biofuels in transport continues to be a topic of controversy, as present biofuels interfere with food chain and have negative effects on the environment. Therefore, this target was considered to be achieved, in the near future, through the support of sustainable biofuels represented by the second generation of biofuels derived from non-crop material (organic waste). FRT contains the actual shares of RES in energy consumed by transport, for 2005 and 2015 in the countries of the selected focus. In 2005, the country with the best efforts was Latvia with 2.4% share of RES in fuel consumption of transport. However, during the studied interval, the shares modified substantially and Slovakia was first in 2015 with 8.5% share of RES in fuel consumption of transport, approaching the target of 10% for 2020. These values reflect the efforts put in development of RES in transport in 2005 and 2015 and the best performers in terms of factor 1 were Latvia and Slovakia, respectfully, while the worst was Estonia for both years.
Factor 2: RES shares in consumption in electrical energy is a measure of the efforts put by a given country in diversifying the fuels for the generation of electrical energy. FRE contains actual shares of RES in the production of electricity, for 2005 and 2015 in the selected countries. Both in 2005 and 2015 Latvia showed the best results, registering 43% and 52.2% shares of RES in the production of electricity, respectively. The worst performers were Estonia in 2005 and Hungary in 2015.
Factor 3: environmental taxes as a share of GDP show the legislative effort of the selected countries to diminish unsustainable products and practices, as they represent an expression of a confirmed, harmful effect on the environment. This factor contains the revenues obtained by selected countries by applying the taxes on energy, transport, pollution and resources. Governments’ interventions are needed for the limitation of the energy effects on the environment. Yet, the design of the environmental taxes, which is made by the policy makers by enforcing energy and environmental legislation, is essential for the overall success of the environment protection. Therefore, the environmental tax was considered as it is also seen as a provider of a larger range of abatement choices than other regulations, especially for energy products. This factor was considered best to portray the Government interventions in the energy market, because a complete dataset on Government interventions in energy market is lacking [31]. The leading country for both 2005 and 2015 was Croatia with 3.9% and 4.1% revenues in GDP coming from environmental taxes, respectively. The worst performer in 2005 was Romania, but the situation improved for this country and in 2015 Slovakia was the worst performer.
Factor 4: energy dependence of all products represents an outcome of the countries’ involvement in energy security by diversifying the energy mix and a more efficient use of energy. The decline of energy dependence of the selected countries might be generally relied with RES development and more efficient use of energy, as there were neither alternative routes for fossil fuels nor new exploited reserves. The best results were obtained by Poland in 2005 and Estonia in 2015. However, the Estonia case is an exception, as the country is a major exploiter of oil shale [6], this being the reason of its lowest energy dependence from the Eastern Bloc, but with significant problems relating with GHG emissions and energy intensity. The worst performer in 2005 was Slovakia, but the situation improved for this country and worsened for Lithuania which was the worst performer in 2015.
Factor 5: energy intensity measures the quantity of energy (gross energy consumption of a given country for all energy sources: fossil fuels and RES) needed to produce a unit of GDP (measured in kg of oil equivalent/1000 EUR). A decline in energy intensity of a given country may be linked with the outcomes of the efforts put in energy efficiency programs or due to development of RES technologies. However, regardless of the reason, generally speaking the smaller the energy intensity is, the more efficient the economy becomes. Slovenia was a leader, both on 2005 and 2015, recording the smallest vales of the energy intensity from the Eastern EU Bloc. The worst performer for both 2005 and 2015 was Bulgaria.
Factor 6: anthropogenic GHG emissions were considered as an important outcome of the use of energy products on environment. GHG contain CO2, CH4, N2O, SF6, NF3, hydrofluorocarbons (HFCs) and perfluorocarbons (PFCs) from all sectors of the economy, expressed as tons of CO2/capita. This factor was used as it is a resource efficiency indicator and it was considered to reflect the deployment of RES and an increased efficiency in the use of the energy resources. The EU has as target for GHG emissions a drop by 20% by 2020 and by 30% by 2030 (compared with the levels of 1990). In 2005 the leading country was Latvia, whereas in 2015 the best values were registered by Croatia. The worst performers were Czech Republic in 2005 and Estonia in 2015.
In terms of IRED, the overall situation improved for the countries belonging to the Eastern Bloc of the EU in the last 11 years. The number of countries belonging to Group III decreased from six in 2005 to three in 2015. However, during the 2005–2015 interval most of the countries progressed, but some of them regressed, as Poland. The IRED allows splitting of countries from the Eastern Bloc of the EU in three groups:
Group I: IRED > 0.60: Leaders—countries that score best for composite IRED, with necessary and sufficient efforts put in developing RES and with significant outcomes. In 2005, only two countries were qualified in this group, Croatia and Latvia, whereas in 2015 four countries increased their performance, Croatia, Romania, Latvia and Slovenia. Latvia had a problem with energy security, having an energy dependence of almost 64% in 2005, being mostly dependent on gas from Russia. Therefore, in 2013 a new energy strategy was enforced to stimulate the energy efficiency plans and investments in RES [32] and the result was an improvement in its energy dependence, from 64% in 2005 to 51% in 2015.
Group II: 0.45 < IRED < 0.60: Followers—countries that put necessary, but not sufficient effort to develop RES. In 2005 three countries were in this group, Romania, Slovenia and Poland, whereas in 2015 the situation improved for the first two countries, but worsened for Poland which was still in this group, but lost a position in ranking. Other three countries improved and moved in 2015 from the third group to this one, Slovakia, Hungary and Bulgaria.
Group III: IRED < 0.45: In progress—countries with insufficient efforts to develop RES. Overall the Eastern Bloc the situation improved from six countries in 2005 (Estonia, Lithuania, Czech Republic, Hungary, Slovakia and Bulgaria) to only three in 2015 (Estonia, Lithuania, Czech Republic). Both Czech Republic and Lithuania lost a position in the ranking.
IRED might be applied to better understand the needed efforts required by different countries in their quest towards energy security, efficient energy use, and emissions control, as it considers factors with the same weight about energy dependence, RES shares, energy intensity and GHG emissions. Also it might lead to the identification of best practices which could be spread throughout EU and might contribute to the more rigorous development of policymaking in the energy area. Despite the fact that most countries from Eastern Bloc of the EU registered progress in RES consumption, IRED allowed the fine distinction among countries from the Eastern Bloc of the EU with real effort put in developing modern RES, like Croatia, Romania, Latvia and Slovenia and countries that are still in progress to address RES situation like Czech Republic, Lithuania and Estonia.
All the setbacks can be addressed by improving the policymaking in energy sector in every country, which should better respond to the identified bottlenecks, especially for the countries belonging to Group III. Estonia ranked last for both 2005 and 2015 and this was mainly due to inefficiency of the transport and industry sectors which leads to large GHG emissions and large energy intensities. Regardless of the fact that Estonia had the lowest energy dependence, this was not due to the policy measures to support RES, but rather to the development of the oil shale industry. The Estonia case comes as a proof of sound application of the IRED, as despite a positive effect, the country ranking portrays the actual situation. Therefore, Estonia has to place an emphasis on the efficiency of transport and industrial sectors in order to improve both energy production and GHG emissions. Moreover, the Estonian regulatory system was not fully adapted to the RES development, and some retroactive changes in the regulatory system stopped the growth of RES [33]. Lithuania has to develop policies to solve its energy dependence problem and this topic is the main goal to be achieved by 2020, as revealed by its National Energy Strategy [34]. Moreover, Lithuania was relying on nuclear energy, but in 2009 the nuclear facilities were shut down and the country was dependent on imports from Russia. Therefore, the Lithuanian Government is more focused on energy security rather than RES development and further plans investments in LNG technology [6]. Furthermore, Lithuania has regulations about RES that do not encourage their development [35]. The achieved target of the Czech Republic looks fine, but this was achieved by a so called “solar boom” and illicit operating licenses for solar plants in Czech Republic in 2010 [36]. Czech Republic has important investments in nuclear energy and plans its further development instead of a more aggressive RES development, the plan being to produce 50% of the electrical energy from nuclear power by 2040 [6].
The main bottlenecks identified by IRED are consistent with the actual challenges of the analysed countries and prove that IRED might be used as strong tool to fostering policies in energy sector, especially for Group III of countries. IRED, as previously pointed out, has some limitations, especially related with data availability, but it may provide important insights into finding the weak and strong points of a certain country and identifying specific remedial measures. Moreover, the limitations of this analysis derived from data availability, data transparency about Governments’ interventions on the energy market, and questionable targets revealed the need of profound changes in energy domain. The need of an institutional change, consistent and transparent policy efforts of all the nations from the EU, and realistic and sustainable targets set by EU decisions are the prerequisites of a decarbonised, yet safe and rational European energy path. Furthermore, the European decisions should be adapted to the requirements of a sustained use of energy products, therefore the 10% target on biofuels has to be more specific and aimed at sustainable biofuels, based on second generation (organic waste) and even third generation of biofuels (organic solar cells). The findings of this research should be considered by policy makers whom will be able to enact better policies translated from research based evidence.
It is important to point out that the situation the Eastern Bloc of the EU, regardless of the individual setbacks, is better than in the rest of the EU, where major economies are still behind the targets. The research based on IRED will continue and IRED will be further assessed for EU28 energy market and global energy market in an effort to reveal the best practices which can be replicated by other countries.
6. Conclusions
RES play an important part in the transition to clean energy and the European energy landscape needs a better identification of safe and rational approaches to develop better energy policies. The pace of substituting fossil fuels should be fostered for all forms of RES utilisation, regardless of the lower commodity prices from the present. Moreover, the new discovered resources based on oil shale and shale gas should not be seen as keys towards a sustainable energy security, as they are insufficient and will be rapidly exhausted [37]. The potential for the RES development is not yet fully unlocked and, regardless of the achieved targets for 2020 for some European countries, the national efforts should be intensified to meet longer-term targets of 2030 [38] and 2050 [39]. Until a real European Energy Union will be setting in, that is very difficult to achieve in the current and foreseen conditions, the national policy solution will remain the main actor in achieving a decarbonised economy of the future. The future clean energy revolution of the EU needs a deep exploring of what is safe and rational in energy development for each member state of the EU, with a more focus set on smart energy interconnections and innovation. Moreover, the policy efforts should be more focused on the institutional change to free the economies from carbon locks-in [40,41] in order to progress to a real decarbonisation.
Peter Drucker said that “what gets measured, gets managed” and therefore gets improved. Having this saying in mind, this paper tried to measure the development of renewable energy in the Easter Bloc of the EU, by employing a specific, straightforward and comprehensible index to show the way to a proper energy management and to identify the best practices to improve the actual situation. The focus has been set on the efforts made by countries and their outcomes in order to identify the best practices, which can be easily replicated by other countries.
The findings of this paper allow the proper identification of best and worst performers in terms of RES development in Eastern European Bloc. The proper studying of the measures taken by each country, judged against its own energy endowment and potential, may further conduct to the identification of a set of best practices required to sustainable develop the energy sector in each country. This in turn, may lead to the identification of the measures needed to prevent unsustainable practices in terms of the management of the energy sector and may offer solutions to policymakers to acquire a more rigorous solution for clean, but rational and safe energy development.
Acknowledgments
I am grateful to anonymous reviewers for their pertinent recommendations and for helping me improve the manuscript.
Conflicts of Interest
The author declares no conflict of interest.
References
- British Petroleum (BP). BP Statistical Report of World Energy, June 2017. Available online: https://www.bp.com/content/dam/bp/en/corporate/pdf/energy-economics/statistical-review-2017/bp-statistical-review-of-world-energy-2017-full-report.pdf (accessed on 10 September 2017).
- World Bank, Online Database. Fossil Fuel Energy Consumption. Code: EG.USE.COMM.FO.ZS. 2017. Available online: https://data.worldbank.org/indicator/EG.USE.COMM.FO.ZS (accessed on 20 September 2017).
- McCrone, A. (Ed.) Global Trends in Renewable Energy Investments; United Nations Environment Programme (UNEP), Frankfurt School-UNEP Collaborating Centre, Bloomberg New Energy Finance: Frankfurt, Germany, 2017; Available online: http://www.fs-unep-centre.org (accessed on 20 September 2017).
- WilderHill New Energy Global Innovation Index. Available online: http://www.nexindex.com/ (accessed on 1 October 2017).
- Jordan, P. Solar Energy Markets—An Analysis of the Global Solar Industry, 1st ed.; Elsevier: London, UK, 2013; ISBN 9780123977687. [Google Scholar]
- World Energy Council. World Energy Resources 2016; World Energy Council: London, UK, 2016; ISBN 9780946121588. [Google Scholar]
- European Union. Directive 2009/28/EC on the Promotion of the Use of Energy from Renewable Sources and Amending and Subsequently Repealing Directives 2001/77/EC and 2003/30/EC. Off. J. Eur. Union 2009, 11, 39–85. [Google Scholar]
- European Commission. Proposal for a Directive of the European Parliament and of the Council on the Promotion of the Use of Energy from Renewable Sources; COM/2016/0767 Final/2—2016/0382 (COD); European Commission: Brussels, Belgium, 2017. [Google Scholar]
- Eurostat, Online Database. Share of Renewable Energy in Gross Final Energy Consumption. Code: t2020_31. 2017. Available online: http://ec.europa.eu/eurostat/web/products-datasets/-/t2020_31&lang=en (accessed on 10 October 2017).
- International Atomic Energy Agency (IAEA). Energy Indicators for Sustainable Development: Guidelines and Methodologies; International Atomic Energy Agency: Vienna, Austria, 2005; ISBN 9201162049. [Google Scholar]
- Hsu, A. (Ed.) Environmental Performance Index; Yale University: New Haven, CT, USA, 2016; Available online: www.epi.yale.edu (accessed on 20 October 2017).
- Nussbaumer, P.; Bazilian, M.; Modi, V.; Yumkella, K. Measuring Energy Poverty: Focusing on What Matters; Working Paper No. 42; Oxford Poverty & Human Development Initiative: Oxford, UK, 2011. [Google Scholar]
- Iddrisu, I.; Bhattacharyya, S. Sustainable Energy Development Index: A multi-dimensional indicator for measuring sustainable energy development. Renew. Sustain. Energy Rev. 2015, 50, 513–530. [Google Scholar] [CrossRef] [Green Version]
- Culver, L. Energy poverty: What you measure matters. In Proceedings of the Reducing Energy Poverty with Natural Gas: Changing Political, Business and Technology Paradigms Symposium, Stanford, CA, USA, 9–10 May 2017. [Google Scholar]
- Markand, J.; Raven, R.; Truffer, B. Sustainability transitions: An emerging field of research and its prospects. Res. Policy 2012, 41, 955–967. [Google Scholar] [CrossRef]
- Kuzemko, C.; Lockwood, M.; Mitchell, C.; Hoggett, R. Governing for sustainable energy system change: Politics, contexts and contingency. Energy Res. Soc. Sci. 2016, 12, 96–105. [Google Scholar] [CrossRef]
- Eurostat, Statistics Explained. Energy Production and Imports. 2017. Available online: http://ec.europa.eu/eurostat/statistics-explained/index.php/Energy_production_and_imports (accessed on 20 October 2017).
- European Commission. Energy 2020—A Strategy for Competitive, Sustainable and Secure Energy; European Commission: Luxembourg, 2011; ISBN 9789279188695. [Google Scholar]
- Armeanu, D.S.; Vintila, G.; Gherghina, S.C. Does Renewable Energy Drive Sustainable Economic Growth? Multivariate Panel Data Evidence for EU-28 Countries. Energies 2017, 10, 381. [Google Scholar] [CrossRef]
- European Environment Agency (EEA). Indicator Assessment—Primary Energy Consumption by Fuel; European Environment Agency: Copenhagen, Denmark, 2017; Available online: https://www.eea.europa.eu/data-and-maps/indicators/primary-energy-consumption-by-fuel-6/assessment-1 (accessed on 20 October 2017).
- Menegaki, A.N. Growth and renewable energy in Europe: Benchmarking with data envelopment analysis. Renew. Energy 2013, 60, 363–369. [Google Scholar] [CrossRef]
- Eurostat, Online Database. Gross Inland Energy Consumption. Code: tsdcc320. Available online: http://ec.europa.eu/eurostat/web/products-datasets/-/tsdcc320 (accessed on 21 September 2017).
- Eurostat, Online Database. Share of Renewable Energy in Fuel Consumption of Transport. Code: tsdcc340. Available online: http://ec.europa.eu/eurostat/web/products-datasets/-/tsdcc340 (accessed on 21 September 2017).
- Eurostat, Online Database. Electricity Generated from Renewable Sources. Code: tsdcc330. Available online: http://ec.europa.eu/eurostat/web/products-datasets/-/tsdcc330 (accessed on 21 September 2017).
- Eurostat, Online Database. Environmental Tax Revenues. Code: env_ac_tax. Available online: http://ec.europa.eu/eurostat/web/products-datasets/-/env_ac_tax (accessed on 5 October 2017).
- Eurostat, Online Database. Energy Dependence. Code: tsdcc310. Available online: http://ec.europa.eu/eurostat/web/products-datasets/-/tsdcc310 (accessed on 29 September 2017).
- Eurostat, Online Database. Energy Intensity of the Economy. Code: tsdec360. Available online: http://ec.europa.eu/eurostat/web/products-datasets/-/tsdec360 (accessed on 5 October 2017).
- Eurostat, Online Database. Green House Gases Emissions/Capita. Code: t2020_rd300. Available online: http://ec.europa.eu/eurostat/web/products-datasets/-/t2020_rd300 (accessed on 5 October 2017).
- Momete, D.C. Building a sustainable healthcare model: A cross-country analysis. Sustainability 2016, 8, 836. [Google Scholar] [CrossRef]
- European Commission. Clean Energy for All. 2016. Available online: https://ec.europa.eu/energy/sites/ener/files/documents/technical_memo_renewables.pdf (accessed on 15 October 2017).
- Alberici, S.; Boeve, S.; van Breevoort, P.; Deng, Y.; Förster, S.; Gardiner, A.; van Gastel, V.; Grave, K.; Groenenberg, H.; de Jager, D.; et al. Subsidies and Costs of EU Energy; Ecofys, Project DESNL14583; European Commission: Brussels, Belgium; Utrecht, The Netherlands, 2014. [Google Scholar]
- Glavs, K.; Kudrenickis, I. Energy Efficiency Trends and Policies in Latvia; Institute of Physical Energetics: Riga, Latvia, 2016; Available online: http://www.odyssee-mure.eu/publications/national-reports/energy-efficiency-latvia.pdf (accessed on 28 October 2017).
- Tammist, R. Renewable Energy in Estonia; Estonian Renewable Energy Association: Tallinn, Estonia, 2013; Available online: http://www.sero.se/Filer/RIGA/Renewable%20Energy%20in%20Estonia_rene_tammist_Sept2013-12%20Kompatibilitetslge.pdf (accessed on 25 October 2017).
- Zane, E.B.; Brückmann, R.; Bauknecht, D. Integration of Electricity from Renewables to the Electricity Grid and to the Electricity Market, Lithuania—Country Report; RES Integration: Berlin, Germany, 2011; Available online: http://www.eclareon.com/sites/default/files/lithuania_-_res_integration_national_study.pdf (accessed on 25 October 2017).
- Jattautas, J.; Stasiukynas, A. Analysis of the Lithuanian renewable energy resources legal framework. Probl. Perspect. Manag. 2016, 14, 31–45. [Google Scholar]
- Denkova, A. Czech Support for Renewable Energy in Uncertain Situation; Euractiv: London, UK, 2016; Available online: www.euractiv.cz (accessed on 20 October 2017).
- European Commission. Energy Prices and Costs in Europe; COM(2016) 769—SWD(2016) 420 Final; European Commission: Brussels, Belgium, 2016. [Google Scholar]
- European Commission. A Policy Framework for Climate and Energy in the Period from 2020 to 2030; COM(2014) 15 Final; European Commission: Brussels, Belgium, 2014. [Google Scholar]
- European Commission. A Roadmap for Moving to a Competitive Low Carbon Economy in 2050; COM(2011) 112 Final; European Commission: Brussels, Belgium, 2011. [Google Scholar]
- Unruh, G. Understanding carbon lock-in. Energy Policy 2000, 28/12, 817–830. [Google Scholar] [CrossRef]
- Seto, K.; Davis, S.; Mitchell, R.; Stokes, E.; Unruh, G.; Ürge-Vorsatz, D. Carbon Lock-in: Types, Causes, and Policy Implications. Annu. Rev. Environ. Resour. 2016, 41, 425–452. [Google Scholar] [CrossRef]
Figure 1.
Primary energy consumption mix in EU28 in 2005 and 2015. Source: calculated from [20].
Figure 1.
Primary energy consumption mix in EU28 in 2005 and 2015. Source: calculated from [20].

Table 1.
Production and consumption of fossil fuels in EU28 over 2005–2015 interval.
| Production | ||||||||||||
| EU28 | 2005 | 2006 | 2007 | 2008 | 2009 | 2010 | 2011 | 2012 | 2013 | 2014 | 2015 | Growth Rate, % |
| Oil production, million tones | 127.2 | 116.1 | 114.2 | 106.6 | 100.0 | 93.6 | 81.7 | 73.0 | 68.5 | 67.3 | 71.9 | −76.96 |
| Natural gas production, Mtoe | 190.7 | 181.7 | 169.3 | 170.8 | 155.0 | 158.2 | 139.8 | 132.0 | 130.4 | 119.3 | 107.8 | −76.89 |
| Coal production, Mtoe | 198.0 | 193.2 | 187.0 | 178.9 | 167.9 | 165.7 | 168.5 | 168.1 | 157.3 | 150.6 | 144.6 | −36.96 |
| Production, all fossil fuels, Mtoe | 515.9 | 490.9 | 470.4 | 456.3 | 422.9 | 417.5 | 390.0 | 373.0 | 356.2 | 337.2 | 324.3 | −59.1 |
| Consumption | ||||||||||||
| EU28 | 2005 | 2006 | 2007 | 2008 | 2009 | 2010 | 2011 | 2012 | 2013 | 2014 | 2015 | Growth Rate, % |
| Oil consumption, million tones | 725.6 | 727.3 | 711.8 | 707.7 | 670.1 | 665.0 | 644.5 | 618.8 | 601.7 | 590.8 | 600.6 | −20.83 |
| Natural gas consumption, Mtoe | 446.8 | 441.1 | 434.7 | 445.4 | 416.5 | 448.1 | 404.7 | 394.7 | 388.1 | 344.7 | 359.2 | −24.37 |
| Coal consumption, Mtoe | 316.5 | 327.2 | 328.4 | 303.6 | 267.4 | 280.2 | 288.1 | 294.3 | 288.0 | 268.4 | 261.1 | −21.21 |
| Consumption, all fossil fuels, Mtoe | 1488.9 | 1495.6 | 1474.8 | 1456.7 | 1353.9 | 1393.3 | 1337.3 | 1307.8 | 1277.8 | 1203.9 | 1220.9 | −21.95 |
Source: calculated from [1].
Table 2.
Gross final energy consumption and shares of RES in gross final energy consumption.
| Country | Gross Final Energy Consumption 1000 Toe (2005) | RES Share in Final Energy Consumption % (2005) | Gross Final Energy Consumption 1000 Toe (2015) | RES Share in Final Energy Consumption % (2015) | Target for 2020 | Achieved |
|---|---|---|---|---|---|---|
| Belgium | 59,061 | 2.3 | 54,217 | 7.9 | 13 | NO, way behind |
| Bulgaria | 19,754 | 9.4 | 18,511 | 18.2 | 16 | YES |
| Czech Republic | 45,425 | 7.1 | 42,442 | 15.1 | 13 | YES |
| Denmark | 19,556 | 16 | 16,766 | 30.8 | 30 | YES |
| Germany | 341,925 | 6.7 | 314,203 | 14.6 | 18 | NO |
| Estonia | 5615 | 17.5 | 6255 | 28.6 | 25 | YES |
| Ireland | 15,265 | 2.9 | 14,178 | 9.2 | 16 | NO, way behind |
| Greece | 31,410 | 7 | 24,449 | 15.4 | 18 | NO |
| Spain | 144,223 | 8.4 | 121,418 | 16.2 | 20 | NO |
| France | 276,382 | 9.5 | 252,615 | 15.2 | 23 | NO, way behind |
| Croatia | 9782 | 23.8 | 8525 | 29 | 20 | YES |
| Italy | 190,081 | 7.5 | 156,169 | 17.5 | 17 | YES |
| Cyprus | 2539 | 3.1 | 2272 | 9.4 | 13 | NO |
| Latvia | 4592 | 32.3 | 4380 | 37.6 | 40 | NO |
| Lithuania | 8711 | 16.8 | 6913 | 25.8 | 23 | YES |
| Luxembourg | 4800 | 1.4 | 4177 | 5 | 11 | NO, way behind |
| Hungary | 27,612 | 4.5 | 25,200 | 14.5 | 13 | YES |
| Malta | 972 | 0.2 | 756 | 5 | 10 | NO, way behind |
| Netherlands | 84,106 | 2.5 | 77,557 | 5.8 | 14 | NO, way behind |
| Austria | 34,128 | 23.9 | 33,250 | 33 | 34 | NO |
| Poland | 92,223 | 6.9 | 95,434 | 11.8 | 15 | NO |
| Portugal | 27,475 | 19.5 | 22,997 | 28 | 31 | NO |
| Romania | 39,206 | 17.3 | 32,414 | 24.8 | 24 | YES |
| Slovenia | 7325 | 16 | 6579 | 22 | 25 | NO |
| Slovakia | 19,029 | 6.4 | 16,426 | 12.9 | 14 | NO |
| Finland | 34,503 | 28.8 | 33,155 | 39.3 | 38 | YES |
| Sweden | 50,993 | 40.6 | 45,474 | 53.9 | 49 | YES |
| United Kingdom | 234,172 | 1.3 | 190,745 | 8.2 | 15 | NO |
Table 3.
Components and factors of energy model architecture.
| Component | Factor | Actual Data | Unit |
|---|---|---|---|
| Efforts | Factor 1 FRT: measuring the development of RES in transport | Share of renewable energy in fuel consumption of transport | percentage |
| Factor 2 FRE: measuring the development of RES in electrical energy | Share of electricity generated from renewable sources | percentage | |
| Factor 3 FET: measuring the legislative effort to diminish unsustainable practice | Total environmental taxes | percentage of gross domestic product (GDP) | |
| Outcomes | Factor 4 FED: the increase of the energy security | Energy dependence for all fuels | percentage |
| Factor 5 FEI: the increase of the efficiency of economy | Gross inland consumption of energy divided by GDP | kg of oil equivalent per 1000 EUR | |
| Factor 6 FGE: the increase of the environmental parameters | Greenhouse gas gases (GHG) emissions per capita | tons of CO2 equivalent per capita |
Table 4.
Factors for renewable energy development architecture.
| Country\Factor | FRT | FRE | FET | FED | FEI | FGE | ||||||
|---|---|---|---|---|---|---|---|---|---|---|---|---|
| Country\Time | 2005 | 2015 | 2005 | 2015 | 2005 | 2015 | 2005 | 2015 | 2005 | 2015 | 2005 | 2015 |
| Bulgaria | 0.8 | 6.5 | 9.3 | 19.1 | 2.9 | 2.9 | 46.7 | 35.4 | 614.0 | 448.5 | 8.4 | 8.6 |
| Czech Republic | 0.9 | 6.5 | 3.7 | 14.1 | 2.5 | 2.1 | 27.8 | 31.9 | 327.0 | 249.2 | 14.6 | 12.2 |
| Estonia | 0.2 | 0.4 | 1.1 | 15.1 | 2.3 | 2.8 | 26.1 | 7.4 | 373.9 | 355.1 | 14.2 | 13.8 |
| Croatia | 1.0 | 3.5 | 35.6 | 45.4 | 3.9 | 4.1 | 52.5 | 48.3 | 222.5 | 192.9 | 6.9 | 5.7 |
| Latvia | 2.4 | 3.9 | 43 | 52.2 | 2.5 | 2.7 | 63.9 | 51.2 | 251.9 | 207.5 | 5.1 | 5.7 |
| Lithuania | 0.6 | 4.6 | 3.8 | 15.5 | 2.3 | 1.8 | 56.8 | 78.4 | 329.5 | 205.4 | 6.9 | 6.9 |
| Hungary | 0.9 | 6.2 | 4.4 | 7.3 | 2.7 | 2.7 | 63.1 | 53.4 | 276.4 | 231.8 | 7.6 | 6.3 |
| Poland | 1.6 | 6.4 | 2.7 | 13.4 | 2.7 | 2.7 | 17.2 | 29.3 | 321.7 | 227.3 | 10.5 | 10.2 |
| Romania | 1.6 | 5.5 | 26.9 | 43.2 | 1.9 | 2.4 | 27.6 | 17.1 | 357.2 | 226.7 | 6.9 | 5.9 |
| Slovenia | 0.8 | 2.2 | 28.7 | 32.7 | 3.2 | 3.9 | 52.5 | 48.7 | 220.2 | 177.9 | 10.3 | 8.2 |
| Slovakia | 1.6 | 8.5 | 15.7 | 22.7 | 2.3 | 1.8 | 65.3 | 58.7 | 355.1 | 214.7 | 9.6 | 7.6 |
Table 5.
Utilities of the factors of renewable energy development architecture.
| Country\Utility | U FRT | U FRE | U FET | U FED | U FEI | U FGE | ||||||
|---|---|---|---|---|---|---|---|---|---|---|---|---|
| Country\Time | 2005 | 2015 | 2005 | 2015 | 2005 | 2015 | 2005 | 2015 | 2005 | 2015 | 2005 | 2015 |
| Bulgaria | 0.27 | 0.75 | 0.20 | 0.26 | 0.50 | 0.48 | 0.39 | 0.61 | 0 | 0 | 0.66 | 0.64 |
| Czech Republic | 0.32 | 0.75 | 0.06 | 0.15 | 0.27 | 0.14 | 0.78 | 0.65 | 0.73 | 0.74 | 0 | 0.19 |
| Estonia | 0 | 0 | 0 | 0.17 | 0.16 | 0.42 | 0.81 | 1 | 0.61 | 0.35 | 0.04 | 0 |
| Croatia | 0.36 | 0.38 | 0.82 | 0.85 | 1 | 1 | 0.27 | 0.42 | 0.99 | 0.94 | 0.82 | 1 |
| Latvia | 1 | 0.43 | 1 | 1 | 0.29 | 0.4 | 0.03 | 0.38 | 0.92 | 0.89 | 1 | 0.97 |
| Lithuania | 0.18 | 0.52 | 0.06 | 0.18 | 0.17 | 0.02 | 0.18 | 0 | 0.72 | 0.90 | 0.81 | 0.84 |
| Hungary | 0.32 | 0.72 | 0.08 | 0 | 0.41 | 0.38 | 0.05 | 0.35 | 0.86 | 0.80 | 0.74 | 0.93 |
| Poland | 0.64 | 0.74 | 0.04 | 0.14 | 0.37 | 0.38 | 1 | 0.69 | 0.74 | 0.82 | 0.43 | 0.44 |
| Romania | 0.64 | 0.63 | 0.62 | 0.80 | 0 | 0.28 | 0.78 | 0.86 | 0.65 | 0.82 | 0.81 | 0.97 |
| Slovenia | 0.27 | 0.22 | 0.66 | 0.57 | 0.63 | 0.92 | 0.27 | 0.42 | 1 | 1 | 0.45 | 0.69 |
| Slovakia | 0.64 | 1 | 0.35 | 0.34 | 0.19 | 0 | 0 | 0.28 | 0.66 | 0.86 | 0.53 | 0.76 |
Table 6.
Country ranking in 2005 and 2015 according to IRED.
| Rank | CountryTime | 2005 | Rank (Previous Rank) | CountryTime | 2015 | Group of Countries |
|---|---|---|---|---|---|---|
| 1 | Croatia | 0.710 | 1 | Croatia | 0.765 | Group I IRED > 0.60 leaders |
| 2 | Latvia | 0.707 | 2 (3) | Romania | 0.727 | |
| 3 | Romania | 0.583 | 3 (2) | Latvia | 0.678 | |
| 4 | Slovenia | 0.547 | 4 | Slovenia | 0.637 | |
| 5 | Poland | 0.537 | 5 (7) | Slovakia | 0.540 | Group II 0.60 < IRED < 0.45 followers |
| 6 | Hungary | 0.410 | 6 (5) | Poland | 0.535 | |
| 7 | Slovakia | 0.395 | 7 (6) | Hungary | 0.530 | |
| 8 | Czech Republic | 0.360 | 8 (10) | Bulgaria | 0.457 | |
| 9 | Lithuania | 0.353 | 9 (8) | Czech Republic | 0.437 | Group III IRED < 0.45 in progress |
| 10 | Bulgaria | 0.337 | 10 (9) | Lithuania | 0.410 | |
| 11 | Estonia | 0.270 | 11 | Estonia | 0.323 |
© 2017 by the author. Licensee MDPI, Basel, Switzerland. This article is an open access article distributed under the terms and conditions of the Creative Commons Attribution (CC BY) license (http://creativecommons.org/licenses/by/4.0/).
Share and Cite
MDPI and ACS Style
Momete, D.C. Measuring Renewable Energy Development in the Eastern Bloc of the European Union. Energies 2017, 10, 2120. https://doi.org/10.3390/en10122120
AMA Style
Momete DC. Measuring Renewable Energy Development in the Eastern Bloc of the European Union. Energies. 2017; 10(12):2120. https://doi.org/10.3390/en10122120
Chicago/Turabian StyleMomete, Daniela Cristina. 2017. "Measuring Renewable Energy Development in the Eastern Bloc of the European Union" Energies 10, no. 12: 2120. https://doi.org/10.3390/en10122120
Note that from the first issue of 2016, this journal uses article numbers instead of page numbers. See further details here.