Article

Positioning and Imaging Detection of Corona Discharge in Air with Double Helix Acoustic Sensors Array

1
State Key Laboratory of Electrical Insulation and Power Equipment, Xi’an Jiaotong University, Xi’an 710049, China
2
Departamento de Ingeniería Eléctrica, Electrónica, Automática y Física Aplicada, Escuela Técnica Superior de Ingeniería y Diseño Industrial (ETSIDI), Universidad Politécnica de Madrid (UPM), Ronda de Valencia 3, 28012 Madrid, Spain
*
Author to whom correspondence should be addressed.
Energies 2017, 10(12), 2105; https://doi.org/10.3390/en10122105
Submission received: 12 September 2017 / Revised: 6 November 2017 / Accepted: 16 November 2017 / Published: 11 December 2017
(This article belongs to the Section F: Electrical Engineering)

Abstract

:
Corona discharge could be a serious hazard to the outdoor insulation of a high-voltage (HV) system and also is an important detection issue for insulation status diagnosis. In this study, a double-helix-ultrasonic-array (DHUA) sensor was developed for corona positioning, which showed a good sensitivity to the ultrasonic signal originating from corona discharge and a satisfied directional response in static beam patterns. Based on the matting-based image fusion method, the acoustic intensity matrix was fused to a visual scene in real-time. This ultrasonic visualization technology was then evaluated with a simulation test and performed in a real air insulated substation (AIS), and showed a satisfied performance in terms of sensitivity and spatial location resolution.

1. Introduction

Corona discharge, which occurs when the local electric field is high enough, is not only a significant cause of power loss in power transmission, but also a serious hazard to the outdoor insulation of a high-voltage (HV) power system. To prevent the insulation system of electrical equipment from corona discharge activity, the source of a corona discharge should be positioned in a timely and convenient way.
Some sensing technologies have been developed in recent years for partial discharge (PD) detection, such as ultra-high-frequency (UHF) electromagnetic (EM) wave detection, acoustic emission (AE) detection and ultra-violet (UV) imaging detection. The UHF method has been proven to be an effective tool in detecting PD occurring inside power equipment, especially in gas-insulated substations (GIS) [1,2] and power transformers [3,4]. However, UHF detection is strongly influenced by the EM noise distributed in the very high frequency (VHF) range (30–300 MHz), which is overlapped by the EM waves of corona in air [5,6]. UV imaging detection has been proven to be effective in positioning external corona [7], but it must be implemented in the sun blind region of the UV spectrum (200–280 nm), which increases the difficulty of optical coupling and its cost. In addition, UV cannot detect the discharge when there is confusion between the UV detection device and the discharge source. With the development of the piezoelectric sensing technique, acoustic sensors can be produced with high sensitivities, good anti-interference abilities as well as micro-scale packaging; these sensors have great potential in many applications, including PD detection [8,9,10,11]. The acoustic waves excited by corona discharge have frequencies of up to 300 kHz with strong directivities, and they can result in different responses from the sensors placed in various positions in a plane. The Azimuth angle and elevation angle of the PD position can be obtained by calculating the time-delay of signals from each sensor [12]. Based on this principle, the direction of the corona discharge source can be determined using a two-dimensional ultrasonic sensor array. The above concept drew on phased array technology used in the radar antenna field and has been gradually applied in PD detection since Luo and Li first used a 16 × 16 planar rectangle array sensor in the PD location [13,14,15,16]. So far, ultrasonic array sensors have been developed with different arrangements for the PD location, including an equality line [17], circular ring [18], and cross-shaped ultrasonic array [19,20,21], but most of them have been designed for coupling the acoustic signals caused by PD inside the equipment. To determine the external corona location in a more intuitive and efficient way, an idea of corona visualization is proposed, based on ultrasonic detection and image fusion technology, which essentially emphasizes not only the sensitivity and response of the ultrasonic sensor unit, but also the spatial resolution of the two-dimensional array arrangement.
In this study, a new ultrasonic sensor array was designed for signal frequencies of 20–80 kHz, with 31 micro-ultrasonic sensor units, aligned in a double-helix arrangement, to obtain a good acoustic performance of the half-power point bandwidth at 24.7°, with high-sensitivity and high-spatial resolution. In addition, image fusion technology was developed, to make the ultrasonic signal originating from corona source visible in a dynamic real-scene. In this paper, the principle and the algorithm of the positioning and imaging, based on an acoustic sensor array, are described in Section 2. Then, the arrangement of the sensor array is analyzed in Section 3. To evaluate the practical applications of our ultrasonic visualization technology, a simulation test for corona detection was carried out (Section 4). Then, a practical test was performed in a substation (Section 5). Finally, the conclusions drawn from the investigation are stated at the end in Section 6.

2. Acoustic Detection and Imaging Fusion Method

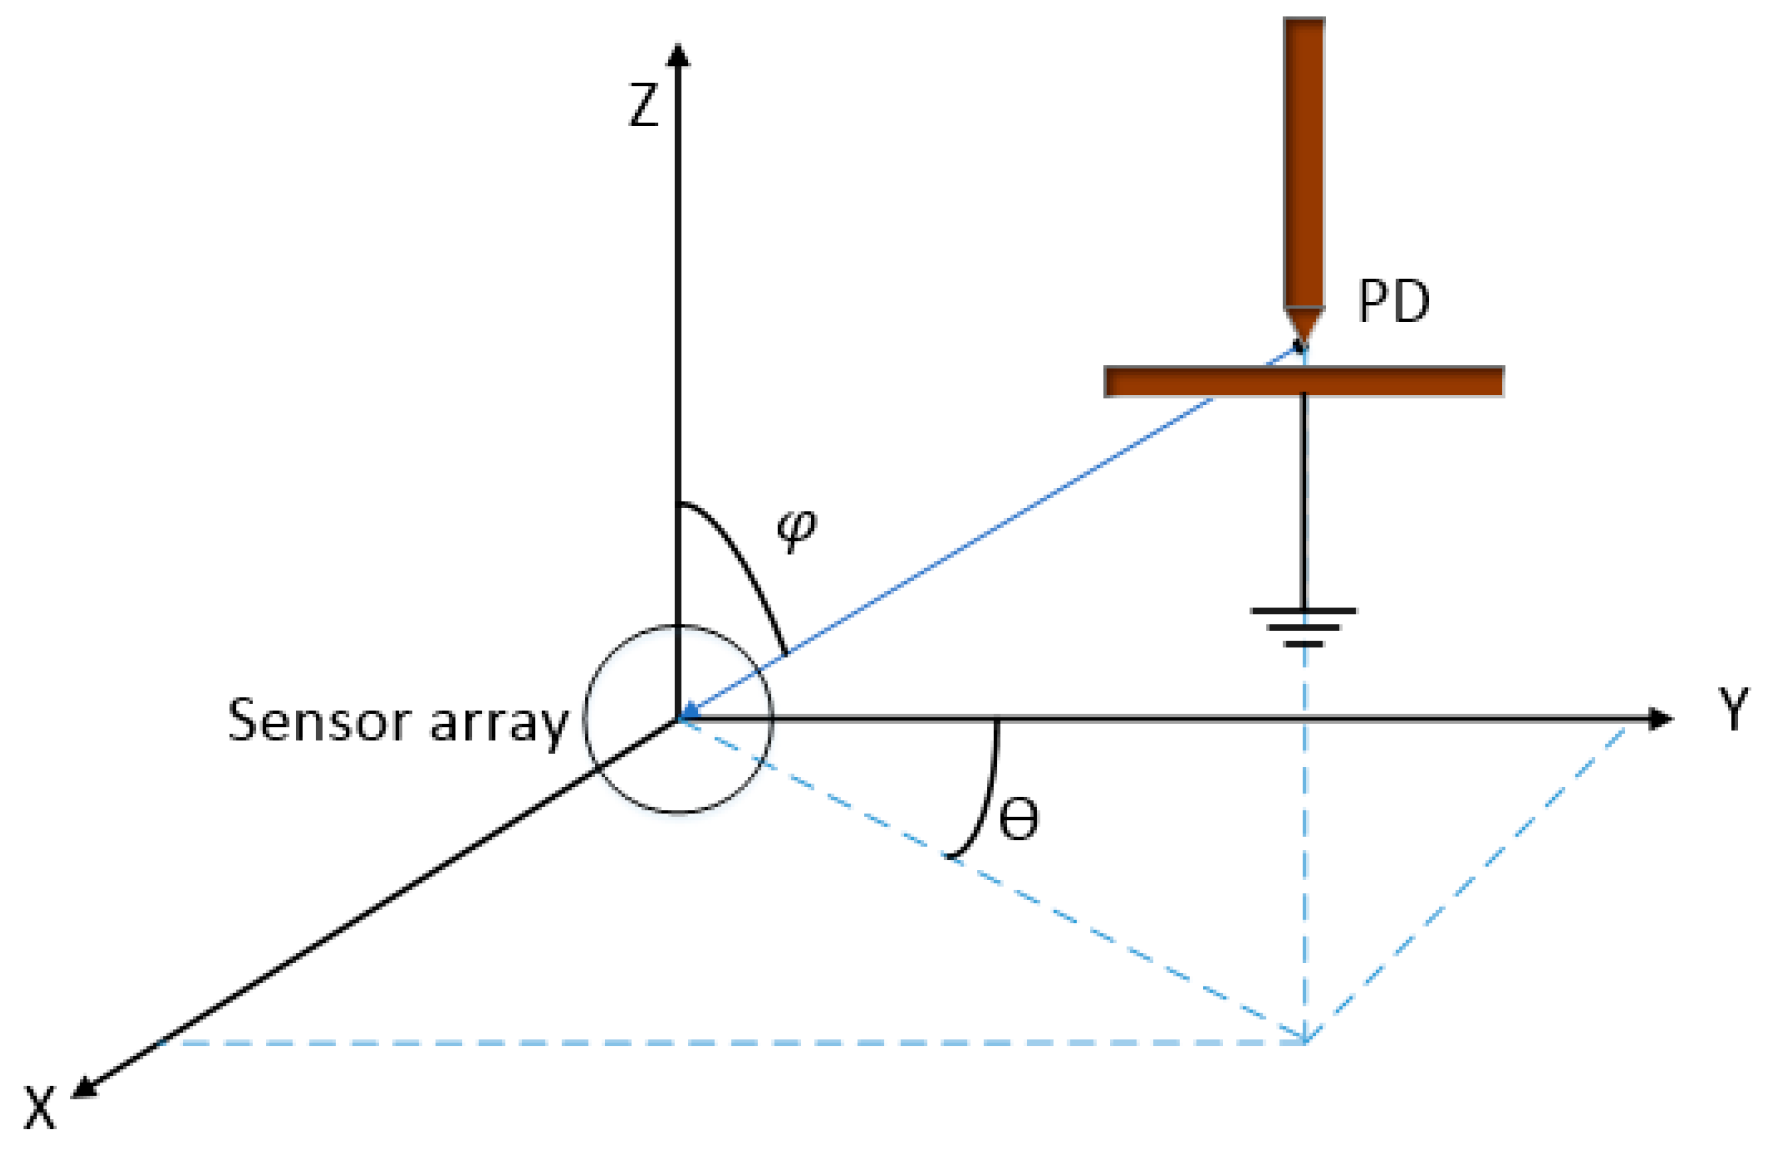
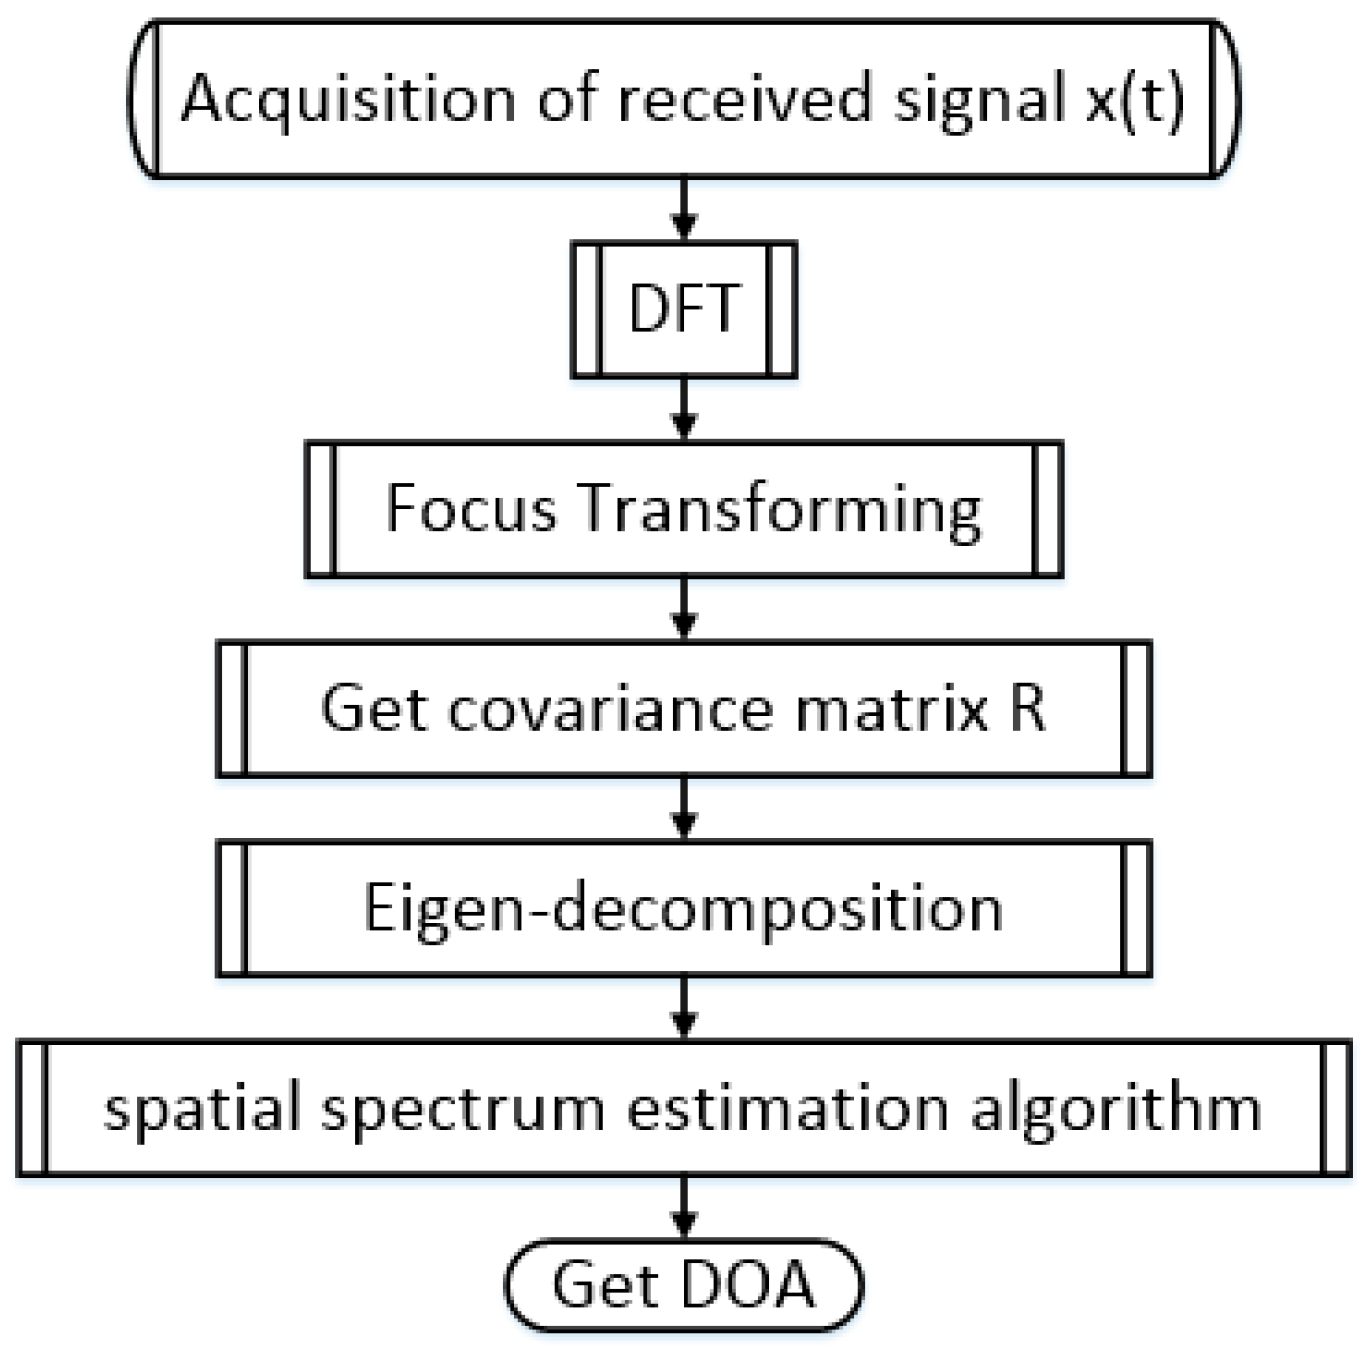
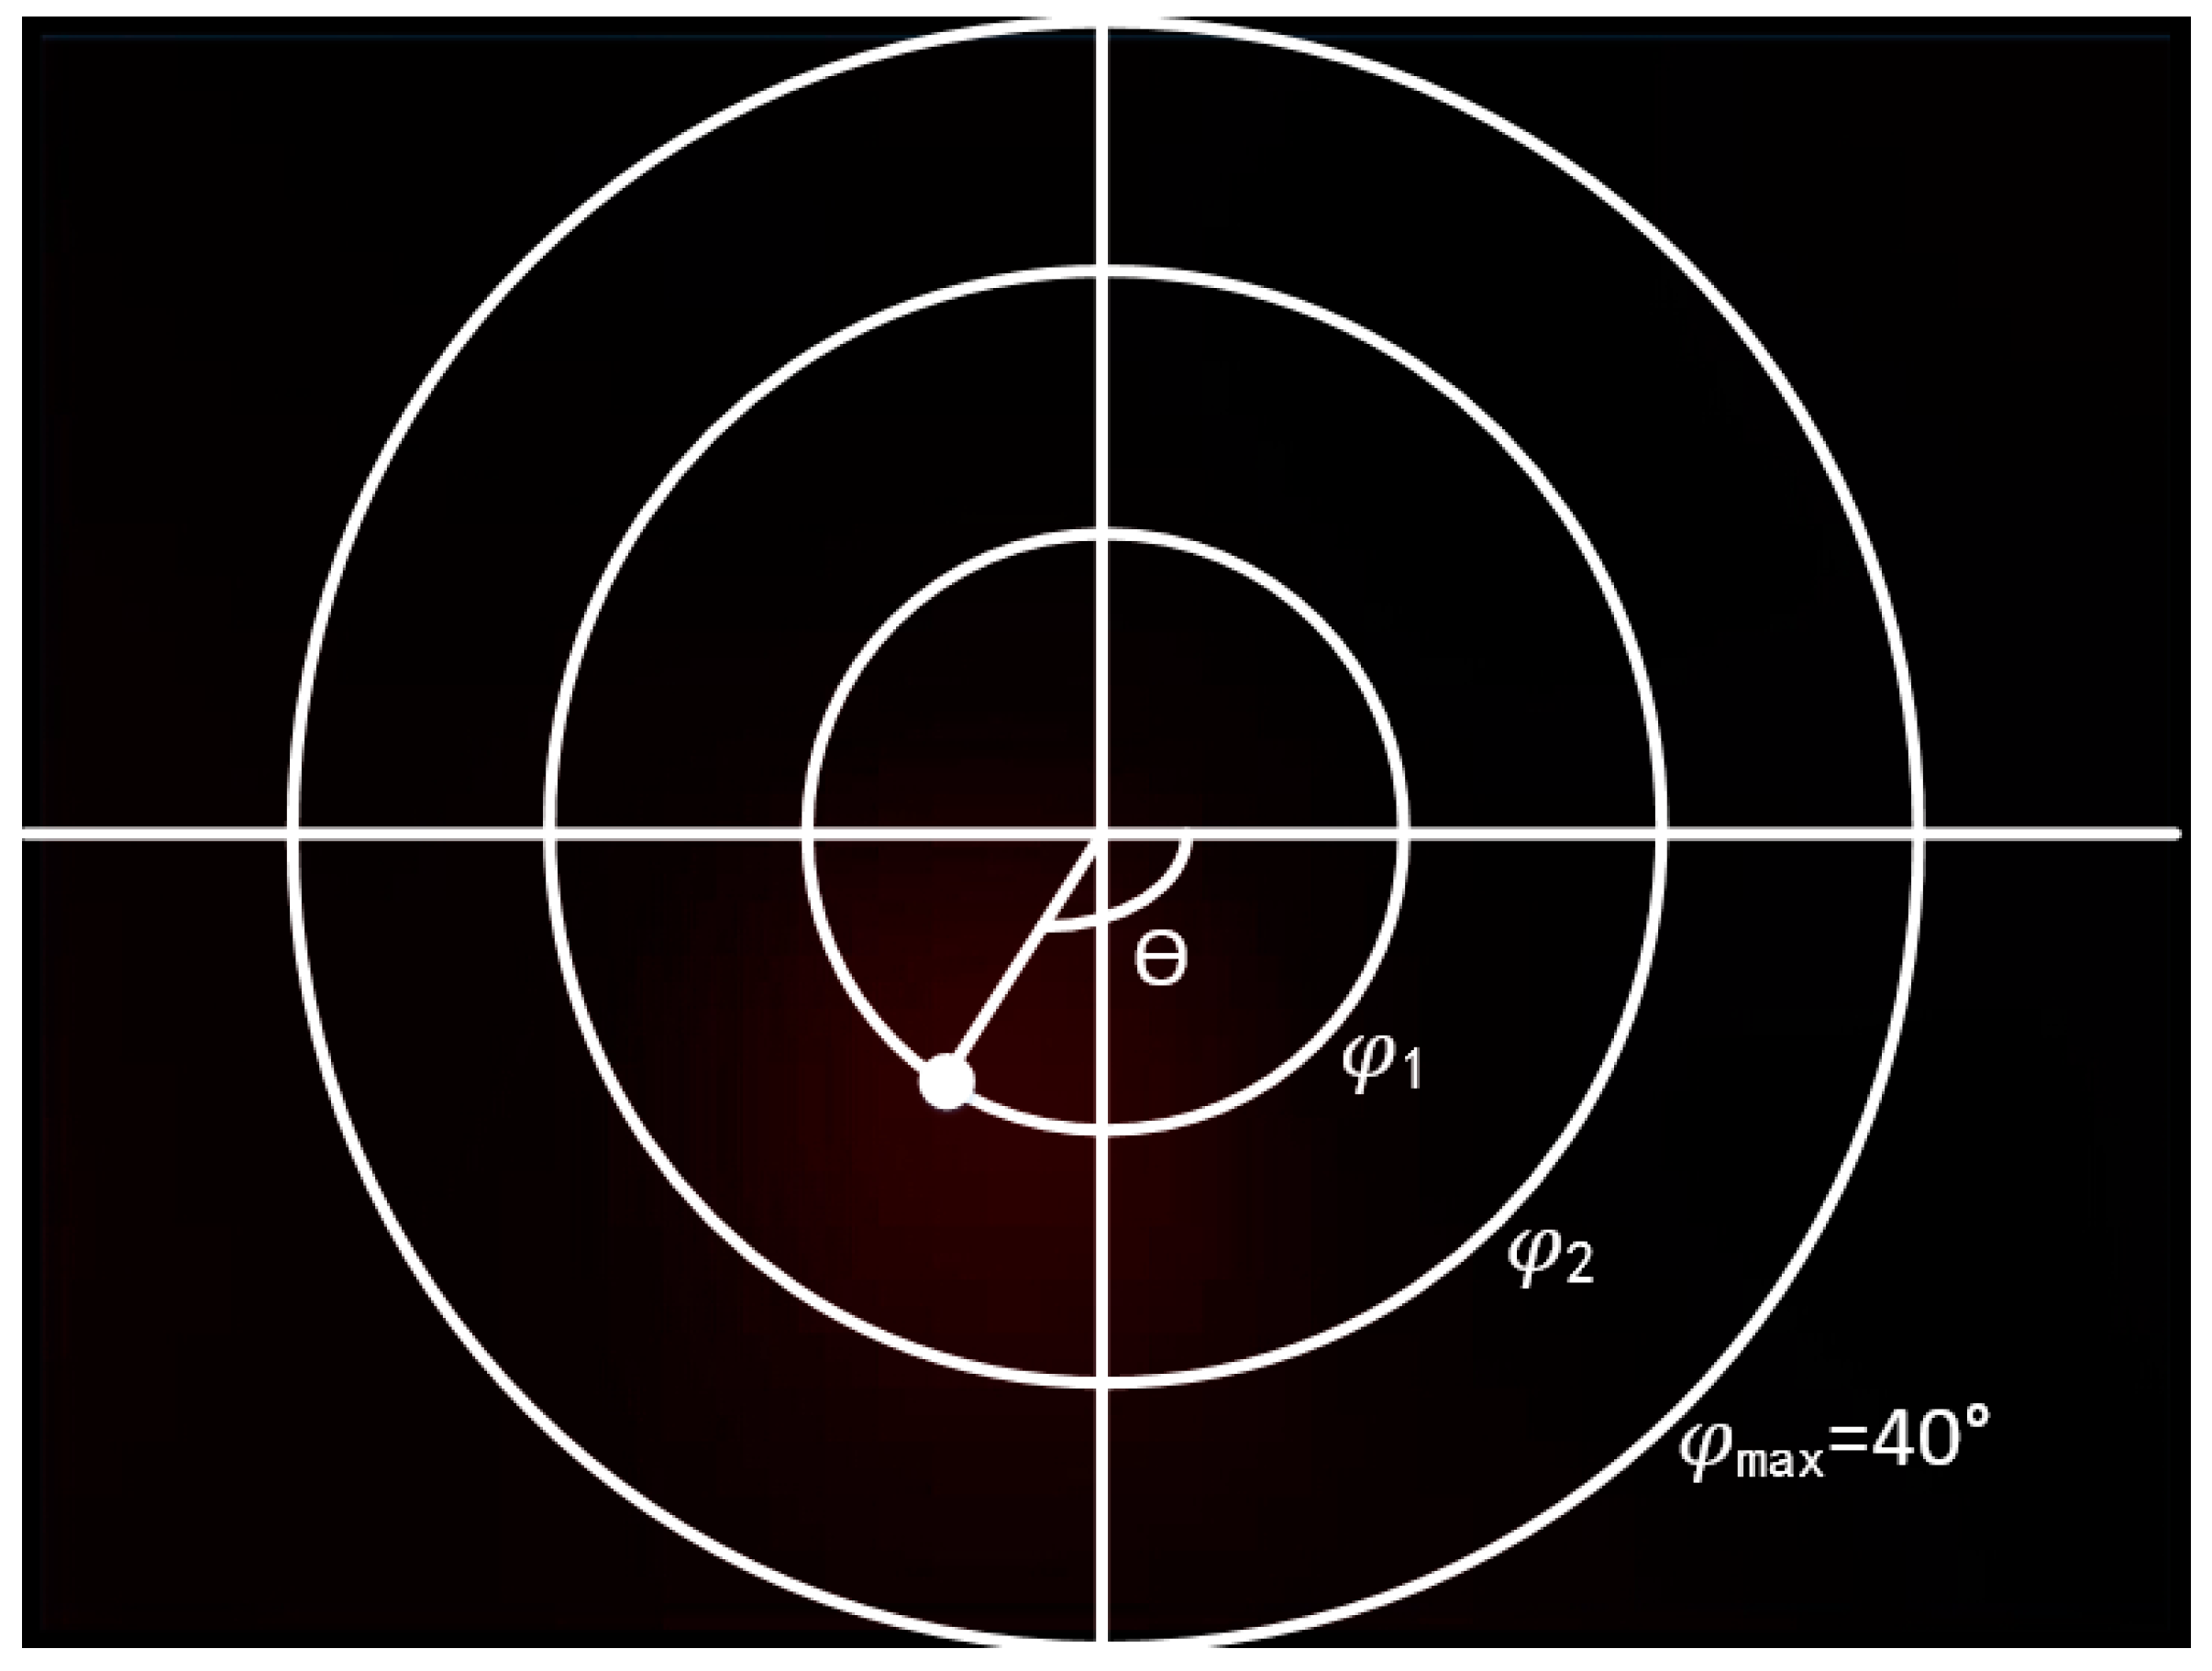
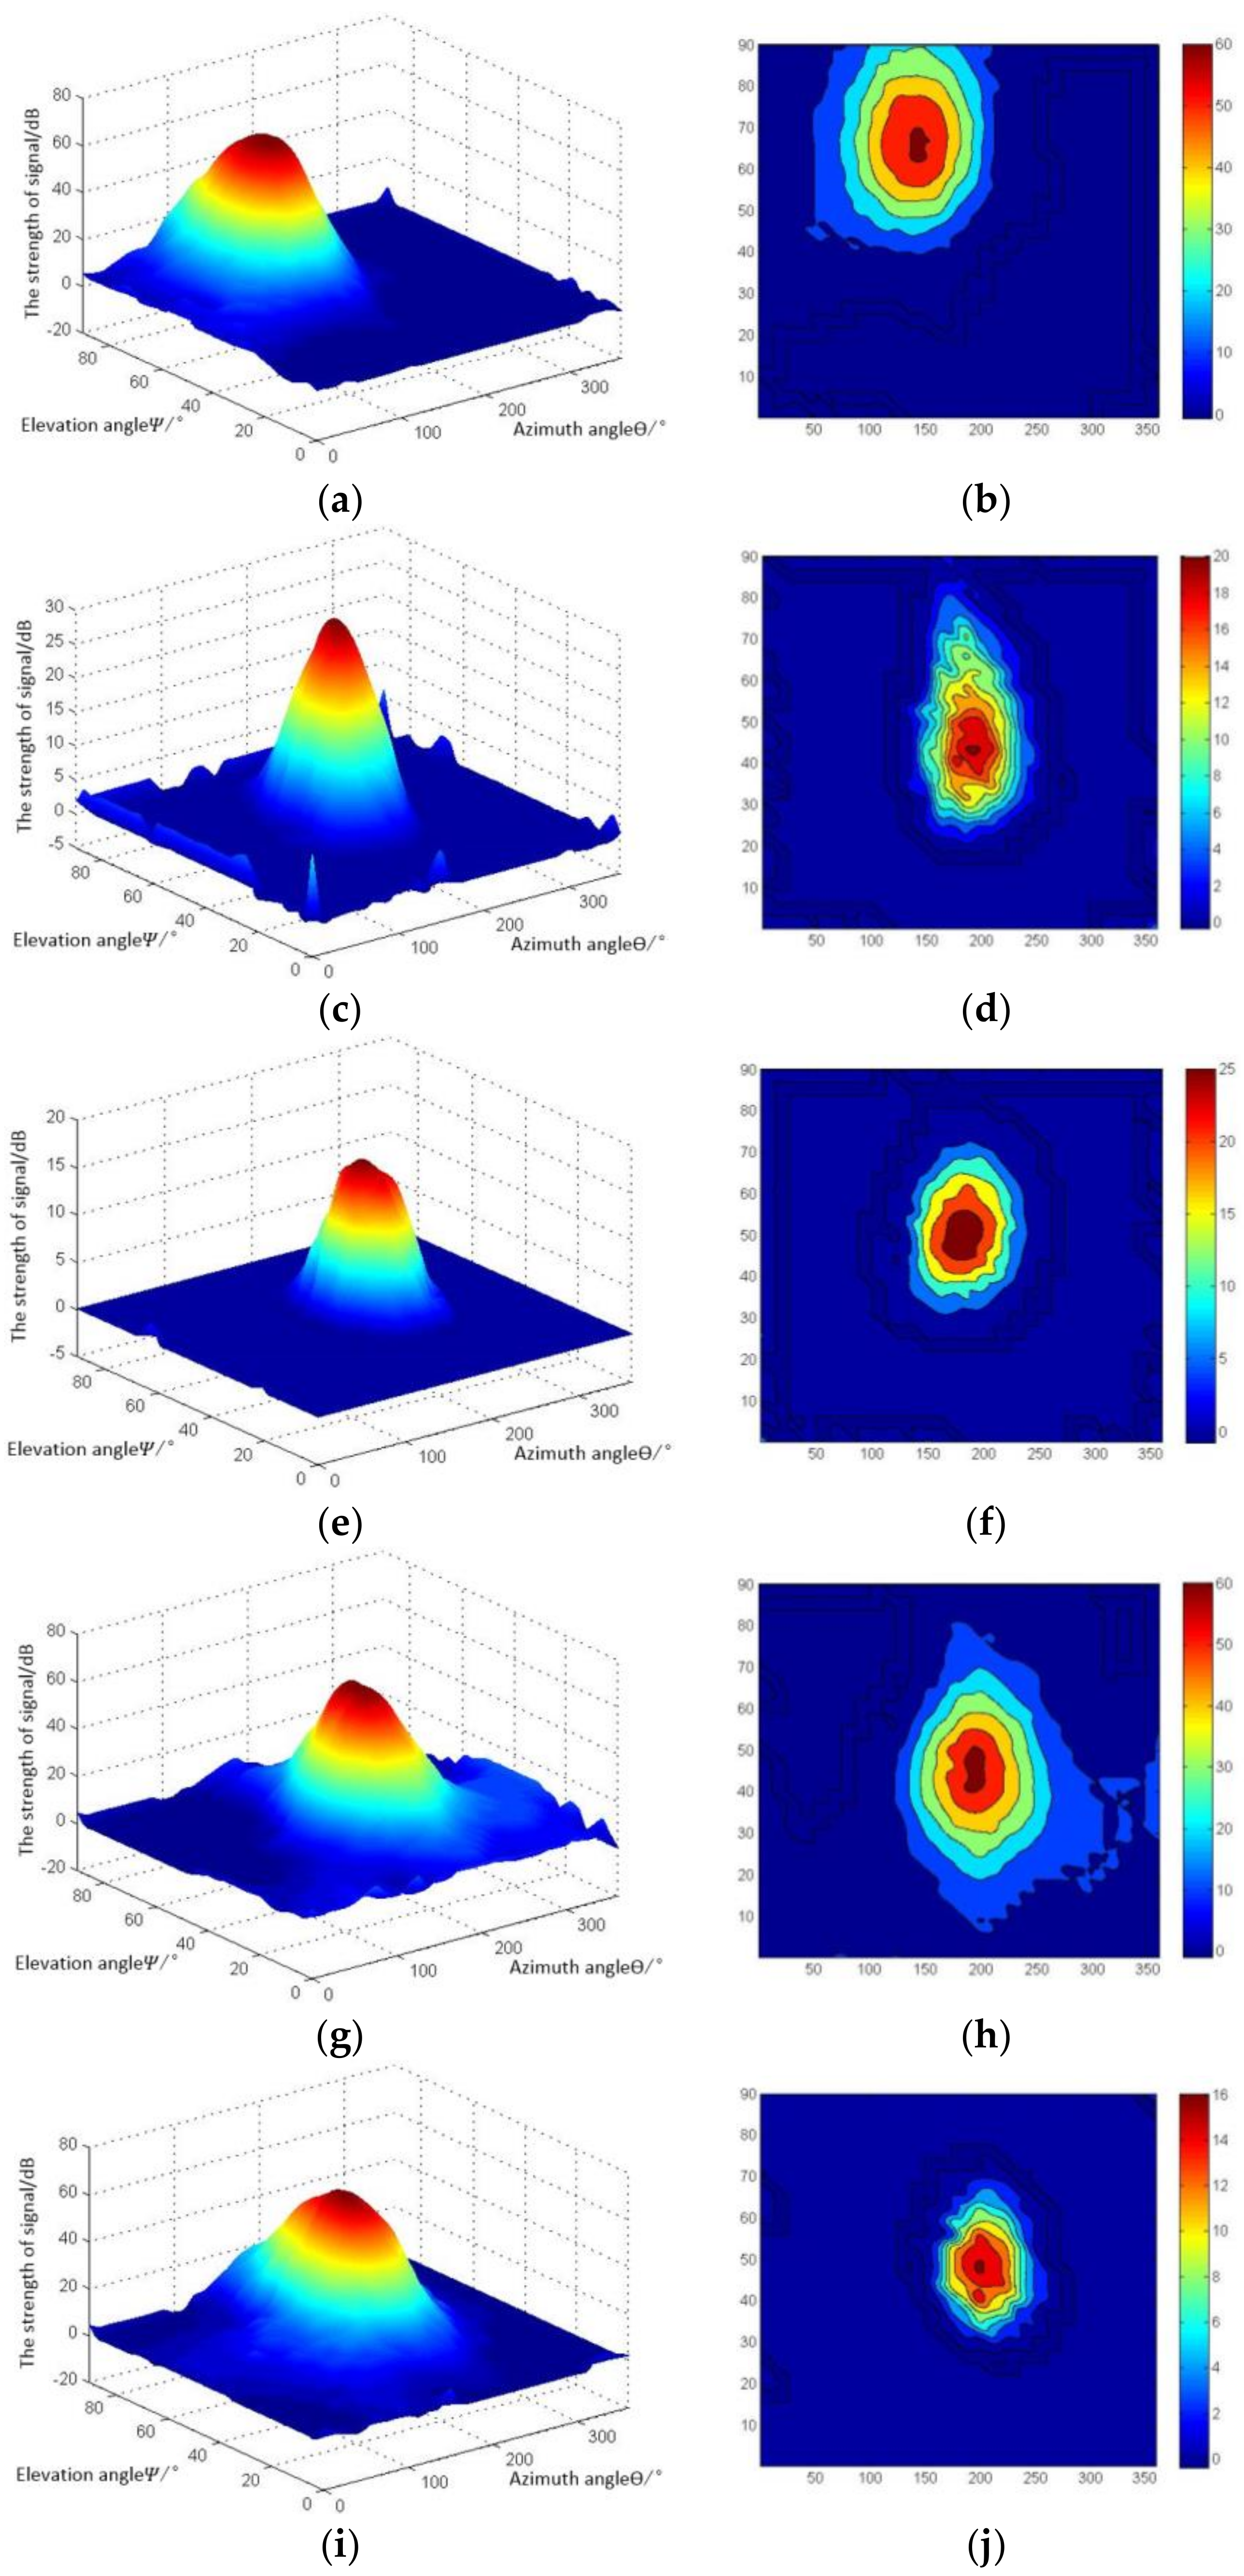
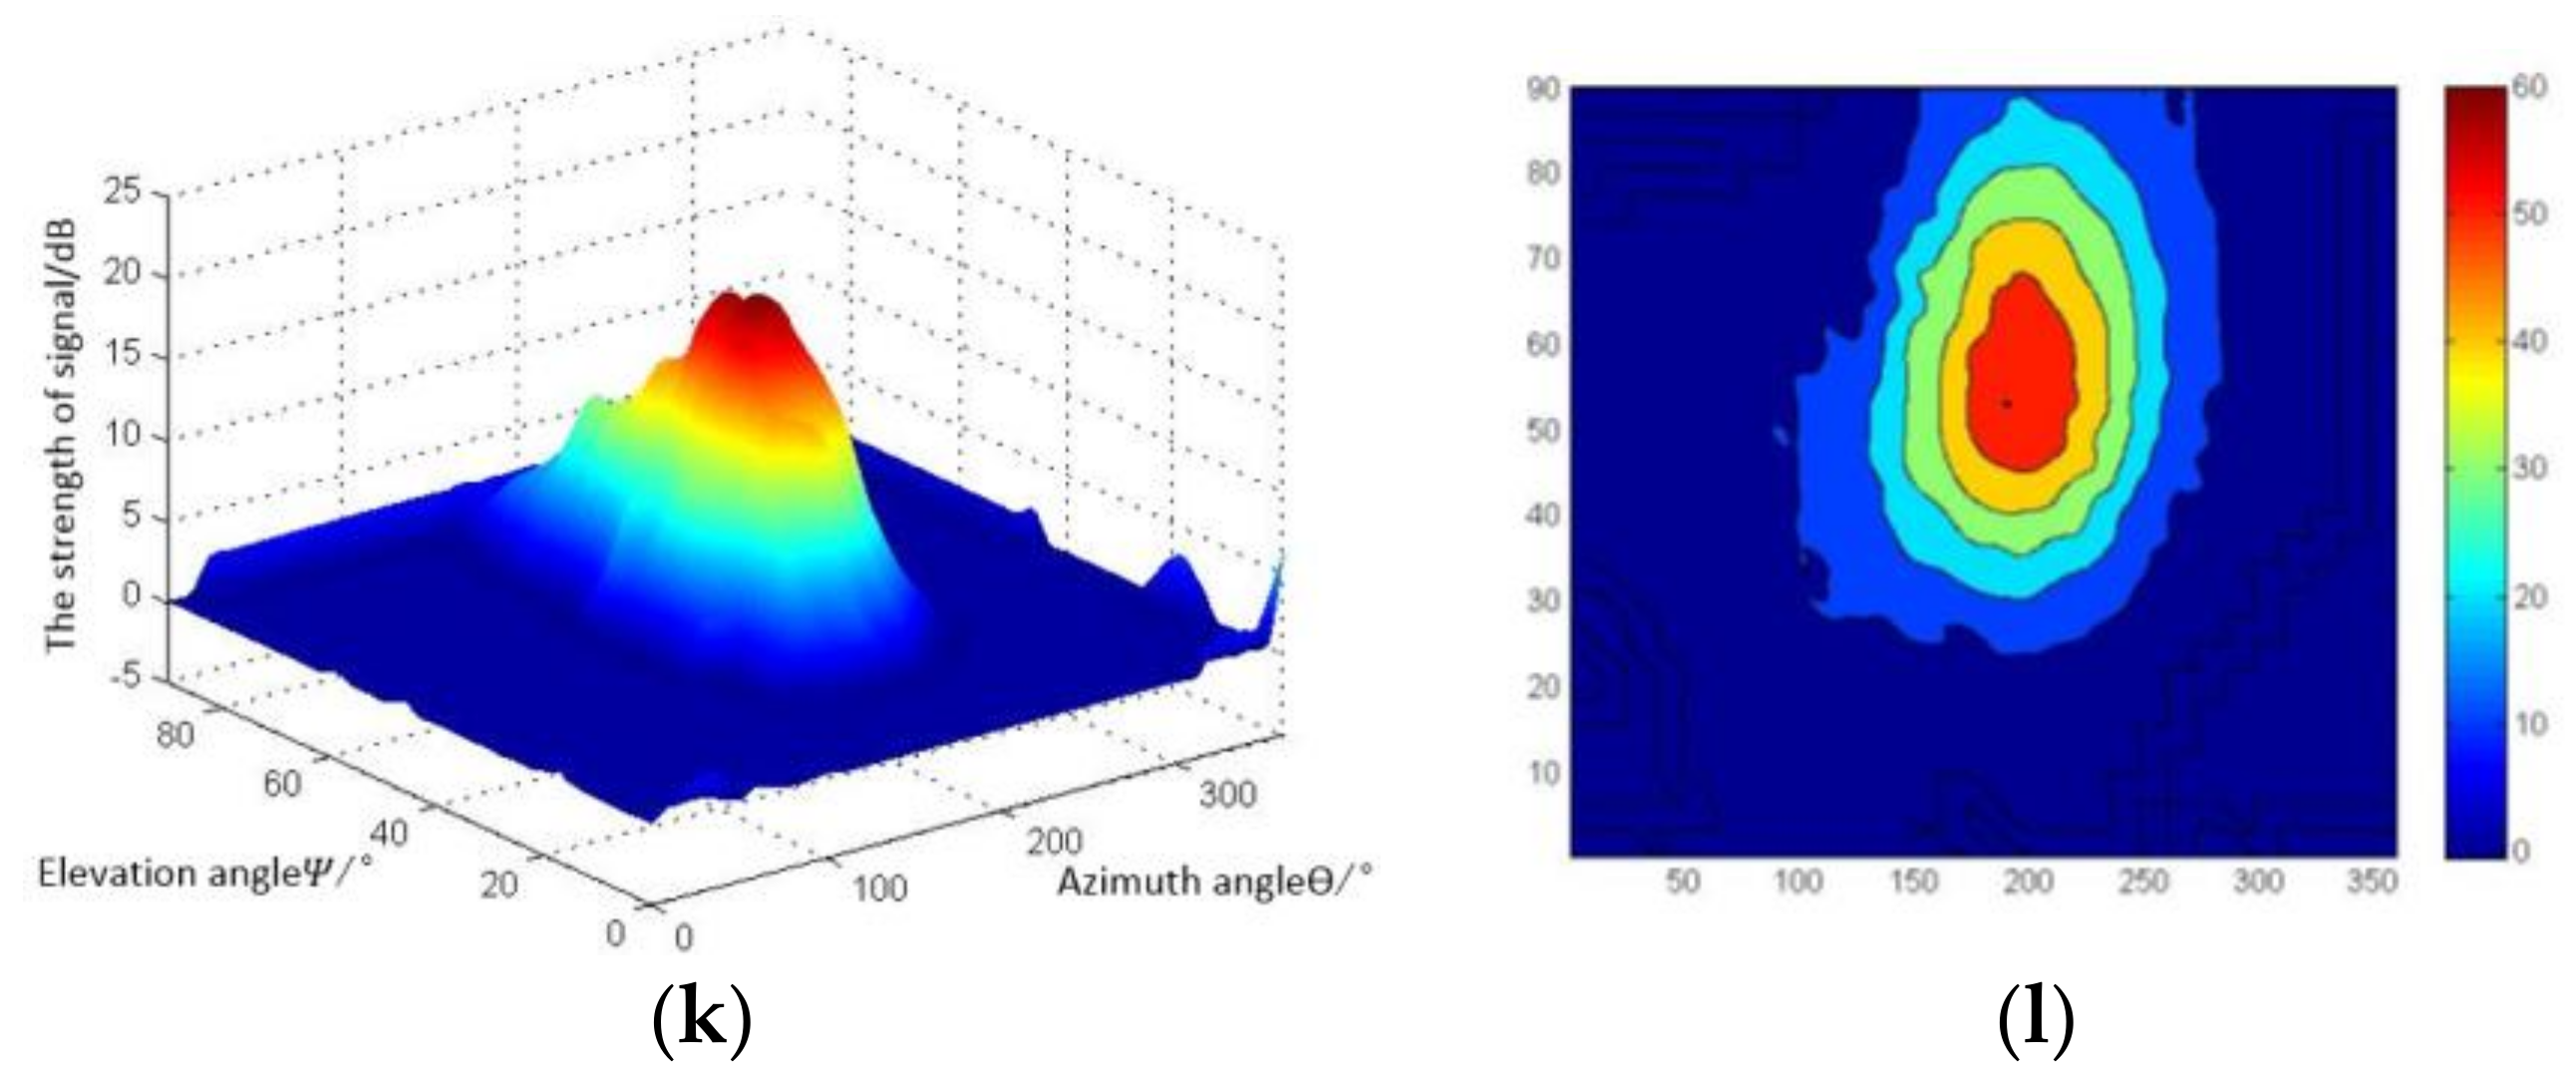
2.1. Acoustic Detection Method

The frequency band of the corona discharge ultrasonic signal received by the sensors ranged from 20 kHz to 80 kHz, which can be expressed by the sum of signal source and noise, as follows:
x l ( t ) = i = 1 N s i ( t τ l i ) + n l ( t )    l = 1 ,   2 ,   ,   M
where xl(t) is the signal collected by the sensor; si(t) is the signal emitted by the discharge source; N is the total number of discharge sources; i is the serial number of discharge sources; l is the serial number of the sensor; M is the total number of sensors; τl is the time delay for number; l is the sensor and nl(t) is the noise signal.
The acquisition time for a signal can be separated into K parts, and each part has j samples. The time of each part needs to be long enough to ensure that the signal and noise have no correlation after discrete Fourier transform (DFT). Then, DFT is performed to j samples of the collected signal. So, the model of the k-th part of the broadband signal can be expressed in the frequency domain. The received signal, discharge source signal, and noise correspond to the frequency (fj), where j = 1, 2, …, J. Thus, the bandwidth (20–80 kHz) of the broadband signal is divided into J elements, as shown in Equation (2).
X k ( f j ) = A ( f j ) S k ( f j ) + N k ( f j )
where X(f) represents the DFT for xl(t); S(f) represents the DFT for si(t); N(f) represents the DFT for nl(t); A(f) is the direction matrix and f0 is the focus frequency.
After that, X(fj) should be focused into one frequency (f0), to obtain narrow-band signals for the positioning algorithm [22]. Using a two-sided correlation transformation (TCT) focusing method, the transform matrix Tβ is created. The broadband signal can be focused into one central frequency (f0) as shown in Equation (3):
T β ( f j ) A β ( f j ) S ( f j ) = A β ( f 0 ) S ( f 0 )
where Tβ is the transform matrix.
After the above processing, the covariance matrix, R = E[XXH], can be built. In this study, the multiple signal classification (MUSIC) was used as a spatial spectrum estimation algorithm to get the direction of arrival (DOA) because it is a fast and mature method in discharge two-dimension positioning, and it is mainly influenced by the relationship between the time of arrival (TOA) of each sensor [23,24]. The direction of arrival (DOA) of the signal can be obtained by the MUSIC algorithm. For the MUSIC algorithm, the covariance matrix, R, should be disposed, following the Eigen-decomposition:
R = U s Σ s U s H + U N Σ N U N H
where US and UN are the signal subspaces for discharge source and noise. According to the theory, the steering vector a(θ,φ) is orthogonal with noise subspace UNH, i.e.,
a H ( θ , φ ) U N = 0
where θ is the Azimuth angle and φ is the elevation angle. The definitions of the Azimuth angle and the elevation angle are shown in Figure 1.
Supposing the sensor array is at the original point of the coordinate in the plane, XOY, the Azimuth angle θ and elevation angle φ are shown in Figure 1, showing the two-dimension position of discharge. The spatial spectrum PMUSIC estimation algorithm can be obtained, as follows:
P M U S I C = 1 a H ( θ , φ ) U N U N H a ( θ , φ )
Finally, the DOA of the signal can be determined from the spatial spectrum. Figure 2 shows the main flowchart of the above signal processing.

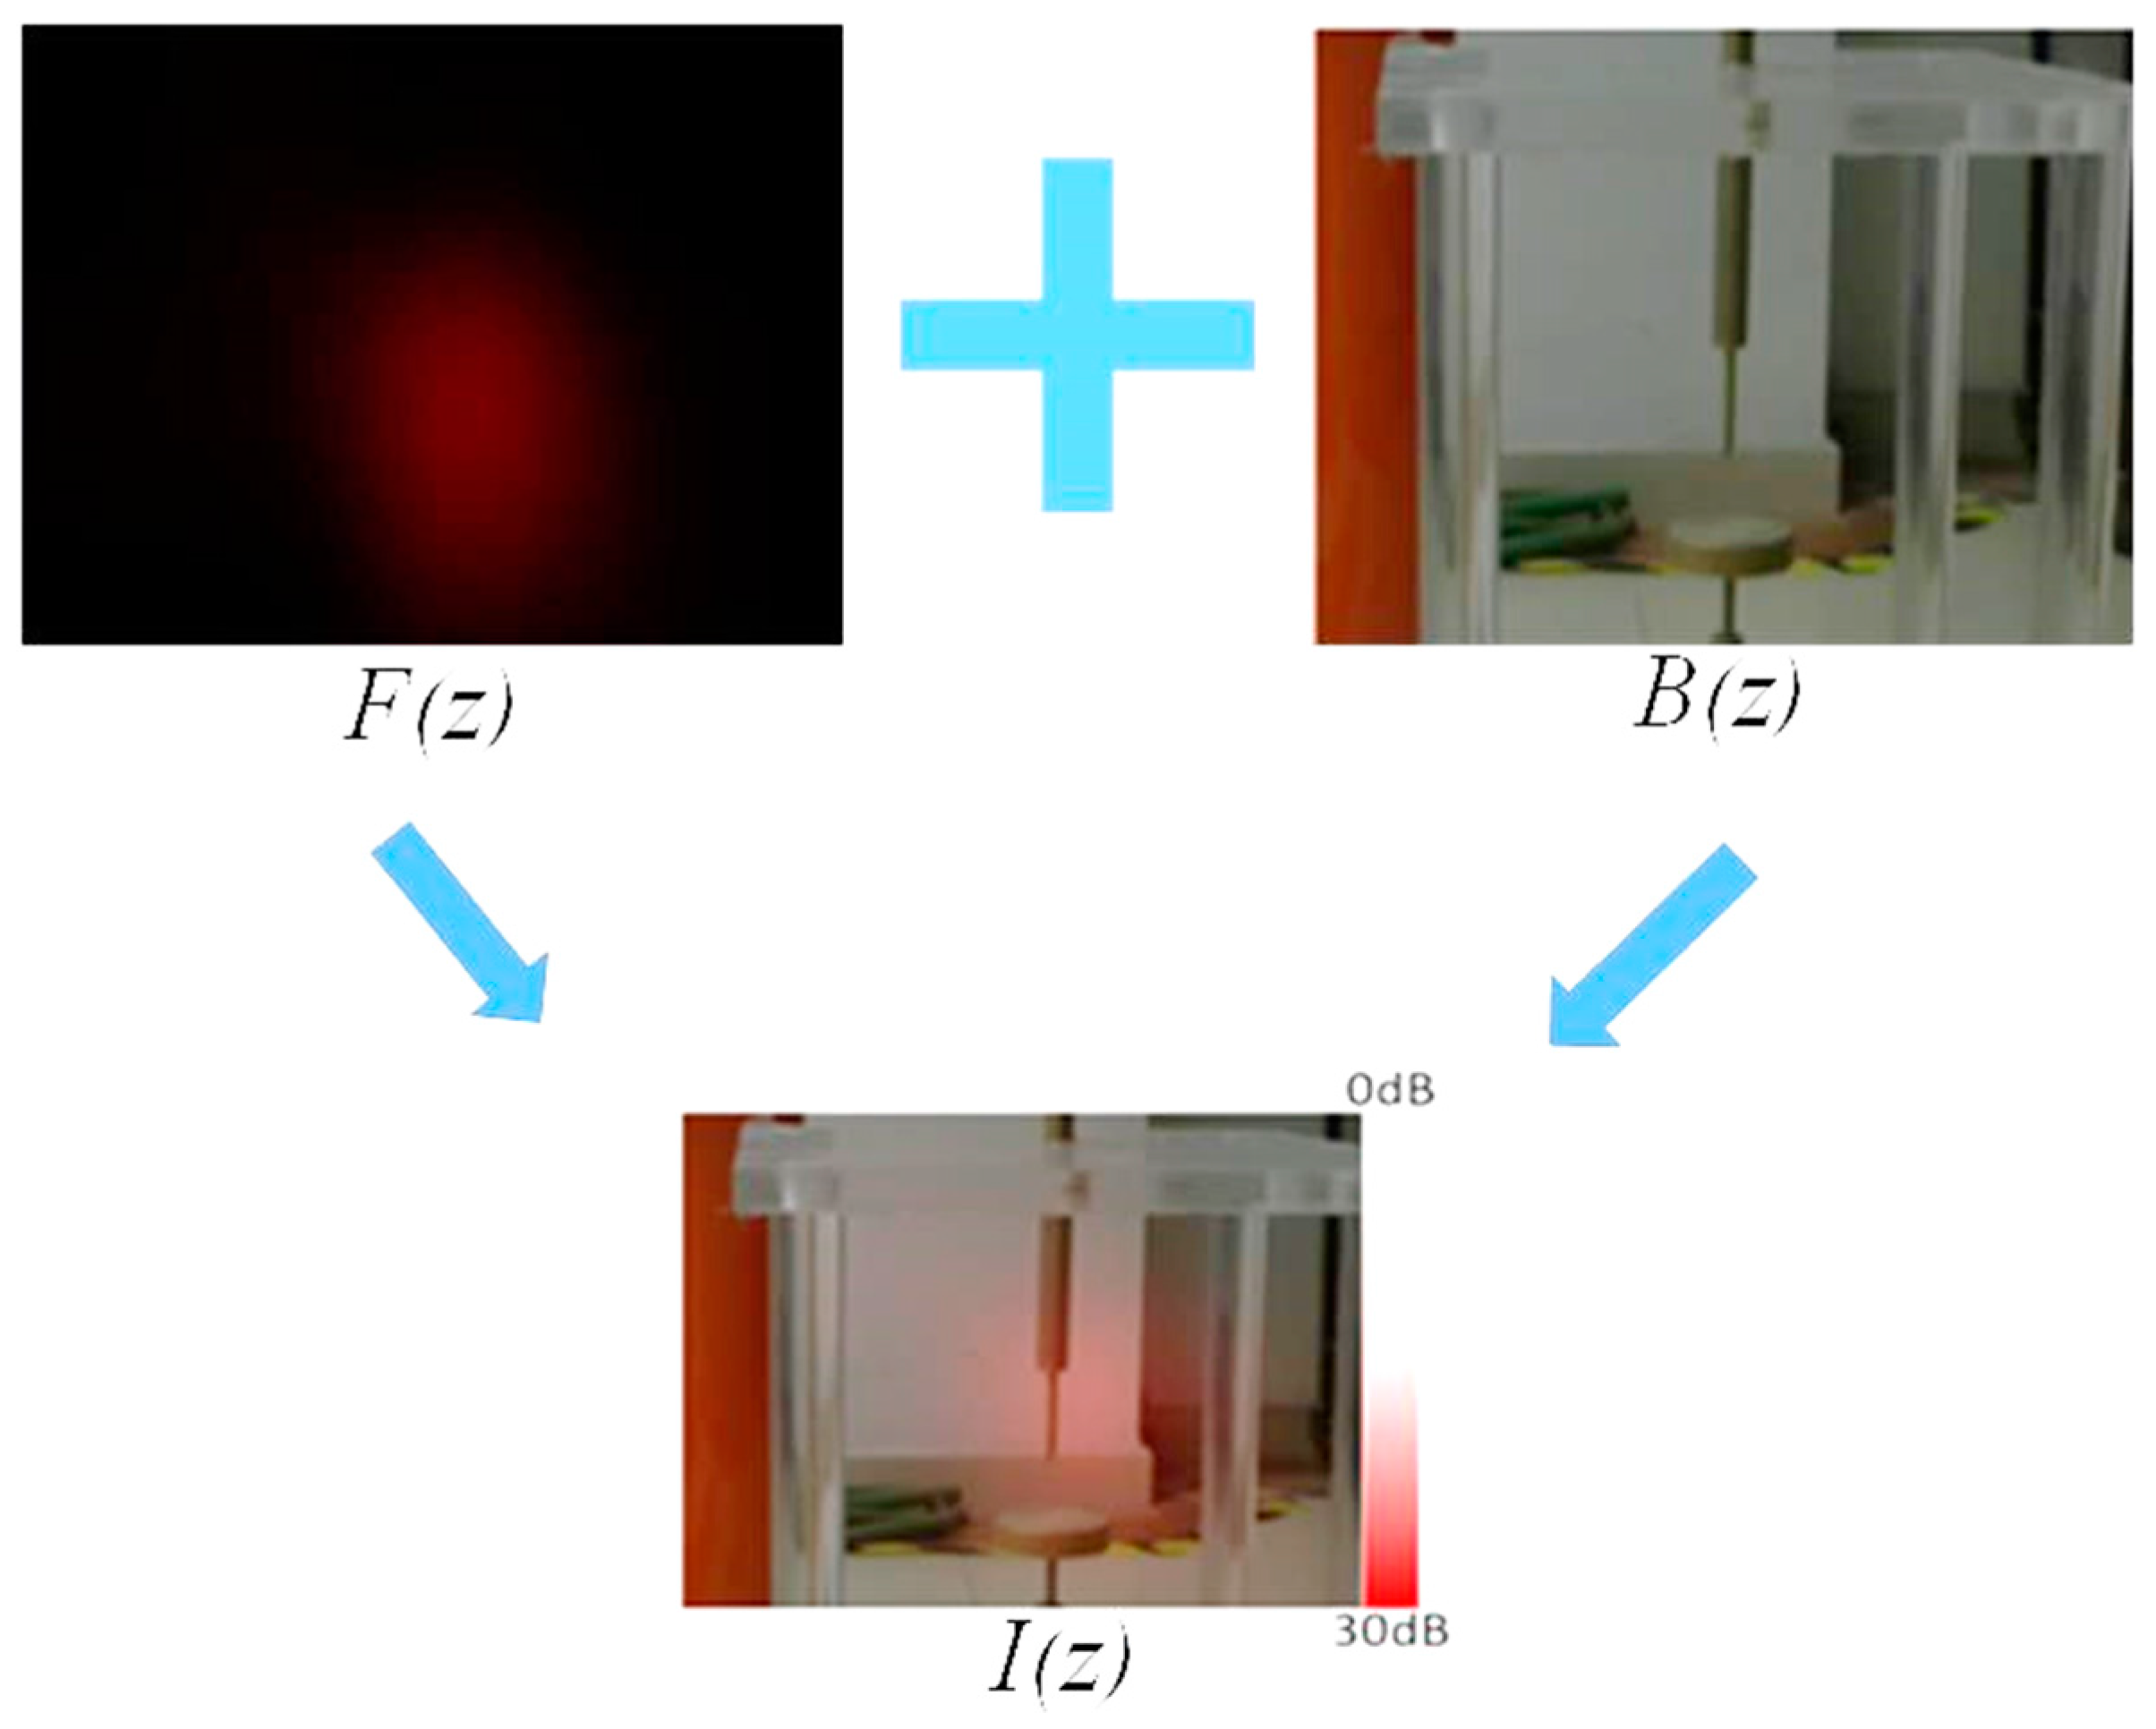
2.2. Image Fusion Method

In this work, we applied image fusion technology to ultrasonic corona discharge detection and location with array sensors. Using this approach, the corona positioning signal can be observed intuitively on the video. As for image fusion, it is necessary to get the pixel and phase of the discharge from a video, timely, and generate the same size ultrasonic signal frame F(z) from the signal, where z is the pair of x and y fitting in the image. In this paper, the video camera had a limited elevation angle (φ), from 0° to 40°, and Azimuth angle (θ), from 0° to 360°. Thus, the ultrasonic signal frame F(z), which shows the discharge position on the video, and is combined with the video phase-to-phase, can be generated from the spatial spectrum, PMUSIC, by φ and θ, as shown in Figure 3.
The essential aim of image fusion is rapidly extracting foreground objects from a given image and compositing them to a new background seamlessly. Matting-based image compositing, which has the advantage in real-time, is utilized in our timely image fusion [25]. Supposing the foreground is F(z), the background is B(z), and the opaqueness for foreground is α(z), the matting-based image fusion method based on α(z) can be realized by the linear compositions of F(z) and B(z) as follows:
I ( z ) = B ( z ) · α ( z ) + F ( z ) · ( 1 α ( z ) )
where I(z) is the fusion image after linear composition. In this study, the foreground is the signal image and the background is the video image. For image fusion, the signal value is added to the red color of the video by opaqueness (z) and the blue and green colors are multiplied by (z). Equations for image fusion are shown below:
I r ( z ) = B r ( z ) · α ( z ) + F ( z ) · ( 1 α ( z ) )
I g ( z ) = B g ( z ) · α ( z )
I b ( z ) = B b ( z ) · α ( z )
where F(z) is the foreground image that equals the signal strength. The fusion results are shown in Figure 4.
After image fusion, the fusion image is continuously shown on the computer monitor frame by frame, which realizes the real-time video detection on corona discharge.

3. Ultrasonic Sensor Array Design

Until now, the configuration of ultrasonic arrays could be divided into several types, including line, rectangle, and circle [26,27,28]. Beam pattern analysis can provide the relationship between the sum absolute value of the output of the sensor array G(θ,φ) (dB) and the direction, including the Azimuth angle and the elevation angle of the input signal. The absolute value of the output changes with the different signal direction, and it generates a pattern of the Azimuth angle (θ), the elevation angle (φ) and the absolute value of the output, which is called the beam pattern.
In order to acquire a good acoustic performance of the sensor in determining the position of the corona discharge source, the alignment or match between the source and the sensor beam pattern should be considered. The beam pattern can be calculated by using Equation (11).
G ( θ , φ ) = | Y ( θ , φ ) | max { | Y ( θ , φ ) | }
where Y(θ,φ) (dB) is the sum of the output value of each sensor and is calculated by Equation (12):
Y ( θ , φ ) = l = 1 m ω l e j ω τ l    l = 1 ,   2 ,   ,   m
ω is the angular velocity of the ultrasonic signal; ωl is the weight coefficient for each sensor (for a static beam pattern, ωl = 1).
1 − m stands for the m sensors. In this study, a double-helix-arrangement was designed and is shown in Figure 5, m = 31; the reference point is at the center of the sensor array.
As shown in Figure 5, 31 sensors were arranged in a double-helix-pattern. In order to analyze and compare the acoustic performance of sensor arrays, static beam patterns (ωl = 1) of several kinds of ultrasonic arrays were plotted and are shown in Figure 6.
As shown in Figure 6, the beam patterns of a specific array strongly depend on its arrangement. The directivity of the sensor array can be improved by increasing the number of sensors, which is indicated by the variation in its beam patterns. Especially for the circle array, the directivity can be effectively improved by increasing the number of sensors as well as the ring of the circle, as shown in Figure 6c–e. By comparing Figure 6e,g, the directivity of the sensor array can be also improved while the concentric circles are made staggered with a certain rotating angle.
The sectional drawing of beam patterns for each array are the sectional drawings of beam patterns at the most significant angle. As for the circle array, like in Figure 6c,e,g, the angle is usually at an Azimuth angle of 90°, and for rectangle arrays, like Figure 6a, the angle is usually at an elevation angle of 180°. The sectional drawing of beam patterns for each array are shown in Figure 6b,d,f and h and the beam widths at zero point (BW0) and half-power point (BW0.5) are shown in Table 1.
The main lobe of the beam pattern sectional drawing for the DHUA is the smallest among all the arrays investigated, and the side-lobe holds a smaller proportion, compared to the circle and concentric circles arrays, which means the double-helix-array has a better acoustic performance, compared to the conventional arrays. Finally, the picture of the sensor array’s printed circuit board (PCB) was made according the above design and is shown in Figure 7.
As shown in Figure 7, a camera lens was placed on the PCB of the sensor array, and 31 SPU0410LR5H-QB piezoelectric sensors (Co. Knowles Acoustics Model, response frequency is from 10 kHz to 70 kHz and center frequency is 20 kHz) were aligned in a double-helix-arrangement.

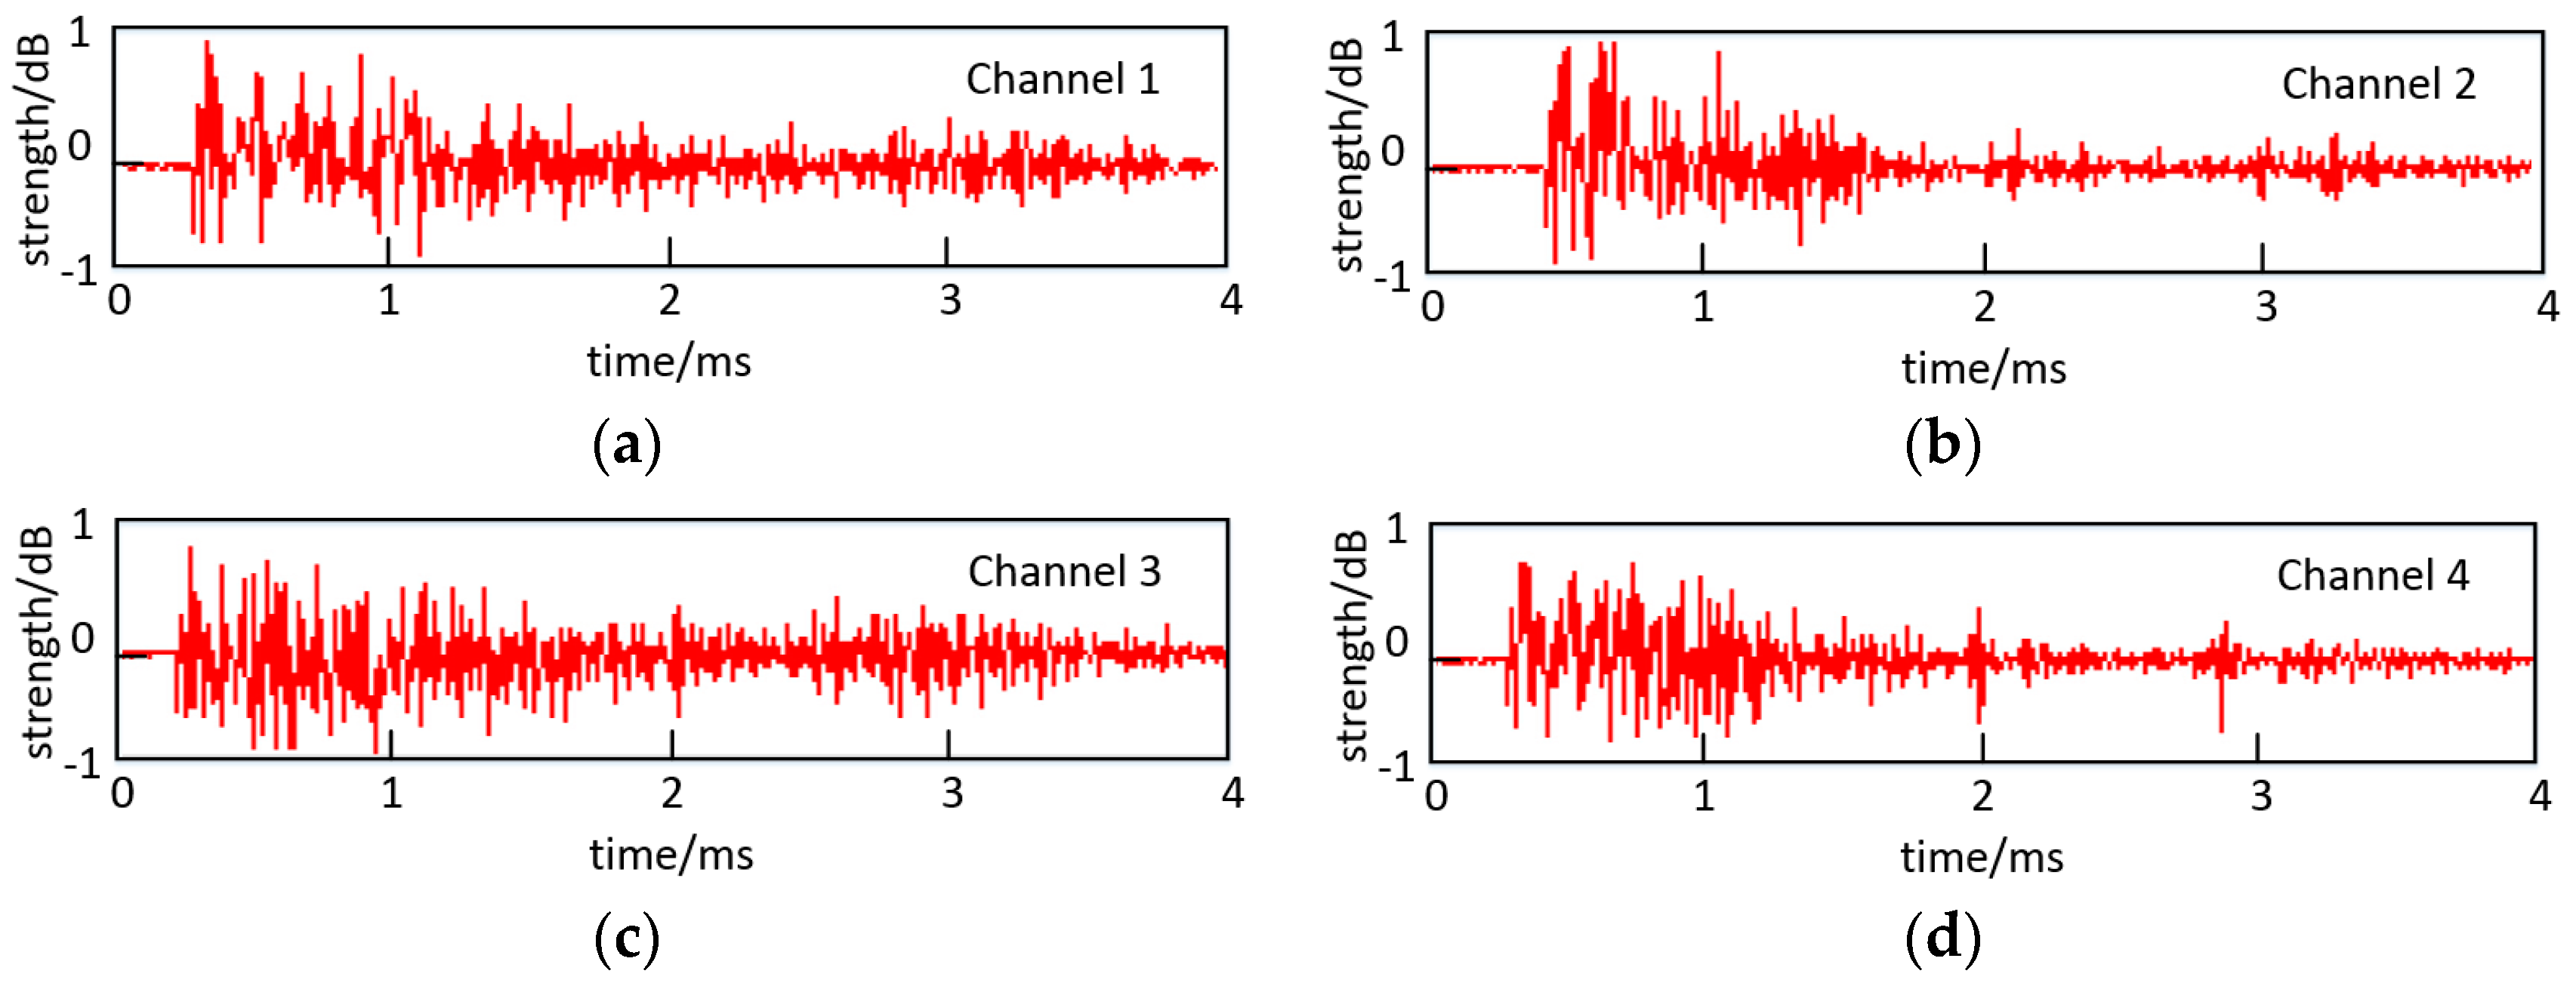
4. Experimental Evaluation of the DHUA Sensor

The pulse current from the corona PD measurement was used to evaluate the effectiveness of the visualized acoustic detection, in terms of sensitivity and accuracy. The discharge source was a needle-plate defect, and the discharge pulse was collected by a Rogowski coil [29] and shown by an oscilloscope.

4.1. Measurement System

In this study, the properties of the DHUA sensor were evaluated by carrying out the pulse current PD detection, according to IEC 60270 [30]. The diagram of the experimental setup is shown in Figure 6.
The PD source was a needle-plate electrode, as shown in Figure 8. The distance between the needle and plate was 30 mm; the curvature radius of the needle point was 0.5 mm. The ultrasonic signal was collected by DHUA and then gathered by a 31-channel AD acquisition card into a laptop. The sampling rate of AD was 100 kS/s, cut-off frequency was 50 kHz, sampling precision was 16 bits, and synchronization precision of 31 channels was less than 1 ns. The bandwidth of the oscilloscope was 600 MHz, and the sampling rate was 10 GS/s. The corona discharge current was collected by a Rogowski coil, which had a frequency band of up to 200 MHz and a sensitivity of 5 V/A. A 50 Hz AC voltage was applied to the test object. The inception voltage of the corona discharge was 9.7 kV. The array sensor could respond to PDs as the applied voltage exceeded 12.5 kV. The test conditions, including the applied voltage, the PD charge identified by current pulse method, and the test distance, are shown in Table 2.

4.2. Measurement System

Examples of the signals coupled by the ultrasonic sensors at 1.5 m are shown in Figure 9.
The signals from different channels have different TOA. The DOA spectra can be drawn with the TOA of 31 channel signals by using the algorithm which is described in Section 2. Figure 10 shows the DOA spectra obtained from different test distances.
Then, the positioning image can be realized by using the acoustical image data transformed from DOA spectra and video data, based on the matting-based image compositing method.

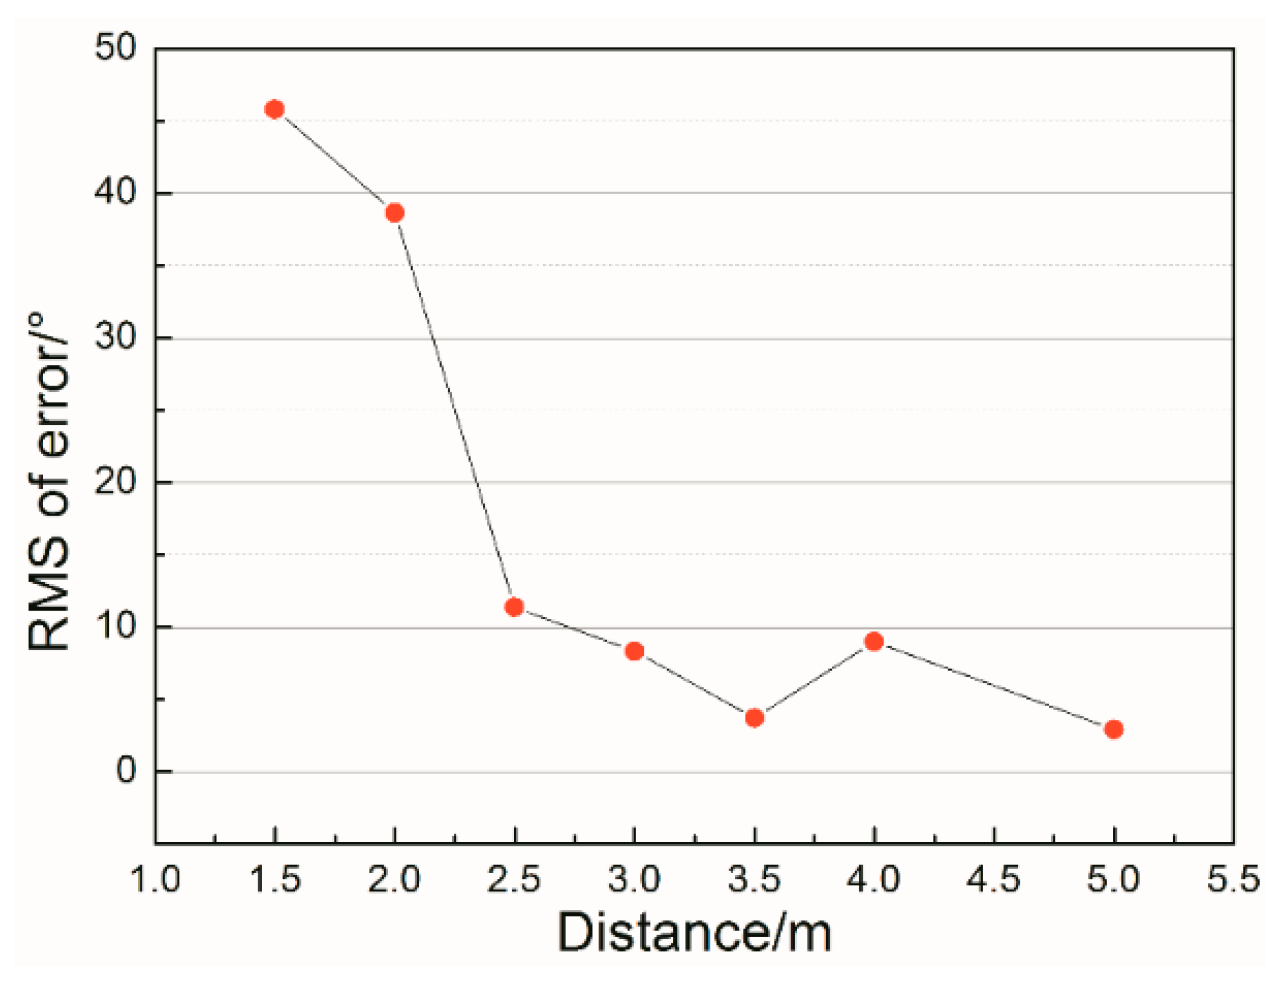
4.3. Error of the Detection System

In principle, both the acoustic performance of sensor array and the detection position can be the main error sources. The error of the detection system is shown in Table 3.
In Table 3, the root-mean-square (RMS) of the error decreases with the increase of the detection distance up to the distance of 2.5 m. The relationship between RMS of error and the test distance is shown as the broken-line in Figure 11.
In the positioning algorithm, the DOA of each sensor should be the same, but in reality they are not, because of the differences in the sensor positions in a plane. The differences in DOA can be ignored when the detection distance is much greater than the size of the array. However, when the detection subject is close to the array, the difference of DOA gets larger, giving rise to an obvious error in positioning. In this paper, the ultrasonic array sensor had an error less than 10° when the detection distance exceeded 2.5 m. The maximum test distance in lab was 5 m due to the space limit of the lab, and the maximum acquisition distance was detailed in Section 5.

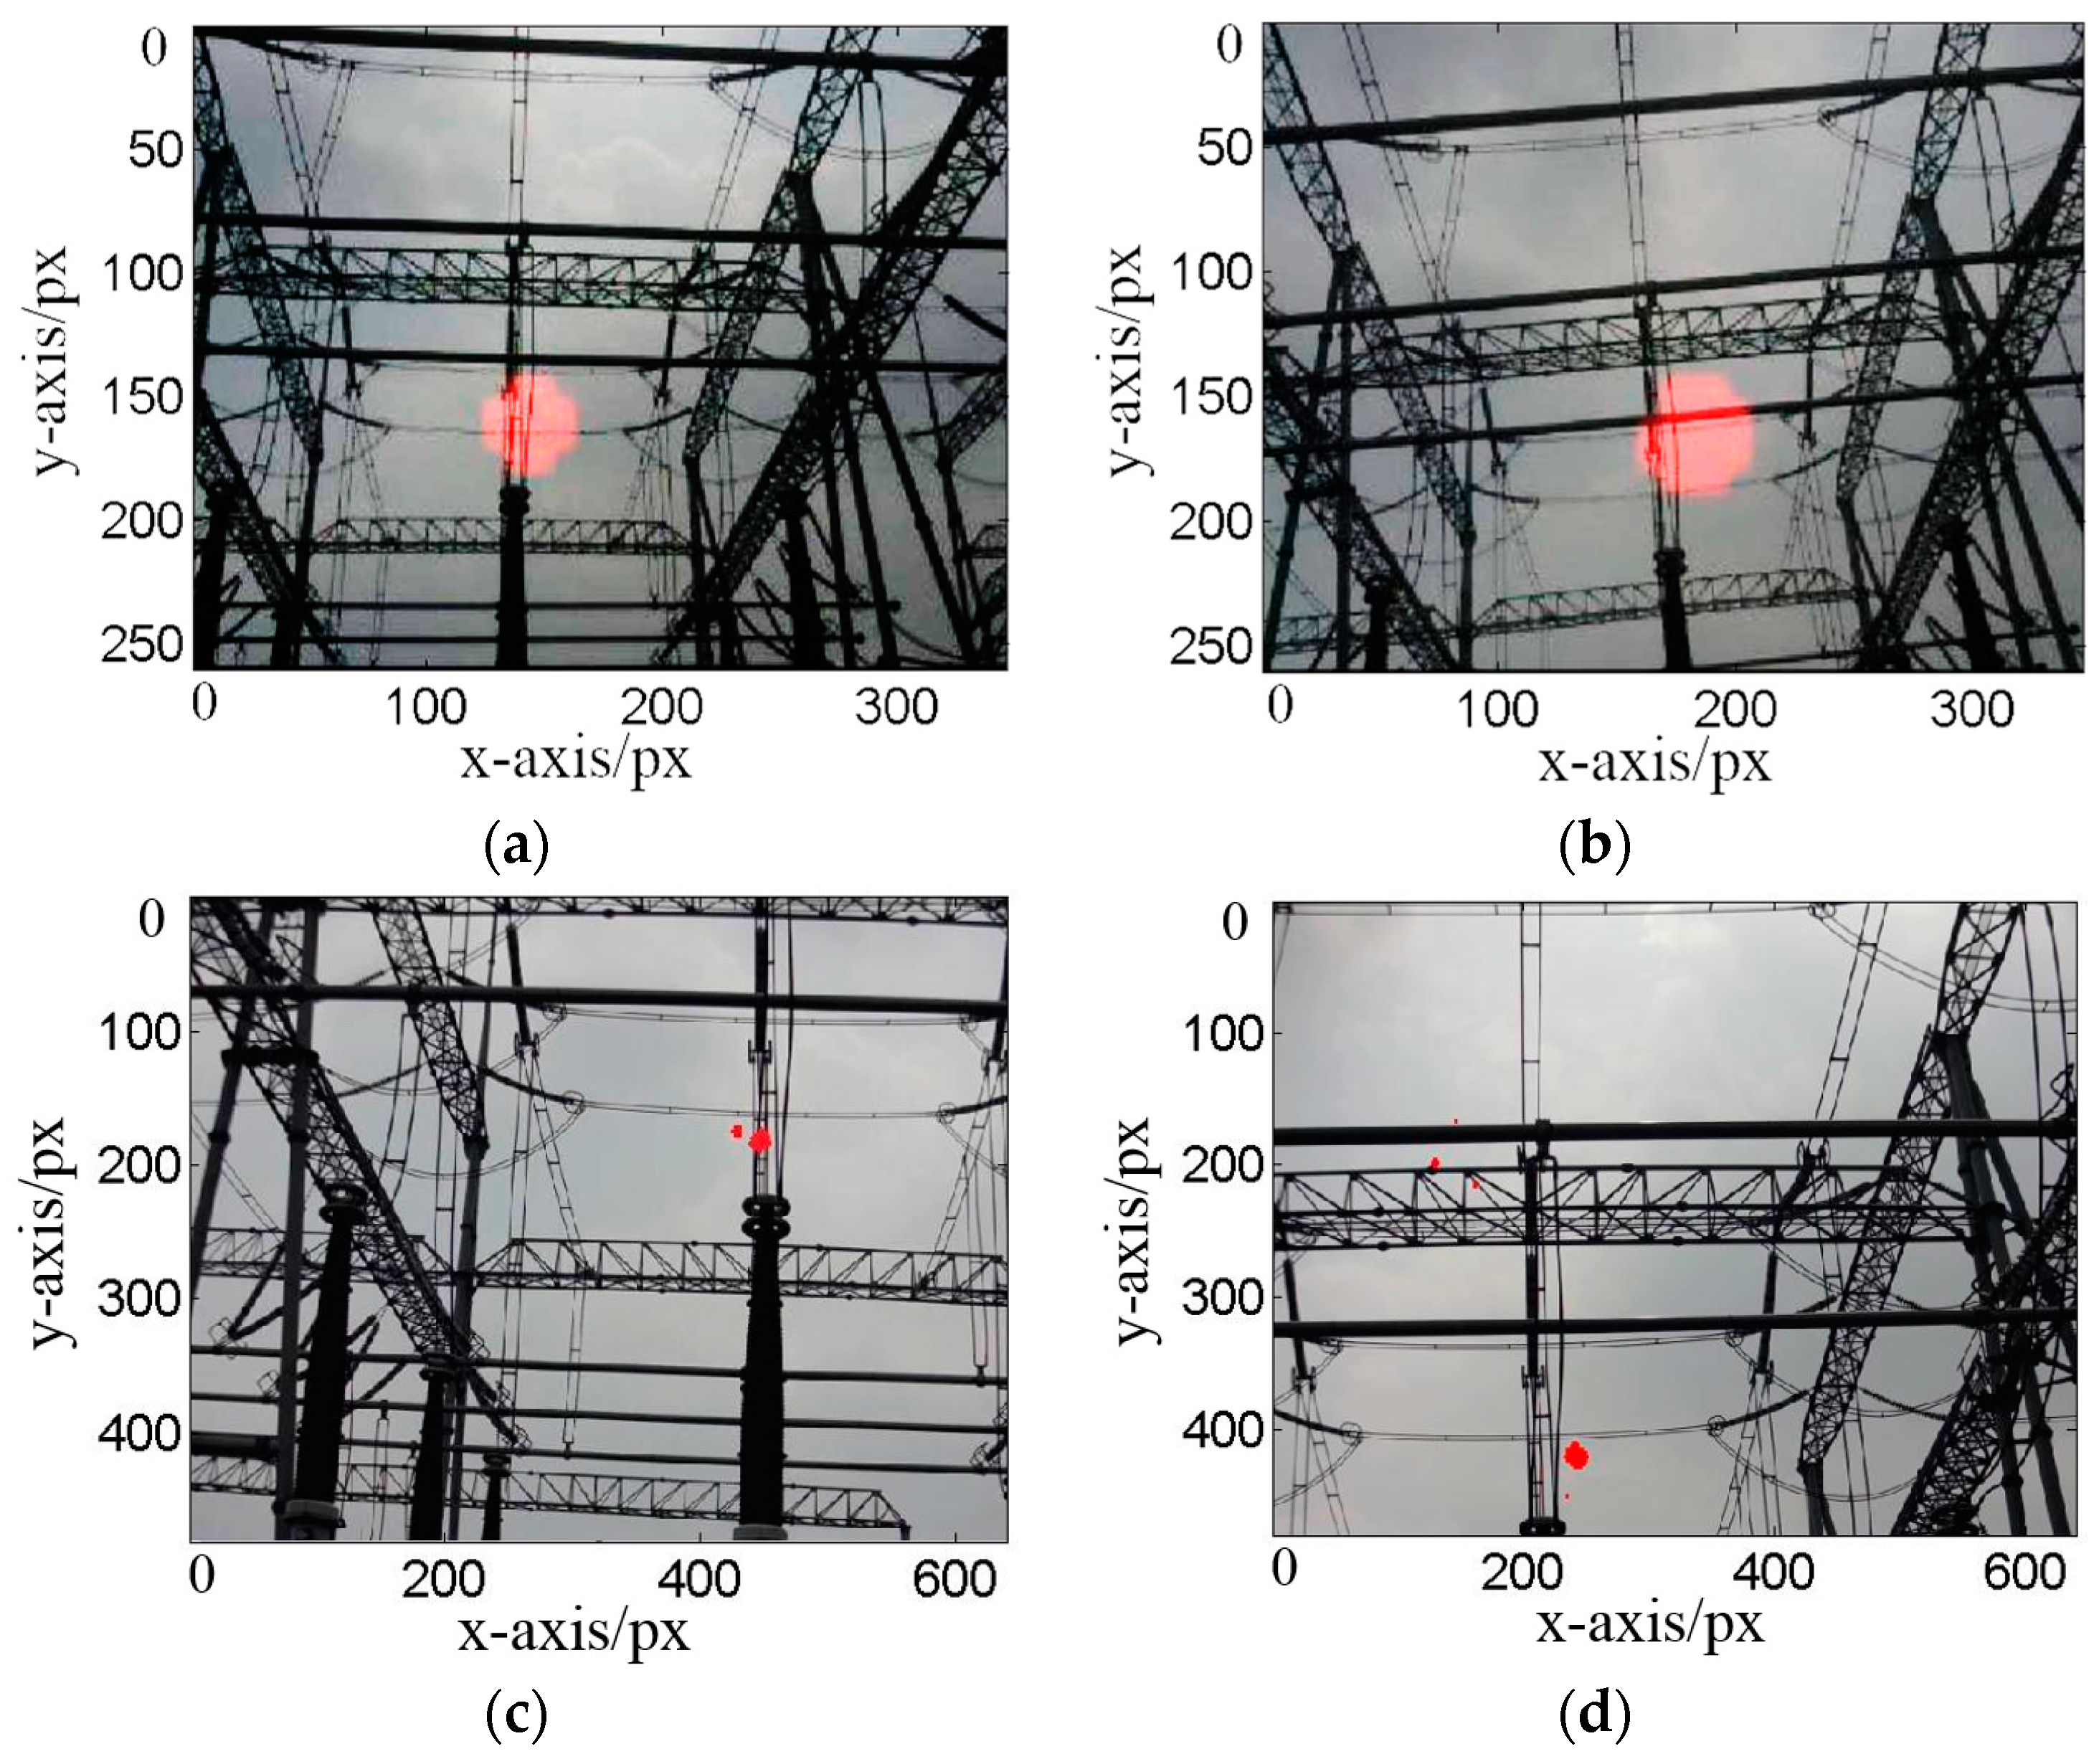
5. Practical Application of Acoustical Visual Detection in an Air Insulated Substation (AIS)

5.1. Measurement in AIS

To facilitate practical application of this technique in outdoor insulation detection, the new visualization detection was performed in a 500 kV air insulated substation (AIS) substation in Shanghai and was compared with UV imaging detection.
In outdoor insulation detection, the results will be influenced by the interference from animals and machines, which could make a sound in the frequency band of 20 kHz to 80 kHz. Therefore, the detection experiments must clear the interference, such as keeping the animals at least 50 m away or closing the machines when the detection is carried out.
Figure 12 shows the results of acoustic and UV detections. There is a limit for the elevation angle (φ), from 0° to 40°, and for the Azimuth angle (θ), from 0° to 360°, due to the camera. The discharge position was around the center of the image because the detection system was portable. The corona discharge occurred at the connection between the insulator and the line, and the detection distances were 25 m and 30 m, respectively.

5.2. Error of the Detection System

The positioning errors of the corona PD obtained by the acoustic visual detection and UV imaging detection are listed in Table 4.
The RMS (px) of error is the distance (px) between the positioning result and the real corona PD position in the video, physically. Table 4 shows that the acoustic method had a lower error of 5.32% comparing to that of UV. The results indicate that corona discharge position, identified by the ultrasonic method, was more accurate than the UV method in the effective distance. Moreover, the ultrasonic signal decayed significantly with distance and frequency band. Following this consideration, the ultrasonic sensor with its low response frequency (10–70 kHz) was selected to couple the PD signal, which makes the detection distance exceed 30 m.

6. Conclusions

In this study, a new DHUA was designed for the corona discharge detection of an outdoor AIS. The visualization of corona discharge was realized by using an array positioning algorithm and image fusion technology. Based on this new approach, the system was successfully built, by incorporating the marked ultrasonic corona discharge signal onto video, timely and directly, and the system was designed to be portable, with a size of 36 × 25 × 8 (mm). The frequency responses of the system were 10 kHz to 70 kHz, which realizes the maximum acquisition distance exceeding 30 m.
Evaluation tests were carried out in the laboratory and in AIS, respectively and successfully. The positioning errors of the system could be less than 10° as the detection distance exceeded 2.5 m, and the maximum acquisition distance exceeded 30 m, with an error of 5.32%. In general, the system was designed with a lower cost and higher accuracy, compared to the UV method. In the future, the system can be not only used in corona PD positioning detection, but also in sound field distribution measurement, vibration monitoring, etc.

Acknowledgments

This project was supported by the National Key Research and Development Program of China (Grant No. 2017YFB0902705) and the National Natural Science Foundation of China (Grant Nos. 51507130 and 51777157). The work in this paper was kindly helped and supported by Wenbin Zhao.

Author Contributions

Ming Dong and Ming Ren conceived and designed the experiments; Jiacheng Xie and Chongxing Zhang performed the experiments; Ao Ma analyzed the data and wrote the paper; Ricardo Albarracín gave some substantive suggestions and guidance about the research.

Conflicts of Interest

The authors declare no conflict of interest.

Abbreviations

The following abbreviations are used in this manuscript:
AISAir Insulated Substation
AEAcoustic-Emission
UHFUltra-High-Frequency
EMElectromagnetic
PDPartial Discharges
UVUltraviolet
HVHigh Voltage
DHUADouble-Helix-Ultrasonic-Array
GISGas-Insulated-Switchgear
VHFVery-High-Frequency
DOADirection of Arrival
MUSICMultiple Signal Classification
ADAnalog-to-Digital
TOATimes-of-Arrival
DFTDiscrete Fourier Transform
TCTTwo-sided Correlation Transformation
RMSRoot-Mean-Square

References

  1. Judd, M.D.; Farish, O.; Hampton, B.F. The excitation of UHF signals by partial discharges in GIS. IEEE Trans. Dielectr. Electr. Insul. 1996, 3, 213–228. [Google Scholar] [CrossRef]
  2. IEC-62478. High-Voltage Test Techniques-Measurement of Partial Discharges by Electromagnetic and Acoustic Methods. In Proposed Horizontal Standard, 1st ed.; International Electro Technical Commission (IEC): Geneva, Switzerland, 2016. [Google Scholar]
  3. Judd, M.D.; Li, Y.; Hunter, I.B.B. Partial discharge monitoring of power transformers using UHF sensors—Part I: Sensors and signal interpretation. IEEE Electr. Insul. Mag. 2005, 21, 5–14. [Google Scholar] [CrossRef]
  4. Albarracín, R.; Ardila-Rey, J.A.; Mas’ud, A.A. On the Use of Monopole Antennas for Determining the Effect of the Enclosure of a Power Transformer Tank in Partial Discharges Electromagnetic Propagation. Sensors 2016, 16, 148. [Google Scholar] [CrossRef] [PubMed]
  5. Gao, W.S.; Ding, D.W.; Liu, W.D.; Feng, R. Location of PD by Searching in Space Using UHF Method. High Volt. Eng. 2009, 23, 535–511. [Google Scholar]
  6. Albarracín, R.; Robles, G.; Martínez-Tarifa, J.M.; Ardila-Rey, J. Separation of sources in radiofrequency measurements of partial discharges using time-power ratio maps. ISA Trans. 2015, 58, 389–397. [Google Scholar] [CrossRef] [PubMed] [Green Version]
  7. Wang, Y.Y.; Ji, S.C.; Li, J.Y.; Zhong, L.; Cui, Y.; Wang, W. Ultraviolet Images of 50-Hz AC Discharges in SF6 Atmosphere. IEEE Trans. Plasma Sci. 2014, 42, 2840–2841. [Google Scholar]
  8. James, R.E. Discharge detection in high-voltage power transformers. Proc. Inst. Electr. Eng. 1970, 117, 1352–1362. [Google Scholar] [CrossRef]
  9. Krim, H.; Forster, P.; Proakis, J.G. Operator approach to performance analysis of root-music and root min-norm. IEEE Trans. Signal Process. 1992, 40, 799–806. [Google Scholar] [CrossRef]
  10. Fuhr, J.; Haessing, M.; Boss, P.; Tschudi, D.; King, R.A. Detection and location of internal defects in the insulation of power transformers. IEEE Trans. Electr. Insul. 1993, 28, 157–167. [Google Scholar] [CrossRef]
  11. Markalous, S.M.; Tenbohlen, S.; Feser, K. Detection and location of partial discharge in power transformers using acoustic and electromagnetic signals. IEEE Trans. Dielectr. Electr. Insul. 2008, 15, 1576–1583. [Google Scholar] [CrossRef]
  12. Robles, G.; Albarracín, R.; Vázquez, J.L. Antennas in Partial Discharge Sensing System. In Handbook of Antenna Technologies; Chen, Z.N., Ed.; Springer: Singapore, 2015; pp. 1–47. [Google Scholar]
  13. Xie, Q.; Lv, F.C.; Li, C.R.; Li, C.; Wang, N.; Ding, Y. Method for PD location in oil combining ultrasonic phased array with wideband array signal processing. Proc. CSEE 2009, 29, 13–17. [Google Scholar]
  14. Lu, Y.; Tan, X.; Hu, X. PD Detection and Localizations by Acoustic Measurements in an Oil-filled Transformer. IEEE Proc. Sci. Meas. Technol. 2000, 147, 81–85. [Google Scholar] [CrossRef]
  15. Jing, R.K.; Li, J.Z.; Zhou, H.L. Research progress of ultrasonic NDT technology. Foreign Electr. Meas. Technol. 2012, 31, 28–30. [Google Scholar]
  16. Jin, S.J.; Yang, X.X.; Chen, S.Z. Development and application of ultrasonic phased array inspection technology. J. Electr. Meas. Instrum. 2014, 9, 925–934. [Google Scholar]
  17. Luo, Y.F.; Li, Y.M.; Liu, L.C. Simulation of PD location method in oil based on UHF and ultrasonic phased array receiving theory. Trans. China Electrotech. Technol. Soc. 2004, 19, 35–39. [Google Scholar]
  18. Luo, Y.F.; Ji, S.C.; Li, Y.M. Phased ultrasonic receiving planar array transducer for partial discharge location in transformer. IEEE Trans. Ultrason. Ferroelectr. Freq. Control 2006, 53, 614–622. [Google Scholar]
  19. Xin, X.H.; Li, J.S.; Ji, H.Y. Study of Cross-shaped Ultrasonic Array Senor Applied to Partial Discharge Location in Transformers. Proc. CSEE 2013, 21, 154–162. [Google Scholar]
  20. Li, T.; Xu, Y.Q.; Yang, Y.L. Development and experimental study of PD positioning system based on a circular ring ultrasonic array sensor. Electr. Meas. Instrum. 2015, 14, 110–123. [Google Scholar]
  21. Li, Y.Q.; Wang, F.; Wang, C. Experimental Study of PD Ultrasonic Location Based on Cross-shaped Ultrasonic Array Sensor. Insul. Mater. 2014, 6, 74–78. [Google Scholar]
  22. Wang, Y.L.; Chen, H.; Peng, Y.N.; Wan, Q. Spatial Spectrum Estimation Theory and Algorithm, 1st ed.; Tsinghua University Press: Beijing, China, 2004. [Google Scholar]
  23. Xie, Q. Research on Partial Discharge Ultrasonic Array Location Method in Transformer Based on Spatial Spectrum Estimation; North China Electric Power University: Baoding, China, 2010. [Google Scholar]
  24. Xie, Q.; Zhang, L.J.; Cheng, S.Y.; Hou, S.; Peng, L.; Lv, F. Application of the fast ICA algorithm to PD ultrasonic array signal De-noising. Proc. CSEE 2012, 32, 160–166. [Google Scholar]
  25. Wu, H.; Xu, D. Survey of digital image compositing. J. Image Graph. 2012, 11, 1333–1346. [Google Scholar]
  26. Hou, S.S. Study on the Method of Partial Discharge Ultrasonic Array Sensors’ Sparse Design. Master’s Thesis, School of Electrical and Electronic Engineering, North China Electric Power University, Beijing, China, 2014. [Google Scholar]
  27. Wu, S. Research on Fault Diagnosis of Power Transformer Based on Acoustic Features; Huazhong University of Science & Technology: Wuhan, China, 2012. [Google Scholar]
  28. Xie, Q.; Cheng, S.Y.; Geng, J.H.; Lv, F.C.; Hou, S.S. A Quantitative Evaluation Method for Acoustic Performances of Partial Discharge’s Ultrasonic Array Sensors. Proc. CSEE 2014, 34, 956–970. [Google Scholar]
  29. Rojas-Moreno, M.V.; Robles, G.; Albarracín, R.; Ardila-Rey, J.A.; Martínez-Tarifa, J.M. Study on the self-integration of a Rogowski coil used in the measurement of partial discharges pulses. Electr. Eng. 2016, 163, 1–10. [Google Scholar]
  30. IEC-60270. High-Voltage Test Techniques-Partial Discharge Measurements, 3rd ed.; International Electrotechnical Commission (IEC): New Delhi, India, 2000. [Google Scholar]
Figure 1. Coordinate system in space for the corona discharge direction.
Energies 10 02105 g001
Figure 2. Flowchart of acoustic signal processing, DOA: direction of arrival; DFT: discrete Fourier transform.
Energies 10 02105 g002
Figure 3. Relationship between spatial spectrum and ultrasonic signal frame F(z).
Energies 10 02105 g003
Figure 4. Results of image fusion.
Energies 10 02105 g004
Figure 5. Double-helix-ultrasonic-array.
Energies 10 02105 g005
Figure 6. Static beam patterns of several kinds of ultrasonic arrays. (a) Static beam patterns of an 8 × 8 rectangle array; (b) Sectional drawing of the beam pattern for an 8 × 8 rectangle array (elevation angle = 180°); (c) Static beam patterns of a circle array; (d) Sectional drawing of the beam pattern for a circle array (Azimuth angle = 90°); (e) Static beam patterns of a six concentric circles array; (f) Sectional drawing of the beam pattern for a six concentric circles array (Azimuth angle = 90°); (g) Static beam patterns of a double-helix-array; (h) Sectional drawing of the beam pattern for a double-helix-array (Azimuth angle = 90°).
Energies 10 02105 g006aEnergies 10 02105 g006b
Figure 7. Picture sensor array printed circuit board (PCB) board.
Energies 10 02105 g007
Figure 8. Experimental setup in the laboratory.
Energies 10 02105 g008
Figure 9. Acoustic signals coupled by the array sensor. Due to space limit and the similarity of 31 signals, four of the 31-recorded signals are shown here. (a) channel 1; (b) channel 2; (c) channel 3; (d) channel 4.
Energies 10 02105 g009
Figure 10. Contour map and DOA spectrum for test PD. (a) 1.5 m DOA spectrum; (b) 1.5 m contour map of the DOA spectrum; (c) 2 m DOA spectrum; (d) 2 m contour map of the DOA spectrum; (e) 2.5 m DOA spectrum; (f) 2.5 m contour map of the DOA spectrum; (g) 3 m DOA spectrum; (h) 3 m contour map of the DOA spectrum; (i) 4 m DOA spectrum; (j) 4 m contour map of the DOA spectrum; (k) 5 m DOA spectrum; (l) 5 m contour map of the DOA spectrum.
Energies 10 02105 g010aEnergies 10 02105 g010b
Figure 11. Relationship between error and detection distance.
Energies 10 02105 g011
Figure 12. Detection results in an air insulated substation (AIS) with a temperature of 37 °C and humidity of 48%. (a) Ultrasonic results at 25 m; (b) Ultrasonic results at 30 m; (c) UV results at 25 m; (d) UV results at 30 m.
Energies 10 02105 g012
Table 1. Beam widths at zero point (BW0) and half-power point (BW0.5).
Array TypesBW0BW0.5
Rectangle array60°31.21°
Circle array55.80°51.82°
Six concentric circles array55.00°33.14°
Double-helix-array41.10°24.70°
Table 2. Data of the test conditions.
Applied Voltage/kVPartial Discharge (PD)/pCTest Distance (m)
9.7 (inception)100 pC[1.46]
12.51400[1.46~2.46]
132100[1.46~2.46]
13.52600[1.46~3.46]
143800[1.46~4.46]
16.1 (critical breakdown)8000[1.46~7.46]
Table 3. Test results in lab.
SiteDistance/mSet Up Angle (θ,φ)/°DOA Angle (θ,φ)/°Error (Δθφ)/°Root Mean Square (RMS)/°
Lab1.5(122.31,28.45)(147.5,66.7)(25.19,38.25)45.79
2(191.37,3.28)(194.5,41.8)(3.13,38.52)38.64
2.5(173.02,38.49)(178.4,48.5)(5.38,10.01)11.36
3(202.61,39.71)(208.5,45.6)(5.89,5.89)8.31
4(203.09,44.23)(206.5,45.7)(3.41,1.47)3.71
5(194.18,50.98)(196.6,52.6)(2.42,1.62)2.91
Table 4. Test results in the practical substation.
ObjectDistance/mReal Corona PD Position/pxMarked Position/pxError/pxRMS of Error/px
(a) Acoustic25(166,172)(181,170)(15,2)15.13
(b) Acoustic30(135,149)(144,162)(9,13)15.81
(c) UV25(443,184)(443,120)(0,64)64
(d) UV30(244,420)(209,361)(35,59)68.60

