Analysis of Heating Expenses in a Large Social Housing Stock Using Artificial Neural Networks


Abstract
1. Introduction
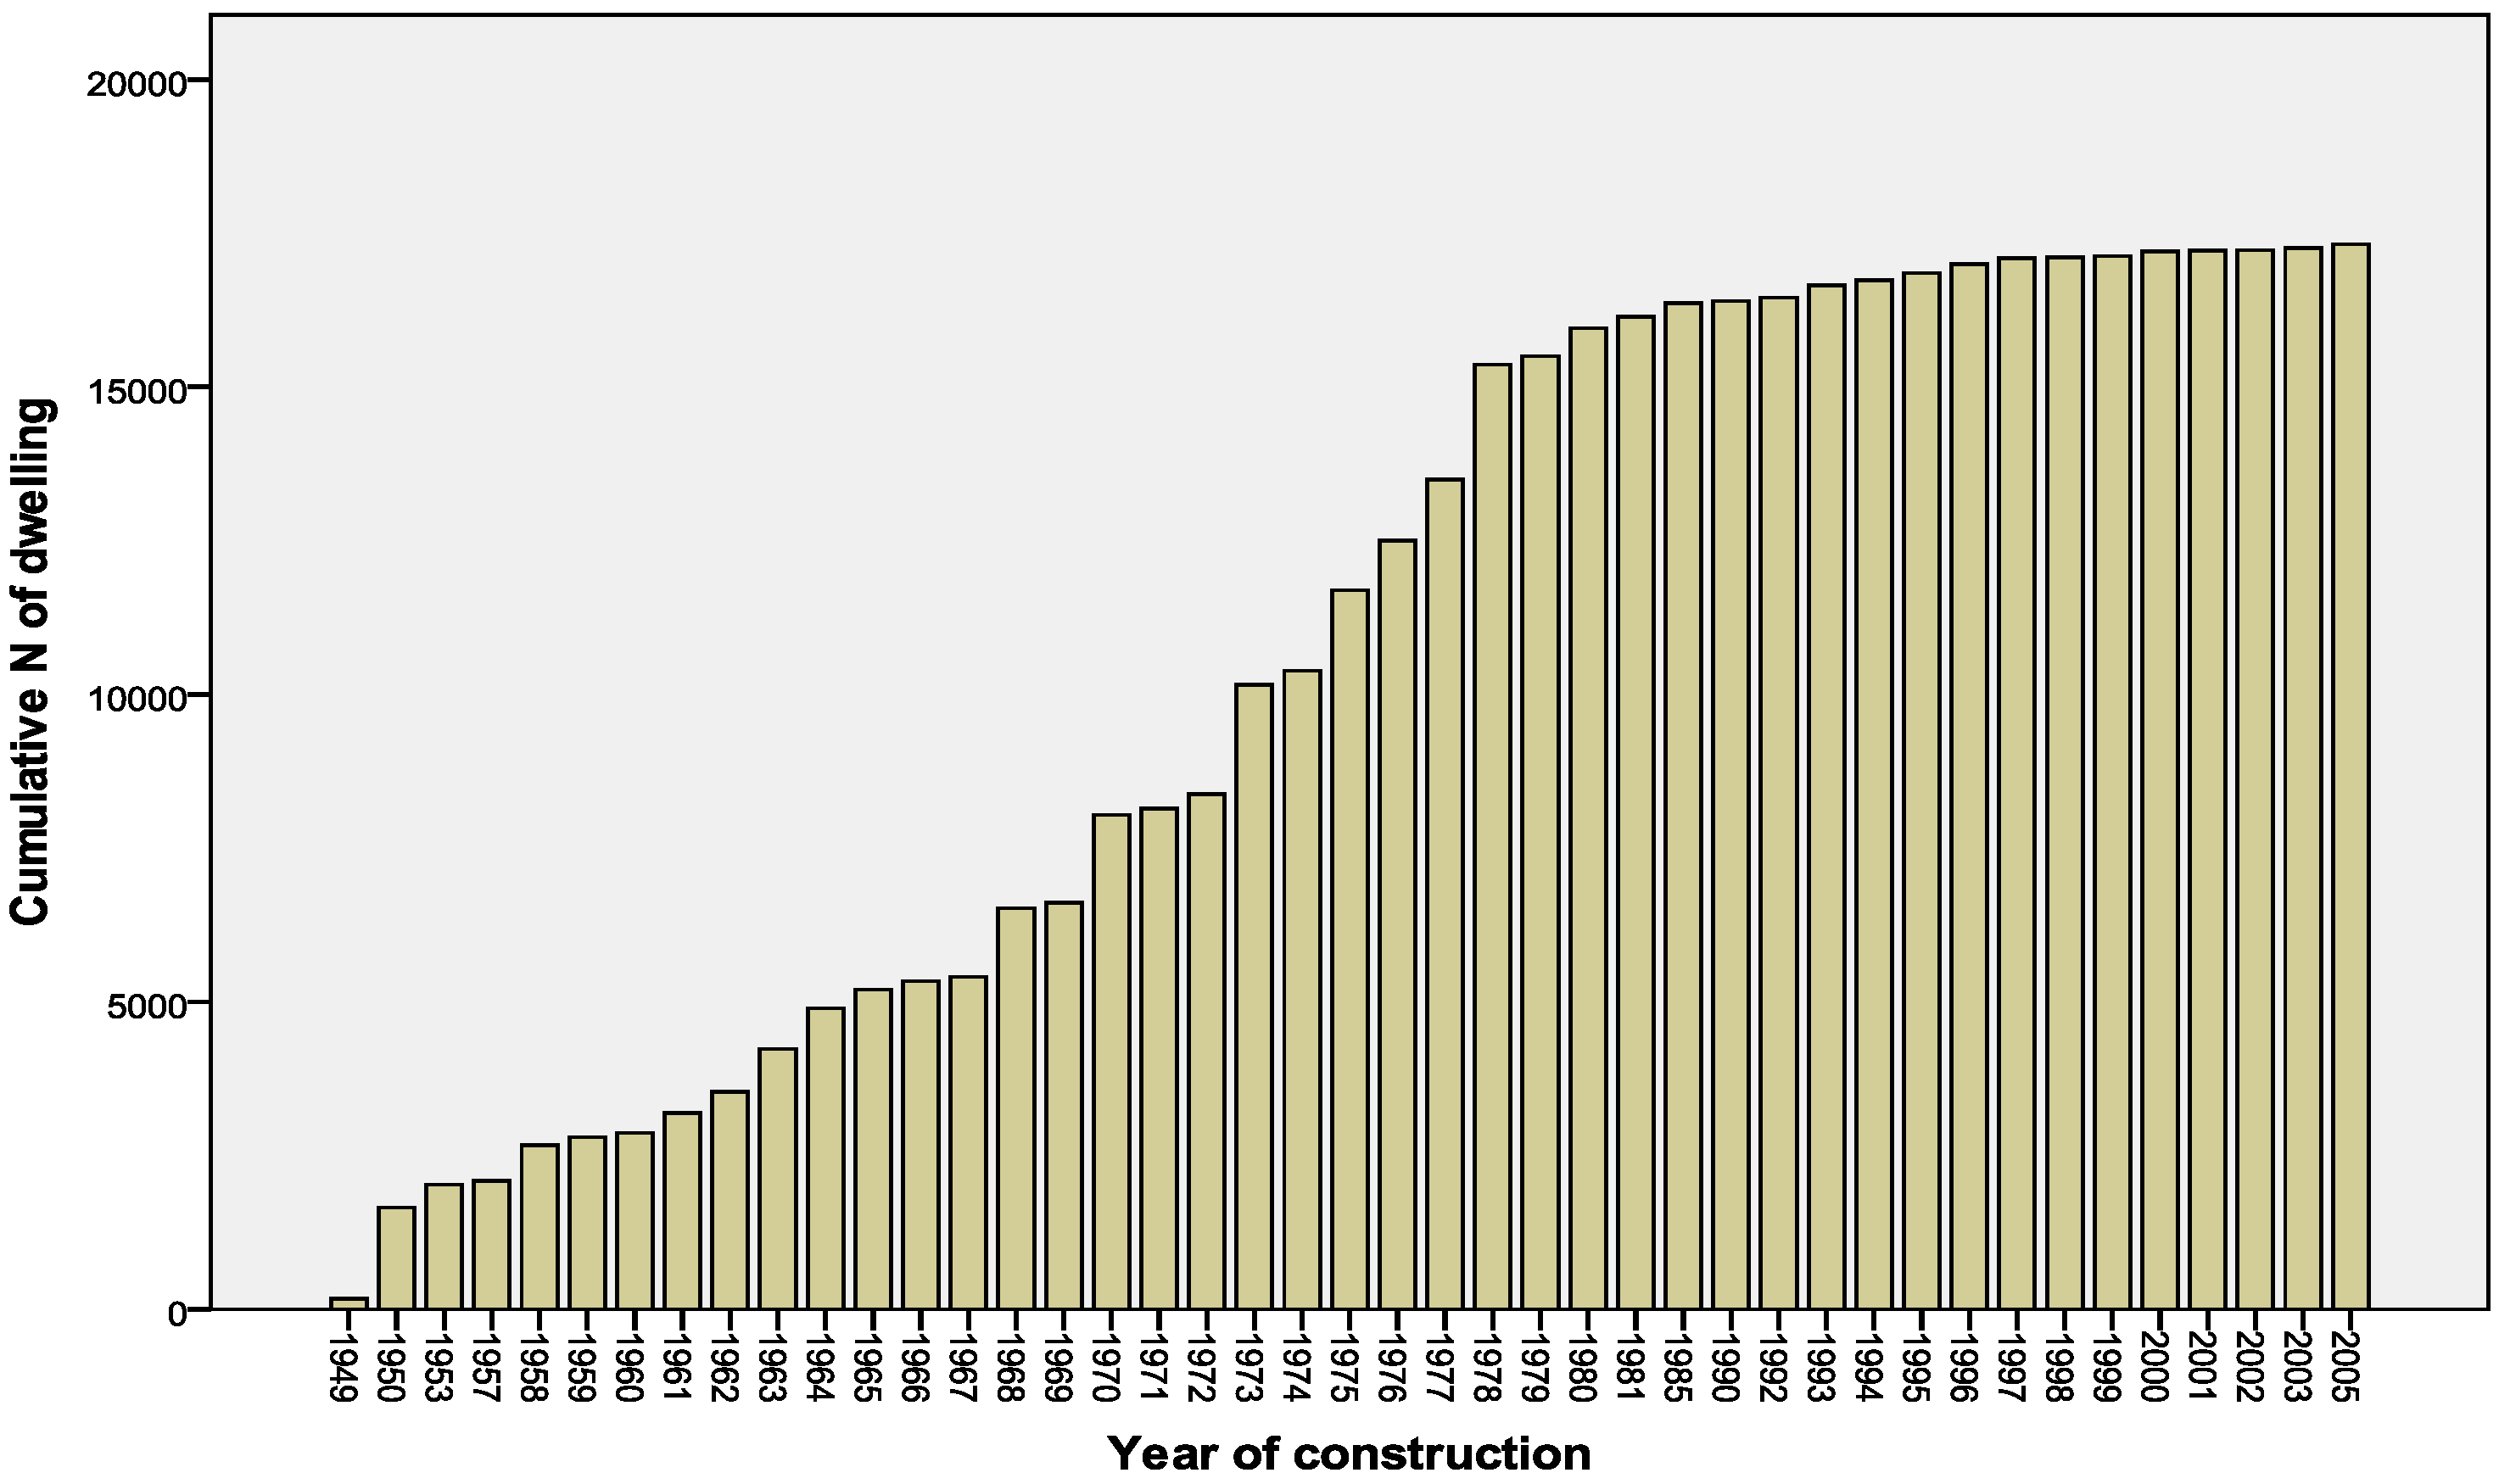
2. Presentation of the Social Housing Stock
3. The Use of the ANN Approach for Energy Expenses Modeling
3.1. The Presentation of the ANN Approach
3.2. Determination of the ANN Architecture
- the training set, which is used to train the ANN model and to adjust the connection weights;
- the testing set, which measures the ability of the model to be generalized; and
- the holdout set, which is used to determine the performances of the ANN model on patterns, which were not used in the previous two phases.
3.3. Analysis of the Influence of the Input Indicators on the Heating Expenses
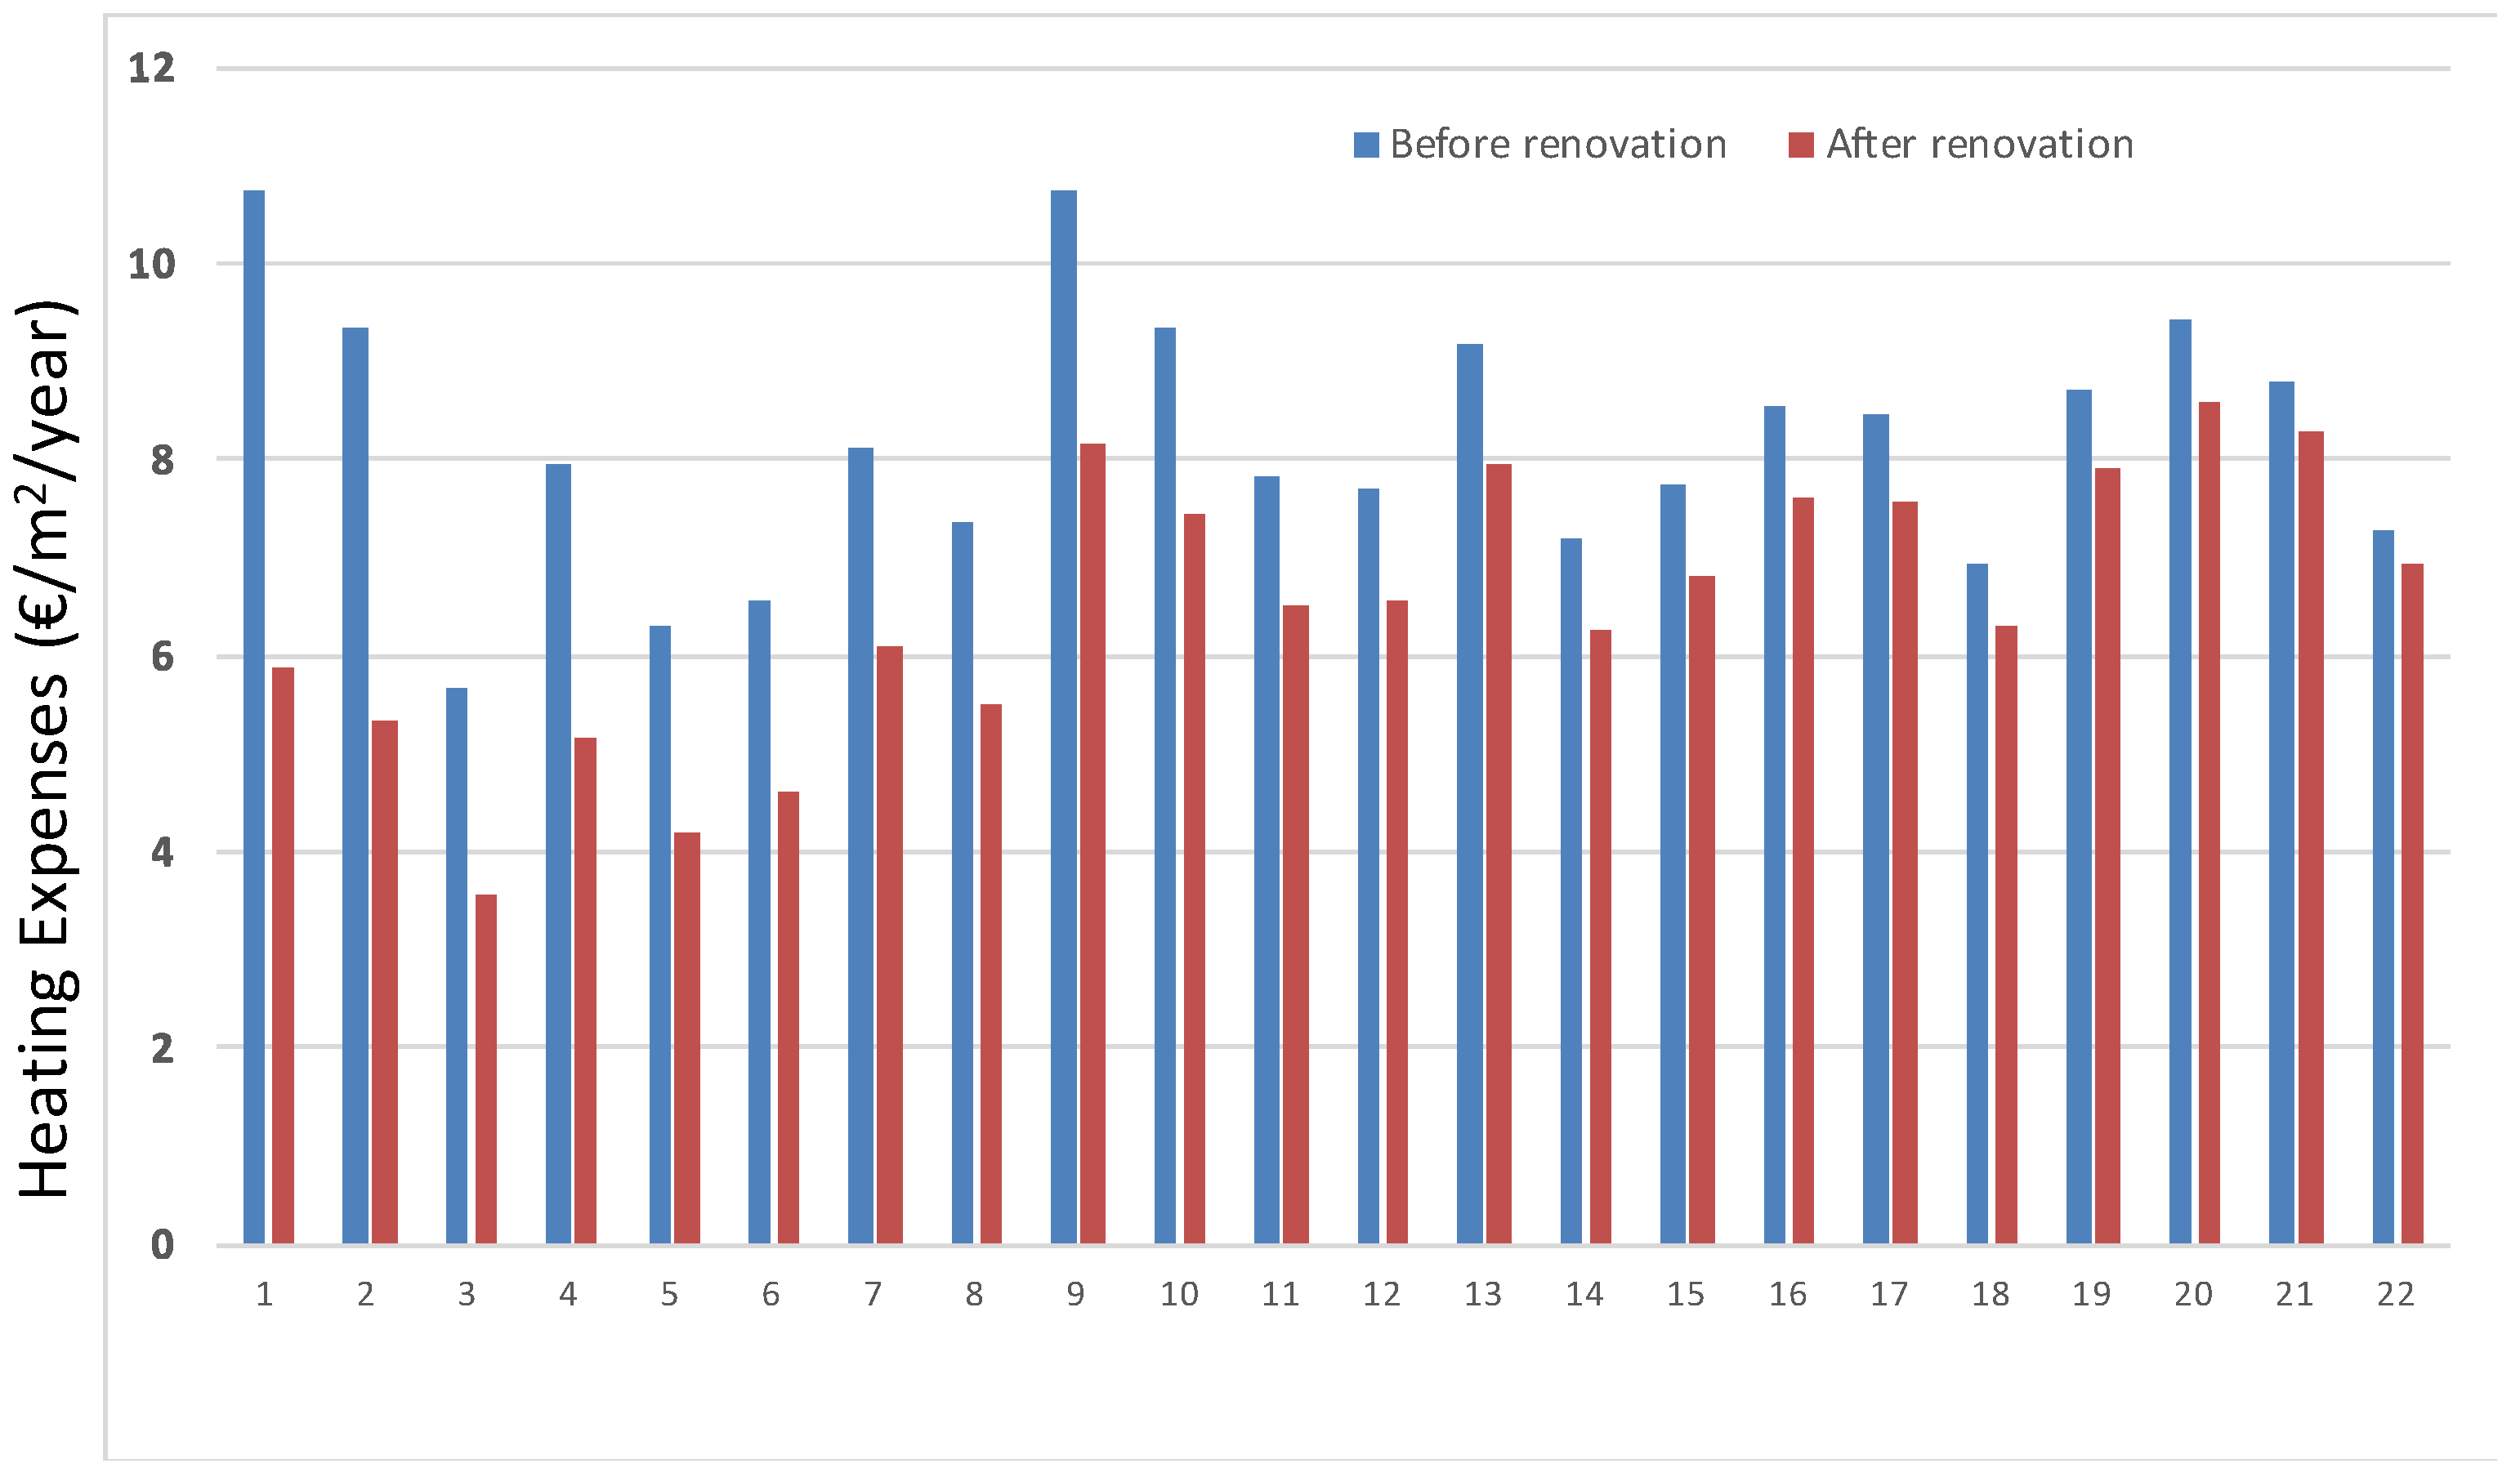
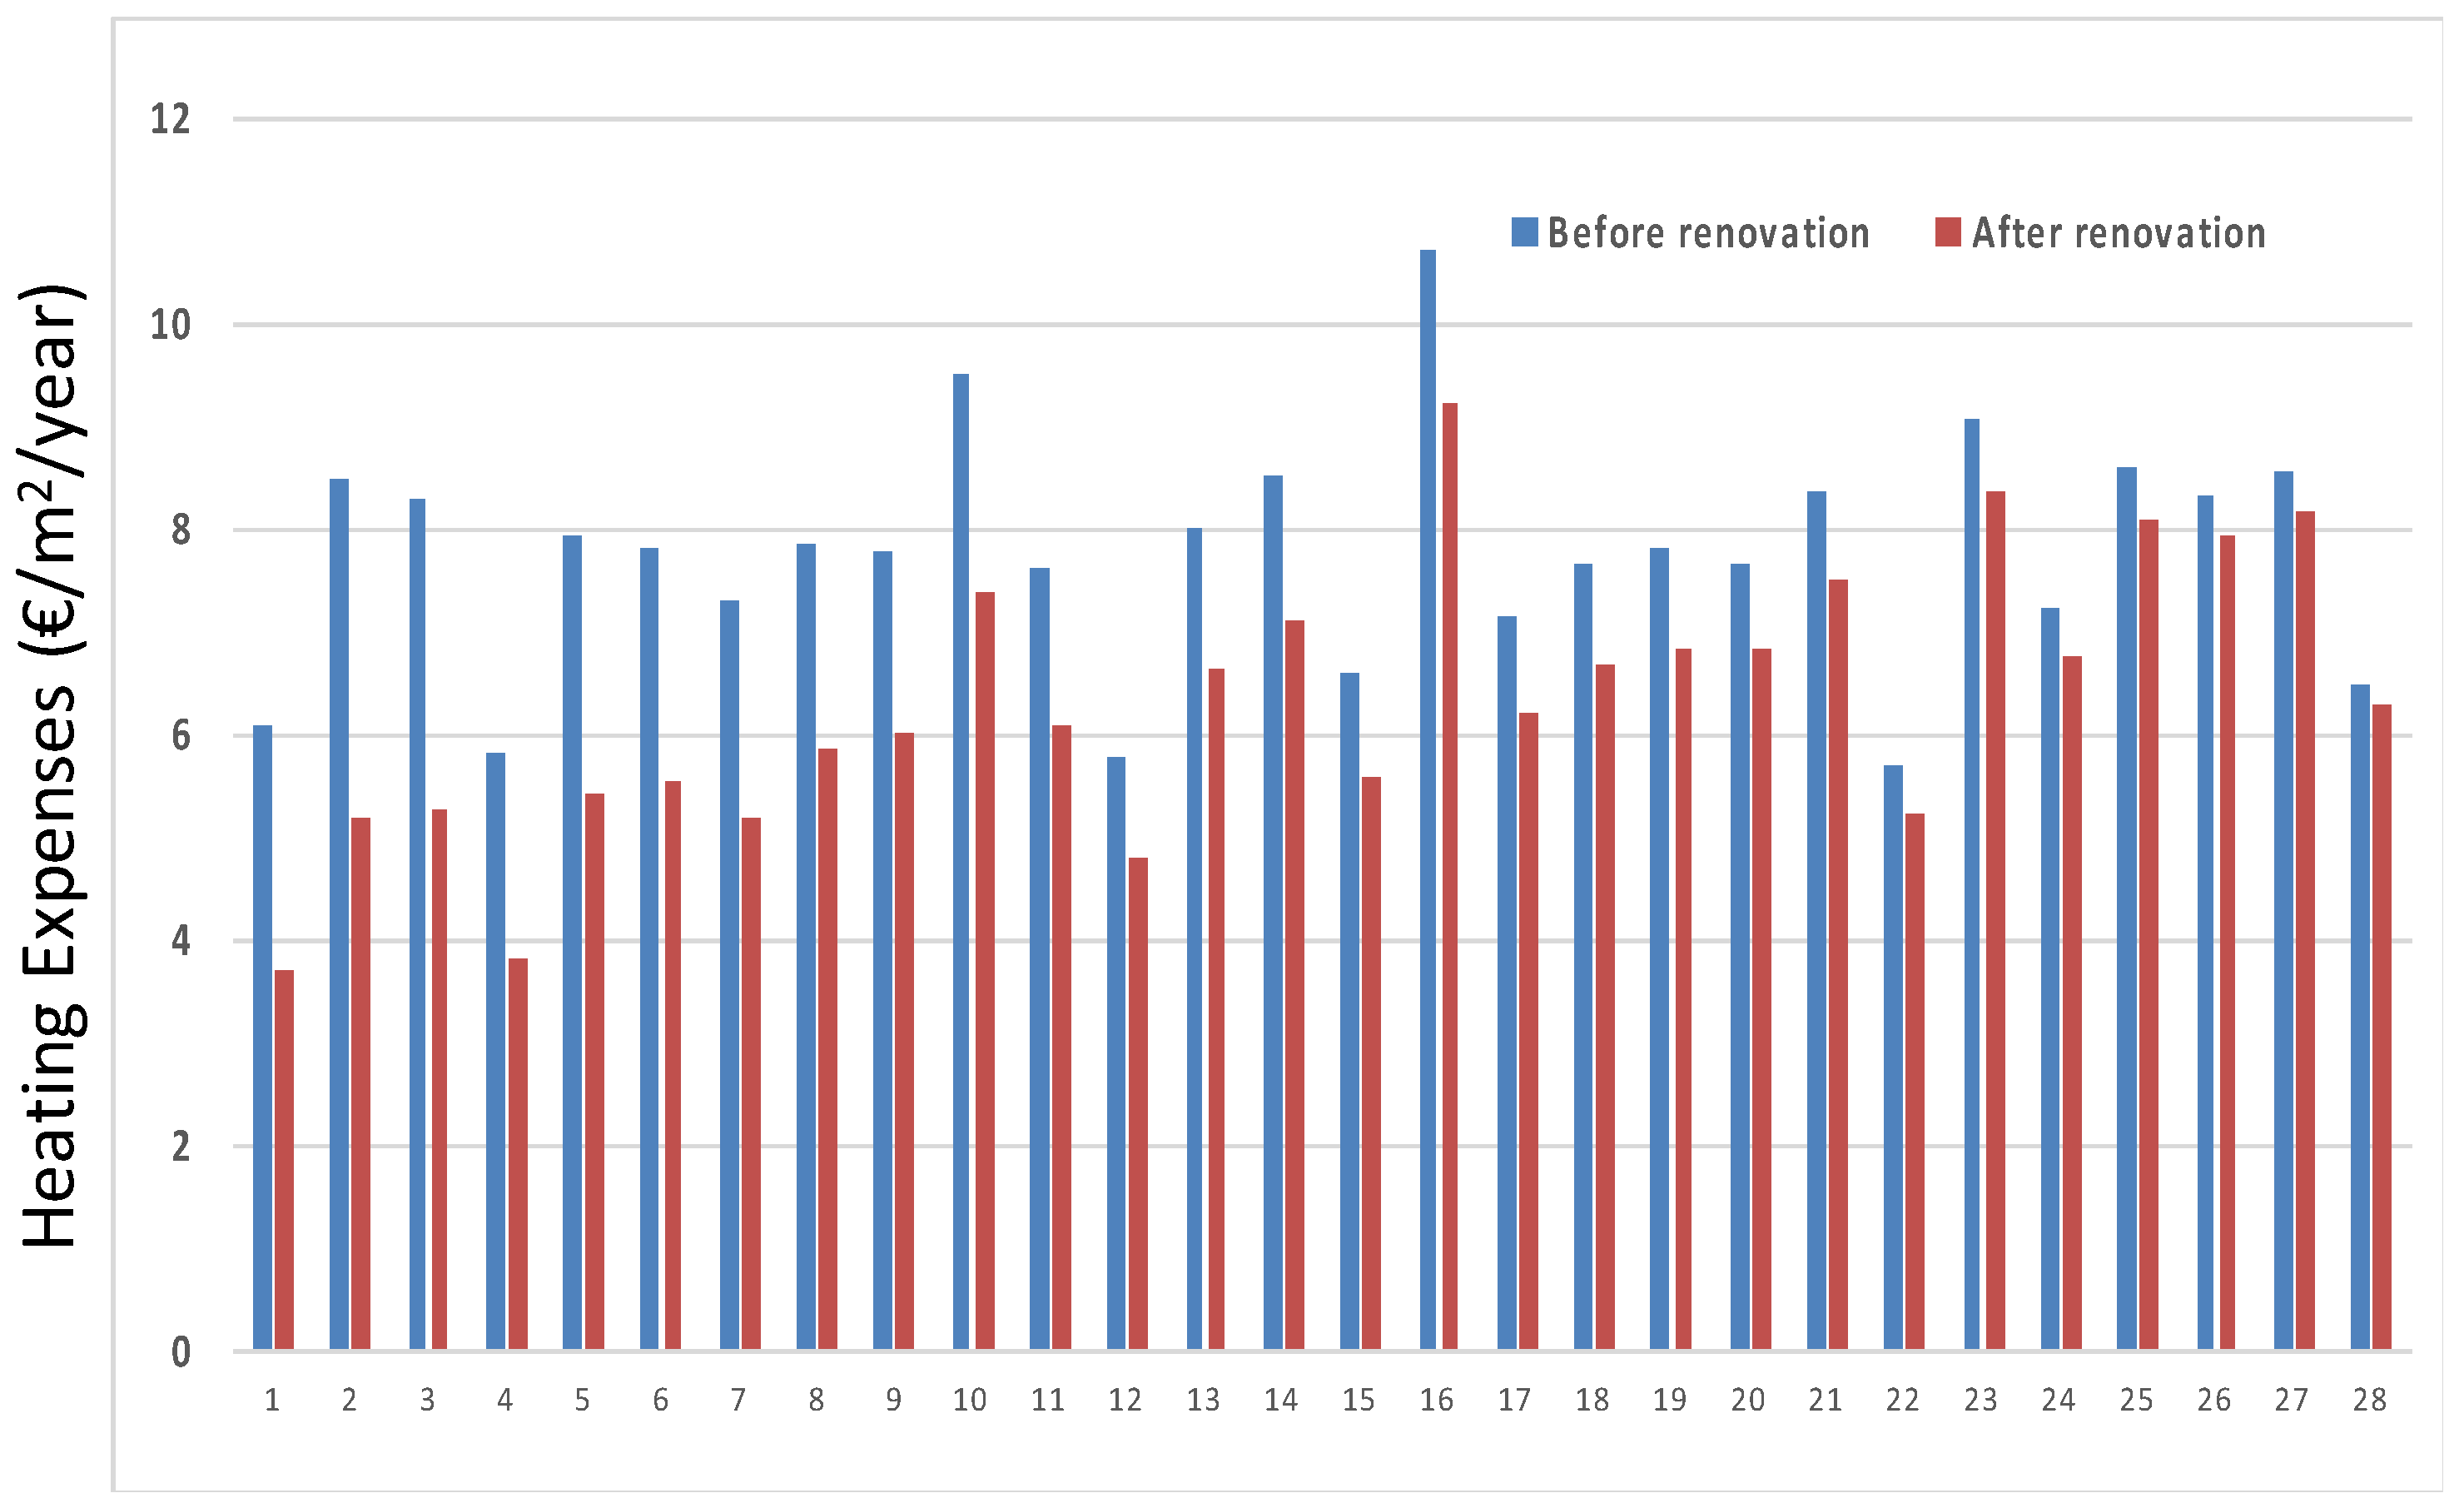
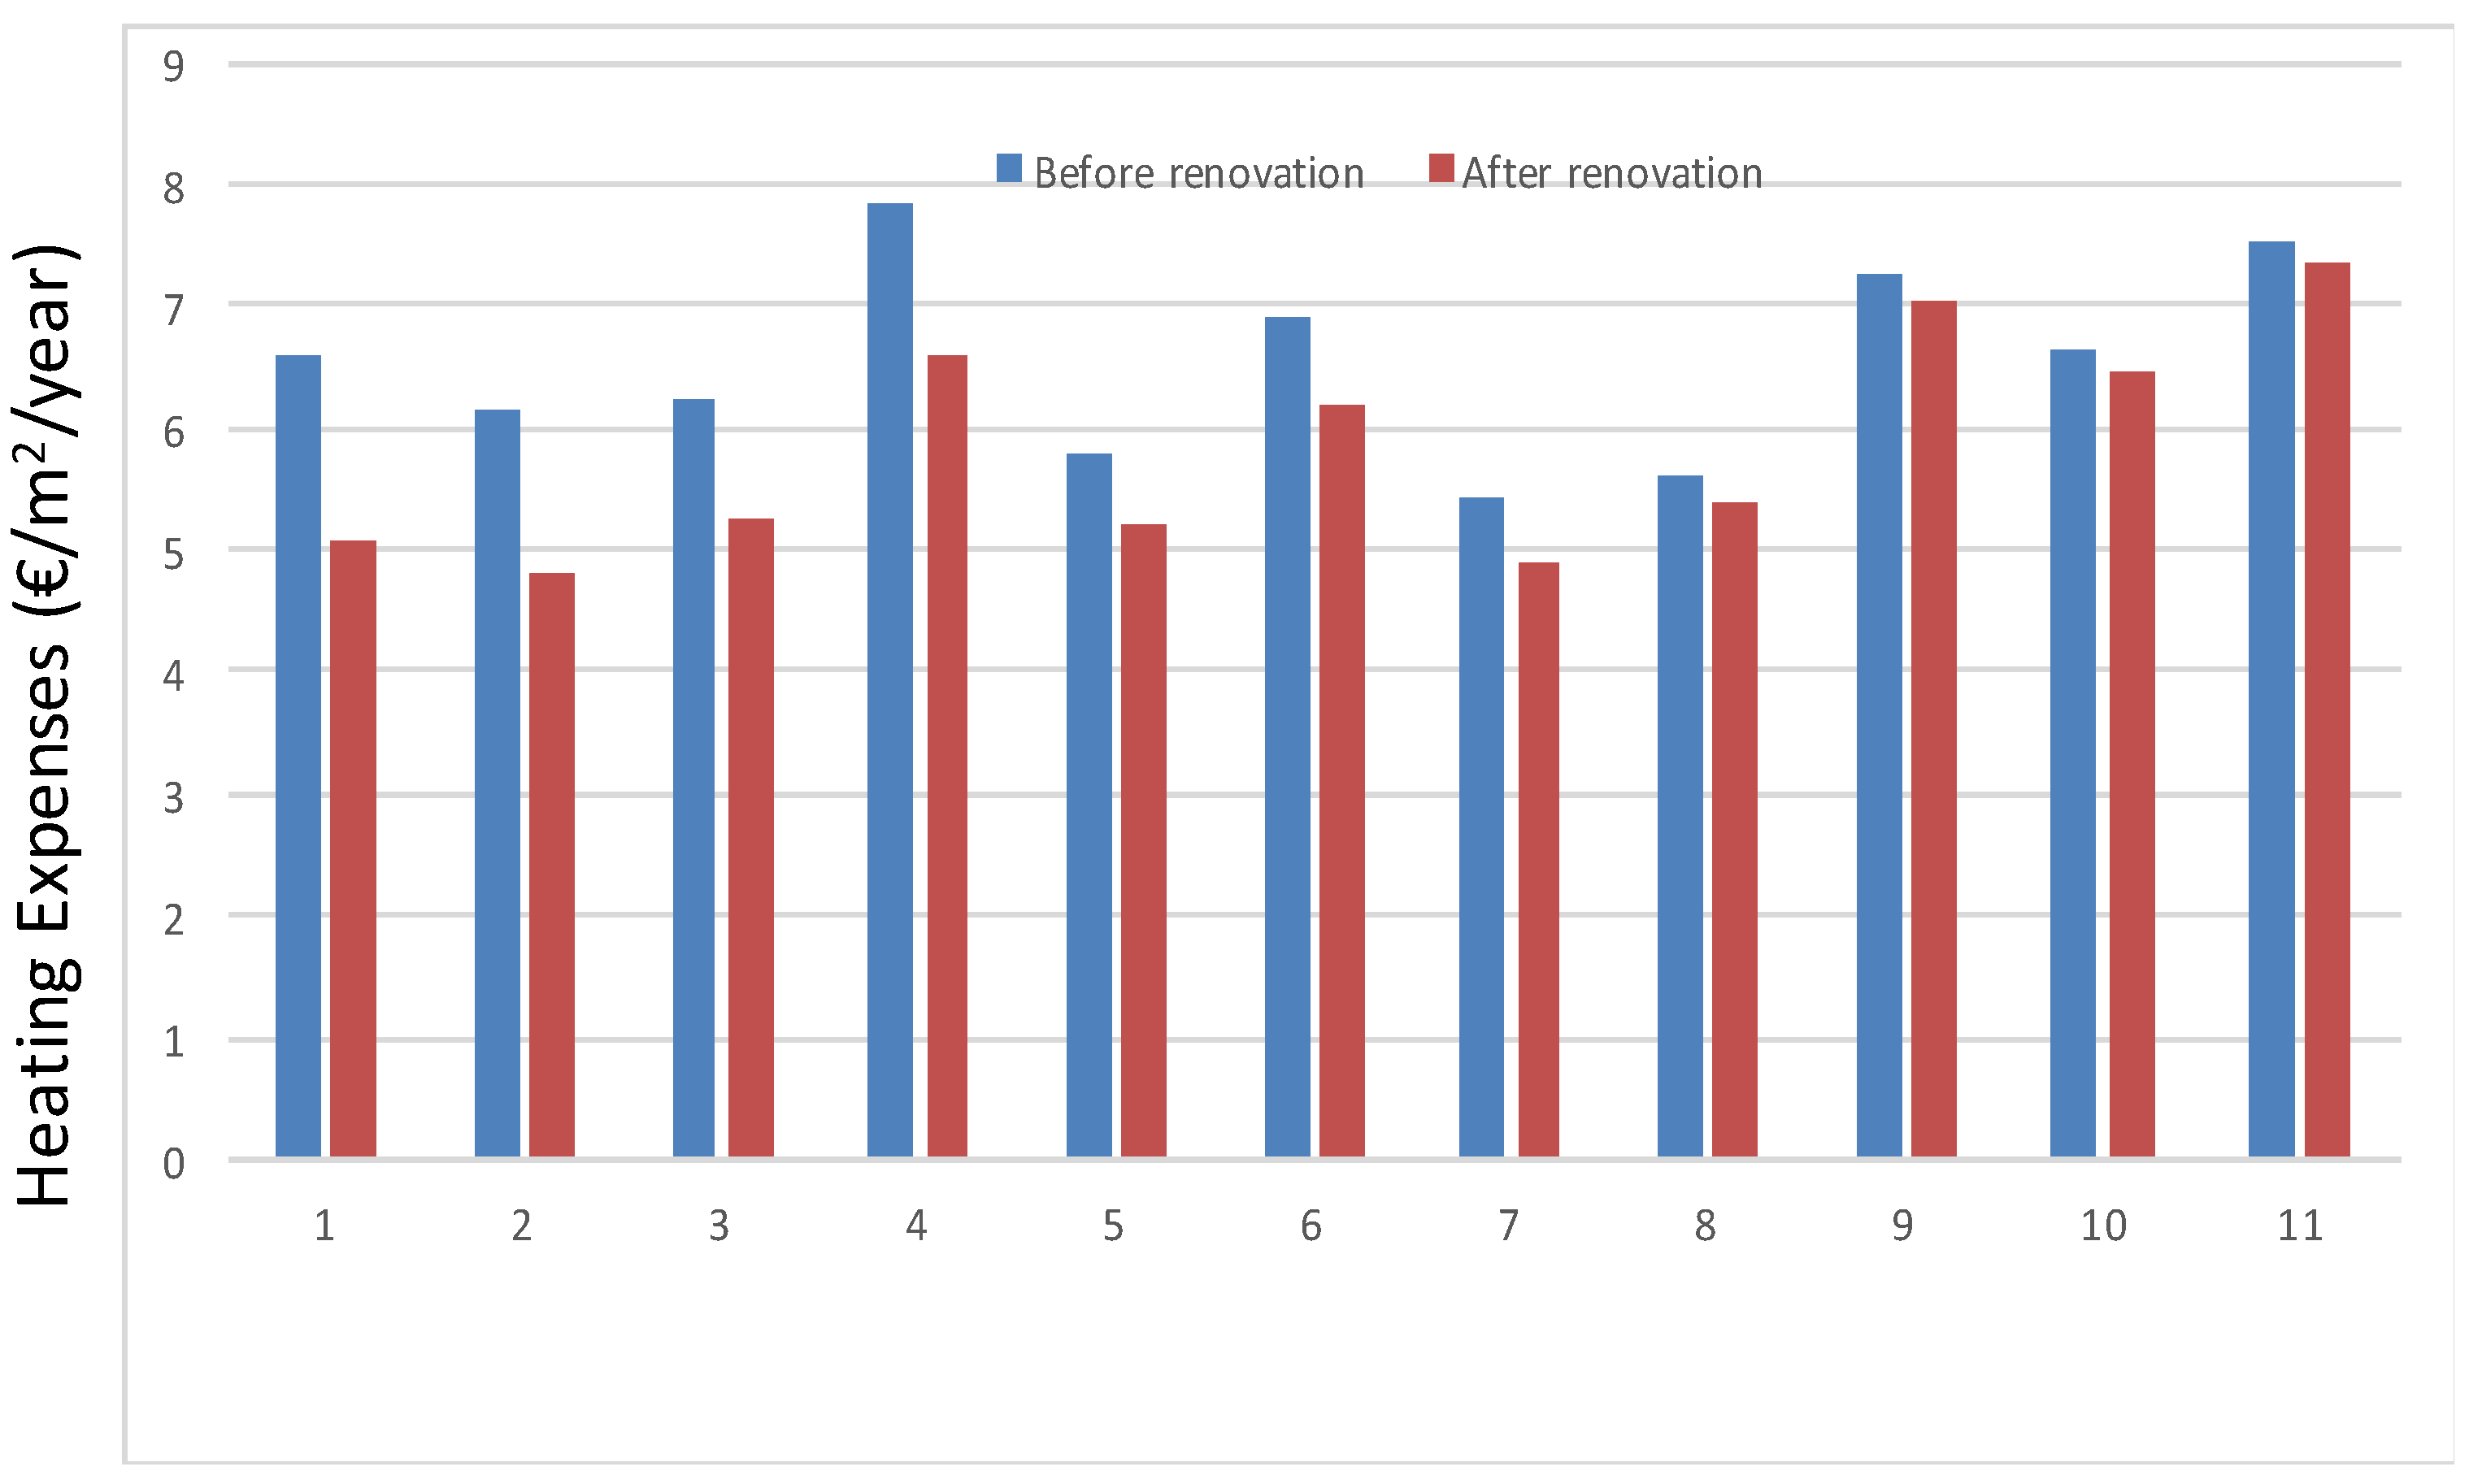
4. The Use of the ANN Model for Establishing Renovation Strategy
5. Conclusions
Author Contribution
Conflicts of Interest
References
- Commissariat Général au Développement Durable. Compte du Logement 2012. Premiers Résultats 2014. Available online: http://www.statistiques.developpementdurable.gouv.fr/fileadmin/documents/Produits_editoriaux/Publications/References/2014/compte-logement/references-compte-logement2012-premiers-resultats2013-ed2014.pdf (accessed on 2 April 2017).
- Balaras, C.; Gaglia, A.; Georgopoulou, A.; Mirasgedis, S.; Dimitris, Y.; Lalas, P. European residential buildings and empirical assessment of the Hellenic building stock, energy consumption, emissions and potential energy savings. Build. Environ. 2007, 42, 1298–1314. [Google Scholar] [CrossRef]
- Santin, O.; Itard, L.; Visscher, H. The effect of occupancy and building characteristics’ on energy use for space and water heating in Dutch residential stock. Energy Build. 2009, 41, 1223–1232. [Google Scholar] [CrossRef]
- Ugursal, V.; Fung, A. Impact of appliance efficiency and fuel substitution on residential end-use energy consumption in Canada. Energy Build. 1996, 24, 137–146. [Google Scholar] [CrossRef]
- Yu, Z.; Fung, B.; Haghighat, F.; Yoshino, H.; Morofsky, E. A systematic procedure to study the influence of occupant behavior on building energy consumption. Energy Build. 2011, 43, 1409–1417. [Google Scholar] [CrossRef]
- Santangelo, A.; Tondelli, S. Occupant behaviour and building renovation of the social housing stock: Current and future challenges. Energy Build. 2017, 145, 276–283. [Google Scholar] [CrossRef]
- Wittenberg, I.; Fleury-Bahi, G. Application of sustainable habitat: What is the appropriation and utilisation of equipment after energy-saving renovations in social housing? J. Community Appl. Soc. Psychol. 2016. [Google Scholar] [CrossRef]
- Llera-Sastresa, E.; Scarpellini, S.; Rivera-Torres, P.; Aranda, J.; Zabalza-Bribián, I.; Aranda-Usón, A. Energy vulnerability composite index in social housing, from a household energy poverty perspective. Sustainability 2017, 9, 691. [Google Scholar] [CrossRef]
- Marta, M.; Belinda, L. Simplified model to determine the energy demand of existing buildings. Case study of social housing in Zaragoza, Spain. Energy Build. 2017, 149, 483–493. [Google Scholar] [CrossRef]
- Majcen, D.; Itard, L.; Visscher, H. Monitoring dwelling stock efficiency through energy performance register: Trends in Dutch social housing. In Proceedings of the Conference paper for World SB14, Barcelona, Spain, 28–30 October 2014. [Google Scholar]
- Copiello, S. Achieving affordable housing through energy efficiency strategy. Energy Policy 2015, 85, 288–298. [Google Scholar] [CrossRef]
- Mihailov, N.; Todorov, T.; Evtimov, A.; Todorov, D.; Iliev, L. Characteristics of electrical energy consumption in the social housing. In Sustainable Energy in the Built Environment—Steps towards nZEB; Visa, I., Ed.; Springer: Cham, Switzerland, 2014. [Google Scholar]
- Tso, G.; Yau, K. Predicting electricity energy consumption: A comparison of regression analysis, decision tree and neural networks. Energy 2007, 32, 1761–1768. [Google Scholar] [CrossRef]
- Hamzaçebi, H. Forecasting of Turkey’s net electricity energy consumption on sectoral bases. Energy Policy 2007, 35, 2009–2016. [Google Scholar] [CrossRef]
- Koksal, M.; Ugursal, V. Comparison of neural network, conditional demand analysis, and engineering approaches for modeling end-use energy consumption in the residential sector. Appl. Energy 2008, 85, 271–296. [Google Scholar] [CrossRef]
- Aydinalp, M.; Ugursal, V.; Fung, A. Modeling of the appliance, lighting, and space-cooling energy consumptions in the residential sector using neural networks. Appl. Energy 2002, 71, 87–110. [Google Scholar] [CrossRef]
- Oyebanji, A.; Liyanage, C.; Akintoye, A. Critical success factors (CSFs) for achieving sustainable social housing (SSH). Int. J. Sustain. Built Environ. 2017, 6, 216–227. [Google Scholar] [CrossRef]
- Belpoliti, V.; Bizzarri, G. A parametric method to assess the energy performance of the social housing stock and simulate suitable retrofit scenarios: An Italian case study. Energy Build. 2015, 96, 261–271. [Google Scholar] [CrossRef]
- Jafar, R.; Shahrur, I.; Juran, I. Application of artificial neural networks (ANN) to model the failure of urban water mains. Math. Comput. Model. 2010, 51, 1170–1180. [Google Scholar] [CrossRef]
- Hornik, K.; Stinchcombe, M.; White, H. Multilayer feedforward networks are universal approximators. Neural Netw. 1989, 2, 359–366. [Google Scholar] [CrossRef]
- Hecht-Nielsen, R. Theory of the back propagation neural network. In Proceedings of the International Joint Conference on Neural Networks, IJCNN, Washington, DC, USA; 1989; pp. 593–605. [Google Scholar] [CrossRef]
- Najjar, Y.; Basheer, I.; Hajmeer, M. Computational neural networks for predictive microbiology: I. methodology. Int. J. Food Microbiol. 1997, 34, 27–49. [Google Scholar] [CrossRef]


| Physical Indicators | Socio-Economic Indicators |
|---|---|
| Energy Performance Diagnostic (DPE) | Tenant age |
| Dwelling area | Family size |
| Building age | Tenant income |
| Number of floors |
| Model | % of Training | % of Testing | % of Holdout | R2 |
|---|---|---|---|---|
| 1 | 50 | 25 | 25 | 0.71 |
| 2 | 70 | 30 | 0 | 0.58 |
| 3 | 100 | 0 | 0 | 0.72 |
| 4 | 66 | 26 | 8 | 0.67 |
| 5 | 74 | 18 | 8 | 0.74 |
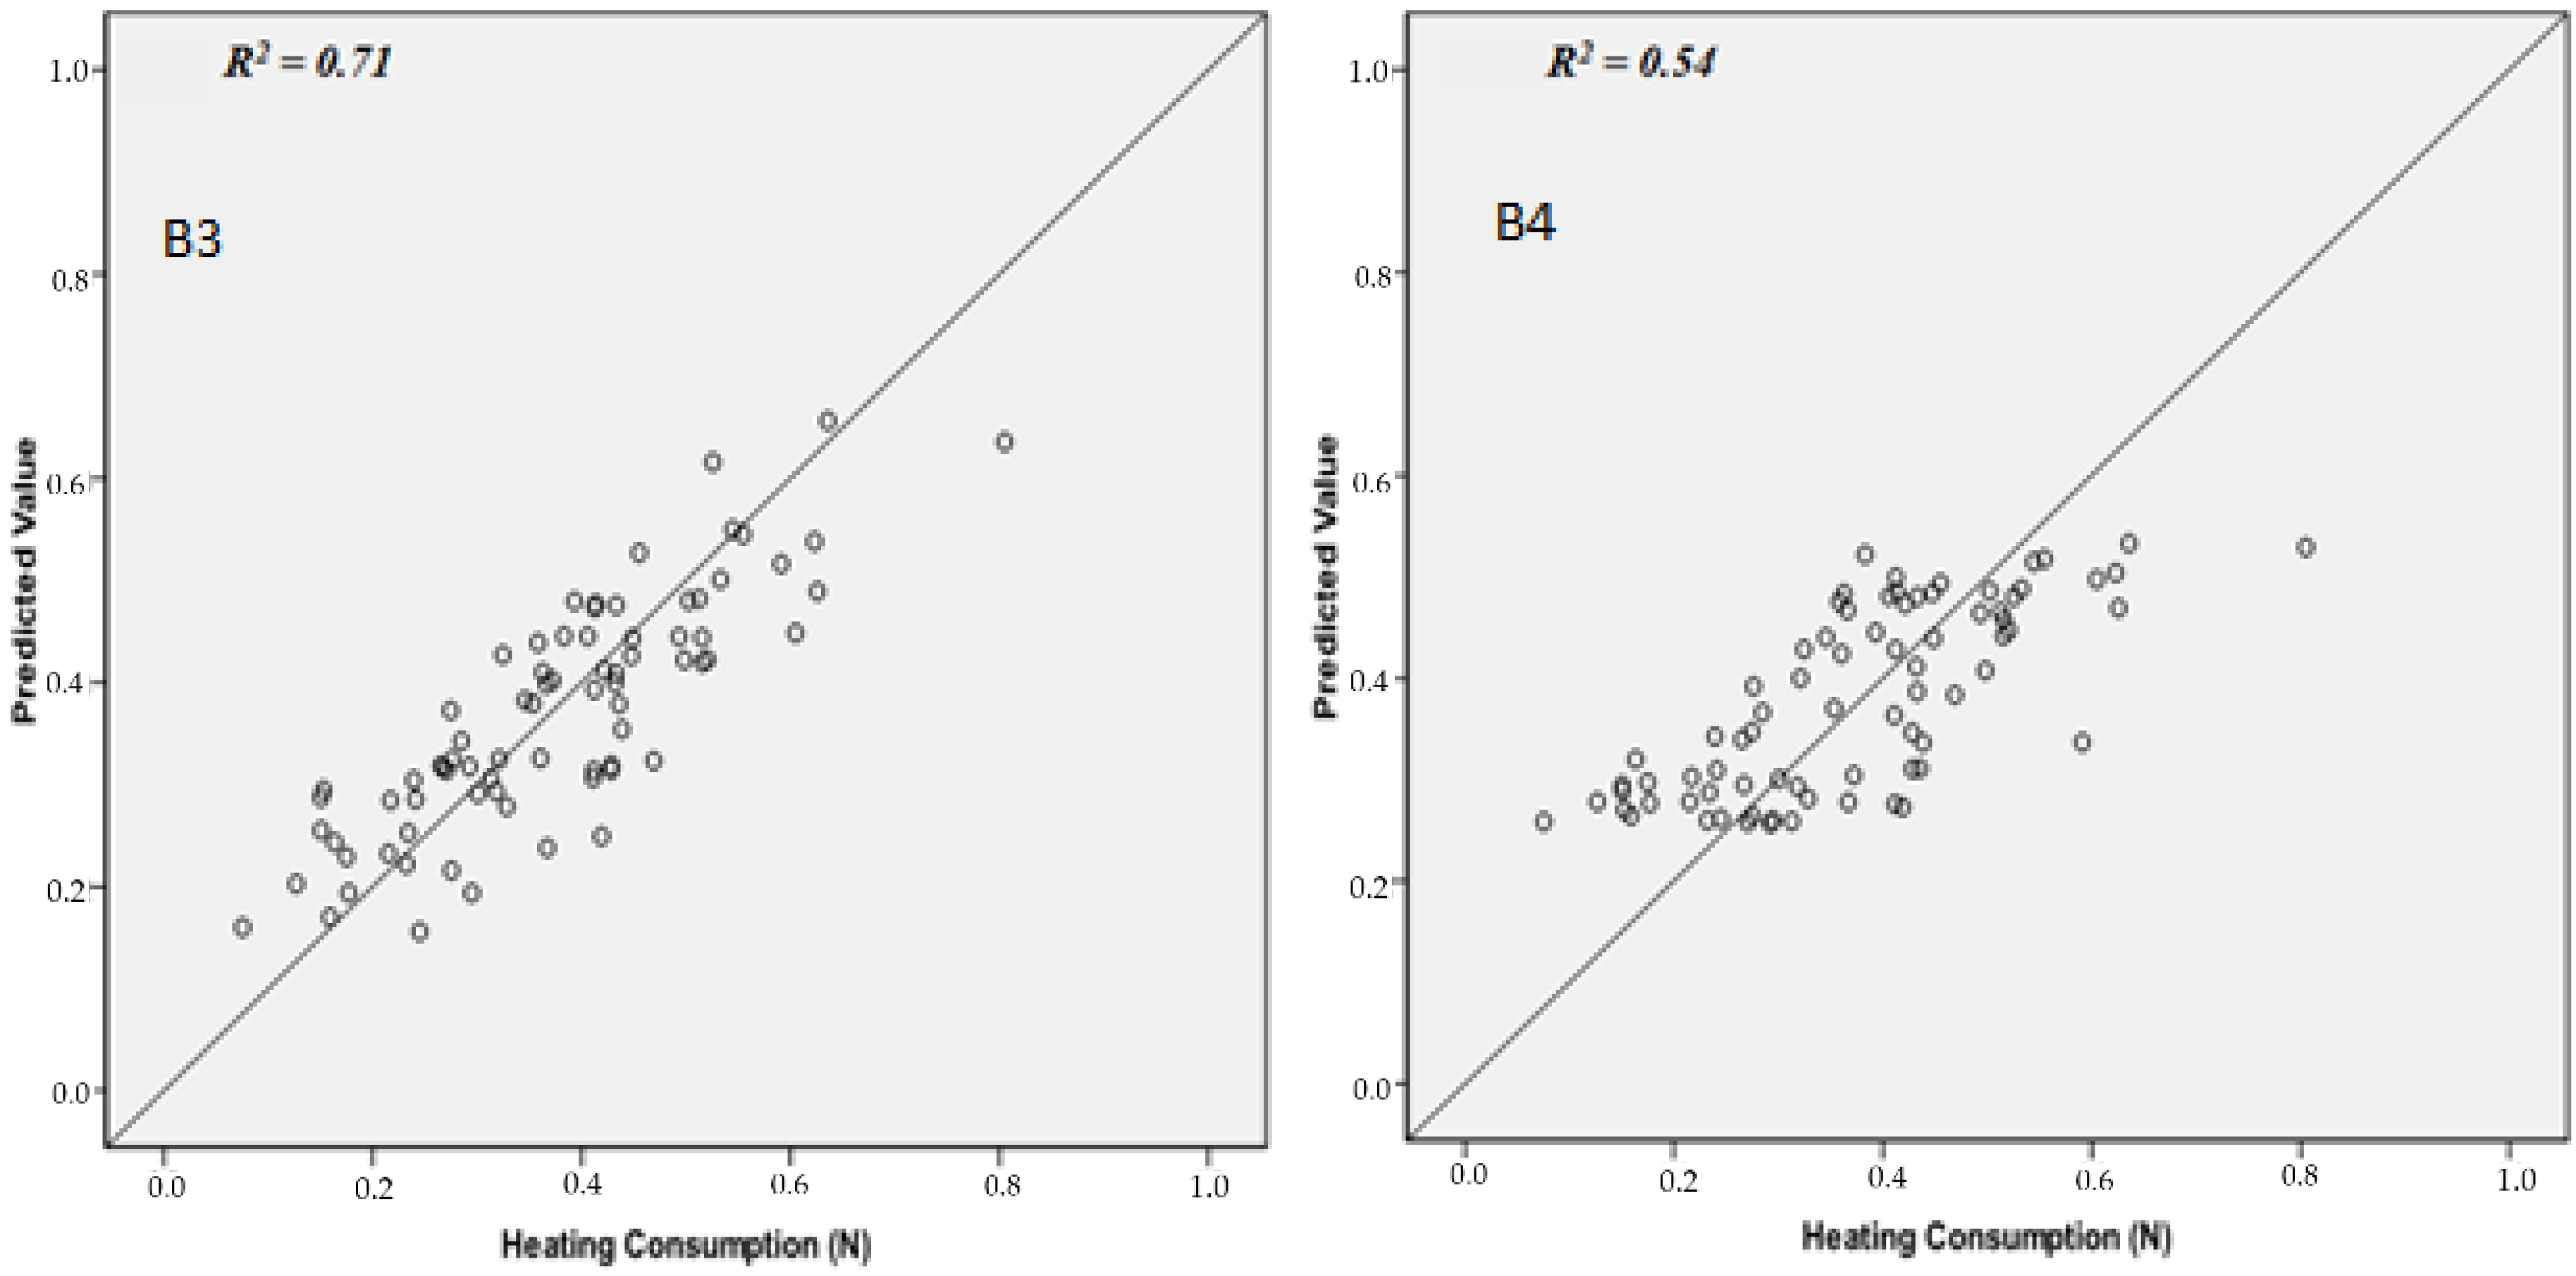
| Model | No. of Hidden Layers | No. of Nodes | Sum of Squares Error for Training | Sum of Squares Error for Testing | Relative Error for Training | Relative Error for Testing | R2 |
|---|---|---|---|---|---|---|---|
| B1 | 1 | 3 | 14.23 | 1.14 | 0.467 | 0.134 | 0.62 |
| B2 | 1 | 5 | 9.16 | 1.58 | 0.30 | 0.186 | 0.74 |
| B3 | 1 | 6 | 9.94 | 1.76 | 0.326 | 0.206 | 0.71 |
| B4 | 2 | 4 | 16.39 | 2.42 | 0.537 | 0.284 | 0.54 |
| Parameter | Weight |
|---|---|
| Building age | 0.23 |
| DPE | 0.26 |
| Number of floors | −0.24 |
| Area | −0.58 |
| Tenant age | −0.22 |
| Family size | 0.32 |
| Tenant income | 0.07 |
© 2017 by the authors. Licensee MDPI, Basel, Switzerland. This article is an open access article distributed under the terms and conditions of the Creative Commons Attribution (CC BY) license (http://creativecommons.org/licenses/by/4.0/).
Share and Cite
Zabada, S.; Shahrour, I. Analysis of Heating Expenses in a Large Social Housing Stock Using Artificial Neural Networks. Energies 2017, 10, 2086. https://doi.org/10.3390/en10122086
Zabada S, Shahrour I. Analysis of Heating Expenses in a Large Social Housing Stock Using Artificial Neural Networks. Energies. 2017; 10(12):2086. https://doi.org/10.3390/en10122086
Chicago/Turabian StyleZabada, Shaker, and Isam Shahrour. 2017. "Analysis of Heating Expenses in a Large Social Housing Stock Using Artificial Neural Networks" Energies 10, no. 12: 2086. https://doi.org/10.3390/en10122086
APA StyleZabada, S., & Shahrour, I. (2017). Analysis of Heating Expenses in a Large Social Housing Stock Using Artificial Neural Networks. Energies, 10(12), 2086. https://doi.org/10.3390/en10122086