1. Introduction
The rapid development of modern society has brought with it issues, including energy shortages and environmental pollution. To overcome these issues, it is crucial to exploit renewable energy (RE) [
1,
2] resources. In recent years, the installed capacities of RE have been rapidly increasing around the world. For example, in China, the generating capacities of wind power and photovoltaic (PV) power were 131 GW and 42 GW, respectively, by the end of 2015 [
3]. Moreover, according to a recent report by the Energy Research Institute of the Chinese National Development and Reform Commission, both the RE electricity integration ratios of wind power and PV power are expected to reach approximately 30%, and their sum may rise to as much as 63% by 2050 [
4,
5]. However, the increased penetration of RE resources into distribution systems may lead to bidirectional power flow and bring abundant volatility and uncertainty, resulting in tremendous challenges to traditional distribution networks. To deal with these issues, traditional distribution networks are gradually evolving from a passive mode to an active mode. Hence, the concept of Active Distribution Networks (ADNs) [
6,
7,
8,
9] has been proposed. In the context of ADNs, distributed energy resources (DERs) (containing RE generators), controllable loads, and energy storage equipment can be actively adjusted using intelligent control techniques to attain specific operation objectives [
10].
The extant research has been primarily focused on the control [
11,
12], protection [
13,
14], and dispatching [
15,
16,
17,
18] of ADNs. This study will investigate optimal ADN dispatching. Golshannavaz et al. [
15] presented an optimal operational scheduling framework for intelligent distribution systems that are aimed at minimizing the day-ahead total operation costs to optimally control the active elements of distributed generations, the network, and demand response loads. In Ref. [
16], the objective of the operation model was to maximize the social welfare in a real-time distribution energy market based on locational marginal prices. A new probabilistic methodology was proposed to assess the impact of residential demand response considering the uncertainties associated with load demand, user preferences, environmental conditions, house thermal behavior, and wholesale market prices. In addition, Safdarian et al. [
17] developed a distribution company’s stochastic operation framework, consisting of the day-ahead operation and real-time operation stages. The objective of the two stages was to minimize the expected operating costs. In Ref. [
18], a bi-level optimization model of distribution networks with several micro-grids was built, with the upper level being aimed at maximizing the distribution networks’ profit and the lower level aimed at minimizing the micro-grids’ cost.
As described above, the previous literature primarily focused on minimizing operational costs or maximizing social welfare. Limited attention has been paid to load profiling with simultaneous optimization of both operational costs and social welfare. In the meantime, the power demands have increased dramatically with economic development. The similar electricity usage patterns of urban residents and the weak awareness of energy conservation lead to an increased load peak-valley gap and low energy efficiency. Therefore, it is necessary to investigate how to schedule coordinately the electric energy, including DERs, demand response (DR) resources, and energy storage devices using ADN technologies to improve energy efficiency and decrease the load peak-valley gap. In order to achieve the above targets, we propose the concept of load equilibrium entropy and use it as one objective function. The proposed load equilibrium entropy can quantify the overall equilibrium of a load curve, which reflects the optimization level of electric energy allocation. Certain practical implications of this study are as follows: First, for generators, optimal allocation of electric energy reduces the impacts of frequent starting or stopping. Secondly, for power systems, optimal allocation increases the security and stability of the system’s operation. Thirdly, for end-users, optimal allocation enables them to avoid the extensive usage of electrical power in the high peak load periods, thereby decreasing their electricity consumption cost and improving the electrical power consumption efficiency. Lastly, from the sustainable societal development perspective, optimal allocation saves energy and improves the efficiency of energy utilization.
The distribution system in this paper includes a wind farm, a PV power station, an energy storage system (ESS), and thermostatically controlled loads (TCLs). In addition, this distribution system also provides time-of-use (TOU) pricing to customers. The energy storage technique [
19,
20] and TOU pricing [
21] strategy are commonly used to mitigate the intermittency of RE resources and reduce system operation costs. In recent years, TCLs [
22], such as air conditioners, heat pumps, water heaters, and refrigerators, have been frequently used as distributed energy resources because they can store electric energy as thermal energy. In addition, the usage of TCLs has been steadily increasing in recent years. In the United States, for example, TCLs are responsible for approximately 20% of the total electricity consumption [
23]. In China, air conditioner loads (a typical type of TCLs) may account for 30–40% of the total load during peak load periods, and, hence, have enormous potential for load curtailment [
24]. As they are small-scale electric loads, a key challenge of managing TCLs is determining how to aggregate them to make them operate as a virtual generator in the system. One way to address such a challenge is to model these small-scale electric loads as virtual power plants (VPPs), an approach that is proposed to aggregate small-scale DERs to provide generation services [
25,
26]. Ruiz, Cobelo and Oyarzabal proposed an optimization algorithm to manage a VPP composed of a large number of customers with thermostatically controlled appliances [
26]. However, they did not illustrate how to calculate generation limits and operating costs of the VPP. Hence, this study proposes a calculation method for VPP operating characteristics based on the equivalent thermal parameter model and the state-queue control method.
The focus of this paper is on intraday scheduling of a distribution system with the wind farm, the PV power station, the ESS, and TCLs. Based on load equilibrium entropy, we propose a multi-objective optimization model to simultaneously optimize scheduling costs and load equilibrium. Furthermore, we conduct a comparison analysis between the proposed model and two single-objective optimization models, focusing on minimizing scheduling costs and maximizing the load equilibrium entropy, respectively.
Five sections follow the introduction. First, the model of TCLs is developed in
Section 2. Then, the concept of load equilibrium entropy is proposed in
Section 3.
Section 4 presents the optimal ADN dispatching model. In
Section 5, a distribution system is studied to illustrate the proposed optimal scheduling model. Finally, a summary is given in
Section 6.
2. TCL Modeling
2.1. Thermal Parameter Model for TCLs
Thermostatically controlled appliances include air conditioning, electric water heaters, and refrigerators. Because of their similarities, these TCLs are normally modeled in the same fashion. While this paper focuses on air conditioning load (ACL) models, our results could also be applied to the other two TCLs (electric water heaters, and refrigerators).
According to the simplified equivalent thermal parameters, model [
27] of the ACL for residential users and small commercial customers [
28], the calculation formula for the indoor temperature can be obtained as follows:
In the model, Tin refers to indoor temperature, Tout outdoor temperature, e−Δt/RC heat dissipation parameter, Δt time interval, R equivalent thermal resistance, C equivalent thermal capacity, η efficiency of ACL, PAC the rated power of ACL, A conduction coefficient, and sAC the switching state of the air conditioner, where “1” and “0” denote that the air conditioner is on and off, respectively.
For a given temperature set point, Tset,, when a consumer turns off an air conditioner, the indoor temperature will increase as time goes by until it reaches the upper temperature limit Tmax. When a consumer turns on the air conditioner, the temperature will decrease as time passes by until it drops to the lower temperature limit Tmin.
2.2. Aggregation of ACLs
In most simplistic analysis scenarios, thermal characteristics of ACLs can be approximately seen as linear. At the moment, the indoor temperature trajectory of ACLs can be simulated by the state queueing (SQ) model [
29].
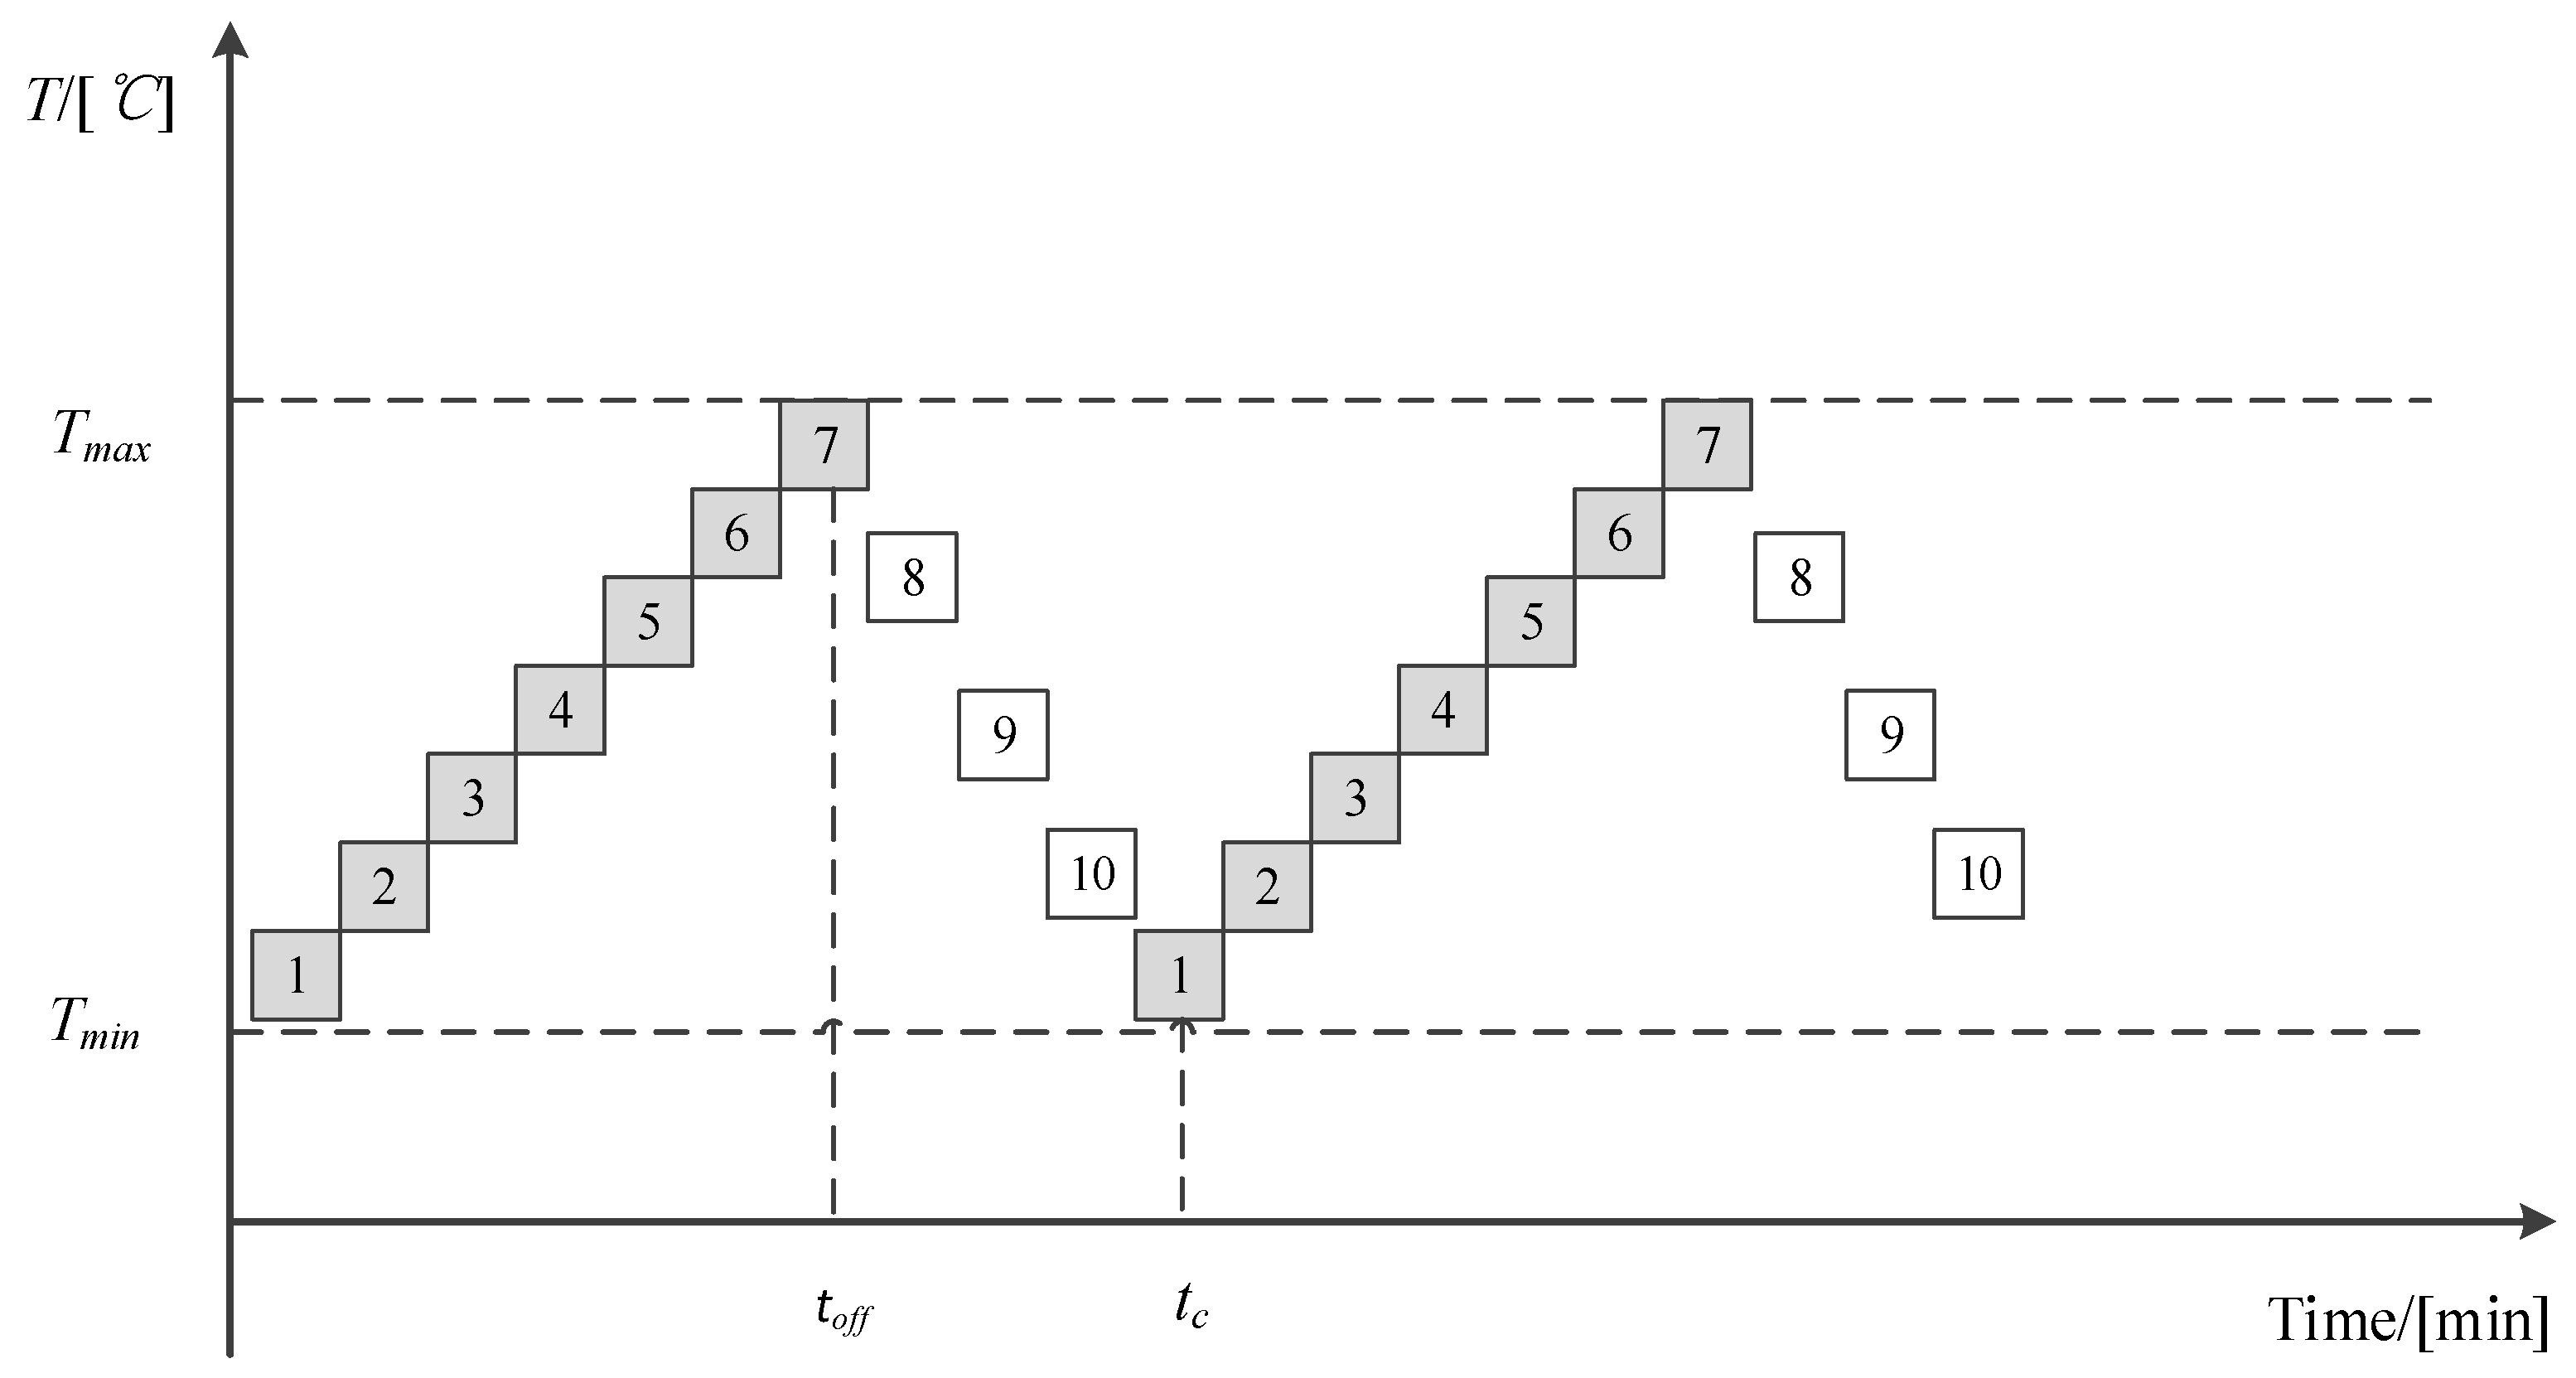
Figure 1 shows the states of a single air-conditioning unit during two operational cycles. As shown in the figure, there are 10 states of equal duration in an operational cycle. Seven shaded boxes represent “off” states and three white boxes represent “on” states. If the ambient temperature and set point remain unchanged, then the state of air-conditioning unit will switch forward from state 1 to state 10 in a temperature range of [
Tmin,
Tmax].
Assuming that there are
NAC air-conditioning units with similar thermal parameters and the same initial thermal states shown in
Figure 1, they are uniformly divided into
tc groups, and each group is controlled in turn (as shown in
Figure 1). If the state time interval Δ
t is 1 min, then at each moment, there are
ton groups of ACLs that are “on” states and
toff groups of ACLs that are “off” states in the temperature interval [
Tmin,
Tmax]. The total number of controlled groups/states equals to the sum of
ton and
toff. Thus, the power of the aggregated ACLs
PACsum can be calculated as follows:
2.3. Virtual Power Plant Model for ACL
With the adjustment of temperature setting of ACLs, the aggregated demands will vary accordingly. In order to preferably integrate ACLs into the real-time scheduling and operation, the concept of VPP is used to represent the aggregated air-conditioning resources.
A VPP is comparable to a conventional power plant with its own operating characteristics, such as scheduling characteristics of generation, generation limits, and operating costs. Assuming that the ACLs with uniform and similar parameters can be equivalent to a virtual power plant. All of the ACLs in scheduling plans are divided into
Ng VPPs. Before operators make the scheduling decisions, aggregators need to offer the feasible power regulation schemes and the corresponding compensation costs to the grid company. Let
Ns,n denote the set of feasible power regulation schemes for VPP
n. The real power of VPP
n at time t is as follows:
where
Pa,n,s refers to the load shedding of VPP
n as it carries out scheme
s at time
t. The value of
Sn,s,t is 0 or 1. When
Sn,s,t = 1, VPP
n implements the regulation scheme
s at time
t. While
Sn,s,t = 0, VPP
n does not implement the regulation scheme
s at time
t. As an example, when the set point of VPP
n is adjusted from
Tset to
Treset, load consumptions in
Tset and
Treset can be, respectively, calculated according to (5). Subsequently, load shedding of VPP
n in the above scenario can be obtained as:
where
Pa,n,reset,t refers to load shedding of VPP
n at time
t when set point changes from
Tset to
Treset, and
PACsum,n,reset,t and
PACsum,n,set,t represent load consumptions of VPP
n at time
t in set point
Treset and set point
Tset., respectively.
2.4. Cost Calculation for VPP
As the temperature set point increases, the comfort of customers weakens. Thus, customers may obtain more compensation to remedy the reduction of comfort.
The operating cost of VPP
n is defined as,
where
K is the cost coefficients and Δ
Tn,s represents the absolute value of the set point variation for VPP
n as it carries out scheme
s. For example, if the set point of VPP
n is adjusted from
Tset to
Treset, Δ
Tn,s is equal to |
Treset −
Tset|.
3. Load Equilibrium Entropy
The increasing peak-valley gap has brought enormous challenges to the reliable operations of the power systems. Many methods have been used to reduce the peak-valley gap, such as DR resources and ESSs. Although the peak-valley gap shrinks much after implementing load curtailment measures, the optimized load curve always appears to be multi-peak or concave-convex. How to make load evenly distributed during dispatch period through optimization measures is the goal of this paper in order to achieve optimal allocation of electric energy and improve the efficiency of electrical consumption. For this purpose, a new index is needed to evaluate the load equilibrium. In this paper, we propose a concept of load equilibrium entropy to quantify the overall equilibrium of the load curve.
As a widely-used concept in information theory, entropy can be adopted to measure heterogeneity [
30]. For example, Bao et al. [
31] evaluated the heterogeneity of power flow distribution over lines with entropy. In a similar way in this paper, we utilize entropy to assess load equilibrium during dispatch period.
The load curve follows continuous distribution patterns. For ease of calculation, we discretize the load curve. According to the definition of discrete information entropy, the discrete information source
X can be calculated as follows:
where
pi is the probability of occurrence of the
i-th possible value of the source symbol.
H uses a logarithm of base 2 and its unit is bit. In addition,
.
There are two types of discrete information entropy: entropy of real numbers and interval entropy [
32].
In this paper, we attempt to optimize the load curve. It is impossible to divide a variational curve into intervals. Hence, we adopted the entropy of real numbers.
pi refers to the percentage of the
i-th information value in all the information value:
To calculate load equilibrium entropy, we need to calculate the load utilization rate first.
where
PL,t is the load at time
t after implementing demand response measures and storage energy devices.
pL,t is load utilization rate at time
t and refers to the electricity consumption situation for customer at time
t.
Load equilibrium entropy can be calculated as follows:
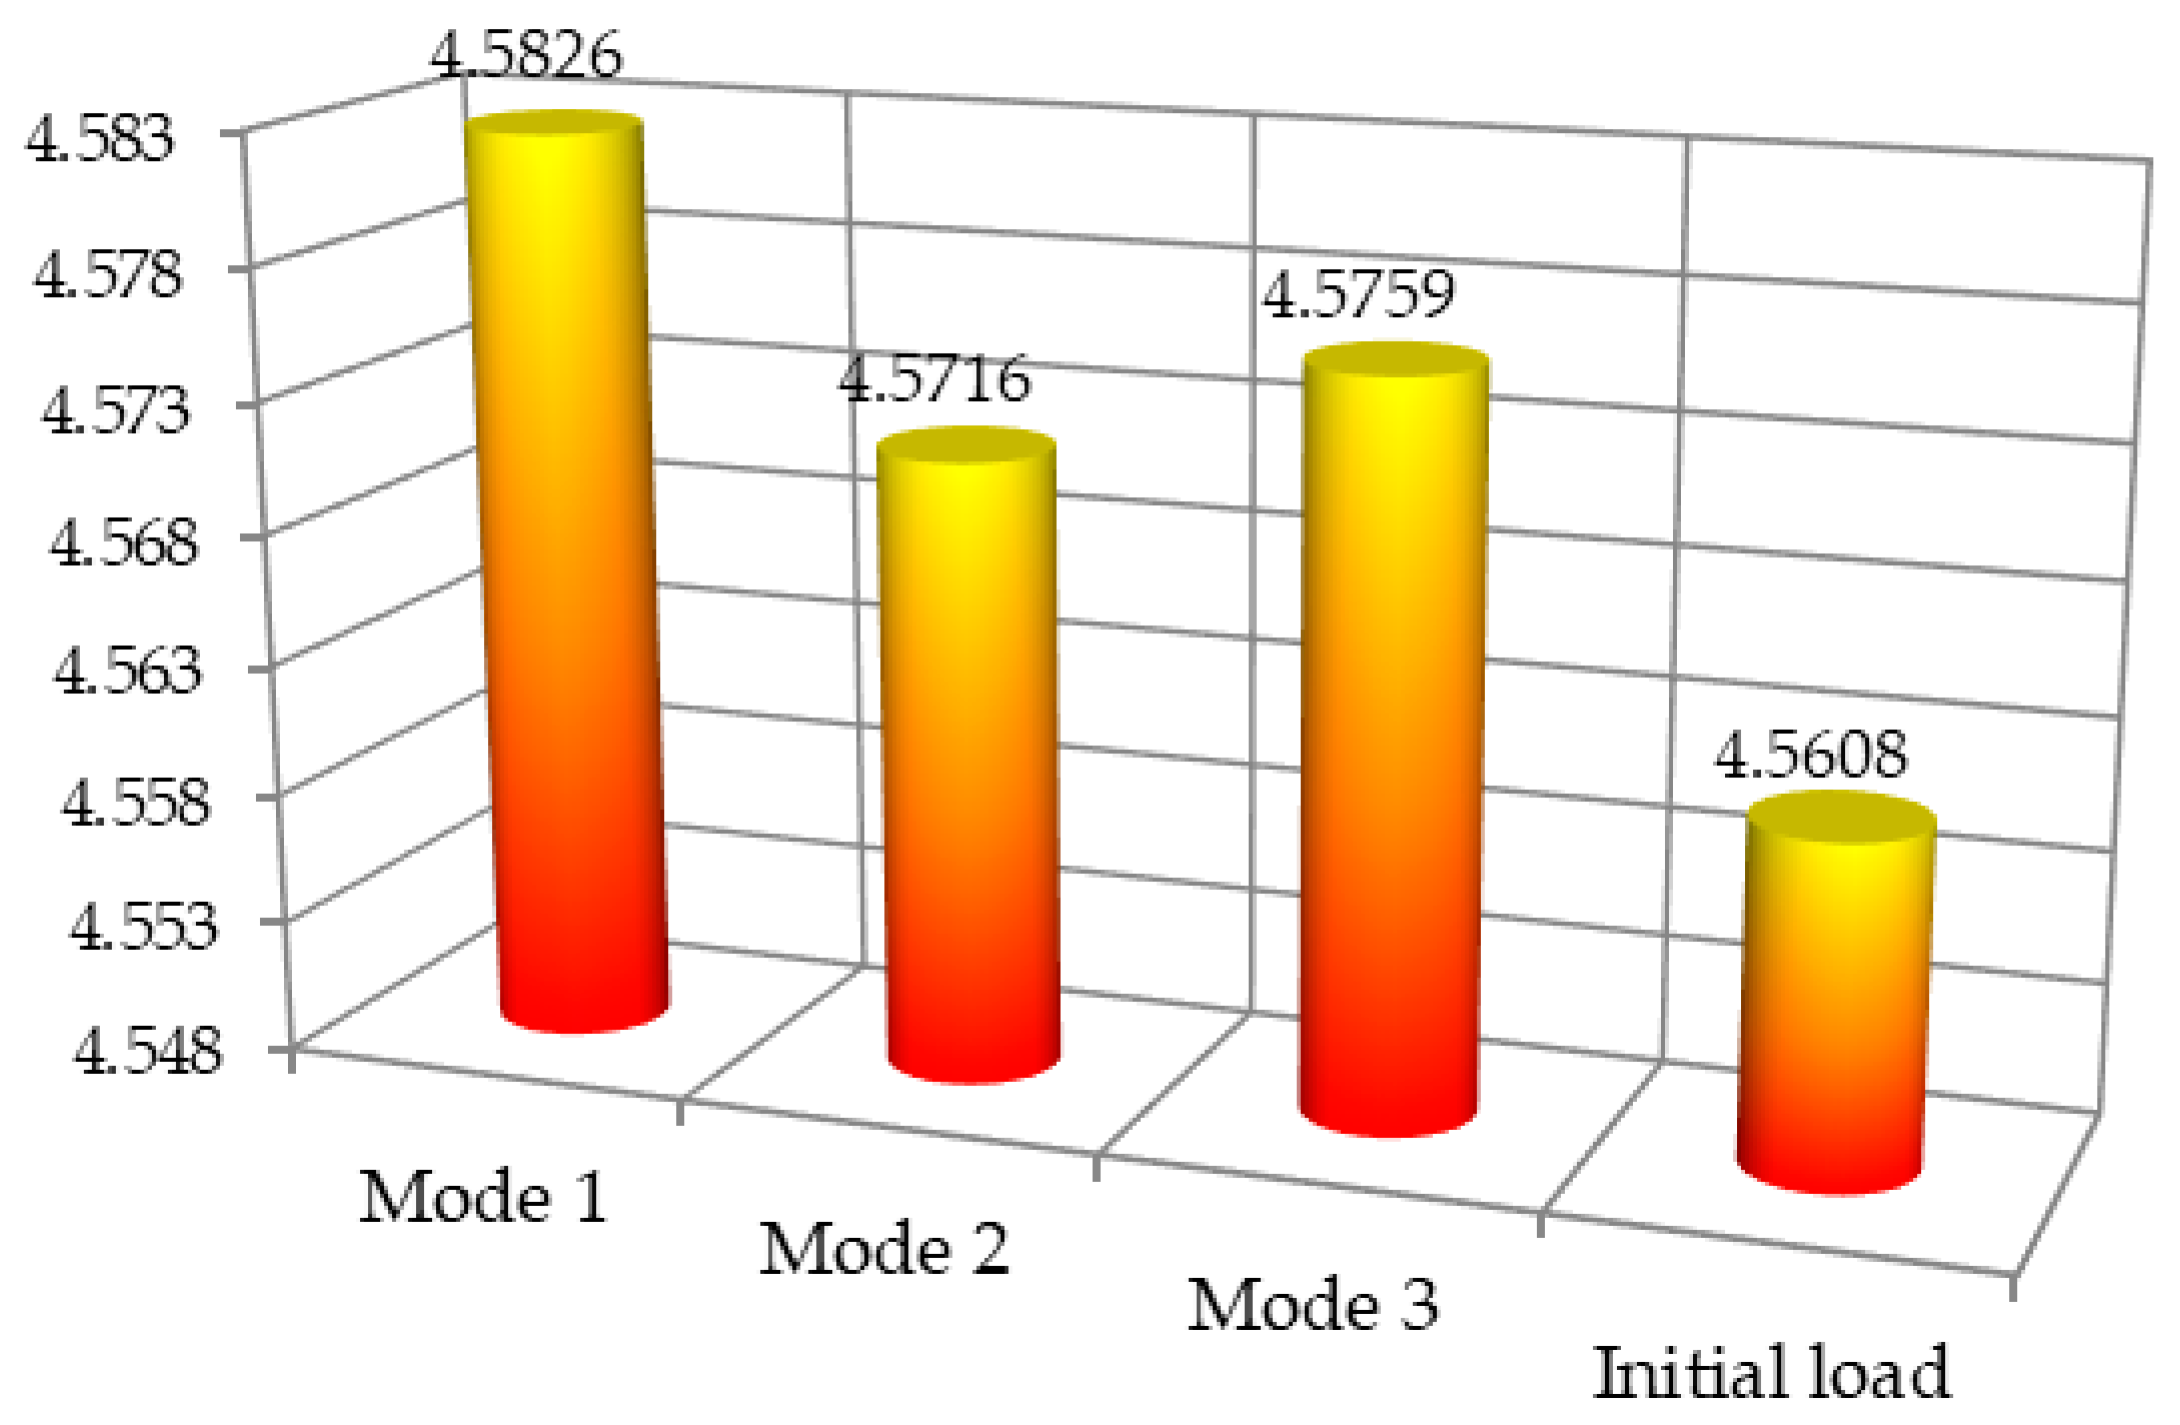
From Formula (10), we can see that the load equilibrium entropy provides an average measure of load curve equilibrium. As load at every time is more close to each other, the value of load equilibrium entropy H is bigger. When the load curve is flat in some special situation, H gets maximum value. Obviously, this is an extreme case.


