Testing for Environmental Kuznets Curve in the EU Agricultural Sector through an Eco-(in)Efficiency Index


Abstract
:1. Introduction
2. Materials and Methods
2.1. Defining the Eco-(In)Efficiency Index
2.1.1. Considerations Regarding DEA Eco-Efficiency Indicators Development
2.1.2. DEA Applications on Agricultural Sector
2.1.3. Developing the DEA Eco-(In)Efficiency Indicator for EU Agricultural Sector Sustainability Assessment
2.2. Defining the Model for EKC Testing
3. Results and Discussion
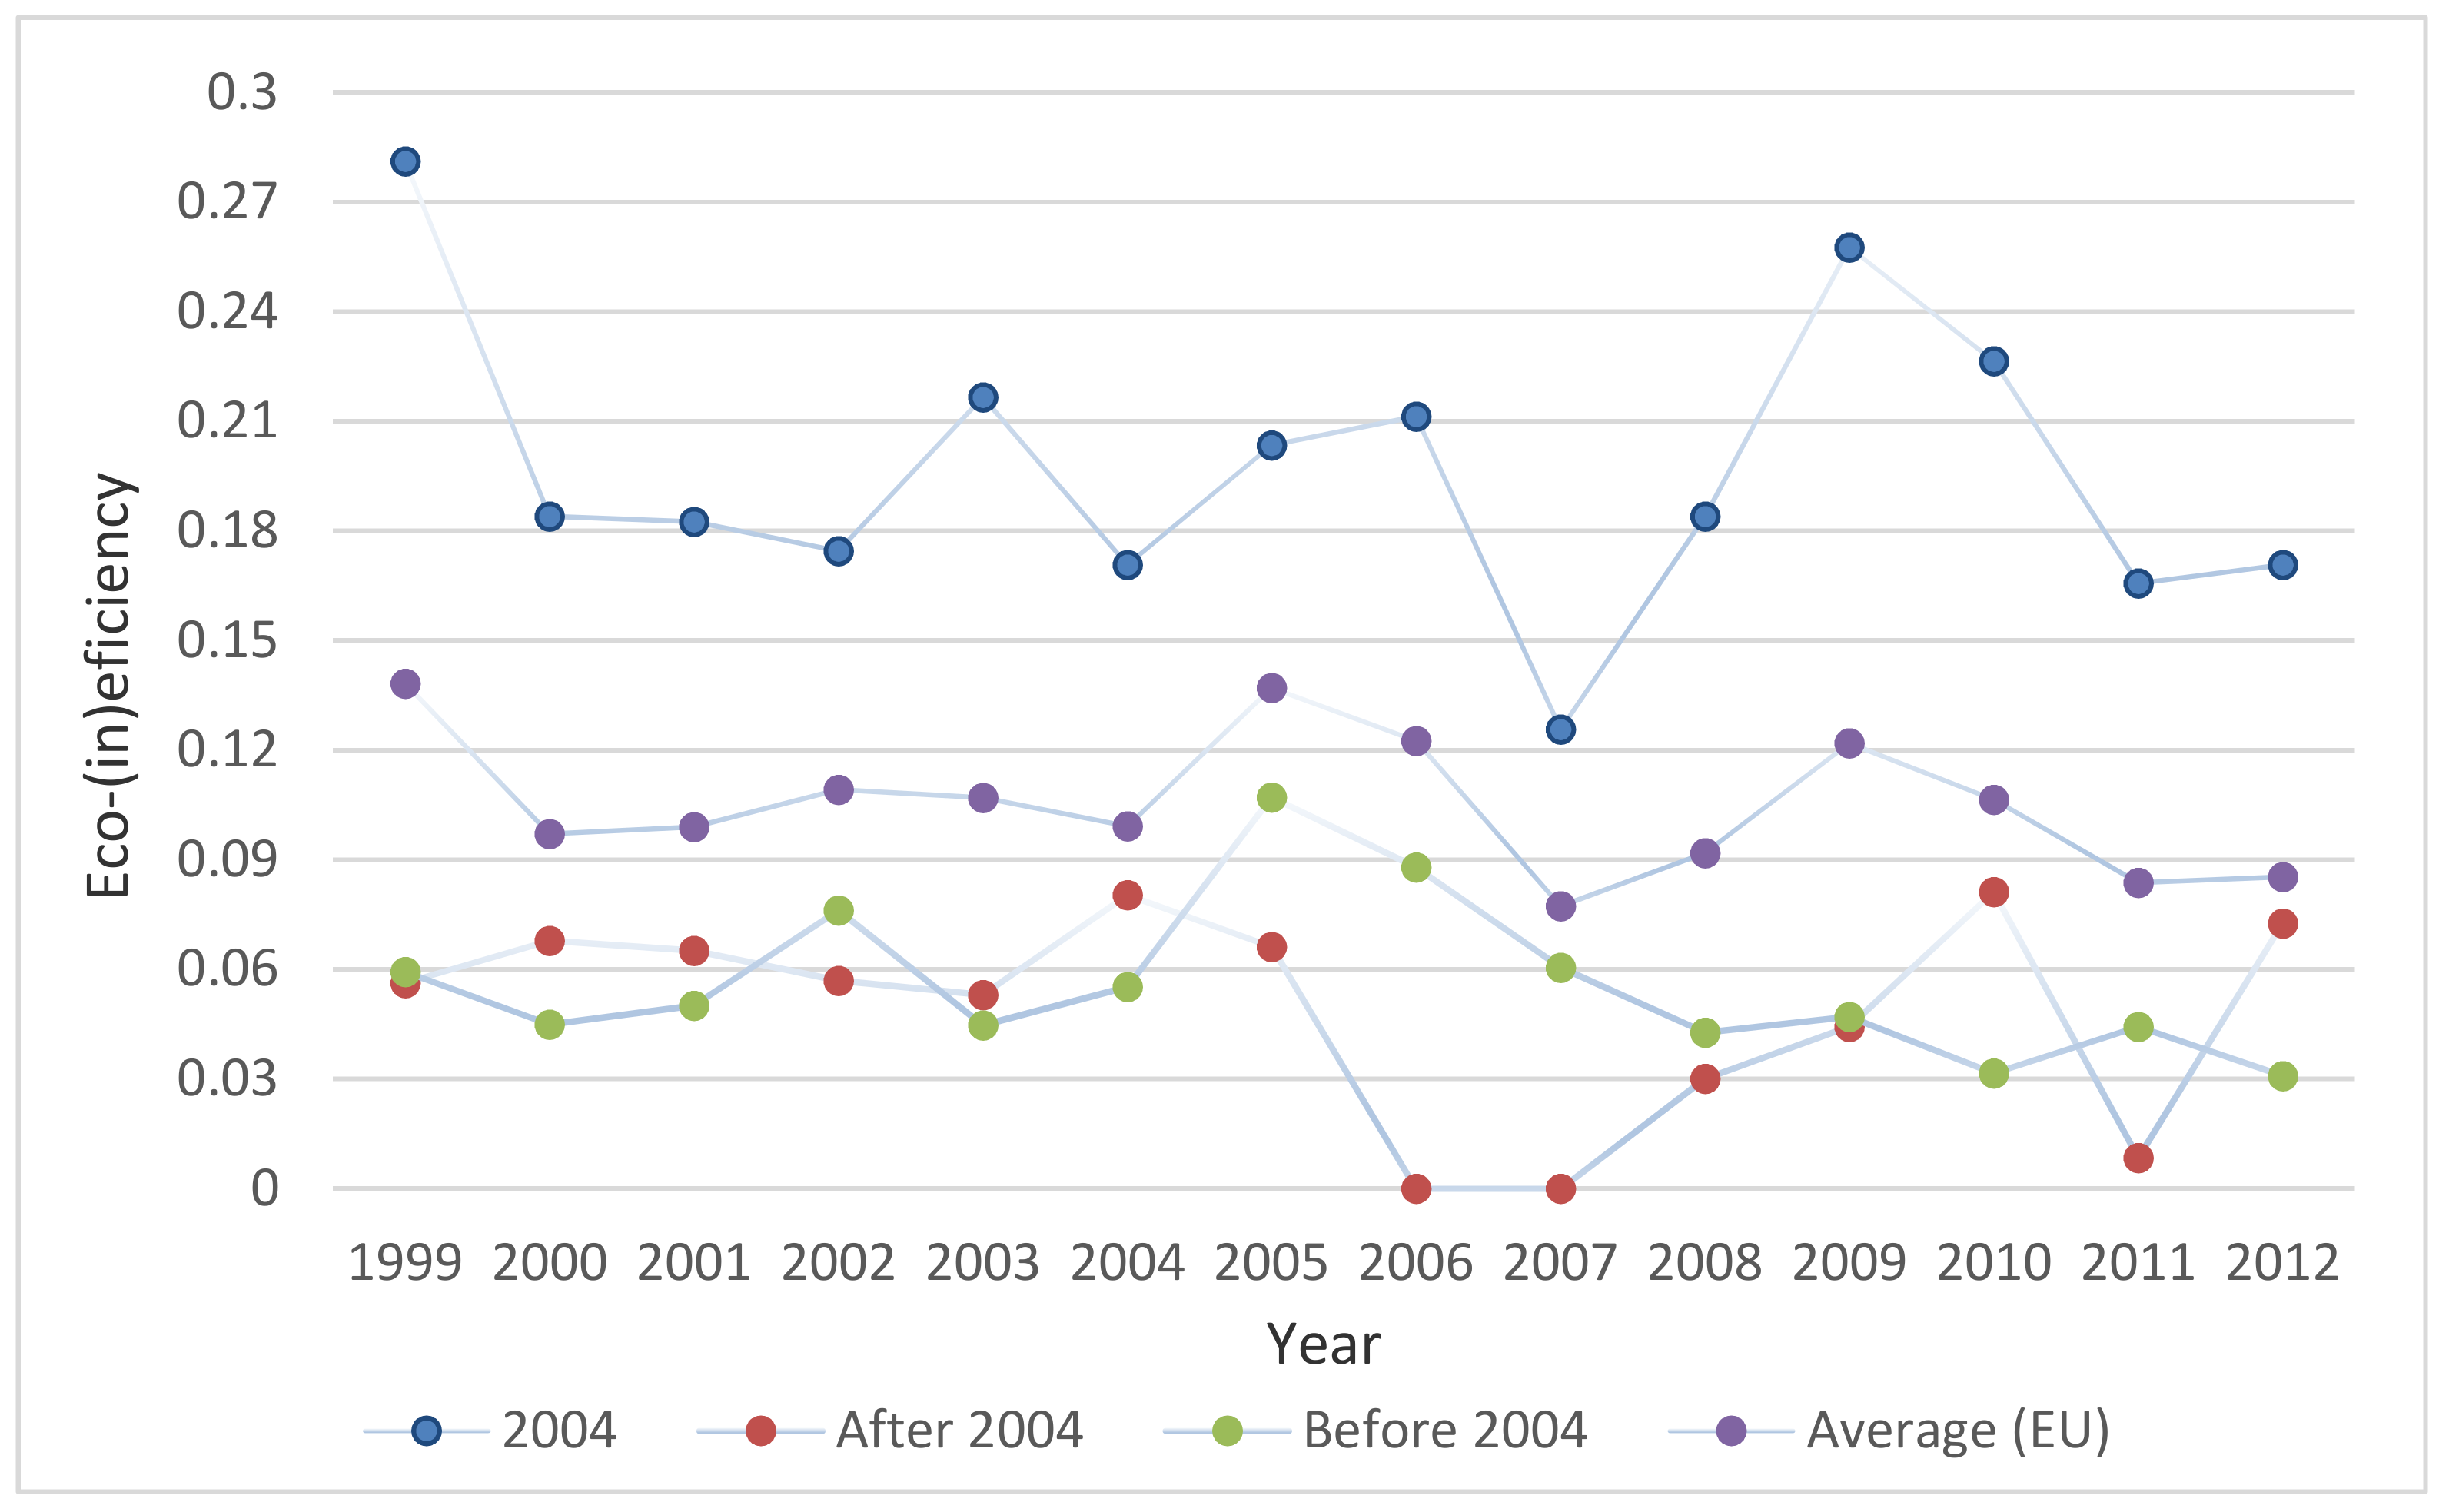
3.1. Eco-(In)Effiiency Assessment Results
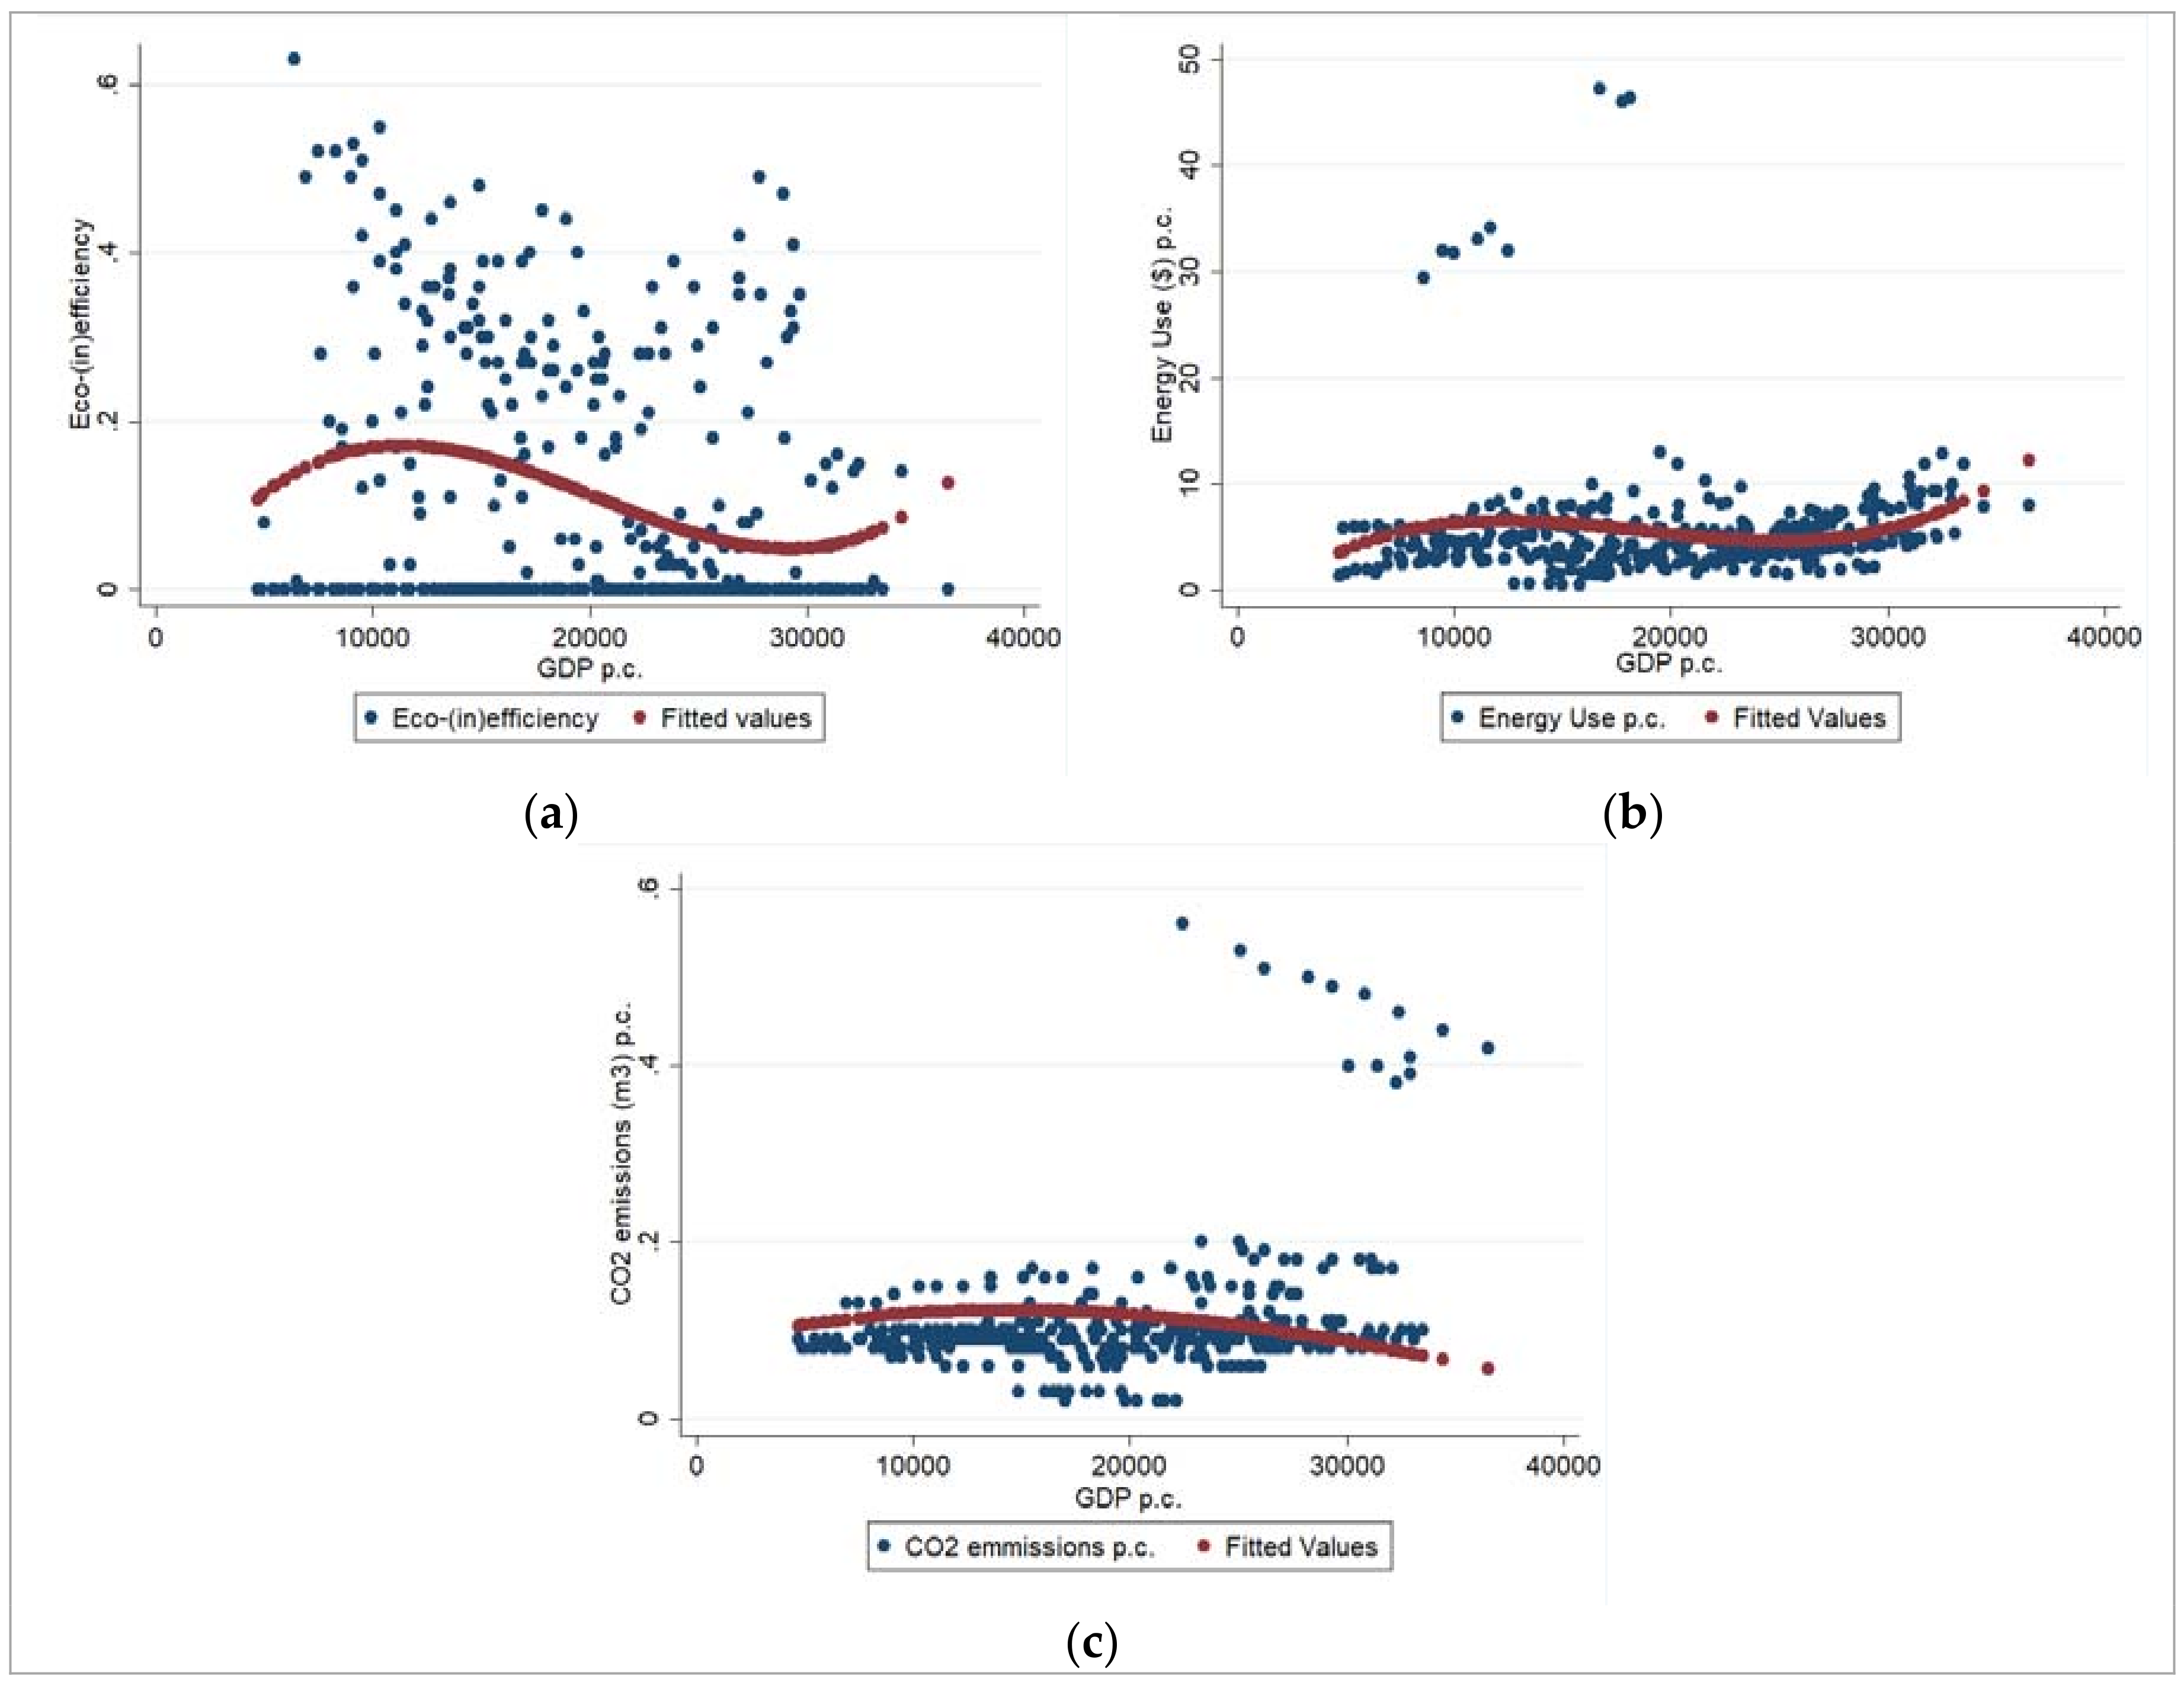
3.2. EKC Testing Results
4. Conclusions
Author Contributions
Conflicts of Interest
Appendix A

| Year | ||||||||||||||
|---|---|---|---|---|---|---|---|---|---|---|---|---|---|---|
| Country | 1999 | 2000 | 2001 | 2002 | 2003 | 2004 | 2005 | 2006 | 2007 | 2008 | 2009 | 2010 | 2011 | 2012 |
| Belgium | 0.06 | 0.00 | 0.00 | 0.07 | 0.00 | 0.00 | 0.01 | 0.00 | 0.00 | 0.00 | 0.00 | 0.00 | 0.00 | 0.00 |
| Bulgaria | 0.00 | 0.00 | 0.00 | 0.00 | 0.00 | 0.00 | 0.00 | 0.00 | 0.00 | 0.00 | 0.13 | 0.03 | 0.03 | 0.11 |
| Czech Republic | 0.00 | 0.00 | 0.00 | 0.00 | 0.00 | 0.39 | 0.45 | 0.44 | 0.27 | 0.27 | 0.40 | 0.33 | 0.25 | 0.28 |
| Denmark | 0.03 | 0.00 | 0.00 | 0.05 | 0.02 | 0.08 | 0.09 | 0.00 | 0.00 | 0.05 | 0.00 | 0.00 | 0.00 | 0.00 |
| Germany | 0.00 | 0.00 | 0.00 | 0.06 | 0.03 | 0.00 | 0.10 | 0.00 | 0.00 | 0.00 | 0.05 | 0.00 | 0.00 | 0.00 |
| Estonia | 0.28 | 0.00 | 0.00 | 0.00 | 0.21 | 0.00 | 0.00 | 0.10 | 0.00 | 0.40 | 0.48 | 0.39 | 0.30 | 0.29 |
| Ireland | 0.07 | 0.00 | 0.00 | 0.00 | 0.00 | 0.00 | 0.15 | 0.14 | 0.00 | 0.00 | 0.00 | 0.00 | 0.00 | 0.00 |
| Greece | 0.00 | 0.00 | 0.00 | 0.00 | 0.00 | 0.01 | 0.00 | 0.08 | 0.05 | 0.05 | 0.02 | 0.00 | 0.05 | 0.00 |
| Spain | 0.02 | 0.00 | 0.00 | 0.00 | 0.00 | 0.00 | 0.00 | 0.05 | 0.00 | 0.00 | 0.00 | 0.00 | 0.00 | 0.00 |
| France | 0.01 | 0.00 | 0.00 | 0.00 | 0.00 | 0.00 | 0.02 | 0.03 | 0.00 | 0.00 | 0.00 | 0.00 | 0.00 | 0.00 |
| Croatia | 0.17 | 0.12 | 0.20 | 0.17 | 0.15 | 0.24 | 0.00 | 0.00 | 0.00 | 0.00 | 0.00 | 0.00 | 0.00 | 0.00 |
| Italy | 0.00 | 0.00 | 0.00 | 0.00 | 0.00 | 0.00 | 0.04 | 0.00 | 0.00 | 0.00 | 0.00 | 0.00 | 0.00 | 0.00 |
| Cyprus | 0.00 | 0.15 | 0.23 | 0.26 | 0.00 | 0.00 | 0.00 | 0.00 | 0.00 | 0.00 | 0.00 | 0.00 | 0.00 | 0.00 |
| Latvia | 0.63 | 0.00 | 0.00 | 0.00 | 0.36 | 0.28 | 0.38 | 0.36 | 0.28 | 0.34 | 0.44 | 0.35 | 0.30 | 0.22 |
| Lithuania | 0.49 | 0.52 | 0.52 | 0.53 | 0.55 | 0.40 | 0.33 | 0.38 | 0.21 | 0.32 | 0.46 | 0.39 | 0.27 | 0.26 |
| Luxembourg | 0.00 | 0.00 | 0.00 | 0.00 | 0.12 | 0.00 | 0.14 | 0.00 | 0.00 | 0.00 | 0.00 | 0.00 | 0.10 | 0.00 |
| Hungary | 0.42 | 0.39 | 0.34 | 0.32 | 0.36 | 0.30 | 0.31 | 0.32 | 0.22 | 0.13 | 0.30 | 0.25 | 0.11 | 0.16 |
| Malta | 0.00 | 0.00 | 0.00 | 0.00 | 0.00 | 0.00 | 0.00 | 0.00 | 0.00 | 0.00 | 0.00 | 0.00 | 0.00 | 0.00 |
| Netherlands | 0.00 | 0.00 | 0.00 | 0.00 | 0.00 | 0.00 | 0.00 | 0.00 | 0.00 | 0.00 | 0.00 | 0.00 | 0.00 | 0.00 |
| Austria | 0.03 | 0.00 | 0.00 | 0.00 | 0.01 | 0.00 | 0.05 | 0.00 | 0.00 | 0.00 | 0.02 | 0.00 | 0.00 | 0.01 |
| Poland | 0.19 | 0.00 | 0.00 | 0.00 | 0.00 | 0.00 | 0.00 | 0.00 | 0.00 | 0.00 | 0.00 | 0.00 | 0.00 | 0.00 |
| Portugal | 0.00 | 0.00 | 0.00 | 0.05 | 0.00 | 0.00 | 0.00 | 0.00 | 0.00 | 0.03 | 0.00 | 0.00 | 0.06 | 0.00 |
| Romania | 0.00 | 0.08 | 0.00 | 0.00 | 0.01 | 0.00 | 0.20 | 0.00 | 0.00 | 0.09 | 0.00 | 0.22 | 0.00 | 0.11 |
| Slovenia | 0.31 | 0.27 | 0.27 | 0.18 | 0.27 | 0.06 | 0.18 | 0.16 | 0.00 | 0.21 | 0.22 | 0.25 | 0.18 | 0.23 |
| Slovakia | 0.49 | 0.51 | 0.47 | 0.45 | 0.41 | 0.29 | 0.37 | 0.36 | 0.27 | 0.17 | 0.28 | 0.32 | 0.24 | 0.26 |
| Finland | 0.30 | 0.28 | 0.28 | 0.28 | 0.31 | 0.24 | 0.31 | 0.37 | 0.33 | 0.35 | 0.35 | 0.35 | 0.30 | 0.31 |
| Sweden | 0.19 | 0.03 | 0.09 | 0.29 | 0.18 | 0.08 | 0.21 | 0.18 | 0.12 | 0.15 | 0.27 | 0.13 | 0.16 | 0.14 |
| United Kingdom | 0.17 | 0.36 | 0.39 | 0.36 | 0.00 | 0.42 | 0.49 | 0.47 | 0.41 | 0.00 | 0.00 | 0.00 | 0.00 | 0.00 |
References
- Arrow, K.; Bolin, B.; Costanza, R.; Dasgupta, P.; Folke, C.; Holling, C.S.; Jansson, B.-O.; Levin, S.; Maler, K.-G.; Perrings, C.; et al. Economic growth, carrying capacity, and the environment. Ecol. Econ. 1995, 268, 520–521. [Google Scholar] [CrossRef]
- Han, X.; Chatterjee, L. Impacts of Growth and Structural Change on CO2 Emissions of Developing Countries. World Dev. 1997, 25, 395–407. [Google Scholar] [CrossRef]
- Beckerman, W. Economic growth and the environment: Whose growth? whose environment? World Dev. 1992, 20, 481–496. [Google Scholar] [CrossRef]
- Handl, G. Declaration of the United Nations Conference on the Human Environment (Stockholm Declaration), 1972 and the Rio Declaration on Environment and Development, 1992; United Nations Audiovisual Library International Law; Codification Division, Office of Legal Affairs: New York, NY, USA, 2012; pp. 1–11. (In English) [Google Scholar]
- Stern, D.I. Environmental Kuznets curve. Encycl. Energy 2004, 2, 1–3. [Google Scholar]
- Stern, D.I. The Rise and Fall of the Environmental Kuznets Curve. World Dev. 2004, 32, 1419–1439. [Google Scholar] [CrossRef]
- Kaika, D.; Zervas, E. The Environmental Kuznets Curve (EKC) theory-Part A: Concept, causes and the CO2 emissions case. Energy Policy 2013, 62, 1392–1402. [Google Scholar] [CrossRef]
- Stern, D.I. The environmental Kuznets curve after 25 years. J. Bioecon. 2017, 19, 7–28. [Google Scholar] [CrossRef]
- Pretty, J.; Brett, C.; Gee, D.; Hine, R.; Mason, C.; Morison, J.; Rayment, M.; Van Der Bijl, G.; Dobbs, T. Policy Challenges and Priorities for Internalizing the Externalities of Modern Agriculture. J. Environ. Plan. Manag. 2001, 44, 263–283. [Google Scholar] [CrossRef]
- Ceddia, M.G.; Sedlacek, S.; Bardsley, N.O.; Gomez-y-Paloma, S. Sustainable agricultural intensification or Jevons paradox? The role of public governance in tropical South America. Glob. Environ. Chang. 2013, 23, 1052–1063. [Google Scholar] [CrossRef]
- Culas, R.J. Deforestation and the environmental Kuznets curve: An institutional perspective. Ecol. Econ. 2007, 61, 429–437. [Google Scholar] [CrossRef]
- Managi, S. Are there increasing returns to pollution abatement? Empirical analytics of the Environmental Kuznets Curve in pesticides. Ecol. Econ. 2006, 58, 617–636. [Google Scholar] [CrossRef]
- Edenhofer, O.; Pichs-Madruga, R.; Sokona, Y.; Kadner, S.; Minx, J.; Brunner, S.; Agrawala, S.; Baiocchi, G.; Bashmakov, I.A.; Blanco, G.; et al. Climate Change 2014: Mitigation of Climate Change; Contribution of Working Group III to the Fifth Assessment Report of the Intergovernmental Panel on Climate Change; Intergovernmental Panel on Climate Change: Geneva, Switzerland, 2014. [Google Scholar]
- Eurostat Agriculture—Greenhouse Gas Emission Statistics. Available online: http://ec.europa.eu/eurostat/statistics-explained/index.php/Agriculture_-_greenhouse_gas_emission_statistics (accessed on 29 September 2017).
- Fort, R.; Henrar, M. Agriculture, Forestry and Fishery Statistics, 2016th ed.; Eurostat: Luxembourg, 2016; ISBN 978-92-79-63350-8. [Google Scholar]
- Yan, Q.; Yin, J.; Baležentis, T.; Makutėnienė, D.; Štreimikienė, D. Energy-related GHG emission in agriculture of the European countries: An application of the Generalized Divisia Index. J. Clean. Prod. 2017, 164, 686–694. [Google Scholar] [CrossRef]
- Communication from the Commission to the European Council and the European Parliament: An Energy Policy for Europe 2007. Avaliable online: http://eur-lex.europa.eu/legal-content/EN/TXT/?uri=LEGISSUM:l27067 (accessed on 27 November 2017).
- Christensen, L.A. Soil, Nutrient, and Water Management Systems Used in U.S. Corn Production; Agriculture Information Bulletin No. 774; United States Department of Agriculture: Washington, DC, USA, 2002.
- Goodland, R.; Daly, H. Environmental Sustainability: Universal and Non-Negotiable. Ecol. Appl. 1996, 6, 1002–1017. [Google Scholar] [CrossRef]
- Färe, R.; Grosskopf, S.; Tyteca, D. An activity analysis model of the environmental performance of firms—Application to fossil-fuel-fired electric utilities. Ecol. Econ. 1996, 18, 161–175. [Google Scholar] [CrossRef]
- Suri, V.; Chapman, D. Economic growth, trade and energy: Implications for the environmental Kuznets curve. Ecol. Econ. 1998, 25, 195–208. [Google Scholar] [CrossRef]
- Tamazian, A.; Chousa, J.P.; Vadlamannati, K.C. Does higher economic and financial development lead to environmental degradation: Evidence from BRIC countries. Energy Policy 2009, 37, 246–253. [Google Scholar] [CrossRef]
- Bohringer, C.; Jochem, P.E.P. Measuring the immeasurable—A survey of sustainability indices. Ecol. Econ. 2007, 63, 1–8. [Google Scholar] [CrossRef]
- Picazo-Tadeo, A.J.; Beltrán-Esteve, M.; Gómez-Limón, J.A. Assessing eco-efficiency with directional distance functions. Eur. J. Oper. Res. 2012, 220, 798–809. [Google Scholar] [CrossRef]
- Oude Lansink, A.; Wall, A. Frontier models for evaluating environmental efficiency: An overview. Econ. Bus. Lett. 2014, 3, 43–50. [Google Scholar] [CrossRef]
- De Koeijer, T.J.; Wossink, G.A.A.; Struik, P.C.; Renkema, J.A. Measuring agricultural sustainability in terms of efficiency: The case of Dutch sugar beet growers. J. Environ. Manag. 2002, 66, 9–17. [Google Scholar] [CrossRef]
- Farrell, M.J. The Measurement of Productive Efficiency. J. R. Stat. Soc. Ser. A 1957, 120, 253–290. [Google Scholar] [CrossRef]
- Lauwers, L. Justifying the incorporation of the materials balance principle into frontier-based eco-efficiency models. Ecol. Econ. 2009, 68, 1605–1614. [Google Scholar] [CrossRef]
- Vlontzos, G.; Niavis, S. Assessing the Evolution of Technical Efficiency of Agriculture in EU Countries: Is There a Role for the Agenda 2000? In Agricultural Cooperative Management and Policy: New Robust, Reliable and Coherent Modelling Tools; Zopounidis, C., Kalogeras, N., Mattas, K., van Dijk, G., Baourakis, G., Eds.; Springer International Publishing: Cham, Switzerland, 2014; pp. 339–351. ISBN 978-3-319-06635-6. [Google Scholar]
- Vlontzos, G.; Niavis, S.; Manos, B. A DEA approach for estimating the agricultural energy and environmental efficiency of EU countries. Renew. Sustain. Energy Rev. 2014, 40, 91–96. [Google Scholar] [CrossRef]
- Armundito, E.; Kaneko, S. Environmental Productivities and Carbon Abatement Costs of Manufacturing Sectors. In Climate Change Policies and Challenges in Indonesia; Kaneko, S., Kawanishi, M., Eds.; Springer: Tokyo, Japan, 2016; Volume 9, pp. 199–218. [Google Scholar]
- Scheel, H. Undesirable outputs in efficiency valuations. Eur. J. Oper. Res. 2001, 132, 400–410. [Google Scholar] [CrossRef]
- Rodseth, K.L. Environmental efficiency measurement and the materials balance condition reconsidered. Eur. J. Oper. Res. 2016, 250, 342–346. [Google Scholar] [CrossRef]
- Knox Lovell, C.A.; Pastor, J.T.; Turner, J.A. Measuring macroeconomic performance in the OECD: A comparison of European and non-European countries. Eur. J. Oper. Res. 1995, 87, 507–518. [Google Scholar] [CrossRef]
- Vlontzos, G.; Pardalos, P.M. Assess and prognosticate green house gas emissions from agricultural production of EU countries, by implementing, DEA Window analysis and artificial neural networks. Renew. Sustain. Energy Rev. 2017, 76, 155–162. [Google Scholar] [CrossRef]
- Halkos, G.E.; Tzeremes, N.G.; Kourtzidis, S.A. Regional sustainability efficiency index in Europe: An additive two-stage DEA approach. Oper. Res. 2015, 15, 1–23. [Google Scholar] [CrossRef]
- Chung, Y.H.; Färe, R.; Grosskopf, S. Productivity and Undesirable Outputs: A Directional Distance Function Approach. J. Environ. Manag. 1997, 51, 229–240. [Google Scholar] [CrossRef]
- Watanabe, M.; Tanaka, K. Efficiency analysis of Chinese industry: A directional distance function approach. Energy Policy 2007, 35, 6323–6331. [Google Scholar] [CrossRef]
- Suzuki, S.; Nijkamp, P. An evaluation of energy-environment-economic efficiency for EU, APEC and ASEAN countries: Design of a Target-Oriented DFM model with fixed factors in Data Envelopment Analysis. Energy Policy 2016, 88, 100–112. [Google Scholar] [CrossRef]
- Tyteca, D. Linear programming models for the measurement of environmental performance of firms—Concepts and empirical results. J. Product. Anal. 1997, 8, 183–197. [Google Scholar] [CrossRef]
- Zaim, O. Measuring environmental performance of state manufacturing through changes in pollution intensities: A DEA framework. Ecol. Econ. 2004, 48, 37–47. [Google Scholar] [CrossRef] [Green Version]
- Zhou, P.; Ang, B.W.; Wang, H. Energy and CO2 emission performance in electricity generation: A non-radial directional distance function approach. Eur. J. Oper. Res. 2012, 221, 625–635. [Google Scholar] [CrossRef]
- Sueyoshi, T.; Goto, M. Data envelopment analysis for environmental assessment: Comparison between public and private ownership in petroleum industry. Eur. J. Oper. Res. 2012, 216, 668–678. [Google Scholar] [CrossRef]
- Zhou, P.; Ang, B.W.; Poh, K.L. A survey of data envelopment analysis in energy and environmental studies. Eur. J. Oper. Res. 2008, 189, 1–18. [Google Scholar] [CrossRef]
- Sueyoshi, T.; Yuan, Y.; Goto, M. A literature study for DEA applied to energy and environment. Energy Econ. 2017, 62, 104–124. [Google Scholar] [CrossRef]
- Coelli, T.J.; Rao, D.S. Total factor productivity growth in agriculture: A Malmquist index analysis of 93 countries, 1980–2000. Agric. Econ. 2005, 32, 115–134. [Google Scholar] [CrossRef]
- Zhu, X.; Lansink, A.O. Impact of CAP subsidies on technical efficiency of crop farms in Germany, the Netherlands and Sweden. J. Agric. Econ. 2010, 61, 545–564. [Google Scholar] [CrossRef]
- Martinho, V.J.P.D. Efficiency, total factor productivity and returns to scale in a sustainable perspective: An analysis in the European Union at farm and regional level. Land Use Policy 2017, 68, 232–245. [Google Scholar] [CrossRef]
- Toma, P.; Miglietta, P.P.; Zurlini, G.; Valente, D.; Petrosillo, I. A non-parametric bootstrap-data envelopment analysis approach for environmental policy planning and management of agricultural efficiency in EU countries. Ecol. Indic. 2017, 83, 132–143. [Google Scholar] [CrossRef]
- Lauwers, L.; Van Huylenbroeck, G.; Rogiers, G. Technical, economic and environmental efficiency analysis of pig fattening farms. In Proceedings of the 9th European Congress of Agricultural Economists, Warschau, Polen, 24–28 August 1999. [Google Scholar]
- Hoang, V.N.; Rao, D.S.P. Measuring and decomposing sustainable efficiency in agricultural production: A cumulative exergy balance approach. Ecol. Econ. 2010, 69, 1765–1776. [Google Scholar] [CrossRef]
- Tian, D.; Zhao, F.; Mu, W.; Kanianska, R.; Feng, J. Environmental efficiency of chinese open-field grape production: An evaluation using data envelopment analysis and spatial autocorrelation. Sustainability 2016, 8, 1246. [Google Scholar] [CrossRef]
- Ghali, M.; Latruffe, L.; Daniel, K. Efficient use of energy resources on French farms: An analysis through technical efficiency. Energies 2016, 9, 601. [Google Scholar] [CrossRef]
- Halkos, G.E.; Tzeremes, N.G. Exploring the existence of Kuznets curve in countries’ environmental efficiency using DEA window analysis. Ecol. Econ. 2009, 68, 2168–2176. [Google Scholar] [CrossRef] [Green Version]
- Zaim, O.; Taskin, F. A Kuznets curve in environmental efficiency: An application on OECD countries. Environ. Resour. Econ. 2000, 17, 21–36. [Google Scholar] [CrossRef]
- Oggioni, G.; Riccardi, R.; Toninelli, R. Eco-efficiency of the world cement industry: A data envelopment analysis. Energy Policy 2011, 39, 2842–2854. [Google Scholar] [CrossRef] [Green Version]
- Galeotti, M.; Lanza, A.; Pauli, F. Reassessing the environmental Kuznets curve for CO2 emissions: A robustness exercise. Ecol. Econ. 2006, 57, 152–163. [Google Scholar] [CrossRef]
- Hoechle, D. Robust standard errors for panel regressions with cross-sectional dependence. Stata J. 2010, 10, 288–308. [Google Scholar]
- Eurostat. Available online: http://appsso.eurostat.ec.europa.eu/nui/show.do?dataset=apro_acs_a&lang=en (accessed on 1 September 2017).
- Economic Accounts for Agriculture—Values at Current Prices. Available online: http://appsso.eurostat.ec.europa.eu/nui/show.do?dataset=aact_eaa01&lang=en (accessed on 1 September 2017).
- Eurostat Database. Available online: http://ec.europa.eu/eurostat/data/database (accessed on 1 September 2017).
- Haug, R. Some leading issues in agricultural extension: A literature review. J. Agric. Educ. Ext. 1999, 5, 263–274. [Google Scholar] [CrossRef]

| Statistic | Land (1000 Ha) | Energy (mil. $) | Chemicals and Fertilizers (mil. $) | Fixed Capital Consumption (mil. $) | Labour (1000 AWU) | Output (mil. $) | GHG Emissions (1000 tonnesCO2) |
|---|---|---|---|---|---|---|---|
| Mean | 6642.64 | 786.57 | 880.12 | 1815.24 | 1210.88 | 11,720.45 | 17.69 |
| St Dv | 7901.59 | 933.03 | 1314.67 | 2730.81 | 1729.06 | 15,644.37 | 22.99 |
| Max | 35,177.80 | 4502.70 | 7599.10 | 12,377.39 | 7307.35 | 70,394.90 | 100.46 |
| Min | 9.70 | 5.44 | 1.73 | 3.76 | 3.59 | 115.18 | 0.08 |
| Country | Average Eco-(In)Efficiency | Years Fully Efficient | Highest Eco-(In)Efficiency | Lowest Eco-(In)Efficiency |
|---|---|---|---|---|
| Netherlands | 0.000 | 14 | 0.000 | 0.000 |
| Malta | 0.000 | 14 | 0.000 | 0.000 |
| Italy | 0.003 | 13 | 0.043 | 0.000 |
| France | 0.004 | 11 | 0.030 | 0.000 |
| Spain | 0.005 | 12 | 0.050 | 0.000 |
| Austria | 0.009 | 9 | 0.055 | 0.000 |
| Belgium | 0.010 | 10 | 0.068 | 0.000 |
| Portugal | 0.010 | 10 | 0.058 | 0.000 |
| Poland | 0.013 | 13 | 0.188 | 0.000 |
| Germany | 0.017 | 10 | 0.098 | 0.000 |
| Greece | 0.018 | 7 | 0.077 | 0.000 |
| Bulgaria | 0.021 | 10 | 0.133 | 0.000 |
| Denmark | 0.022 | 8 | 0.088 | 0.000 |
| Luxembourg | 0.025 | 11 | 0.136 | 0.000 |
| Ireland | 0.026 | 10 | 0.153 | 0.000 |
| Cyprus | 0.046 | 11 | 0.255 | 0.000 |
| Romania | 0.050 | 8 | 0.216 | 0.000 |
| Croatia | 0.075 | 8 | 0.241 | 0.000 |
| Sweden | 0.159 | 0 | 0.286 | 0.029 |
| Estonia | 0.175 | 6 | 0.479 | 0.000 |
| Slovenia | 0.199 | 1 | 0.312 | 0.000 |
| Czech Republic | 0.219 | 5 | 0.451 | 0.000 |
| United Kingdom | 0.220 | 6 | 0.492 | 0.000 |
| Hungary | 0.281 | 0 | 0.422 | 0.113 |
| Latvia | 0.282 | 3 | 0.634 | 0.000 |
| Finland | 0.311 | 0 | 0.375 | 0.239 |
| Slovakia | 0.351 | 0 | 0.513 | 0.167 |
| Lithuania | 0.402 | 0 | 0.551 | 0.213 |
| Mean | 0.105 | - | - | - |
| St.Dv | 0.150 | - | - | - |
| Models (Dependent Variable) | ||||||
|---|---|---|---|---|---|---|
| 2.1 () | 2.2 () | 2.3 () | ||||
| Estimators | Estimation | St.Error | Estimation | St.Error | Estimation | St.Error |
| 0.0428 *** | 0.0145 | 1.759 ** | 0.7169 | 0.0060 *** | 0.00195 | |
| −2.62 × 10⁻⁹ *** | 7.75 × 10⁻¹⁰ | −1.06 × 10⁷ *** | 3.92 × 10⁻⁸ | −2.43 × 10⁻¹⁰ ** | 1.09 × 10⁻¹⁰ | |
| 4.30 × 10⁻¹⁴ *** | 1.27 × 10⁻¹⁴ | 1.89 × 10⁻¹² *** | 6.55 × 10⁻¹³ | 1.65 × 10⁻¹⁵ | 1.82 × 10⁻¹⁵ | |
| −0.0399 | 0.0820 | −2.6329 | 4.0450 | 81.5590 *** | 15.490 | |
| T | 14 | |||||
| N | 27 | |||||
| WaldTest chi2(1) | 8.68 | 9.75 | 137.46 | |||
| Prob > chi2 | 0.003 | 0.021 | 0.001 | |||
| Hausman Test chi2(1) | - | 0.01 | 3.84 | |||
| Prob > chi2 | - | 0.943 | 0.051 | |||
| TurningPoint 1 (000€) | 11,326 | 12,428 | 12,325 | |||
| TurningPoint 2 (000€) | 29,294 | 24,961 | - | |||
© 2017 by the authors. Licensee MDPI, Basel, Switzerland. This article is an open access article distributed under the terms and conditions of the Creative Commons Attribution (CC BY) license (http://creativecommons.org/licenses/by/4.0/).
Share and Cite
Vlontzos, G.; Niavis, S.; Pardalos, P. Testing for Environmental Kuznets Curve in the EU Agricultural Sector through an Eco-(in)Efficiency Index. Energies 2017, 10, 1992. https://doi.org/10.3390/en10121992
Vlontzos G, Niavis S, Pardalos P. Testing for Environmental Kuznets Curve in the EU Agricultural Sector through an Eco-(in)Efficiency Index. Energies. 2017; 10(12):1992. https://doi.org/10.3390/en10121992
Chicago/Turabian StyleVlontzos, George, Spyros Niavis, and Panos Pardalos. 2017. "Testing for Environmental Kuznets Curve in the EU Agricultural Sector through an Eco-(in)Efficiency Index" Energies 10, no. 12: 1992. https://doi.org/10.3390/en10121992