Factors Influencing the Thermal Efficiency of Horizontal Ground Heat Exchangers


Department of Geology, GeoZentrum Nordbayern, Friedrich-Alexander University Erlangen-Nuremberg, 91054 Erlangen, Germany
*
Author to whom correspondence should be addressed.
Energies 2017, 10(11), 1897; https://doi.org/10.3390/en10111897
Submission received: 13 October 2017
/
Revised: 12 November 2017
/
Accepted: 14 November 2017
/
Published: 18 November 2017
(This article belongs to the Special Issue Low Enthalpy Geothermal Energy)
Abstract
:The performance of very shallow geothermal systems (VSGs), interesting the first 2 m of depth from ground level, is strongly correlated to the kind of sediment locally available. These systems are attractive due to their low installation costs, less legal constraints, easy maintenance and possibility for technical improvements. The Improving Thermal Efficiency of horizontal ground heat exchangers Project (ITER) aims to understand how to enhance the heat transfer of the sediments surrounding the pipes and to depict the VSGs behavior in extreme thermal situations. In this regard, five helices were installed horizontally surrounded by five different backfilling materials under the same climatic conditions and tested under different operation modes. The field test monitoring concerned: (a) monthly measurement of thermal conductivity and moisture content on surface; (b) continuous recording of air and ground temperature (inside and outside each helix); (c) continuous climatological and ground volumetric water content (VWC) data acquisition. The interactions between soils, VSGs, environment and climate are presented here, focusing on the differences and similarities between the behavior of the helix and surrounding material, especially when the heat pump is running in heating mode for a very long time, forcing the ground temperature to drop below 0 °C.
1. Introduction
In a context of societal and economic transformations and growing global interdependencies, access to energy resources plays worldwide a fundamental role. European countries have few natural energy reserves and currently they import the majority of their energy requirements. This leads to high costs for natural gas and electricity supplies, subject to energy market trends. Therefore, to reduce the energetic dependencies and maintain the standard of living, key efforts are directed to a better exploitation of green and renewable energy resources (solar, biomass, geothermal, wind, hydro and ocean energy) [1,2].
According to the European Vision for the Renewable Heating & Cooling (RHC) sector in Europe, which aims to produce over 25% of heat consumed in the European Union (EU) with renewable energy technologies by 2020 and over 50% by 2030, geothermal energy is one of the most promising sources due to its high potential and multiple uses [3,4]. In detail, shallow geothermal energy is a reliable thermal energy source used mainly for indirect heating and cooling of residential, industrial or commercial buildings and greenhouse farming [5,6,7]. It involves the exploitation of low temperature geothermal resources, as soil and groundwater (temperature range 5–30 °C), abundant around the world and available at relative small depths (on average around 100–150 m depth), by means of ground source heat pumps (GSHPs) [8,9]. This technology consists of three main sections: (i) the Earth connection, represented by heat exchangers, responsible for extracting (injecting) heat from (into) the ground; (ii) the geothermal heat pump, able to transfer heat between the ground and the building; (iii) the heat distribution system, that distributes the heat in the building [10].
When the heat carrier fluid circulates inside heat exchangers and is physically separated from the rock/soil and surrounding environment, the system is known as a closed loop system [11]. In this case, the Earth connections can be realized both by vertical and horizontal ground heat exchanger. The former is preferred when the installation area is limited and is characterized by high installation costs due to drilling operation. The latter, located slightly below the Earth’s surface (1–2 m depth), known also as very shallow geothermal (VSG) systems, is attractive due to its merits of low installation cost and less restricted legal constraints and easy maintenance, even if ample ground areas are required [12,13].
The operating principle in both cases is the same: in winter time (heating mode) the heat exchanger extracts heat from the ground, taking advantage of the higher ground temperature than the air temperature; in summer (cooling mode) it reinjects heat into the ground by withdrawing it from the warmer external atmosphere [14,15]. In order to assess the performance of different GSHPs, properly size the shallow geothermal applications and estimate cost and payback time of the system, several heat transfer models are available, according to the geometry of the GSHP selected, the environmental conditions and the building features [16,17,18].
To ensure a good thermal exchange with the subsoil, the horizontal loops can assume different lengths and configurations (linear, helical, spiral) according to local characteristics and building conditioning requirements [19,20,21]. The performance is strongly correlated both to technical factors (i.e., pipe configuration, length, loop diameter, loop pitch, spacing of pipes, fluid flow rate, thermal loads of the buildings, quality of building envelope…) and to the local geological and environmental conditions [22,23,24,25]. Recent works have concluded that helical heat exchangers, known as helix systems, provide the best thermal performance compared to common horizontal loop systems, even if they need more tube length [26]. Moreover, they are also a valid alternative to vertical systems installed at shallow depths (up to 25 m) [27,28,29,30]. Anyway, used as horizontal collector, helix requires shorter trenches and less land space [12], so a great interest in their possible implementation is registered.
Among the geological and environmental parameters, the heat conductivity (λ) of the soil around the tubes plays a key role in determining the VSGs efficiency: an increase in λ corresponds to a better performance. This property is greatly affected by the kind of material at disposal (i.e., grain size, mineralogical content, density), the soil moisture and temperature variations [31,32,33]. Once the kind of material is defined, the moisture migration in soil bodies due to thermal or hydraulic gradients is the main responsible for changes in thermal conductivity. The heat transfer in soil is led by conduction, a process driven by temperature gradients and dependent on thermal conductivity, in turn a property strictly related to water content. Then, the heat transfer in soils tends to decrease as anhydrous conditions or decreasing temperature are detected [34,35,36,37].
Due to the proximity of very shallow horizontal ground loops to the ground surface, the water content in the first meter of depth is conditioned by meteorological and environmental events, such as rainfall, solar radiation, albedo, fluctuations in air temperature, vegetation cover, evapotranspiration, etc. [38,39,40,41]. Diurnal, monthly and seasonal variations of climatic data, especially air temperature and rainfall, can affect the moisture transfer in soils. Even if their contributions is reduced with increasing depth, the induced variations on soil thermal properties may have significant effects on the performance of the horizontal GSHP system [42,43,44]. According to Leong et al. a soil saturation degree below 12.5%, above 25% and in excess of 50% is responsible respectively for a decrease, an improvement and an insignificant variation of the performance [45].
Furthermore, we must consider that when the VSG system is running in heating (cooling) mode, a decrease (increase) of temperature is registered in the surrounding of the Earth connections and that it is important to take into consideration also the capacity of the thermal energy content of the soil to regenerate when the heat exchangers are not operating [21].
Therefore, understanding the relationships between different soils, horizontal collectors and the above ground environment is fundamental to plan a rational use of soil heat resources over time.
On this regard, the research performed under the Improving Thermal Efficiency of horizontal ground heat exchangers Project (ITER, http://iter-geo.eu/), funded by the European Union, is concerned, among other topics, with assessing the performance and the environmental impacts of helix heat exchangers in VSG systems by directly monitoring over time the environmental and thermal parameters. The aims of the project are to understand how to enhance the heat transfer of the sediments surrounding the pipes and to depict the VSGs behavior in extreme thermal situations.
This paper presents the outputs of the ITER Project test site in Eltersdorf (Bavaria, Germany), where five helices are installed horizontally at 1 m depth surrounded by five different backfilling materials under the same meteorological conditions and tested under different operation modes. Measurements of climatic data, soil thermal properties and temperatures of the ground have been performed for 1 year and a half, from 13 November 2015 till 22 May 2017. In this timeframe the system runs in heating mode three times (16 March–19 April 2016, 10–28 November 2016 and 2 March–22 May 2017), while in the remaining period the heat carrier fluid is recirculated in the helix heat exchangers without any heat-extraction (or heat-injection) from (into) the ground [29]. The primary aim is to monitor the temperature of the soil and the environment during the heating period and the period of stagnation of ground heat exchanger. Then, the experimental data measured in the test field, especially those related to thermal conductivity, are compared with the database of thermally enhanced backfilling material (TEBM)physical-thermal properties already determined in laboratory, in order to discriminate how the climatic factors can influence the thermal properties of surficial soil bodies. Finally, the interactions between soils, VSGs, environment and climate, focusing on the differences and similarities between the behavior of the helix and surrounding material, are observed especially when the heat pump is running in heating mode for a very long time, forcing the ground temperature to drop below 0 °C.
2. Materials and Methods
2.1. Test Site
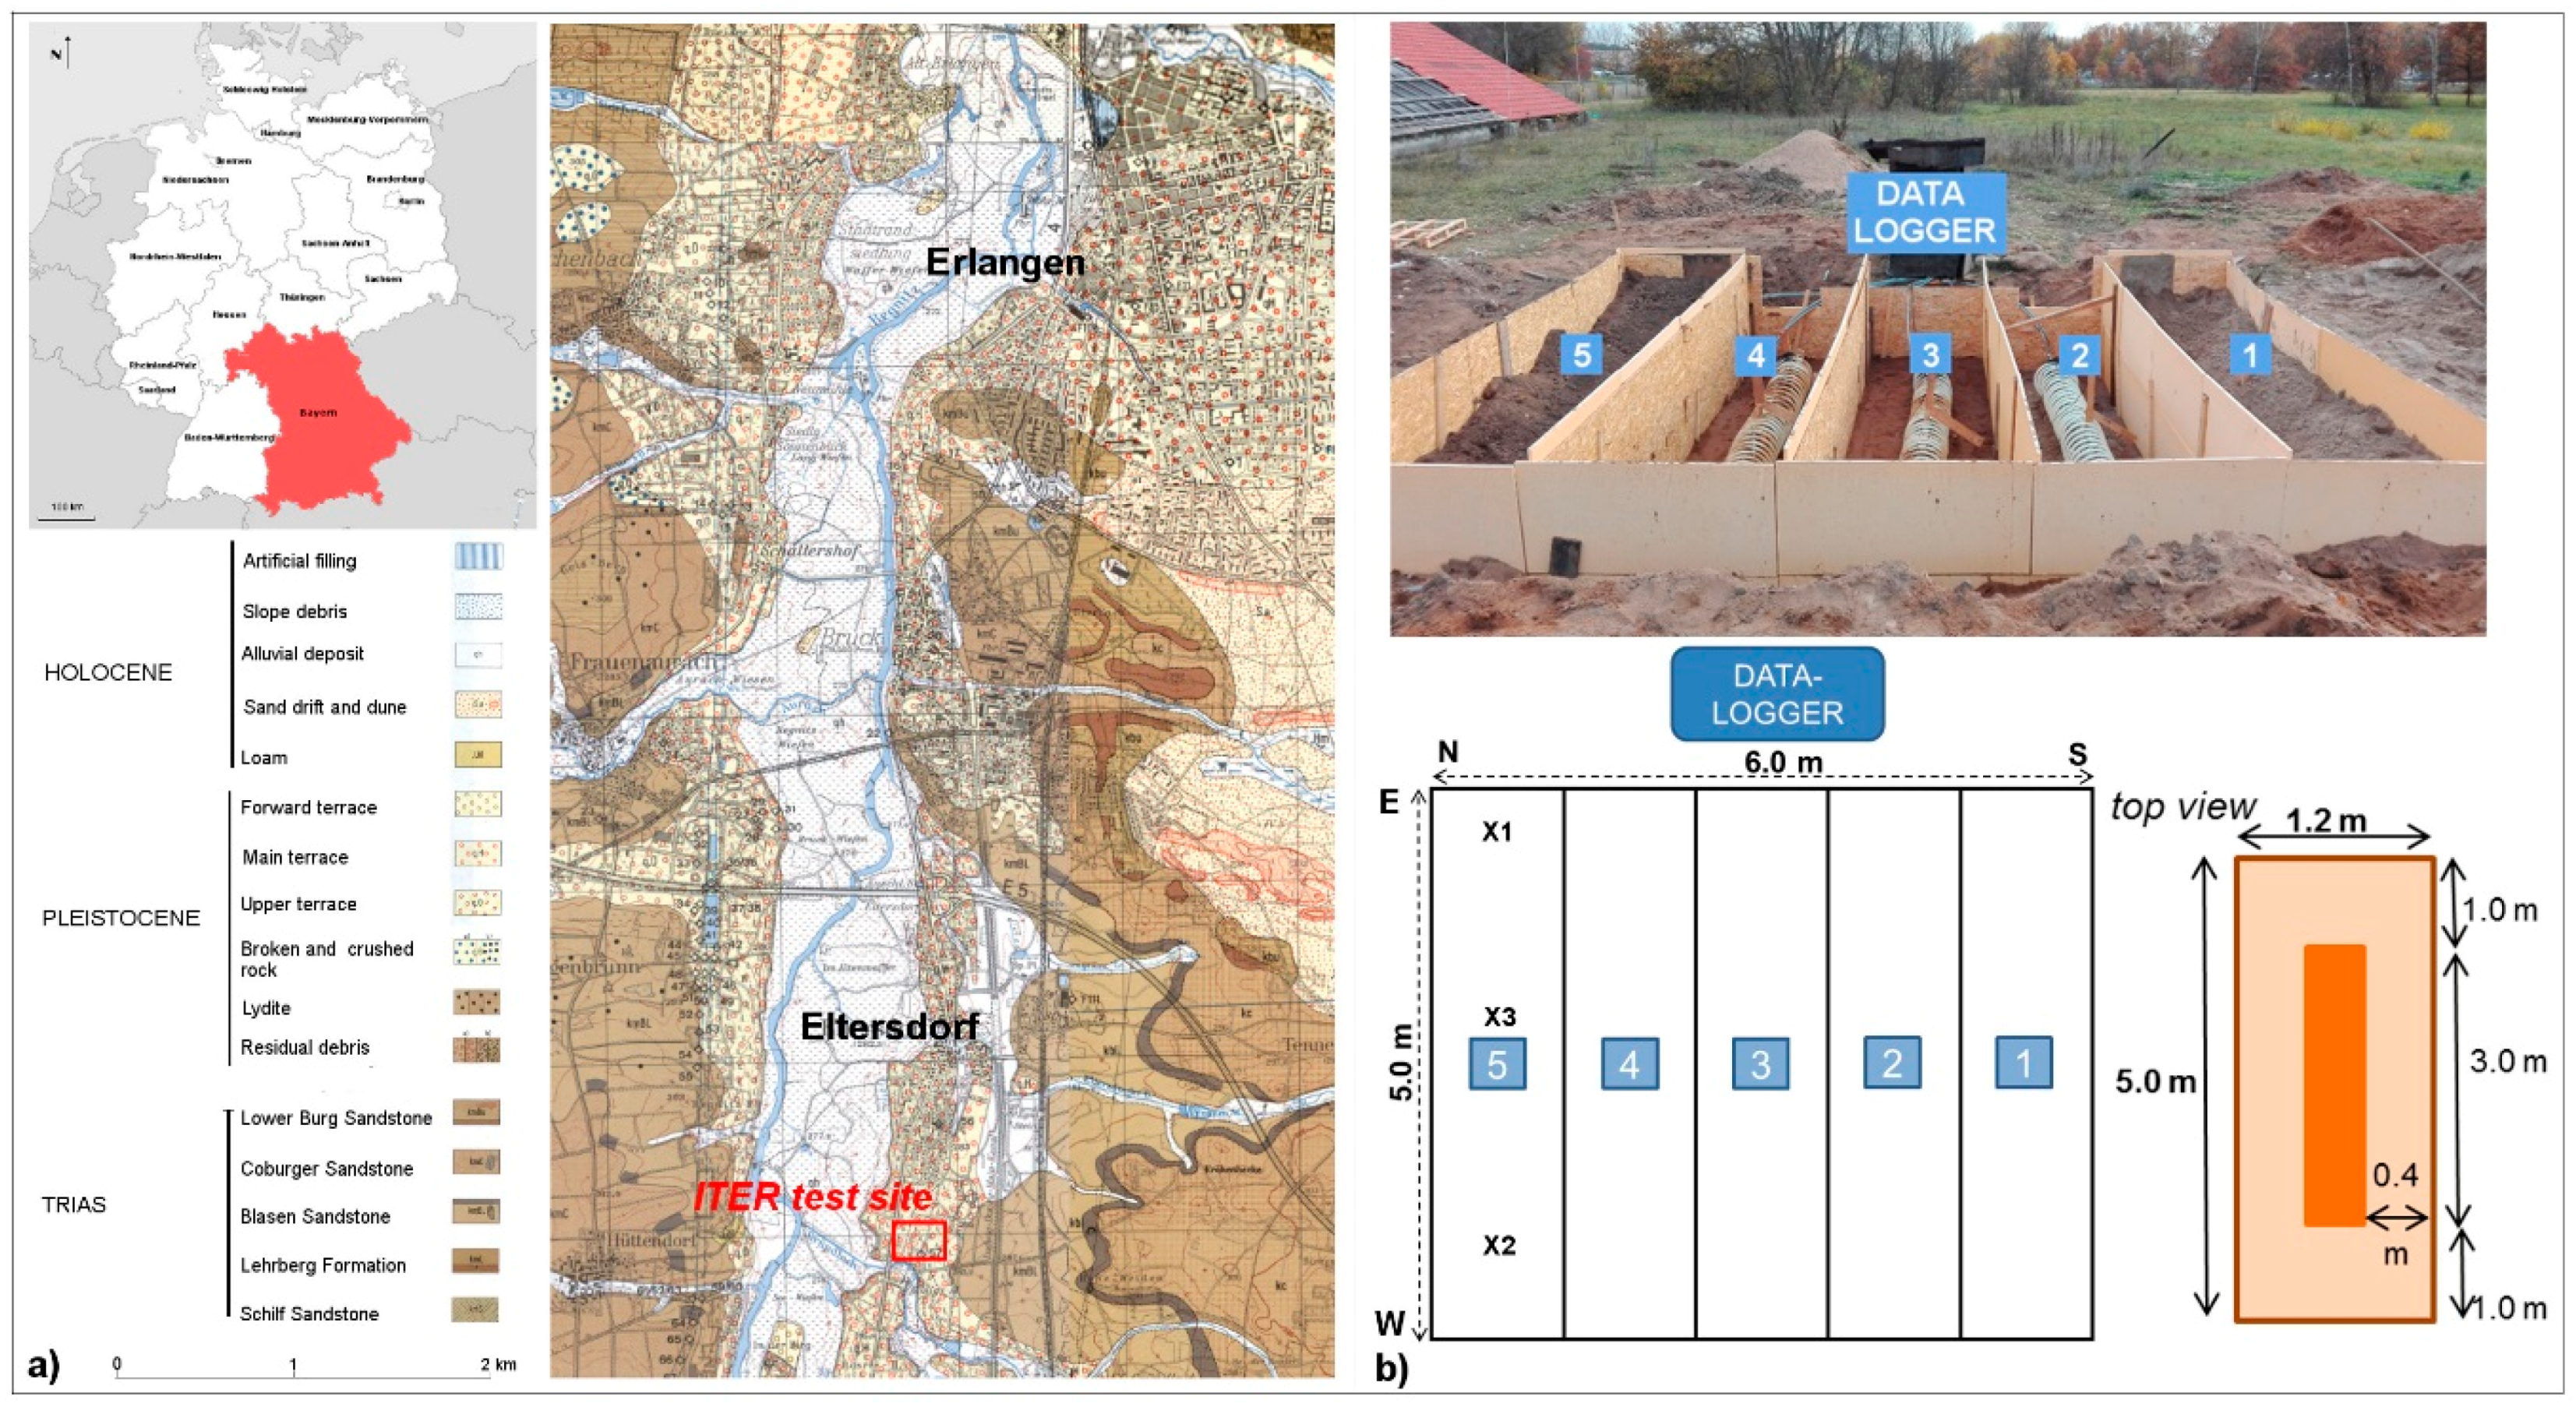
The ITER project test site is located in Eltersdorf, about 6 km south-west from the city of Erlangen (Bavaria, Germany, Figure 1a). Hosted on the property of REHAU AG & Co company (Eltersdorf, Bavaria, Germany), partner of the project, it consists of a trench 6.0 m wide, 5.0 m long and 1.1 m depth, divided in five sectors of the same size (1.2 × 5.0 × 1.1 m, Figure 1b).
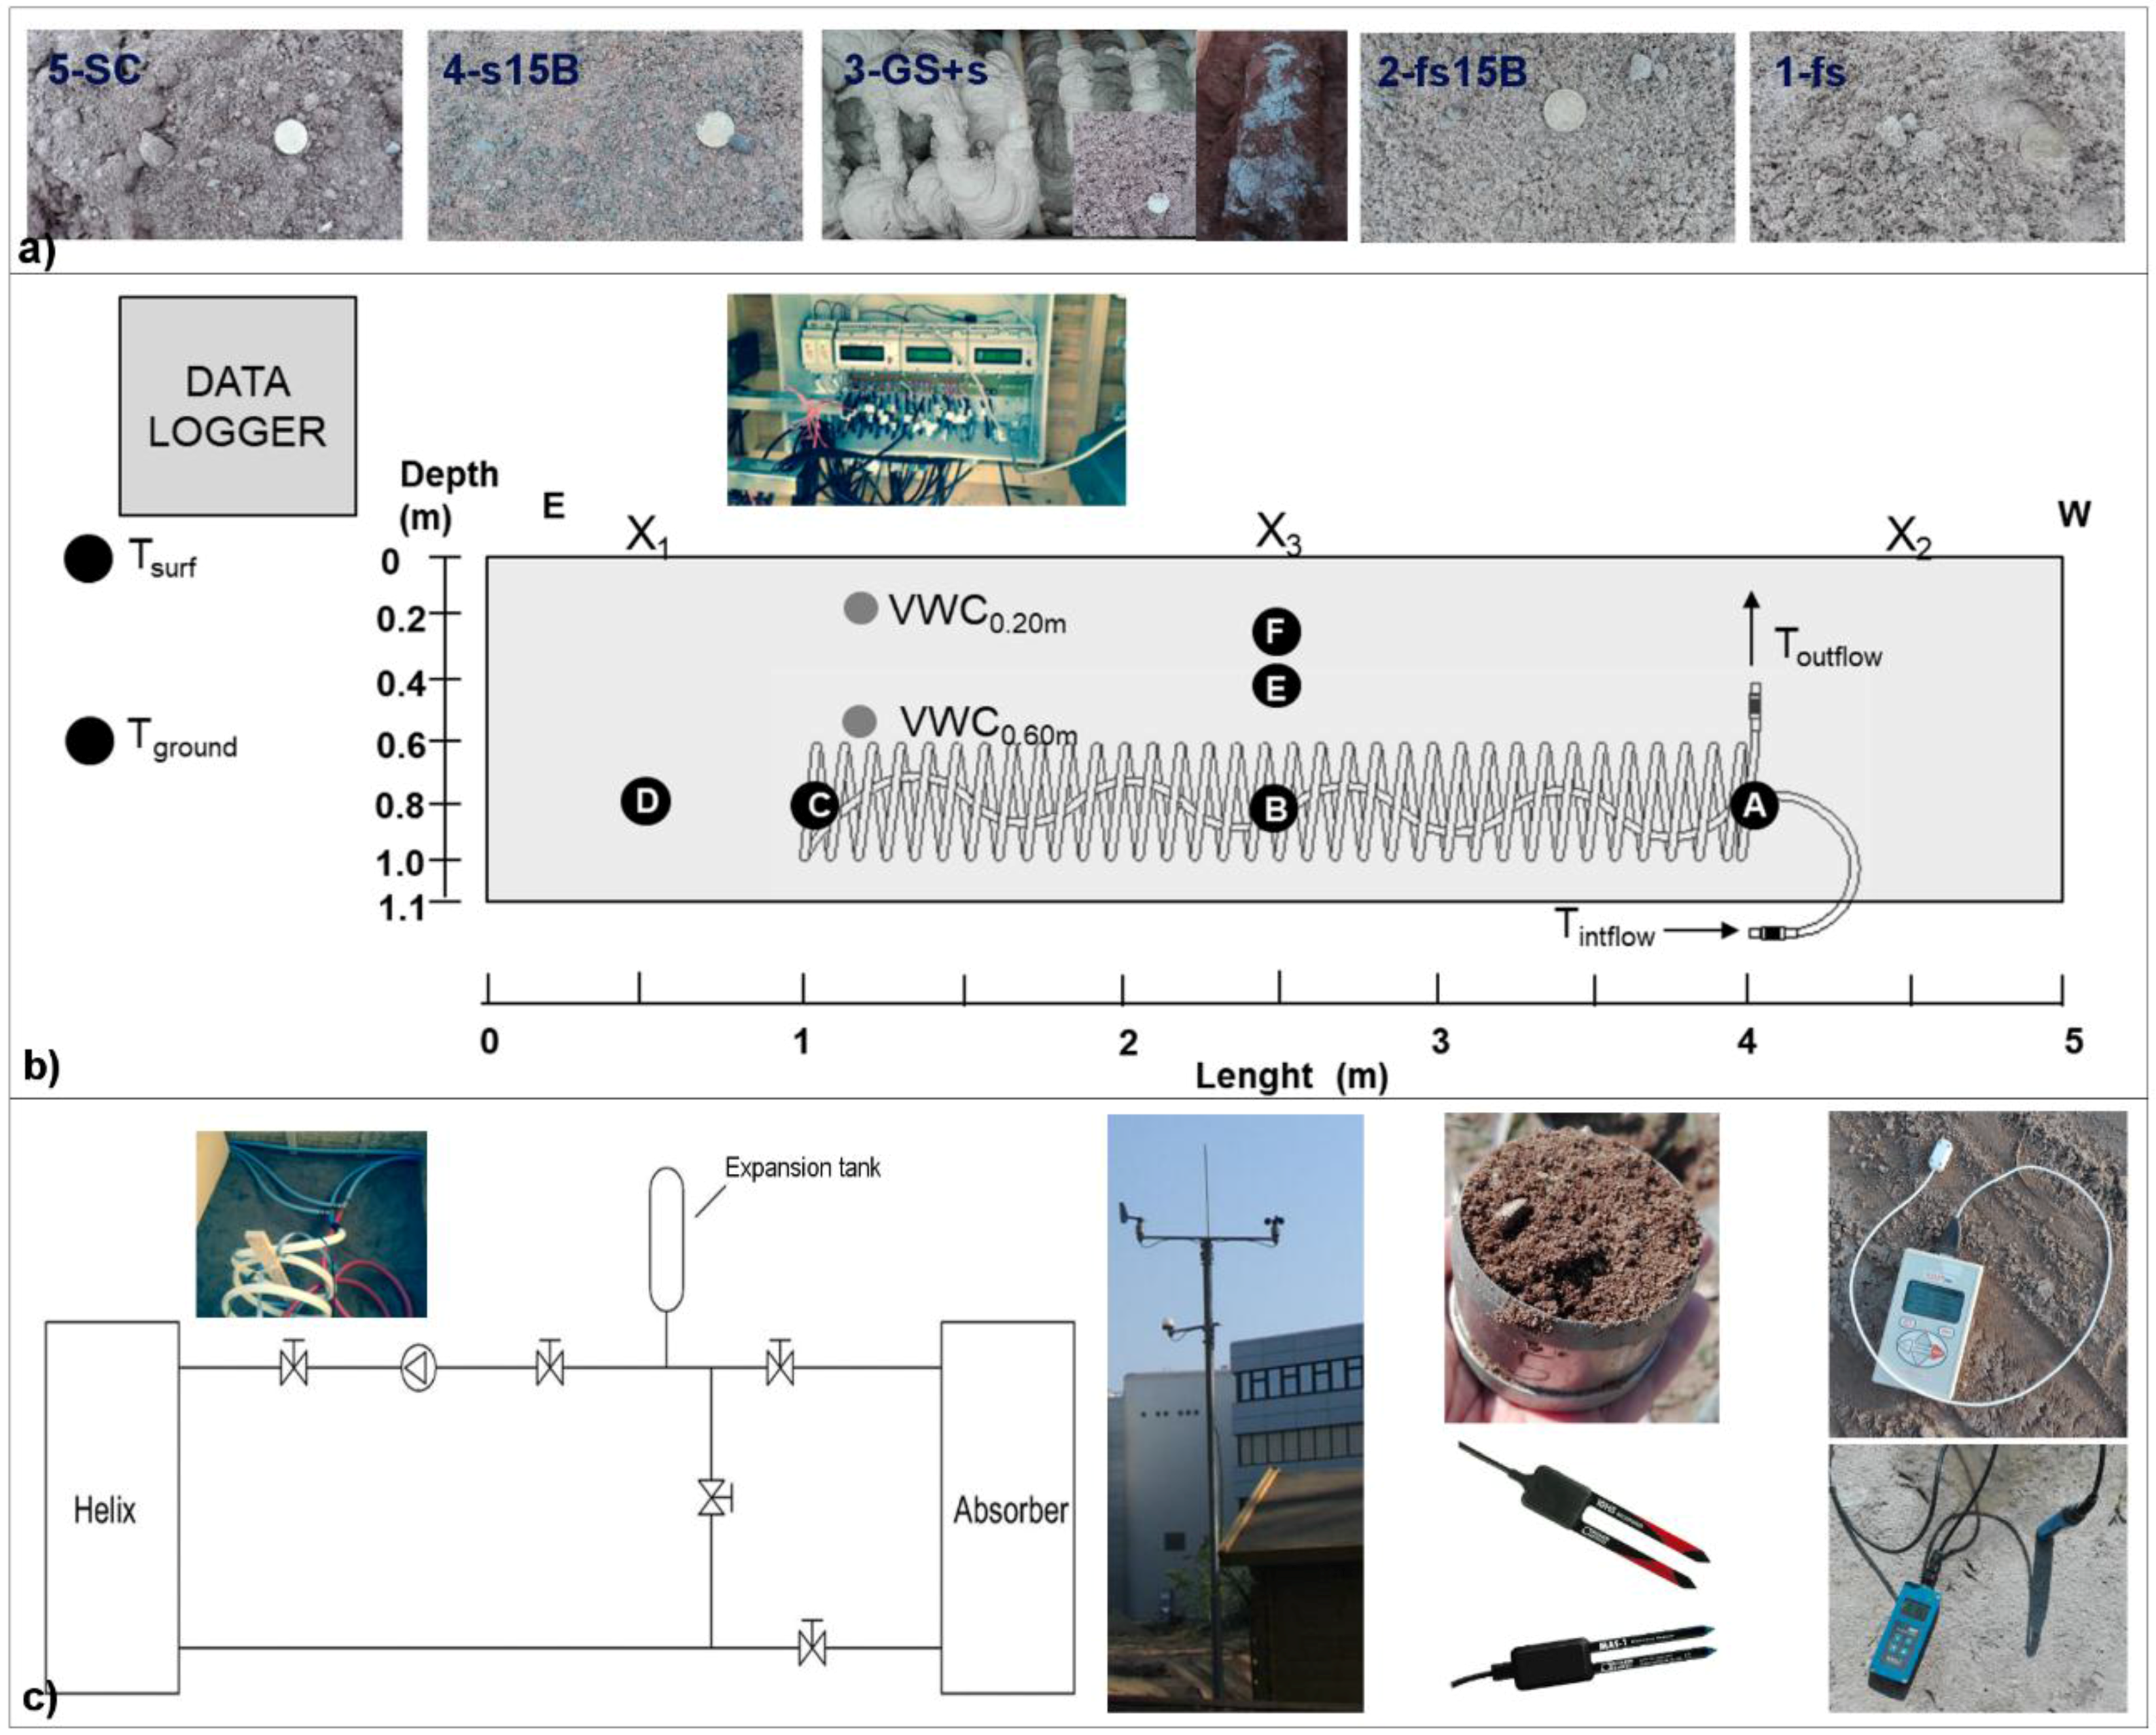
In each sector a surface collector system (helix probe, 3 m long, 0.4 m wide) is installed between 0.6 and 1 m depth below the ground level (bgl), equidistant from the boundaries and E-W oriented [46]. The main characteristics of the helix heat exchangers are outlined in Table 1.
The installation depth of the helix, with the bottom lying at 1.0 m and the top at 0.60 m depth, is deliberately chosen, on one hand, to verify if at 0.60 m depth, according to industrial partner experience, the effect of soil thermal conductivity is dominant compared to that of the daily temperature amplitude [26]; on the other, to force the growing and potential merging of the ice radius around the helix and see the reaction of the surrounding soil. In addition, the selected installation depth allows to reduce the installation costs.
In order to thermally isolate every trench from the adjacent one and the surrounding ground, the outer and intermediate walls are made of extruded polystyrene (XPS, 2 cm thick) panels, characterized by very low thermal conductivity value (λ = 0.035 W m−1 K−1) (Figure 1b). In this way the thermal contamination between adjacent trenches is expected to be negligible, even if border effects cannot be excluded a priori. Moreover, the groundwater flow is not affecting the system because locally the piezometric level is on average at about 10 m depth.
The trenches are filled in with five thermally enhanced backfilling materials (TEBM), tested also in laboratory (Figure 2a):
- (1)
- fine sand 0–1 mm (fs);
- (2)
- fine sand 0–1 mm with 15% bentonite (fs15B);
- (3)
- a commercial product (GeoSolid 240HS) in direct contact with the Helix, in turn surrounded by sand 0–5 mm (s);
- (4)
- sand 0–5 mm + 15% bentonite (s15B);
- (5)
- loamy sand (SC);
The sand bodies used in this research belong to the Burg Sandstone Formation (Trias), have a dominant quartz composition, and are commonly used in constructions, sieved up to 1 and 5 mm. Therefore, it is possible to identify two distinctive materials: a grey withe fine sand 0–1 mm (fs) and a reddish coarse sand 0–5 mm (s). The loamy sand (SC), a quaternary sediment belonging to the Main terrace formation and characterized by a very high content of silicon oxide and clay minerals (i.e., illite, smectite), is the original material available on site [47]. The bentonite (B) used to create the soil mixtures is a very fine non-calcareous marine clay, belonging to the Holmehus Formation (Denmark), constituted mainly of montmorillonite (>60%).
Finally, the commercial product GeoSolid 240 HS (from now on cited as GS), kindly provided by Fischer Spezialbaustoffe Gmbh (Heilsbronn, Bavaria, Germany), is an enhanced thermal material (λ = 2.4 W m−1 K−1) generally used as grouting for borehole heat exchangers in agreement with the current recommendations of Verein Deutscher Ingenieure (VDI), Association of German Engineers) guideline for the thermal utilization of the substrate [48]. In the framework of ITER, it has been applied mixed with water all around the helix, creating, once dried, an impermeable solid box completely covered with coarse sand (Figure 2a).
The five soil mixtures have been selected according to the results of the laboratory measurements performed on 15 thermally enhanced backfilling material (TEBM) tested under different water content (complete dry up to complete saturation) and incremental load conditions [36].
Concerning the hydraulic system, the five helix probes are coupled in a Tichelmann configuration, each showing the same flow over 24 h, and are connected to an absorber, able to stress the working condition (heating/cooling) (Figure 2c). A Tichelmann system, also commonly known as a reverse return system, is a special system for pipe installation in heating engineering offering an equilibrated system with the lowest possible resistance [50]. The circuits of the five helix collectors are connected to the same flow and return line and are exposed approximately to equal pressure losses and equal volume flows, in order to have a uniform heating all over the system. The ground boundary conditions (kind of material, insulation panels, groundwater flow) have been already described, while the meteorological effects (outdoor temperature, solar radiation, precipitation etc…) are discussed below. A numerical simulation and related error analysis are not dealt with this work, based on the interactions between soils, climate and running heat pumps.
2.2. The Monitoring System
Three main data acquisition systems have been conceived in order to collect information directly from (i) the helix system, (ii) the surrounding environment and (iii) the backfilling material on surface.
Several sensors focused on the helix systems allows one to record every 5 min in two dataloggers data related to:
- the ground temperature inside and outside each helix (six sensors/helix, 30 sensors in total);
- the undisturbed ground and surface temperature (two sensors) outside the trench;
- the fluid temperature running in and out the helix system (two sensors);
- the speed flow inside the helix (one sensor);
- the speed flow between the helix and the absorber (four sensors);
- the surface temperature of the absorber (two sensors);
- the volumetric water content (VWC) at 0.60 m depth, that is at the top of each helix (five sensors).
In detail, the temperature sensors are constituted by Pt-1000 class B resistance thermometers (accuracy of ± (0.30 °C + 0.005 × the reading temperature)). In each sector they are installed (Figure 2b):
- (1)
- at the helix inlet (A), at 0.80 m depth below the ground surface (bgl) and 4 m away from the east (E) margin;
- (2)
- at the helix center (B), at 0.80 m depth (bgl) and 2.5 m away from E margin;
- (3)
- at the helix end (C), at 0.80 m depth (bgl) and 1 m away from E margin;
- (4)
- at the helix end (D) at 0.80 m depth (bgl) and 0.5 m away from E margin;
- (5)
- at the helix center (E), at 0.40 m depth (bgl) and 2.5 m away from E margin;
- (6)
- at the helix center (F), at 0.30 m depth (bgl) and 2.5 m away from E margin;
- (7)
- outside the test site (Tground), near the datalogger, at 0.60 m depth (bgl);
- (8)
- outside the test site (Tsurf), near the datalogger, at 0.10 m depth (bgl).
Given that the number of available sensors is limited and the project priority is to understand the ground reaction to extreme thermal stress, it was decided to increase the number of sensors in different locations (inside and outside each helix) instead of doubling the measurements in few points (only inside the helix) in order to better fulfil the research purposes. In the event of one or more sensors failure, the data collected in other sectors in the same position can provide an idea of the missing data trend.
The fluid flow rate is measured by electromagnetic sensor (accuracy of 2%) and the volumetric water content (VWC) at 0.60 m depth by soil moisture sensors (MAS-1 sensor of Decagon Devices Inc. (Pullman, WA, USA), range 0 to 100% VWC, accuracy of ±6%).
The heat carrier fluid is a mixture of water and 25% in volume of ethylene glycol [28]. It enters the system into the straight pipe placed in the helix center and exited from the helical pipe [29] (Figure 2b).
All measured values are recorded and stored simultaneously by two datalogger systems both with GigaLog-S logger modules and transmitters (IMC-Ingenieurbüro MessElektronik, Chemnitz, Saxen, Germany). The data presented in this paper are registered continuously (every 5 min) from 13 November 2015 till 22 May 2017, while the moisture measurements are available only in the period 15 November 2016–7 February 2017. The system is switched on recreating heating conditions three times (16 March–19 April 2016, 10–29 November 2016 and 2 March–22 May 2017). During the remaining period the heat carrier fluid is recirculated in the helix without any heat-extraction (or heat-injection) from (into) the ground [29]. Anyway, temperatures are monitored throughout the test.
A meteorological station, belonging to REHAU AG & Co, located 250 m SW from ITER test site, provides climatic data acquisition related to light intensity or illuminance (Lux), rainfall (mm), wind speed (m/s), wind direction (Grad), relative humidity (%), outside temperature (2 m high, °C) and surface temperature (0 m, °C). The weather station is located 3 m above the ground and data are collected every 10 min. Furthermore, measurements collected at the nearby weather station in Nuremberg airport (about 10 km towards SE) by the Germany National Meteorological Service have been used to validate the hourly and monthly measurement acquired in situ [51].
The time and date attributed to the data are always related to the solar time. In the helix monitoring system, the hourly and the daily averages are calculated based on 12 measurements per hour and 288 measurements per day, respectively. In the meteorological station, the hourly and daily cumulative rainfall is determined based on six measurements per hour and 144 measurements per day. Concerning the other climatic parameters, the recording is used to determine the average values.
Some malfunctions of the monitoring systems have resulted in limited data loss for certain parameters, including the complete loss of signal for sensors E and B in sector 5 (E5 and B5) starting from 8 February 2016 at 22:00 and from 24 May 2016 at 3:45 respectively (Figure 2c).
Monthly measurements of thermal conductivity and moisture content have been collected since November 2015 till June 2017 on the surface. For each sector under investigation, three series of data have been collected by thermal properties analyzer (KD2Pro apparatus, Decagon Devices, Inc.) and time domain reflectometry (TDR) device (TRIME IMKO GmBH, Ettligen, Baden-Württemberg, Germany) in the first 10 cm below the ground surface (Figure 2c). However, from November 2016 till February 2017, the presence of frozen soil related to prolonged period of air temperatures below 0 °C prevented the execution of reliable thermal conductivity (λ) measurements, while in September 2016 the data have not been collected, due to the non-availability of the devices. Since July 2016 surface soil samples have been collected in order to determine the bulk density and volumetric water content of the mixture, according to the Deutsches Institut für Normung (German institute for standardization) DIN 52102 and DIN 18121 [52,53]. In addition, the VWC at 0.20 m depth is recorder continuously (every 5 min) since 15 November 2016 by soil moisture sensors (10HS sensor of Decagon Devices Inc., range 0 to 57%, accuracy of ±0.5%).
3. Results and Discussions
3.1. Metereological Variables
The possibility to exploit surface geothermal energy by means of geothermal collectors is essentially determined by the local climatic factors influencing precipitation and temperature. These two parameters can vary the degree of soil water-saturation in the first meters of depth and, therefore, according to the kind of sediment at disposal, the thermal properties, influencing the performance of the helix. In addition, the meteorological variables provide essential information for the energy consumptions of the buildings in the study area.
Therefore, the climatological data collected in Eltersdorf for over one year, from 1 November 2015 to 10 February 2016 are here presented. Diurnal and seasonal variations in soil temperature are a function of solar radiation, fluctuations in air temperature, soil textural composition, and soil depth [34]. On the ITER test site, the effect of type and density of vegetation cover is not considered, because no plants are foreseen on top of the backfilling material.
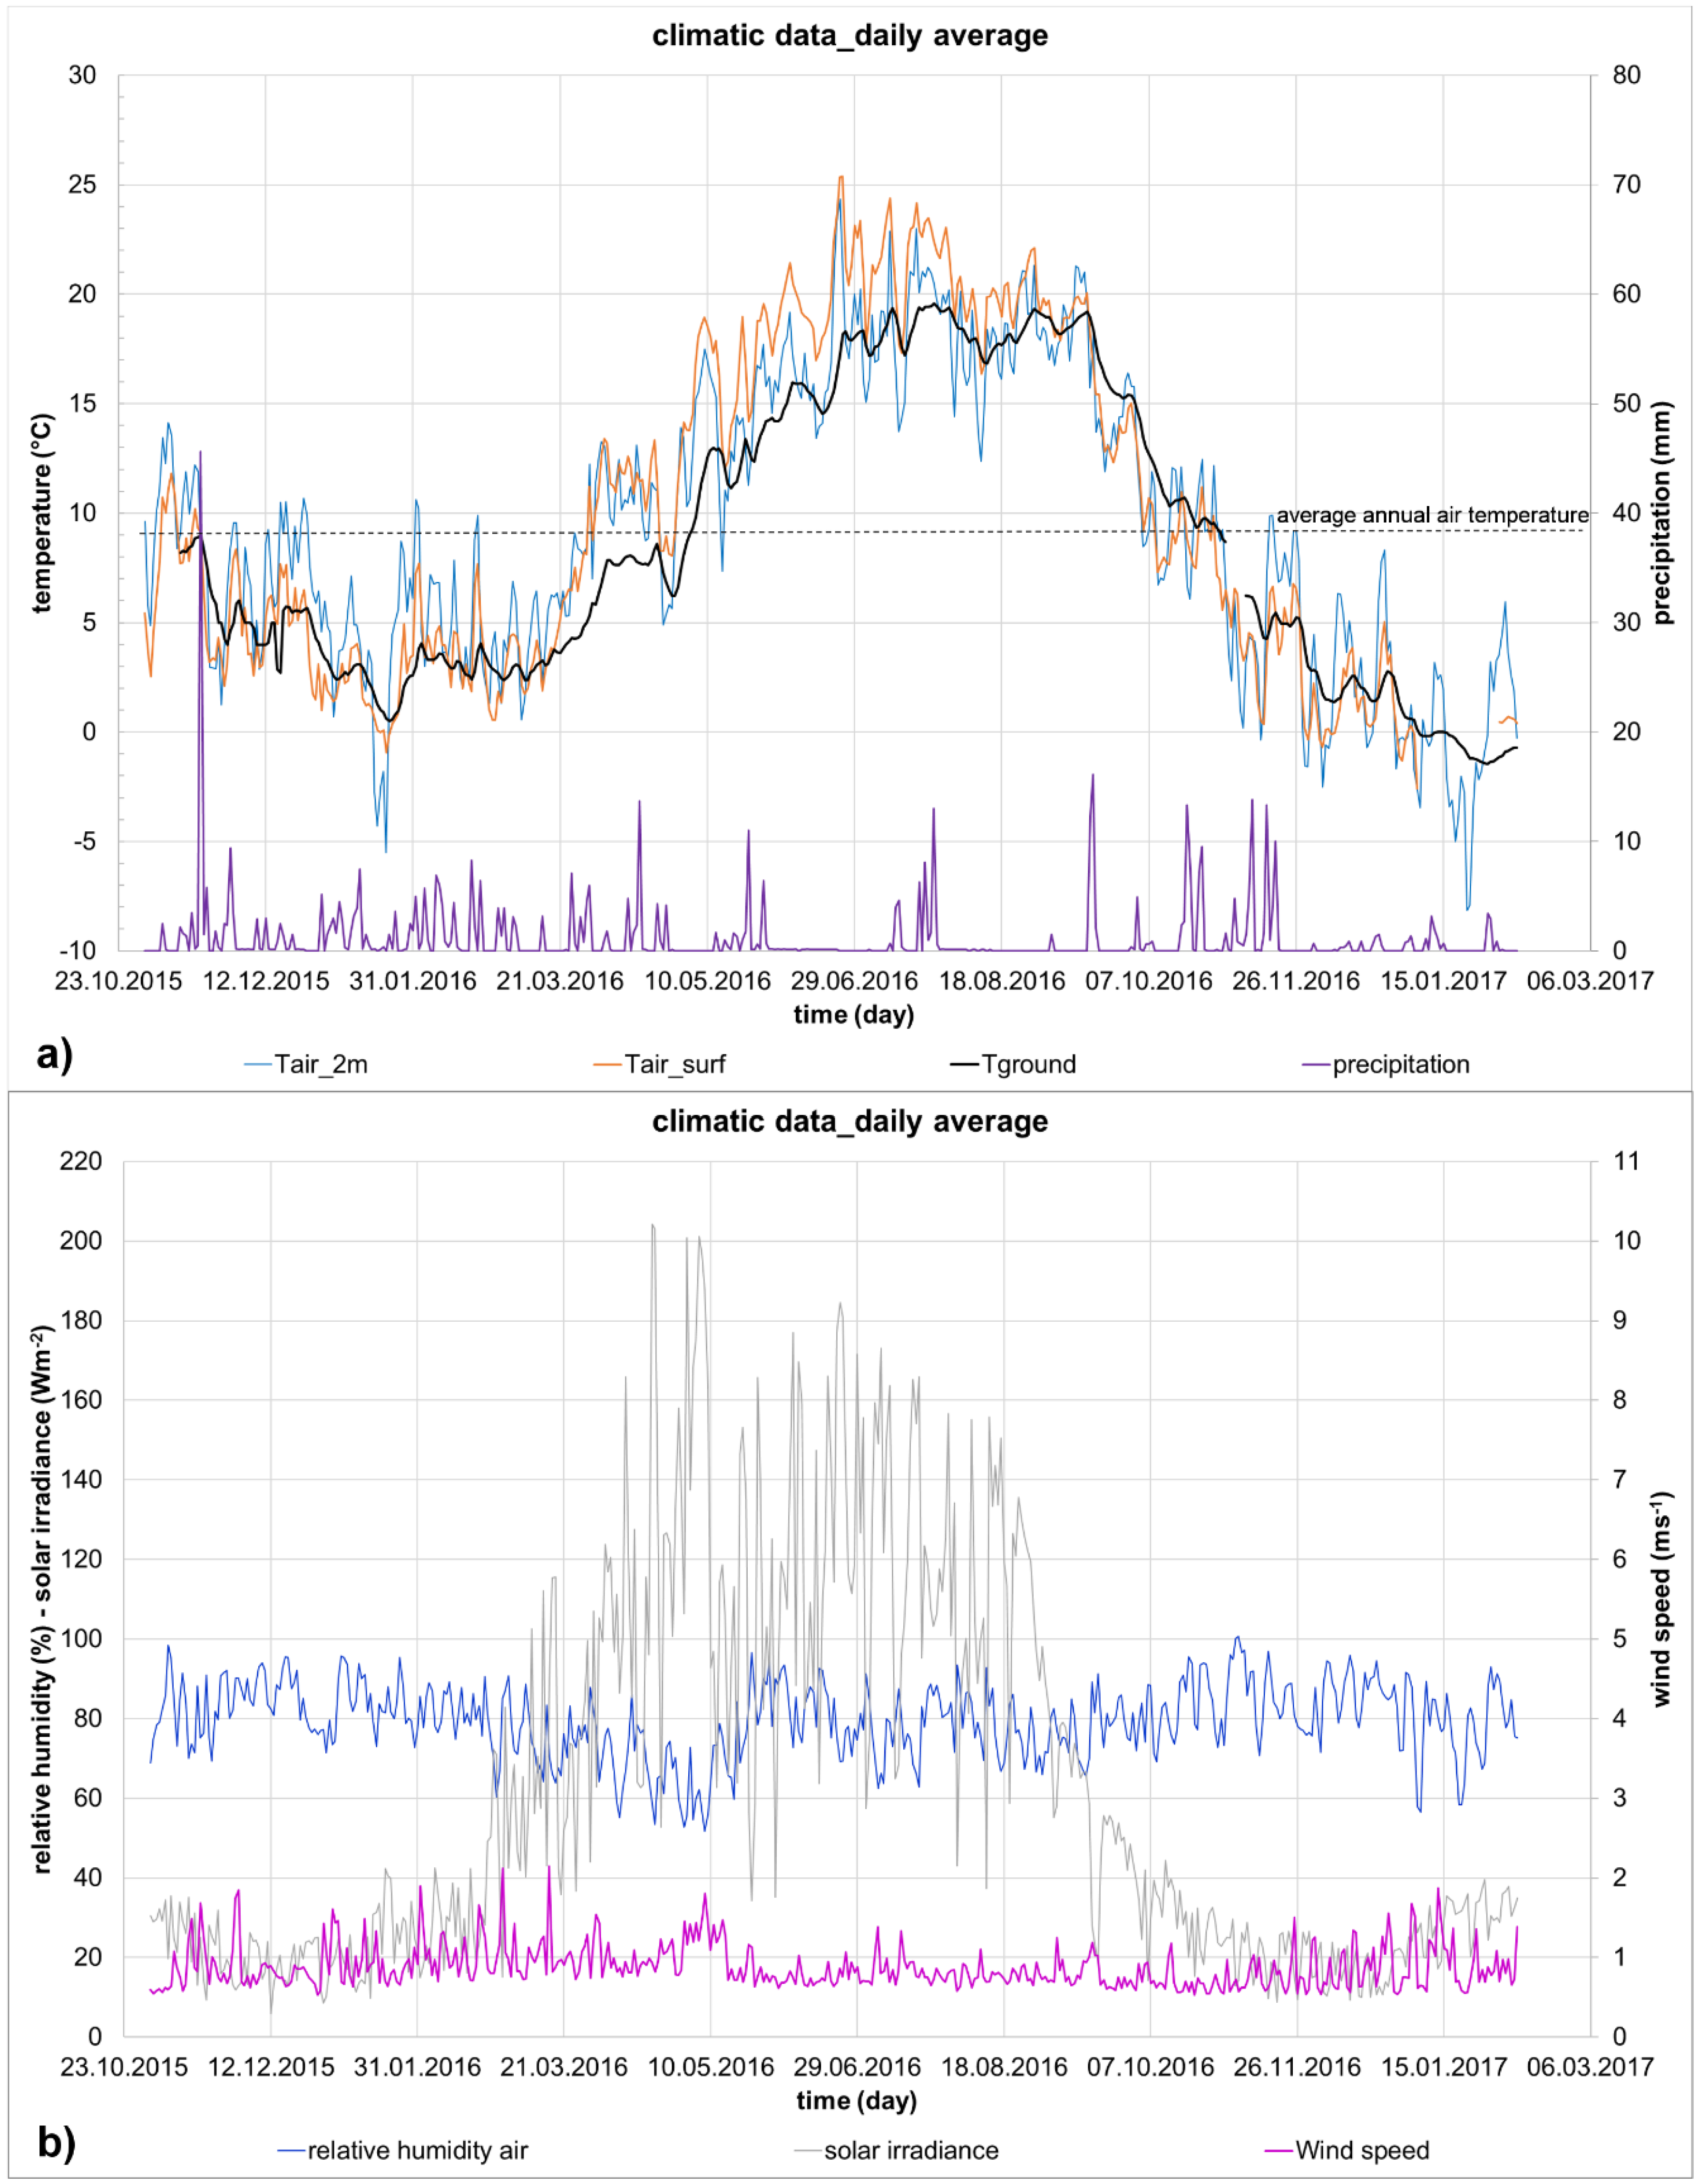
During summer the air temperature and solar irradiance present the highest values, in agreement with the favored seasonal recharge of heat into the ground (Figure 3a,b). Solar irradiance (W/m2) is derived by the illuminance data (Lux in lumen/m2) directly recorded by the meteorological station considering a luminous efficacy of 105 (lumen/W), valid for clear skies and average condition [54].
In late December 2016 and in early January 2017 air temperatures below 0 °C are recorded, representative of snow and frost events. (Figure 3a). The wind speed shows large short-term fluctuations, while the relative humidity behavior is characterized by minimum values in early May 2016 and early January 2017. Throughout the year the latter shows quite high values and oscillates following air temperature and rainfall variations (Figure 3b).
The average daily air temperature is estimated about 14–15 °C during summer time (from April to September) and 3–4 °C during winter (October to March). Maximum and minimum values reach on average up to 24–25 °C and up to −8.5 °C. The undisturbed Tground is assumed equal to the annual mean Tair value, that is about 9°C according to Germany’s National Meteorological Service [51]. In Eltersdorf a value of 9.24 °C is determined in 2016 (Figure 3a). In general, the Nuremberg area is characterized by an oceanic climate (Koppen: Cfb) with rather warm summers and mild-cold winters, with significant rainfall all over the year (644 mm/year).
Precipitation is spread throughout the year, with the driest month in winter time (December–February) and the wettest in summer (June–July) and autumn (November). During the observation period, a minimum of 7.2 mm in December 2016 and maximum of 80–90 mm in November 2015 and June 2016, are collected in Eltersdorf. Due to technical problems at the Eltersdorf meteorological station, the value between June-August 2016 have been integrated by the data available at the Nuremberg airport station [51].
3.2. Soil Temperatures
Soil temperatures at 0.30 m, 0.40 m, 0.60 m, 0.80 m depths are collected continuously in all Eltersdorf sectors from 1 November 2015 to 22 May 2017. The hourly average values are compared with temperatures (T) taken on ground surface (Tair_surf) and at 0.60 m depth (Tground) in undisturbed conditions (Figure 4).
Moving down from the surface, the ground temperature decreases exponentially with depth, due to the high thermal inertia of the ground: T oscillations are quite completely dumped bgl and a phase shift can be observed between Tair_surf and Tground [12,15,23,55]. The amplitude of the T waves is already reduced at 0.60 m depth (Tground), reaching an average value of 7.9 °C, even if seasonal variations are still visible and shifted in time compared to Tair_2m (Figure 3a). As expected, Tground is lower than Tair_surf (14.9 vs 16.5 °C) during the warmer season (April to September), and higher (3.7 vs 1.5 °C) during the colder months (from October till March).
In order to understand the thermal trend at different depth and in different GSHPs operative mode (only fluid circulation or extraction/injection of heat) in each sector at disposal, an overview of the underground temperature data recorded inside the same kind of material is discussed (Figure 4a).
The system is running in heating mode (24 h/day) three times from November 2015 till May 2017 (16 March–19 April 2016, 10–28 November 2016 and 2 March–22 May 2017), forcing freezing conditions and a significant decrease of soil temperatures inside the helix (Figure 4). In addition, from 22 December 2016 to 1 March 2017, the heat pump is switched on again in heating mode. However, in this last period, prolonged intermittent thermal stress (25 cycles), always forcing the system up to freezing, are artificially induced in the different kind of soils for short periods (generally 2 days on, 2 days off). In fact, the project is focused on detecting the reaction of soil and collectors to extreme situations, highlighting differences and similarities between the five sectors under the same climatic conditions in different VSGs operation modes.
As the T trend at different depths is similar in all sectors, only the measurements performed in sector 1 (fs) are showed as representative (Figure 4a). The selected interval (15 October 2016–15 December 2016) comprehends the running of the system in heating mode (10–28 November 2016). During the whole timeframe the external temperature (Tair_surf) naturally decreases from about 12 to 2 °C. The area up to 0.80 m depth, when only fluid circulation is present, is sensitive to short-term temperature variations, damped with depth (hourly average). However, as soon as the heat extraction is activated, the sensors inside the helix and near its top show a sudden decrease of temperature, no more affected by Tair_surf fluctuations, with the lowest values registered in B.
Sensor E, located 0.20 m above the helix top, is affected by the GSHP system, while sensor F, only 0.30 m above, shows fluctuations according to air temperature changes. Sensor D, 0.50 m away from the helix east margin, is completely unaffected by the GSHP activation: its trend follows that of the undisturbed ground temperature (Tground) registered outside the trench, at 0.60 m depth (Figure 2). Therefore, the effects of the helix in the surrounding soil are no longer observable at 0.50 m distance from the margins and 0.30 m above the top, so it is reasonable to consider the T registered on sensor D (TD) as the undisturbed underground temperature for each mixture used as backfilling material.
Based on this assumption, the temperature differences between sensor E and sensor D (ΔT = TE-TD) detected in each sector illustrate more clearly the thermal energy absorbed by the helix [34]. In fact, the undisturbed soil (TD) is in thermal equilibrium with its environment. For a geothermal collector to absorb heat, its temperature must be below the undisturbed soil temperature. To allow a heat flow from the surrounding soil to the geothermal collector, a temperature gradient (ΔT) is required according to the Fourier law of heat conduction [56]. Negative ΔT values highlight that in the same material the area interested by the helix is considerably cooler than that not affected (reference soil, sensor D, ΔT ≈ −10 °C), when the heat pump is running (Figure 4b). Moreover, when the heat exchanger is not operational, the soil temperature differences between the inside (TB) and outside (TD) of the helix are negligible (ΔT ≈ 0 °C).
For example, in the heating period considered (10–28 November 2016) (Figure 4):
- TD never drops below 0 °C when the heat pump is running, showing a mean value of about 4.5, 5.2, 4.3, 4.7, 4.5 °C in sector 1-2-3-4-5 respectively;
- TB average values of about −5.3, −5.2, −4.0, −5.0 °C for (fs), (fs15B), (s), (s15B) sectors are determined. No direct measurements are available for loamy sand (SC) sector, due to sensor B malfunction, but a value of about 5 °C is considered to be plausible;
- Tground shows a mean value of about 5.2 °C;
- Tsurf has a mean value of 2.5 °C
Moreover, as the heating mode begins, the ground temperature inside the helix drops suddenly below 0 °C, reaching and maintaining a constant value (about −6, −5, −2 °C in B, A and C sensors respectively) during the whole heating period and then recovering a value similar to Tground after the heat pump shutdown. When T remains constant below 0 °C, the phase change between water and ice takes place, latent heat is released and the time required to expand the freezing front in the surrounding ground increases [44,45,46,47,48,49,50,51,52,53,54,55,56,57]. No further drop of temperature is noticed, so complete freezing is not reached and the helix take advantage from the release of latent heat during the phase change process [21,58,59]. A greater amount of latent heat to be extracted (latent heat storage capacity) belongs to the soil with the greater water content that, in this way, could be really promising when critical conditions are reached [60]. Therefore, even with a low burial depth of installation and a heat pump operating for a very long time with a flow temperature well below the permissible limit value according to VDI 4640, the merging of ice radii does not occur.
Given that a strong T decrease is observed along the vertical (TB, TE, TF) and horizontal (TC, TB, TA) profiles of the helix when the system is running (10−28 November 2016), it is interesting to verify, once stopped the GSHP, when the temperature rises again towards the Tsurf values, allowing to start the heat energy potential refurbishment (Figure 5). In the T depth profiles two main behaviors are identified, typical of non-operating (i.e., 15 October, 5 November, 15 December 2016) and operating (i.e., 10, 15, 20 November 2016) conditions. Both show an initial increase of T values deepening from 0.30 to 0.40 m bgl as expected in the colder season. Then, a quite stable temperature characterizes the former, up to 0.80 m depth, while a strong decrease of T between 0.40 and 0.80 m depth identifies the latter (Figure 5c). Once shutting down the heat pump on 28 November 2016, the non-operating behavior is completely recovered after one week ( 5 December 2016), while already after three days (1 December 2016 the temperature difference between 0.40 and 0.80 m depth is annihilated. Moreover, the ground temperature recorded at all depths at the end of the heat extraction period are lower than those noticed at the beginning, in agreement with the general Tair_surf trend already described.
Along the horizontal profile all the sensors are located at the same depth (0.80 m), corresponding to the central axis of the helix oriented E-W. A steady temperature is registered in the four measurement points during non-operating period. In this case the recorded data reflects the progressive lowering of the outside air temperature, so before and after running the system the values range respectively between 9–11 °C and 2–4°C. At the beginning of the heat extraction (10 November 2016), a sudden drop of T is observed, with the lowest values belonging to B sensor and undisturbed condition in D. After 3 days (1 December 2016) from the shutting down, the Ts inside the helix begin to be similar again, but only after 2 weeks (10 December 2016) they reach the same value of the undisturbed condition (Figure 5d).
During the same period the illuminance trend diminishes over time, even if strong day by day oscillations are observed, due to cloudy and sunny days following one another. The relative humidity of the air and the wind speed have average value of 86% and 0.74 m/s, while several precipitation events are recorded. Moreover, the data related to soil moisture content monitoring at 0.20 and 0.60 m depth, recorded since 15 November 2016 and 3 November 2016 respectively, are shown. At 0.20 m depth, the VWC is affected by precipitation: due to the porosity of the material (a fine sand) a small increase of moisture content is observed instantly on surface during the precipitation event of 19/11, while in depth no visible effects are noticed (Figure 5b).
During the heating period, small T variations can be observed also on a daily base. Taking day 15 November 2016 as a reference, the Tsurf is lower than Tground (cold season), but during the 24 h it is progressively increasing, ranging from −2.1 °C up to 0.3 °C (Figure 6a). The soil temperature at different depth, instead, is constant throughout the day, but Tground > TE > TF >TB.
T depth profiles and sections have the characteristic operating behavior, but, from 0 h to 23 h, differences of about 0.2–0.3 °C in the former and about 0.5 °C in the latter are observed. The lowest temperatures are reached at the end of the day, probably as an effect of the air temperature thermal shift over time (Figure 6c,d). Moreover, throughout the day the illuminance presents a maximum value at midday and minimum trend during the night and late evening. The relative humidity of the air is 89% and the wind speed is about 0.6 m/s on average, while a small precipitation event occurs in the evening. No appreciable changes in soil moisture content, both at 0.20 and 0.60 m depth, are observed during the 24 h (Figure 6b).
3.3. Thermal Conductivity and Moisture Content Variation
The monthly measurements of thermal conductivity (λ) and moisture content (MC) performed at the test field in Eltersdorf show how and in which extent, under the same climatic conditions, the soil mixtures thermal properties are affected by the ability to retain water.
The five mixtures (fs, fs15B, GS+s, s15B, SC) have been placed in situ in nearly dry condition (volumetric water content ≈ 5%) and then have increased or reduced their water content according to the meteorological variations. On this regard, the time domain reflectometry (TDR) is a reliable tool to easily detect the moisture content on surface [46], while at greater depth soil moisture sensors detecting VWC values are used since November 2016.
It is important to remember that the GS compound in sector 3 completely covers the helix, isolating it from the surrounding sand. The GS, once solidified, is completely impermeable and it is assumed not affected by water content variation. Therefore, its thermal conductivity is considered invariant throughout the observation period with a constant value of 2.4 W m−1 K−1, as declared by the producer. However, the data collected in sector 3 can be used to observe thermal properties variations in the coarse sand.
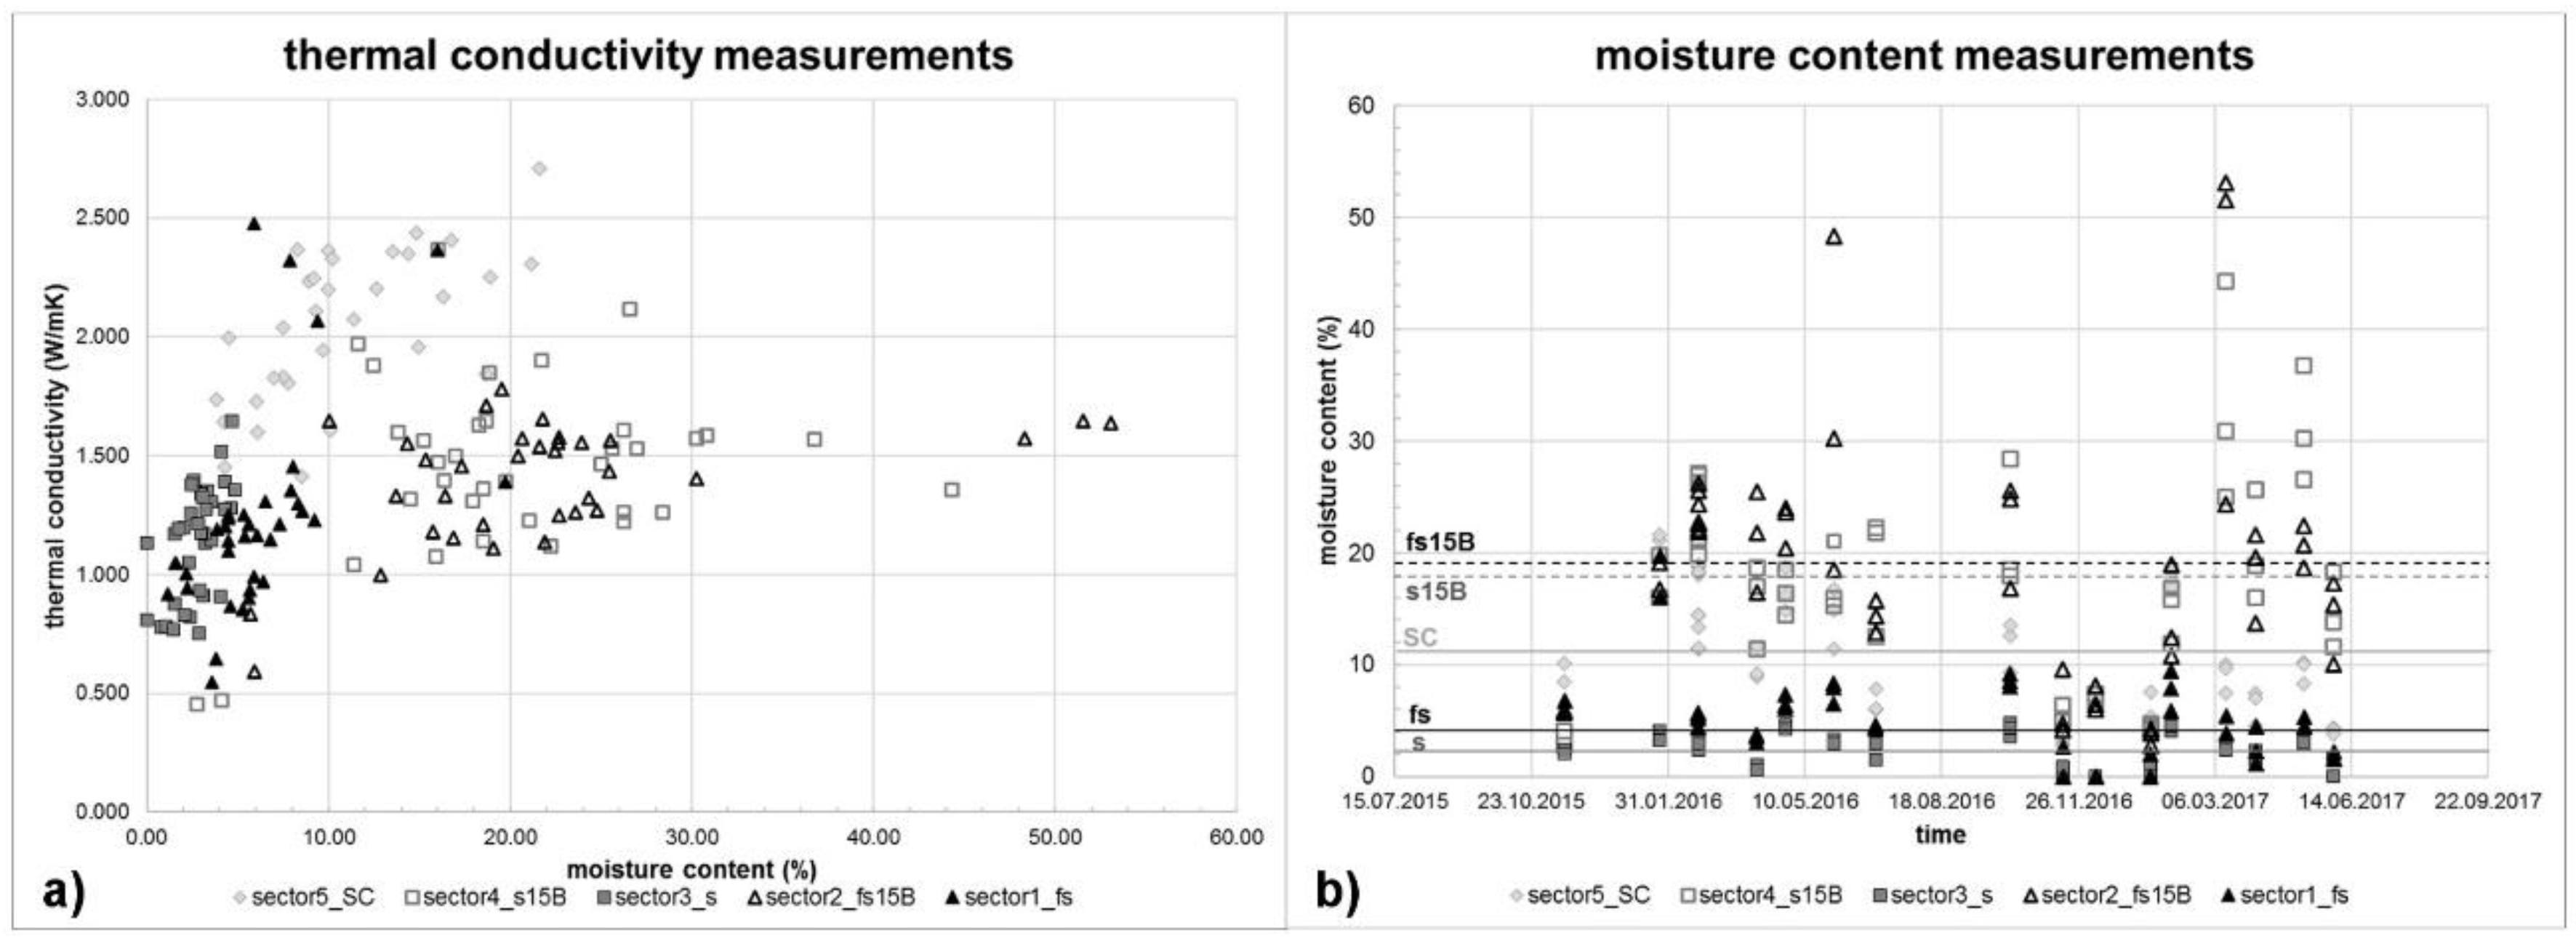
In detail, the relationship between λ and MC clearly identifies the five backfilling materials (Figure 7a). The coarse (s) and fine (fs) sand are characterized by a rapid increase of λ with a limited increase of MC. In fact, the majority of their values is grouped in a narrow MC interval (0 ÷ 10%). The average thermal conductivity is 1.1 W m−1 K−1 for the coarse sand and 1.2 W m−1 K−1 for the fine sand. Highest value of heat transfer capacity belongs to the loamy sand (SC), that reaches an average λ value of 2.0 W m−1 K−1. Finally, the thermally enhanced backfilling material created for the project (fs15B, s15B) reveal on surface (first 10 cm depth) a better thermal performance than the corresponding pure material (fs, s), with an average λ value of about 1.4 W m−1 K−1. Therefore, summarizing, we found that on surface λloamy sand > λbentonite mixtures > λpure sand.
This outcome is in agreement with the laboratory results and is related to the MC changes recorded in situ [34] (Figure 7b). Three main patterns are identified: (i) the lowest MC average values (MCaverage ≈ 2.3% and 4.9%) belongs to the pure sands (s and fs respectively), (ii) an intermediate value (MCaverage ≈ 11%) is typical of the loamy sand; (iii) the highest records (MCaverage ≈ 18% and 19%) belongs to the sand-bentonite compounds (s15B and fs15B, respectively). A remarkable improvement in the ability to retain water in the pores is observed when bentonite is added to the pure sand. Instead, notwithstanding the loamy sand has an intermediate moisture content, it shows the best thermal performance, thanks also to its prevalent quartz mineralogical composition.
However, the moisture content decreases with depth, as shown by the data measured by the soil moisture sensor located at 0.20 and 0.60 m of depth (Table 2). The average VWC values on Table 2 are calculated from the data recorded continuously from 29 November 2016 up to 7 February 2017.
Due to the decreasing of VWC, a reduction of λ with depth is expected, more effective in pure sand than in bentonite mixtures. In fact, as seen in Figure 7, a gradual decrease of moisture content in sands implies a rapid decrease of λ, while on bentonite mixtures or loamy sands, the reduction is more gradual.
4. Conclusions
The long-term investigation of soil temperatures, environmental parameters and soil characterizations provided by ITER Project and described in this paper contribute to understand the influence of several factors on very shallow geothermal systems, as helix Earth collectors. In the ITER project test site in Eltersdorf, the data collected over more than one year in the same environmental condition allows to recognize the effects of meteorological parameters on five different soil bodies.
At first, the influence of air and soil temperature variation during the heating and stagnation period of ground heat exchanger is analyzed. In all five soils tested in situ, when the system is not running, the amplitude of Tground waves is already reduced at 0.60 m depth compared to Tair_2m and Tair_surf. When the heat pump is running, Tground variations induced by the helix are no longer noticed at 0.30 m from the top and 0.50 m from the lateral margins of the helix itself and the lowest T values are always recorded in the middle of the helix (sensor B). Moreover, horizontal and vertical temperature profiles determined through the helix axes show small T variations on monthly and daily basis, related to the influence of air temperature fluctuations in depth. On monthly base a non-operating (i.e., 15 October, 5 November, 15 December 2016) and operating (i.e., 10, 15, 20 November 2016) behavior, typical of “switching off” and "switching on" mode of the heat pump, are easily identified. They allow a preliminary evaluation of the recovery time needed to re-establish undisturbed Tground conditions, that is about one week along the vertical profile and two weeks along the horizontal section.
Due to the low burial depth of installation (0.60–1.0 m depth) the helix performance is still affected by daily and monthly temperature amplitude fluctuations, but this effect is limited compared to thermal conductivity variations induced by different soil moisture content.
In fact, the thermal properties of the soil mixtures measured in situ together with the soil moisture content show the following pattern λloamy sand > λbentonite mixtures > λpure sand. A decrease of water content with depth is observed (no groundwater flow is present), followed as expected by a reduction of thermal conductivity. In detail, in coarse sand material a gradual decrease of moisture content implies a rapid decrease of thermal conductivity, while on bentonite mixtures or loamy sands, the reduction is more gradual. Then, these materials are promising for a better performance of the helix if initial adequate moisture conditions (>12.5%) are provided and maintained over time. In fact, according to literature, a VWC content below 12.5% decreases the performance of a shallow geothermal system while a VWC over 25% improve it [45]. In ITER Project test site, at 0.60 m depth only (fs15B) overcame this restraint in a long time and is expected to provide the better performance together with GS, whose thermal properties are considered invariant.
Finally, the deliberately chosen conditions of low burial installation depth and longtime heat pump running with a flow temperature well below the permissible limit value according to VDI 4640, reveal that, contrary to what expected, the helix is still working in extreme conditions and the merging of ice crystals does not occur. In all ITER sector the temperature drops well below 0 °C at the beginning of the heating mode, reaches and maintains a constant value during all the heating period and then recovers value similar to Tground when the heat pump is shutdown. When the temperature is constant, water is converted into ice and latent heat is released. No further drop of temperature is registered, so complete freezing is not reached and the helix take advantage from the release of latent heat during the phase change process. A greater amount of latent heat to be extracted (latent heat storage capacity) belongs to the soil with the greater amount of water content, that is the fine sand with 15% bentonite (fs15B), characterized in situ by a VWC equals or greater than 25%. This finding is extremely interesting and requires further research approaches. Anyway, periods of not operating condition must be respected to allow soil to regenerate its thermal energy content and thermal properties.
In general, to improve the heat exchange in all the sector, a practical solution could be to increase the VWC at 0.60 m depth up to 25%. Then, the loamy sand and fine sand are expected to provide better performances, thanks to the combined presence of quartz minerals and ability to retain water responsible for the high thermal conductivity measured on surface (λ > 2.0 W m−1 K−1). However, bentonite mixtures are expected to play a fundamental role when high content of soil moisture (at least > 30% VWC) are involved, especially if critical operating conditions are reached.
For example, to increase and renew the soil moisture content in order to enhance the performance of the system and simultaneously improve the recovery time of ground temperature after the heat pump shutdown, a practical solution could be to bypass with pipes the roof precipitation drainage into the ground.
Further development of the research foresees numerical simulation to better characterize the influence over time of all the parameter here described.
Acknowledgments
This work was supported by the European Union. ITER project (http://iter-geo.eu/) has received funding from the European Union’s Framework Programme for Research and Innovation Horizon 2020 (2014–2020) under the Marie Skłodowska-Curie Grant Agreement No. [661396-ITER]. Special thanks to REHAU AG&Co and Fischer Spezialbaustoffe Gmbh companies and their representative Ing. Mario Psyk and Thomas Popp for their valuable support. We thank Hans Schwarz and Johannes Müller of the University of Erlangen for assisting in laboratory and field tests data acquisition.
Author Contributions
Eloisa Di Sipio was the lead researcher on this study, performing data collection and analysis, drafting the manuscript and helping to conceive of the experimental design and secure funding. David Bertermann, supervisor of ITER Project, helped with the conception of the experimental design and securing funding, critically revised the manuscript, and provided mentoring throughout the study.
Conflicts of Interest
The authors declare no conflict of interest.
Nomenclature
| VSGs | very shallow geothermal systems |
| RHC | Renewable Heating & Cooling |
| GSHPs | Ground Source Heat Pumps |
| λ | heat conductivity (W m−1 K−1) |
| TEBM | thermally enhanced backfilling materials |
| XPS | extruded polystyrene |
| fs | fine sand 0–1 mm |
| fs15B | fine sand 0–1 mm with 15% bentonite |
| s | sand 0–5 mm |
| GS | GeoSolid 240HS |
| s158 | sand 0–5 mm + 15% bentonite |
| SC | loamy sand |
| VWC | volumetric water content (%) |
| bgl | below the ground level |
| T | temperature |
| TS | temperatures |
| Tground | temperature of the ground outside the test site at 0.60 m depth (°C) |
| Tsurf | temperature of the ground surface outside the test site (° C) |
| Tair_2m | temperature of the air 2 m above the ground surface (°C) |
| Tair_surf | temperature of the air above the soil surface (°C) |
| Tairf | temperature of the atmospheric air (°C) |
| BX | sensor B in each sector |
| DX | sensor D in each sector |
| TA-B-C-D-E-F | temperature measured at sensor A, B, C, D, E, F respectively |
| MC | moisture content detected in situ with TDR device |
| TDR | Time Domain Reflectometry |
References
- EU Energy Roadmap. Available online: http://ec.europa.eu/energy/energy2020/roadmap/index_en.htm (accessed on 29 September 2017).
- Self, S.J.; Reddy, B.V.; Rosen, M.A. Geothermal heat pump systems: Status review and comparison with other heating options. Appl. Energy 2013, 101, 341–348. [Google Scholar] [CrossRef]
- RHC-Platform. Strategic Research and Innovation Agenda for Renewable Heating and Cooling. 2013, pp. 1–116. Available online: http://www.rhc-platform.org/fileadmin/user_upload/members/RHC_SRA_0418_lowres.pdf (accessed on 30 September 2017).
- Di Sipio, E.; Galgaro, A.; Destro, E.; Teza, G.; Chiesa, S.; Giaretta, A.; Manzella, A. Subsurface thermal conductivity assessment in Calabria (southern Italy): A regional case study. Environ. Earth Sci. 2014, 72, 1383–1401. [Google Scholar] [CrossRef]
- Sanner, B.; Karytsas, C.; Mendrinos, D.; Rybach, L. Current status of ground source heat pumps and underground thermal energy storage in Europe. Geothermics 2003, 32, 579–588. [Google Scholar] [CrossRef]
- Adaro, J.A.; Galimberti, P.D.; Lema, A.I.; Fasulo, A.; Barral, J.R. Geothermal contribution to greenhouse heating. Appl. Energy 1999, 64, 241–249. [Google Scholar] [CrossRef]
- D’Arpa, S.; Colangelo, G.; Starace, G.; Petrosillo, I.; Bruno, D.E.; Uricchio, V.; Zurlini, G. Heating requirements in greenhouse farming in southern Italy: Evaluation of ground-source heat pump utilization compared to traditional heating systems. Energy Effic. 2015, 9, 1065–1085. [Google Scholar] [CrossRef]
- Omer, A.M. Ground-source heat pumps systems and applications. Renew. Sustain. Energy Rev. 2008, 12, 344–371. [Google Scholar] [CrossRef]
- Schelenz, S.; Vienken, T.; Shao, H.; Firmbach, L.; Dietrich, P. On the importance of a coordinated site characterization for the sustainable intensive thermal use of the shallow subsurface in urban areas: A case study. Environ. Earth Sci. 2017, 76, 73. [Google Scholar] [CrossRef]
- Bi, Y.; Wang, X.; Liu, Y.; Zhang, H.; Chen, L. Comprehensive exergy analysis of a ground-source heat pump system for both building heating and cooling modes. Appl. Energy 2009, 86, 2560–2565. [Google Scholar] [CrossRef]
- Galgaro, A.; Di Sipio, E.; Teza, G.; Destro, E.; De Carli, M.; Chiesa, S.; Zarrella, A.; Emmi, G.; Manzella, A. Empirical modeling of maps of geo-exchange potential for shallow geothermal energy at regional scale. Geothermics 2015, 57, 173–186. [Google Scholar] [CrossRef]
- Florides, G.; Kalogirou, S. Ground heat exchangers—A review of systems, models and applications. Renew. Energy 2004, 32, 2461–2478. [Google Scholar] [CrossRef]
- Han, C.; Ellett, M.K.; Naylor, S.; Yu, X.B. Influence of Local Geological Data on the Performance of Horizontal Ground coupled Heat Pump System Integrated with Building Thermal Loads. Renew. Energy 2017, 113, 1046–1055. [Google Scholar] [CrossRef]
- Banks, D. An Introduction to Thermogeology: Ground Source Heating and Cooling; John Wiley & Sons, Ltd.: New York, NY, USA, 2012. [Google Scholar]
- Busby, J.; Lewis, M.; Reeves, H.; Lawley, R. Initial geological considerations before installing ground source heat pump systems. Q. J. Eng. Geol. Hydrogeol. 2009, 42, 295–306. [Google Scholar] [CrossRef]
- Zhang, W.; Yang, H.; Lu, L.; Fang, Z. Investigation on heat transfer around buried coils of pile foundation heat exchangers for ground-coupled heat pump applications. Int. J. Heat Mass Tranf. 2012, 55, 6023–6031. [Google Scholar] [CrossRef]
- Lee, C.K. Dynamic performance of ground-source heat pumps fitted with frequency inverters for part-load control. Appl. Energy 2010, 87, 3507–3513. [Google Scholar] [CrossRef]
- Galgaro, A.; Farina, Z.; Emmi, G.; Carli, M.D. Feasibility analysis of a borehole heat exchanger (BHE) array to be installed in high geothermal flux area: The case of the Euganean thermal basin, Italy. Renew. Energy 2015, 78, 93–104. [Google Scholar] [CrossRef]
- Wu, Y.; Gan, G.; Verhoef, A.; Vidale, P.L.; Gonzalez, R.G. Experimental measurement and numerical simulation of horizontal-coupled slinky ground source heat exchangers. Appl. Therm. Eng. 2010, 30, 2574–2583. [Google Scholar] [CrossRef]
- Naili, N.; Attar, I.; Hazami, M.; Farhat, A. Experimental Analysis of Horizontal Ground Heat Exchanger for Northern Tunisia. J. Electron. Cool. Therm. Control. 2012, 2, 44–51. [Google Scholar] [CrossRef]
- Neuberger, P.; Adamovsky, R.; Sed’ova, M. Temperatures and heat flows in a soil enclosing a slinky horizontal heat exchanger. Energies 2014, 7, 972–987. [Google Scholar] [CrossRef]
- Chong, C.S.A.; Gan, G.; Verhoef, A.; Gonzalez, R.G.; Vidale, P.R. Simulation of thermal performance of horizontal slinky-loop heat exchangers for ground source heat pumps. Appl. Energy 2013, 104, 603–610. [Google Scholar] [CrossRef]
- Demir, H.; Koyun, A.; Temir, G. Heat transfer of horizontal parallel pipe ground heat exchanger and experimental verification. Appl. Therm. Eng. 2009, 29, 224–233. [Google Scholar] [CrossRef]
- Benazza, A.; Blanco, E.; Aichouba, M.; Río, J.L.; Laouedja, S. Numerical Investigation of Horizontal Ground Coupled Heat Exchanger. Energy Procedia 2011, 6, 29–35. [Google Scholar] [CrossRef]
- Kharseh, M.; Altorkmany, L. How global warming and building envelope will change buildings energy use in central Europe. Appl. Energy 2012, 97, 999–1004. [Google Scholar] [CrossRef]
- Congedo, P.M.; Colangelo, G.; Starace, G. CFD simulations of horizontal ground heat exchangers: A comparison among different configurations. Appl. Therm. Eng. 2012, 33, 24–32. [Google Scholar] [CrossRef]
- Starace, G.; Congedo, P.M.; Colangelo, G. Horizontal heat exchangers for GSHPs. Efficiency and cost investigation for three different applications. In Proceedings of the 18th International Conference on Efficiency, Cost, Optimization, Simulation, and Environmental Impact of Energy Systems, Trondheim, Norway, 20–23 June 2005; pp. 1443–1450. [Google Scholar]
- Zarrella, A.; De Carli, M. Heat transfer analysis of short helical borehole heat exchangers. Appl. Energy 2013, 102, 1477–1491. [Google Scholar] [CrossRef]
- Zarrella, A.; Emmi, G.; De Carli, M. Analysis of operating modes of a ground source heat pump with short helical heat exchangers. Energy Convers. Manag. 2015, 97, 351–361. [Google Scholar] [CrossRef]
- Zarrella, A.; Emmi, G.; Graci, S.; De Carli, M.; Cultrera, M.; Dalla Santa, G.; Galgaro, A.; Bertermann, D.; Mueller, J.; Pockelé, L.; et al. Thermal Response Testing Results of Different Types of Borehole Heat Exchangers: An Analysis and Comparison of Interpretation Methods. Energies 2017, 10, 801. [Google Scholar] [CrossRef]
- Farouki, O.T. Thermal Properties of Soils (No. CRREL-MONO-81-1); Cold Regions Research and Engineering Lab: Hanover, NH, USA, 1981; Available online: http://www.dtic.mil/docs/citations/ADA111734 (accessed on 17 November 2017).
- Drefke, C.; Schedel, M.; Stegner, J.; Balzer, C.; Hinrichsen, V.; Sass, I. Measurement Method of Thermal Properties of Cementitious Bedding Materials and Unsaturated Soils: Hydraulic Influence on Thermal Parameters. Geotech. Test J. 2016, 40, 160–170. [Google Scholar] [CrossRef]
- Bertermann, D.; Klug, H.; Morper-Busch, L. A pan-European planning basis for estimating the very shallow geothermal energy potentials. Ren. Energy 2015, 75, 335–347. [Google Scholar] [CrossRef]
- Gonzalez, R.G.; Verhoef, A.; Vidale, P.L.; Main, B.; Gan, G.; Wu, Y. Interactions between the physical soil environment and a horizontal ground coupled heat pump, for a domestic site in the UK. Renew. Energy 2012, 44, 141–153. [Google Scholar] [CrossRef]
- Wu, R.; Tinjum, J.M.; Likos, W.J. Coupled Thermal Conductivity Dryout Curve and Soil–Water Characteristic Curve in Modeling of Shallow Horizontal Geothermal Ground Loops. Geotech. Geol. Eng. 2015, 33, 193–205. [Google Scholar] [CrossRef]
- Di Sipio, E.; Bertermann, B. Thermal properties variations in soil bodies for very shallow geothermal application: Overview of ITER Project. Int. Agrophys. Submitted for publication.
- Nowamooz, H.; Nikoosokhan, S.; Lin, J.; Chazallon, C. Finite difference modeling of heat distribution in multilayer soils with time-spatial hydrothermal properties. Renew. Energy 2015, 76, 7–15. [Google Scholar] [CrossRef]
- Guan, X.; Huang, J.; Guo, N.; Bi, J.; Wang, G. Variability of soil moisture and its relationship with surface albedo and soil thermal parameters over the Loess Plateau. Adv. Atmos. Sci. 2009, 26, 692–700. [Google Scholar] [CrossRef]
- Liu, H.; Wang, B.; Fu, C. Relationships between surface albedo, soil thermal parameters and soil moisture in the semi-arid area of Tongyu, northeastern China. Adv. Atmos. Sci. 2008, 25, 757–764. [Google Scholar] [CrossRef]
- Song, W.K.; Cui, Y.J.; Tang, A.M.; Ding, W.Q.; Tran, T.D. Experimental study on water evaporation from sand using environmental chamber. Can. Geotech. J. 2014, 51, 115–128. [Google Scholar] [CrossRef] [Green Version]
- Roxy, M.S.; Sumithranand, V.B.; Renuka, G. Variability of soil moisture and its relationship with surface albedo and thermal diffusivity at astronomical observatory, Thiruvananthapuram, South KeralaJ. J. Earth Syst. Sci. 2010, 119, 507–513. [Google Scholar] [CrossRef]
- Ozgener, O.; Ozgener, L.; Tester, J.W. A practical approach to predict soil temperature variations for geothermal (ground) heat exchangers applications. Int. J. Heat Mass Transf. 2013, 62, 473–480. [Google Scholar] [CrossRef]
- Xing, L.; Spitler, J.D.; Li, L.; Hu, P. A Model for Ground Temperature Estimations and Its Impact on Horizontal Ground Heat Exchanger Design. In Proceedings of the IGSHPA Technical/Research Conference and Expo, Denver, CO, USA, 14–16 March 2017; pp. 1–10. [Google Scholar]
- Nikoosokhan, H.; Nowamooz, H.; Chazallon, C. Temperature variations in unfrozen soils with variable hydrothermal properties. Eur. J. Soil. Sci. 2015, 66, 378–388. [Google Scholar] [CrossRef]
- Leong, W.H.; Tarnawski, V.R.; Aittomäki, A. Effect of soil type and moisture content on ground heat pump performance: Effet du type et de l’humidité du sol sur la performance des pompes à chaleur à capteurs enterrés. Int. J. Refrig. 1998, 21, 595–606. [Google Scholar] [CrossRef]
- Di Sipio, E.; Bertermann, B. Influence of Different Moisture and Load Conditions on Heat Transfer within Soils in Very Shallow Geothermal Application: An Overview of ITER Project. In Proceedings of the 42nd Workshop on Geothermal Reservoir Engineering, Stanford University, Stanford, CA, USA, 13–15 February 2017; pp. 1345–1353. [Google Scholar]
- Bayerischen Geologischen Landesamt. Geologischen Karte von Bayern 1:25,000, Blatt Nr. 6431 Herzogenaurach (Geological Map of Bavaria 1:25,000, Sheet Nr. 6431 Herzogenaurach). 1971. Available online: https://www.lfu.bayern.de/geologie/geo_daten/gk25/index.htm (accessed on 17 November 2017).
- Verein Deutscher Ingenieure. VDI 4640/2 2015–05 Thermal Use of the Underground-Ground Coupled Heat Pumps. 2015. Available online: http://www.vdi.eu/nc/guidelines/vdi_4640_blatt_2-thermische_nutzung_des_untergrundes_erdgekoppelte_waermepumpenanlagen_/ (accessed on 17 November 2017).
- REHAU. Raugeo System Technology: Innovative Heating, Cooling and Storage Using Ground-Source Energy Technical Information 827600/1en. 2012. Available online: https://www.rehau.com/download/790486/raugeo-technical-manual-september-2012.pdf (accessed on 29 September 2017).
- Riechers, J. Harvesting wastewater energy-turning segmental lined interceptor sewers into heat exchangers. In Proceedings of the Water Environment Federation, Water Energy 2015, Washington, DC, USA, 7–10 June 2015; pp. 1–13. [Google Scholar] [CrossRef]
- Deutscher Wetterdienst. Available online: http://www.dwd.de (accessed on 29 September 2017).
- German Standard DIN. Test Methods for Aggregates—Determination of Dry Bulk Density by the Cylinder Method and Calculation of the Ratio of Density; Deutsches Institut für Normung: Berlin, Germany, 2006. [Google Scholar]
- German Standard DIN. Investigation and Testing: Water Content Part 1. Determination by Drying in Oven; Deutsches Institut für Normung: Berlin, Germany, 1998. [Google Scholar]
- Littlefair, P.J. The luminous efficacy of daylight: A review. Light. Res. Technol. 1985, 17, 162–182. [Google Scholar] [CrossRef]
- Naili, N.; Hazami, M.; Kooli, S.; Farhat, A. Energy and exergy analysis of horizontal ground heat exchanger for hot climatic condition of northern Tunisia. Geothermics 2015, 53, 270–280. [Google Scholar] [CrossRef]
- Bergman, T.L.; Lavine, A.S.; Incropera, F.P.; Dewitt, D.P. Introduction to Heat Transfer, 6th ed.; John Wiley & Sons, Inc.: New York, NY, USA, 2011; pp. 1–1035. [Google Scholar]
- Xu, H.; Spitler, J.D. Importance of moisture transport, snow cover and soil freezing to ground temperature predictions. In Proceedings of the 9th Nordic Symposium on Building Physics, Tampere, Finland, 29 May–2 June 2011; pp. 163–170. [Google Scholar]
- Hinkel, K.M.; Paetzold, R.F.; Nelson, F.E.; Bockheim, J.G. Patterns of soil temperature and moisture in the active layer and upper permafrost at Barrow, Alaska: 1993–1999. Glob. Planet Chang. 2001, 29, 293–309. [Google Scholar] [CrossRef]
- Kane, L.D.; Hinkel, K.M.; Goering, D.J.; Hinzman, L.D.; Outcalt, S.I. Non-conductive heat transfer associated with frozen soils. Glob. Planet Chang. 2001, 29, 275–292. [Google Scholar] [CrossRef]
- Di Sipio, E.; Bertermann, B. Soil thermal behavior in different moisture condition: An overview of ITER Project from laboratory to field test monitoring. Environ. Eart. Sci. Submitted for publication.
Figure 1.
ITER Project test site location in Eltersdorf, Bavaria, Germany: (a) location and geological characterization of the area [47]; and (b) installation of the 5 helix probes covered with different soil mixtures. Moreover, a top view scheme of the trench and of a single sector, together with the location of surface measurement points (X1-X2-X3) is shown in (b).

Figure 2.
Monitoring system in Eltersdorf: (a) soil mixtures used as backfilling material in each trench (SC = loamy sand; s15B = sand 0–5 mm + 15% bentonite; GS+s = commercial products surrounded by sand 0–5 mm; fs15B = fine sand 0–1 mm + 15% bentonite; fs = fine sand 0–1 mm); (b) schematic profile showing the location of the temperature (A-B-C-D-E-F-D-Tsurf-Tground) and moisture (VWC) sensors, the sampling measurements on surface (X1-X2-X3) and the dataloggers; and (c) from left to right the hydraulic system, the climatic station, the bulk density sampling, the moisture sensors used at 0.20 and 0.60 m bgl, the thermal properties and time domain reflectometry devices used in situ.

Figure 3.
Climatic data between 1 November 2015 and 10 February 2016 in Eltersdorf: (a) daily average temperature values for air (2 m above ground, Tair_2m), soil surface (Tair_surf) and undisturbed ground (Tground), together with the cumulative daily precipitation value. The dotted line represents the mean value for the atmospheric air temperature all over the observation period (Tair_2m_mean = 9.24 °C); and (b) daily mean data for wind speed, relative humidity, and solar irradiance.

Figure 4.
Temperature trend registered in the five ITER Project sectors between 15 November 2016 and 15 December 2016: (a) T (hourly average) recorded in sector 1 (fs as backfilling material); (b) daily average soil temperature differences (°C) between the values collected in the helix center (Bx) and the corresponding undisturbed profile (Dx) for each sector. The horizontal line in (b) is included to distinguish positive and negative temperature differences.
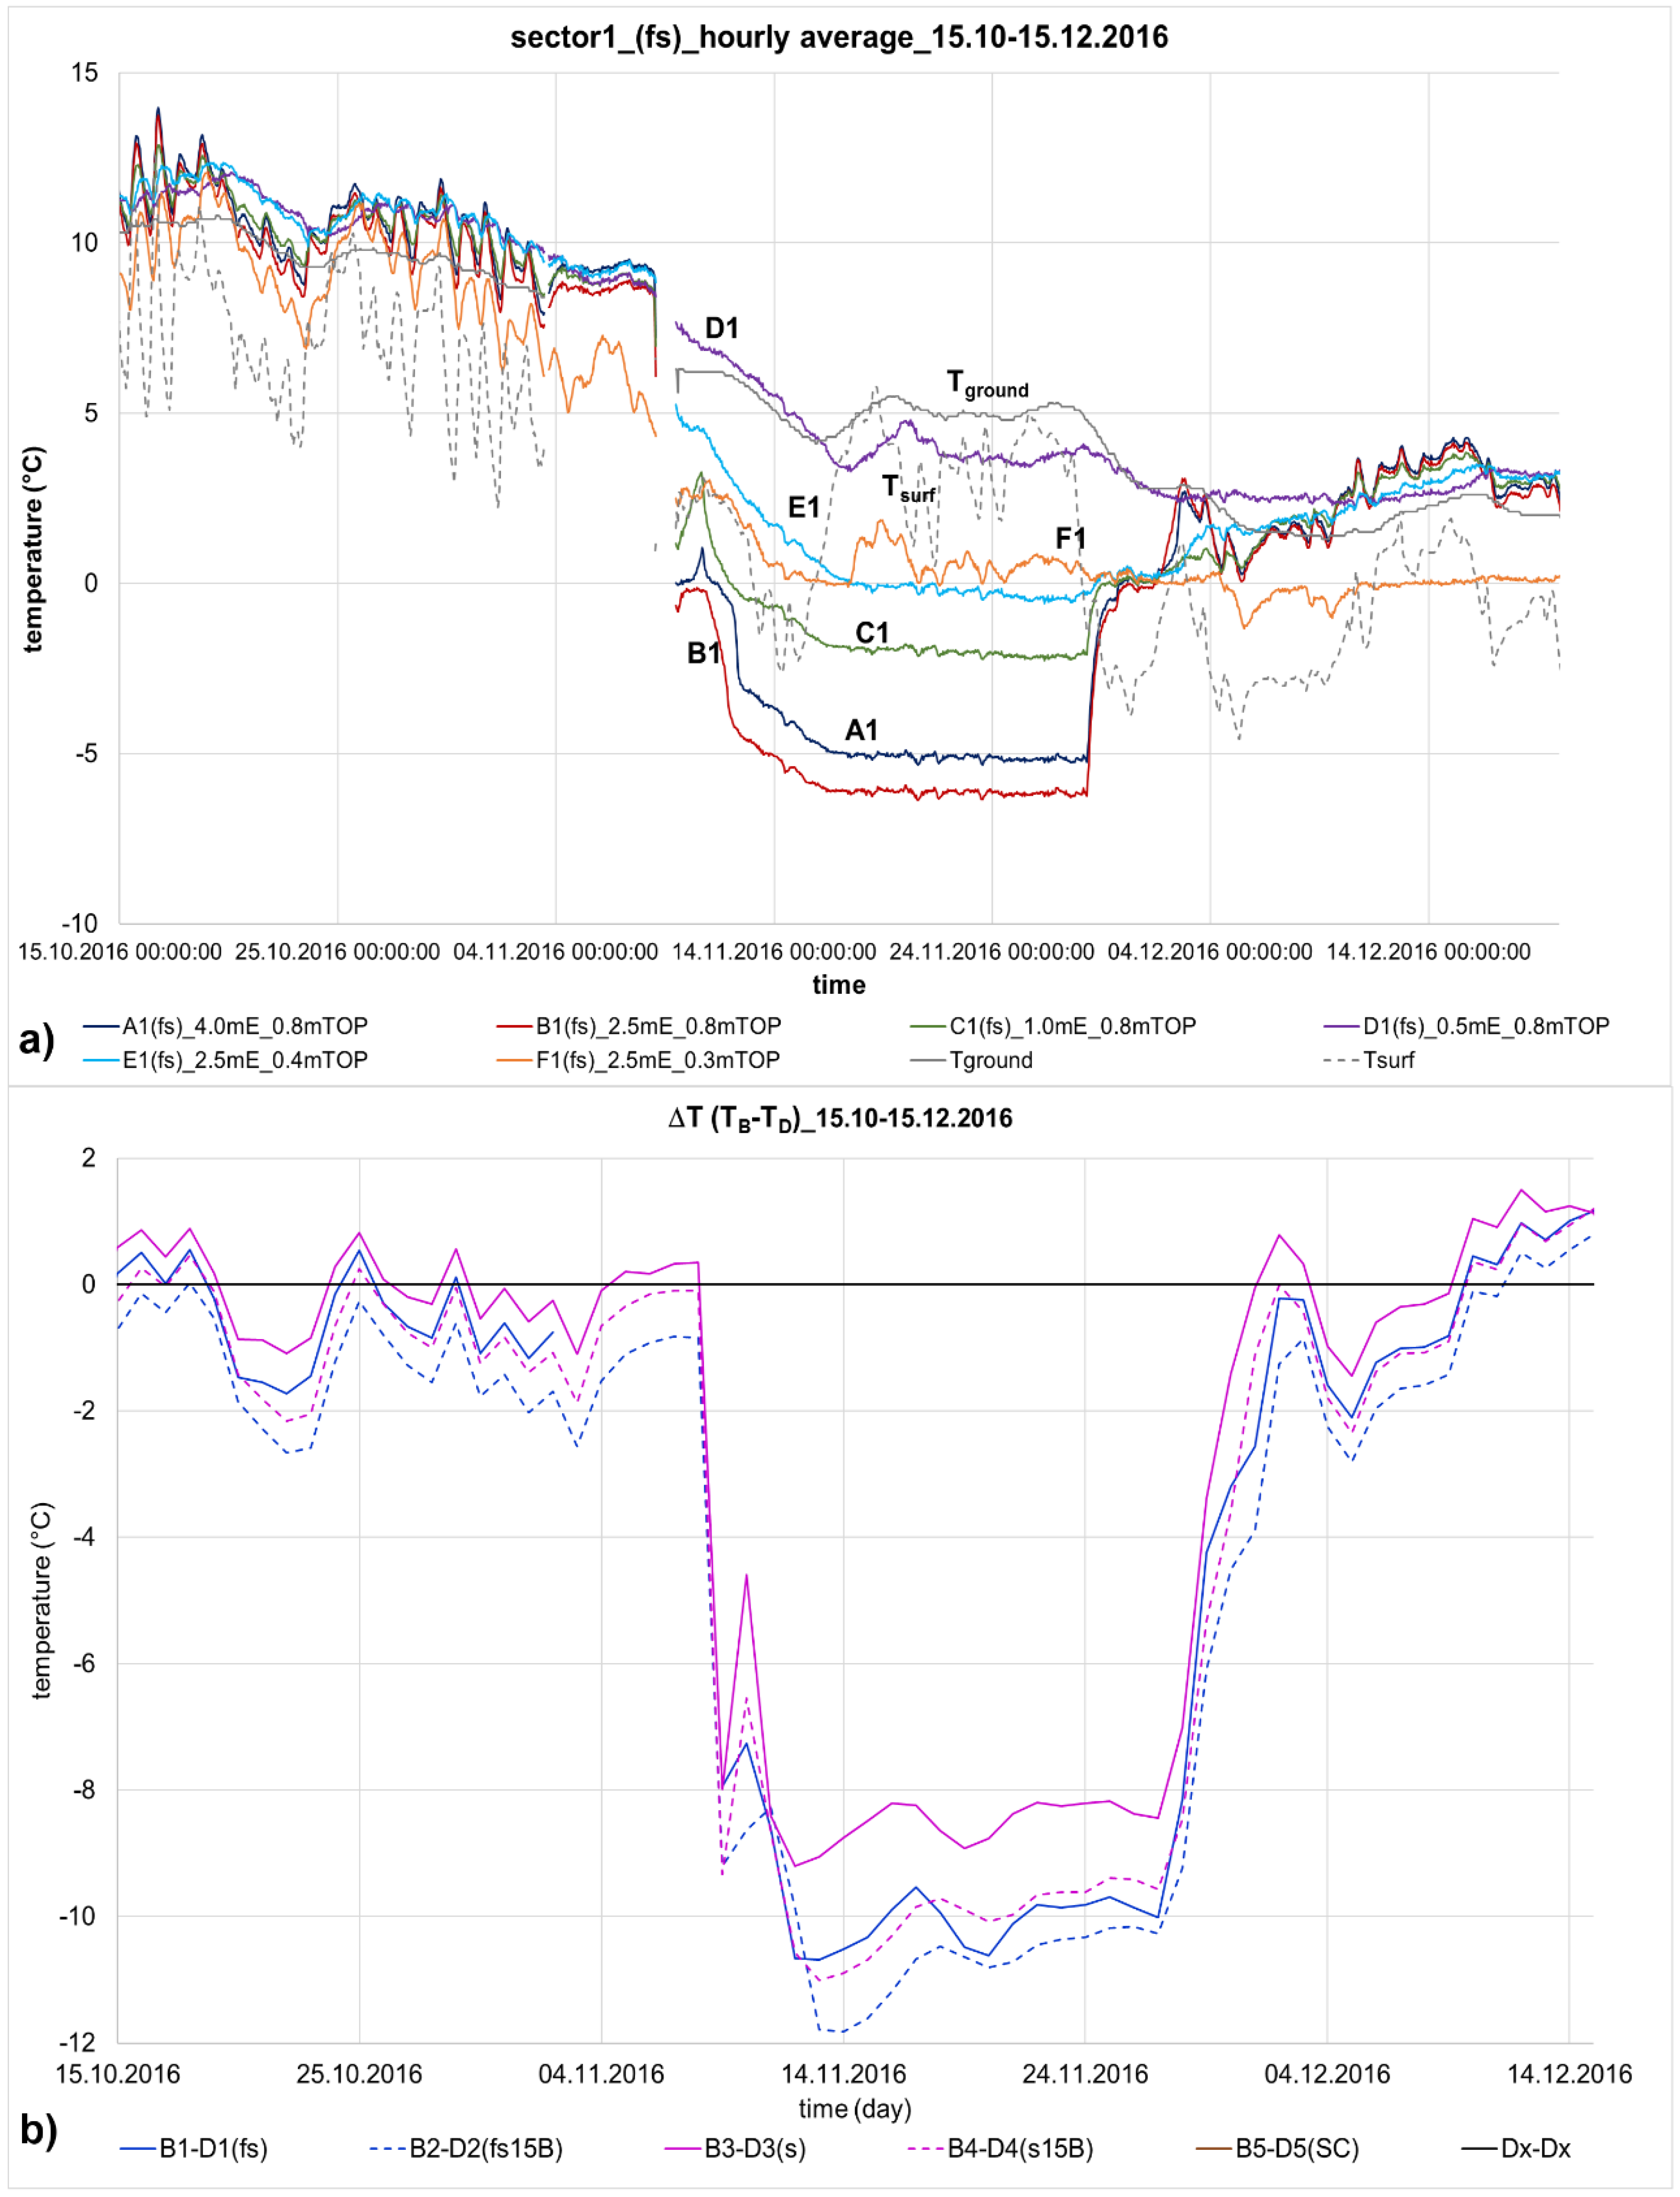
Figure 5.
Comparison of temperature and climatological data expressed as daily average in sector 1 (fs) from 15 October 2016 up to 15 December 2016. (a) Air and ground temperature variations registered at different depths together with illuminance data; (b) relative humidity, wind speed, precipitation and soil moisture content variation in the same period; (c) vertical temperature profile connecting sensor B with the outside temperature; and (d) temperature section changes along the E-W axis of the helix.
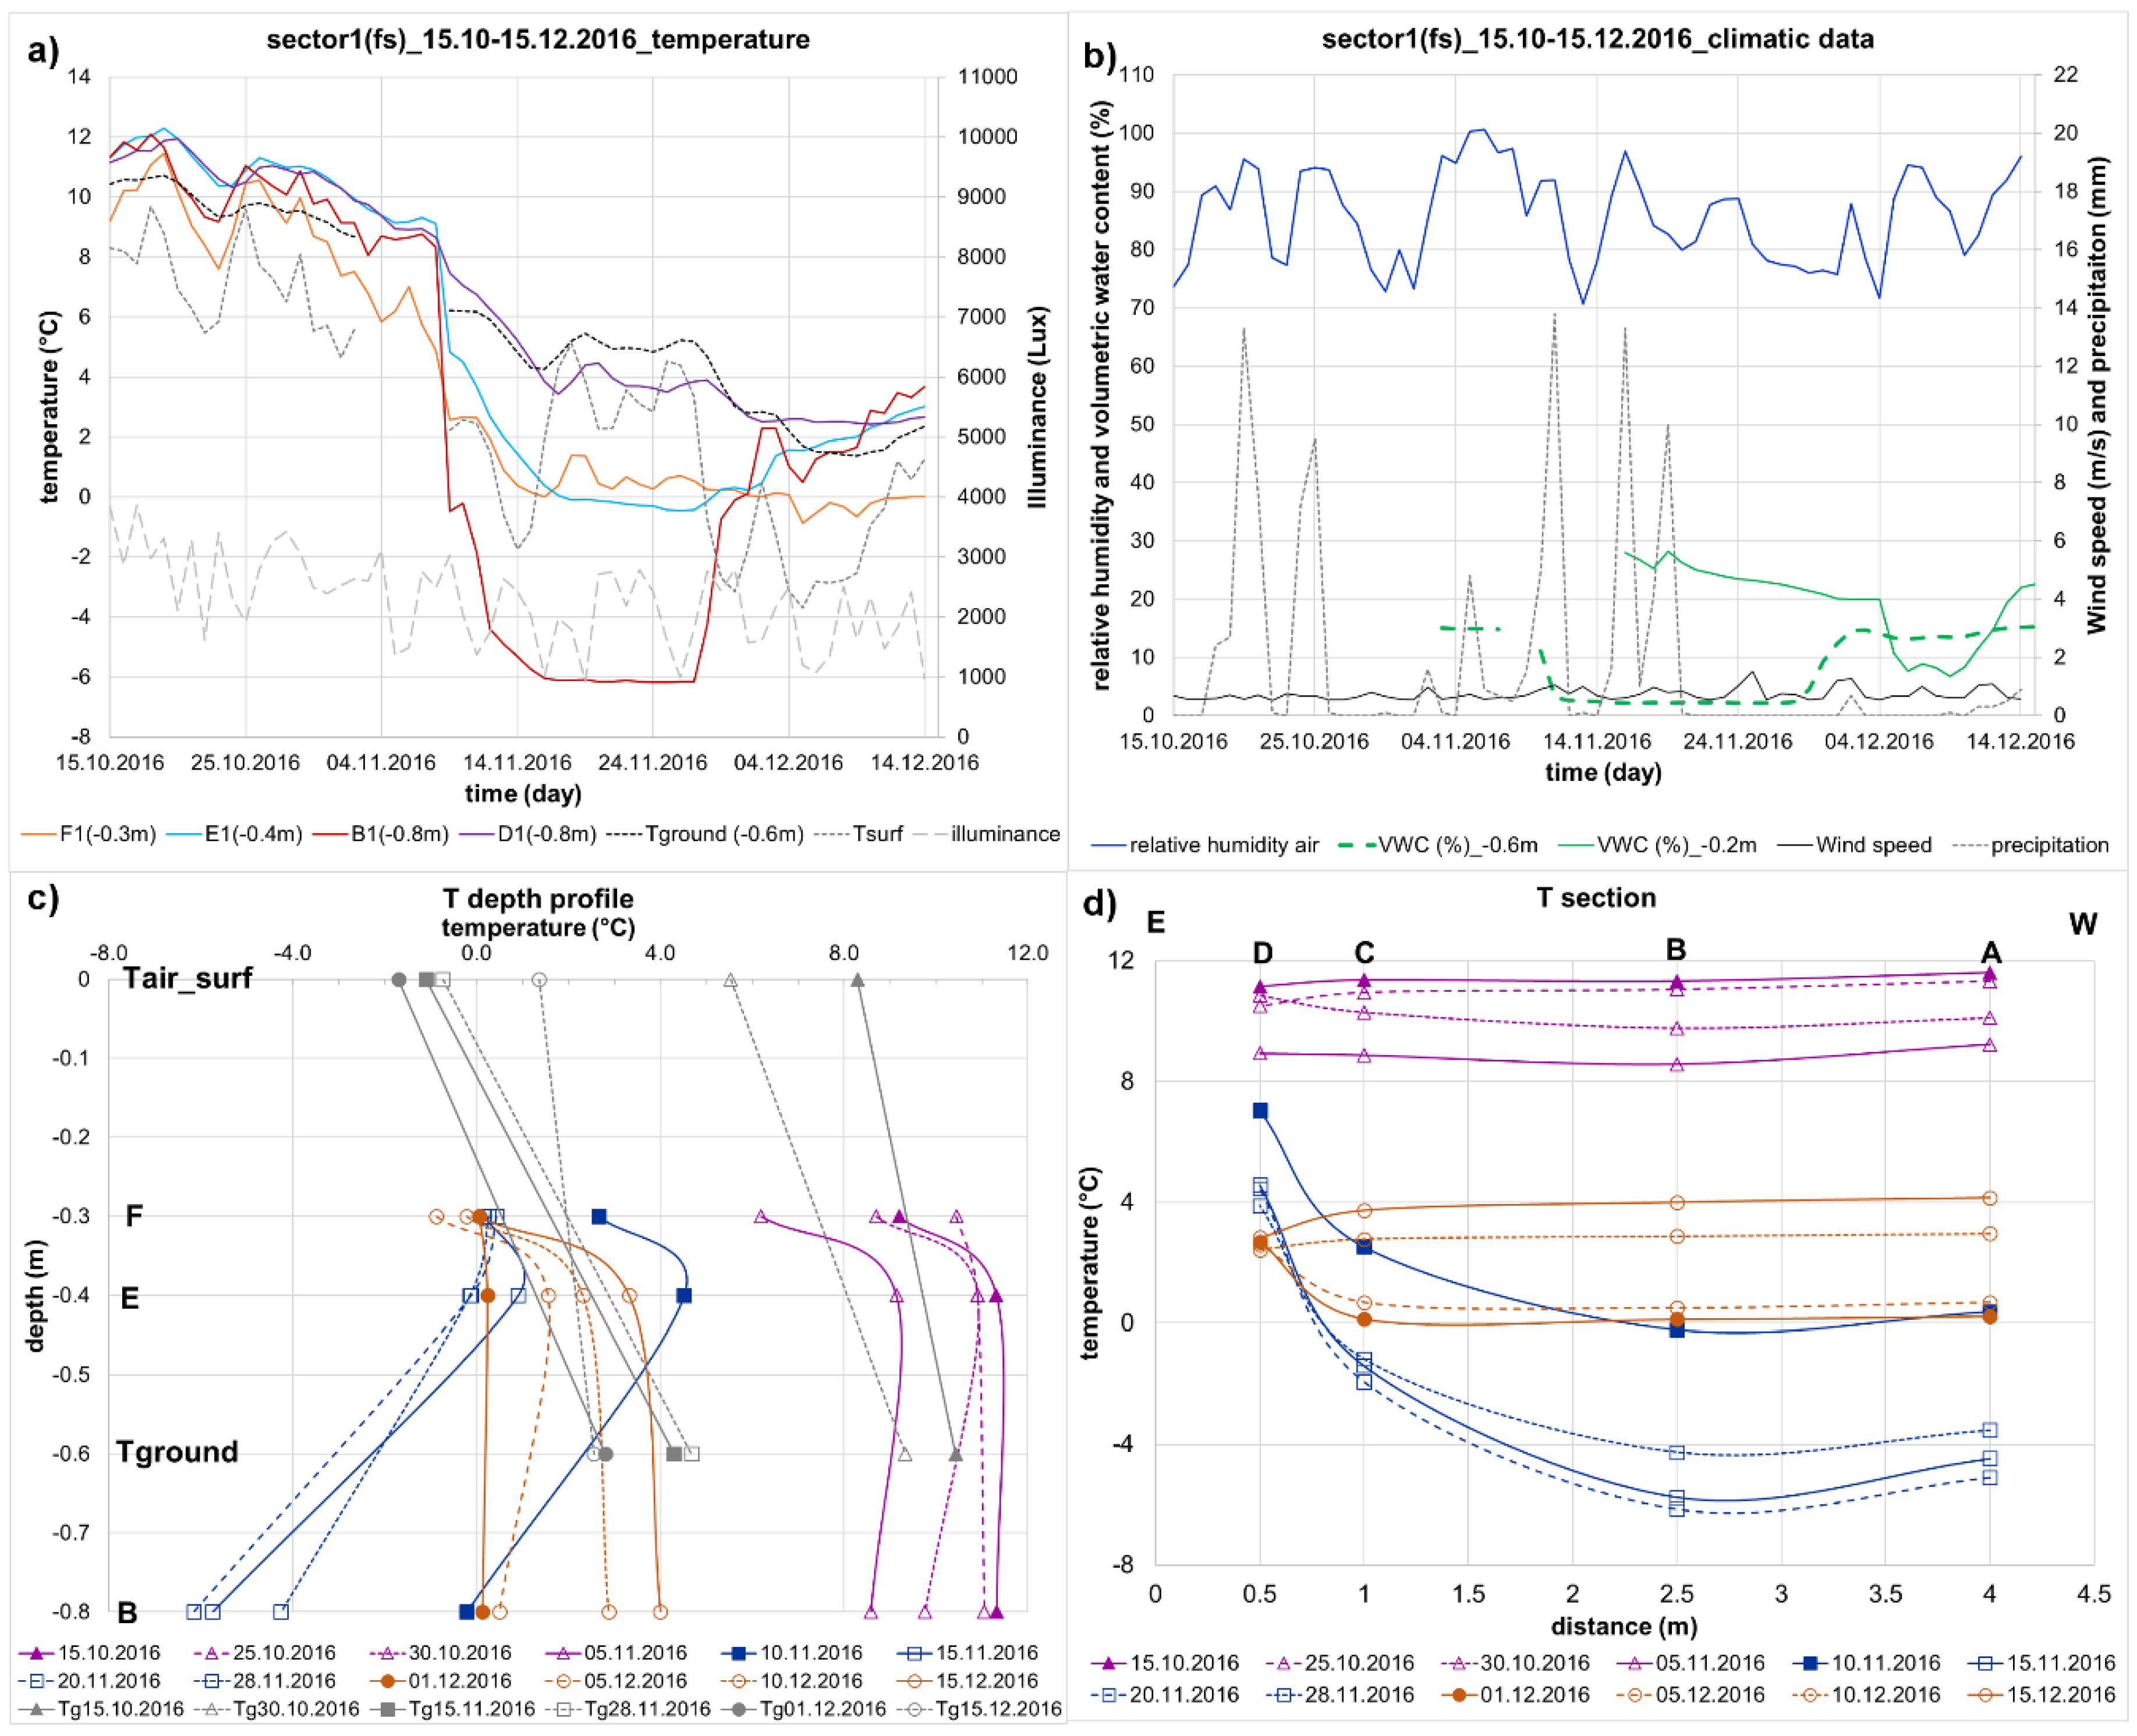
Figure 6.
Comparison of temperature and climatological data expressed as hourly average on 15 November 2016 in sector 1 (fs). (a) Air and ground temperature variations at different depths together with illuminance data; (b) relative humidity, wind speed, precipitation and soil moisture content collected in the same period; (c) vertical temperature profile and (d) horizontal temperature section along the E-W axis of the helix.
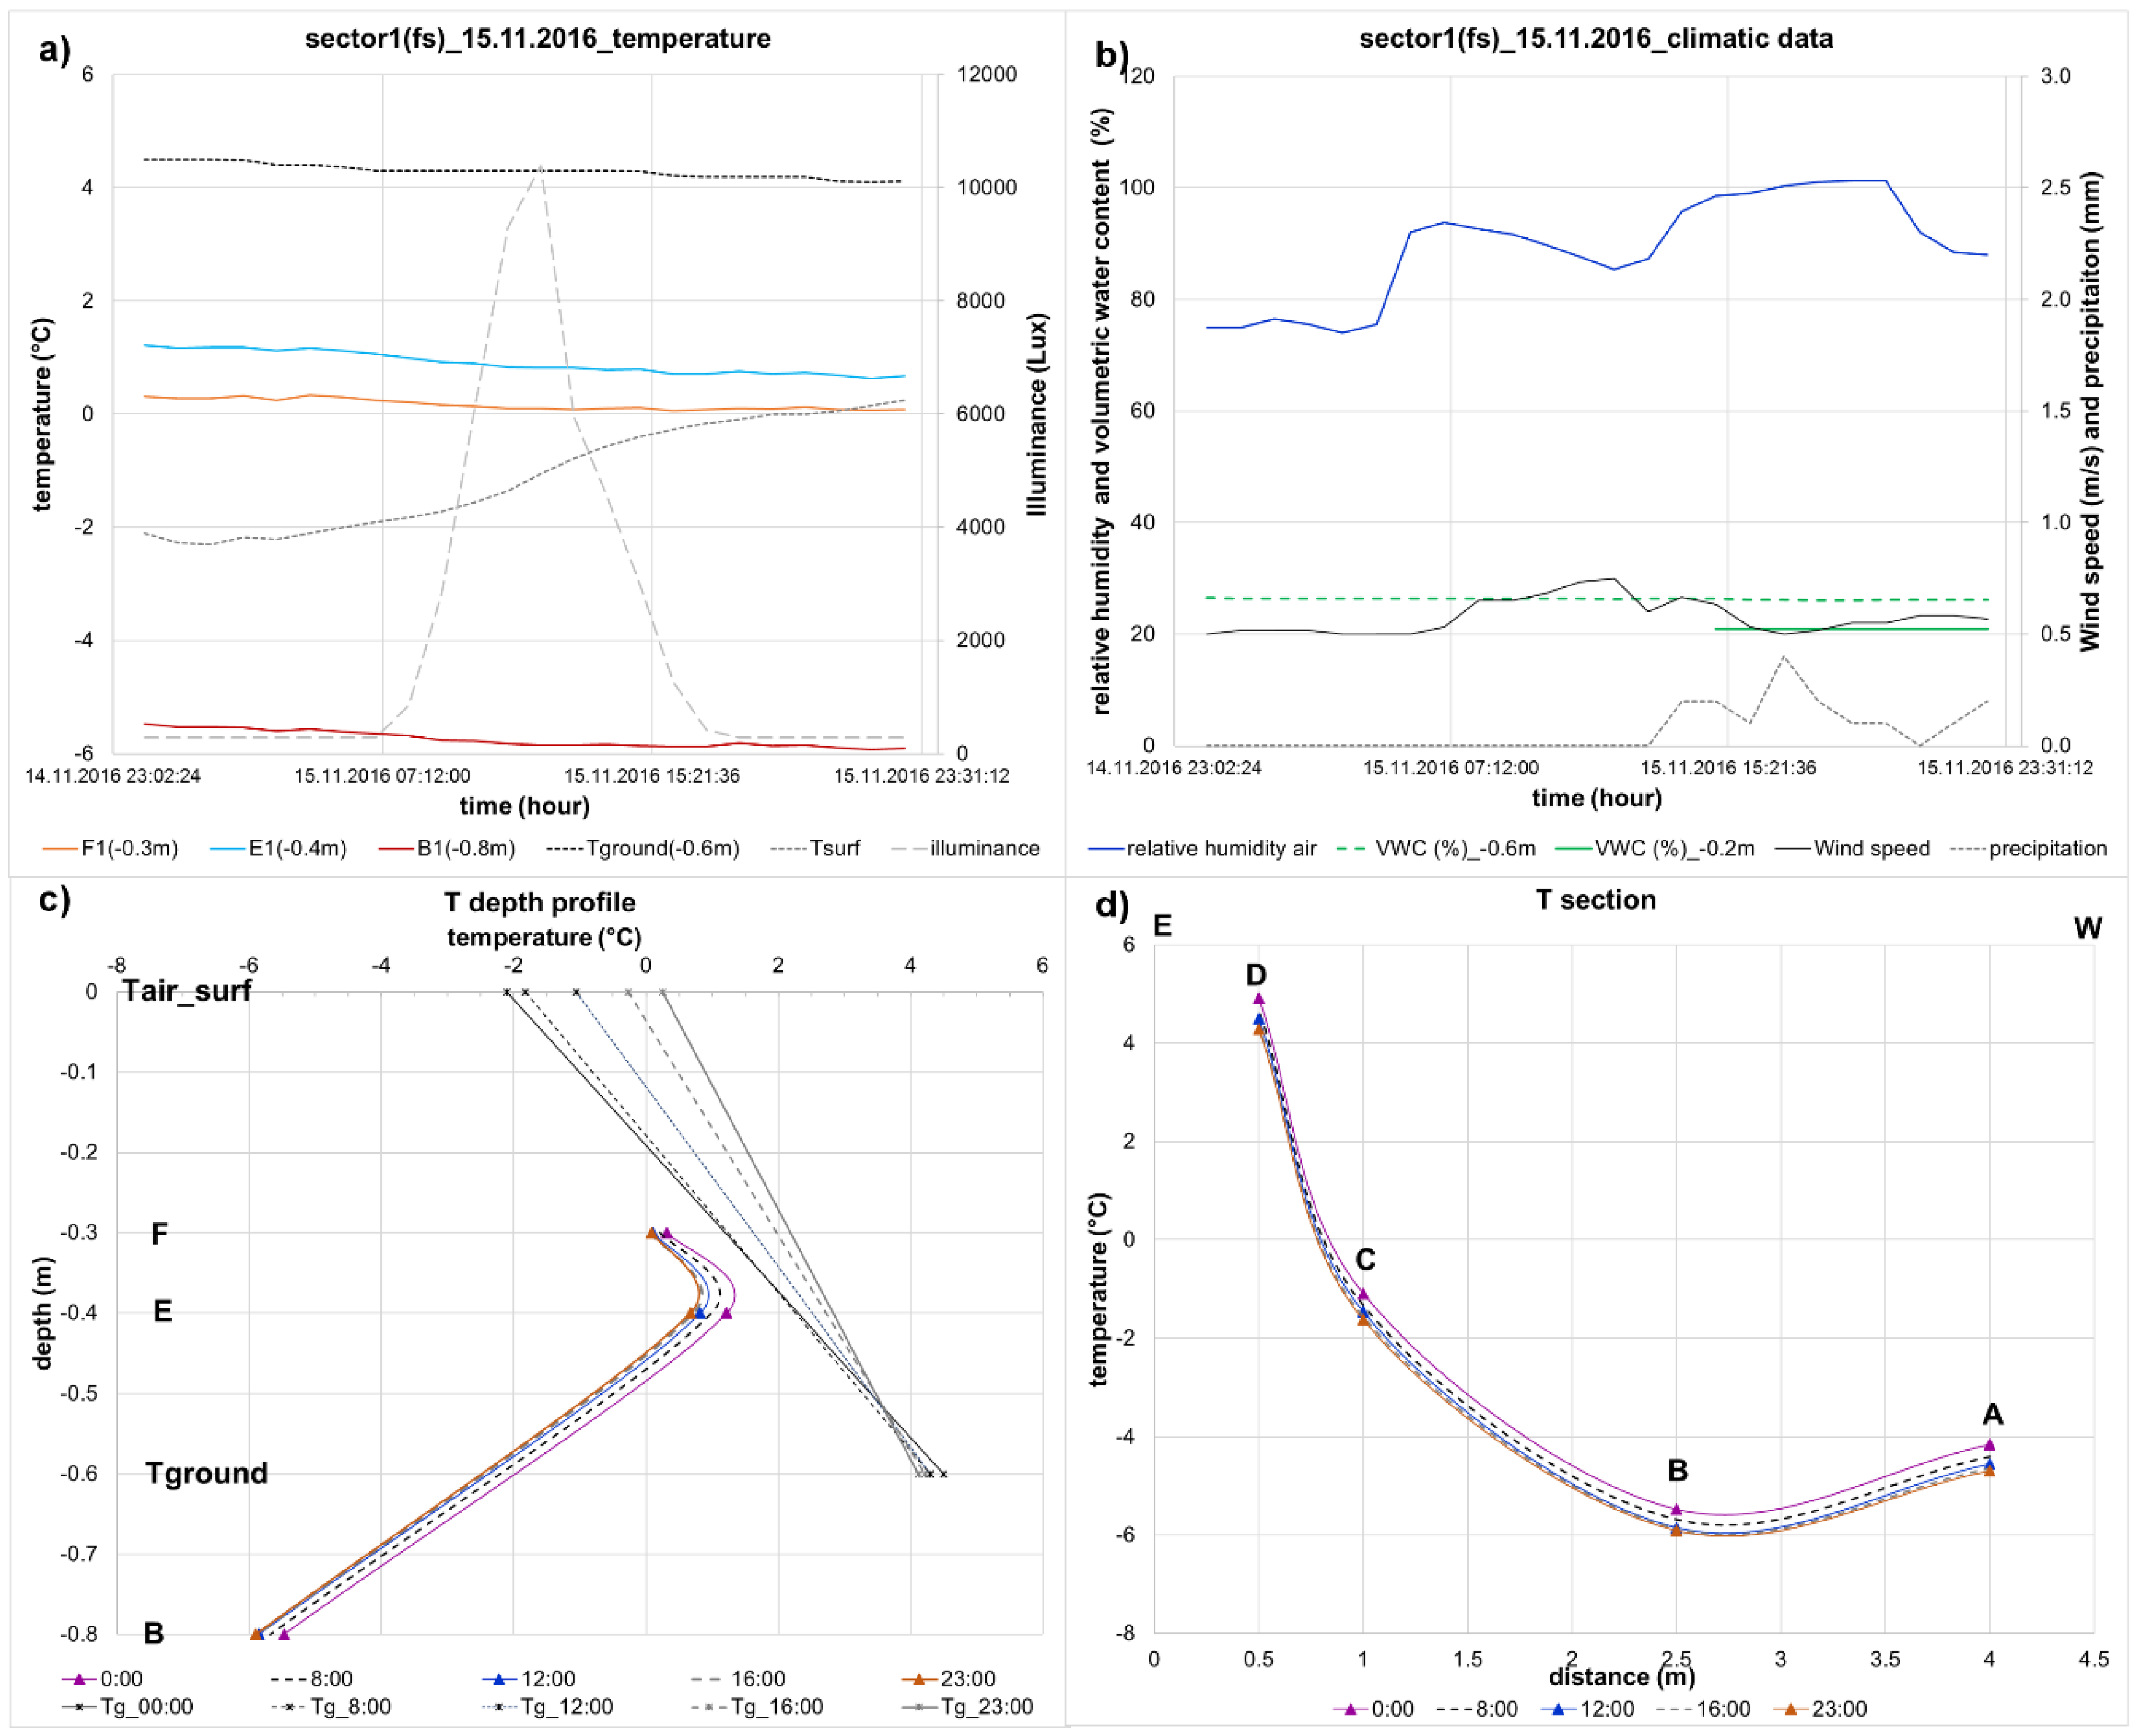
Figure 7.
Thermal conductivity data and moisture content variations measured monthly at the test field in Eltersdorf. (a) Relationship between thermal conductivity and moisture content for the five ITER mixtures used on site; and (b) surface variation of moisture content over time.
Figure 7.
Thermal conductivity data and moisture content variations measured monthly at the test field in Eltersdorf. (a) Relationship between thermal conductivity and moisture content for the five ITER mixtures used on site; and (b) surface variation of moisture content over time.


Table 1.
Characteristics of the helix probe [28,29,30,31,32,33,34,35,36,37,38,39,40,41,42,43,44,45,46,47,48,49]
| Helix | Value |
|---|---|
| Spiral height—for transport (m) | 1.1 |
| Spiral height—for installation (m) | 3 |
| Outer diameter of the helix (m) | 0.40 |
| Pipe length (m) | 40 |
| Pipe size (mm) | 25 × 2.3 |
| Pipe Material | High density polyethylene (PE-Xa) |
| Pipe Outside diameter (mm) | 25.0 |
| Pipe Inside diameter (mm) | 20.4 |
| Total length of the helical pipe (m) | 40 |
| Pitch between the turns (m) | 0.10 |
| Weight (kg) | 7.5 |
| Volume (for water/antifreeze) (l) | 13 |
| Temperature resistance (°C) | up to 95 |
| Estimated average extraction performance (W/helix probe) * | 450 |
* This value is intended for each helix probe, as described in detail in the technical manual of the helix provided by the manufacturer. The value could vary according to the kind of material and soil water content at disposal [49].
Table 2.
Average value 1 of the volumetric water content (%) measured in continuous from 29 November 2016 up to 7 February 2017.
Table 2.
Average value 1 of the volumetric water content (%) measured in continuous from 29 November 2016 up to 7 February 2017.
| Depth (m) | Sector 5_SC | Sector 4_s15B | Sector 3_GS+s | Sector 2_fs15B | Sector 1_fs |
|---|---|---|---|---|---|
| −0.20 | 19.6 | 15.9 | 5.3 | 28.4 | 14.1 |
| −0.60 | 10.1 | 12.8 | 10.8 | 26.7 | 6.6 |
1 All values are expressed in %.
© 2017 by the authors. Licensee MDPI, Basel, Switzerland. This article is an open access article distributed under the terms and conditions of the Creative Commons Attribution (CC BY) license (http://creativecommons.org/licenses/by/4.0/).
Share and Cite
MDPI and ACS Style
Di Sipio, E.; Bertermann, D. Factors Influencing the Thermal Efficiency of Horizontal Ground Heat Exchangers. Energies 2017, 10, 1897. https://doi.org/10.3390/en10111897
AMA Style
Di Sipio E, Bertermann D. Factors Influencing the Thermal Efficiency of Horizontal Ground Heat Exchangers. Energies. 2017; 10(11):1897. https://doi.org/10.3390/en10111897
Chicago/Turabian StyleDi Sipio, Eloisa, and David Bertermann. 2017. "Factors Influencing the Thermal Efficiency of Horizontal Ground Heat Exchangers" Energies 10, no. 11: 1897. https://doi.org/10.3390/en10111897
Note that from the first issue of 2016, this journal uses article numbers instead of page numbers. See further details here.