Article

Design and Performance of Test Cells as an Energy Evaluation Model of Facades in a Mediterranean Building Area

by
Ángel Luis León-Rodríguez
,
Rafael Suárez
*,
Pedro Bustamante
,
Miguel Ángel Campano
and
David Moreno-Rangel
Instituto Universitario de Arquitectura y Ciencias de la Construcción, Escuela Técnica Superior de Arquitectura, Universidad de Sevilla, Av. de Reina Mercedes 2, Seville 41012, Spain
*
Author to whom correspondence should be addressed.
Energies 2017, 10(11), 1816; https://doi.org/10.3390/en10111816
Submission received: 27 September 2017 / Revised: 4 November 2017 / Accepted: 6 November 2017 / Published: 9 November 2017

Abstract

:
The current European energy policies have an influence on the need to rehabilitate the housing stock in order to meet the objectives of the European Union. Most of this housing stock was built without any type of energy regulation in adverse technical and economic conditions and thus is now energetically obsolete. The major rehabilitation effort required must be approached through actions based on previous quantitative energy knowledge of the existing buildings in order to guarantee the efficiency of energy-retrofitted solutions. This assessment can be carried out through monitoring dwellings conditioned by use patterns; through simulation programs, which do not usually offer faithful representations of energy conditions; or by using test cells, which allow us to evaluate a controlled indoor environment without the influence of users. The objective of this paper is to present the design and performance of test cells as an experimental method for vertical facade analysis in order to tackle the problem of retrofitting residential buildings in a Mediterranean climate, taking into account energy and environment. With this equipment, efficiency and energy savings, as well as illumination and interior air quality, can be simultaneously and comprehensively evaluated.

1. Introduction

European regulations establish common ground for reducing energy consumption and meeting the requirements set by the EU for 2020 [1], with housing stock as one of the central lines of action. Most housing stock was built outside energy regulations of any sort and with little technology and funding. Approaches to the problem of housing stock in the Mediterranean area cannot be the same as those in northern Europe [2], given the difference in climate. In southern Spain, the housing stock was built before the implementation of the first legislation for the thermal regulation of buildings, CT-79 in 1980 [3], in a context of limited technical and economic means, with a view to providing universal access to housing for the working class. This housing stock presents deficient energy conditions requiring high energy consumption in order to maintain suitable comfort conditions [4]. However, the socio-economic profile of a large number of users results in living conditions of energy poverty, with environmental deficiencies and discomfort [5]. In the current economic climate, architectural retrofitting, covered by retrofitted supporting policies [6], is a priority in the construction sector.
However, before any type of rehabilitation can be carried out on the housing stock, extensive knowledge of a building’s energy performance in its current condition and the appropriate prediction of the energy behaviour of the retrofitted proposals are required.
In fact, one of the themes proposed by the European Commission in its Horizon 2020 research and innovation policy is “new tools and methodologies to reduce the gap between predicted and actual energy performances at the level of buildings and blocks of buildings” [7].
A protocol has been put into place [8] for this Mediterranean housing stock to enable energy characterization through in-use monitoring of representative study cases. This is followed by an extrapolation of the results using energy simulation models previously validated with typological analysis and an evaluation of the energy responses with in situ measurements and monitoring campaigns [9]. The data obtained are used to propose active strategies at the neighbourhood [10] and urban levels [11]. However, the representativeness of these studies is conditioned by use patterns, wherein users are responsible for the performance gap [12].
In contrast to the laboratory test studies, which reproduce a steady-state regimen, the use of test cells allows results with real outdoor conditions to be obtained in a controlled indoor environment with high instrumentation levels. These also collect accurate results for each parameter evaluated, unlike the case of in-use monitoring. In a controlled setting, this analysis allows the energy optimization of the constructive solutions to be tested. Test cells cannot be seen as an end in themselves but rather as the first step of the analysis, which is to be complemented with the validation stage and the later use of energy simulation programs [13,14] analysing previous test cell results. This energy evaluation of test cells is presented as one of the main mechanisms for the optimization of energy retrofitting strategies based on a comparative study of different constructive options and the current state of the buildings to be rehabilitated.
Since the 1980s, the PASSYS (PASsive Solar Components and SYStems Testing) Project [15] has been used for experiences in Europe in the field of energy efficiency and saving, making use of experimental test cells located in outdoor environments. A thermal characterization test methodology using highly insulated and real scale cells was developed [16] by the PASSYS Project. These cells consisted of a test room with a removable facade facing south and a small room known as a service room, where control systems, measurement equipment, and HVAC (Heating, ventilation, and air conditioning) are located. These cells were used to analyse the performance of different interchangeable building envelopes in the south facade mentioned above [17]. One of the main conclusions of this project was the existence of methodological problems caused by uncontrolled transmission through the insulated envelope. This led to the creation of the PASLINK cells [18] and the DYNASTEE group (DYNamic Analysis, Simulation, and Testing applied to the Energy and Environmental performance of buildings) [19], in which all results obtained are incorporated [20].
PASLINK test cells have been frequently used [21] for different purposes but mainly for conducting tests for the performance improvement of a specific component in building envelopes. In Europe, it is worth noting the experiences of the CSTC-BBRI (Centre Scientifique et Technique de la Construction-Belgian Building Research Institute) in Belgium while analysing several types and sizes of window apertures in the south facade [22]; with different facade components [23]; for photovoltaic elements [24]; to obtain solar gain results [25]; or to be able to evaluate different orientations using a rotary platform [26].
PASLINK test cells are used in pairs for the comparative evaluation of the efficiency of retrofitted and existing solutions similar to real-scale facilities such as the twin houses of the IBP (Institute for Building Physics) in Germany [27]. Attention should also be drawn to research into cells in pairs, focusing more specifically on the investigation of residential buildings in the University of California [28]. In this case a double cell is analysed, reproducing the initial conditions of a house, contrasted with the conditions of the rehabilitation solution in order to evaluate cooling through ventilation and comfort conditions in relation to window size, thermal mass, and ventilation flow rate.
In Spain, and in a continental climate, it is worth highlighting the work carried out in Madrid [29] by a research team studying homogeneous facade solutions without considering the window aperture, as well as that of the building quality control laboratory of the Basque Government in Alava [30]. The solar platform installations in Almeria [31] are used to test different types of building envelopes in a desert climate. Equally, in the case of a Mediterranean climate, it is worth highlighting the equipment of the Centre for Renewable Energy Sources and Saving in Greece [32]. This studies homogeneous solutions in facades with no energetic or acoustic interaction of the window aperture or influence from solar protections or ventilation.
The aim of this study is to show the design and performance of one-pair test cells, which allow the optimization of vertical building envelope solutions for the retrofit of residential buildings in a Mediterranean area. The environmental conditions in a cell with an existing envelope and another retrofitted one, both with the same orientation, are simultaneously evaluated. Moreover, the suitability of the retrofitted solution is assessed from a global and simultaneous vision of energy aspects, thermal and lighting comfort, and air quality through the later development of simulation models. The use of this equipment provided a precise and real knowledge of the envelope solutions of buildings, ignoring the influence of the user but considering a fully controlled environment that can be manipulated.

2. Description of Test Cells
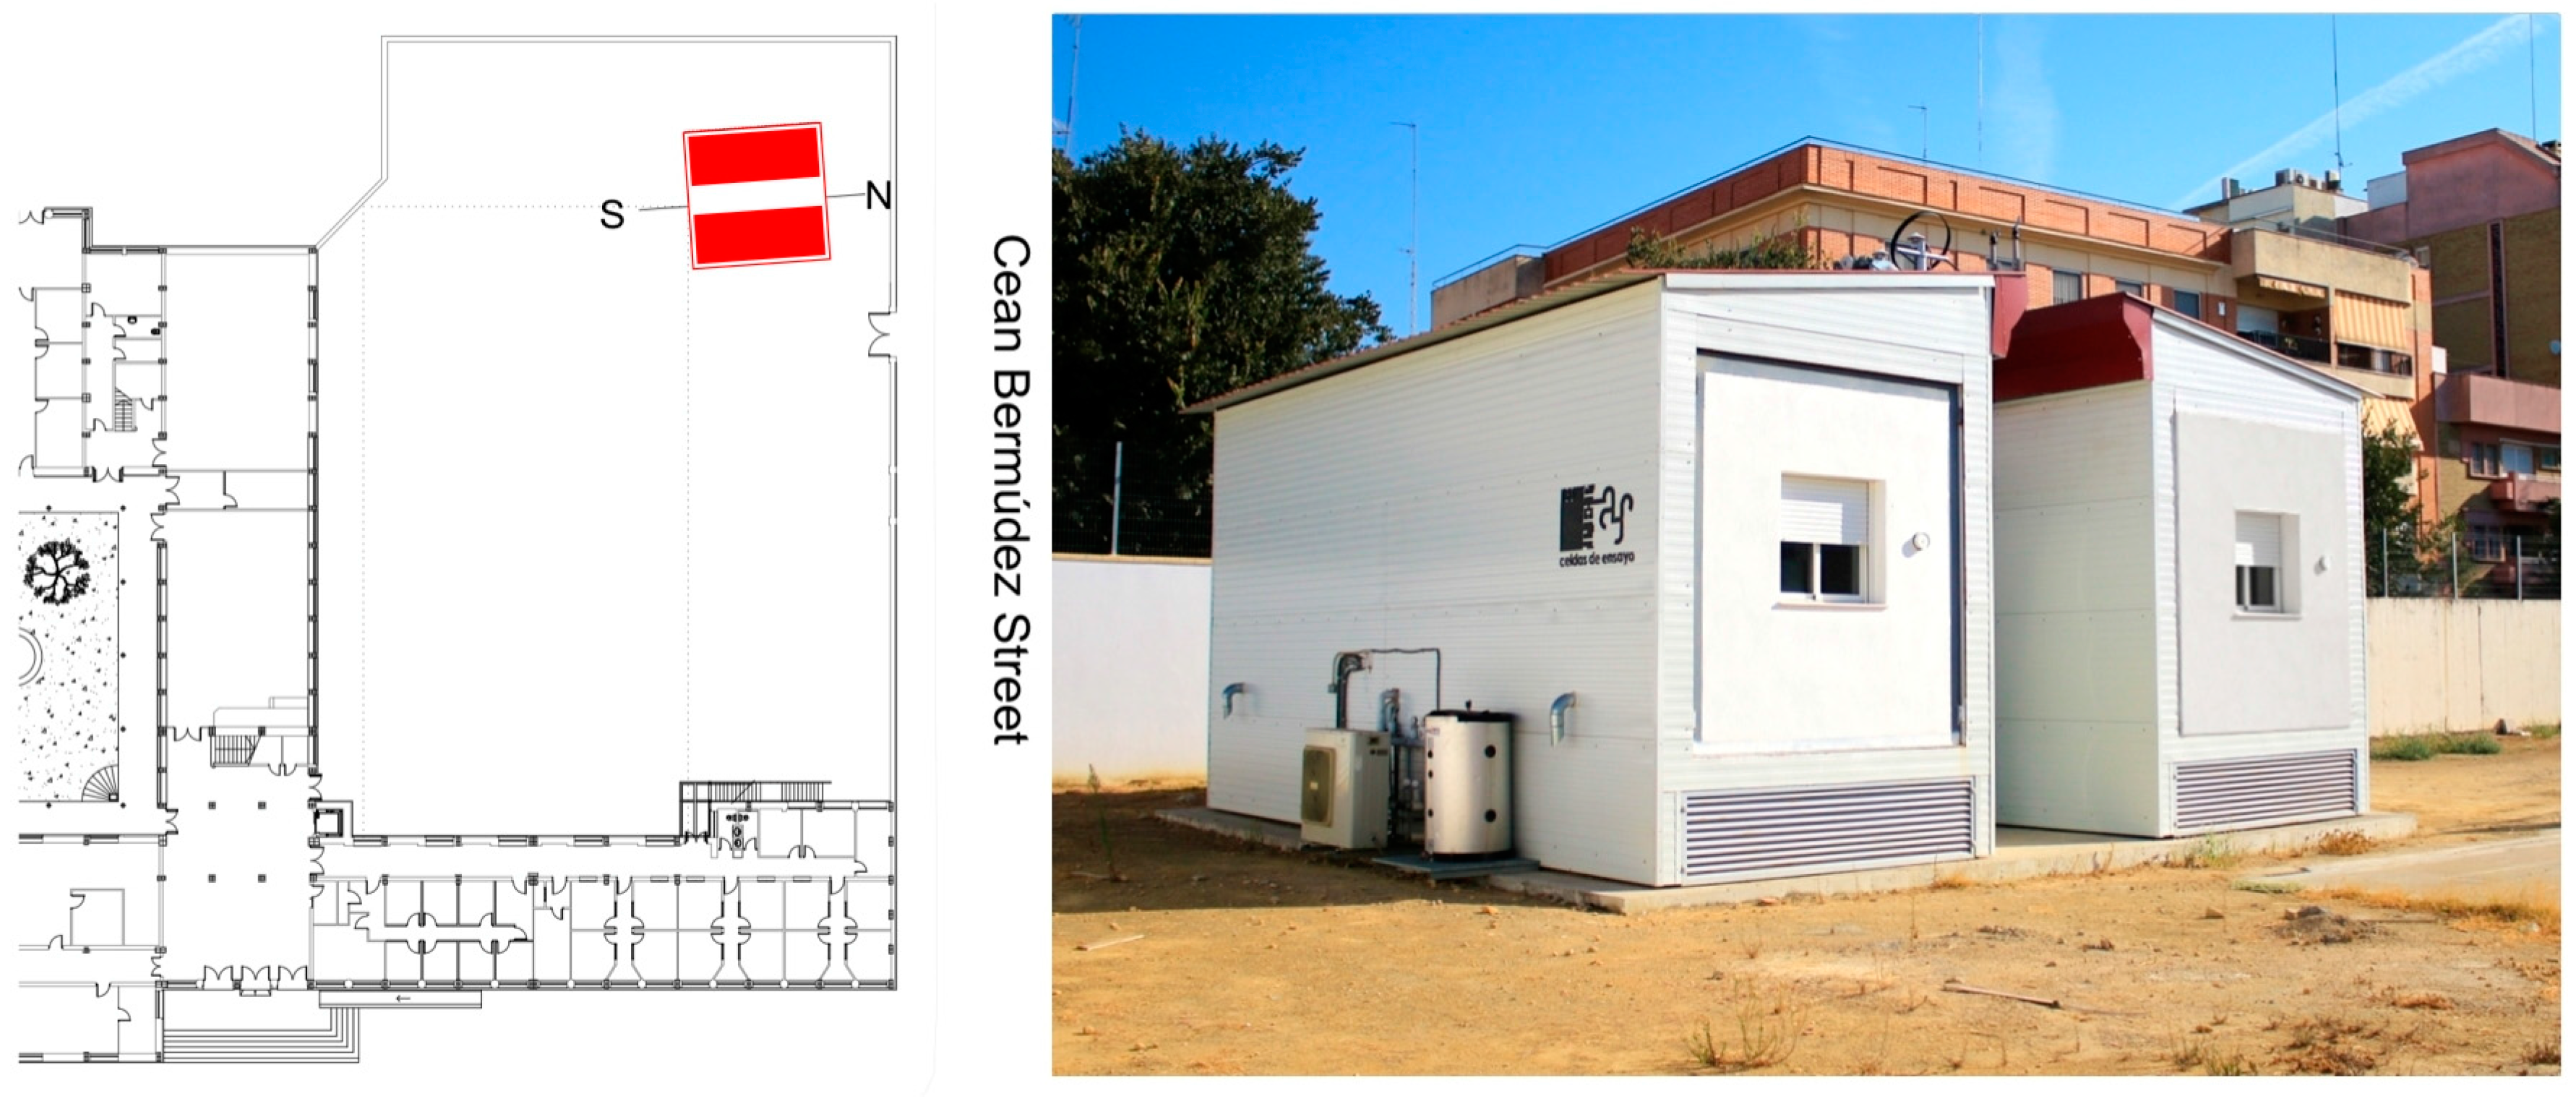
2.1. Location Site

The test cells are located in an outdoor area of a building at the University of Seville, with a N-S longitudinal axis, as can be seen in Figure 1.
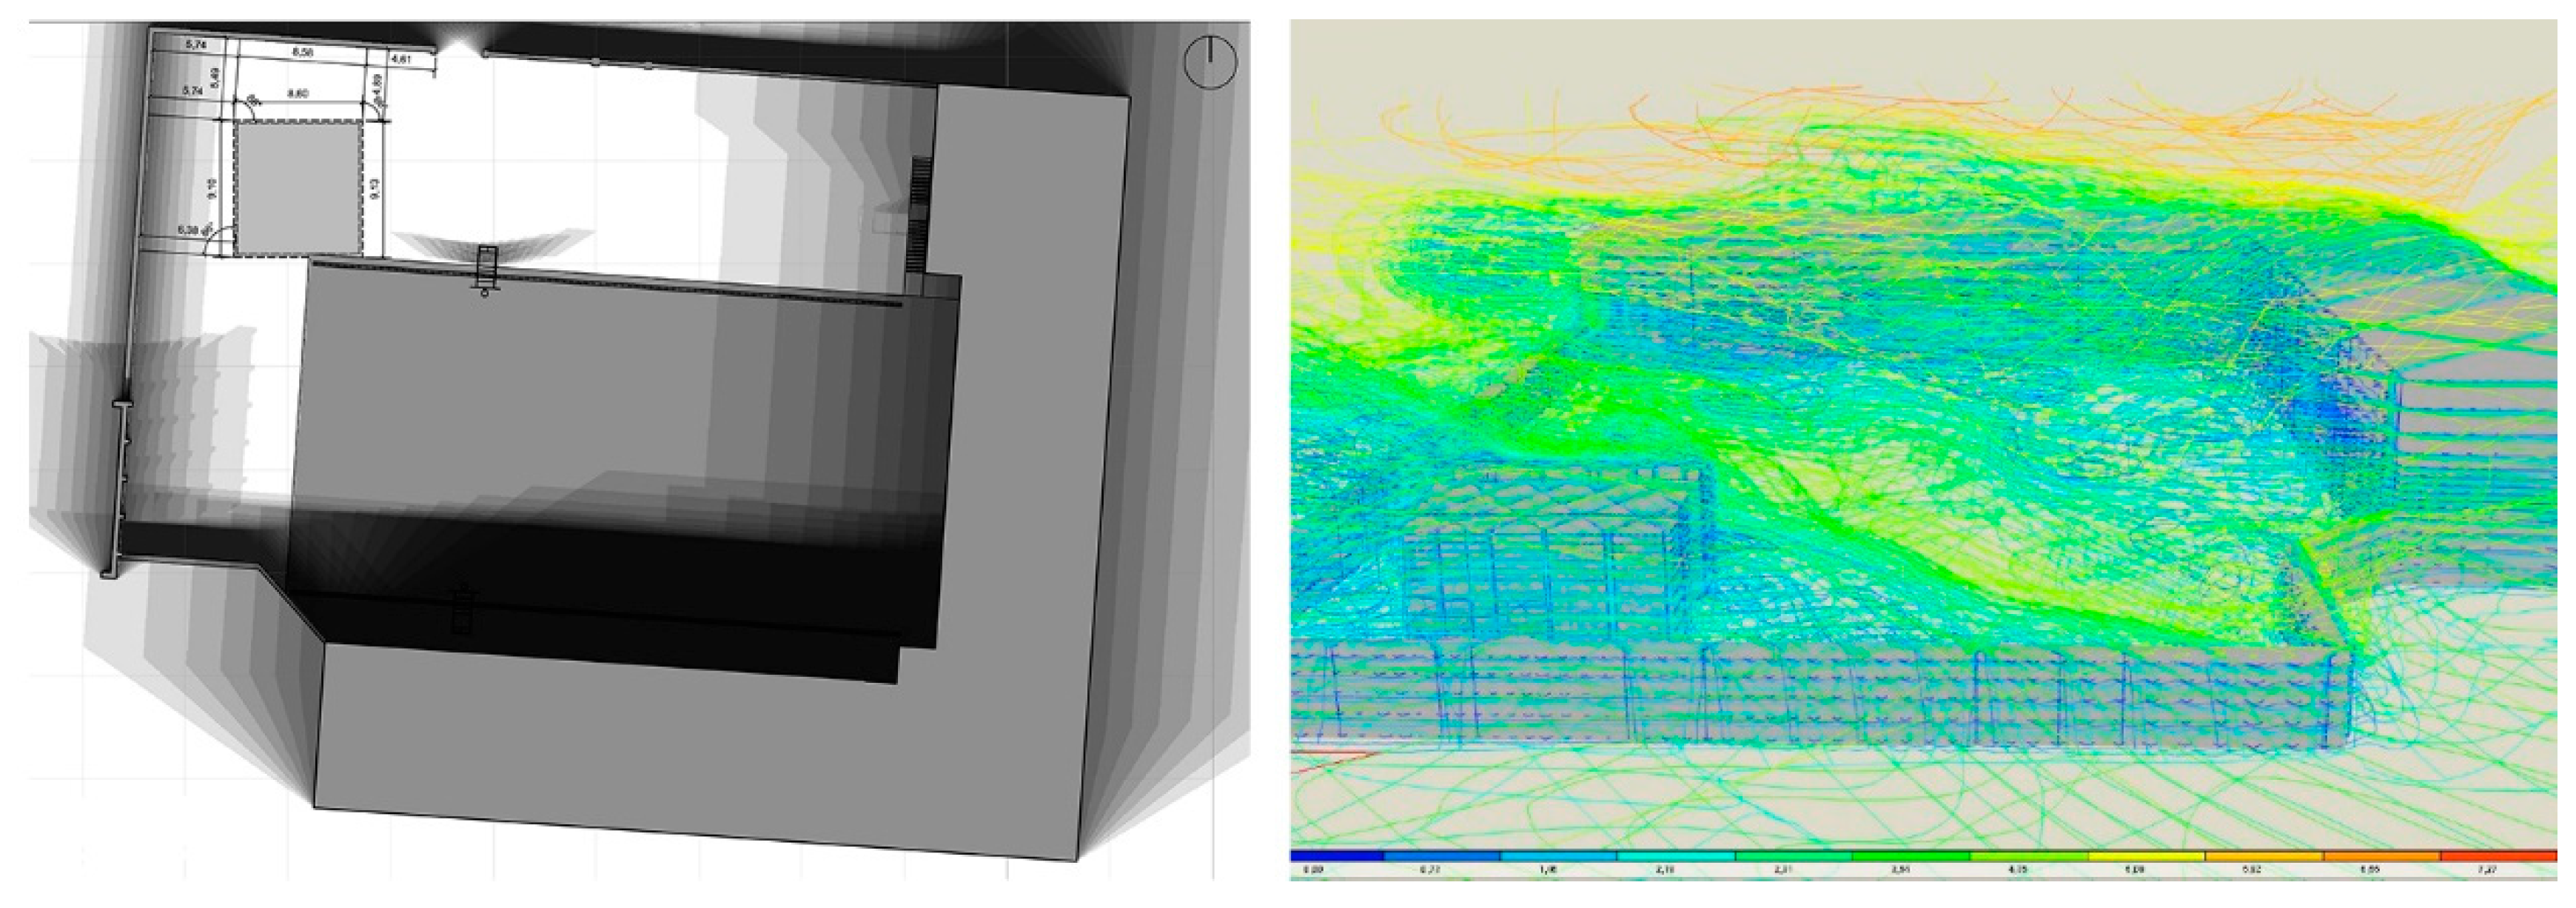
In order to determine the exact location, several sunlight and wind studies were conducted to ensure that there were no obstacles to sun or to the significant influence of wind flows in the surroundings (Figure 2).

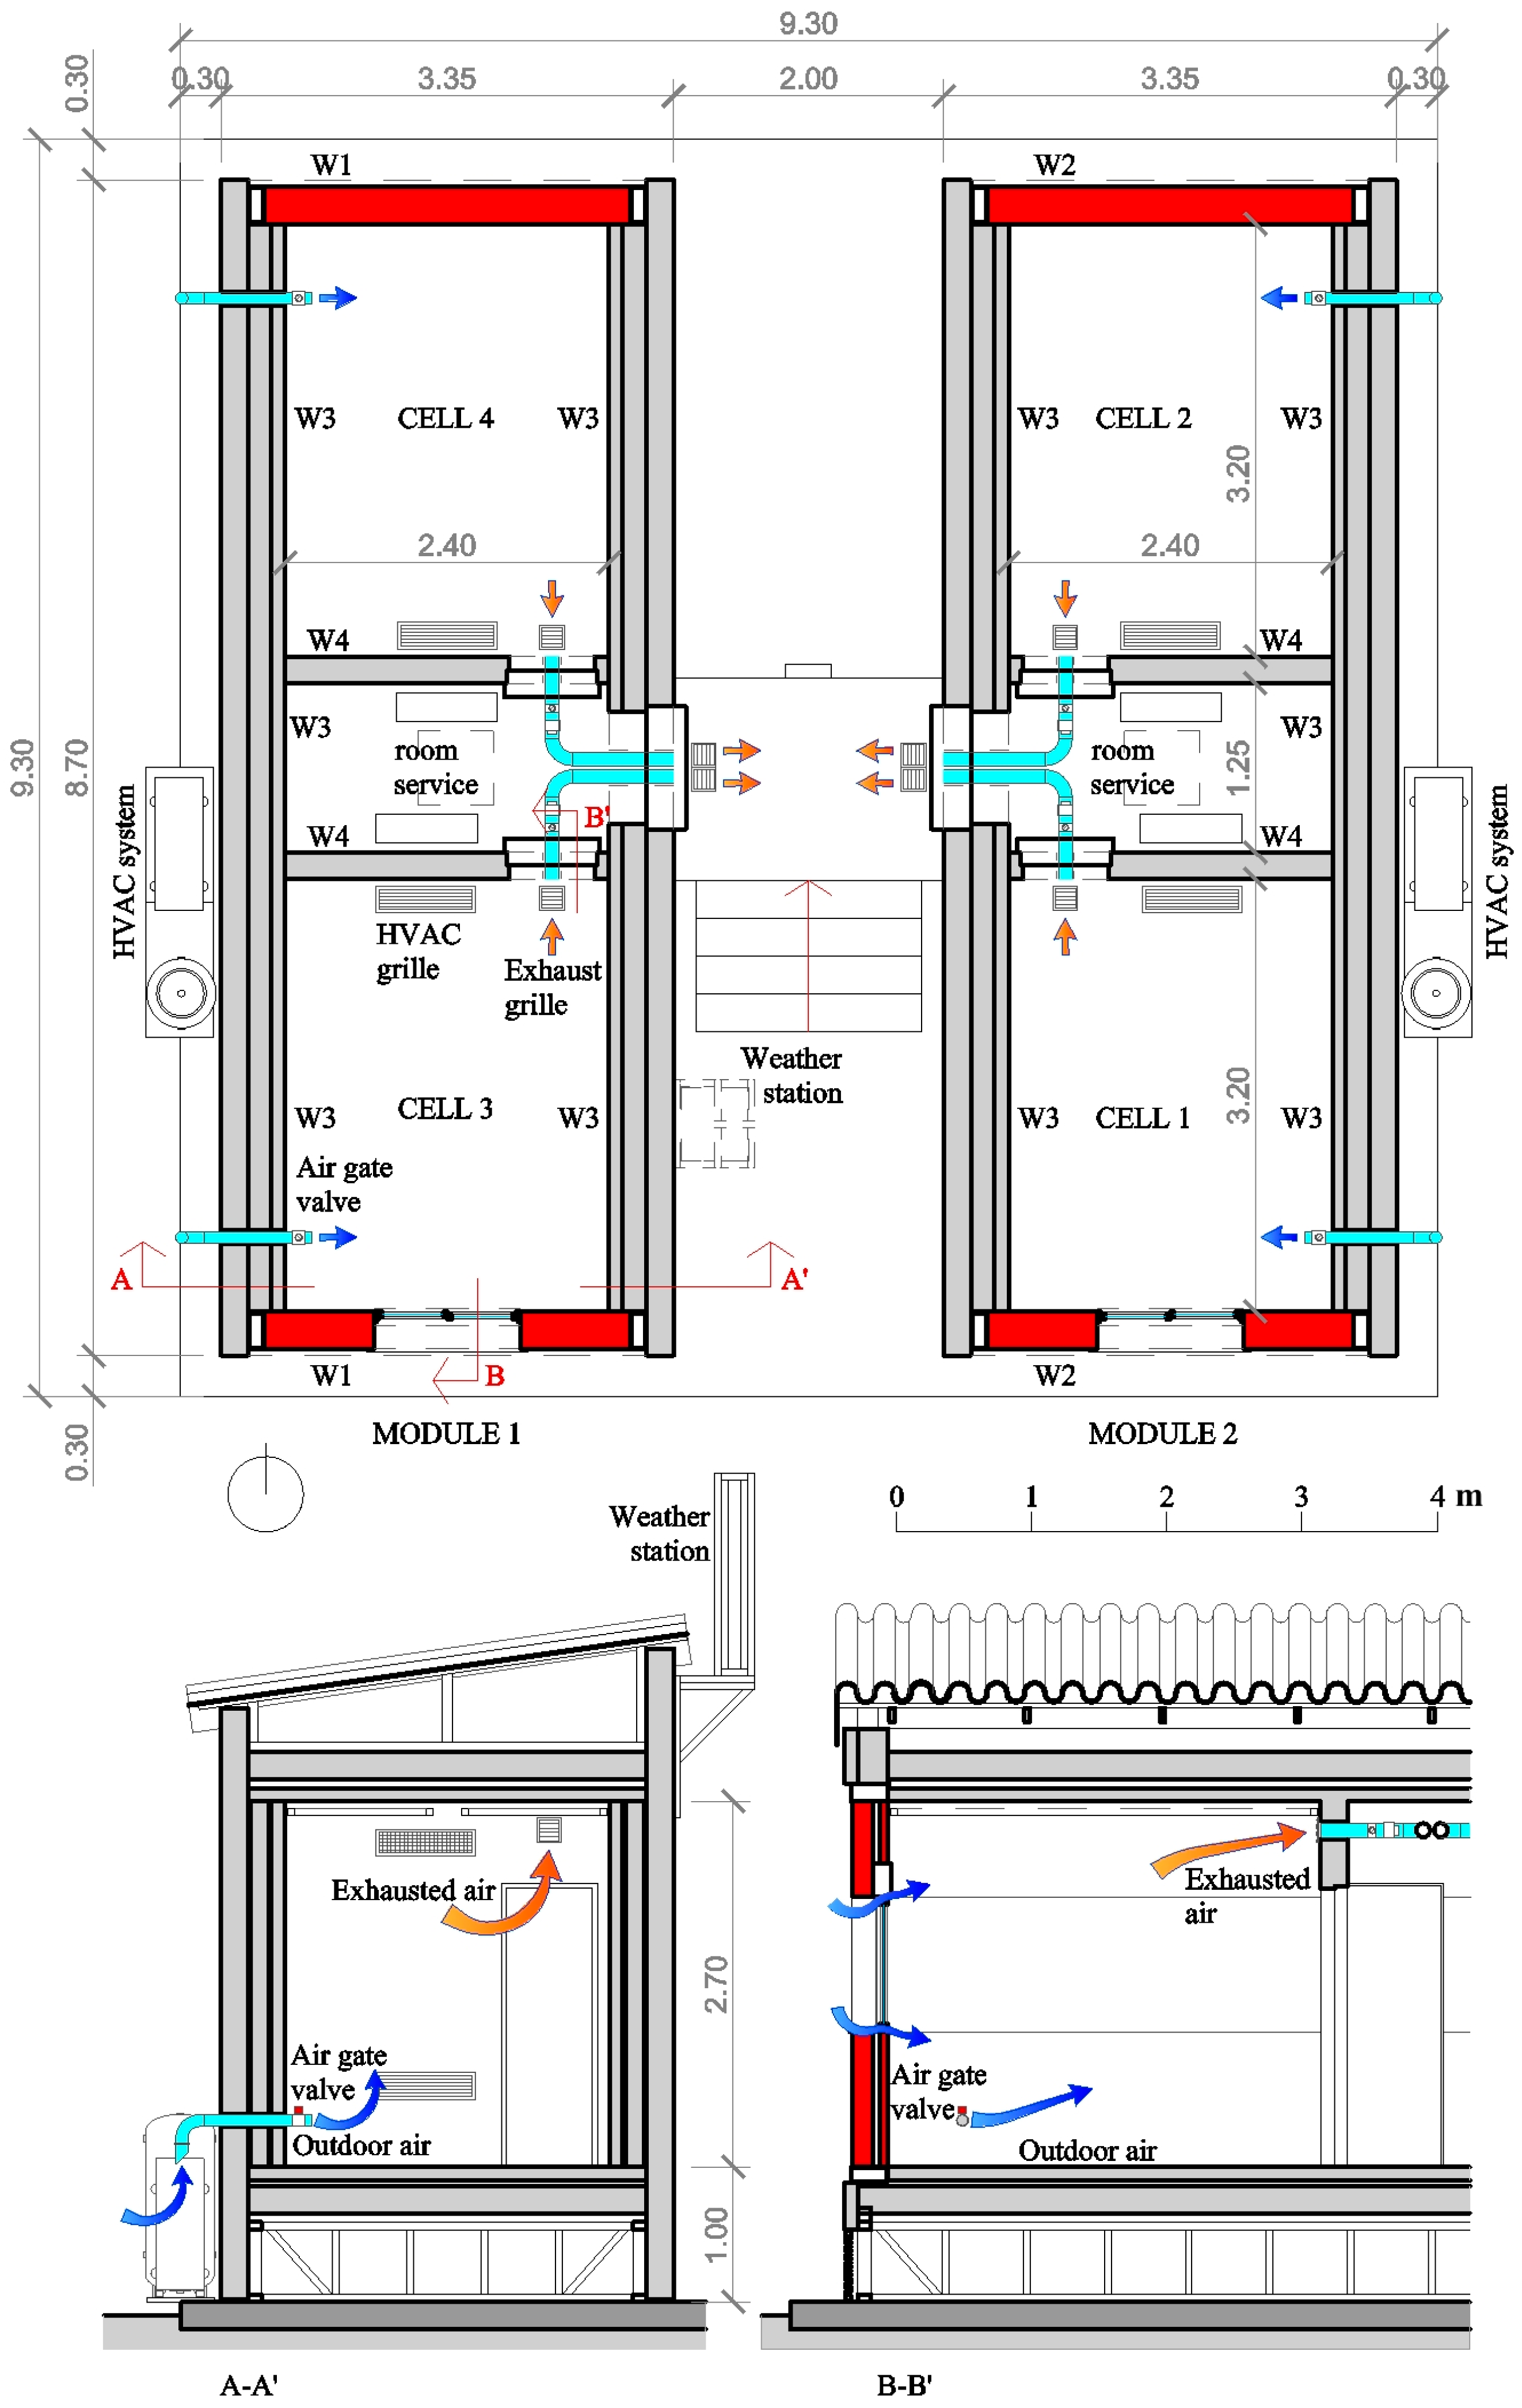
2.2. Spatial Description

The test cells are set up in two independent modules 90 cm off the ground and separated by an access area. Each module features two test cells facing different directions and separated by a service room for control systems, measurement equipment, and HVAC units. Each cell is an autonomous system that reproduces a housing space, with an open information system, which can determine the performance of different construction solutions in the facades tested. Four cells, two facing south and two facing north, with interior dimensions of 2.40 m wide, 3.20 m deep, and 2.70 m high, are presented. In this way, two different construction solutions can be evaluated simultaneously for the same cardinal direction (Figure 3).

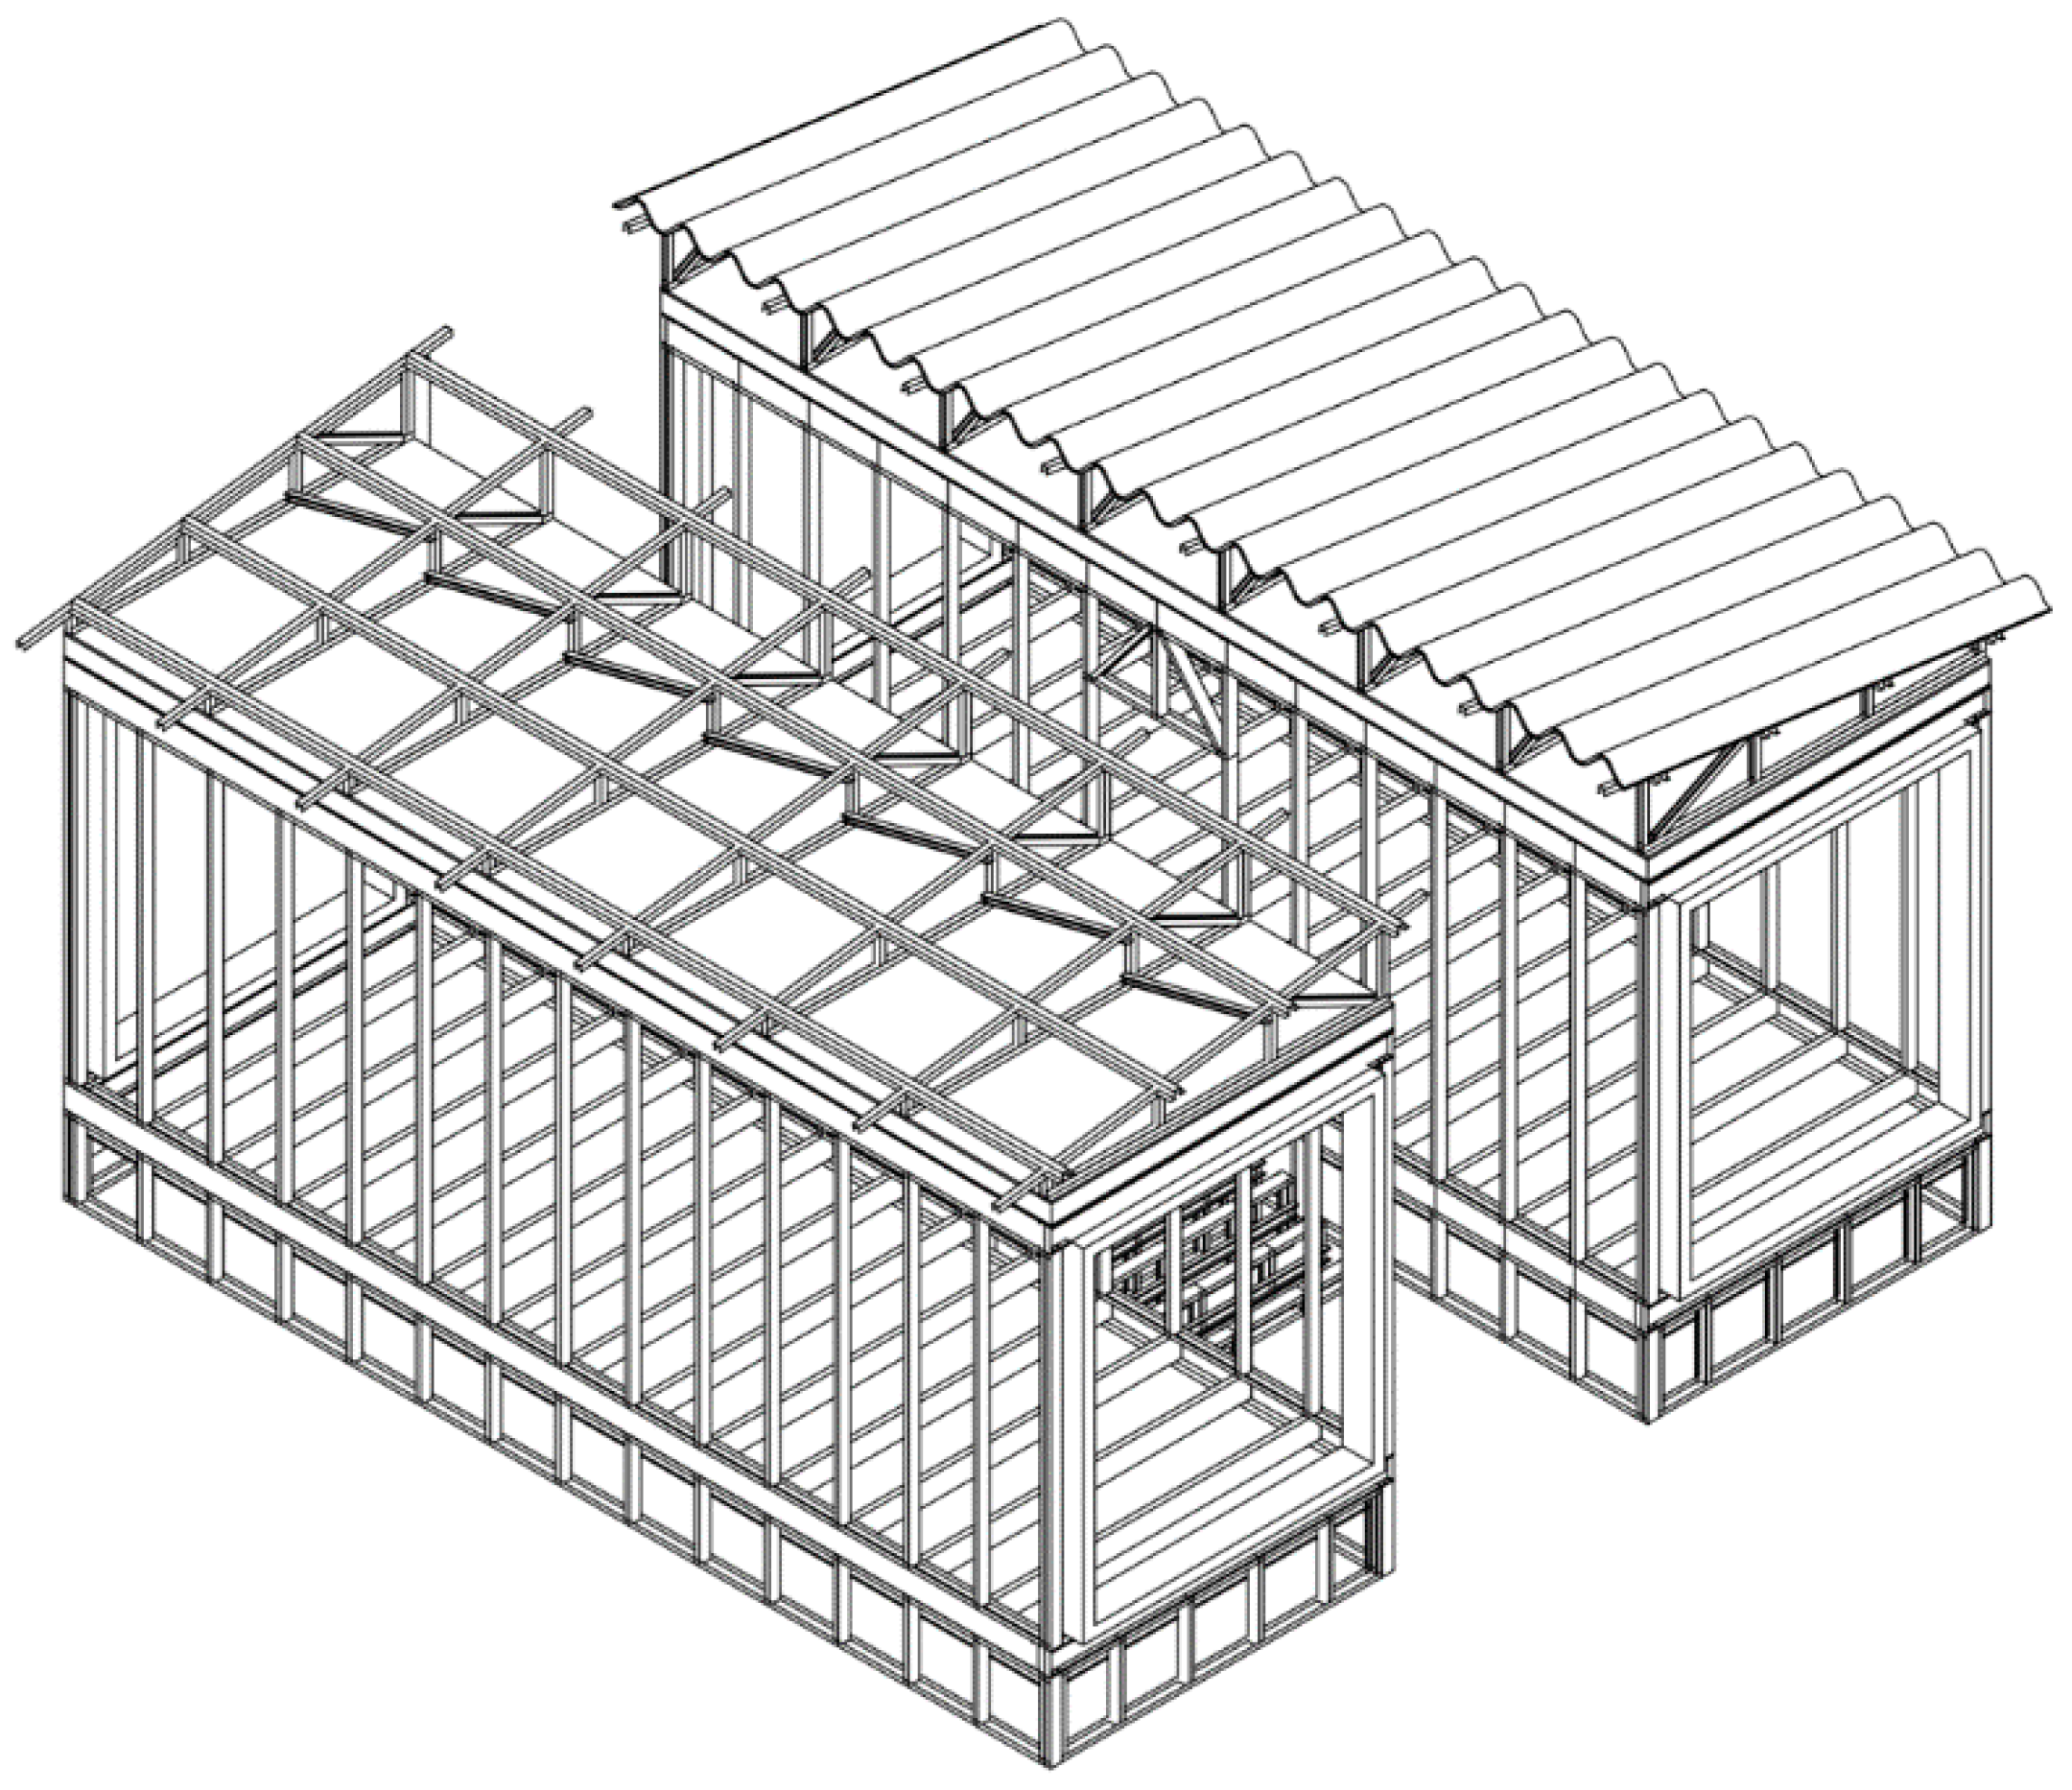
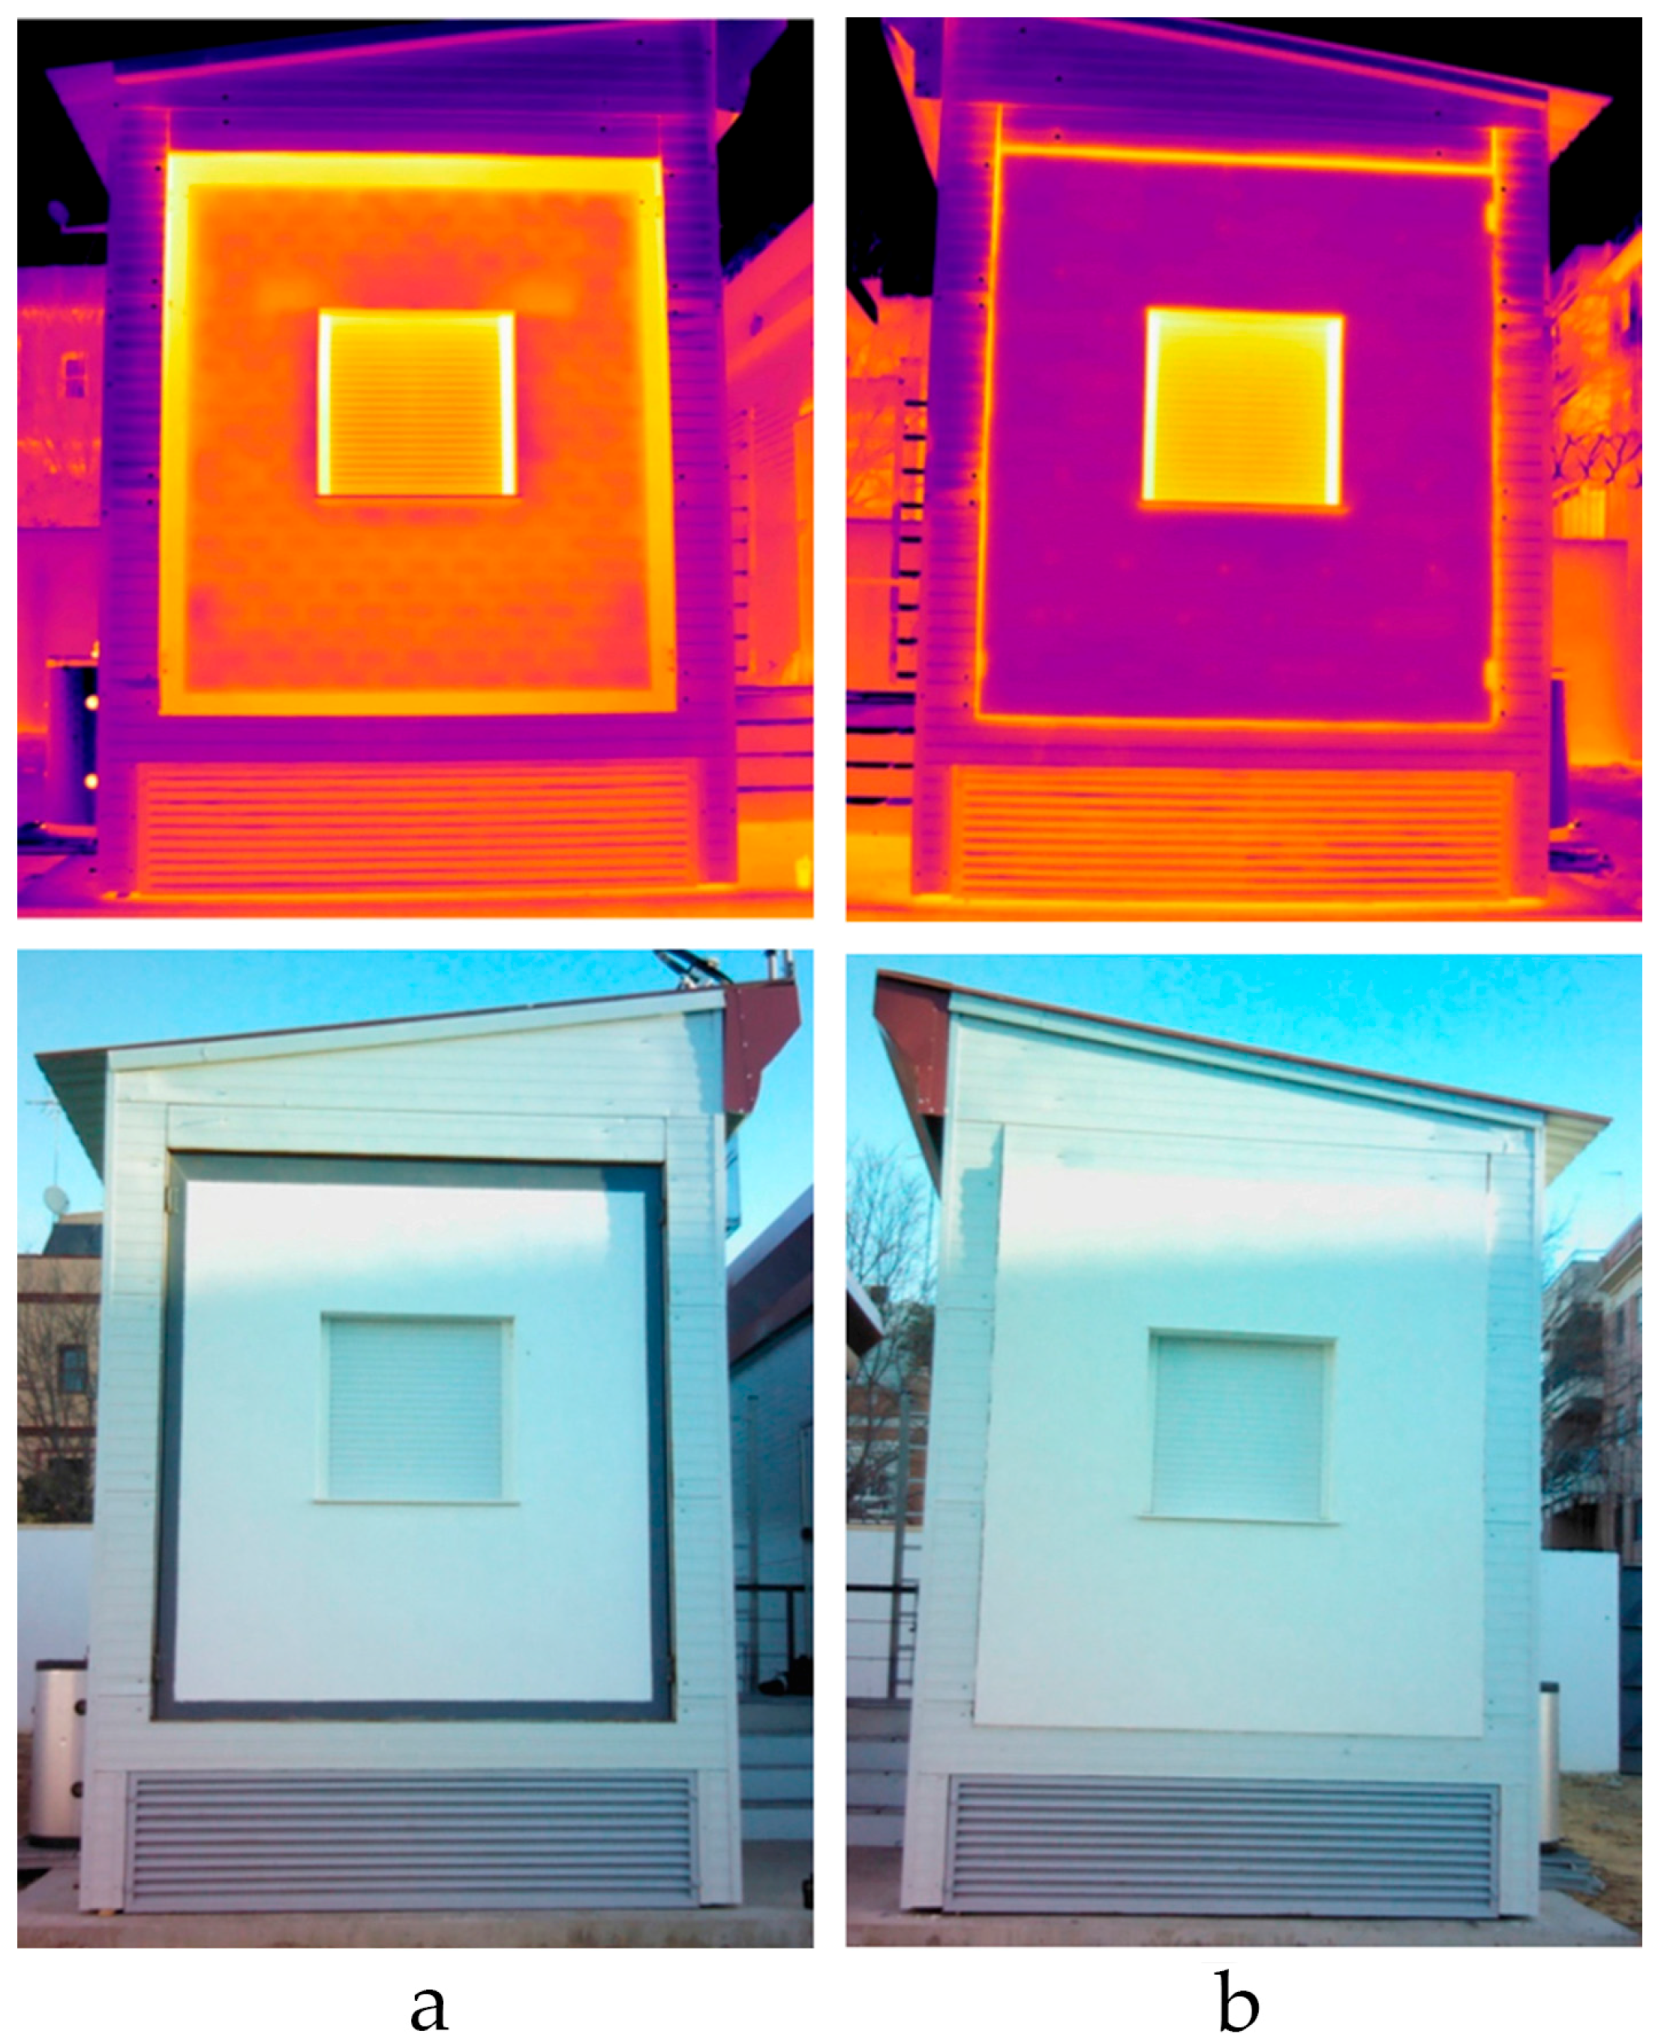
2.3. Constructive Characterization

The modules are light ‘steel frame’ structures (Figure 4), pinned to a 10-cm-thick squared reinforced concrete slab measuring 9.30 × 9.30 m. Galvanized steel frames are cold-formed and used in the vertical building envelope as 100 mm frames and in the beams and joists as 200 mm profiles. The roof slope consists of trusses with 50 mm galvanized steel profiles, while omega profiles are used for the metallic belt structures, allowing them to support the galvanized and corrugated sheet panels used as roofs. The north and south facing facades include a metal frame made of 6 mm welded plates forming an L profile that supports the anchorage and installation of the different facade systems to be tested. The facade samples are built over a frame of steel tubes.
The thermal enclosure, consisting of the vertical envelope, the floor, and the roof, is made of high density sandwich panels, coloured in white, suitable as cold stores, and screwed to the steel frame structure. There is one interior panel that is 100 mm thick and another exterior panel that is 200 mm thick (both vertical and horizontal). The air chamber between infill pieces and metal studs is filled by wool rock panels at a density of 100 kg/m3, and the space is 160 mm thick (80 + 80 mm). The thermal transmittance (U-values) is 0.05 W/m2 K, which indicates a significant reduction of heat flow, with values that are not considered significant in the overall balance (Table 1).
For the flooring solution, 3 mm of non-slip black rubber is used, with cold storage pivot access doors, both to the modules and cells, and similar thermal characteristics to those of the opaque envelope.
The facade panels can be easily configured with different construction solutions executed over a tubular steel frame, fitting and screwing the steel frame on the north and south sides of the modules. Cells 3 and 4 of Module 1 reproduce the conditions of a traditional facade from a Mediterranean climate dwelling (UW1 = 1.43 W/m2 K). In contrast, cells 1 and 2 of Module 2 represent a retrofitted solution using the same base elements as the other module but adding an External Thermal Insulation Composite System (ETICS), consisting of a 50-mm-thick Expanded Polystyrene (EPS) panel (UW2 = 0.47 W/m2 K) (Table 1). Cells 1 and 3, facing south, have a window aperture of 116 × 108 cm with aluminium sliding carpentry, 4.8.4 double glazing (UO = 3.3 W/m2 K), and Polyvinyl Chloride (PVC) slatted shutters. Cells 2 and 4, facing north, are completely opaque (see Video 1 in the Supplementary Materials).

2.4. Ventilation and Air Conditioning System

Ventilation is a variable that especially affects energy demand, as well as the degree of ambient comfort and the accumulation of CO2, pollutants, and suspended particles. In the existing housing stock, ventilation usually comes from uncontrolled infiltrations through enclosures, whereas the current regulation of the Technical Building Code (CTE) [33] establishes the need to guarantee a minimum outdoor airflow through the use of a mechanical system.
Given that the proposed test cells were designed to emulate social housing bedrooms, natural and mechanical ventilation tests are carried out using an extraction fan corresponding to each room, with an air flow rate of 187 m3/h. In order to simulate natural ventilation, this fan generates air depression, allowing outdoor air into the room through the tested envelope. In the case of mechanical ventilation, a gate valve is opened to resemble the operation of an air inlet.
Each test module has an interior thermal control system, consisting of a reversible heat pump (air-water) and three fancoils: one per cell and a third one in the service room. This system also includes a buffer tank of 200 L capacity. The thermal capacities (cooling/heating) of the equipment are a production system of 5/5.5 kW, fancoils in the 2.5/3.5 kW tests cells, and a 1.87/2.53 kW fancoil in the service room. A hydronic system has been chosen to measure the thermal demand in each cell, as well as the final energy consumption. Demand measurement is possible thanks to thermal energy meters placed on each fancoil, whereas final electrical consumption is recorded by electricity meters.

2.5. Monitoring System

The interior monitoring system controls ambient conditions of interior air quality, lighting, consumption, and energy efficiency. A weather station placed over one of the experimental modules is used to monitor the exterior parameters.
The protocol established in EN ISO 7726:2001 [34] has been followed in the installation process for this system, considering a 5 min time interval for the reading of monitored data and recording historic tendencies.
Monitoring probes, sensors, and meters are organized into seven systems: one for the measurement of external ambient conditions, four for the test cells, and the remaining two for air-conditioning systems.
The system that measures the external ambient conditions is controlled by the weather station and is composed of sensors for the air temperature variables, relative humidity, carbon dioxide, velocity, wind direction, direct normal and diffuse solar irradiation, and illuminance.
Most of the systems of the four test cells are similar. Each is composed of a set of sensors that measures air temperature variables, relative humidity, carbon dioxide, illuminance, and the superficial temperature of the envelope, both interior and exterior.
Finally, the two systems related to the air-conditioning systems are identical to each other. They incorporate several sensors that record the power consumed, electricity intensity, voltage, velocity, and air temperature in the ventilation ducts, water temperature in the flow and return pipes of the heat pump, and flowmeters in the interior air-conditioning units.
The monitoring installation is made up of a star network for data collection, where a set of multi-parametric sensors carry out measurements of different ambient and energy variables. This information is regularly sent to data loggers, where it is temporarily stored and uploaded every 30 min to a File Transfer Protocol (FTP) server (Universidad de Sevilla, Seville, Spain) through the RedIris network of the University of Seville. Data stored in the FTP server is periodically sent to local computer equipment for processing and interpretation before it is imported to a standard Microsoft Excel 2016® (Microsoft, Redmond, WA, USA) spreadsheet.

Description of Monitoring Equipment Installation

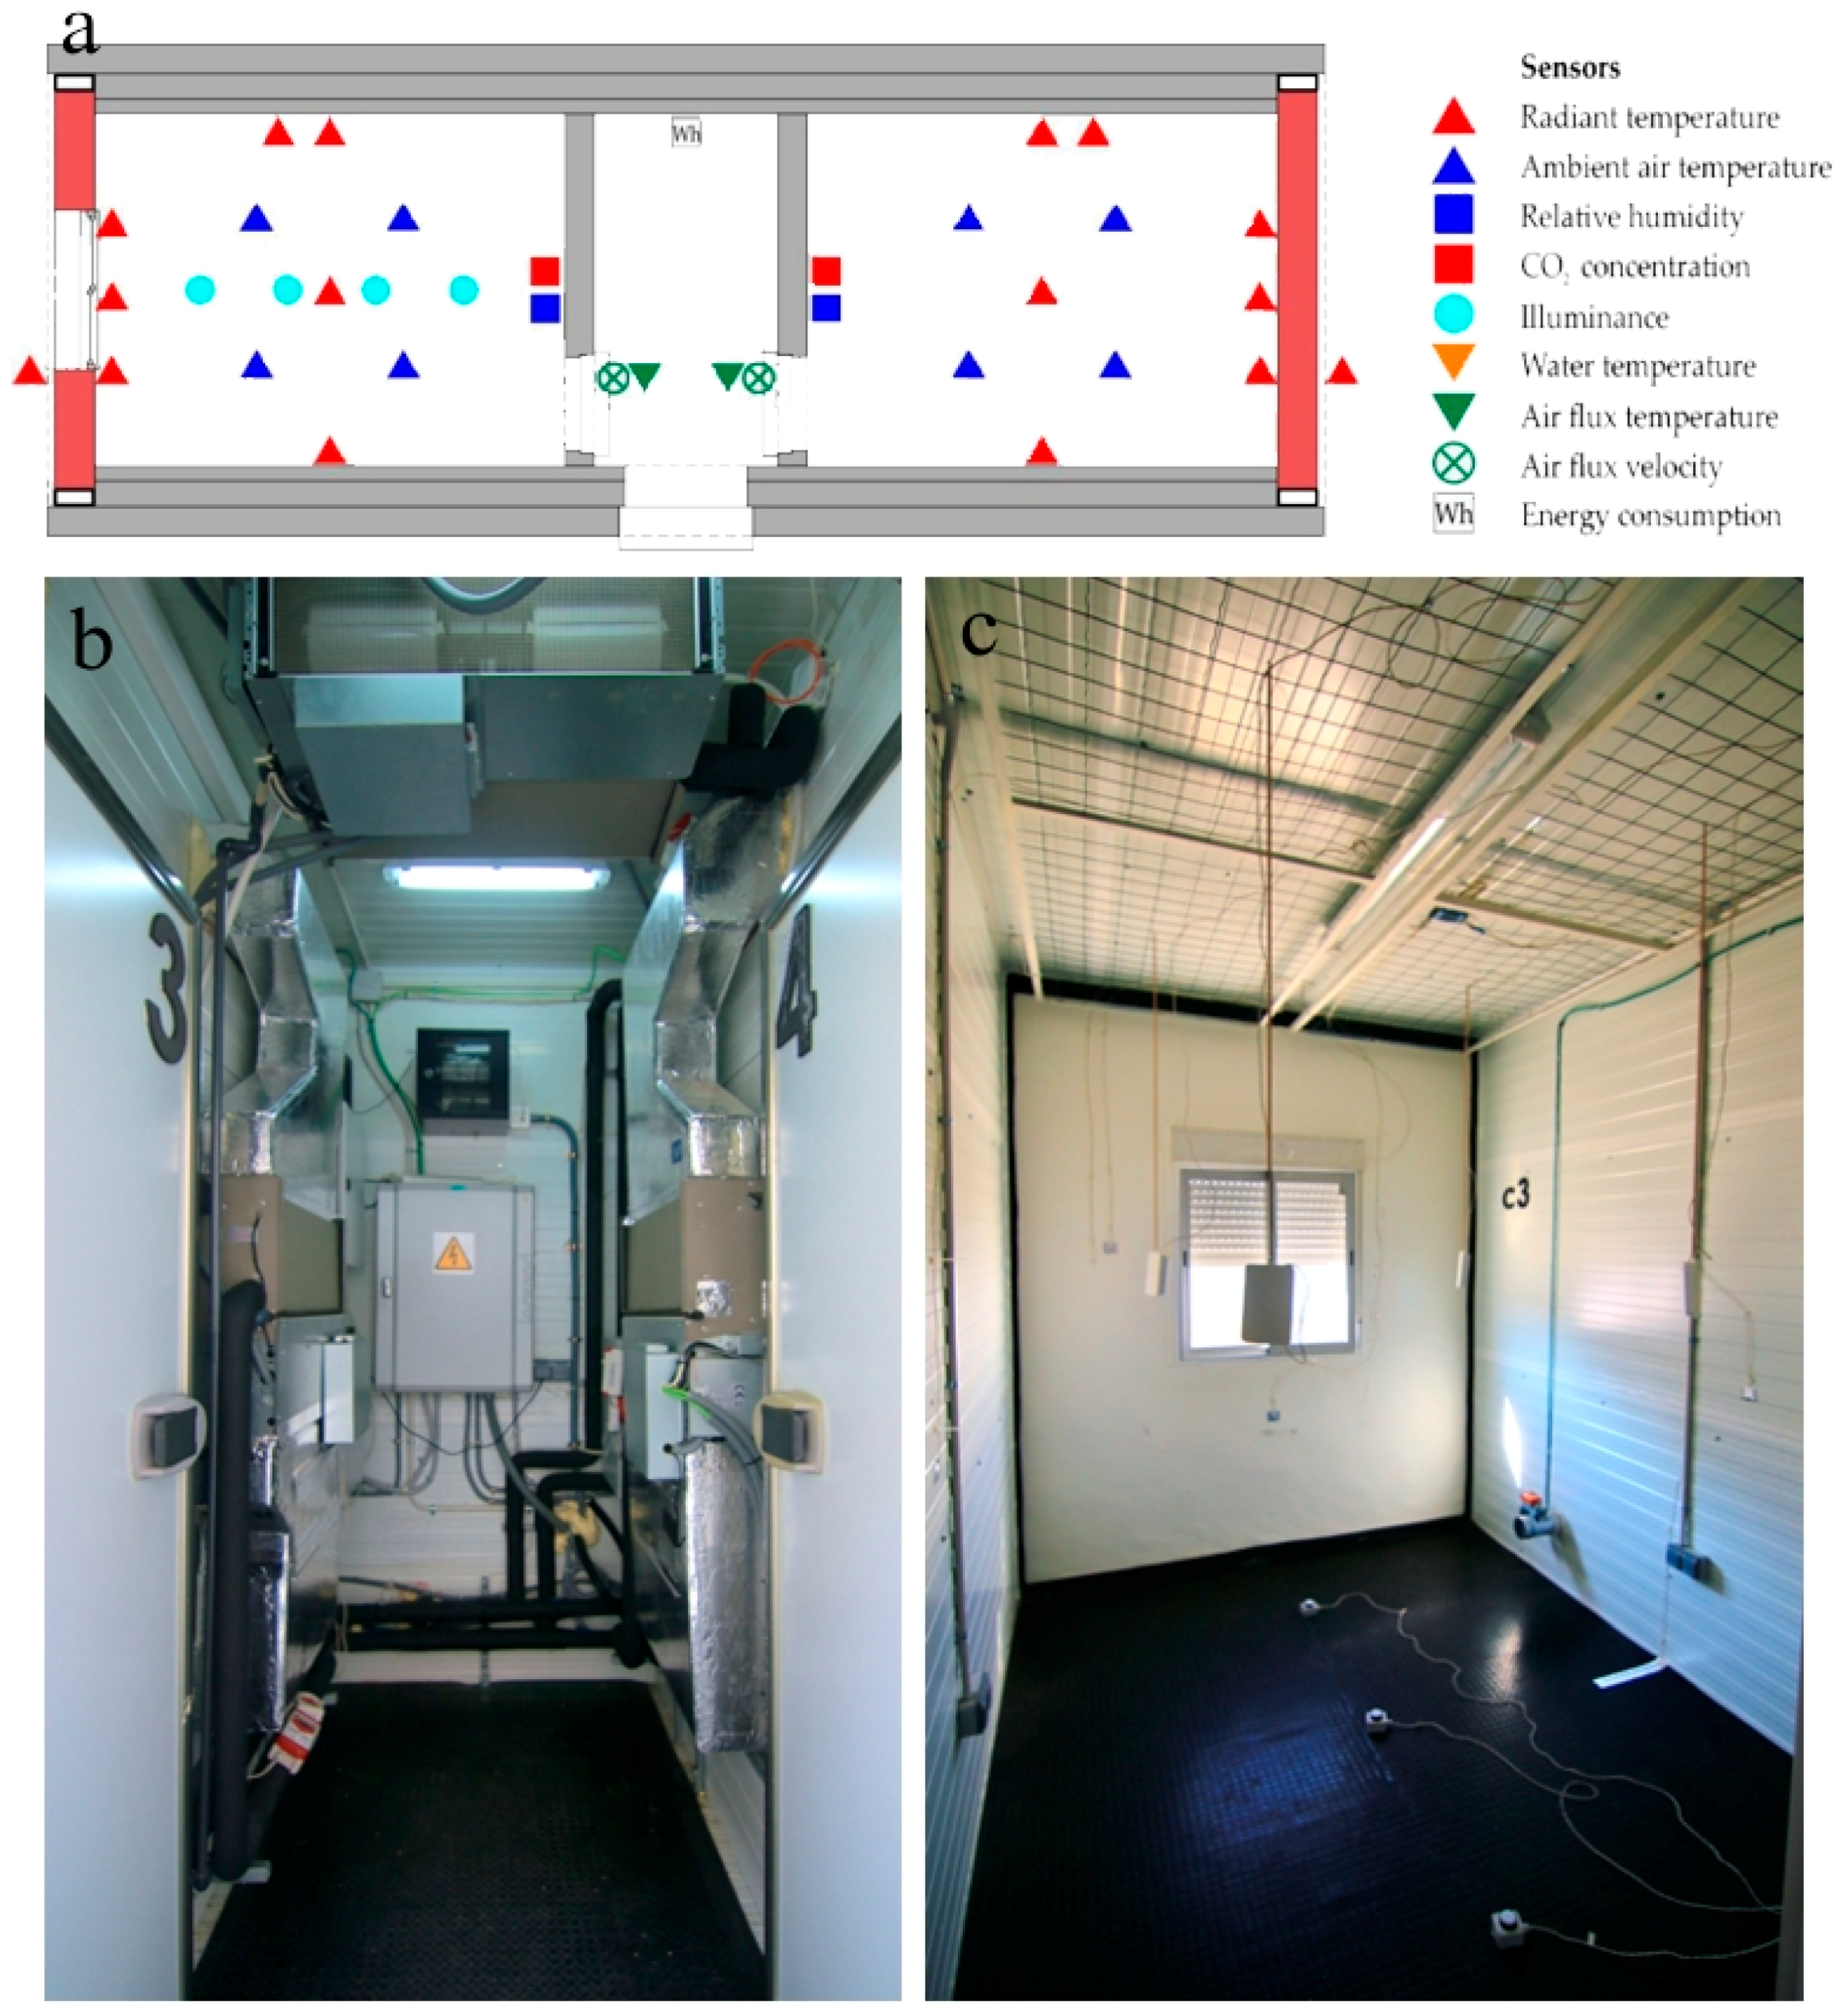
Measuring sensors used are as follows:
  • Test cells: ambient parameters (air temperature, velocity, relative humidity, CO2 levels, radiant temperature, and illuminance) are measured. The sensors hang from a metal false ceiling open cell type padded with PVC, to make it possible to have a measurement matrix (Table 2) (Figure 5).
  • Air conditioning systems: These are located in the service rooms between the test cells. Electrical consumption (power, intensity, and potential difference) is recorded, and data from the air extraction fan (air velocity and temperature) and from the water circuit feeding the fancoils (water flow rate and temperature) are also collected (Table 3).
  • Weather station: This is placed over an exterior metallic structure on top of Module 2 to measure the outdoor ambient parameters (air temperature and relative humidity in the north and south positions, air velocity and direction, CO2 levels, illuminance, and incoming solar radiation, both direct and diffuse) (Table 4).
The hubs and data loggers of each test cell, which receive measured data from the sensors, are situated in a cell panel located in the service rooms of both modules. These hubs are connected to an RJ45 plug assembled in a double superficial jack on the partial electrical power panel, connecting to the local Digital Visual Interface (DVI) network, which is in turn linked to the University of Seville campus network.
Data from the test modules can be easily downloaded from the FTP server or accessed via the Internet through an html portal. This portal also allows technical personnel to remotely access every probe and hub installed and to easily modify their configuration.

3. Cell Validation. Trials and Tests

3.1. Infiltration Tests

Enclosure pressurization/depressurization or Blower Door equipment can be used to measure the airtightness level of the envelope of the cells, following ISO standard 9972:2015 [35]. These tests consist of decreasing the pressure of the room with a fan and extracting air until the differential pressure between indoor and outdoor is stabilized by the air entering through the envelope cracks. The differential pressure is then decreased by lowering the fan speed in steps, thus obtaining a regression curve of the differential pressure/extracted airflow relation.
The equipment used in these tests is the Minneapolis Blower Door Model 4/230 V System (The Energy Conservatory, Minneapolis, MN, USA), controlled by TECTITE Express software (The Energy Conservatory, Minneapolis, Minnesota, United States of America). Since the highest pressure difference recommended by ISO 9972:2015 for these tests is at least ±50 Pa, this study was performed with a maximum differential pressure value of ±70 Pa.
The airtightness measurements were performed by installing the Blower Door in the doors of the inner test cells, and the following test procedure was developed:
  • Test 1 (t1): Both the window and the air gate valve are closed.
  • Test 2 (t2): Both the window perimeter and the air gate valve are closed and sealed.
It should be noted that, in order to ensure the airtightness of the test cells, which is essential for the development of future work, the joint points have been sealed after the construction process to guarantee adequate tightness conditions.

3.2. Thermographic Tests

Infrared images were taken to visualize and value the heat flow through the facade examples for each test cell. The equipment used in these tests is a FLIR T620bx infrared camera (FLIR Systems, Wilsonville, OR, USA) with a thermal resolution of 640 × 480 pixels; a FLIR MR77 psychrometer (FLIR Systems, Wilsonville, OR, USA) to simultaneously measure air temperature and relative humidity; and a laser distance measure LEICA Disto™ D5 (Leica Geosystems AG, Sankt Gallen, Switzerland) to consider the atmospheric attenuation of solar radiation in relation to distance.
Measurements were conducted following the procedure established in EN 13187 [36] for image recording and ISO 18434-1 [37] for the previous measurement of the reflected apparent temperature (reflector method).
During testing, the indoor and outdoor ambient conditions were as shown in Table 5. In order to guarantee an adequate thermal flow in the facades analysed, images were registered prior to the heating of the exterior surfaces by solar radiation and considering dry surfaces. Furthermore, the interior temperature of the cells was maintained at an average of 28.5 °C over exterior temperatures during the 48 h previous to measurements.

4. Results. Performance Analysis

4.1. Analysis of Infiltration Test Results

Initially, the sealing of the panel joints after the construction process mentioned above showed that there was an average reduction of infiltrations of around 65.3%, with a standard deviation of 9.2%. This means that suitable treatment of these joints is essential to the proper operation of the cell.
Secondly, as can be seen in Table 6, the infiltration rates obtained for the finished test cells under normal conditions show that the airtightness of these rooms (t1) is remarkable. It presented an average infiltration value of 4.6 Air Changes per Hour (ACH) for ±50 Pa, with a standard deviation of 1.0 ACH, and 3.9 ACH with a standard deviation of 1.0 ACH when the window and the air gate valve were sealed (t2).
When the average infiltration rate for these test cells is analysed and compared with other standards and measured values, as shown in Table 7, the average value observed is over 60% less than that established in the technical conditions document for the application of the Spanish energy certification tools in existing houses (HULC) [38], according to the Technical Building Code [39]. When this value is contrasted with the average airtightness value measured in existing social houses in the Mediterranean [40], it can be observed that the average test cell value is only 20% less than that obtained for the existing social houses. Therefore, it can be concluded that the airtightness conditions of the test cells tend to be close to those obtained from measurements of existing social houses in the Mediterranean.

4.2. Thermal Radiation Evaluation

Figure 6 shows infrared (a, b) and visual (c, d) images of the south facades of cells 1 and 3, taken in the same ambient conditions. The images on the left correspond to the original solution wall (cell 3), while those on the right show the rehabilitated facade (cell 1), which incorporates the External Thermal Insulation Composite Systems (ETICS) insulation system. Both envelopes have the same exterior surface finish (painted cement mortar), with 0.95 emissivity. The reflected apparent temperature on the exterior was 5.7 °C. The thermal gap between interior and exterior ambient temperature was 28.1 °C (cell 3) and 28.6 °C (cell 1).
Using the infrared images analysis tool Flir Tools+ (FLIR Systems, Wilsonville, OR, USA) [41], the radiant temperatures of the external surfaces in both hypotheses have been evaluated: (a) considering only the homogeneous opaque part and (b) taking into account all the parts of the envelope (homogenous opaque part, the window aperture, and the perimeter thermal bridge). Table 8 indicates the average surface temperature (TSE), the thermal bridge between interior-exterior ambient (ΔT), and the heat flow per unit area (Φ), assuming a steady regime for each facade and hypothesis. The heat flow per unit area is defined as:
Φ = ε · σ · ( T S E 4 T r e f 4 ) + h · ( T S E T A )
In Equation (1), ε is is the emissivity, σ is the Stefan–Boltzmann constant, Tref is the reflected apparent temperature (K), TSE is the surface temperature (K), and TA is the outdoor temperature (K). The convective coefficient (h), considered to estimate heat transfer due to an exterior convection effect, was 8 W/m2 K, according to standard ISO 6946:2007 [42], considering a wind speed equal to 1 m/s.
According to the information presented in Table 8, and considering the entire wall (case b), the heat flows show that the original facade wall displays slightly more than double the losses of the retrofitted solution, which means a 56.5% reduction in flow in the retrofitted case. When exclusively considering the opaque section of the wall (case a), the retrofitted facade presents a reduction in superficial heat flow of around 67.4% compared with the original solution.

4.3. Temperature Evaluation

The evolution throughout a week of the outdoor temperatures, average indoor temperatures for each cell, and the global solar radiation (W/m2) inciding on the facades is obtained from the monitored data and represented in Figure 7. Table 9 and Table 10 show the maximum outdoor temperature and sol-air temperature [43] values, as well as the time lag (hours) between the moments of maximum outdoor and indoor temperature. Data are recorded during a period of free running or, in other words, without the influence of air conditioning systems.
As expected, the influence of solar radiation, as well as the existence of a window aperture, lead to much higher indoor thermal oscillations in test cells facing south (cells 1 and 3), when compared to north-facing cells (cells 2 and 4). In south-facing cells, the implementation of the ETICS insulation system (cell 1) entails greater attenuation of the thermal wave; around 2 °C compared to the cell without thermal insulation (cell 3). In north-facing modules, since there is no influence from direct solar radiation or window aperture, differences in temperature attenuation between the cell with the ETICS system (cell 2) and its partner (cell 4) are slightly lower (up to 1.5 °C).
In Figure 8, an instant cooling load (W) for each cell can be observed, as well as for the modules overall, over a five-day period. The temperature set point was 25 °C. The thermal power of each module corresponds to the sum of each of its cells (Module 1: cells 1 and 2; Module 2: cells 3 and 4). As can be seen, the demands of Module 1 (retrofitted facades) are appreciably lower than those of Module 2 (original facades) by approximately 15%. However, when the results of each cell are analysed, those facing South (cells 1 and 3) have very similar demands (1%) due to the influence of the window aperture, which minimizes the effect of the opaque part. In contrast, in north-facing cells with no window apertures, the differences in demand are much more significant (27%).

5. Conclusions

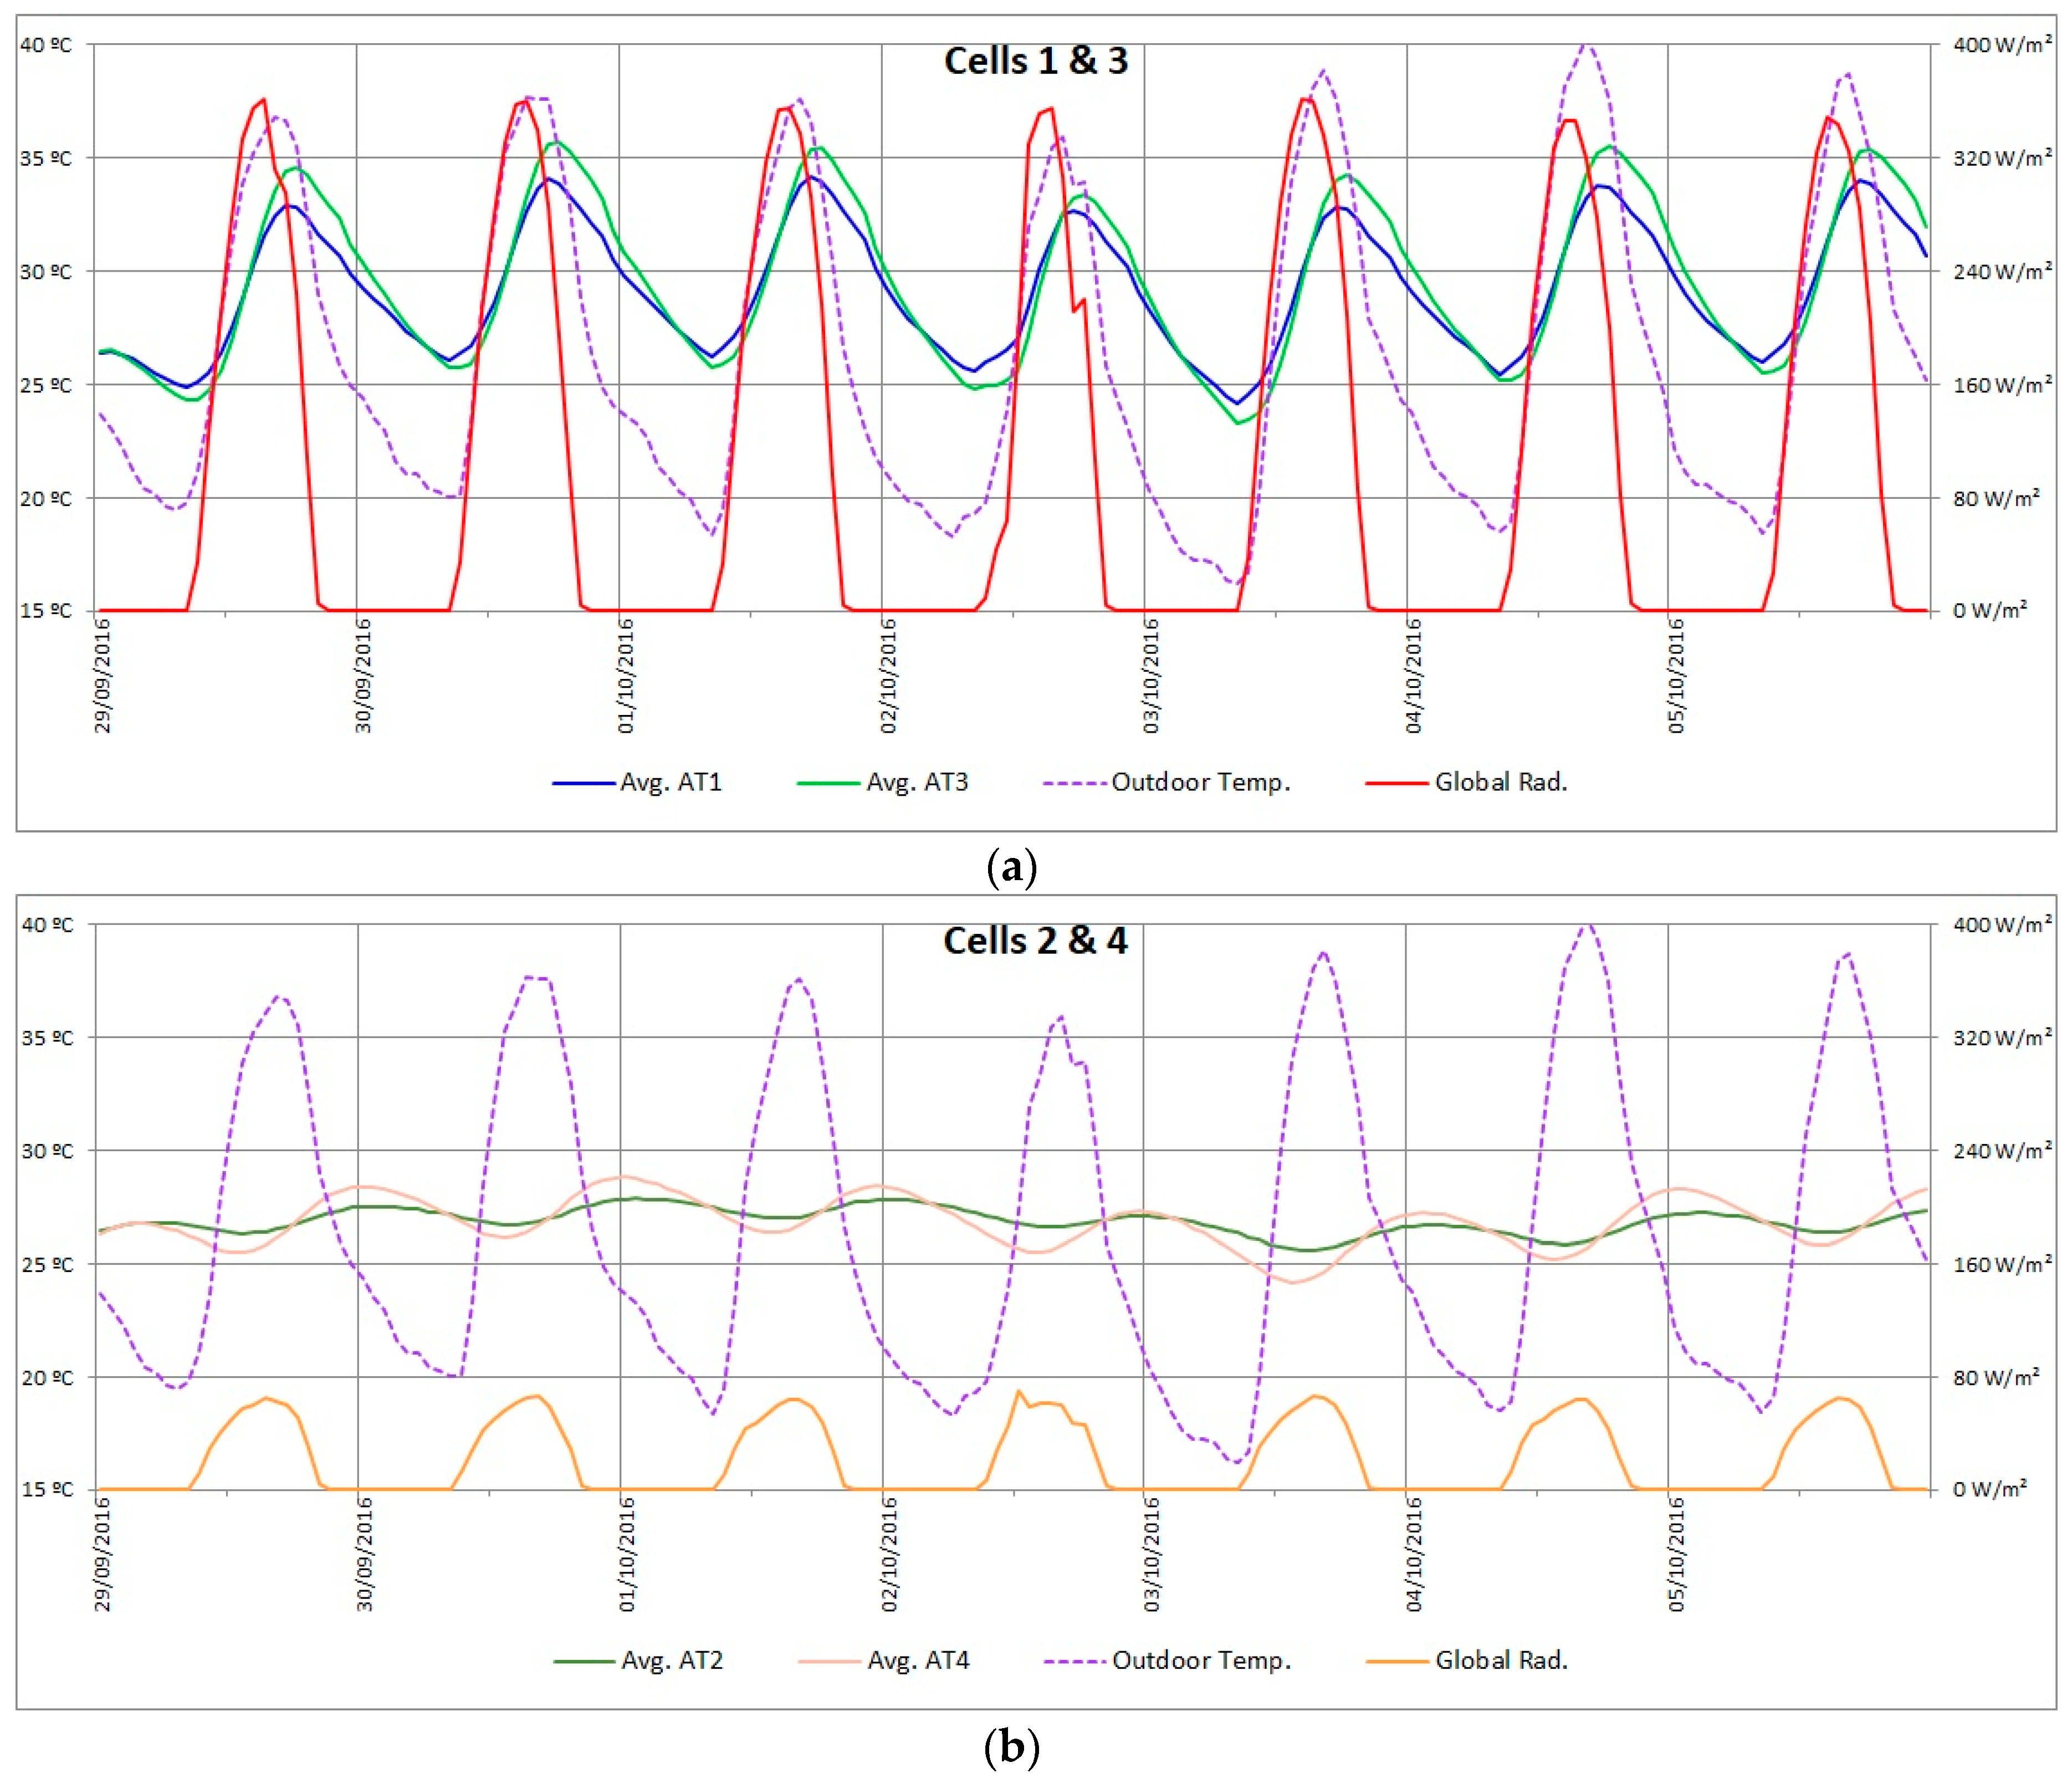
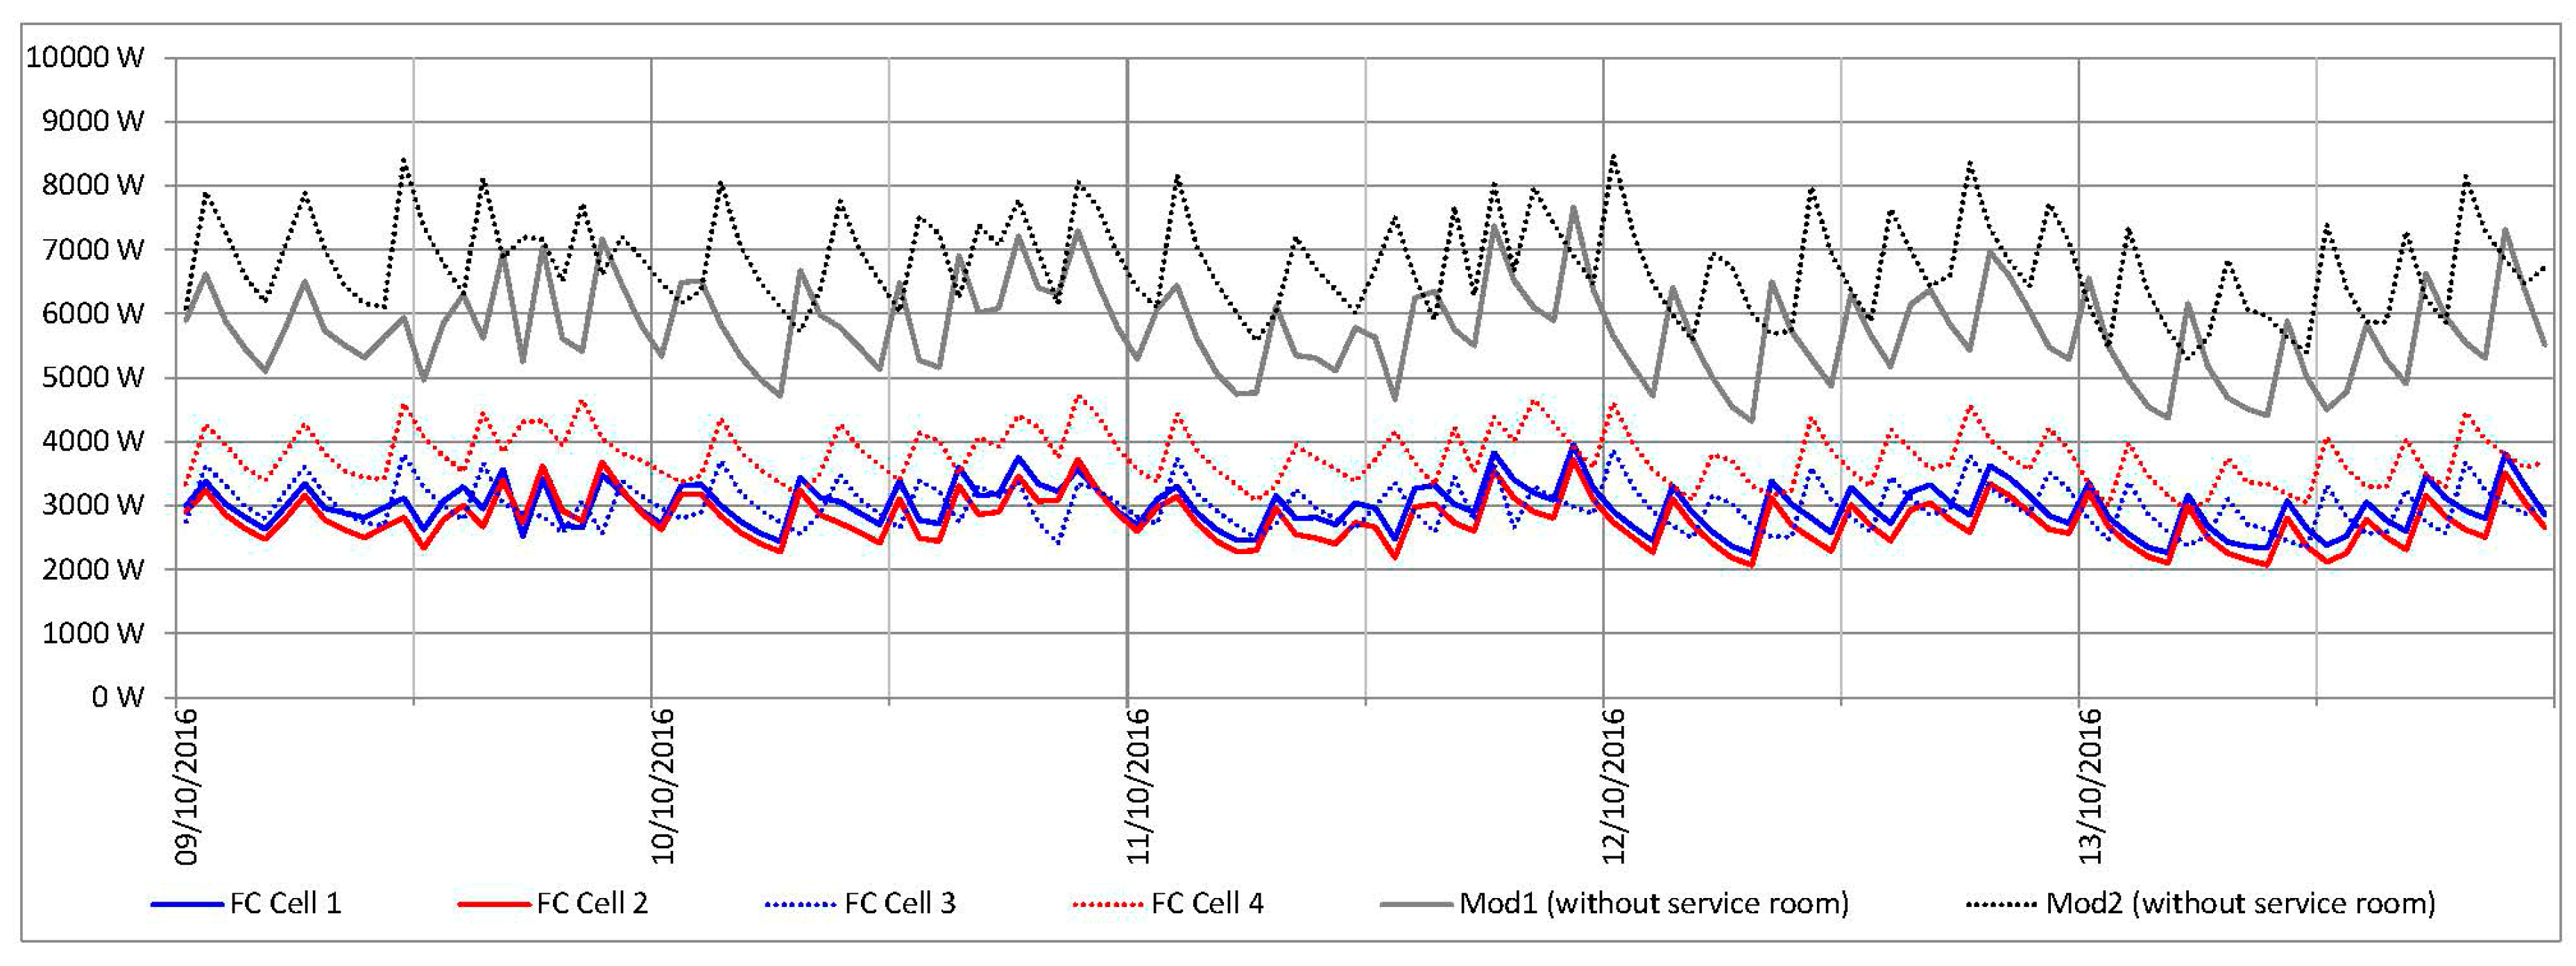
The use of test cells provided precise and tangible information to determine improvements in ambient conditions in retrofitted processes for dwellings located in a Mediterranean climate, without the influence of users. This made it possible to simultaneously evaluate demand conditions, energy consumption, and thermal comfort, comparing results both in the original solution and the retrofitted one.
The equipment in the test cells, composed of an extensive range of sensors and data acquisition systems, offers a wide variety of tests, obtaining essential empirical data on the ambient and energy variables, as well as their evolution over time. This data set will be used as an initial tool to validate and adjust energy and lighting simulation models for the more detailed and accurate use of these tools and the extrapolation of results to other climate zones and cardinal directions. The analysis of the results, combined with statistical tools, allows correlations to be established between the different variables monitored. This contributes to the optimization of retrofitted solutions in vertical envelopes, as well as the design conditions of air conditioning and lighting systems, before acting on real buildings. Moreover, all this will foster a reduction in economic costs, aiming to optimize thermal and lighting comfort conditions, as well as energy use in air conditioning and lighting installations in dwellings.
Although equipment construction must resolve some of the problems detected, including thermal bridges and infiltrations, it ensures a wide and complete operating range in realistic climate conditions with valuable and representative results of dynamic performance.

Supplementary Materials

The following are available online at www.mdpi.com/1996-1073/10/11/1816/s1, Video S1: Construction Process Video.

Acknowledgments

The results presented were funded by the government of Spain through the research and development projects ‘Energy Rehabilitation of tertiary buildings in Mediterranean climate by optimizing Solar Protection Systems’ (ref BIA2014-53949-R) and ‘Energy and environmental refurbishment of social housing in Andalusia: Evaluation with test cells’ (ref G-GI3003/IDIR). The authors wish to express their gratitude for all the technical and financial support provided.

Author Contributions

Ángel Luis León-Rodríguez, Rafael Suárez, and David Moreno-Rangel conceived and designed the experiments; Ángel Luis León-Rodríguez, Pedro Bustamante, David Moreno-Rangel, and Miguel Ángel Campano performed the experiments; Ángel Luis León-Rodríguez, Rafael Suárez, Pedro Bustamante, and Miguel Ángel Campano analysed the data; and all authors have written, reviewed, and approved the final manuscript.

Conflicts of Interest

The authors declare no conflicts of interest.

References

  1. Directive 2012/27/EU of the European Parliament and of the Council. Available online: http://eur-lex.europa.eu/legal-content/EN/TXT/PDF/?uri=CELEX:32012L0027&from=EN (accessed on 12 April 2016).
  2. Jaggs, M.; Palmer, J. Energy performance indoor environmental quality retrofit—A European diagnosis and decision making method for building refurbishment. Energy Build. 2000, 31, 97–101. [Google Scholar] [CrossRef]
  3. Spanish Royal Decree 2429/1979. Approving the Basic Building on Thermal Conditions in Buildings NBE-CT-79. BOE Núm. 253. 6 July, pp. 24524–24550. Available online: https://www.boe.es/diario_boe/txt.php?id=BOE-A-1979-24866 (accessed on 19 April 2017).
  4. Sech-Spahousec Project (Analysis of the Energy Consumption in the Spanish Households). Available online: http://www.idae.es/uploads/documentos/documentos_Informe_SPAHOUSEC_ACC_f68291a3.pdf (accessed on 12 April 2016).
  5. Sendra, J.J.; Domíngez-Amarillo, S.; Bustamante, P.; León, A.L. Energy intervention in the residential sector in the south of Spain: Current challenges. Informes de la Construcción 2013, 65, 457–464. [Google Scholar] [CrossRef]
  6. Spanish Royal Decree RD 233/2013. Available online: https://www.boe.es/boe/dias/2013/04/10/pdfs/BOE-A-2013-3780.pdf (accessed on 19 April 2017).
  7. European Commission Official Website. Available online: http://ec.europa.eu/research/participants/portal/desktop/en/opportunities/h2020/topics/eeb-07–2015.html (accessed on 19 April 2017).
  8. Escandón, R.; Suárez, R.; Sendra, J.J. Protocol for the energy assessment of social housing stock: The case of Southern Europe. Energy Procedia 2016, 96, 907–915. [Google Scholar] [CrossRef]
  9. Dascalaki, E.G.; Droutsa, K.G.; Balaras, C.A.; Kontoyiannidis, S. Building Typologies as a Tool for Assessing the Energy Performance of Residential Buildings—A Case Study for the Hellenic Building Stock. Energy Build. 2011, 43, 3400–3409. [Google Scholar] [CrossRef]
  10. Cuerda, E.; Pérez, M.; Neila, J. Facade Typologies as a Tool for Selecting Refurbishment Measures for the Spanish Residential Building Stock. Energy Build. 2014, 76, 119–129. [Google Scholar] [CrossRef] [Green Version]
  11. Caputo, P.; Costa, G.; Ferrari, S. A supporting method for defining energy strategies in the building sector at urban scale. Energy Policy 2013, 55, 261–270. [Google Scholar] [CrossRef]
  12. Zero Carbon Hub, Closing the Gap between Designed and Built Performance, London. 2010. Available online: www.zerocarbonhub.org (accessed on 25 May 2017).
  13. IEA ECBCS Annex 43—Testing and Validation of Building Energy Simulation Tools. Available online: http://www.ecbcs.org/annexes/annex43.htm (accessed on 25 May 2017).
  14. Blázquez, T.; Suárez, R.; Sendra, J.J. Towards a calibration of building energy models: A case study from the Spanish housing stock in the Mediterranean climate. Informes de la Construcción 2015, 67, e128. [Google Scholar] [CrossRef]
  15. Gicquel, R. The Project PASSYS. In Solar Energy Applications to Buildings and Solar Radiation Data; Springer: Brussels, Belgium, 1988; Volume 3, pp. 167–178. [Google Scholar]
  16. Strachan, P. Model Validation using the PASSYS Test Cells. Build. Environ. 1993, 28, 153–165. [Google Scholar] [CrossRef]
  17. Wouters, P.; Vandaele, L. The PASSYS Services—Summary Report of the PASSYS Project; EC, DG XII for Science, Research & Development, EUR 15113 EN; European Commission, Belgian Building Research Institute: Brussels, Belgium, 1994. [Google Scholar]
  18. DYNASTEE. Available online: www.paslink.org (accessed on 12 April 2017).
  19. DYNASTEE. Available online: http://dynastee.info/ (accessed on 21 May 2017).
  20. Bloem, J.J.; Baker, P.H.; Strachan, P.; Madsen, H.; Vandaele, L. DYNASTEE—Dynamic Testing, Analysis and Modelling. In Stimulating Increased Energy Efficiency and Better Building Ventilation. Leading Actions Coordinated by INIVE EEIG and Sources of Other Relevant Information on EU Level and IEA ECBCS Projects; Papaglastra, M., Wouters, P., Eds.; INIVE EEIG: Brussels, Belgium, 2010; pp. 473–496. [Google Scholar]
  21. Clarke, J.A.; Janak, M.; Ruyssevelt, P. Assessing the overall performance of advanced glazing systems. Sol. Energy 1998, 63, 231–241. [Google Scholar] [CrossRef]
  22. Strachan, P.A.; Vandaele, L. Case Studies of Outdoor Testing and Analysis of Building Components. Build. Environ. 2008, 43, 129–142. [Google Scholar] [CrossRef] [Green Version]
  23. Saxhof, B. (Ed.) IEA Solar Heating and Cooling Task 13 Final Report: Component and System Testing; DTU: Copenhagen, Denmark, 1995; ISBN 87-984610-3-6. [Google Scholar]
  24. Bloem, J.J. Evaluation of a PV integrated building application in a well-controlled outdoor test environment. Build. Environ. 2016, 43, 205–216. [Google Scholar] [CrossRef]
  25. Manz, H.; Loutzenhiser, P.; Frank, T.; Strachan, P.A.; Bundi, R.; Maxwell, G. Series of Experiments for Empirical Validation of Solar Gain Modeling in Building Energy Simulation codes—Experimental Setup, Test Cell Characterization, Specifications and Uncertainty Analysis. Build. Environ. 2006, 41, 1784–1797. [Google Scholar] [CrossRef] [Green Version]
  26. Alcamo, G. Daylight distribution and thermo-physical evaluation of new facade components through a test cell for the overheating control in Mediterranean Climate. In Proceedings of the 5th International Conference SOLARIS, Brno, Czech Republic, 10–11 August 2011. [Google Scholar]
  27. Fraunhofer Institute for Building Physics. Twin Research in Building Physics. Available online: http://www.ibp.fraunhofer.de/en/Press/Research_in_focus/Archives/April_2014_twin_research.html (accessed on 21 May 2017).
  28. Roche, P.; Milne, M. Effects of Window Size and Thermal Mass on Building Comfort Using an Intelligent Ventilation Controller. Sol. Energy 2004, 77, 421–434. [Google Scholar] [CrossRef]
  29. Alonso, C.; Oteiza, I.; García-Navarro, J.; Martín-Consuegra, F. Energy consumption to cool and heat experimental modules for theenergy refurbishment of facades. Three case studies in Madrid. Energy Build. 2016, 126, 252–262. [Google Scholar] [CrossRef]
  30. Laboratorio de Control de Calidad en la Edificación del Gobierno Vasco. Available online: https://www.euskadi.eus/r41–19380/es/contenidos/informacion/area_termica/es_atlcce/presentacion_1.html (accessed on 21 May 2017).
  31. Laboratorio de Ensayos Energéticos Para Componentes de la Edificación (LECE). Available online: http://www.psa.es/es/laboratorios/lece.php (accessed on 21 May 2017).
  32. Centre for Renewable Energy Sources. Available online: http://www.cres.gr/kape/index_eng.htm (accessed on 21 May 2017).
  33. Código Técnico de la Edificación. Documento Básico HS de Salubridad; CTE-DB-HS; Ministerio de Fomento del Gobierno de España: Madrid, Spain, 2009. [Google Scholar]
  34. EN ISO 7726:2001: Ergonomics of the Thermal Environment. Instruments for Measuring Physical Quantities; British Standards Institution: London, UK, 2001.
  35. International Organization for Standardization. Thermal Performance of Buildings—Determination of Air Permeability of Buildings—Fan Pressurization Method; ISO 9972; ISO: Geneva, Switzerland, 2015. [Google Scholar]
  36. EN 13187:1998. Thermal Performance of Building-Qualitative Detection of Thermal Irregularities in Building Envelopes—Infrared Method; ISO 6781: 1983 Modified; AENOR: Madrid, Spain, 1998.
  37. ISO 18434–1: 2008 (E). Condition Monitoring and Diagnostics of Machines. Thermography. Part 1: General Procedures; ISO: Geneva, Switzerland, 2008.
  38. HULC, Herramienta Unificada LIDER-CALENER. Available online: https://www.codigotecnico.org/index.php/menu-recursos/menu-aplicaciones/282-herramienta-unificada-lider-calener (accessed on 19 May 2017).
  39. Código Técnico de la Edificación. Documento Básico HE de Ahorro de Energía; CTE-DB-HE; Ministerio de Fomento del Gobierno de España: Madrid, Spain, 2013. [Google Scholar]
  40. Fernández-Agüera, J.; Domínguez-Amarillo, S.; Sendra, J.J.; Suárez, R. An approach to modelling envelope airtightness in multi-family social housing in Mediterranean Europe based on the situation in Spain. Energy Build. 2016, 128, 236–253. [Google Scholar] [CrossRef]
  41. FLIR Tools+ v.5.12.17041.2002. FLIR Systems, Inc.: Wilsonville, OR, USA. Available online: http://support.flir.com/DsDownload/Assets/T198583-en-US.html (accessed on 8 June 2017).
  42. ISO 6946: 2017. Building Components and Building Elements. Thermal Resistance and Thermal Transmittance. Calculation Method; ISO: Geneva, Switzerland, 2007.
  43. Wang, S.K. Handbook of Air Conditioning and Refrigeration; Mc Graw-Hill: New York, NY, USA, 2001. [Google Scholar]
Figure 1. Location site with N-S (North-South) orientations; external appearance of the test modules.
Energies 10 01816 g001
Figure 2. Solar and wind influence study (autumn equinox, 9:00 a.m. to 4:00 p.m.).
Energies 10 01816 g002
Figure 3. Floor plans and cross-sections showing the spatial organization of the test cells. Dimensions are in metres.
Energies 10 01816 g003
Figure 4. Axonometry of the module structure system, steel framing type.
Energies 10 01816 g004
Figure 5. (a) Location of the sensors within each module; (b) Service room; (c) Test room (cell 3).
Energies 10 01816 g005
Figure 6. Infrared and visual images of the test cells facing south. (a) non-retrofitted building envelope (cell 3); (b) retrofitted solution with ETICS (cell 1).
Energies 10 01816 g006
Figure 7. Air ambient temperature and global solar radiation in one week. Free-running: (a) Cells 1 and 3 (south) and (b) Cells 2 and 4 (north).
Energies 10 01816 g007
Figure 8. Instant cooling load (W) in cells and modules.
Energies 10 01816 g008
Table 1. Thermal envelope definition of the thermal transmittance (U-values).
Building EnvelopeU (W/m2 K)
W1Exterior mortar rendering, brick wall (1/2 foot), interior rendering, 5 cm air chamber, brick partition wall, and gypsum plasterUW1 = 1.43
W2W1 + thermal insulation EPS 50 mm with exterior renderingUW2 = 0.47
W3200 mm sandwich panel, thermal insulation MW 80 + 80, 100 mm sandwich panelUW3 = 0.05
FloorsUF = 0.05
RoofUR = 0.05
W4100 mm sandwich panelUW4 = 0.17
Opening4/8/4 double-glazing, Metal frame (no thermal bridge)UO = 3.3
Table 2. Probes in test cells.
Device#LocationUnitRankAccuracy
Thermocouple32On surface°C−250, +350±1 ± 0.75%
CO2 detector4Air return grille ppm0–2000±2.0%
Hygrometer4Air return grille%0–100±3% (0.70%) ± 5% (71.10%)
Lux meter8Interior matrixlux20–2000-
Thermometer16Interior matrix°C−40, +80±0.15 ± 0.1%
Table 3. Probes in the air-conditioning system.
Device#LocationUnitRankAccuracy
Voltmeter8Electrical panelV--
Ammeter8Electrical panelA--
Potentiometer8Electrical panelW--
Energy4Electrical panelkWh--
Reactive energy4Electrical panelkVArh--
Pipe thermometer8Hydronic circuit°C−75, +135±0.3
Duct thermometer4Air duct°C−10, +60±0.3
Ammeter4Air ductm/s0.1–2.00.06 m/s + 3%
Table 4. Probes in the Weather Station.
Device#OrientationUnitRankAccuracy
Thermometer2N,S°C−40, +80±0.15 ± 0.1%
Hygrometer1-%0–100±3% (0.70%) ±5% (71.10%)
CO2 detector1-ppm0–2000±2.0%
Lux meter1-lux0–200,000±3.0%
Anemometer1-m/s0–50±0.5
Vane1-°0–360±2.5
Pyranometer6North, South, East, West, horizontal, diffuseW/m20–2000±1.5%
Table 5. Ambient conditions considered for the thermographic tests.
ParameterValue
Outdoor ambient temperature5.2 °C
Average indoor ambient temperatureCell 133.9 °C
Cell 234.8 °C
Cell 333.4 °C
Cell 433.4 °C
Wind speed1.0 m/s
Wind directionSW
Table 6. Test cell infiltration rates.
Test CellTestAir leakage Rate at 50 Pa (V50, m3/h)Infiltration Rate at 50 Pa (n50, ACH)
South-west (with window)t11123.8
t2943.2
North-west (no windows)t11455.0
t21434.9
South-east (with window)t11725.9
t21354.6
North-east (no windows)t11113.8
t21093.7
Table 7. Comparison chart of infiltration rates at 50 Pa (n50) ACH.
Test Cell Average ValueHULCMeasurements in Mediterranean Existing Social Houses
4.612.05.72
Table 8. The external surface temperature and estimated heat flux.
Original Wall (Cell 3)Rehabilitated Wall (Cell 1)
Case (a) Opaque PartCase (b) GlobalCase (a) Opaque PartCase (b) Global
TSE (°C)9.710.96.87.8
ΔT (°C)28.128.6
Φ (W/m2)55.170.617.930.7
Table 9. Air ambient temperature in Cells 1 and 3.
DayOutdoor Max.Tsol Max.Cell 1Cell 3
Indoor Max.GapIndoor Max.Gap
OutdoorTsolOutdoorTsol
29 September 201636.8 °C43.4 °C32.9 °C1:401:3034.6 °C2:102:00
30 September 201637.7 °C46.8 °C34.1 °C0:302:2035.7 °C0:102:35
01 October 201637.6 °C46.7 °C34.2 °C1:051:4035.4 °C1:402:15
02 October 201636.2 °C45.5 °C32.7 °C0:451:0533.4 °C2:102:30
03 October 201638.7 °C50.2 °C32.9 °C1:050:5034.3 °C1:551:40
04 October 201640.1 °C50.9 °C33.8 °C0:300:3535.5 °C1:151:20
05 October 201638.8 °C48.8 °C34.1 °C1:202:0535.4 °C1:552:40
Table 10. Air ambient temperature in Cells 2 and 4.
DayOutdoor Max.Tsol Max.Cell 1Cell 3
Indoor Max.GapIndoor Max.Gap
OutdoorTsolOutdoorTsol
29 September 201636.8 °C38.0 °C27.5 °C9:209:1028.4 °C8:408:30
30 September 201637.7 °C39.3 °C27.8 °C6:506:5028.8 °C6:406:40
01 October 201637.6 °C39.2 °C27.9 °C7:307:3028.8 °C7:057:05
02 October 201635.9 °C37.8 °C27.8 °C10:1510:3528.4 °C8:308:50
03 October 201638.9 °C41.1 °C27.1 °C9:159:0027.3 °C8:558:40
04 October 201640.3 °C50.9 °C27.1 °C9:159:2028.2 °C8:258:30
05 October 201638.7 °C40.4 °C27.4 °C9:258:4528.3 °C8:558:15

