Abstract
An updraft tower cooling system is assessed for elimination of water use associated with power plant heat rejection. Heat rejected from the power plant condenser is used to warm the air at the base of an updraft tower; buoyancy-driven air flows through a recuperative turbine inside the tower. The secondary loop, which couples the power plant condenser to a heat exchanger at the tower base, can be configured either as a constant-pressure pump cycle or a vapor compression cycle. The novel use of a compressor can elevate the air temperature in the tower base to increases the turbine power recovery and decrease the power plant condensing temperature. The system feasibility is evaluated by comparing the net power needed to operate the system versus alternative dry cooling schemes. A thermodynamic model coupling all system components is developed for parametric studies and system performance evaluation. The model predicts that constant-pressure pump cycle consumes less power than using a compressor; the extra compression power required for temperature lift is much larger than the gain in turbine power output. The updraft tower system with a pumped secondary loop can allow dry cooling with less power plant efficiency penalty compared to air-cooled condensers.
1. Introduction
Utility scale power plants must reject a huge amount of heat based on the second law of thermodynamics. The heat is not useful for power production, and must be rejected to the ambient at the lowest possible temperature to maximize the power plant efficiency. Typically, for each megawatt of electricity generated, one to two megawatts of heat must be rejected [1]. The most common method of rejecting heat from the condenser of the power plant Rankine cycle uses cooling towers. Water cooling towers are widely used in industry and provide reliable long-term operation. The return water temperature from the cooling tower to the condenser can be well controlled by the cooling tower water temperature. However, processing heat rejection using cooling towers consumes a large amount of water. The United States Geological Survey (USGS) data shows that water usage in thermoelectric power generation was 45% of the total national water use in 2010 [2]. In water-stressed arid regions, there is not enough water available to simultaneously satisfy the needs of power production and other critical functions. In areas with physical access to water sources, cooling towers are co-located with rivers or lakes. Nevertheless, heat rejected to the environment may cause temperature increases that negatively affect the local ecological system. From an energy perspective, the cooling towers do not recover or utilize any of the waste heat that is rejected. As a consequence of these disadvantages, government agencies have changed policy to limit open-loop water cooling for power plants [3,4,5]. Thus, there is a significant need for alternatives to existing water cooling approaches that reduce or eliminate the water consumption associated with power plant heat rejection.
Several different methods for power plant heat rejection have been investigated in recent decades that utilize the waste heat stream, such as a water canal system [6], a spray pond system [7], or rejecting the heat to an algae pond to produce biofuel [8,9]. However, water canal systems or spray pond systems still consume significant amounts of water when rejecting heat to the environment. In order to solve the water consumption problem, this paper concentrates on alternative dry cooling methods, a topic of recent significant technological interest due to regional water shortages [10]. One dry cooling method that is becoming increasingly adopted in newly constructed utility scale power plants is the use of air-cooled condensers (ACC) [11]. There are two general types of dry cooling systems using air-cooled condensers: direct and indirect. Indirect dry cooling systems use secondary water loops; the steam from the power plant is condensed by water in the secondary loop, which is then cooled within the air-cooled condenser. In the direct system, the power plant steam is ducted directly to the air cooled condenser with either mechanical draft or natural draft. Air-cooled condensers with a mechanical draft system are used in most of the dry cooling power plants [11]. In mechanically-driven direct air-cooled condensers, the power plant exhaust steam exiting the turbines passes through a system of air-cooled heat exchangers, typically finned-tube heat exchangers arranged in an A-frame configuration [12]. The exhaust steam condenses on the inner tubes walls, flows downward to a condensate receiver tank by gravity, and then is pumped back to the boiler. On the floor of the condenser, large mechanically-driven axial flow fans force the cooling air through the condenser.
The power consumption associated with using air-cooled condensers can be classified in two categories: the mechanical fan power consumption required to drive the air through the heat exchanger and the penalty in power generation efficiency compared to cooling tower heat rejection due to the higher condensing temperature. Based on a report from the California Energy Commission [13], the fan power consumption is usually 1 to 1.5% of the total power output. The reported efficiency penalty on the power generation ranges from 5% on normal days to 20% on hot and windy days; wind reduces the ACC heat transfer rates due to reduced fan performance or recirculation of the hot air [14]. The condensing temperature and the power generation efficiency penalty is strongly influenced by the environmental temperature, and hence is affected by the location. In the studied case, the location of the power plant had an average temperature 13.8 °C.
A solar-driven updraft tower concept was originally proposed over 100 years ago and only later studied for solar power generation purposes [15,16]. A solar updraft tower comprises a tall tower chimney with a large solar collection area surrounding the base of the tower, and gas turbines at the inlet. Air is heated by the sun in the collector. Air at the top of the tower is cooler due to the height above sea level. The temperature and density difference between the heated air and the ambient air at the top of the tower establishes the driving buoyancy force to draw air into the tower without any mechanical draft. Solar energy is thereby converted to kinetic energy that can be extracted by the gas turbines. A 50 kW experimental plant was built in Manzanares (Spain) in 1981 and operated for two years [17]; the operating principle, construction details, and preliminary test results were described and analyzed [18]. This plant had a tower height of 194.6 m and a vertical axis single-rotor turbine configuration with four blades. The experiment showed that the updraft tower would operate in real-world conditions and the performance agreed with model predictions [19].
A number of different theoretical modeling efforts have followed this first experimental demonstration to analyze various parameters’ influence on solar updraft tower system performance. Padki and Sherif developed a simple analytical model for a constant-diameter tower by using a momentum balance and assuming the Boussinesq approximation was valid to calculate the air velocity and kinetic energy at the outlet; the power output was assumed equivalent to the kinetic energy. Bernardes et al. studied the power output using a model that balanced the pressure potential and theoretical maximum volume flow rate at the tower inlet under a no-load condition to obtain the pressure drop and the volume flow rate at the updraft tower inlet; the same method was adopted by Koonsrisuk and Chitsomboon and Zhou et al. [20,21,22]. Pastohr et al. calculated the temperature and flow field in the solar updraft tower numerically [23]. The simulation results were validated against experimental data and showed a good agreement. Fluri and von Backström compared different modeling approaches and layouts for solar updraft turbines, and confirmed the assumptions of previous researchers that the turbine efficiency of a solar updraft tower is approximately 80% [24,25]. Nizetic and Klari evaluated the influence of turbine pressure drop on the updraft tower; the turbine pressure drop factors were in the range of 0.8 to 0.9 [26].
While solar updraft towers use solar energy to heat air at the tower base, an updraft tower could also operate in an analogous manner using power plant waste heat as the energy source. Namely, the solar updraft tower collector is replaced by a heat exchanger at the tower base. A secondary loop is needed to couple the waste heat source to the heat exchanger at the tower base to heat the air. A constant-pressure pump secondary loop with a condenser (i.e., tower base air heater) and an evaporator (i.e., power plant steam condenser) can be used as the secondary loop that transfers the heat from power plant steam to atmospheric air. The condenser surface area is distributed around the tower base and rejects heat to the buoyant-driven airflow. The updraft tower system with a constant-pressure pump cycle is one possible design. This technology is known as the natural draft dry cooling tower and has been analyzed in the literature and applied in large power plants. Zhao et al. developed a 3D numerical model to assess the cooling performance of a natural draft system with vertical radiators and validated the model against published data [27]. Zou et al. combined the solar updraft tower concept with a natural draft cooling tower and analyzed this solar-enhanced natural draft cooling scheme [27,28]; they concluded that a solar updraft tower coupled to a power plant can significantly increase the updraft tower turbine power output, but requires a larger heat transfer area to reject the power plant condensing heat.
In this paper, an innovative indirect dry cooling method is analyzed that uses an updraft tower, combined with a secondary loop with vapor compression cycle, to reject the power plant condenser heat and increase the energy recovered from the turbine. The system cooling efficiency and performance is benchmarked against air-cooled condensers to evaluate the thermodynamic feasibility.
A traditional natural draft cooling system couples the updraft tower to the power plant using a constant-pressure pump cycle; this requires a larger heat transfer area to reject the condensing heat. In order to increase the heat rejection rate to the ambient air, the secondary fluid temperature can be increased at the tower base using a modified system with a conventional vapor compression cycle as the secondary loop. In this context, the constant-pressure pump cycle can be considered a special case of the vapor compression cycle by eliminating the compressor (pressure ratio equal to one) and using a liquid pump instead of the expansion valve. Results and design insights gained through study of the vapor compression secondary loop system can generally be applied to the traditional constant pressure pump system.
In this paper, a quantitative, model-based analysis is used to evaluate the system performance and compare with traditional methods of power plant cooling. This paper includes a detailed thermodynamic feasibility analysis of the components and system performances of an updraft tower dry cooling system. State-point thermodynamic models are developed for the power plant, updraft tower, and secondary loop, and are coupled together to analyze the system performance. The simulation model is built in Engineering Equation Solver (EES), which has libraries for refrigerant properties and can solve coupled systems of equations [29]. The analysis considers two secondary loop systems, a constant-pressure pump secondary loop as well as a vapor compression secondary loop. Parametric studies of the vapor compression secondary loop system are first carried out to determine the influence of the tower height, tower diameter, secondary loop condenser depth, and secondary loop evaporator heat transfer area on turbine power output and the required compressor work. A realistic updraft tower system design is formulated based on the results of these parametric studies. For this design, the constant-pressure pump secondary loop system performance is evaluated and compared to the vapor compression secondary loop system. Lastly, the penalty in power generation efficiency using a dry cooling updraft tower system is compared to a power plant using air-cooled condensers.
2. System Description and Modeling Approach
The updraft tower dry cooling system comprises three major subsystems: the power plant, secondary loop, and updraft tower. Figure 1 presents a schematic illustration of the dry cooling system with a power plant connected to an updraft tower using a vapor compression secondary loop. The secondary loop transfers waste heat from the power plant steam condenser to the heat exchanger at the updraft tower base. This heat will increase the air temperature at the base and, due to the density difference, drive airflow up through the tower. The kinetic energy of this air stream can then be converted to electric power using turbines inside the tower core. The driving buoyancy force eliminates the need for mechanical fans found in conventional dry cooling using air-cooled condensers. The power generated by the turbines can assist in compression of the refrigerant in the secondary loop. Detailed descriptions of the component models developed to predict the behavior of this dry cooling system are introduced in this section. The coupled thermodynamic models are solved using Engineering Equation Solver (EES).
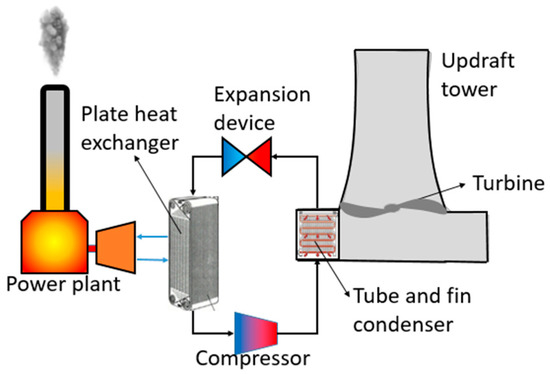
Figure 1.
Schematic illustration of an updraft tower system with a vapor compression secondary loop for dry cooling in large-scale power plants.
2.1. Power Plant Model
A simplified power plant model was developed based on realistic power plant components and operating conditions. A block diagram describing the key components of the power plant is shown Figure 2. The power plant is a three-pressure-stage coal-fired Rankine cycle with reheat and regeneration. The primary steam line from the boiler passes through a high-pressure (HP) turbine. Part of the HP turbine outlet steam is reheated in the boiler and passes through a two-stage intermediate pressure (IP) turbine and two five-stage low pressure (LP) turbines. The other portion of the HP turbine outlet steam floes to the feed-water heater that preheat the return water. Furthermore, portions of steam are extracted at the IP turbine and the LP turbines to preheat return water in additional feed-water heaters. The steam exiting the LP turbines flows into the condenser. There are eight feed-water heaters to preheat the return water from the condenser. Five feed-water heaters are located upstream of the condensate pump and three downstream of the pump.
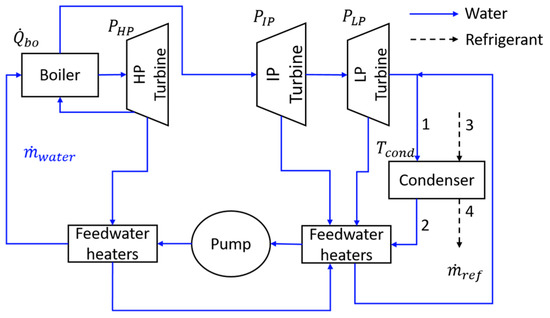
Figure 2.
Schematic diagram of power plant model.
A simplified model is built to predict the condensing heat transfer rate of the power plant for given operating conditions, and to subsequently couple the model with the secondary loop model in the system model. Pressure drop in the piping is neglected. The condensation pressure and temperature are assumed to be known inputs based on baseline power plant operation with a water cooling tower. The outlet state of the condenser (and hence feed-water heaters) are saturated water. The power plant model is built as the system of equations formed from balancing energy and mass for each component. For the boilers, the enthalpies of the inlet and outlet steam are known for both heating and reheating processes. For the turbines, the power output is calculated based on the inlet properties, the outlet pressure, and a known isentropic efficiency:
For the feed-water heaters, it is assumed that the heater temperature is the saturated temperature at the given pressure; to model the regeneration cycle performance and preheat of the condensing flow, it is also assumed that all heaters have a constant terminal temperature difference (TTD) that is used to calculate the outlet temperature of the heater:
Because the pressure drop in the heater is neglected, the inlet and outlet of the heaters have the same pressure. The water temperature is assumed constant across the pumps, and the enthalpy constant across any valves. All other component models are modeled using energy and mass balances. Given the input operating conditions, the power plant model solves for the steam mass flow rate and condensing heat transfer rate.
2.2. Secondary Loop Model
The secondary loop can be configured either as a constant-pressure pump cycle with condenser, evaporator, and pump (Figure 3a) or a vapor compression cycle with condenser, evaporator, expansion device, and compressor (Figure 3b). The heat exchanger types and key geometric parameters of the secondary loop evaporator and condenser are shown in Figure 3c,d respectively. The geometric parameters are selected for a given existing 702 MW power plant, the detailed operating conditions are given in Section 4.1. A staggered-tube plate fin heat exchanger is selected as the secondary loop condenser for its low pressure drop and wide usage in air to refrigerant heat transfer.
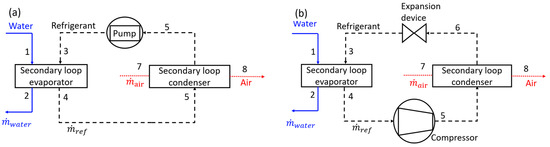
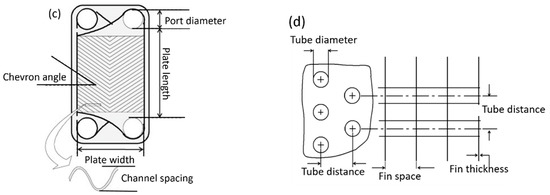
Figure 3.
(a) Schematic diagram of the constant pressure pump secondary loop model; (b) schematic diagram of the vapor compression secondary loop model; key geometric parameters of the (c) chevron plate evaporator and (d) plate fin condenser are also shown.
The refrigerant inside the evaporator of the secondary loop must condense the power plant steam. The exhausted steam mass flow rate is generally very large for a power plant, which requires a large refrigerant mass flow rate in the secondary loop. A plate heat exchanger is selected as the secondary loop evaporator for the current study due to the compact design and efficient heat exchange; a large number of plates (or heat exchangers) can be combined in parallel to accommodate the large mass flow rates at reasonable flow velocities. The number of heat exchanger plates is a variable parameter that is modified as necessary to maintain the desired operating conditions. The component sizes summarized in Table 1 are chosen based on a guide book for heat exchanger design [30].

Table 1.
Secondary loop evaporator and condenser key geometric parameters.
The plate heat exchanger was modeled for parallel flow operation. The water-side inlet condition is determined by the power plant operating conditions; the refrigerant-side conditions are set by the secondary loop evaporating temperature. The secondary loop model assumes that the refrigerant enters the evaporator as saturated liquid and exits as saturated vapor. Hence, heat transfer occurs between the fluid streams exclusively in the two-phase region; the thermophysical properties and heat transfer coefficient are functions of quality. To evaluate the model, the heat exchange surface area is discretized into stream-wise segments, so that the quality change in each segment is small and can be assumed constant. The properties and heat transfer coefficient can then be determined. Given the inlet properties of both fluids, as well as the water-side mass flow rate, the outlet states for both fluids can be calculated segment by segment. The total heat transfer rate can be calculated by summing the segment-by-segment heat transfer rate. The plate overall heat transfer coefficient in the ith segment is calculated as:
where is the fouling resistance and is the conduction resistance for the plate. The heat transfer rate through each plate for different segments can be determined as:
The outlet of the water/refrigerant sides then can be determined:
The correlation for the water-side two-phase heat transfer coefficient is [31]:
The refrigerant-side two-phase heat transfer coefficient is [32]:
For the constant-pressure pump secondary loop, the pump is used to overcome the pressure drop in the piping and heat exchangers. Assuming an adiabatic process, the enthalpy of the pump inlet and outlet is known based on the temperature and pressure. The power input can then be calculated by:
For the vapor compression secondary loop, the compressor located downstream of the evaporator compresses the refrigerant vapor to a higher pressure. The required compression work is calculated using the isentropic compressor efficiency and the refrigerant compressor inlet properties from the outlet of the secondary loop evaporator. Based on the given isentropic efficiency, the outlet enthalpy is solved:
Given the outlet pressure, the compressor outlet state can be calculated and the compressor work given by:
The condenser of the secondary loop, at the circumference of the tower base, heats the ambient air drawn into the tower. A staggered-tube, plate fin heat exchanger was selected for this study due to the low air-side pressure drop characteristics. While the outer diameter of the annular condenser footprint will increase slightly with the condenser depth (), the cross-sectional air flow area is assumed constant (based on the inner diameter for the footprint) for simplicity of calculating the heat transfer area.
The refrigerant-side pressure drop is assumed to be dominated by the frictional pressure drop in the tubes. The pressure drop is calculated using the two-phase correlation method of Friedel [33], as detailed in Appendix A. The refrigerant-side heat transfer coefficient is calculated by the Chato correlation [34]:
The air-side pressure drop is determined by an expression given by Kays and London [35]:
where is the maximum mass flux. The air-side heat transfer coefficient is calculated using a correlation given by Kays and London [35]:
The ε-NTU method was used to calculate the heat transfer rate. The overall UA, NTU, and condenser effectiveness can be calculated:
The heat transfer rate from the refrigerant side to the air side is given by:
Given the refrigerant inlet properties and the condenser geometry, the model must be coupled with the updraft tower model presented in the next section to solve the air mass flow rate and outlet properties for both the refrigerant and air side.
The expansion device located after the condenser reduced the pressure and controls the low-pressure-side mass flow rate. The expansion device model used assumes constant enthalpy. The expansion device outlet state point is determined by the low-side pressure and inlet refrigerant enthalpy.
2.3. Updraft Tower Model
The updraft tower has three main parts: a base, a tall chimney, and recuperative turbines (Figure 4). The secondary loop condenser is installed around the circumference of the tower base. The recuperative turbines are located in the cross section of the chimney inlet. For each state point, two independent variables are used to determine the properties.
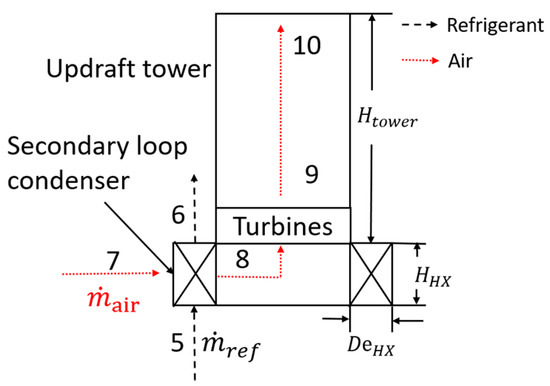
Figure 4.
Schematic diagram and key geometric parameters of the updraft tower.
The tower base inlet (state point 7) is ambient air that is drawn across the refrigerant-to-air heat exchanger located in the tower base and exits at state point 8. Using the air-side pressure drop and the predicted condenser heat transfer rate determined by the secondary loop condenser model presented in Section 2.2, the air pressure and enthalpy in the tower base can be respectively calculated as:
The hot air inside the tower base flows through the turbine assuming an isentropic process and a constant head loss :
The turbine outlet air (state point 9) rises to the tower outlet (state point 10); inside the tower, Bernoulli’s equation is used to describe the flow considering the gravitational head and frictional head:
where and is Darcy friction coefficient calculated using the Colebrook relation [36]. The outlet state of the tower (state point 10) is determined by the tower height above sea level. According to Munson et al. [37], the temperature and pressure can be calculated as:
where K m−1 is the laps rate, is gravitational acceleration, and J kg−1 K−1 is the gas constant. Note that is the air temperature outside the tower, not necessarily the temperature of the tower outlet (state point 10), which should be higher. For , as reported by previous research [21,22], the temperature change across the chimney can assumed to be small, and thus:
Since the pressure and temperature vary over a relatively small range, the air is assumed to behave as an ideal gas; the air enthalpy is a function of temperature while density and entropy are also functions of pressure. The unknown system variables (, , , , , , and ), can be determined by solving the system of Equations (11), (27), (33)–(36), (38) and (40). The updraft tower model can then be used to predict the turbine power output.
3. System-Level Model
The objective of this model is to allow for a parametric analysis of the updraft tower system performance for a fixed power plant model. All component models are coupled together to solve for the system-level behavior. The secondary loop condenser is coupled with the updraft tower; the secondary loop evaporator is coupled with the power plant. The refrigerant mass flow rate through the condenser and evaporator must match in the closed secondary loop. A schematic diagram of the coupled model, with key input and output variables, is shown in Figure 5. In the air flow path, the inlet temperature and pressure are fixed at the ambient conditions. The power plant condensing temperature and steam mass flow rate are determined by the fixed power plant operating data. These parameters are the external inputs to the system. Other system variables must be specified as the operating conditions (e.g., refrigerant type, secondary loop condensing and evaporating temperature) or selected geometries (e.g., tower height and diameter, secondary loop condenser size). The state point variables are unknown and need to be solved by the coupled system model.
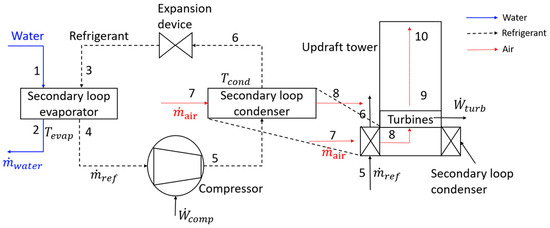
Figure 5.
Coupled system model schematic drawing and key input and output variables.
The following process is used to solve the coupled system model for the complete set of operating conditions:
- The water-side conditions determined by the power plant model, the evaporator heat exchanger area, and refrigerant evaporating temperature are used to predict the refrigerant mass flow rate.
- The ambient conditions, tower size, and condensing temperature are used in the coupled condenser and tower model to predict the refrigerant mass flow rate.
- The predicted refrigerant mass flow rates in steps 1 and 2 must match. If they do not match, the operating condition (tower size and condensing temperature) are adjusted and the refrigerant mass flow rate is recalculated until it matches step 1.
- The pump/compression work is predicted using the pump/compressor model.
- The air mass flow rate and turbine power output are calculated.
4. Results and Discussion
4.1. Power Plant Operation
The power plant model is based on a real power plant system. Full-load operation data from this system are used to solve the condensing heat transfer rate and steam mass flow rate. The power plant pressure ratio, turbine work output, and steam condensing temperature are given as input variables. The input parameters of the power plant are shown in Table 2. The model outputs for these inputs are shown in Table 3.
Table 2.
Power plant model key input parameters.
Table 3.
Power plant simulation results.
4.2. Updraft Tower System Parametric Studies
A single secondary loop refrigerant type is selected in order to conduct parametric analyses of system performance. Considering the practical concerns of safety, heat transfer performance, and wide usage in the power production industry, water was selected as the secondary loop refrigerant. It has to be noted that for regions that experience temperature below freezing, water by itself would not be a suitable secondary refrigerant. However, in such regions, water could be mixed with ammonia to provide suitable freeze protection or a conventional HFC refrigerant could be selected.
Different parametric studies have been completed to explore how the plate heat exchanger area, the tower size (height and diameter), and the secondary loop condenser size and temperature influence the system performance. A set of baseline system parameters and operating conditions for the tower and secondary loop that are used for the parametric studies is given in Table 4. The baseline operating condition in Table 4 will be explained in detail in Section 4.3. All of the parametric studies are carried out using the vapor compression secondary loop, which is more general and allows broader parametric variations compared to the simplified constant-pressure pump secondary loop. The compressor and turbine isentropic efficiency are set constant to 0.85 [38]. The ambient temperature is set as 25 °C, and the ambient pressure at 1 atm.
Table 4.
Baseline operating conditions of the secondary loop and key parameters for the parametric studies.
4.2.1. Secondary Loop Evaporating Temperature
The secondary loop evaporating temperature set point determines the required plate heat exchanger heat transfer area (i.e., number of plates). A parametric study is conducted by varying this evaporating temperature and observing the change in the required heat transfer area and compression work (results shown in Figure 6). All other variables are fixed at the baseline conditions shown in Table 4.
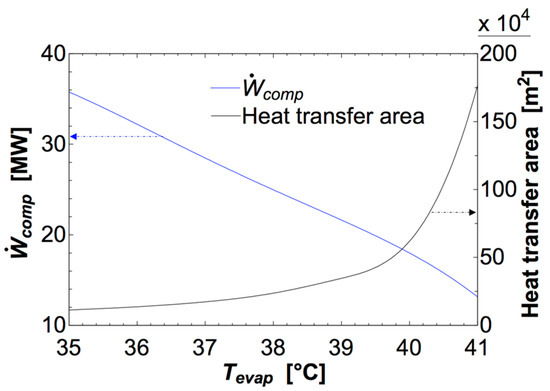
Figure 6.
Secondary loop evaporator heat transfer area and compression work change with secondary loop evaporating temperature.
The compression work will decrease significantly as the evaporating temperature increases. For the constant power plant steam-side inlet temperature, a higher secondary loop evaporating temperature will increase the evaporating pressure accordingly. Hence, the pressure ratio across the compressor will decrease, which lowers the compression work (for a fixed secondary loop condensing pressure). However, the required evaporator heat transfer area increases significantly as the evaporating temperature increases. As the temperature difference in the plate heat exchanger decreases, more heat exchange area is required to condense heat at the same rate. Furthermore, plates are added to the heat exchanger in order to increase the heat transfer area, which will decrease the mass flow rate in each channel and lower the heat transfer coefficient, leading to the nonlinear trend observed in Figure 6. The turbine power output of the updraft tower system is 4.0 MW and is constant with varying secondary loop evaporating temperature because the secondary loop condenser and updraft tower operate at fixed conditions. Hence, the secondary loop evaporating temperature presents a tradeoff between increasing the system efficiency and reducing the required heat exchanger area.
4.2.2. Updraft Tower Height and Diameter
The updraft tower operation, in tandem with the secondary loop condenser design, determines the recuperated power and compression work of the system. Parametric studies varying the tower height and tower diameter were carried out separately for a fixed secondary loop evaporating temperature and power plant operating conditions. Figure 7 shows the air mass flow rate and refrigerant mass flow rate as a function of the updraft tower height. A taller tower yields a larger temperature differential from the bottom to top of the tower. This increases the buoyancy-driven air mass flow rate. However, for the fixed secondary loop condenser design, the higher air-side mass flow rate necessitates a lower condensing temperature for the refrigerant mass flow rate to match the evaporator side of secondary loop.
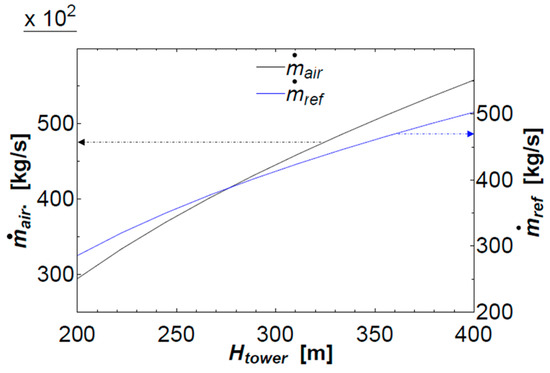
Figure 7.
Air and refrigerant mass flow rate change with tower height.
Figure 8a shows the variation of the condensing temperature as a function of tower height. A given secondary loop condensing temperature then determines the compressor work and turbine power output (Figure 8b). The reduced condensing temperature offered by a taller tower reduces the compressor ratio, and thereby compression work, significantly. The turbine power output increases with the tower height due to the increased driving buoyancy force. Note that this increased driving buoyancy force, due to the reduced temperature at the top of the taller tower, dominates the turbine power output behavior compared with the decrease of the air inlet temperature due to the lowered condensing temperature.
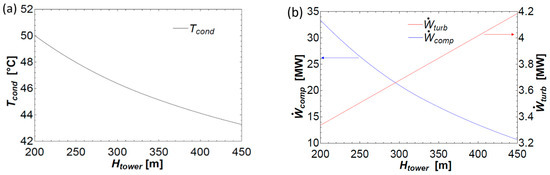
Figure 8.
(a) Condensing temperature; (b) as well as compression work and turbine power output, change with tower height.
Figure 9 similarly shows the system performance, but for varying updraft tower diameter. The effects of increasing the tower diameter are analogous to increasing the tower height. Increasing the tower diameter reduces the condensing temperature and compression work; the turbine power output will increase due to the increasing condenser area available for increasing tower diameter.
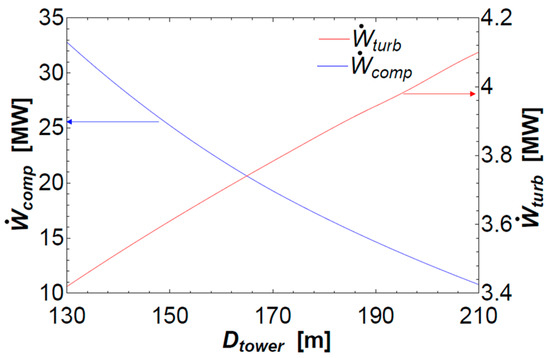
Figure 9.
Compression work and turbine power output change with tower diameter.
4.2.3. Secondary Loop Condenser Depth
The baseline secondary loop condenser height is selected to prevent significant flow constriction into the tower, such that air flow can be assumed uniform across the tower base inlet. A larger secondary loop condenser depth presents a tradeoff between larger heat exchange surface area and increased air-side pressure drop; the higher inlet temperature and increased pressure drop will oppositely affect the air mass flow rate through the tower. Thus, for a specific working condition, there is an optimized depth to be identified via a parametric study of the condenser size.
Figure 10 shows the refrigerant mass flow rate and turbine power output with varying condenser depth. The horizontal dotted line shows the refrigerant mass flow rate required to match the mass flow rate of the evaporator. There are two possible condenser depths for the specific tower size and other baseline parameters. The smaller condenser depth option yields a much higher power output than the larger depth. The smaller depth condenser should always be chosen from a power output perspective, and also saves space and material. This result can be explained by the change of air mass flow rate and tower inlet air temperature in Figure 11. With an increasing condenser depth, the heat transfer area becomes larger and the operating condensing temperature is fixed. The ambient air passing through the condenser will take up more heat and this will increase the tower inlet (condenser outlet) air temperature as well as the temperature difference across the tower height, which will increase the driving buoyancy force inside the tower. Conversely, the larger air-side pressure drop will increase the flow resistance. The air-side pressure drop is dominant, and causes the air mass flow rate through the tower (and power output) to decrease within increasing condenser depth.
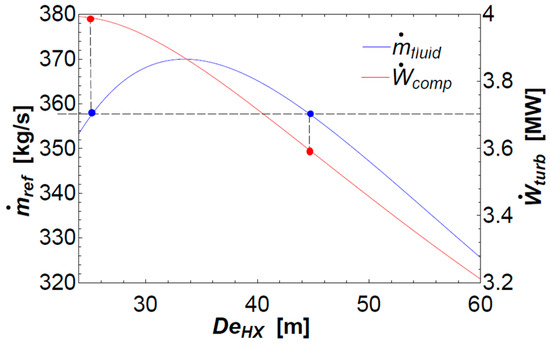
Figure 10.
Refrigerant mass flow rate and work output change with condenser depth.
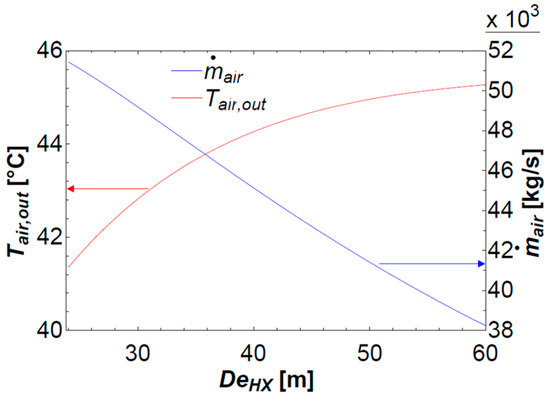
Figure 11.
Air mass flow rate and condenser outlet air temperature change with condenser depth.
4.2.4. Power Plant Condensing Temperature
The power plant model was fixed at constant operating conditions for the results shown in Section 4.2.1, Section 4.2.2 and Section 4.2.3 However, from the updraft tower system perspective, a higher steam condensing temperature would decrease the secondary loop compressor pressure ratio and compressor work. Conversely, a higher power plant condensing temperature will reduce the power plant thermal efficiency. The reduction in power generation as a function of the condensing temperature, calculated using the power plant model, is shown in Figure 12.
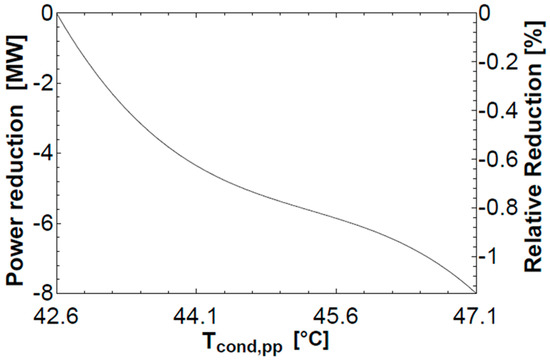
Figure 12.
Relative reduction in power plant output with increasing condensing temperature from a baseline temperature of 42.2 °C.
The tradeoff between the decreased required compressor power versus the power generation reduction for an increasing power plant condensing temperature is analyzed for the baseline updraft tower system, as defined by Table 4. The net power for cooling compared with the water-cooled power plant at a condensing temperature of 42.2 °C under normal operation, can be calculated by combining the power reduction due to any change in power plant efficiency (negative), compression work (negative), and updraft tower power output (positive). The results are shown in Figure 13.
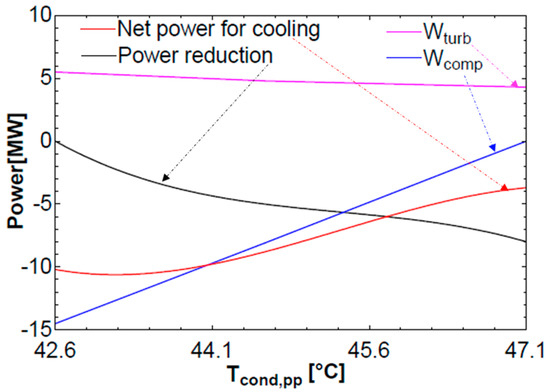
Figure 13.
Compressor power, power reduction, turbine power output and net power for cooling to water-cooled baseline with varying power plant condensing temperature.
The updraft tower power output stays constant because the updraft tower size and operating conditions are fixed. The compressor power decreases as the power plant condensing temperature increases due to the lower pressure ratio needed. The net total power produced increases even though the power plant condensing temperature is increasing. This indicates that the compressor power required to operate the vapor compression secondary loop at the normal power plant condensing temperature is dominant compared to the power plant efficiency penalty. Similarly, decreasing the power plant condensing temperature will decrease the net total power produced because the extra compression power required would be much larger than the increase in power plant output power. Ultimately, the case without any compression work and the highest power plant condensing temperature provides the least power penalty for dry cooling compared to water cooling. Section 4.4 will further explore this extreme case in which there is no compression work (constant-pressure pump secondary loop) and the power plant condensing temperature is allowed to increase accordingly.
4.3. Baseline Design Performance
Based on the results of the parametric studies presented in Section 4.2, the reasoning for the chosen baseline design parameters for the updraft tower dry cooling system with the vapor compression secondary loop, shown in Table 4, can be understood for the given power plant heat rejection load and working conditions. The secondary loop evaporating temperature was selected by considering the tradeoff between increased required heat transfer area and reduced compression work as presented in Figure 6. There is a diminishing return in reducing the compression work as the heat transfer area increases rapidly above an evaporating temperature of 40 °C. For example, the heat transfer area must be tripled to increase the evaporating temperature to 41 °C to achieve a marginal reduction in the compressor work. It is likely that the cost of building a larger heat exchanger would not outweigh the performance benefit for an evaporating temperature of ~40 °C, corresponding to a heat transfer area of ~620,000 m2 (~170,000 plates in the selected heat exchanger).
The tower height (350 m) and diameter (180 m) were chosen to be as large as possible based on extension of practical construction limits. For example, the tallest cooling tower in the world is the 202 m tall cooling tower (142 m diameter) of the Kalisindh Thermal Power Station in Jhalawar, India [39]. Using the selected tower height and diameter, the secondary loop condensing temperature is 45.5 °C to match the refrigerant mass flow rate in the secondary loop evaporator. A required compression work of 18.1 MW is calculated using the compressor model.
Lastly, the secondary loop condenser depth must be optimized for maximum turbine power output. The secondary loop condenser height is first fixed as 50 m considering the flow area of the condenser inlet and the size of existing large air condensers. The condenser depth of 23.7 m maximizes the work output while ensuring that the refrigerant mass flow rate in the secondary loop is balanced on the condenser and evaporator sides. For the baseline design, the turbine power output is 4.0 MW.
The performance of the system is assessed based on the required net power input, calculated as the required compressor input power minus the turbine output power recovered. In the baseline design, the required net power input is 14.1 MW (compressor input power of 18.1 MW and turbine output power of 4.0 MW) to condense the steam of a 700 MW power plant.
4.4. Constant Pressure Pump Secondary Loop
In the previous parametric studies (Section 4.2), the influence of system components geometry and operating conditions have been studied for a realistic benchmark design of an updraft tower dry cooling system with a vapor compression secondary loop; the system was designed to maintain the same power plant condensing temperature as the original water-cooled power plant. However, Section 4.2.4 revealed that allowing the power plant condensing temperature to increase, so as to reduce the compression work, yielded a net benefit compared to operating the updraft tower system at the same condensing temperature as the water-cooled power plant. In this section, the compressor of the secondary loop is effectively replaced with a pump and, assuming no pressure drop in the connection piping, the secondary loop was evaluated as a constant-pressure pump loop; the refrigerant evaporates in the power plant condenser at the same temperature as it condenses in the updraft tower condenser.
In comparison to the vapor compression cycle, the updraft tower secondary loop condenser has a lower refrigerant inlet temperature when using a constant pressure pump cycle. The tower height itself must be adjusted in order to match the refrigerant mass flow rates with the secondary loop evaporator. For any given tower height, this sets the power plant condenser temperature. The relationship of tower height and the power plant condensing temperature is shown in Figure 14a. The net power for cooling compared with the water-cooled power plant at a condensing temperature of 42.2 °C under normal operation can be calculated by combining the power deduction due to any change in power plant efficiency (negative),and updraft tower power output (positive). The result is shown in Figure 14. With a constant pressure pump secondary loop, an intractably tall tower (820 m) is required to maintain the power plant condensing temperature at the water-cooled operational temperature where there is no efficiency loss; however, at this condition, there is a net increase in power plant output. As the tower height decreases and power plant condensing temperature increases, the net power for cooling decreases due to a reduced turbine power output and significant power plant efficiency penalty. There is a critical tower height of 590 m for which the constant pressure pump secondary loop system that yields zero net change in total power output. At the tower height of 350 m, the constant pressure pump secondary loop provided a net change in total power output of −3.7 MW, consistent with the result for the vapor compression secondary loop without any compression work in Figure 13.
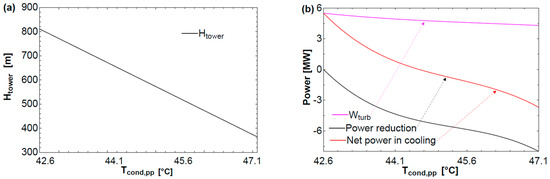
Figure 14.
(a) Required tower height to maintain a power plant condensing temperature at varying temperature; (b) net power for cooling.
4.5. Dry Cooling Performance Comparison
In this section, the constant-pressure pump secondary loop and vapor compression secondary loop are compared to an air-cooled condenser for dry cooling. As described in Section 1, the traditional power plant cooling method is a water-cooled cooling tower. All of the dry cooling systems’ performances are benchmarked against the water-cooled cooling tower by calculating the net change in total power when using each different dry cooling system to reject the same amount of heat as the cooling tower. For the water-cooled cooling tower, the power plant condensing temperature is fixed at 42.2 °C, which is the original operating condition for the power plant. The only power that needs to be considered when using a water-cooled cooling tower is the water pump power, which is relatively small; for this given 702 MW power plant, the water pump power is typically ~2 MW. For the air-cooled condenser, a 5% reduction in total power output of the power plant is assumed to reject the heat from the power plant [13]. For the calculation of constant-pressure pump secondary loop and vapor compression secondary loop, varying tower heights are considered; all of the other parameters including tower diameter, heat exchanger area, and heat exchanger depth are otherwise fixed at the values shown in Table 4. At each specific tower height, the corresponding power plant condensing temperature will be different for the two different secondary loop cycles, as discussed in Section 4.2; the constant-pressure pump secondary loop needs a higher power plant condensing temperature. The power reduction and turbine output can then be calculated. A 2 K temperature difference is assumed in the secondary loop heat exchanger.
Figure 15 shows the change in total power for the vapor compression secondary loop, constant-pressure pump secondary loop, and air-cooled condenser system compared to the water-cooled cooling tower case as a function of tower height. The water-cooled cooling tower and air-cooled condenser results appear as horizontal lines because the tower height is not applicable. The change in total power becomes less negative as the tower height increases for the updraft tower system. The constant pressure pump secondary loop has a much smaller reduction in the total power compared to the vapor compression secondary loop. At the same tower height, even though the constant-pressure pump secondary loop requires a higher power plant condensing temperature that decreases the thermal efficiency of power generation, it takes more power to use a compressor to increase the refrigerant loop condensing temperature to reject the same amount of heat. The constant-pressure pump secondary loop universally has better performance than the vapor compression secondary loop. The performance difference between these two secondary loop types will eventually become zero, because, if the tower becomes high enough, a pump loop can condense all the heat from power plant and no pressure ratio is needed. The constant pressure pump secondary loop has a better efficiency for the given tower design.
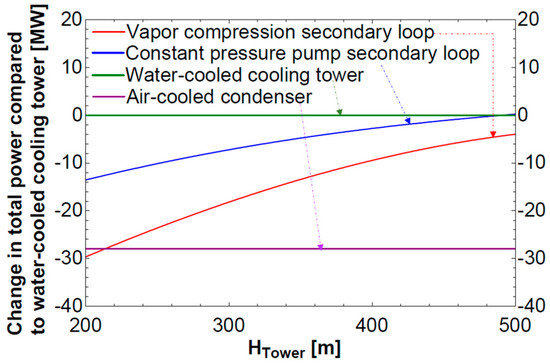
Figure 15.
Change in total power of constant- pressure pump loop, vapor compression loop, and air-cooled condenser compared against a water-cooled cooling tower.
The performance comparison with an air-cooled condenser shows that with a tower height over 220 m, the vapor compression secondary loop works better than an air-cooled condenser, while still providing dry cooling capability. The constant pressure pump secondary loop has a higher performance than an air-cooled condenser for all tower heights shown. Even compared to the traditional water-cooled cooling tower, the pumped loop can produce a net power benefit if a tower higher than approximately 480 m is constructed, due to the heat recovery by the updraft tower turbine. This is consistent with the result of the constant-pressure pump secondary loop shown in Figure 14; note that Figure 14 shows the net power consumed by the cooling system, which is offset from Figure 15 by 2 MW due to the power required by the water-cooled cooling tower.
When rejecting same amount of heat from the power plant, the constant-pressure pump secondary loop has a better energy performance than the vapor compression secondary loop. While the tower height of 480 m is very tall compared with a water cooling tower, the primary motivation of this updraft tower system is to eliminate the water usage; the air-cooled condenser system is the appropriate dry cooling benchmark. Compared to the air-cooled condenser, the constant-pressure pump secondary loop updraft tower system can achieve better energy performance for reasonable tower heights and achieve the same performance with ~225 m height. This first-order analysis of the updraft tower system suggests that this system is competitive from an energy consumption perspective.
4.6. Practical Considerations
In this research, the simulation model analyzes the system performance and feasibility from a thermodynamic perspective. However, there are multiple other constraints that would need to be considered to construct and operate an updraft tower system. Several of these challenges, and potential solutions, are discussed in the following section.
4.6.1. Updraft Tower
While the system performance always increases with the updraft tower size, the maximum size will be limited due to the practical construction constraints, especially the height. The constant pump pressure loop needs a tower height of at least 225 m to provide improved performance comparable to the air-cooled condenser benchmark. A multi-tower system could be used with several smaller updraft towers in parallel, yielding a very large effective tower diameter. The smaller height towers could be easier to build while providing a similar performance to a single tall tower with smaller diameter. Condensing the same amount of heat using smaller tower will decrease the turbine power output slightly because of the decreasing height. However, the reduced tower height helps to overcome challenges in design, construction, and cost of the updraft tower system. As an example, if three smaller updraft towers with heights of 110 m each were used to condense the same amount of heat, the multi-tower system results in the approximately same power output with less than 0.5 MW decrease as compared to the original optimized design using a single 225 m-tall tower.
Special design considerations would be needed for the turbine in the updraft tower. Considering the system proposed in this paper has a tower diameter of 180 m, one turbine with a single rotor is not feasible. Multiple turbines as well as the number and arrangement of blades should be considered with a design and layout to maximize power output and minimize the pressure head loss [40].
4.6.2. Secondary Loop Refrigerant
If the updraft tower system were to be used in large-scale power plant with hundreds of megawatts of condensing heat, a very large amount of refrigerant (and mass flow rate) would be required. Different types of refrigerant can be used in the system such as R134a, R290, or R600a. The performance of different refrigerants would most likely not vary significantly except for the required refrigerant mass flow rate. The turbine power outputs would be similar because the condensing temperatures of the secondary loop as well as the tower and condenser geometries remain similar. However, the required mass flow rates will be quite different because the secondary loop must handle the same heat rejection from the power plant steam for all of the refrigerants. The enthalpy of evaporation determines the refrigerant mass flow rate in each case.
Handling and selection of the refrigerant should mainly consider safety, potential ecological impacts, and affordability. Among all considered refrigerants, water has the smallest mass flow rate with very low price and safe properties, which makes water an attractive refrigerant for this application. However, the low pressure operation of water could be a problem. The operating pressures are far lower than the ambient pressure, which needs special consideration in design and maintenance. Another potential challenge is that the freezing point of water is high, and would require certain precautions to avoid freezing problem in cold climates. One possible solution is to use a water-ammonia mixture. Ammonia has a much lower freezing temperature, and as a secondary potential benefit, the mixture will have a temperature glide when going through two-phase heat transfer region. This can be advantageous for the condenser operation because the air side will also have a temperature glide that can be aligned with the refrigerant side. In order to realize the benefits of such a temperature glide, and solve the freezing problem, the mass fraction of ammonia needs to be carefully evaluated.
5. Conclusions
An updraft tower dry cooling system for large-scale power plant is evaluated. The updraft tower system can condense steam from the power plant without using mechanical fans or consuming water. The performance of the system is evaluated based on the net power needed to drive the system (i.e., difference between the recuperative turbine power output and required work to drive the pump or compressor), which depends on the refrigerant type, component sizing, and operating conditions. The system can work with a vapor compression secondary loop or a constant pressure pump secondary loop. Parametric studies are performed to illustrate the influence of different key parameters using a model-based analysis. For the vapor compression secondary loop: higher tower height and larger condenser inner diameter increase the turbine power output and decrease the compression work; the secondary loop condenser placed at the base of the tower has an optimized depth to maximize turbine power output; increasing the power plant condensing temperature reduces the power plant efficiency but requires a smaller pressure ratio across the compressor; the compression work is dominant compared to the power plant efficiency reduction.
From evaluation of the constant pressure pump secondary loop, it was found that replacing the compressor with a pump will require a higher power plant condensing temperature to reject the same amount of heat, which will reduce the power plant output, but also eliminates the compression work. Our results show that the compression work is dominant compared to the power plant efficiency reduction; the compression work required by the vapor compression secondary loop is not compensated by the additional power generated in return. Using the same tower diameter, the constant pressure pump secondary loop has a better energy efficiency than the vapor compression secondary loop.
Compared to alternative dry cooling with an air-cooled condenser, an updraft tower system with constant pressure pump secondary loop has better performance. For a 702 MW full-load operation power plant, using a secondary constant pressure pump loop, an updraft tower system with a tower 225 m in height and 180 m in diameter has half of the power generation penalty compared to the air-cooled condenser. Therefore, when using a secondary constant pressure pump loop, the tower size can be further reduced based on the allowable performance penalty. Increasing the tower height to 480 m with the same system yields the same power generation efficiency as a water-cooled cooling tower system, but eliminates water consumption entirely. This research only analyzes the system feasibility from an energy efficiency perspective; further economic analysis is required to further understand the cost-feasibility compared to the capital investment and payback period of alternative dry cooling technologies.
Acknowledgments
Special thanks to Duke Energy for their financial support of this work and to Neil Kern for his technical oversight and mentorship of the project.
Author Contributions
Haotian Liu built the simulation model. Eckhard Groll, Justin Weibel and Haotian Liu analyzed the data and wrote the paper.
Conflicts of Interest
The authors declare no conflict of interest.
Nomenclature
| area, m2 | |
| ff | free flow area of finned passages in heat exchanger, m2 |
| Boiling number | |
| p | specific heat, kJ kg−1 K−1 |
| diameter, m | |
| depth, m | |
| friction factor | |
| Froude number | |
| gravitational constant, m s−2 | |
| G | mass flux, kg m−2 s−1 |
| Grashof number () | |
| thermal conductivity, W m−1 K−1 | |
| minor loss coefficient | |
| height, m | |
| turbine head loss, m | |
| specific enthalpy, kJ kg−1 | |
| heat of vaporization, kJ kg−1 | |
| length, m | |
| mass flow rate, kg s−1 | |
| Nusselt number () | |
| Number of Transfer Units | |
| pump | |
| pressure, kPa | |
| Prandtl Number () | |
| heat, kJ | |
| heat rate, kW | |
| heat flux, kW m−2 | |
| gas constant, kg−1 K−1 | |
| Reynolds number () | |
| thermal resistance, K m2 W−1 | |
| temperature, °C | |
| velocity, m s−1 | |
| overall heat transfer coefficient, W m−2 K−1 | |
| time, s | |
| terminal temperature difference, °C | |
| specific volume, m3 kg−1 | |
| mechanical power, W | |
| Weber Number () | |
| Greek | |
| heat transfer coefficient, W m−2 K−1 | |
| χ | vapor quality |
| laps rate, K m−1 | |
| efficiency | |
| effectiveness | |
| µ | dynamic viscosity, kg m s−1 |
| density, kg m−3 | |
| surface tension, N m−1 | |
| ϕ | relative humidity |
| friction multiplier | |
| Subscripts | |
| ambient | |
| boiler | |
| cold fluid | |
| condenser | |
| evaporator | |
| fin | heat exchanger fin |
| gas | |
| hot fluid | |
| feed water heater | |
| heat exchanger | |
| high-pressure turbine | |
| hydraulic | |
| liquid | |
| low-pressure turbine | |
| index number | |
| inlet | |
| intermediate-pressure turbine | |
| maximum | |
| outlet | |
| pump | |
| power plant | |
| secondary loop pump | |
| refrigerant | |
| isentropic | |
| saturation | |
| surroundings | |
| surface | |
| turbulent-turbulent | |
| turbine | |
| vapor | |
| water | |
Appendix A
The friction pressure drop is calculated by the multiplier:
where is the liquid pressure drop, calculated by:
and and are the vapor phase and liquid phase friction coefficient, which are determined by:
The friction multiplier is calculated by:
where
References
- Leffler, R.A.; Bradshaw, C.R.; Groll, E.A.; Garimella, S.V. Alternative heat rejection methods for power plants. Appl. Energy 2012, 92, 17–25. [Google Scholar] [CrossRef]
- Maupin, M.A.; Kenny, J.F.; Hutson, S.S.; Lovelace, J.K.; Barber, N.L.; Linsey, K.S. Estimated Use of Water in the United States in 2010; U.S. Geological Survey: Reston, VA, USA, 2014.
- Energy Information Administration (EIA). Electric Power Annual 2011; Department of Energy, U.S. Energy Information Administration (EIA): Washington, DC, USA, 2013.
- Environmental Protection Agency (EPA). National Pollutant Discharge Elimination System—Final Regulations to Establish Requirements for Cooling Water Intake Structures at Existing Facilities and Amend Requirements at Phase i Facilities; Final Rule; Federal Register: Washington, DC, USA, 15 August 2014; Volume 79, p. 158.
- Environmental Protection Agency (EPA). Federal Water Pollution Control Act 33 U.S.C. 1251 et Seq; Federal Register: Washington, DC, USA, 2002.
- Frediani, H.A. Cooling Canal System Modeling Report; Jan. Report, No. 1670; Golder Associates Inc.: Atlanta, GA, USA, 2008. [Google Scholar]
- Ryan, P.J.; Harleman, D.R.; Stolzenbach, K.D. Surface heat loss from cooling ponds. Water Resour. Res. 1974, 10, 930–938. [Google Scholar] [CrossRef]
- Demirbas, M.F. Biofuels from algae for sustainable development. Appl. Energy 2011, 88, 3473–3480. [Google Scholar] [CrossRef]
- Chisti, Y.; Yan, J. Energy from algae: Current status and future trends. Appl. Energy 2011, 88, 3277–3279. [Google Scholar] [CrossRef]
- Advanced Research Projects Agency-Energy (ARPA-E). Advance Research in Dry Cooling (Arid); Advanced Research Projects Agency-Energy: Washington, DC, USA, 2015.
- Bustamante, J.G.; Rattner, A.S.; Garimella, S. Achieving near-water-cooled power plant performance with air-cooled condensers. Appl. Therm. Eng. 2016, 105, 362–371. [Google Scholar] [CrossRef]
- Electric Power Research Institute (EPRI). Air-Cooled Condenser Design, Specification and Operation Guidelines; Electric Power Research Institute: Palo Alto, CA, USA, 2005. [Google Scholar]
- Electric Power Research Institute (EPRI). California Energy Commission. Compraison of Alternatte Cooling Technologies for California Power Plants: Economic, Environmental and Other Tradeoffs; Electric Power Research Institute: Palo Alto, CA, USA, 2002. [Google Scholar]
- Owen, M.; Kröger, D.G. Contributors to increased fan inlet temperature at an air-cooled steam condenser. Appl. Therm. Eng. 2013, 50, 1149–1156. [Google Scholar] [CrossRef]
- Cabanyes, I. Proyecto de Motor Solar, La Energia eléctrica. Rev. Gen. Electr. Appl. 1903, 8, 61–65. [Google Scholar]
- Schlaich, J. The Solar Chimney: Electricity from the Sun; Edition Axel Menges: Stuttgart-Fellbach, Germany, 1995. [Google Scholar]
- Haaf, W.; Friedrich, K.; Mayr, G.; Schlaich, J. Part I: Principle and construction of the pilot plant in manzanares. Int. J. Sol. Energy 1983, 2, 3–20. [Google Scholar] [CrossRef]
- Lautenschlaqer, H.; Haaf, W.; Schlaich, J. New Results from the Solar Chimney Prototype and Conclusions for Large Power Plants. In Proceedings of the European Wind Energy Conference, Hamburg, Germany, 22–26 October 1985; pp. 231–235. [Google Scholar]
- Haaf, W. Solar chimneys: Part II: Preliminary test results from the manzanares pilot plant. Int. J. Suatain. Energy 1984, 2, 141–161. [Google Scholar] [CrossRef]
- Dos Santos Bernardes, M.A.; Voß, A.; Weinrebe, G. Thermal and technical analyses of solar chimneys. Sol. Energy 2003, 75, 511–524. [Google Scholar] [CrossRef]
- Koonsrisuk, A.; Chitsomboon, T. Dynamic similarity in solar chimney modeling. Sol. Energy 2007, 81, 1439–1446. [Google Scholar] [CrossRef]
- Zhou, X.P.; Yang, J.K.; Xiao, B.; Hou, G.X. Simulation of a pilot solar chimney power equipment. Renew. Energy 2007, 32, 1637–1644. [Google Scholar] [CrossRef]
- Pastohr, H.; Kornadt, O.; Gurlebeck, K. Numerical and analytical calculations of the temperature and flow field in the upwind power plant. Int. J. Energy Res. 2004, 28, 495–510. [Google Scholar] [CrossRef]
- Fluri, T.P.; von Backström, T.W. Performance analysis of the power conversion unit of a solar chimney power plant. Sol. Energy 2008, 82, 999–1008. [Google Scholar] [CrossRef]
- Fluri, T.P.; von Backström, T.W. Comparison of modelling approaches and layouts for solar chimney turbines. Sol. Energy 2008, 82, 239–246. [Google Scholar] [CrossRef]
- Nizetic, S.; Klarin, B. A simplified analytical approach for evaluation of the optimal ratio of pressure drop across the turbine in solar chimney power plants. Appl. Energy 2010, 87, 587–591. [Google Scholar] [CrossRef]
- Zou, Z.; Guan, Z.Q.; Gurgenci, H.; Lu, Y. Solar enhanced natural draft dry cooling tower for geothermal power applications. Sol. Energy 2012, 86, 2686–2694. [Google Scholar] [CrossRef]
- Zou, Z.; He, S. Modeling and characteristics analysis of hybrid cooling-tower-solar-chimney system. Energy Convers. Manag. 2015, 95, 59–68. [Google Scholar] [CrossRef]
- Klein, S.A.; Alvarado, F.L. EES: Engineering Equation Solver for the Microsoft Windows Operating System; F-Chart Software: Madison, WI, USA, 1992. [Google Scholar]
- Wang, L.; Sunden, B.; Manglik, R.M. Plate Heat Exchangers: Deigan, Application and Performance; WIT Press: Boston, MA, USA, 2008; ISBN 9781853127373. [Google Scholar]
- Lee, E.; Kang, H.; Kim, Y. Flow boiling heat transfer and pressure drop of water in a plate heat exchanger with corrugated channels at low mass flux conditions. Int. J. Heat Mass Transf. 2014, 77, 37–45. [Google Scholar] [CrossRef]
- Amalfi, R.L.; Farzad, V.F.; Thome, J.R. Flow boiling and frictional pressure gradients in plate heat exchangers. Part 2: Comparison of literature methods to database and new prediction methods. Int. J. Refrig. 2015, 61, 185–203. [Google Scholar] [CrossRef]
- Friedel, L. Improved friction pressure drop correlations for horizontal and vertical two phase pipe flow. Presented at European Two Phase Flow Group Meeting, Ispra, Italy, 5–8 June 1979. Paper E2. [Google Scholar]
- Chato, J.C. Laminar condensation inside horizontal and inclined tubes. Am. Soc. Heat. Refrig. Air-Cond. Eng. J. 1962, 4, 52–60. [Google Scholar]
- Kays, W.M.; London, A.L. Compact Heat Exchangers; McGraw-Hill: New York, NY, USA, 1984; ISBN 13: 9780070334182. [Google Scholar]
- Colebrook, C.F. Turbulent flow in pipes, with particular reference to the transition region between the smooth and rough pipe laws. J. Inst. Civ. Eng. 1939, 11, 133–156. [Google Scholar] [CrossRef]
- Munson, B.R.; Young, F.; Okiishi, T.H. Fundamentals of Fluid Mechanics, 7th ed.; Wiley & Sons: Hoboken, NJ, USA, 2006; ISBN 13: 978-1118116135. [Google Scholar]
- Moran, M.J.; Shapiro, H.N.; Boettner, D.D.; Bailey, M.B. Fundamentals of Engineering Thermodynamics, 7th ed.; Wiley: Hoboken, NJ, USA, 2010; pp. 322–328. [Google Scholar]
- Asadzadeh, E.; Alam, M. A survey on hyperboic cooling towers. Int. J. Innov. Res. Sci. Eng. 2014, 8, 1079–1091. [Google Scholar]
- Ming, T.Z.; Liu, W.; Xu, G.L.; Xiong, Y.B.; Guan, X.H.; Pan, Y. Numerical simulation of the solar chimney power plant systems coupled with turbine. Renew. Energy 2008, 33, 897–905. [Google Scholar] [CrossRef]
© 2017 by the authors. Licensee MDPI, Basel, Switzerland. This article is an open access article distributed under the terms and conditions of the Creative Commons Attribution (CC BY) license (http://creativecommons.org/licenses/by/4.0/).