1. Introduction
Energy costs are one of the major operating costs in the meat processing industry (AUD
$1M to AUD
$2M per year for each of the top 25 processing plants in Australia), with primary energy sources including electricity and natural gas [
1]. Most meat processing facilities can be categorized according to the activities performed at the facility and these can include: slaughter only or boning only; slaughter and boning; processing; and/or, rendering. The main energy consuming equipment found at abattoirs include a refrigeration plant, steam and hot water generating equipment, pumps, lighting loads and air compressors. Generally, the supply voltage maintained by the network operator is higher than the optimum operating voltage required for most of the electrical equipment in meat processing facilities [
2,
3]. To ensure adequate power quality (PQ) and reduce energy costs, it is beneficial to maintain a regulated electricity supply that is optimal, as overvoltage leads to inefficient use of energy in the device, and can causes overheating and shortening of equipment life [
1,
2,
3].
According to the current Australian AS60038 Standard Voltages standard [
4], single phase and three phase supply voltages are 230 V and 400 V, respectively, with a tolerance between +10% and −6% and a utilization range of +10% and −11%. However, many local utilities still follow the old standard, for example Ergon Energy in Queensland uses 240 V ± 6% and 415 V ± 6% for single and three phase systems, respectively [
5]. There are a number of reasons that network operators maintain the voltage at the higher end of standard limits; some of these include to avoid voltage drop at the end node, accommodating loss in transmission and to avoid financial loss due to lower voltage at the customer end. Electrical equipment at the end of the network function optimally at 220 V to 230 V and sometimes even as low as 200 V.
When incoming voltages exceed the required equipment voltages, energy is wasted in the form of heat. This results in unnecessary costs and potentially reduces the lifespan of electrical appliances. Generally, power demand will increase with an increase in supply voltage magnitude and vice versa. In effect, a 1% voltage increase leads to a 1% increase in energy consumption and a 1.7% or more increase in reactive power consumption (depending on load types and power factor). Energywise [
6] performed data logging across Australia, and found that approximately 90% of sites are operating at an overvoltage level, with the average voltage being approximately 240 V. To ensure adequate power quality and reduce energy costs, it is therefore beneficial to maintain a regulated electricity supply that is stable at the equipment’s optimal operating voltage, whether using only the grid as an electricity source, or combining the grid with on-site electricity generating sources.
Voltage optimisation (VO) technology aims to reduce electricity usage, power demand and overall cost by reducing supply voltage “downstream” of the meter. VO plays an important role by keeping the voltage at an optimum level, improving the power factor and reducing harmonic losses and voltage deviations and, most importantly reduces energy consumption and carbon emissions for the red meat processing industry [
7,
8]. Recently Snowy Mountains Engineering Company (SMEC) [
9] has developed a voltage optimisation guide that identifies the opportunity for the use of voltage optimisation technology and issues for deployment in various industries.
Like other industries, the supply voltage maintained by the network operator for most meat processing facilities in Australia is usually higher than that required for their equipment to operate efficiently with minimal energy consumption [
2]. Therefore, there is significant scope to reduce energy consumption and carbon emissions for the meat processing industry by managing the voltage levels at facilities using voltage optimization [
7]. VO technologies are currently widely used in different meat industries around the world and evidence suggests that there is a significant opportunity in implementing these technologies in the Australian meat processing industry [
2,
10].
To determine the suitability of adopting VO technology for the Australian meat processing industry, a detailed investigation is required to understand the state of the power network and the electrical equipment used in the industry as well as its corresponding operating conditions. This understanding is needed in order to correctly determine the potential technical, economic, environmental and social benefits to be gained in meat processing facilities after implementing VO technology. Therefore, this research has explored the current operating conditions in representative red meat processing facilities in Australia; specifically, PQ related issues such as voltage level, harmonics and power factor and, in light of this, investigated suitable voltage optimisers for these facilities, considering both technical and economic evaluation.
2. Methodology
Initially, an extensive literature review was conducted to investigate the voltage optimisation and stabilization technologies currently used in other related sectors and internationally in the meat processing industry with their technical and economic performance characteristics. Secondly, catalogues of the equipment, measured load profiles, and grid PQ analyses for two abattoir case studies sites were used to identify the extent of possible improvement to PQ and energy savings opportunities from the use of voltage optimisers. A techno-economic analysis was then undertaken to identify the suitable VO technology solution for the Australian meat processing industry. The methodology of the study is shown in
Table 1.
3. Literature Survey: Voltage Optimisation in Abattoirs
3.1. Electricity Consumption in Abattoirs
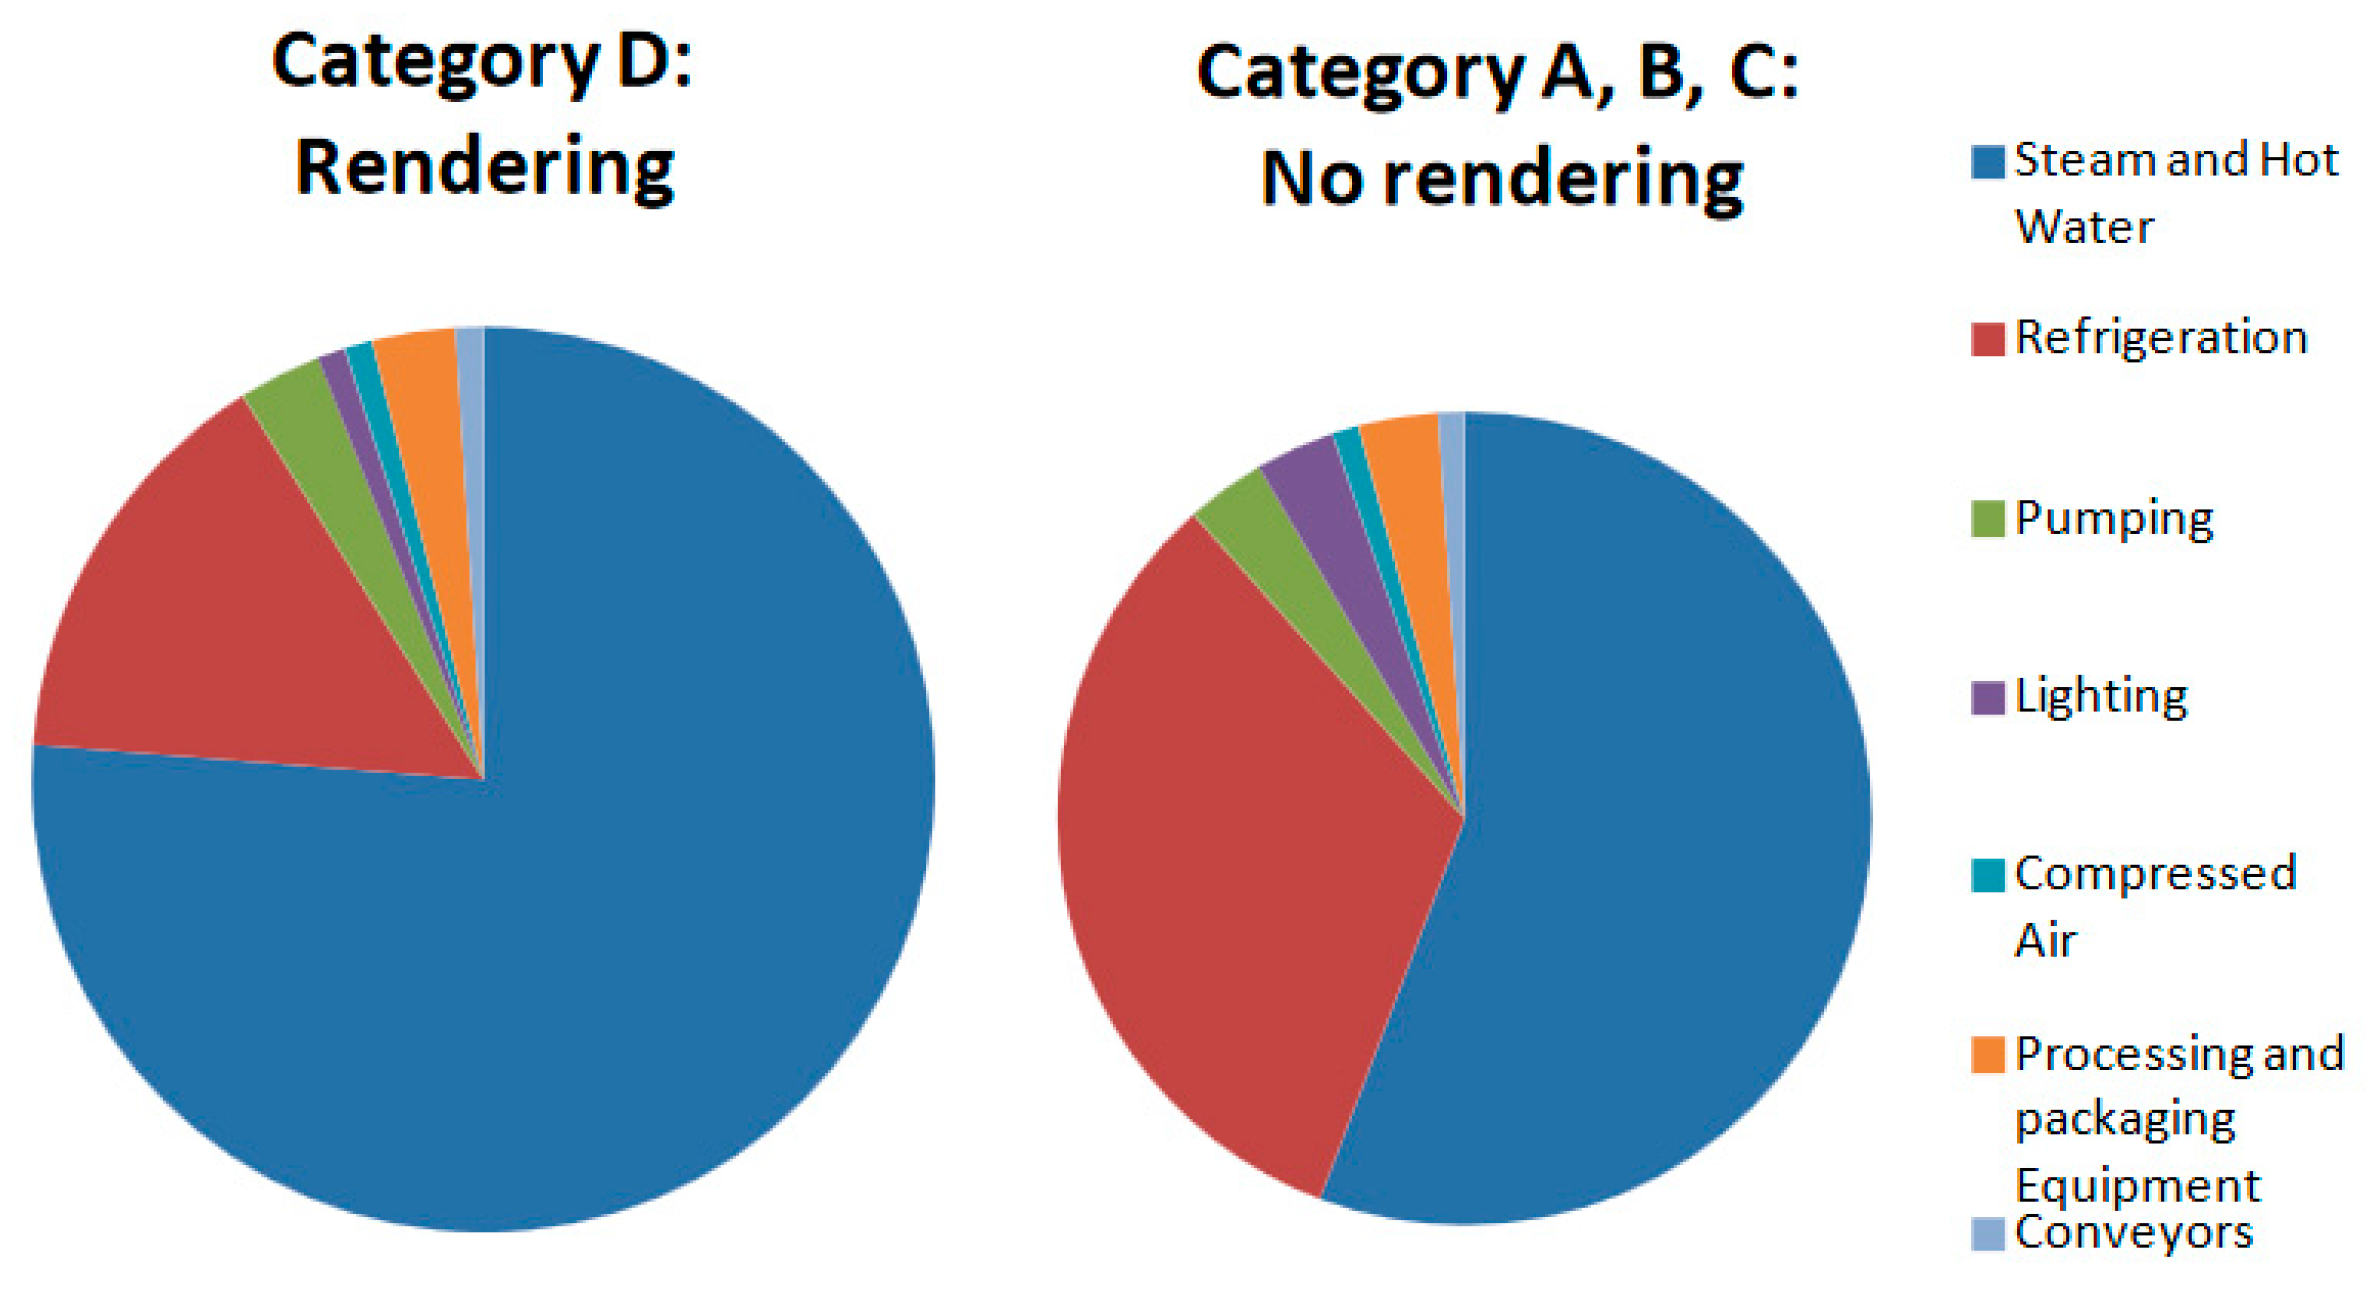
In a meat processing facility, electricity is predominantly used for refrigeration, compressed air, and lighting and gas is used for hot water and steam systems. Under the Domestic Processors Energy Efficiency Program (DPEEP) [
1] five Australian meat processing sites were surveyed to investigate energy consumption from each major energy service or equipment type, categorised as either rendering or non-rendering sites. Rendering sites use more electricity compared to non-rendering sites due to the additional steam and equipment required for the rendering process and wash down activities. The main energy consuming services/equipment include refrigeration (15–31%), steam and hot water (53–77%), pumping (3%), lighting (3%), processing equipment (2%), conveyors (1%), packaging equipment (1%), and air compressors (1%), as shown in
Figure 1 [
1].
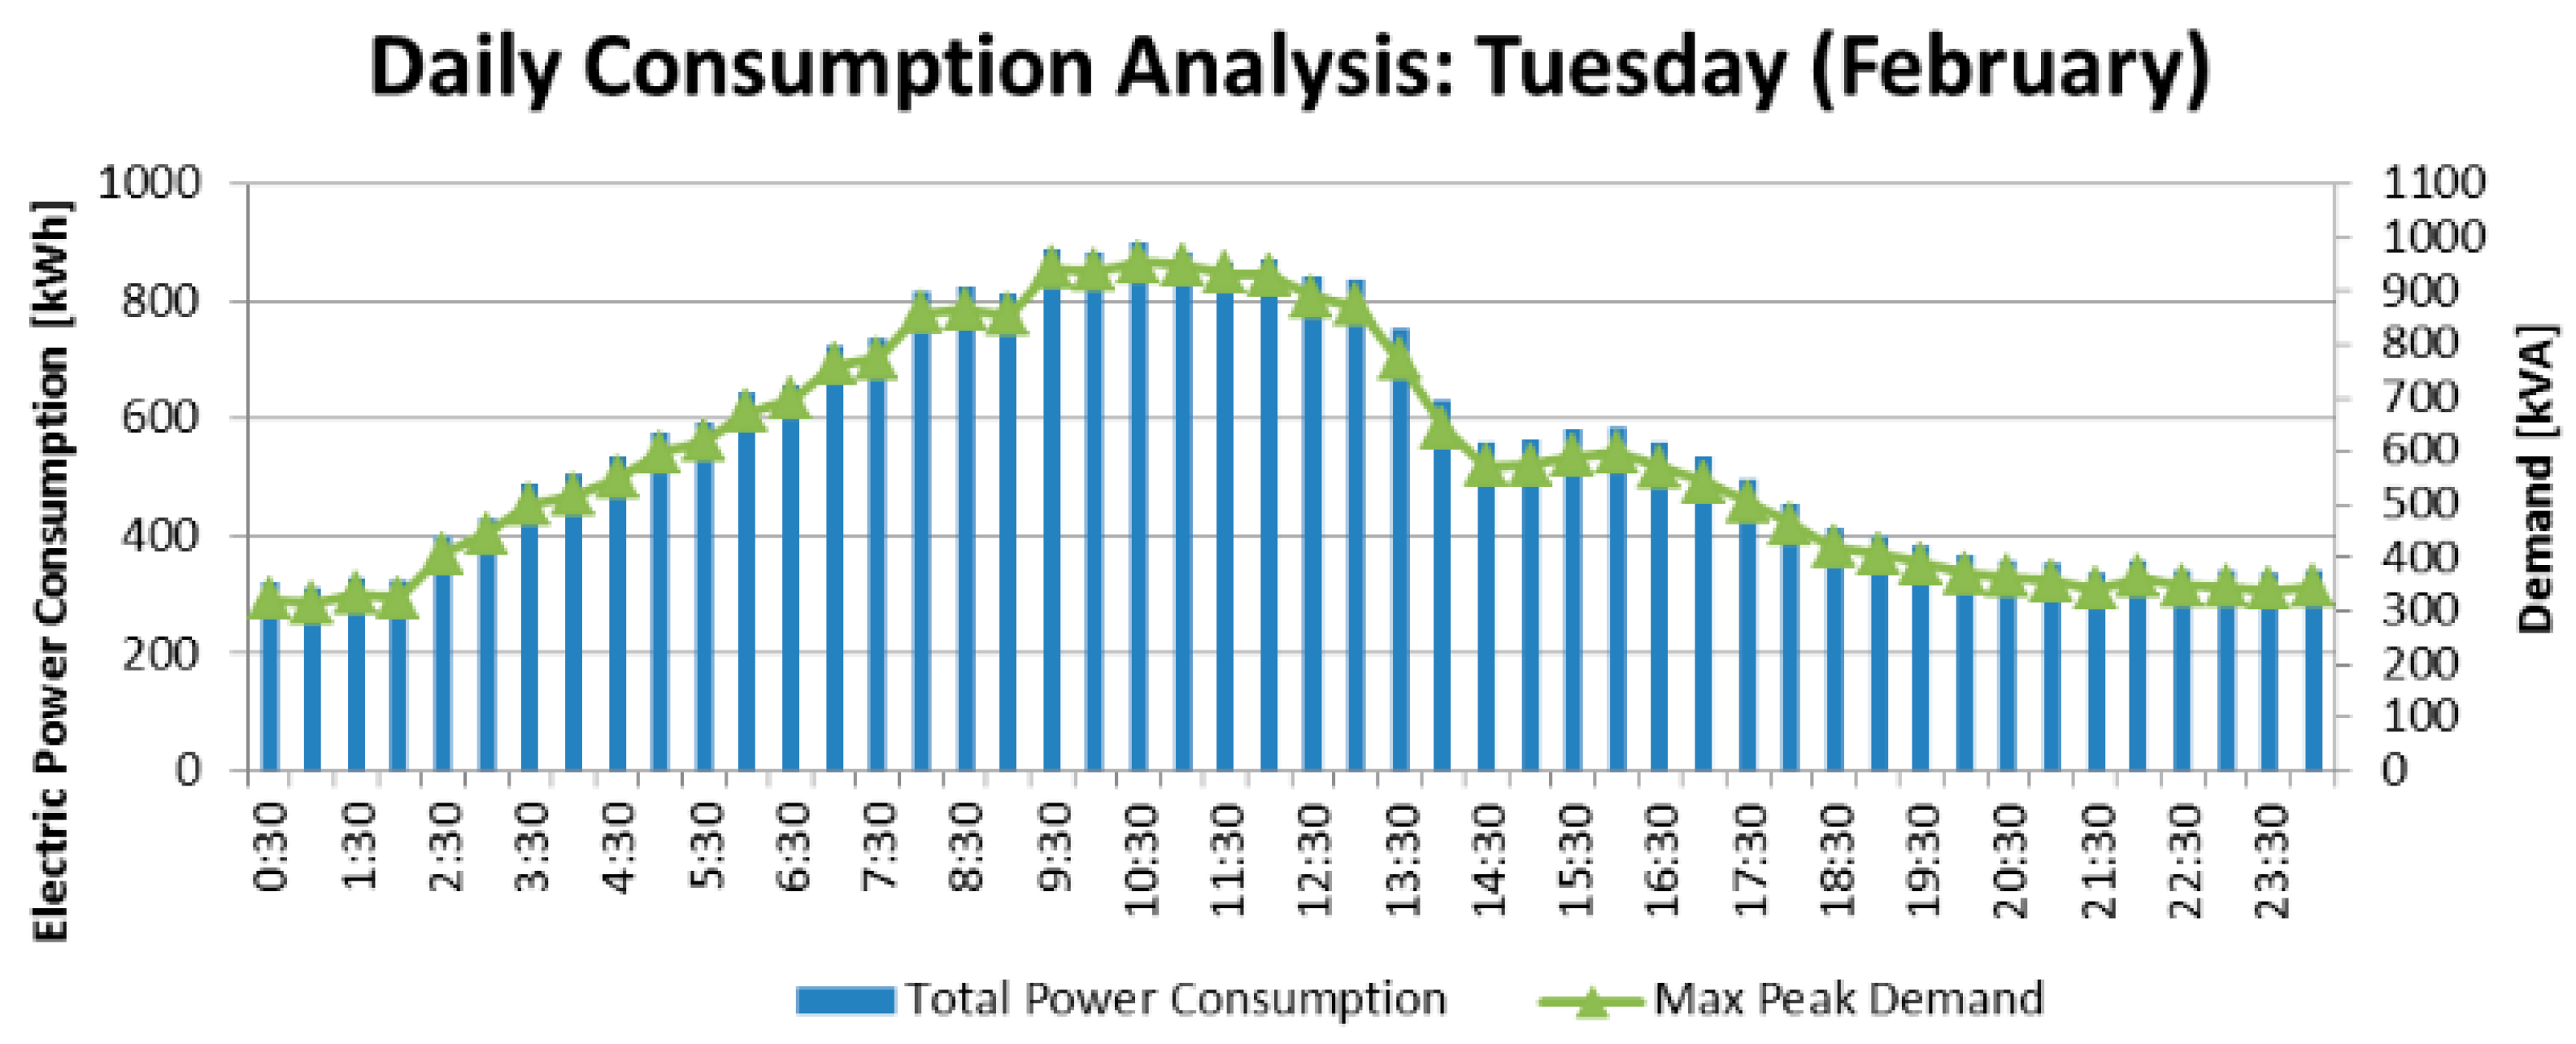
On a day-to-day basis, typical electrical load profiles for a meat processing facility in Australia reveal that electric power consumption is the highest during boning and the initial stages of carcass cooling, which occurs from 05:00 to 14:30, Monday to Friday, as shown in
Figure 2. Compared to a typical weekday, which has a distinct peak throughout the day, the typical weekend electricity consumption is relatively constant throughout the day.
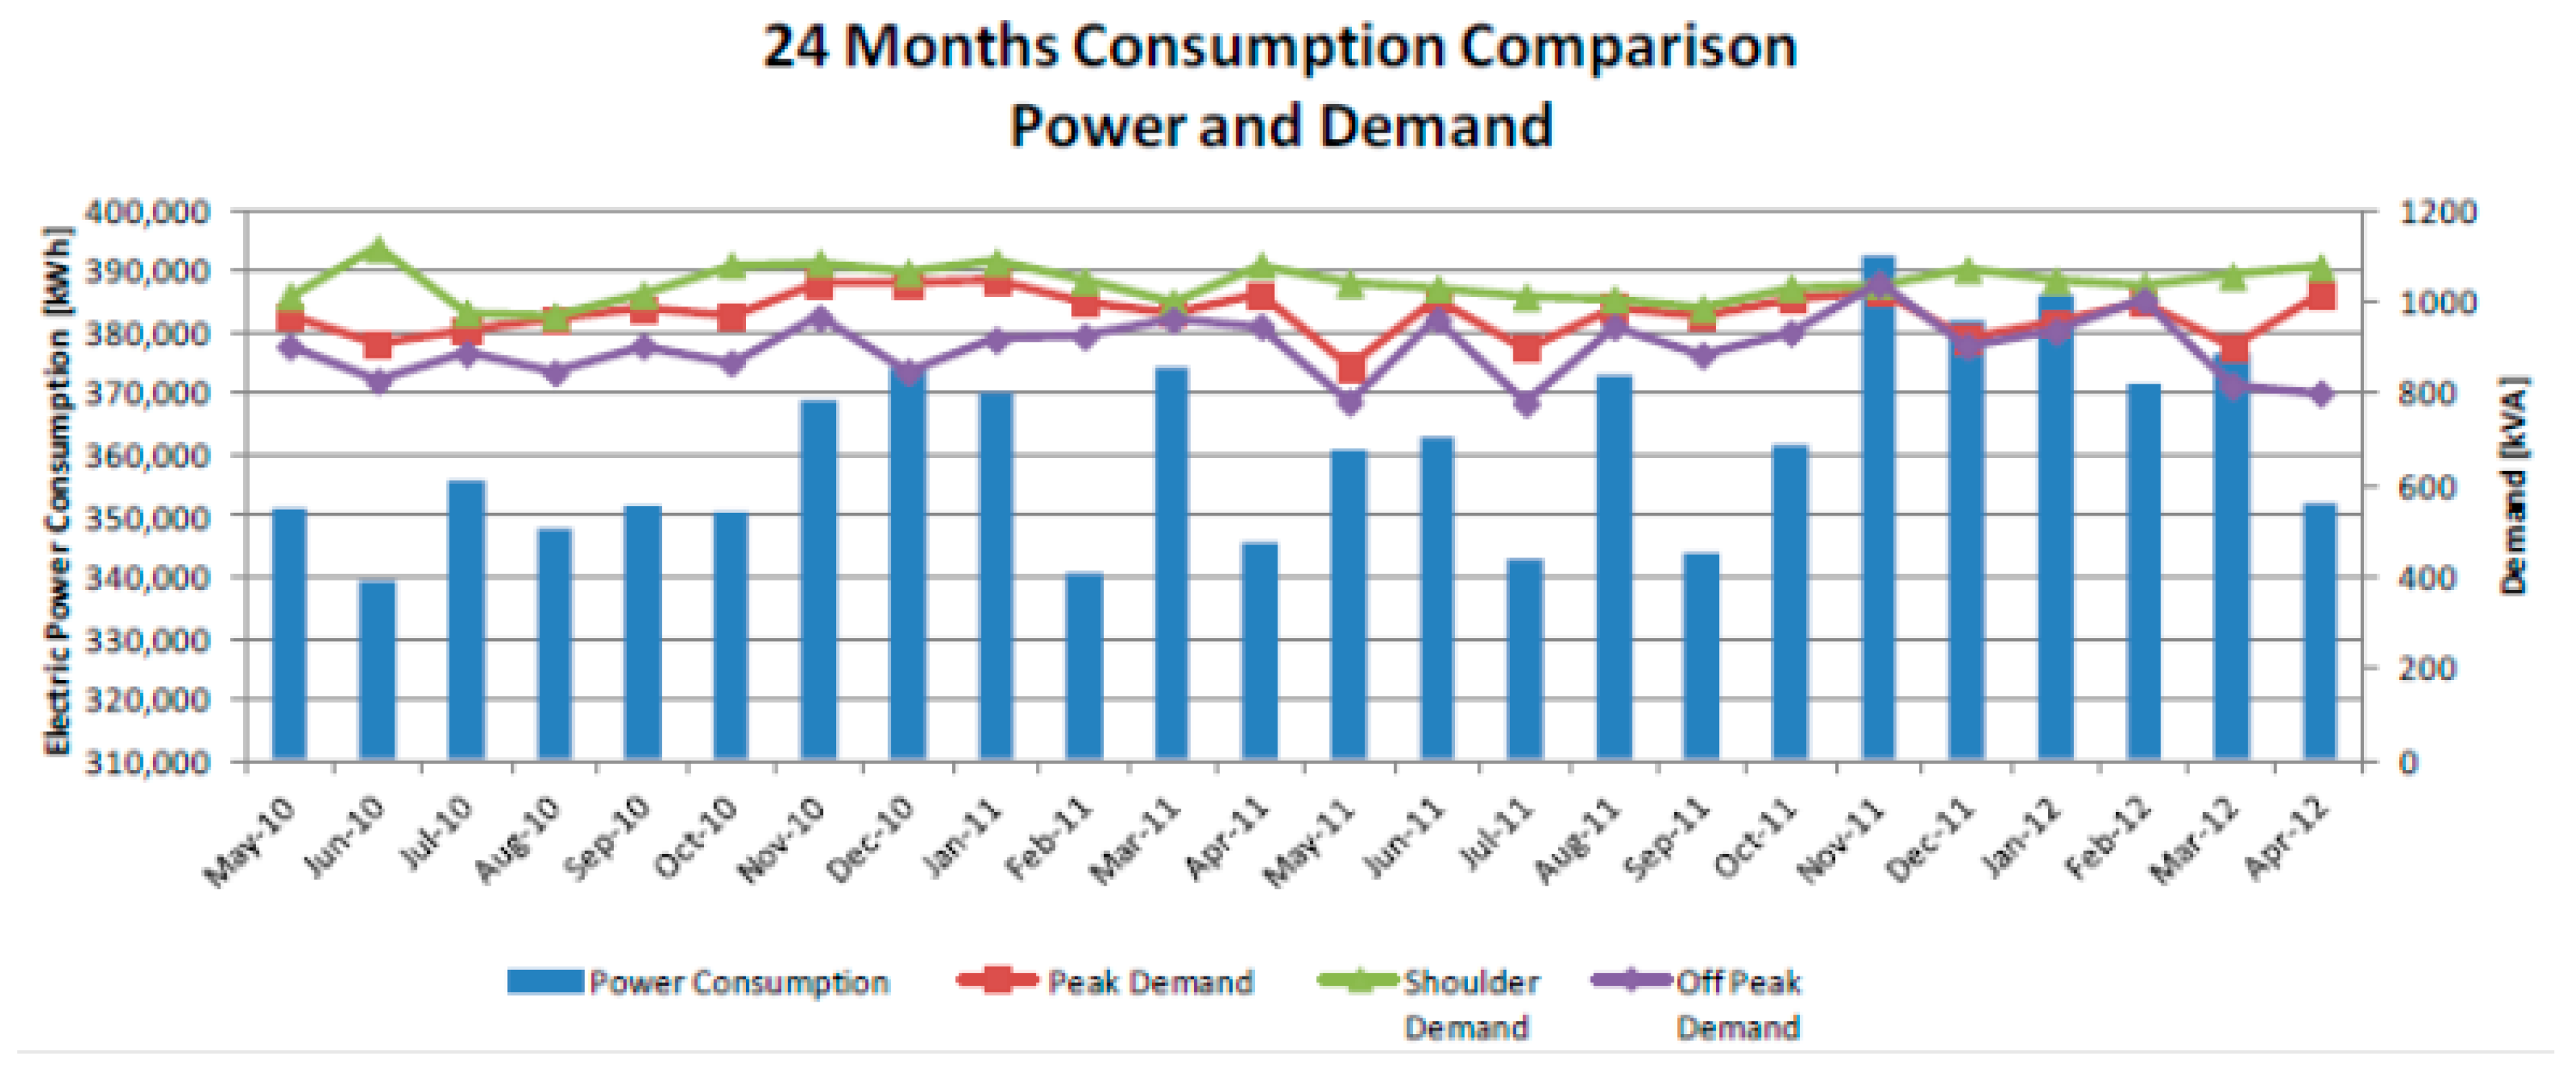
From analyses undertaken in the Domestic Processors Energy Efficiency Program [
1], electricity consumption increases during the summer months (November–March) due to additional cooling and refrigeration requirements, as shown in
Figure 3.
What can be gleaned from typical energy consumption quantities, proportions, and usage patterns in Australian red meat processing facilities is that there is significant potential for reducing the electricity consumption by reducing the supply voltage to an optimum level, regardless of whether the site has rendering or non-rendering activities.
3.2. Voltage Optimisation
Voltage optimisation can be beneficial for utilities through peak loading relief of distribution systems, reduction in fuel consumption (if, say, the utilities have local power generation plants), reduction in emissions (should energy regulations place a cost on emissions), and overall cost reductions [
11,
12]. The technology can also improve power quality by reducing harmonic and transient voltages, as well as balance phase voltages. A reduction and balancing in electricity supply voltage provides a saving in energy consumption (kWh) and a reduction in maximum demand (kW and kVA), which results in a reduction in electricity bills for the customer [
13,
14]. Other purported benefits include improved power quality, less equipment maintenance, improved equipment life, and reduced energy consumption, which all lead to significant cost savings [
15].
Voltage optimisation is considered to be part of voltage management. Depending on how voltage may impact an abattoir’s operations and productivity, and the performance of site equipment, voltage management may include [
16]:
Voltage stabilization (e.g., manages electrical transients);
Voltage regulation (e.g., controls over- and under-voltage);
Voltage reduction (e.g., reduces voltage by a selectable percentage); and
Voltage optimisation (e.g., adjusts voltage within a certain range).
Voltage stabilization and voltage regulation are both ways of protecting equipment from variations in voltage (either fast short period transients, or slower longer periods of over- or under-voltage). Both of these technologies do not change the underlying supply voltage but adjust the voltage around the supplied grid voltage and ensure this voltage is maintained. Voltage reduction and voltage optimisation are both ways of reducing the voltage to a set value in order to realise energy savings. Common types of voltage optimisation units with their strength and shortcomings are presented in
Table 2.
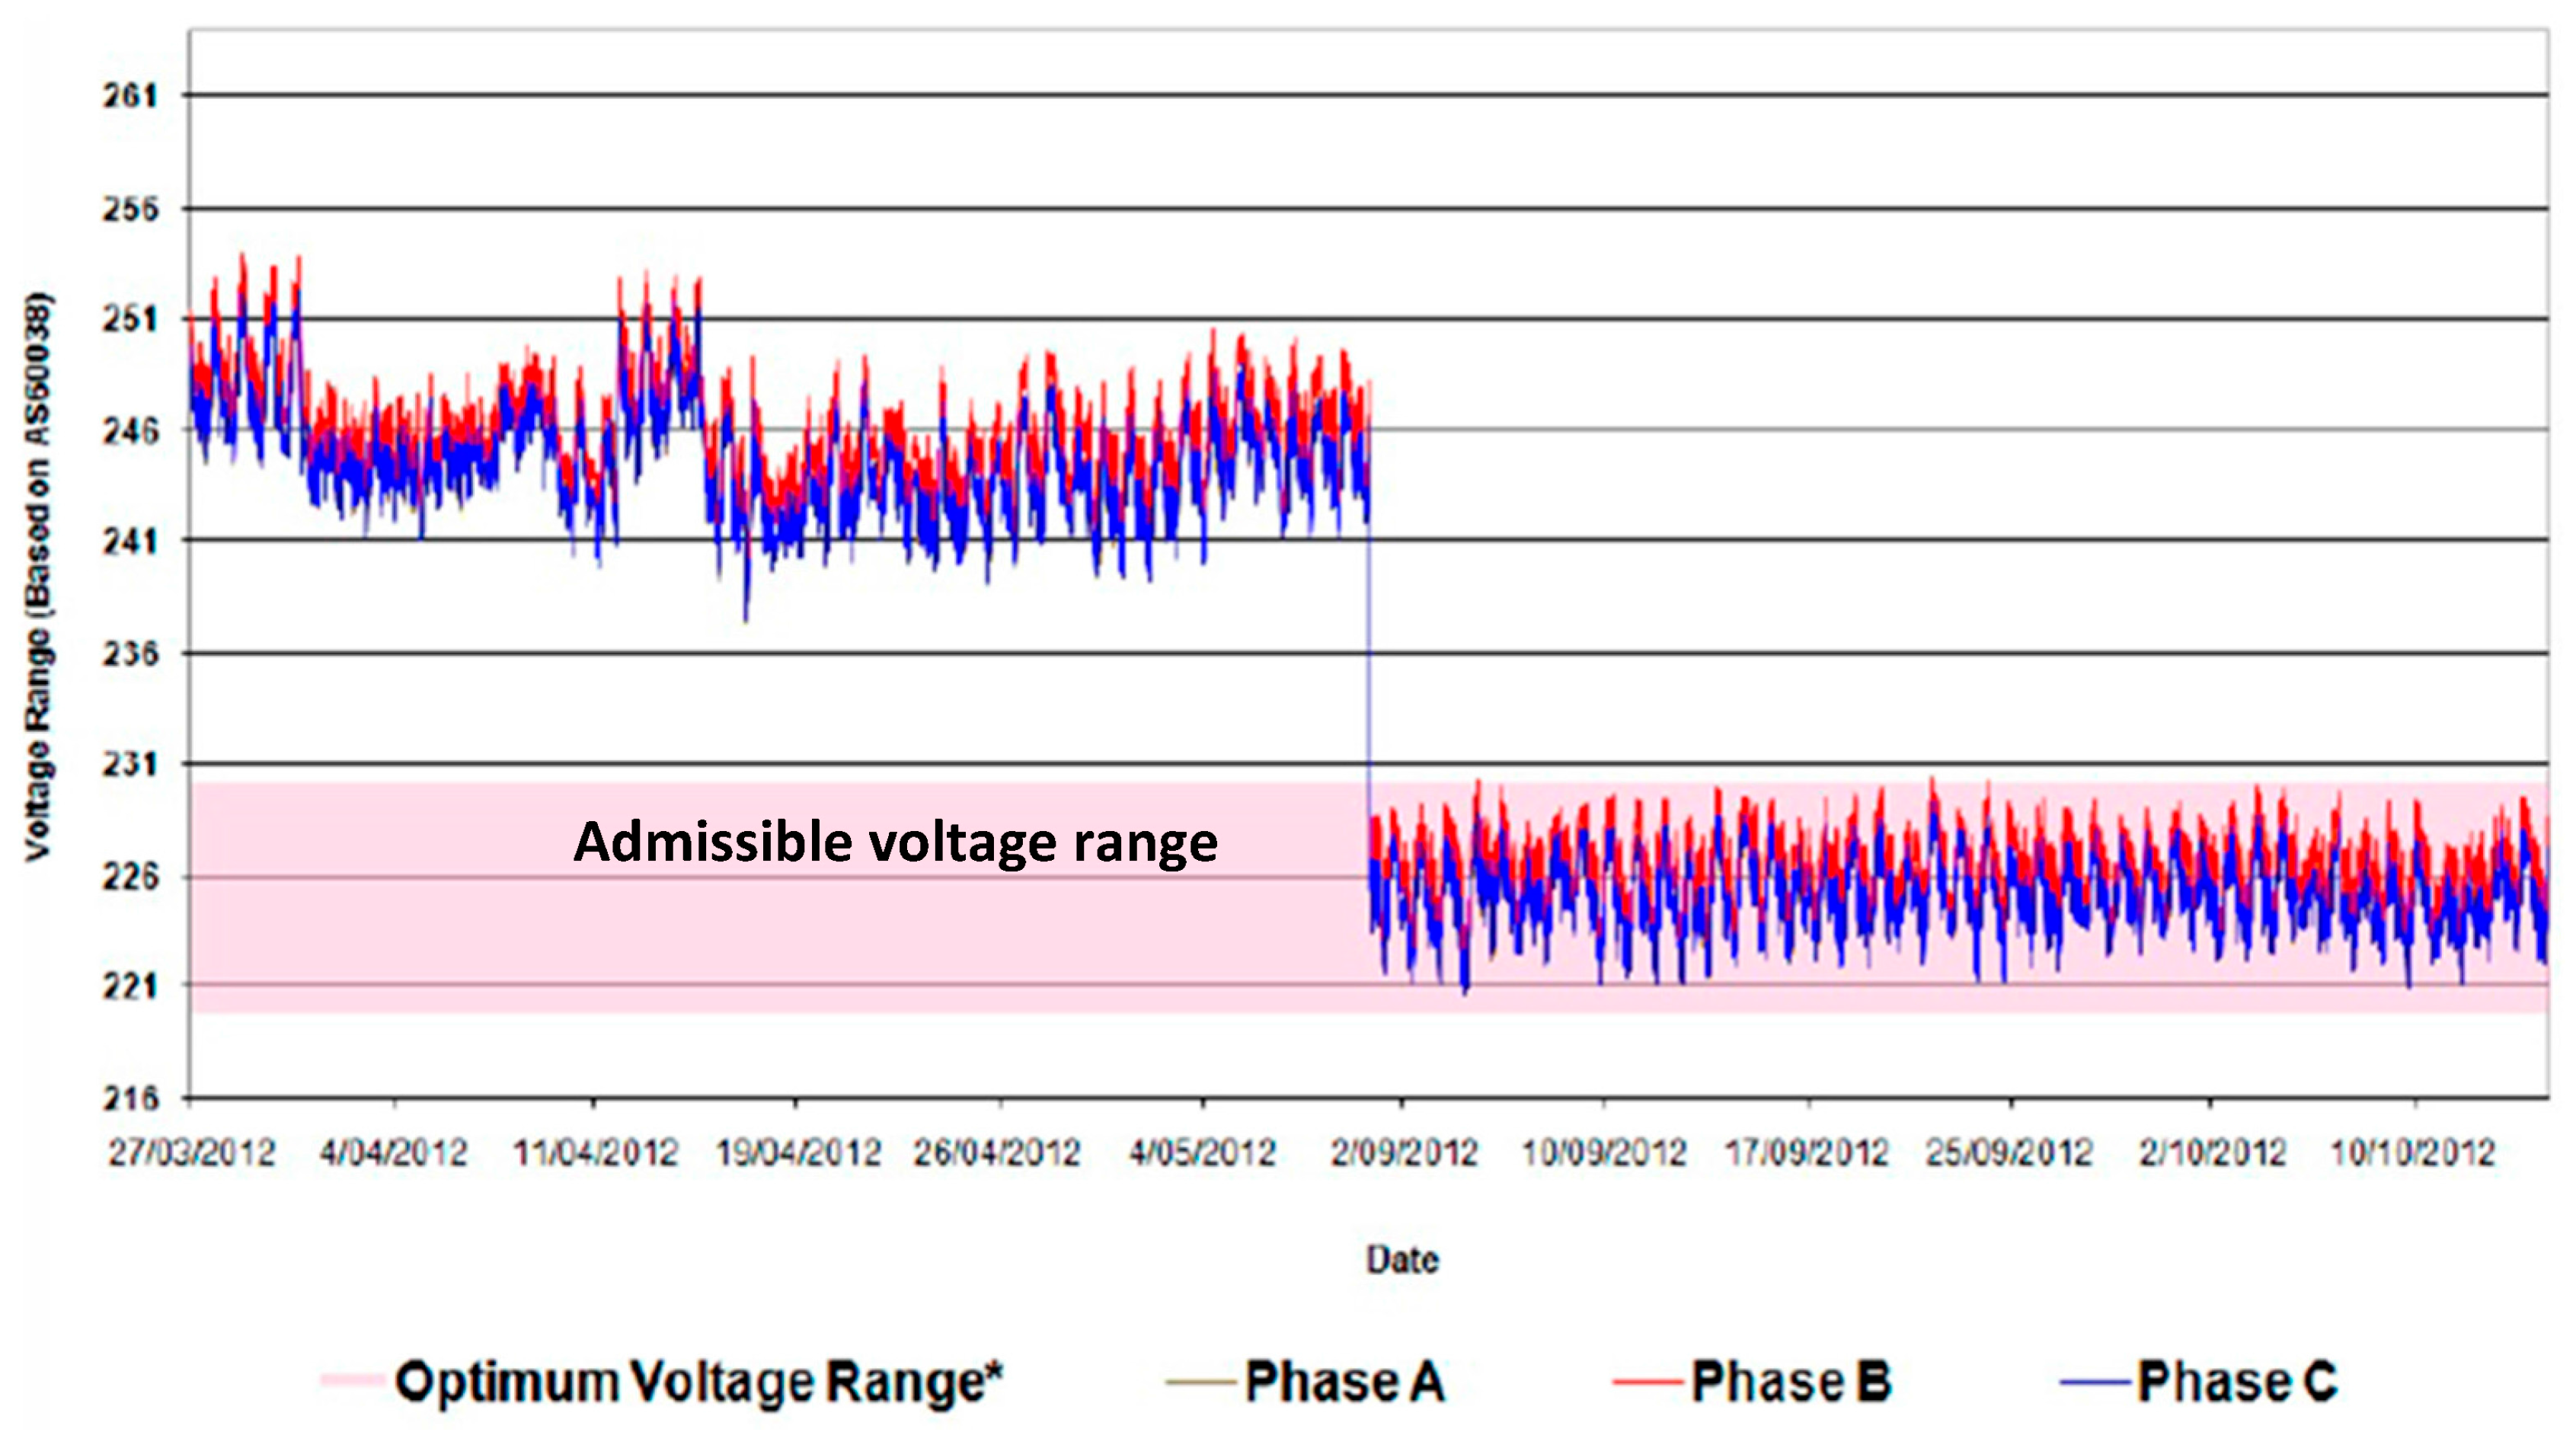
Figure 4 shows a typical voltage profile, measured from a representative survey site for six weeks, pre- and post-VO installation. During the pre-installation process, the voltage range is 241 V to 251 V most of the time, and after the VO installation, the voltage range becomes 220 V to 231 V, i.e., in the admissible voltage range. For facility owners, the benefits of voltage optimisation include reduction in energy consumption, and therefore reduction of electricity bills; removal of harmonics (which generally cause overheating, misfiring in variable speed drives and torque pulsations in electric motors); reduction of transients (over- or under-voltage); improvement of power factor; and an overall reduction in maintenance costs [
13,
14].
To date, very few published studies have been performed considering the impacts of VO technologies in red meat processing industries.
Table 3 demonstrates the different types of VO technologies that are currently used in meat industries throughout the world, together with their voltage optimisation and energy saving scenarios. All the studies presented in
Table 3 considered the annual energy cost savings and payback period for the installation of VO units. The benefit from voltage optimisation in the form of energy and cost savings is highly dependent on the existing site voltage, the size of the voltage tapping applied, and the proportion of voltage-dependent equipment used on site. The studies in
Table 3 are also case-specific and do not provide any clear and simple guidelines on assessing the applicability of voltage optimisation at a given site.
The appliances used in abattoirs are not all voltage sensitive, i.e., power consumption and/or output of an appliance does not vary with changes in the supply voltage.
Table 4 summarises the common voltage sensitive and non-sensitive equipment, with many of these equipment types being found in red meat processing sites. This checklist can be used as an initial check to determine whether equipment is likely to be sensitive to voltage or not, and therefore potentially benefit from voltage optimisation. In an abattoir, many motors or appliances have variable speed drives (VSD) to regulate the speed and rotational force or torque output. The energy savings in VSD loads is highly dependent on the type of voltage optimisation technology applied, with some providing little to no savings on VSD loads. To ensure optimum savings and performance, a comprehensive analysis of a building or site’s power conditions should be completed prior to installation.
4. Power Quality Analysis
In order to understand the voltage profile and power quality of typical red meat processing facilities electricity usage data have been collected from two abattoirs; one in Western Australia (WA) and another in Queensland (QLD). Site analyses of electrical loads with PQ issues in particular voltage regulation, power factor, and total harmonic distortion (THD) was performed at each abattoir to determine whether there would be benefits from applying voltage optimisation. This detailed data analyses for operations during representative weekdays and weekends are presented in this section for both abattoirs, with consideration for individual transformers and the whole site.
4.1. Case Study Site 1: Abattoir in Western Australia
4.1.1. Data Collection
The abattoir in Western Australia is an older, medium sized red meat facility processing approximately 600 head a day, and includes rendering. The facility operates one killing shift, five days a week, for 50 weeks a year. Seven main transformers supply electricity to the equipment at this site. The annual electricity consumption of this representative site is approximately 15,800 MWh. This facility has no power generation on-site and electricity is only supplied from the main grid by the Government owned transmission and distribution company. The abattoir is at the end of the local feeder line and is known to have lower voltages and regular periods of power drop. The electricity data were collected from the four most heavily loaded of the seven transformers. These transformers represent more than 90% of the electricity used on site. The specifications of the monitored transformers are as follows:
Refrigeration Feeder—Transformer 1 (TX_1): The capacity of TX_1 is 1 MVA. This transformer supplies the main part of the refrigeration plant and the boning room loads.
Kill Floor Feeder—Transformer 2 (TX_2): The capacity of TX_2 is 1 MVA. This transformer supplies the kill floor motor control, air compressors and plate freezer switchboard.
By-Products Feeder—Transformer 3 (TX_3): The capacity of TX_3 is 1 MVA. This transformer supplies the by-products motor control center and the site fire pumps.
General Distribution Feeder—Transformer 6 (TX_6): The capacity of TX_6 is 1.5 MVA. This transformer supplies part of the refrigeration plants and general loads.
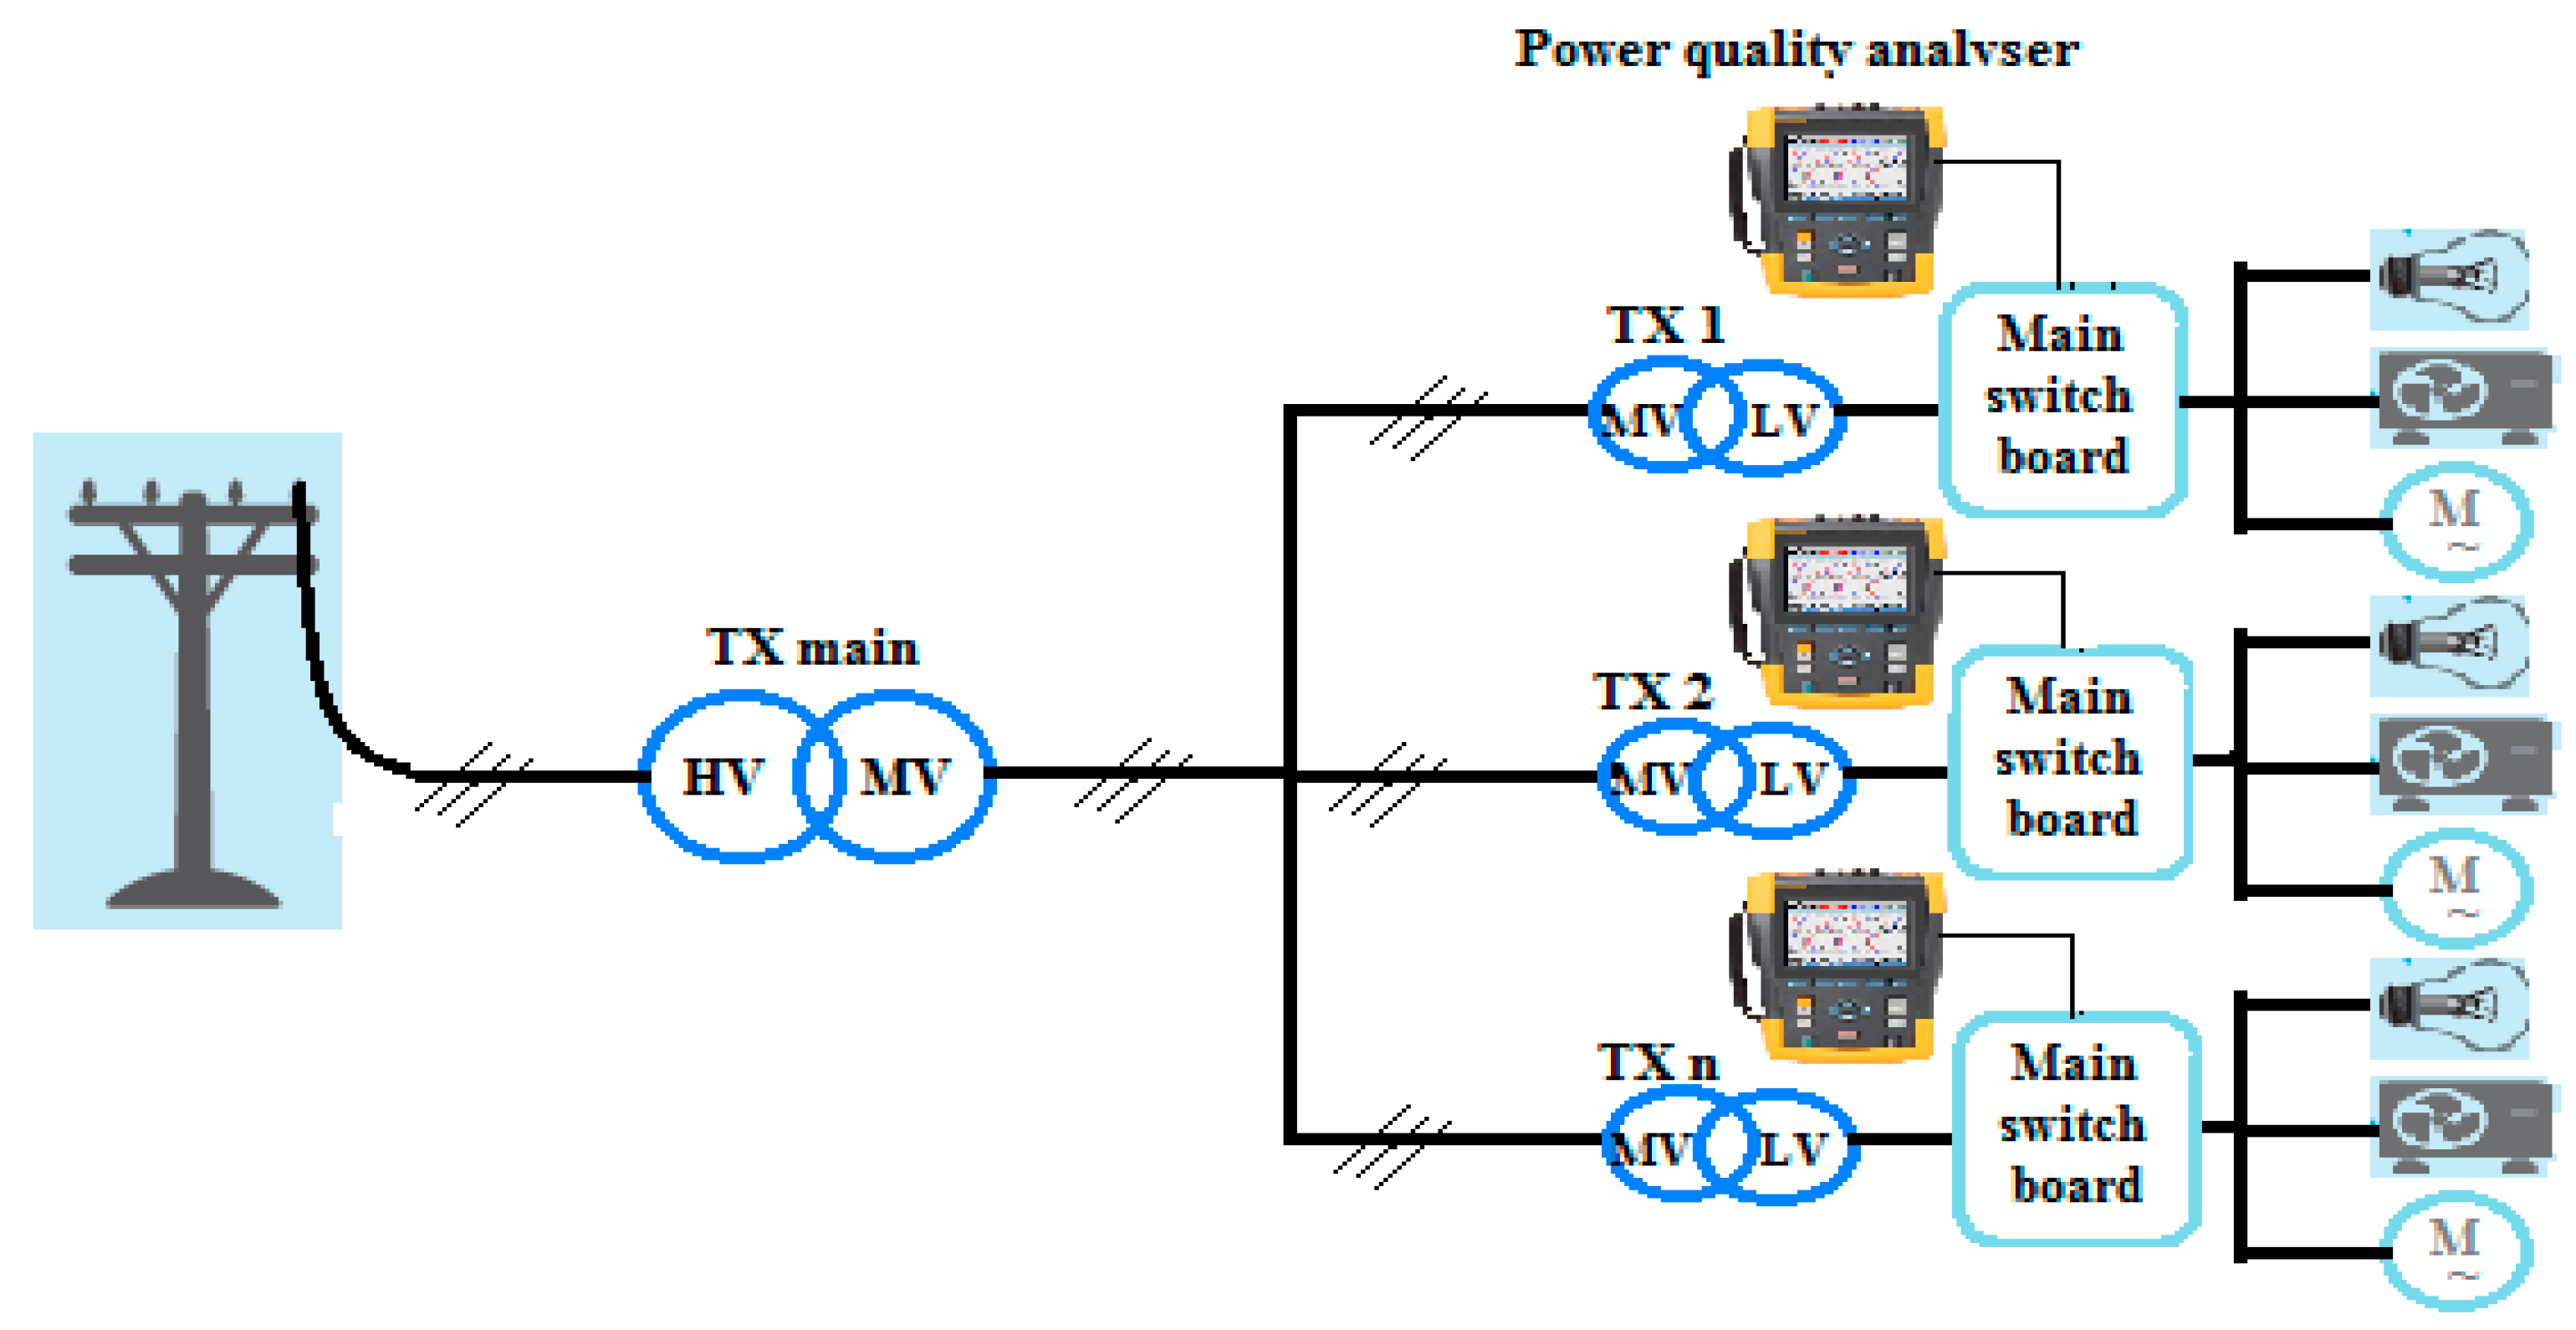
A power quality analyser (Fluke 435 Series II Power Quality and Energy Analyzer) [
23] was installed, as shown in
Figure 5, at each of the transformers on-site for a week to measure the electricity data at 1-min intervals. Monitoring was undertaken over a four-week period leading up to (Tx_1, Tx-2 and Tx_6), and just after (Tx_3) Christmas, as this is the busiest time of year for the abattoir, when the electrical equipment will be under most load. The electricity data collected from the individual transformers were phase and line voltages, phase and line currents, active power (per-phase and total), reactive power (per-phase and total), apparent power (per-phase and total), voltage and current unbalances, power factor, THD, and a number of other relevant parameters.
4.1.2. Load and Voltage Profiles
The following sections present the load and voltage profiles for the refrigeration, kill floor, by-products, and general distribution (with some refrigeration) feeder transformers at the abattoir. The deviation from the average supply voltage and weekly voltage frequencies are also presented for each of these transformers.
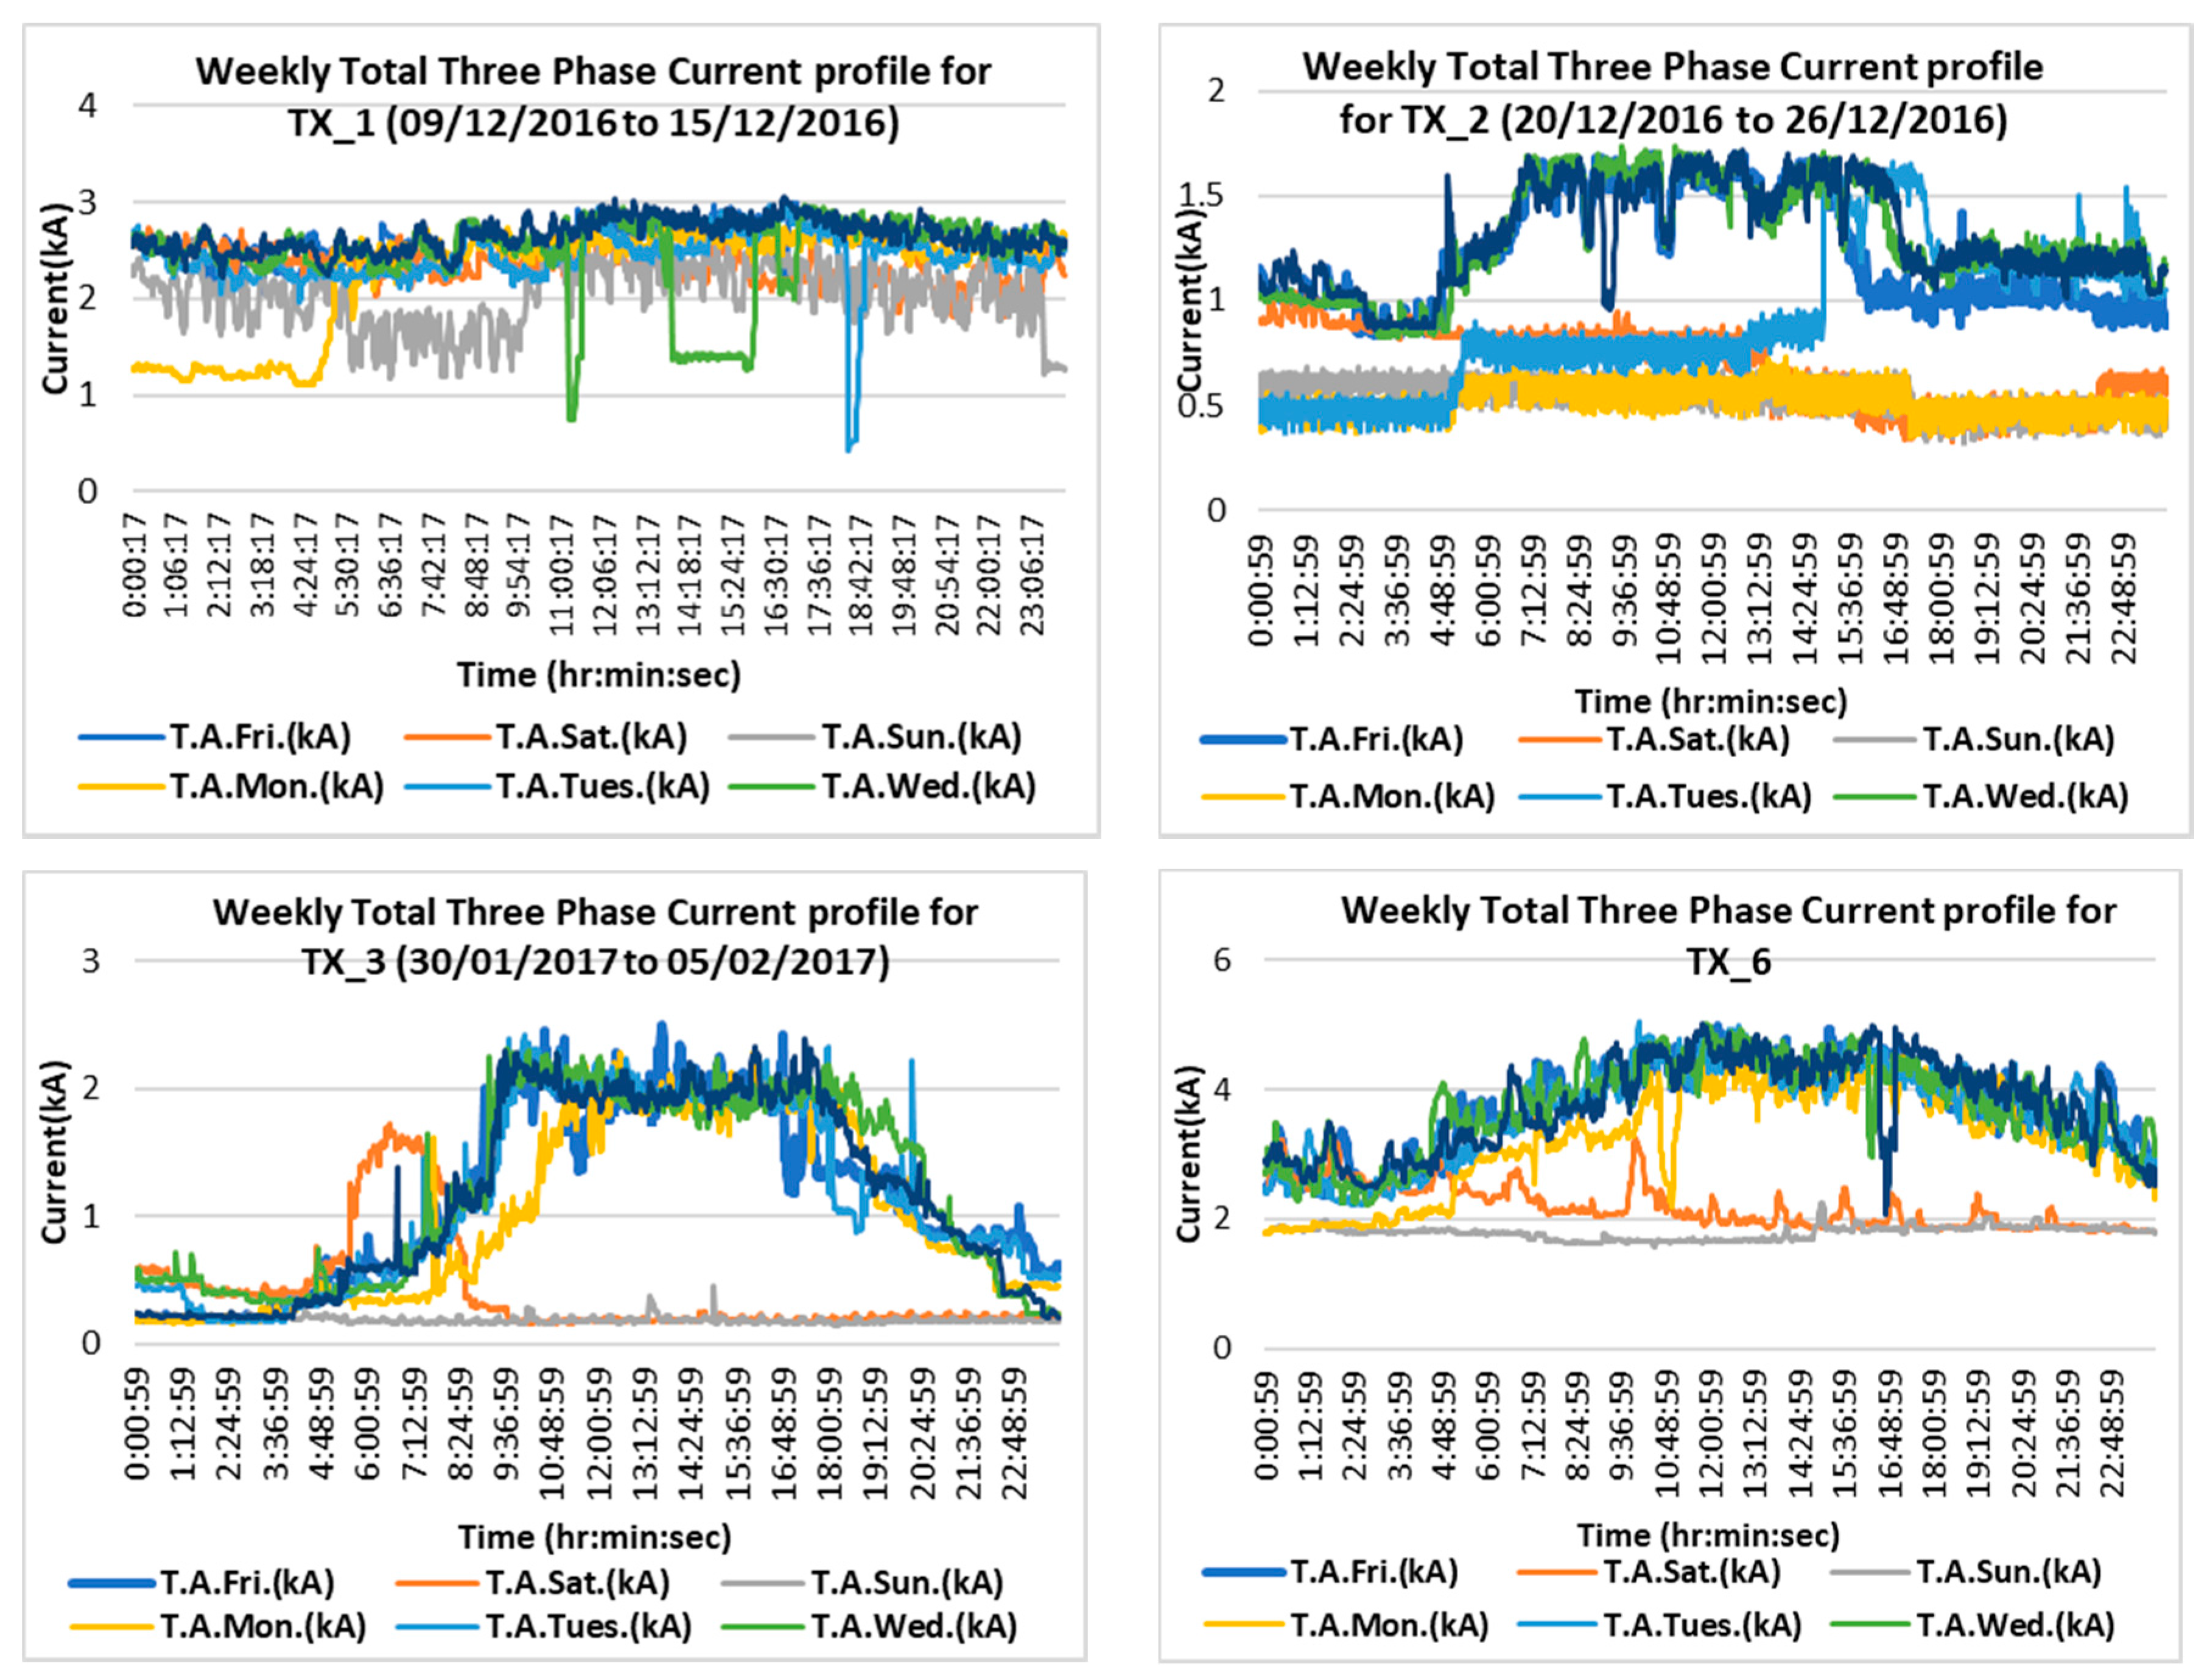
It can be seen in
Figure 6 that the general distribution transformer (TX_6) is more heavily loaded than the other three transformers. During weekdays (Monday to Friday), kill floor (TX_2), by products (TX_3), and TX_6 have similar consumption trends with a significant rise during the day, corresponding to the start and end of the slaughter and boning shifts, returning to a lower overnight base load. This reflects the loads presented in the literature [
1]. It should be noted that TX_2 was measured during the week of Christmas, and so there are only three weekdays when full slaughtering and boning shifts occurred (Wednesday, Thursday and Friday). These are still representative of normal operation at high throughput. Refrigeration (TX_1) shows a much flatter energy consumption pattern where current profiles vary from 2 kA to 3 kA throughout the weekdays. On weekend days (Saturday and Sunday), the TX_6 and TX_2 transformers are less loaded, as there are no slaughtering activities on the weekends. TX_1 continues to have a significant load over the weekend because it services the main refrigeration load.
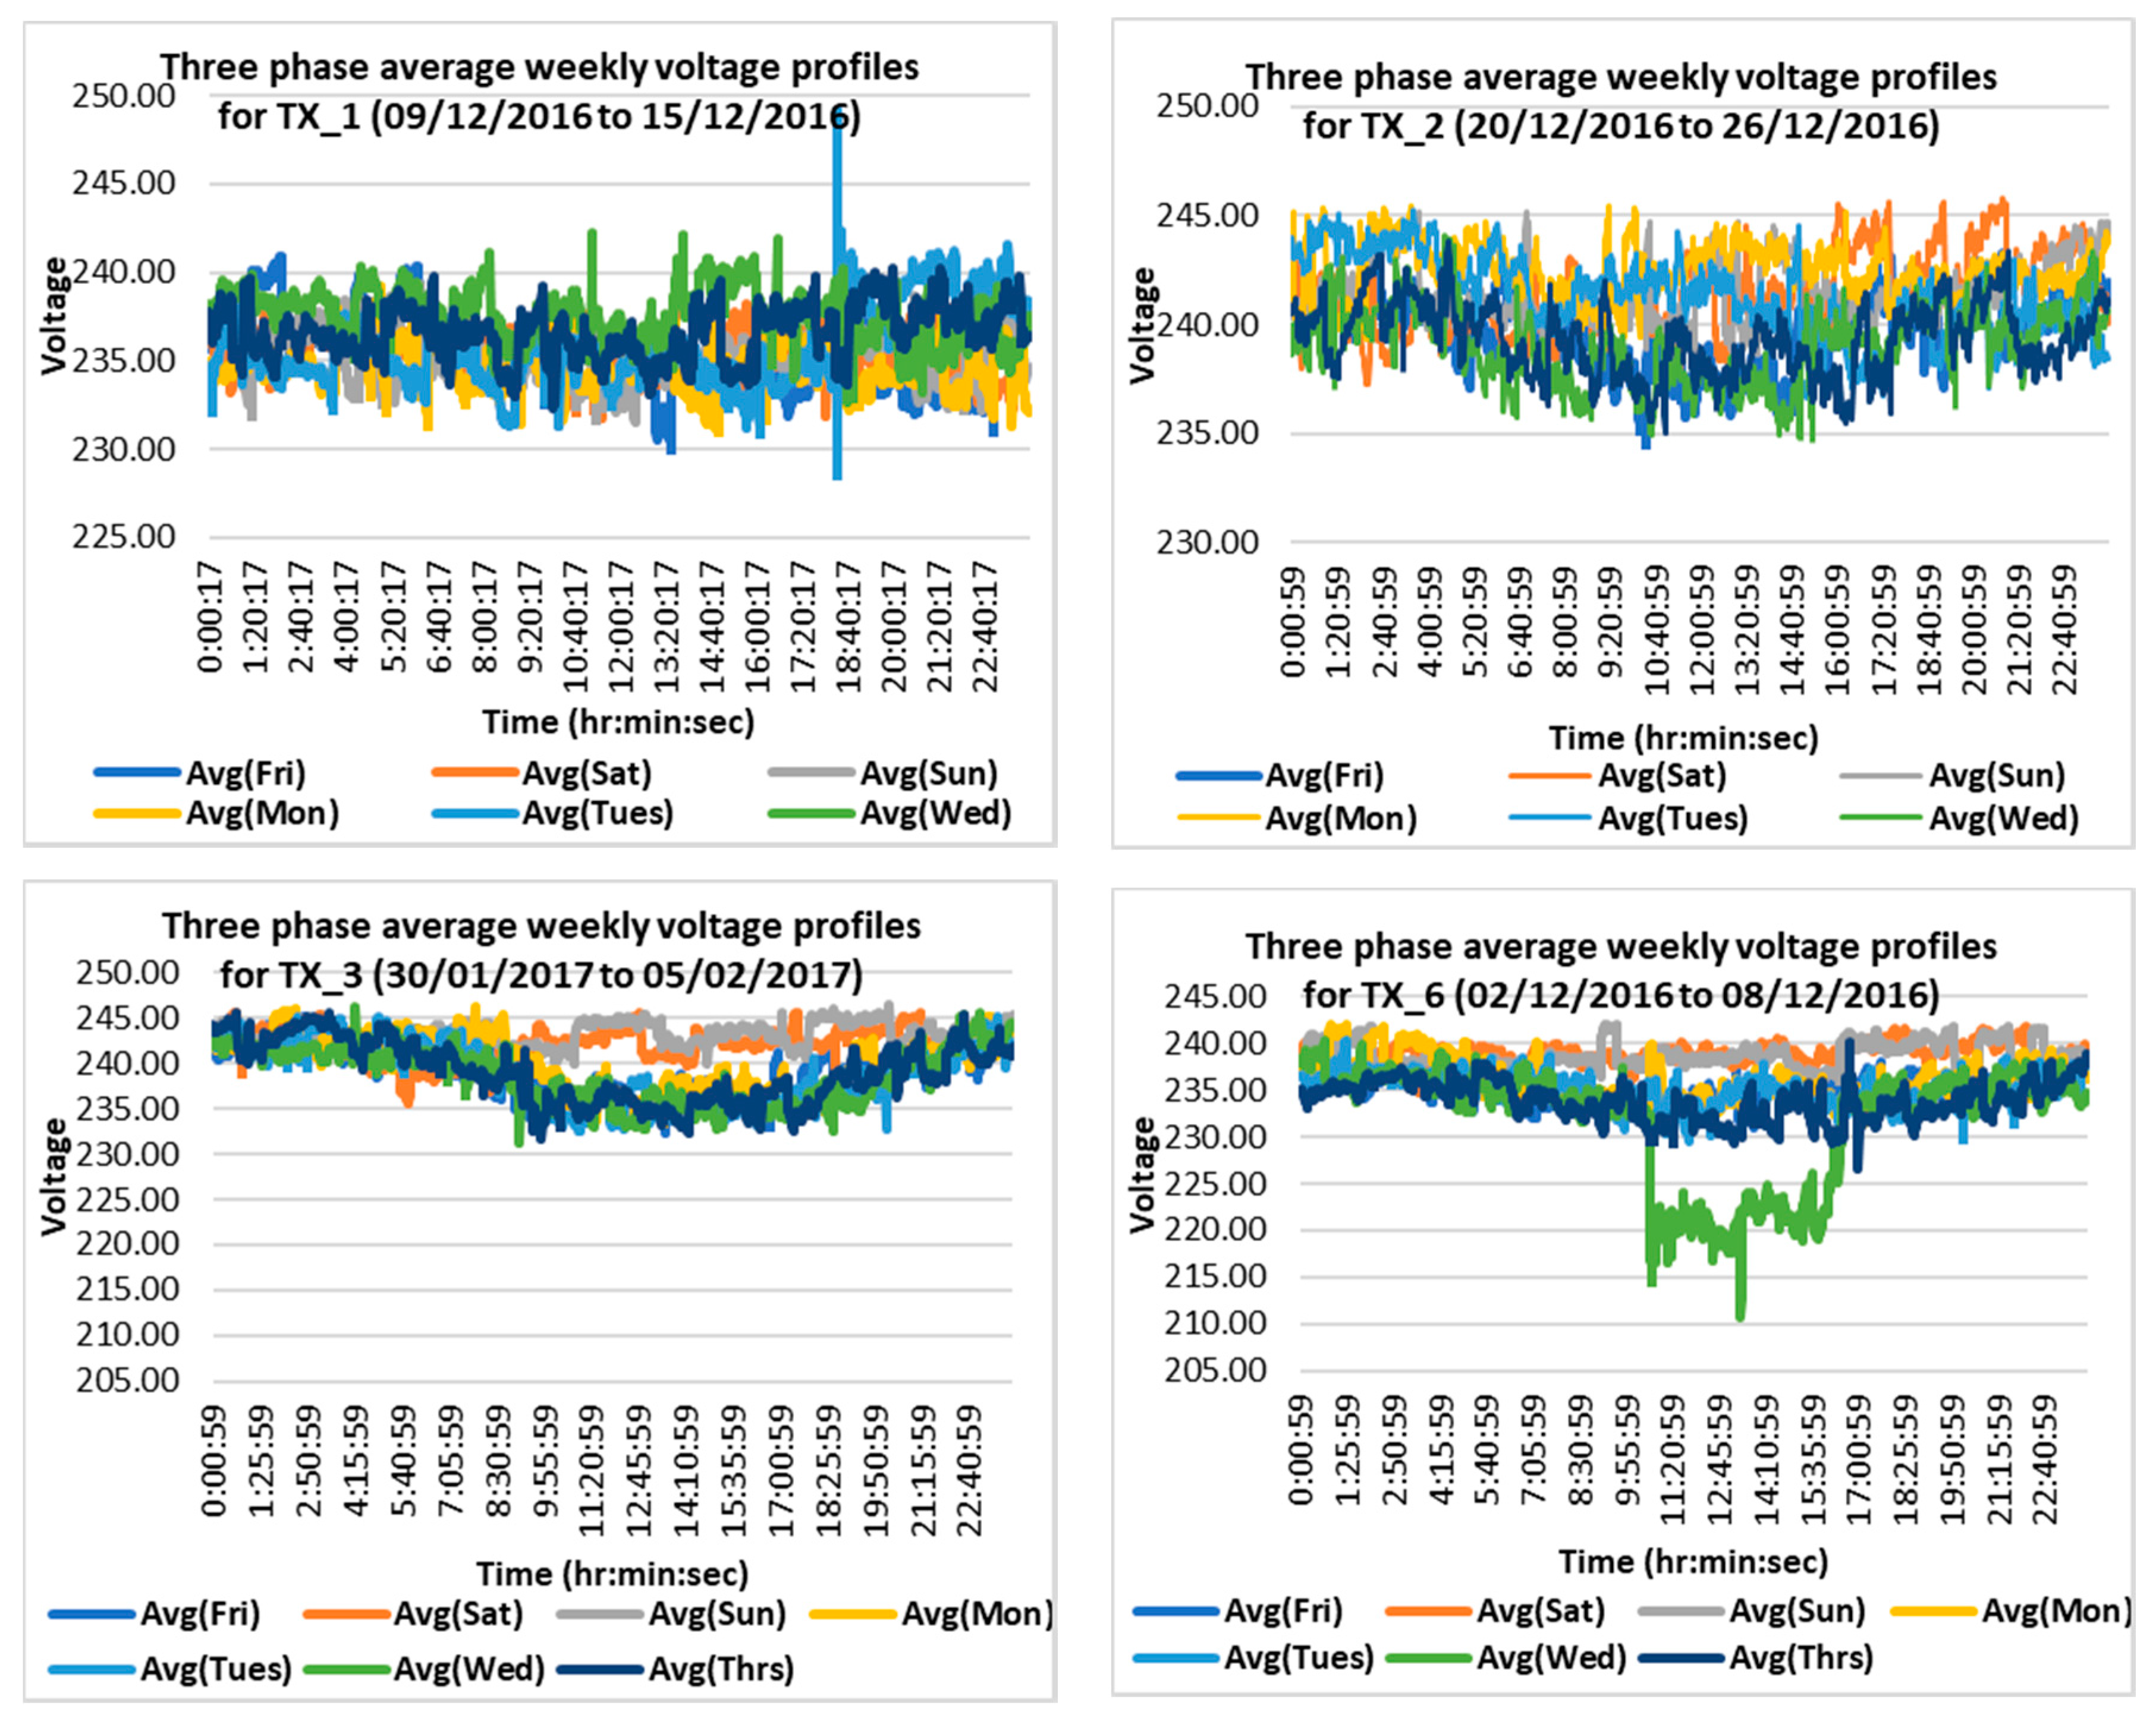
In
Figure 7, it can be observed that during the measurement period there is a voltage drop in TX_6 on Wednesday which remained at a value of less than 225 V for around approximately 6 h. An observed transient voltage rise and drop occur in TX_1 on Tuesday of the monitoring period. The transient voltage rise is close to 250 V. Average voltage variations throughout the week for TX_6 and TX_1 are seen to vary between 233 V and 240 V. However, voltage levels in TX_2 are significantly higher than the other three transformers, ranging from 238 V to 245 V. It is not clear whether this reflects normal operations or because TX_2 was measured close to the Christmas break, when the surrounding sites were not operating at normal loads.
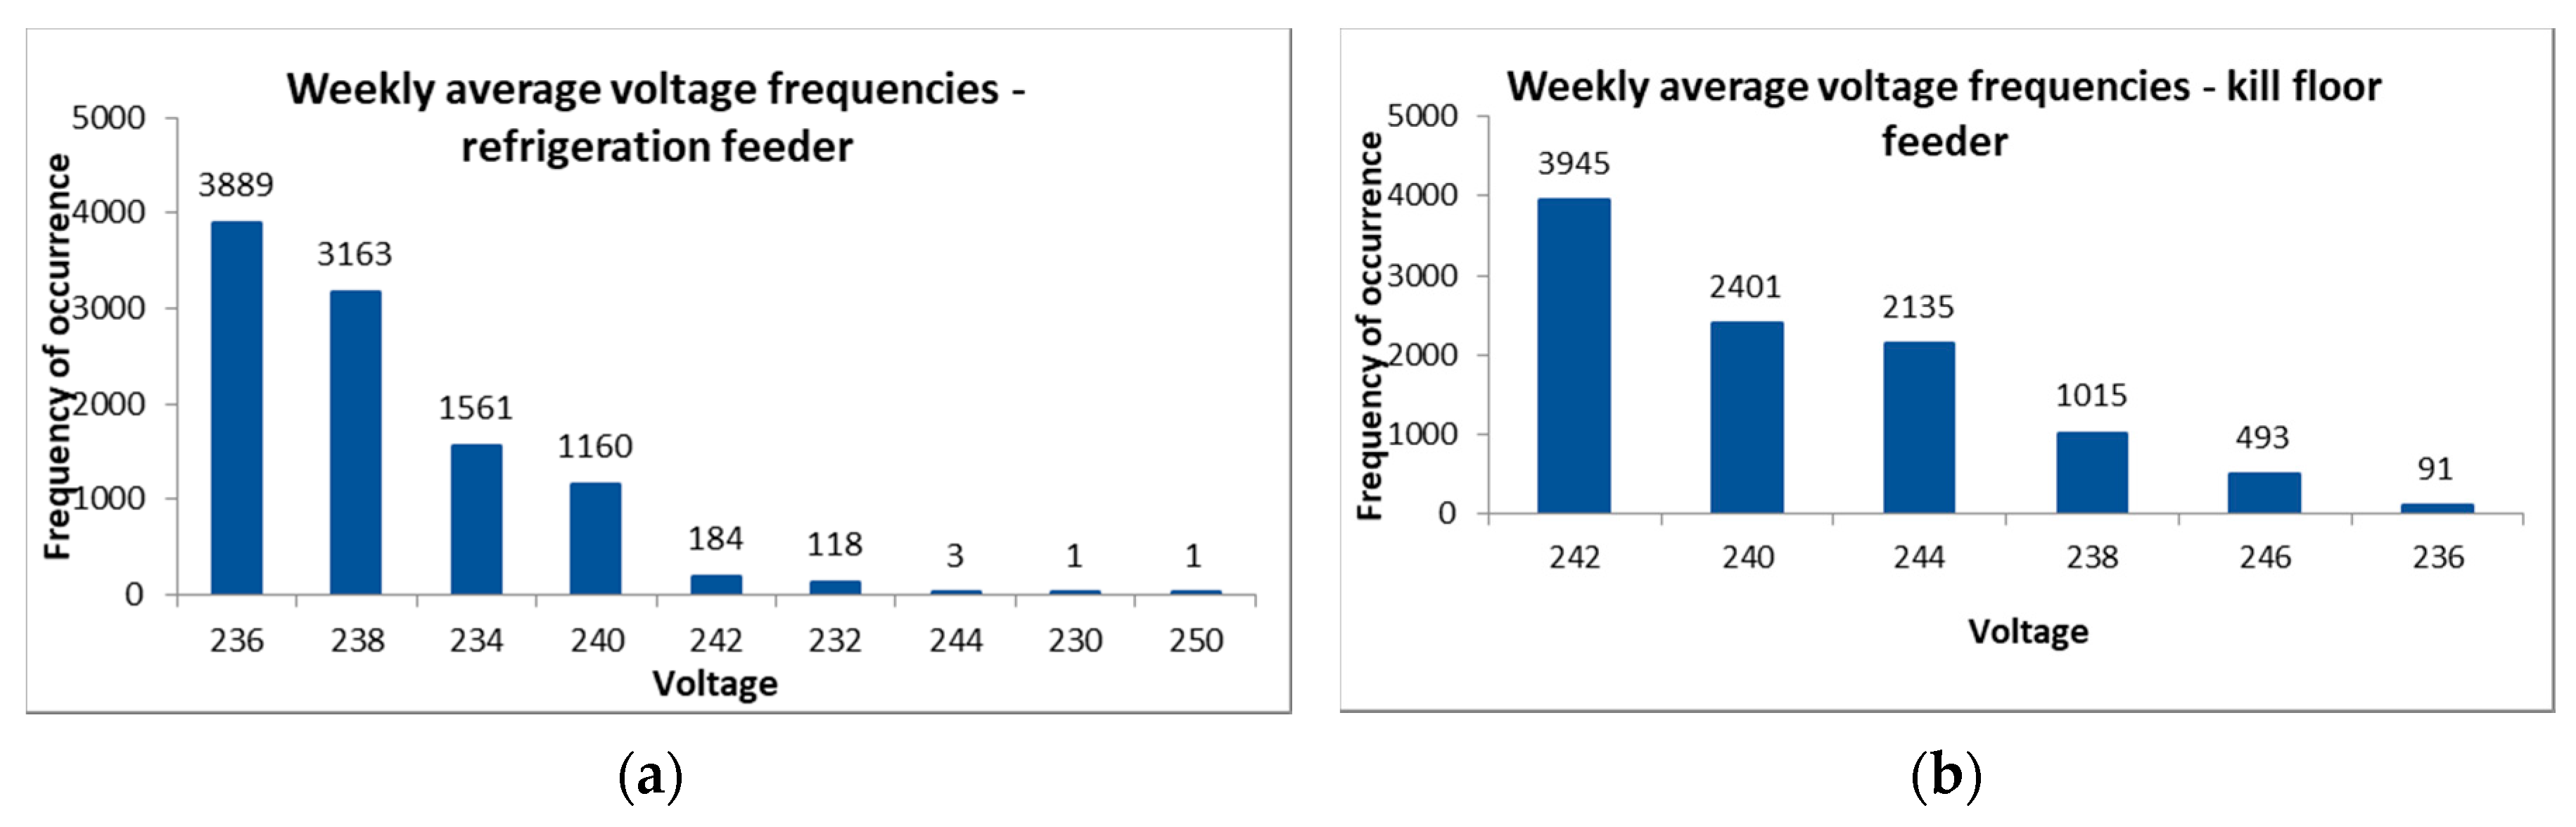
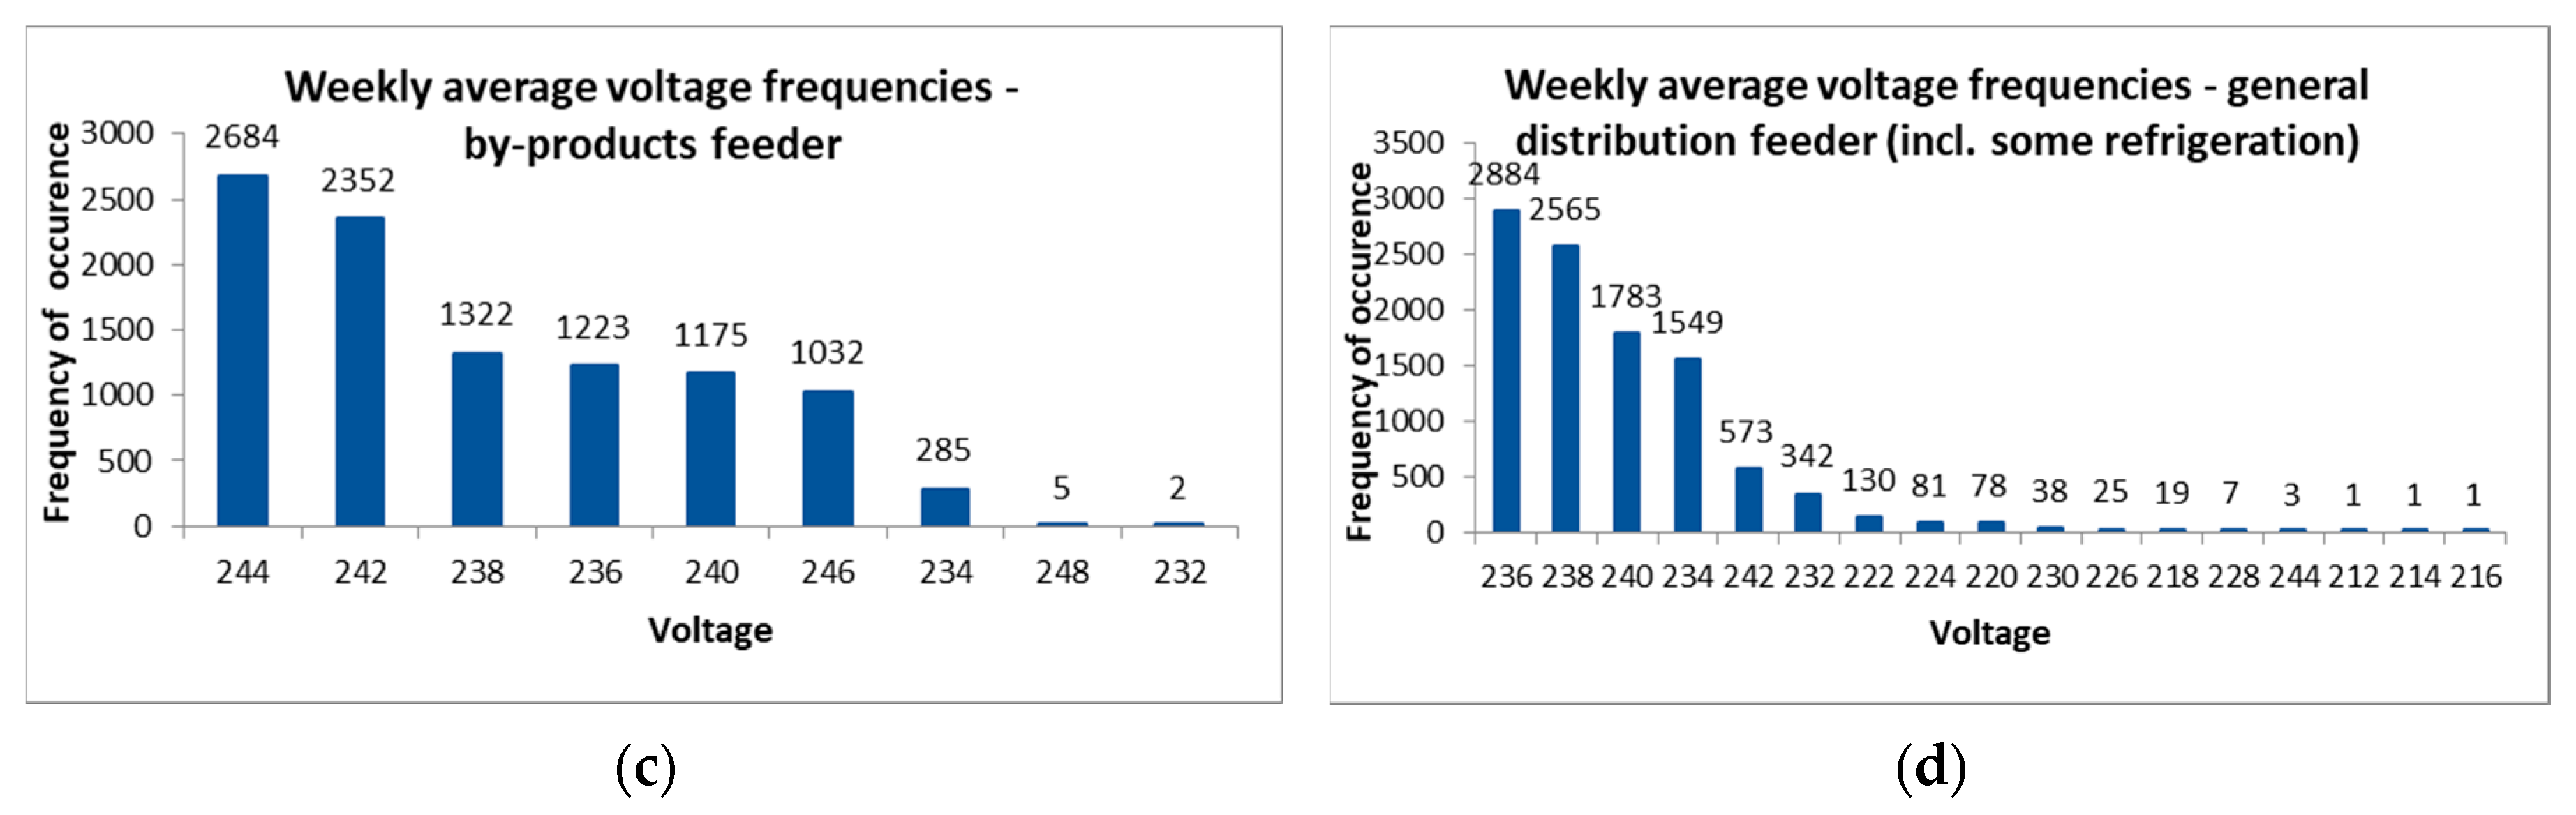
Figure 8a–d presents the weekly voltage frequencies for each transformer.
Figure 8 shows that voltage levels between 236 V and 238 V are dominant for the general distribution (
Figure 8d) and refrigeration (
Figure 8a) transformers. However, for the kill floor and by-products transformers, voltage levels of 240 V and above are more dominant, as shown in
Figure 8b,c, respectively.
The over voltage conditions for kill floor and by-products transformers will increase energy losses, overheat the connected equipment, and eventually shorten the equipment life. Optimising the supply voltage for these two transformers will help prevent equipment and machinery from early burn-out and reduce maintenance costs, as well as offer potential savings on energy. Therefore, VO systems could be used to reduce the incoming voltage by a set amount to the optimum level for these two transformers.
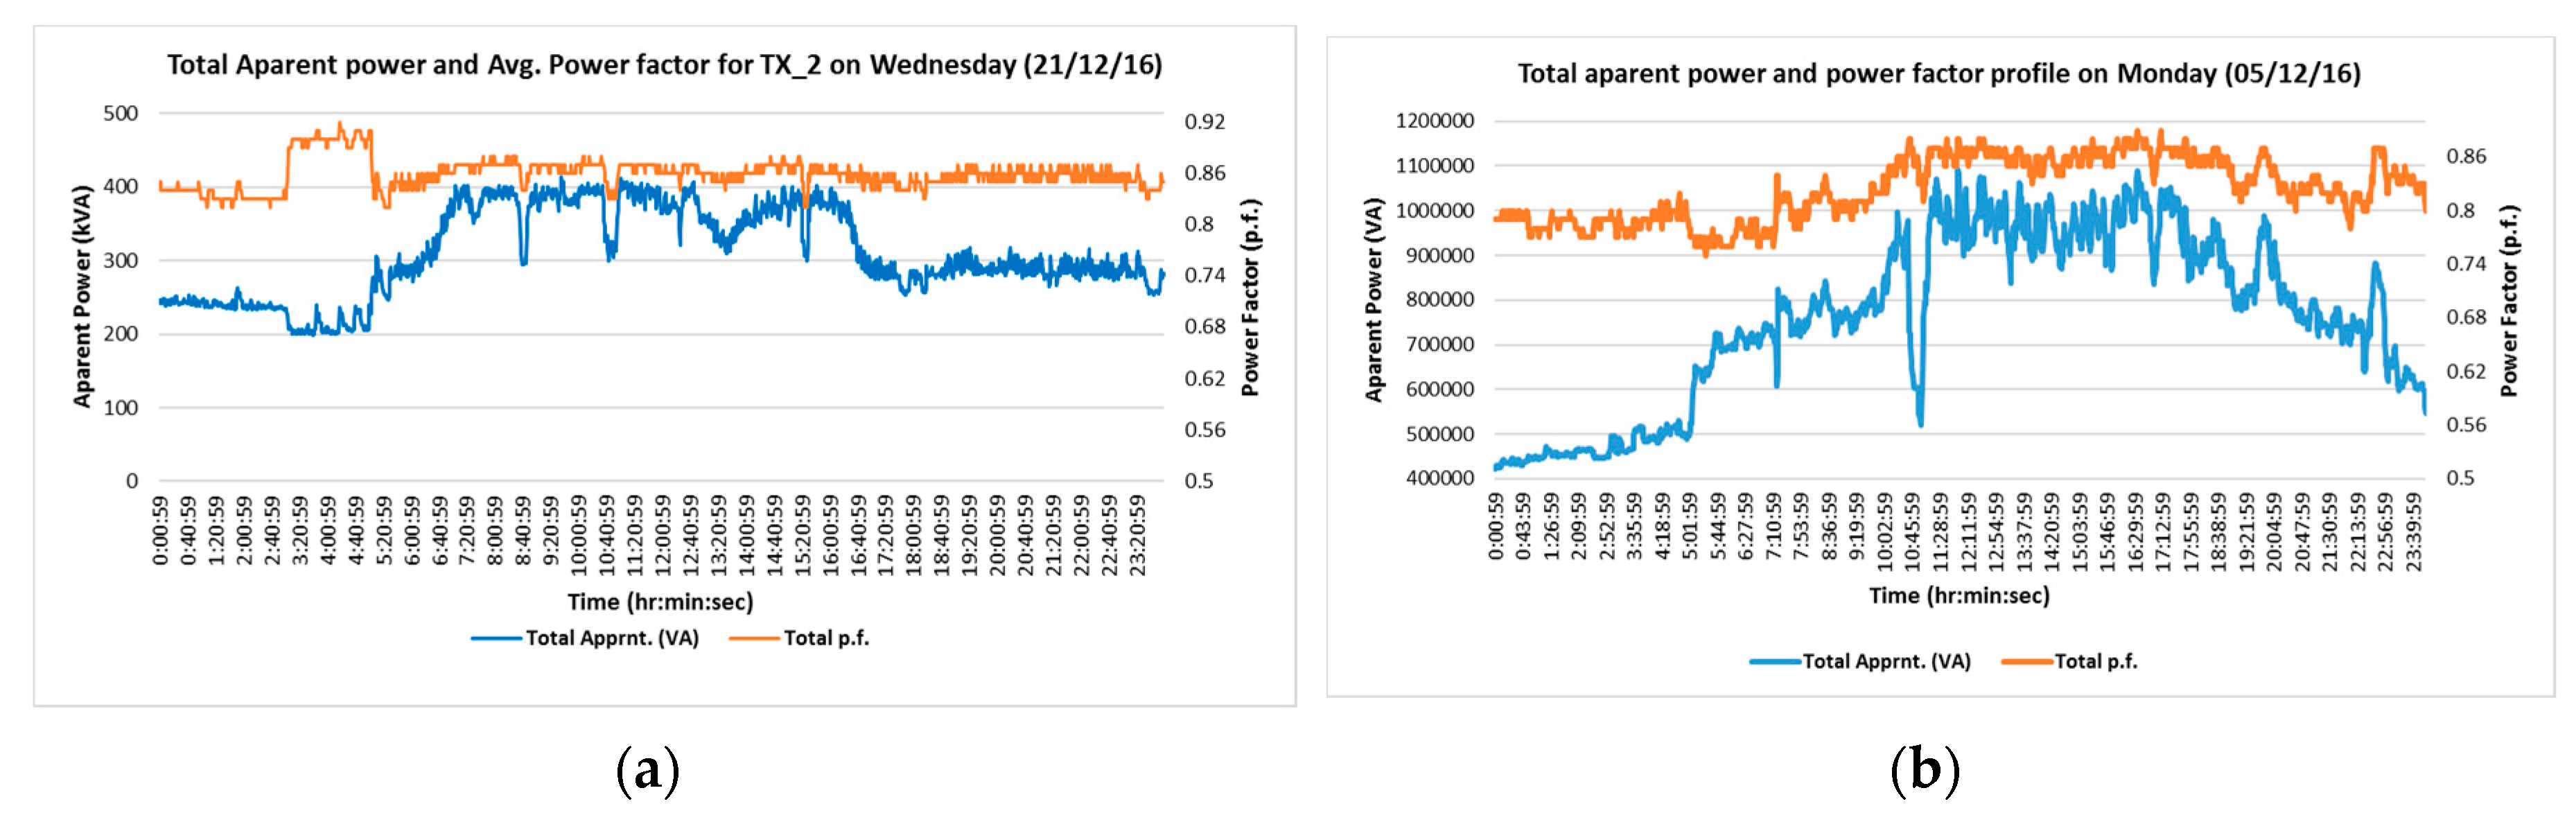
4.1.3. Power Factor and Harmonics
The ratio between real power and apparent power in a circuit is called the power factor (p.f.), which is a practical measure of the efficiency of a power distribution system. A p.f. less than 1.0 causes some additional energy loss, as more current is required, and the lower the power factor, the higher the apparent power drawn from the distribution network. Any period with a p.f. below specified limit usually results in a p.f. surcharge. For instance, Ergon Energy in Queensland requires a customer to ensure that the p.f. of any electrical installation measured at the customer’s terminals is not less than 0.8 lagging for installations supplied at low voltages (<1 kV) [
17].
Figure 9 displays the three-phase average p.f. and total apparent power of two transformers for a typical weekday. The average p.f. of the kill floor transformer (TX_2) is 0.85 and remains mostly constant throughout the day. On the other hand, the average p.f. of the general distribution transformer (TX_6) is around 0.85 but when the loading is low, especially early in the morning, the p.f. at the transformer is less than 0.8. One of the reasons for this low p.f. is that the connected motors’ loadings are significantly less than during daytime operational periods.
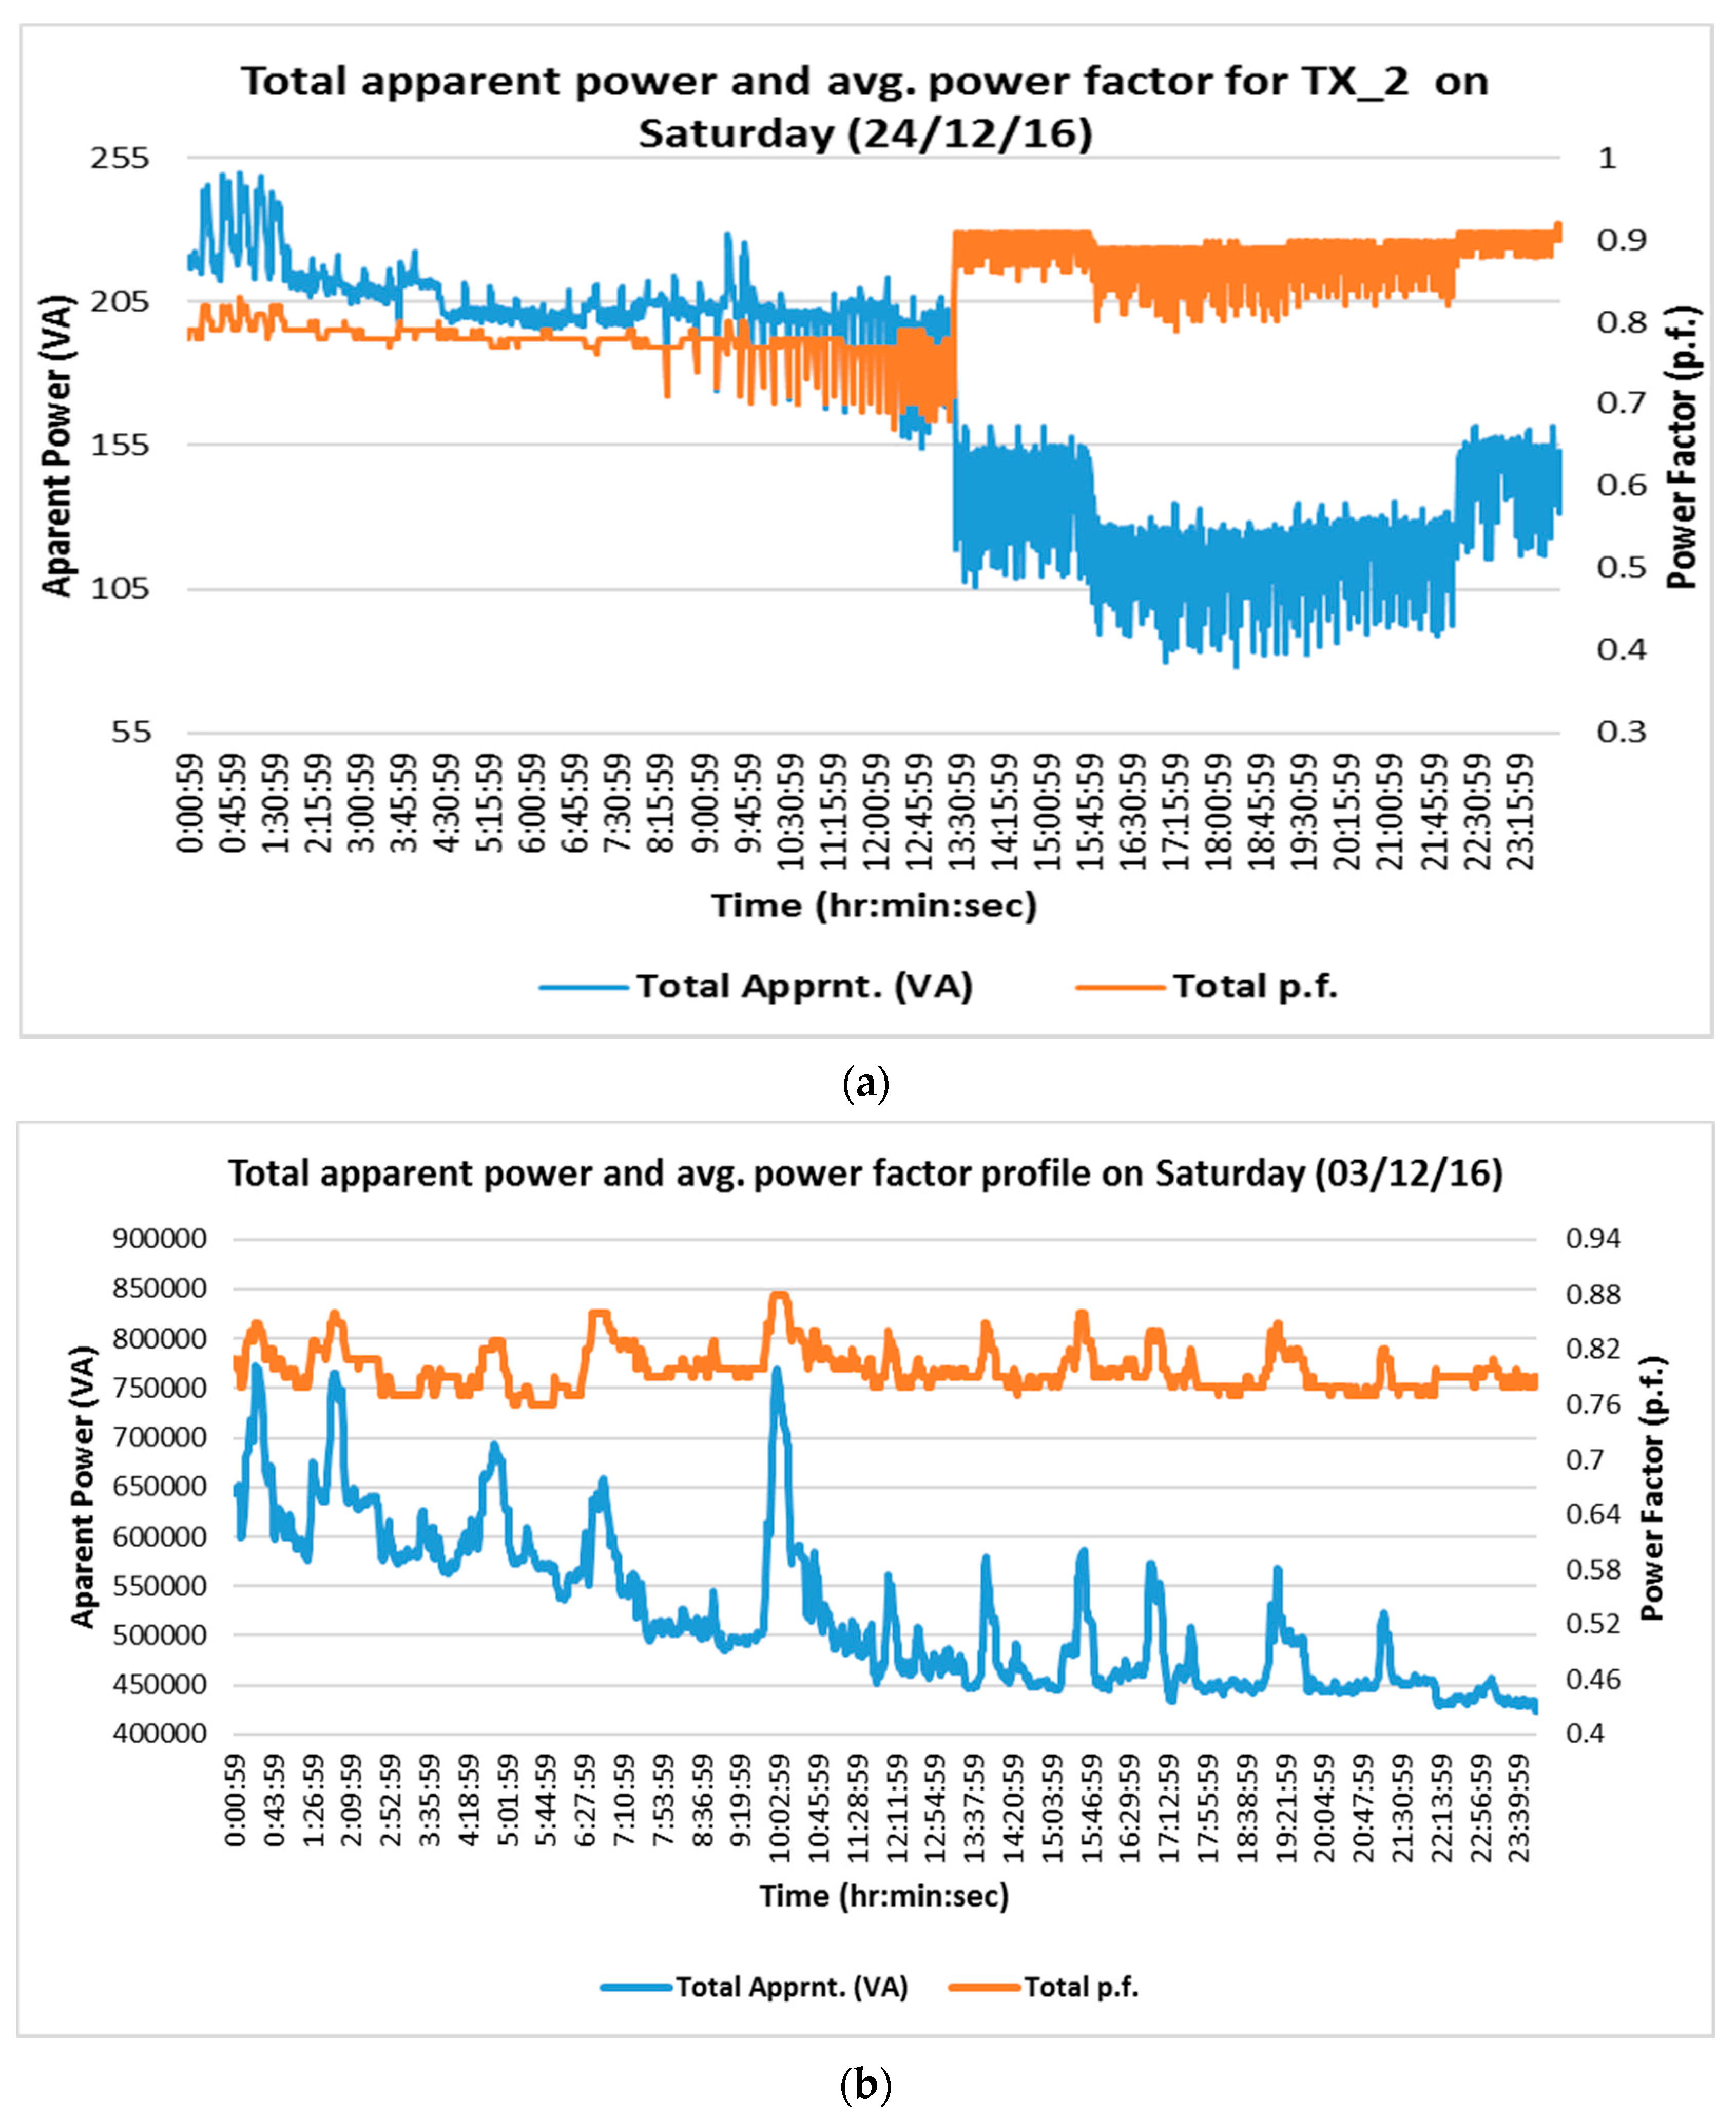
Figure 10 shows the three-phase average p.f. and three-phase total apparent power of two transformers that demonstrated typical characteristics on Saturday. The p.f. profiles of both TX_2 (
Figure 10a) and TX_6 (
Figure 10b) are less than 0.8 for most of the time and as a result the cost of electricity will be higher. Considering the lower power factors, these transformers would be optimal for the application of VO, as by reducing kVAr, the VO can also improve the p.f. to some extent.
A poor power factor can also be improved by adding power factor correction capacitors to the plant’s distribution system. Correction capacitors provide needed reactive power (kVAr) to the load. Distribution system losses are also reduced through power factor correction by reducing the total load current in the system. Some VO device suppliers [
24] claim that their equipment can also improve power factor (by 5% to 10%) and phase voltage imbalance (by up to 20%), which all assist in reducing energy losses and enhancing system efficiency [
25]. However, these claims have not been independently verified. In some field trials [
26,
27], it was identified that the reduction of voltage reduces the active and reactive power consumption to some extent, depending on the load types, and therefore improves the power factor.
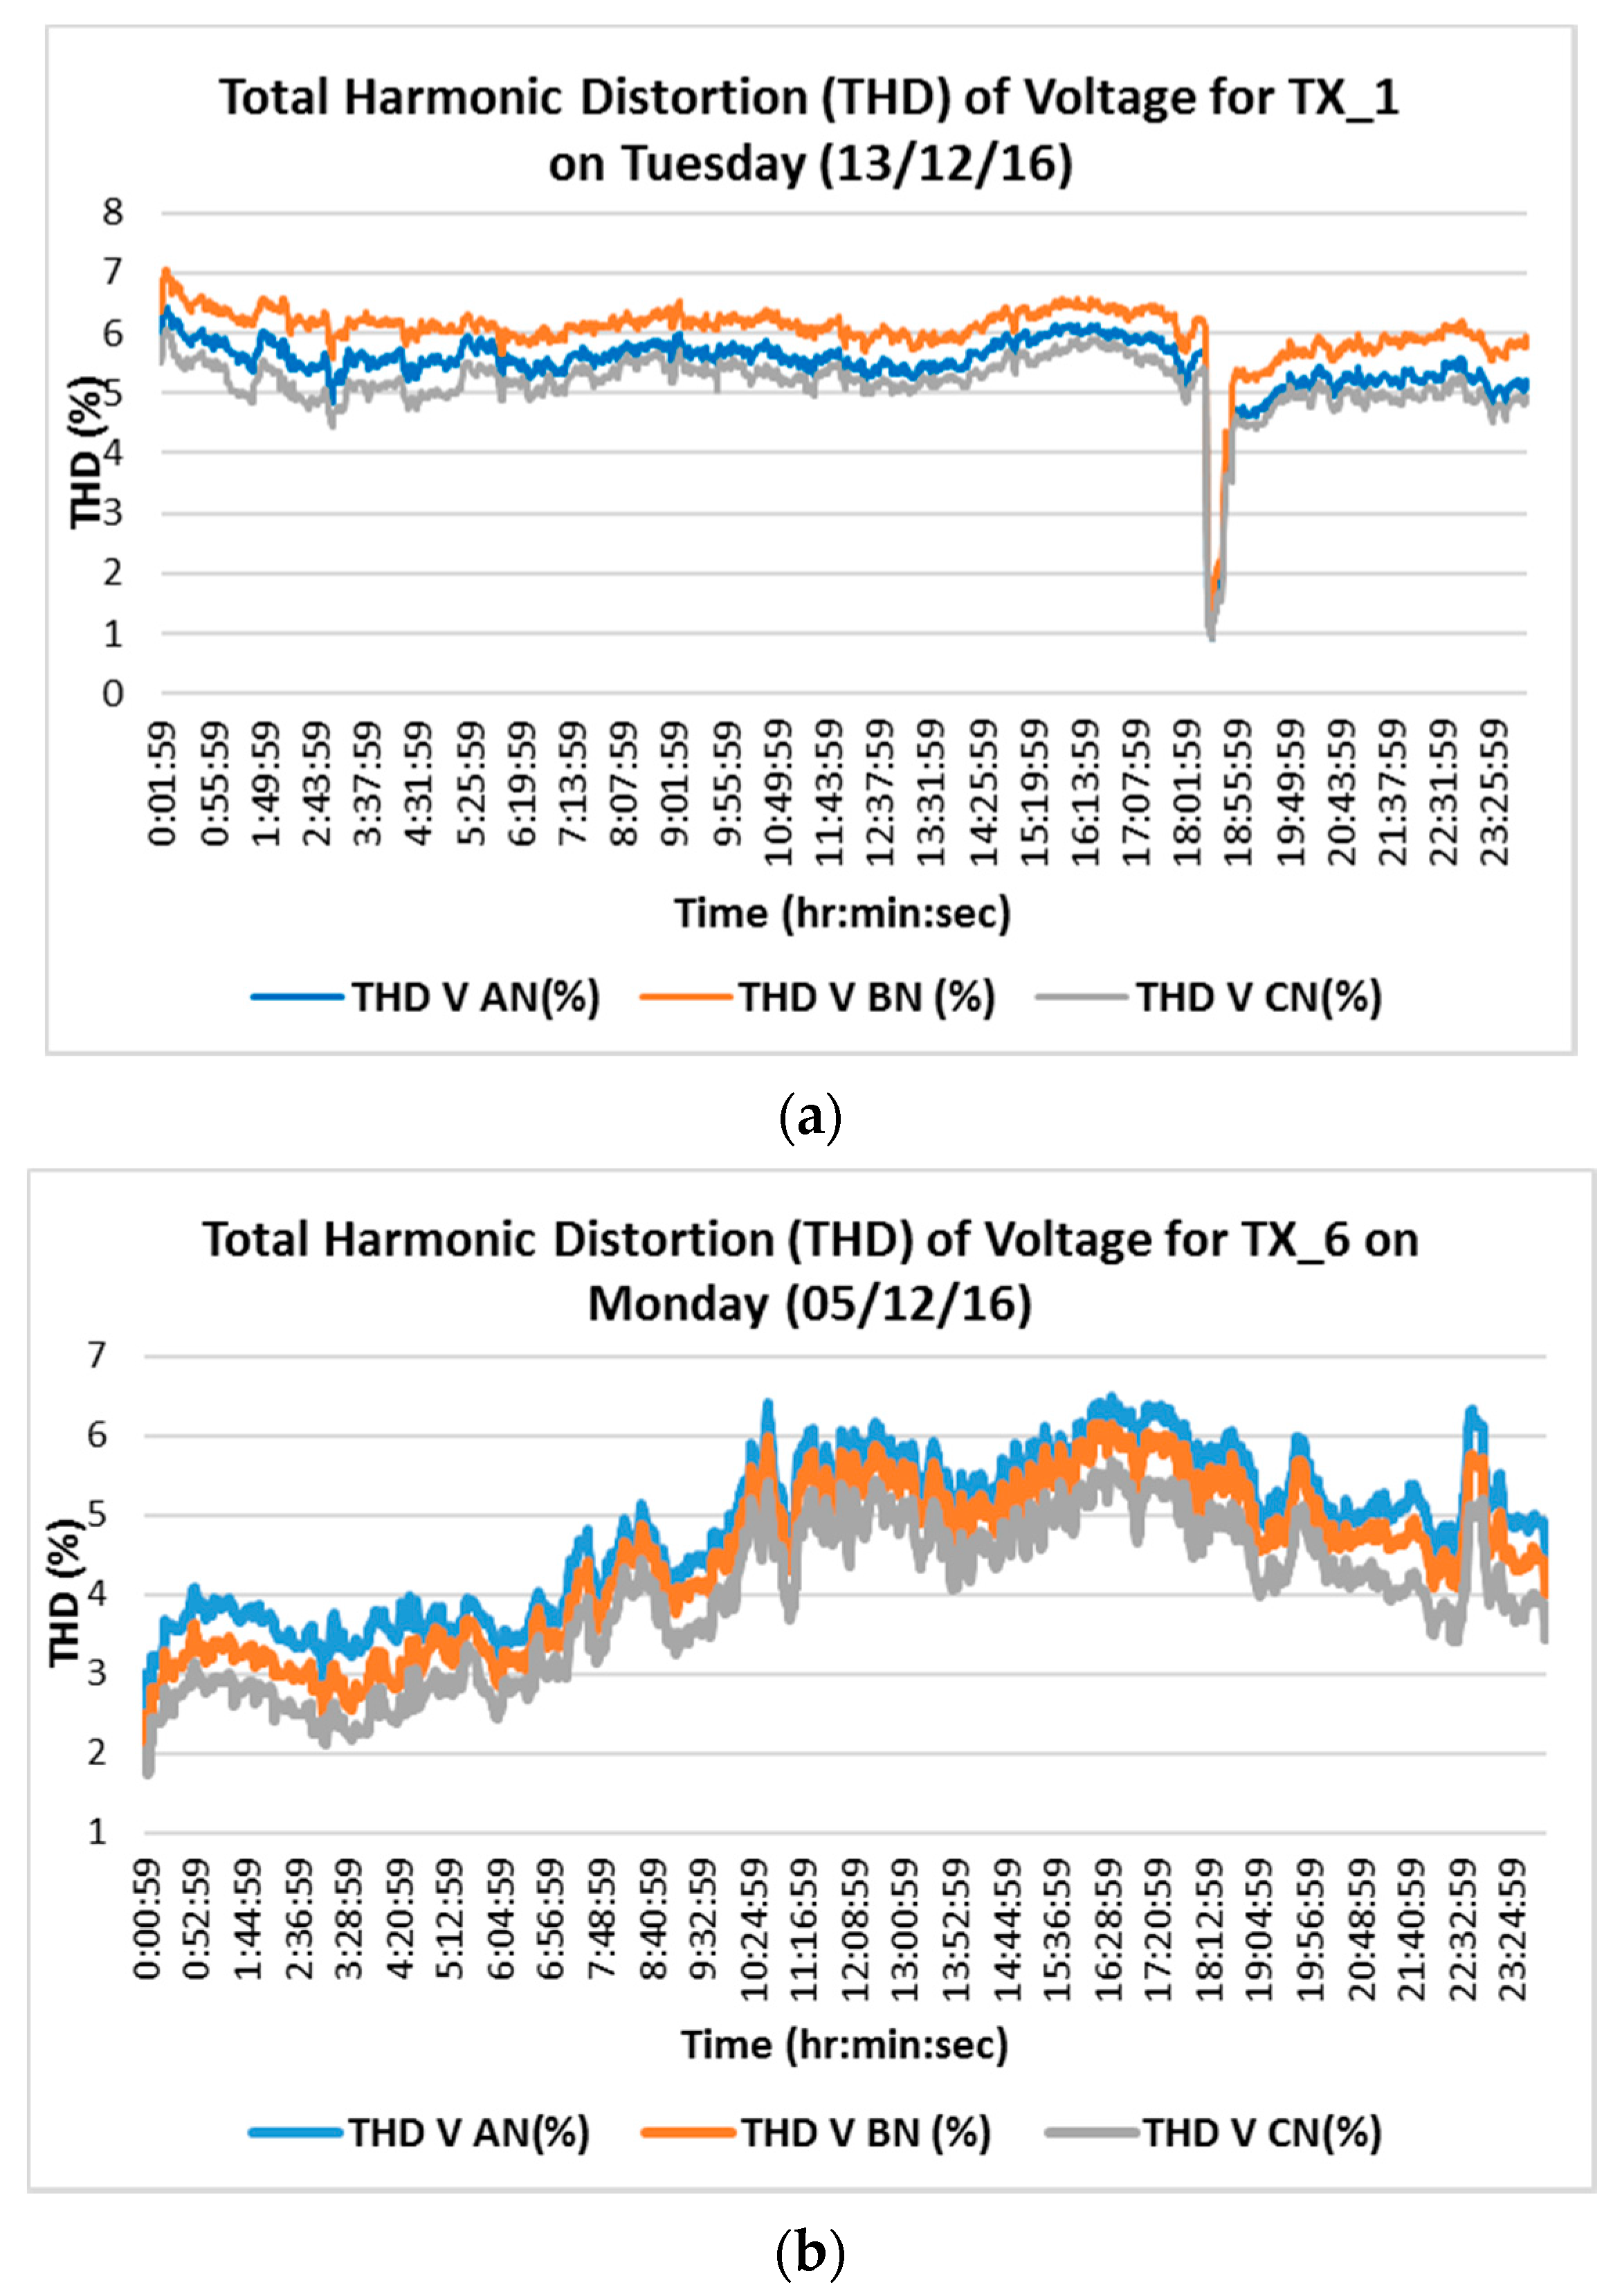
THD is related to either current harmonics or voltage harmonics, and is defined as the ratio of the sum of the power of all harmonic components to the power of the fundamental frequency. The THD measurement of the refrigeration (TX_1) and general distribution (TX_6) transformers during typical weekdays at the case study site showed that the THD values are within the recommended limits of 8% [
28] on the low voltage side. TX_1 (
Figure 11a) has higher THD than TX_6 (
Figure 11b) due to the refrigeration loads, as shown in
Figure 11. The measurements also showed that the level of total harmonic distortion is quite low on a typical weekend day relative to the weekdays, which is expected as there are less loads on the weekend.
The presence of harmonics in the waveform of the network voltage can be attributed to various causes such as rectifiers, variable speed drives, thyristors, a saturated transformer, etc. If the harmonic power is significant, i.e., total harmonic voltage distortion (THVD) is greater than 7% and total harmonic current distortion (THID) is greater than 40%, this can result in overvoltage and overloads, which may lead to the failure of the capacitors, circuit breakers, contactors, etc. Harmonic power losses can be reduced using reactors or harmonic filters. In some voltage optimiser technologies [
24], the harmonic filtration is integrated (e.g., in the Power Perfector VO), reducing overall THD.
4.2. Case Study Site 2: Abattoir in Queensland
4.2.1. Data Collection
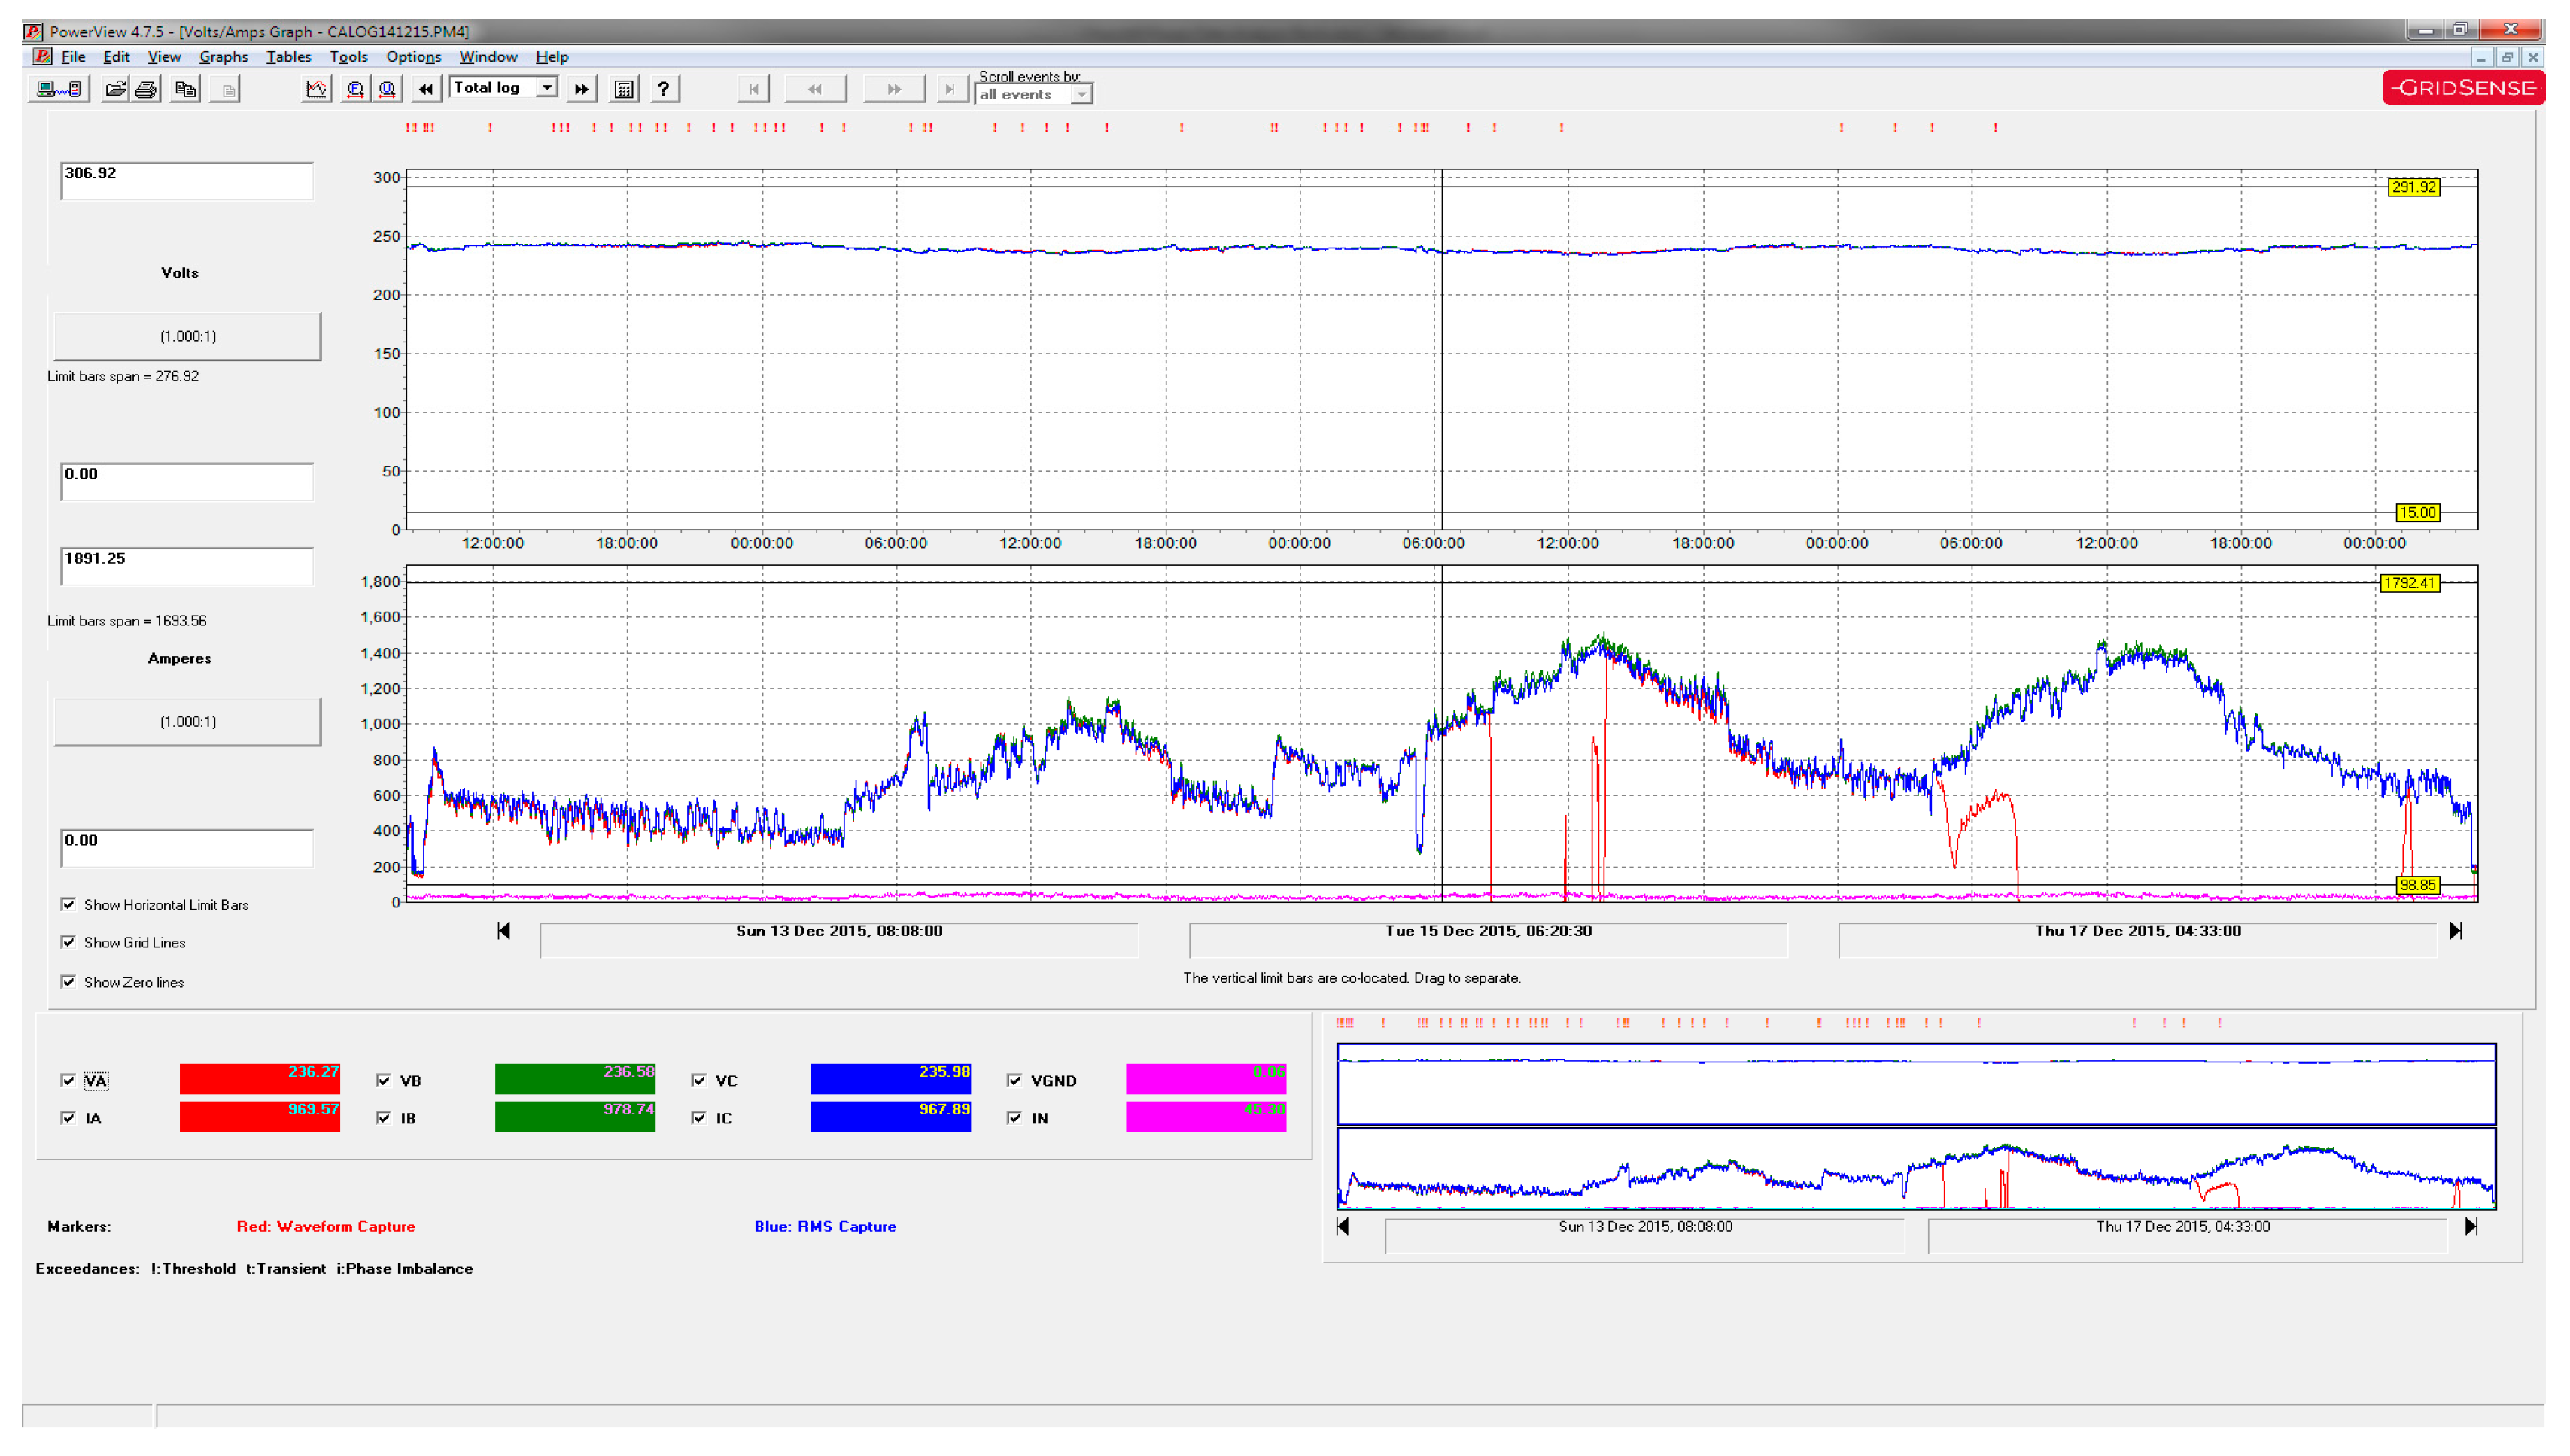
The data was collected from the Case Study 2 site using a Powermonic PM45 [
29] and included voltage and current across three phases from 12 December 2015 to 17 December 2015, again in the busiest period leading up to Christmas. The data were collected from the incoming on-site transformer of 1 MVA capacity that feeds the main switchboard.
Figure 12 shows the voltage and current profile over a three-day period.
4.2.2. Load and Voltage Profiles
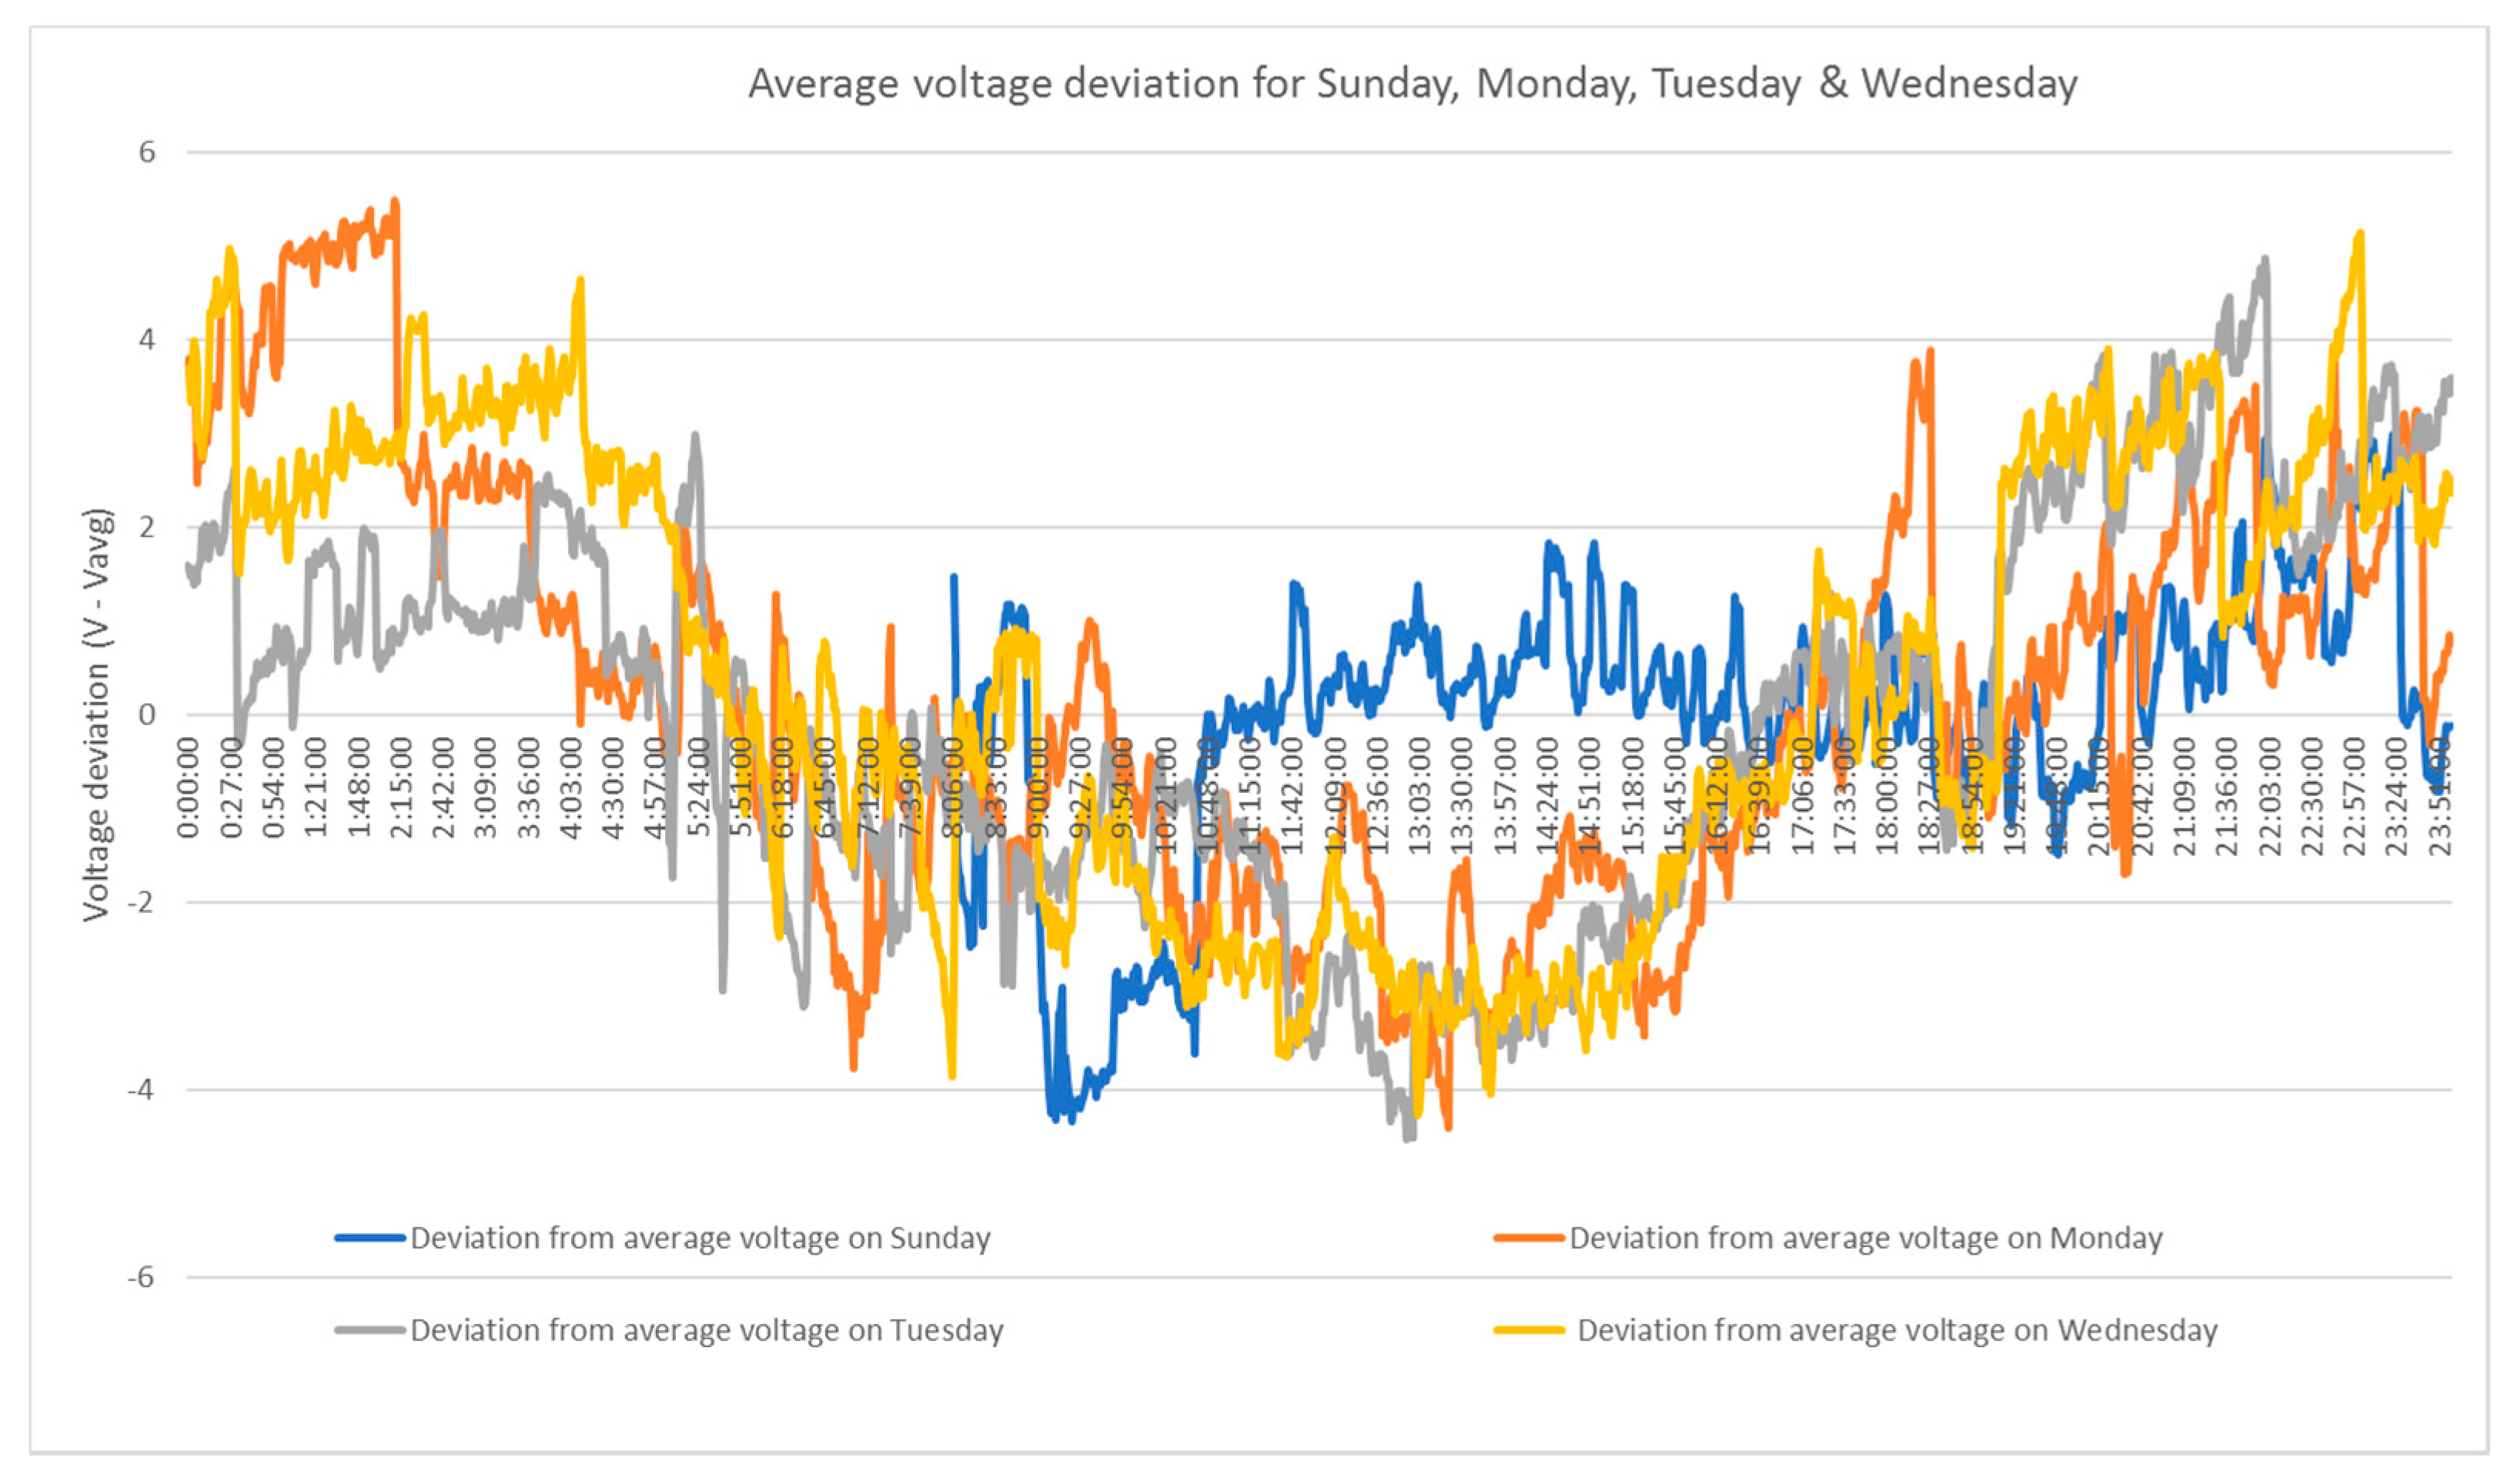
Voltage deviation from the average supply voltage for the whole site in Queensland is shown in
Figure 13, which shows very similar weekday profiles. High voltages are observed in the network from midnight to early morning and sunset to midnight due to less loading, while lower voltages are observed during daytime due to high loading in the abattoir. On the other hand, the weekend profile fluctuates with time due to the number of connected loads in the network.
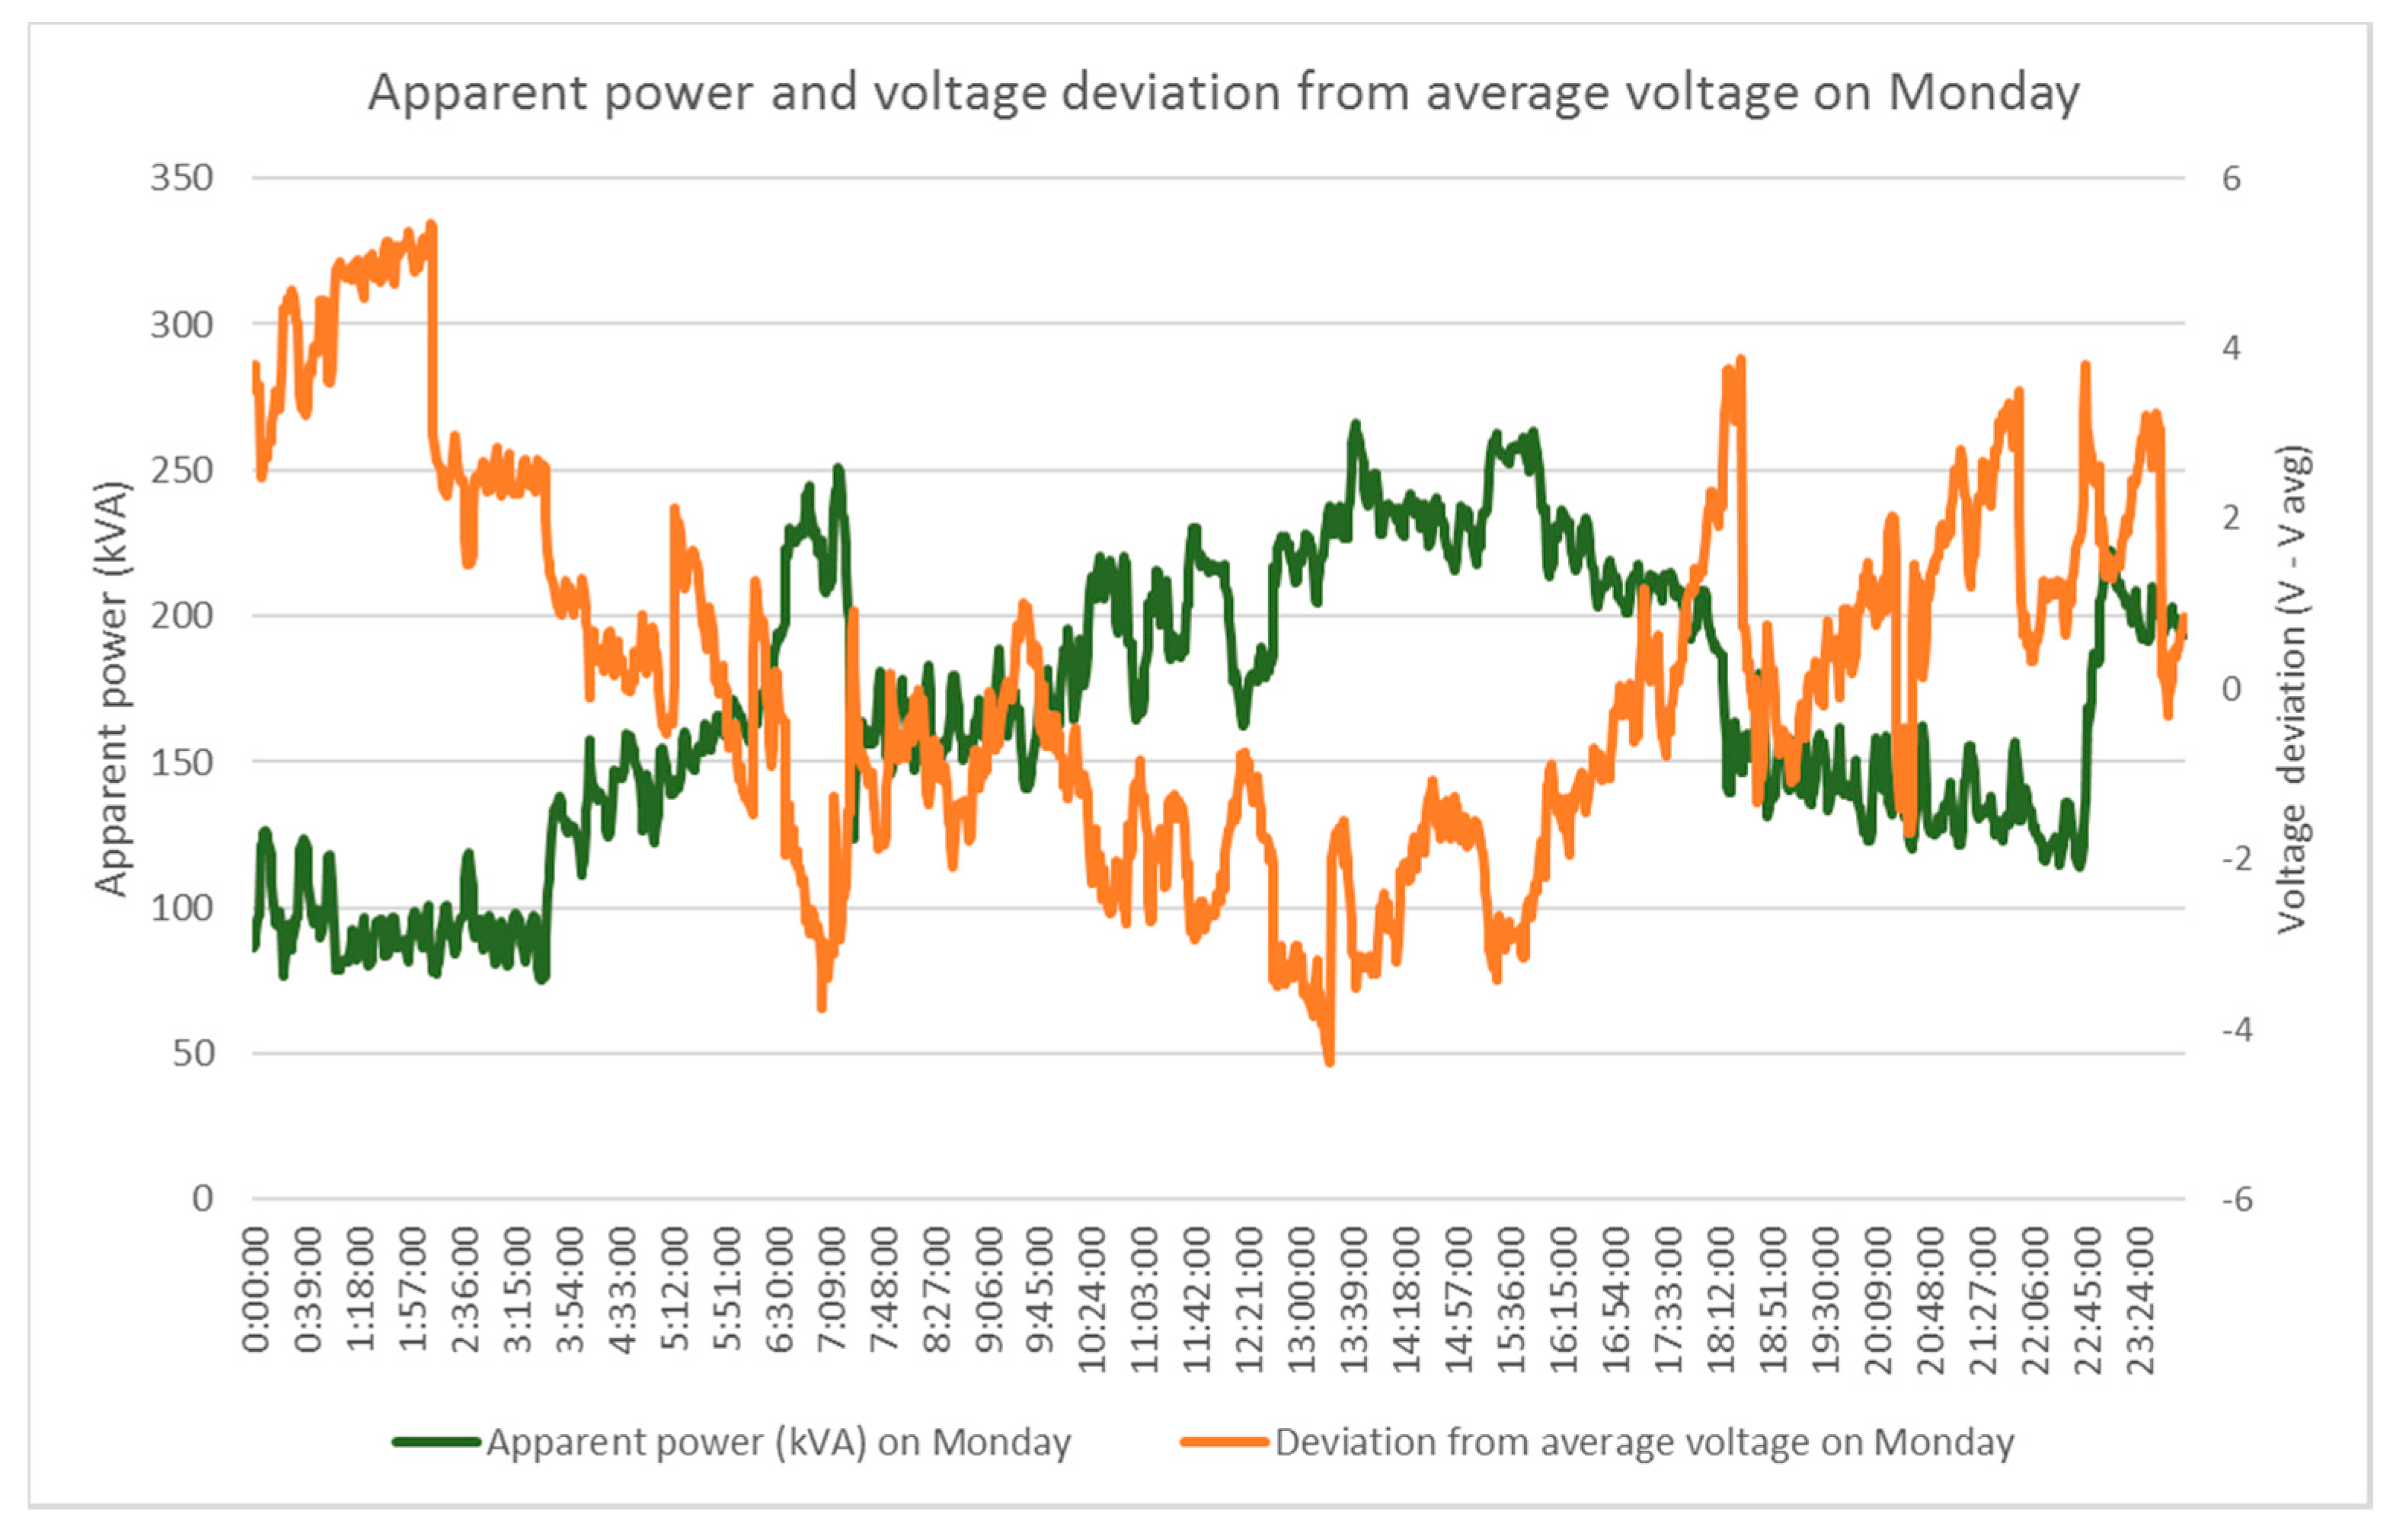
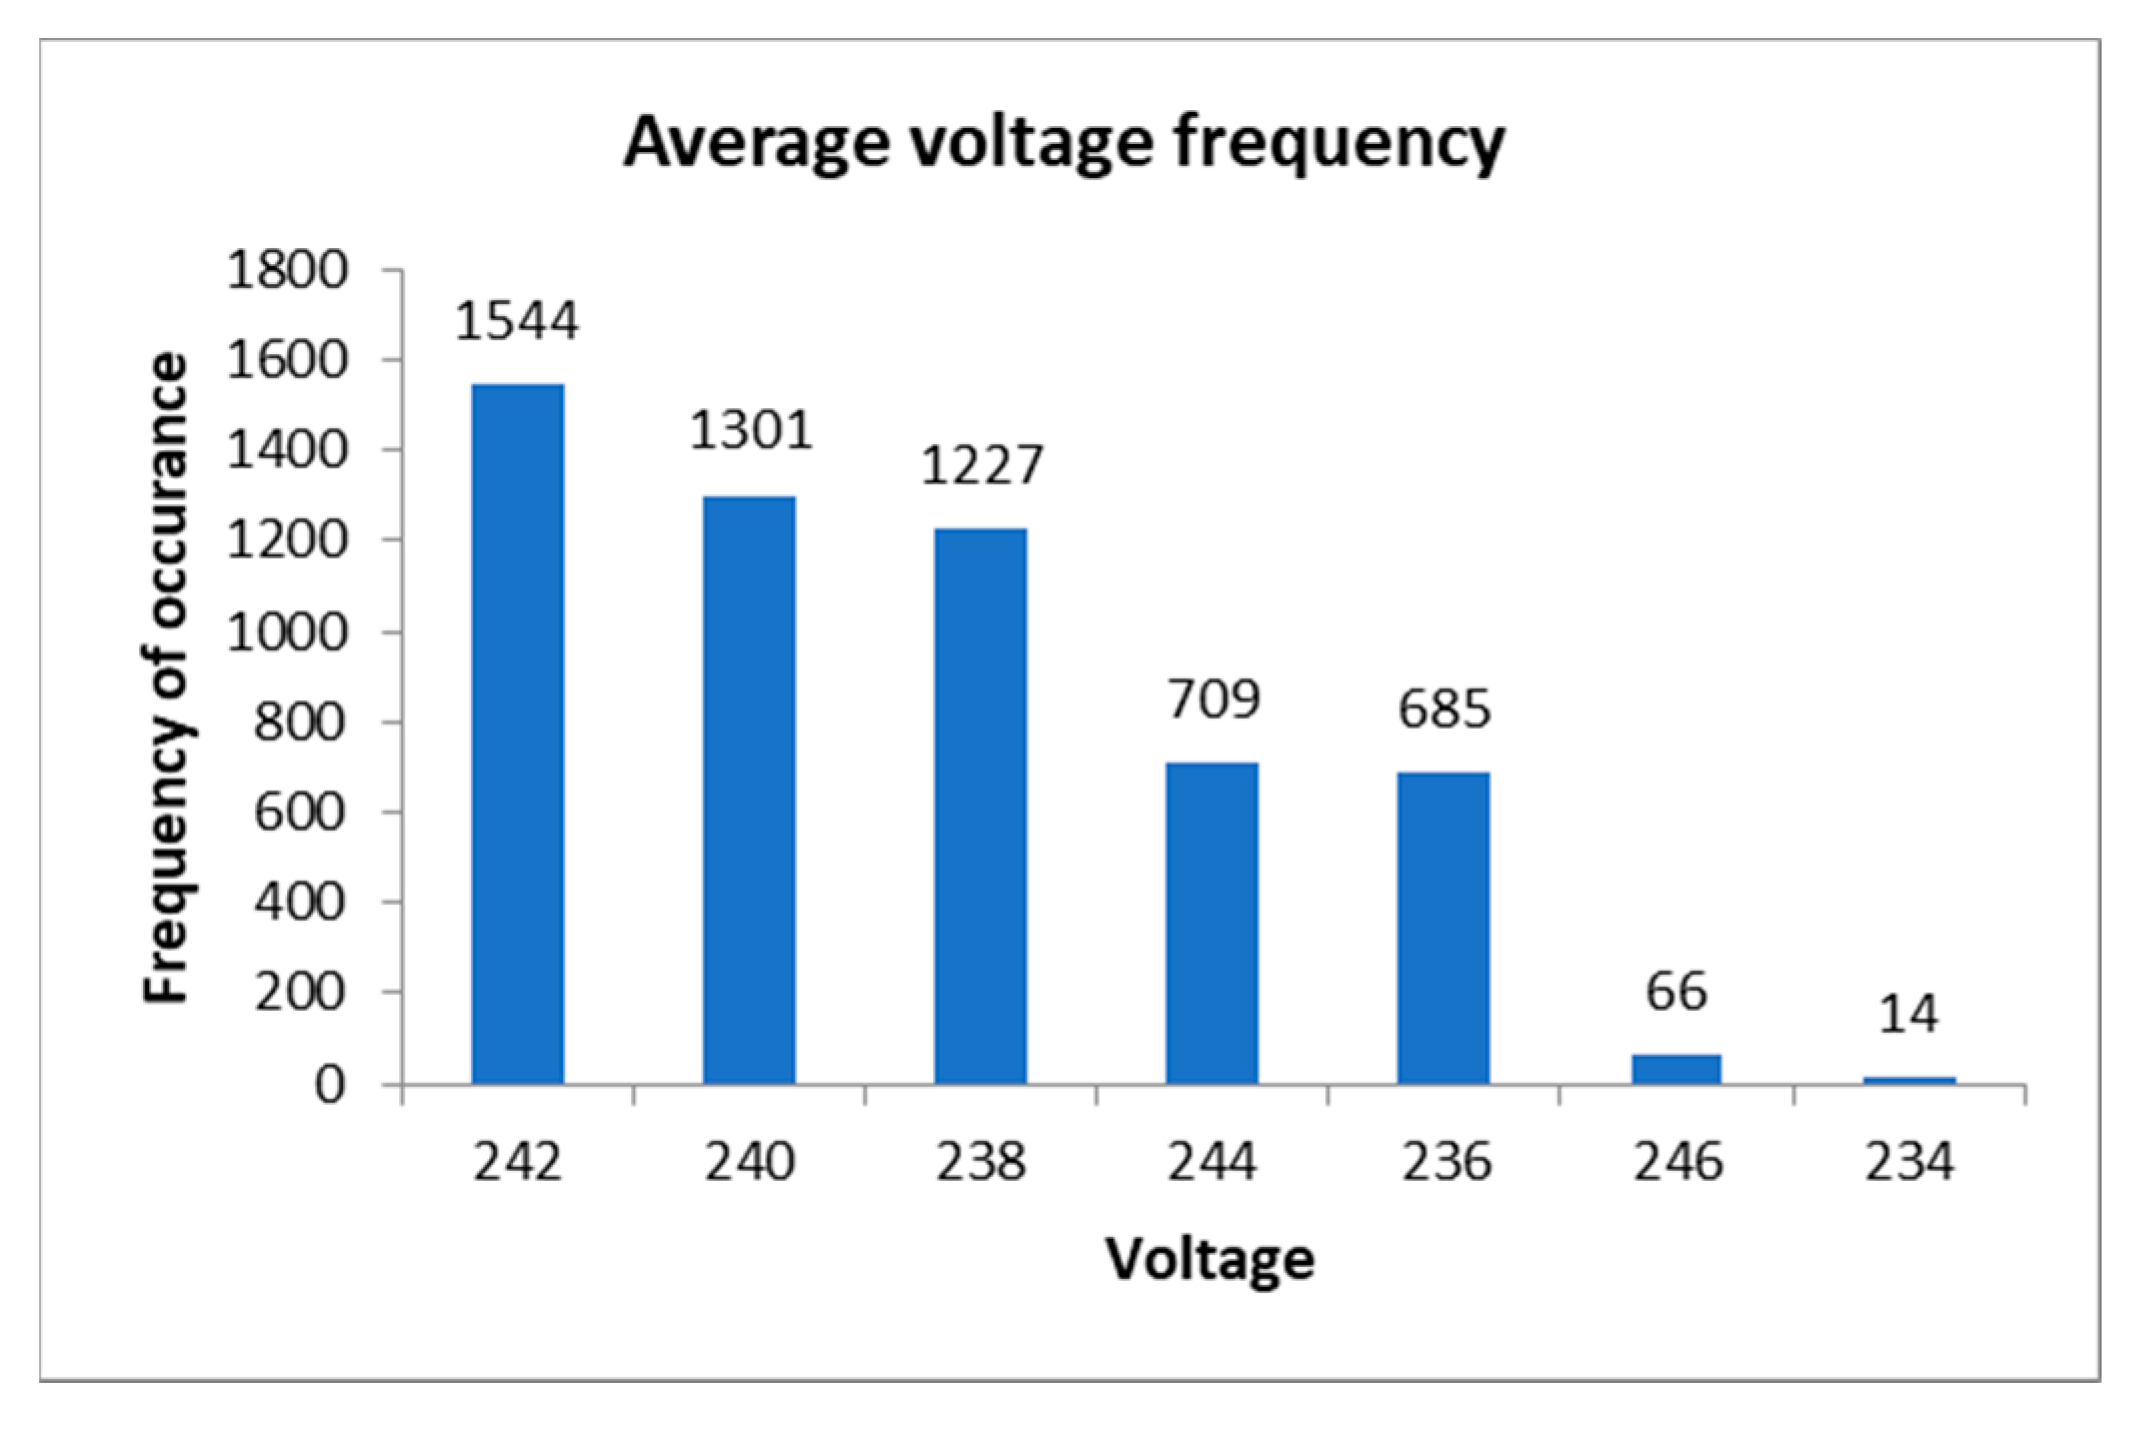
Figure 14 shows the average apparent power and voltage deviations on Monday, where lower voltages are observed with the increase of load demand and higher voltage with the decrease of load demand in the abattoir. From the frequency distribution, as shown in
Figure 15, it is seen that 41% of the time site voltages are more than the nominal voltage of 240 V and, hence, more energy and costs savings will be possible from this site through the use of VO technology.
5. Economic Evaluation
To determine whether VO can be implemented, and whether it is economically worthwhile for red meat processing sites, this study has undertaken a techno-economic analysis of the use of VO. A sensitivity analysis around key factors including price of electricity, facility/electrical feeder size (electricity consumption) and load type, supply voltage and optimiser type (dynamic or static) was conducted and identified the energy savings and simple payback period with various sensitivity variables to evaluate the cost effectiveness and usefulness of VO technology for abattoirs.
5.1. Standard Sized Abattoir for Analysis
The energy savings and simple payback periods identified, unless stated otherwise, are based on a typical medium-sized abattoir (this is based on site visits and data collection from two abattoirs, one in Western Australia and one in Queensland, with kill rates of ~600 head per day, which is considered typical for medium sized abattoirs) with an average of 600 head kill/day, operating five days per week (250 days per year) with an average supply voltage of 240 V (per phase) and an electricity tariff of AU $0.15/kWh (including supply charges). Four main transformers are considered for the load, three of which are rated at 1 MVA supplying the refrigeration, kill floor, and by-products feeders and a 1.5 MVA general distribution feeder (which also includes some refrigeration loads). The feeders with refrigeration loads are considered to contain a high proportion of variable speed drives (VSDs) on the refrigeration loads, which is common practice now in most abattoirs. The annual electricity consumption of this representative site is considered to be approximately 15,800 MWh.
5.2. Energy Savings Calculation
As mentioned in the previous sections, voltage, current and p.f. data for each phase of the transformer were collected at 1 min intervals over a seven-day period. When considering the application of dynamic VO, the following calculation method was used to ascertain the potential energy savings for each VO voltage level setting:
Step 1: Calculate actual active power (
for each phase using measured voltage (
), current (
and p.f. at 1 min intervals.
Step 2: Calculate optimised active power (
for each phase using the new voltage setting (
), measured current (
and p.f. at 1-min intervals.
is the voltage assigned at the voltage optimiser, either fixed or dynamically, to achieve maximum energy savings at a meat processing plant. Voltage optimiser set voltage is usually identified based on the facility voltage and load profiles, available VO technologies and their voltage settings.
Step 3: Calculate power difference (
by subtracting the actual power from the optimised power at 1-min intervals.
Step 4: Calculate energy difference (
) per hour by adding the 1-min interval power difference (
and then divide by 60 to obtain the hourly difference in energy consumed. This will give the hourly energy difference obtained from varying VO voltage levels and the measured voltage level.
Step 5: Sum up the hourly energy saved (
) for every 24-h period to find the aggregated daily energy savings (
for each phase A, B and C.
Step 6: Calculate the total three phase daily energy saving (
by summing all the phases
values.
Step 7: Calculate the total energy saving in a week by adding all three phase daily energy savings (
for seven days.
Step 8: Estimate the yearly energy savings as follows:
Step 9: Estimated the yearly energy cost savings as follows:
5.3. Indicative Prices for Voltage Optimisation Technologies
Table 5 and
Table 6 provide a summary of the different sizes and indicative costs of dynamic and fixed voltage optimisation technologies, respectively. Indicative unit costs (AU
$/kVA) and total capital cost are provided which both consider the installation costs but exclude the transportation costs as these vary significantly depending on the supplier and location of the installation. These costs are adopted from the available fixed and dynamic VO technology price lists and through personal communication with suppliers. Prices may also vary depending on the supplier, locations of sites and manufacturer specifications of VO technologies. VO technology suppliers should be contacted for more accurate prices for a particular site.
5.4. Energy Savings Analysis
From the data analysis for Site 1, it can be identified that, on weekdays and weekends, the average voltage levels of TX_6 and TX_1 are 236 V and 238 V, respectively, which is below the 240 V prescribed by the standard. In TX_2, the average voltage levels are 240 V and above. As stated earlier, energy savings from VO technology ultimately depends on the voltage levels and the type of equipment. The higher the voltage levels are, the more energy savings that can be obtained and the shorter the financial pay back periods are.
There are six voltage steps, i.e., 240 V, 237.5 V, 235 V, 232.5 V, 230 V and 220 V, which were used in this study as the basis for VO voltage settings to analyse the potential energy savings. These voltage steps are related to the tap settings of a typical VO. For example, the, Powerstar VO has five tapings, with 2.5 V between each tap [
32]. To avoid the low voltage impacts on the equipment such as over-current, malfunction and damage, these voltage levels are limited to no less than −10% of the nominal 240 V. According to the Australian Standard, individual equipment must operate within −10% of nominal voltage [
33].
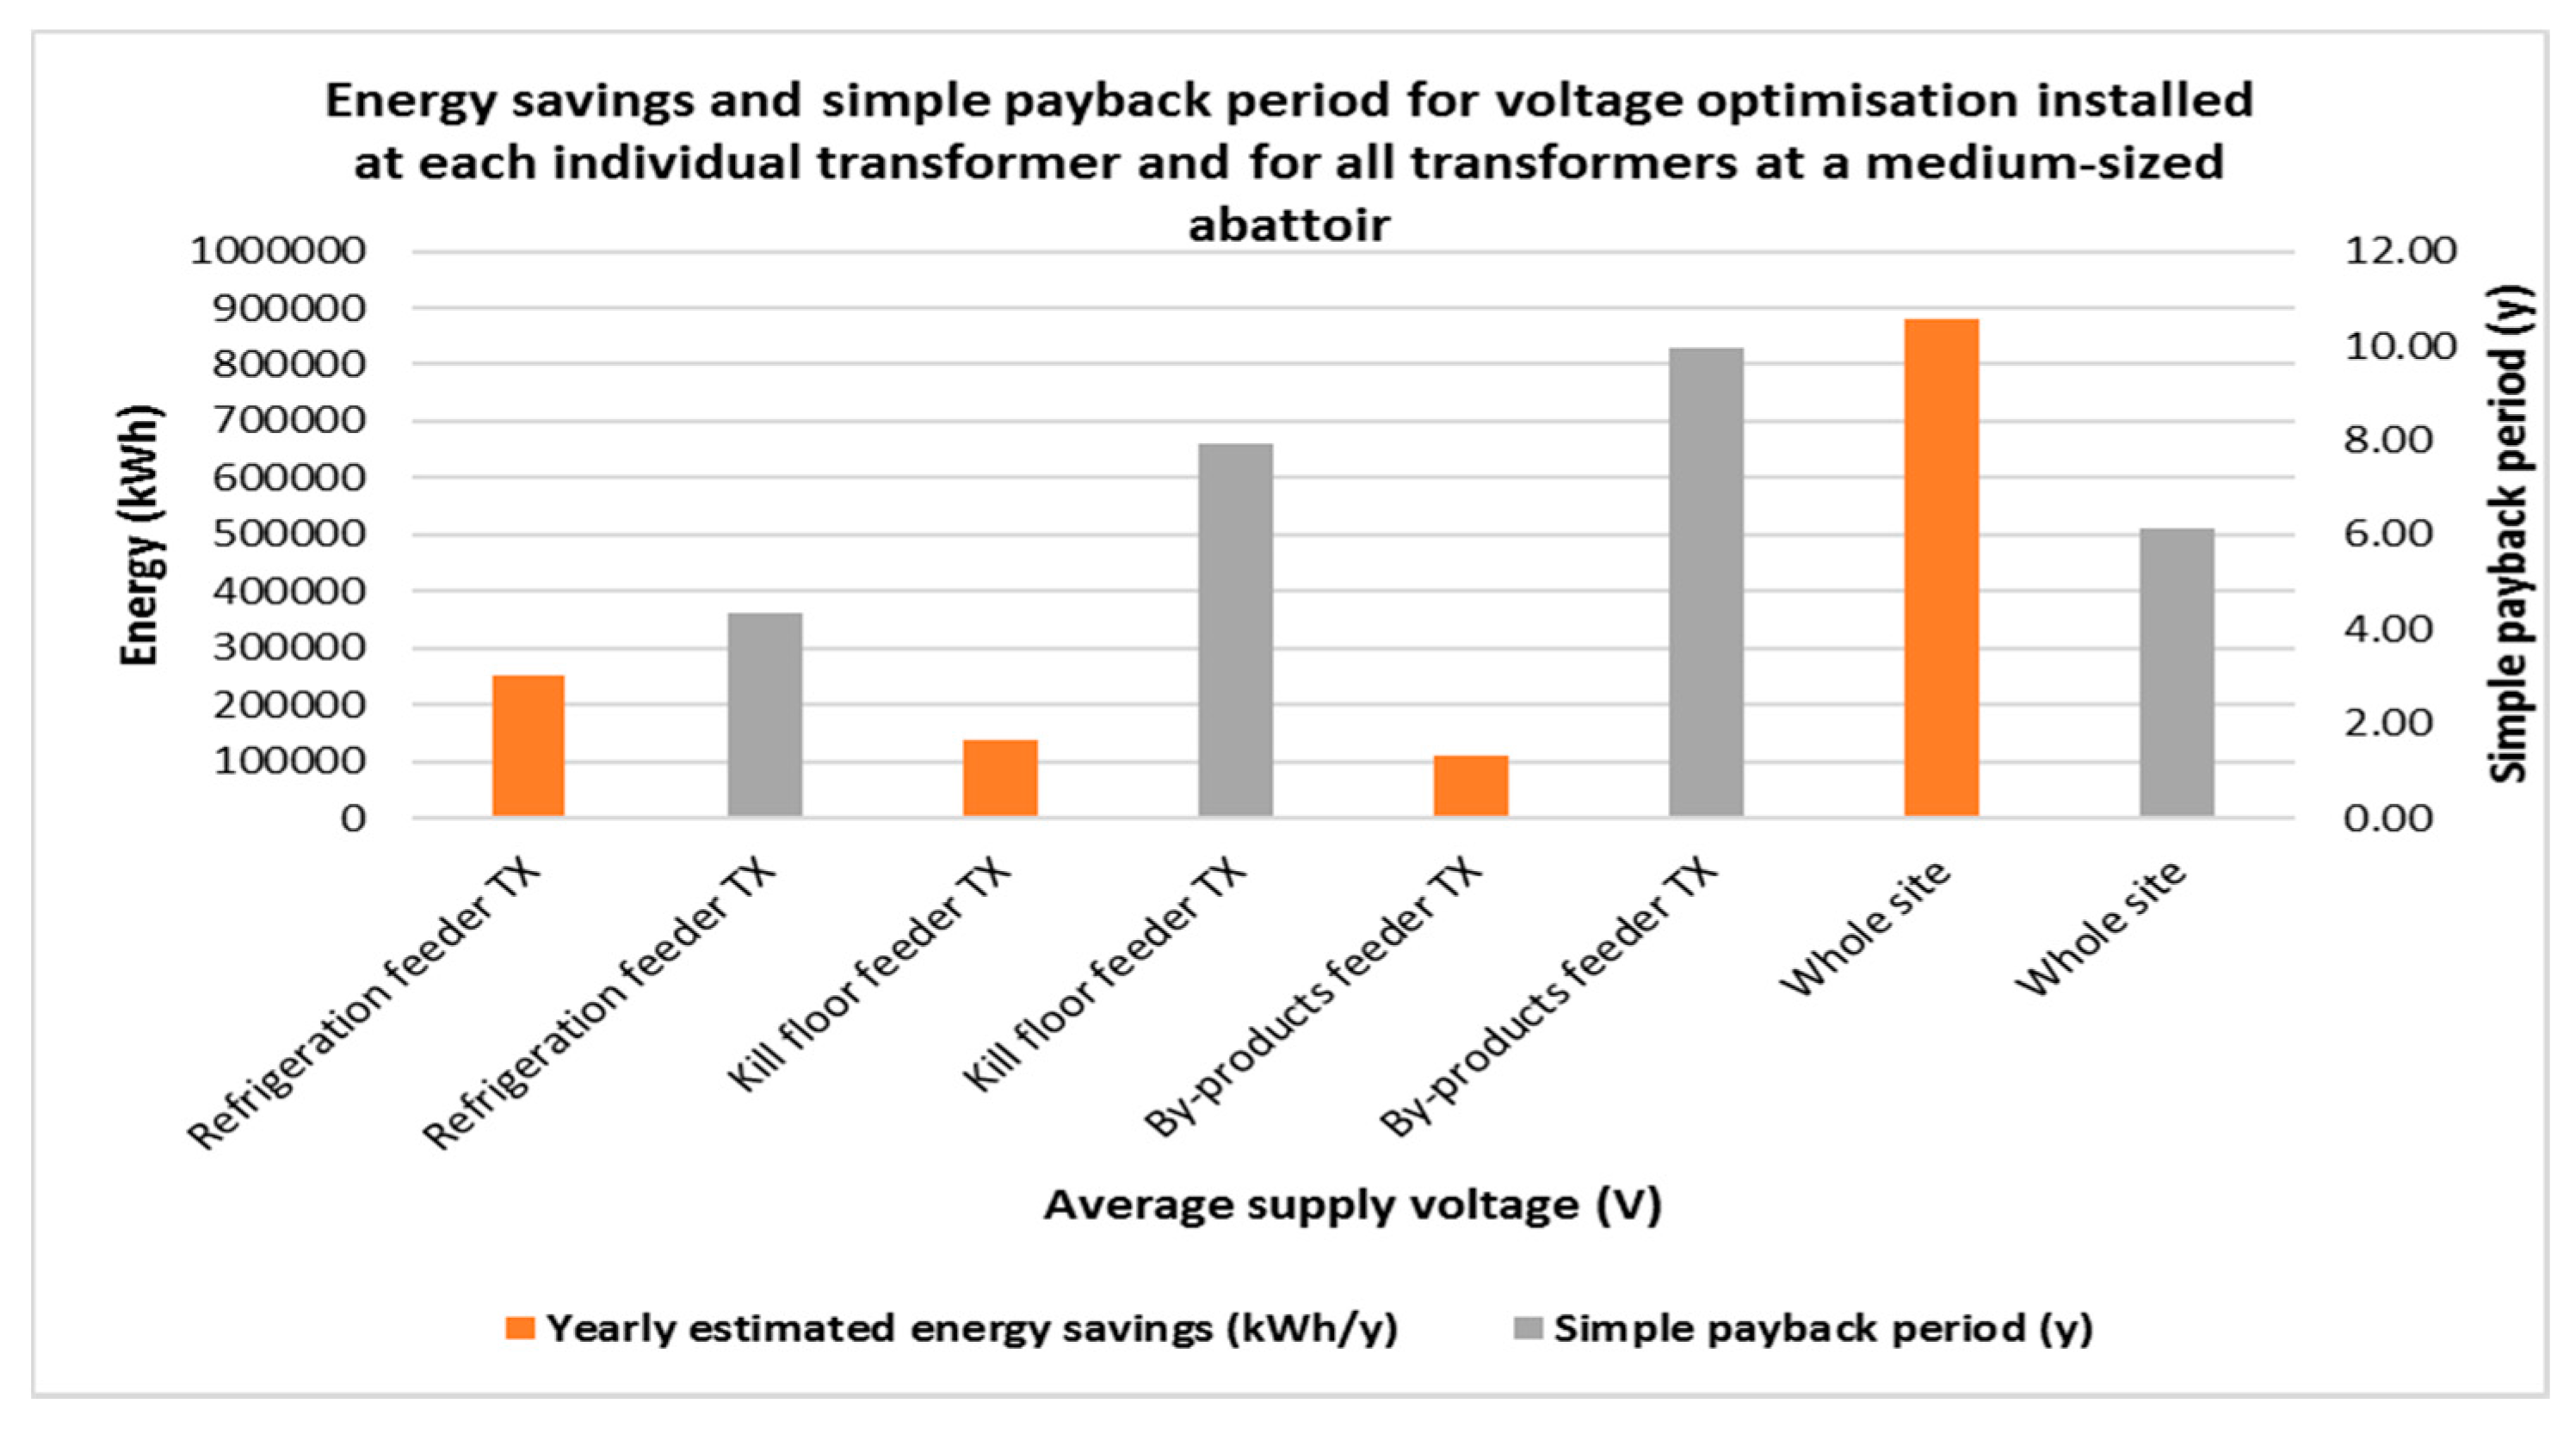
The annual energy savings and simple payback period for VO units installed at typical refrigeration, kill floor, and by-product feeder transformers as well as for the whole site (VO units installed on each main transformer) in a medium-sized abattoir (considering VSDs in loads) is given in
Figure 16, using a VO set voltage of 220 V and supply voltage of 240 V. Applying voltage optimisation at the refrigeration feeder transformer provides the largest energy savings and shortest payback period compared to the two other types of transformers, even though this transformer contains the highest number of VSDs. Installing voltage optimisation for all the main transformers at a medium sized abattoir also provides a shorter payback period compared to installing voltage optimisation units at the kill floor or by-products feeder transformers only.
This study also estimated yearly cost savings and payback periods using time of use (TOU) electricity pricing, as a few abattoirs may use time varying electricity pricing. As an example,
Table 7 shows the energy savings and payback period for the kill floor feeder transformer (TX_2) with a VO set voltage of 220 V. The time varying prices considered are for large business consumers currently offered by the Western Australian electricity retailer Synergy [
34]. As can be observed in
Figure 16, the payback period of VO for the kill floor feeder transformer at a fixed electricity price of
$0.15/kWh is around two times higher than at the time varying prices shown in
Table 7. This is due to high electricity prices during peak periods. The higher the electricity price, the more energy cost savings there will be, and thus the shorter the payback periods become.
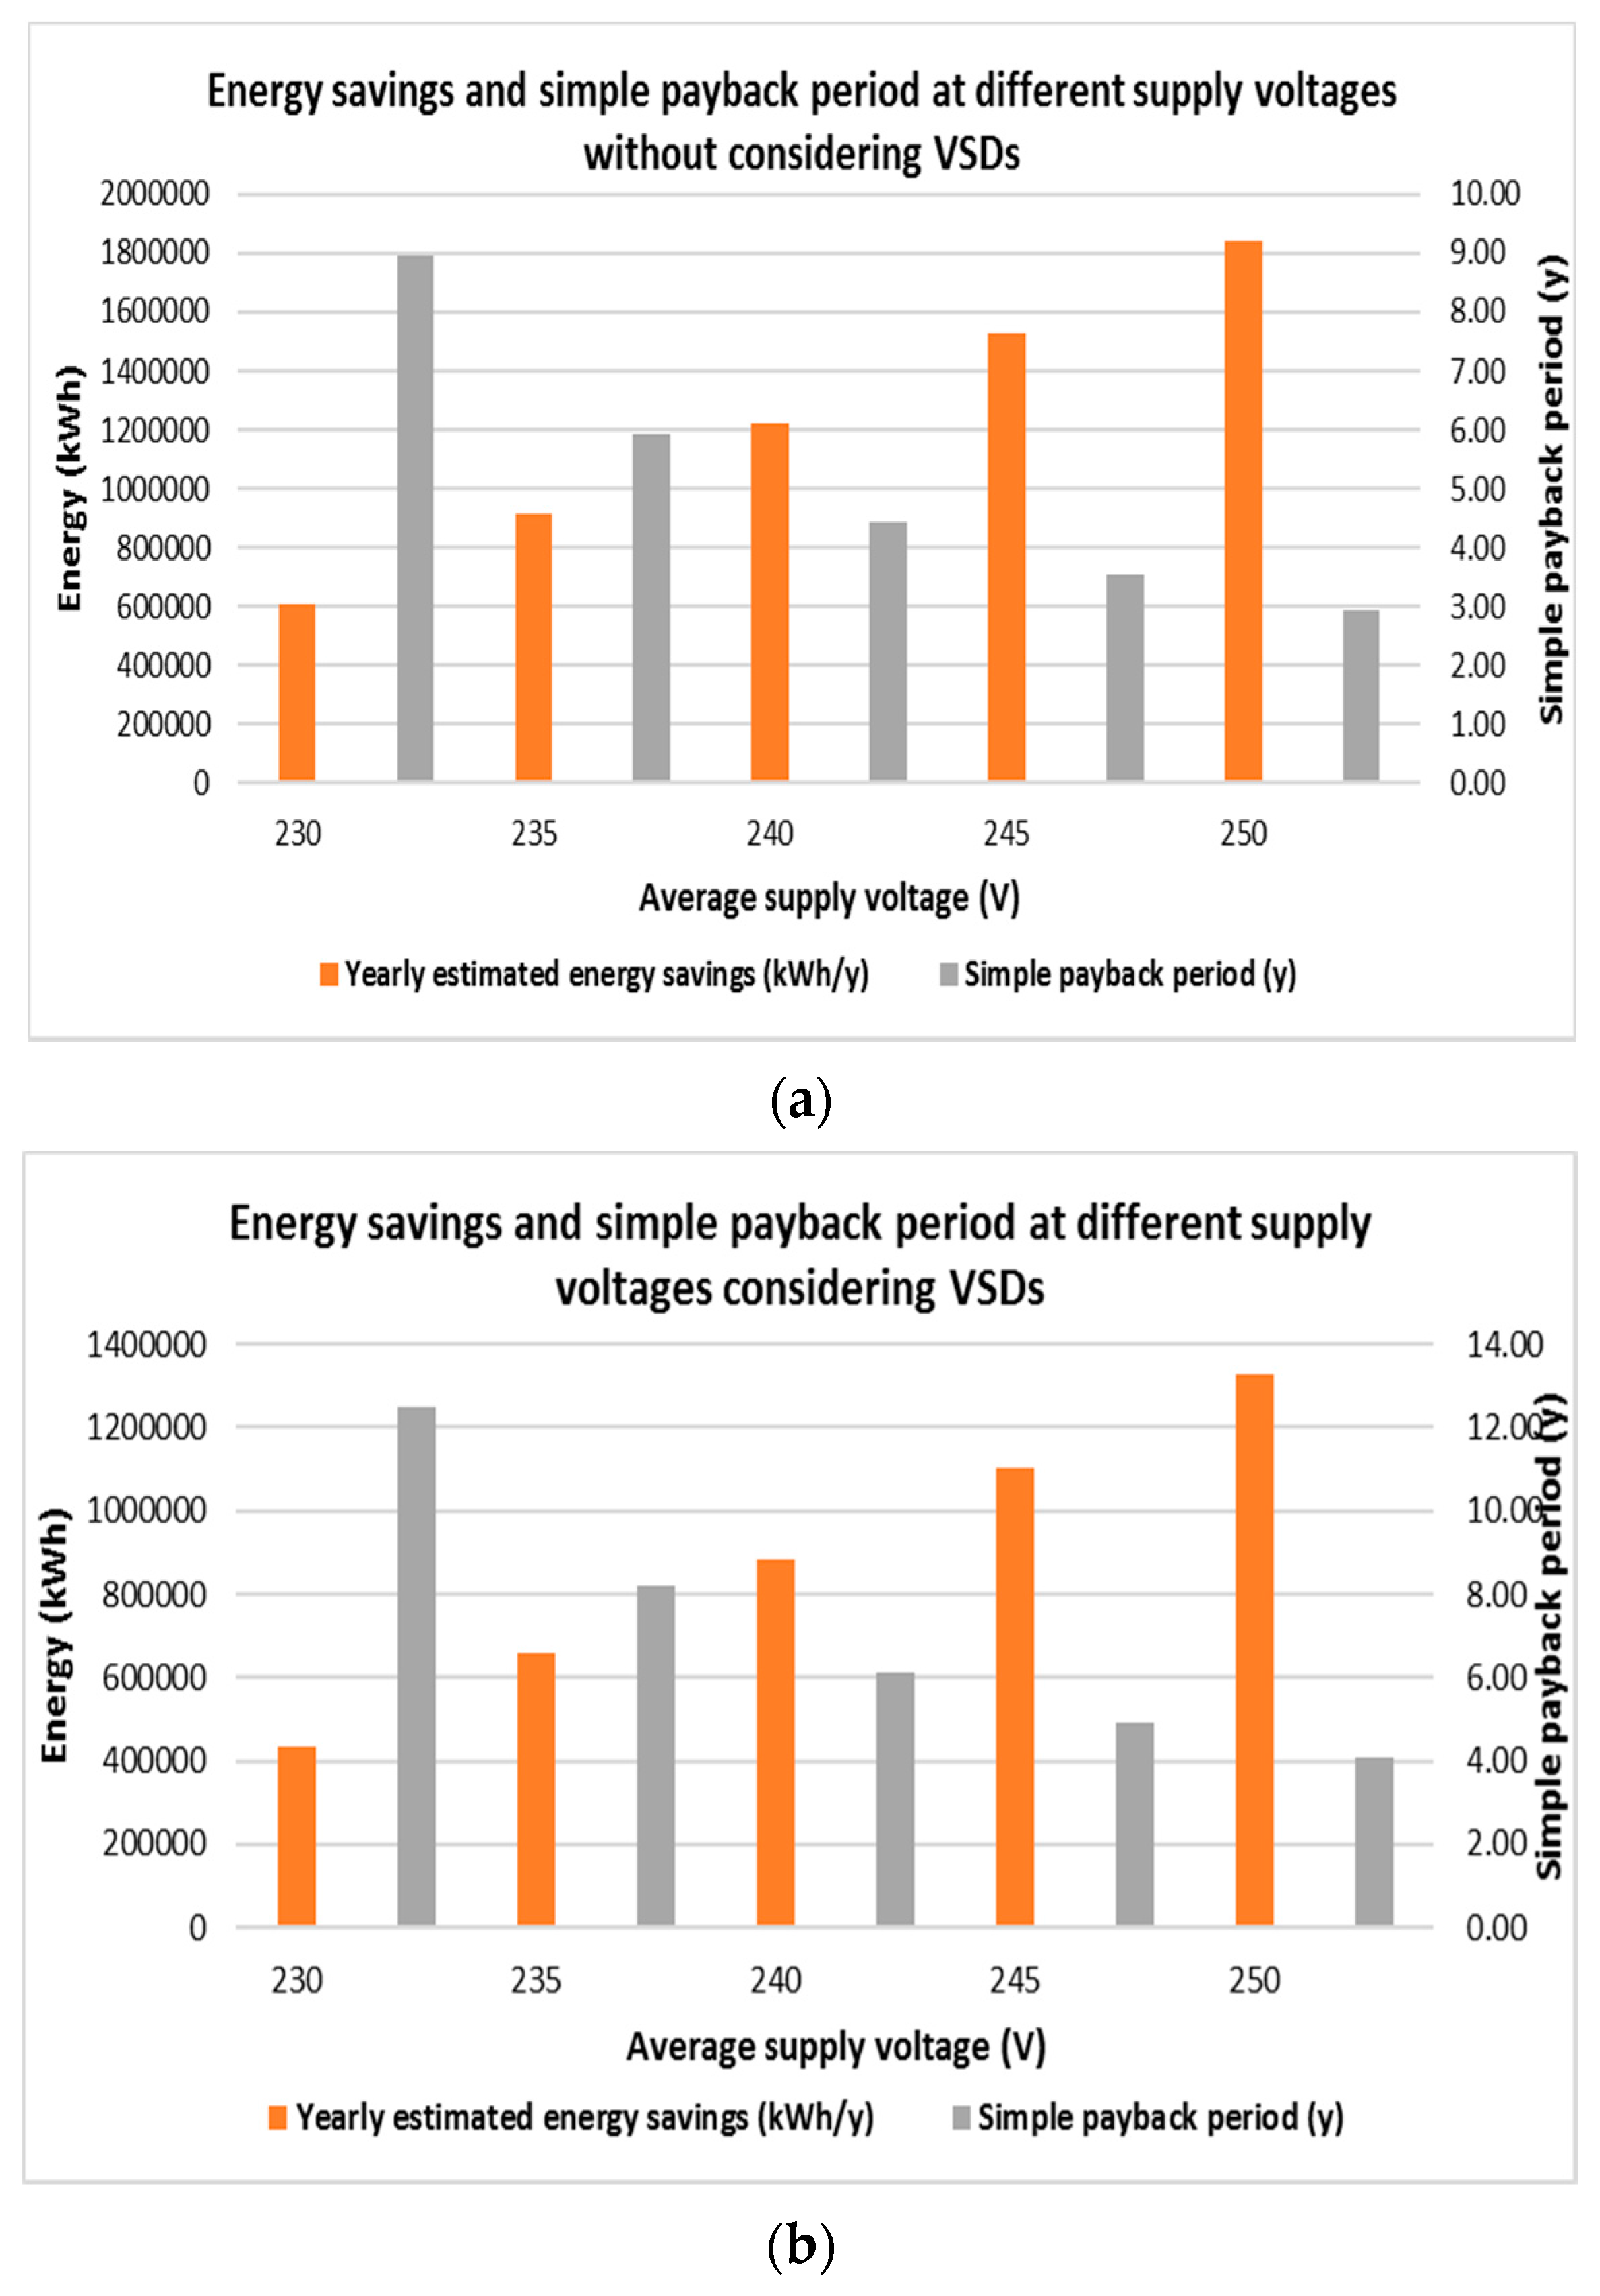
The energy savings and simple payback periods of installing voltage optimisation with a set voltage of 220 V at a medium sized abattoir is given in
Figure 17a, where the effect of VSDs in the load is not considered, and
Figure 17b, where the effect of VSDs on voltage optimisation is considered. Based on the types of VSDs typically used, the energy savings from voltage optimisation applied loads with VSDs is estimated to be 35% less than loads without VSDs in this analysis. On the other hand,
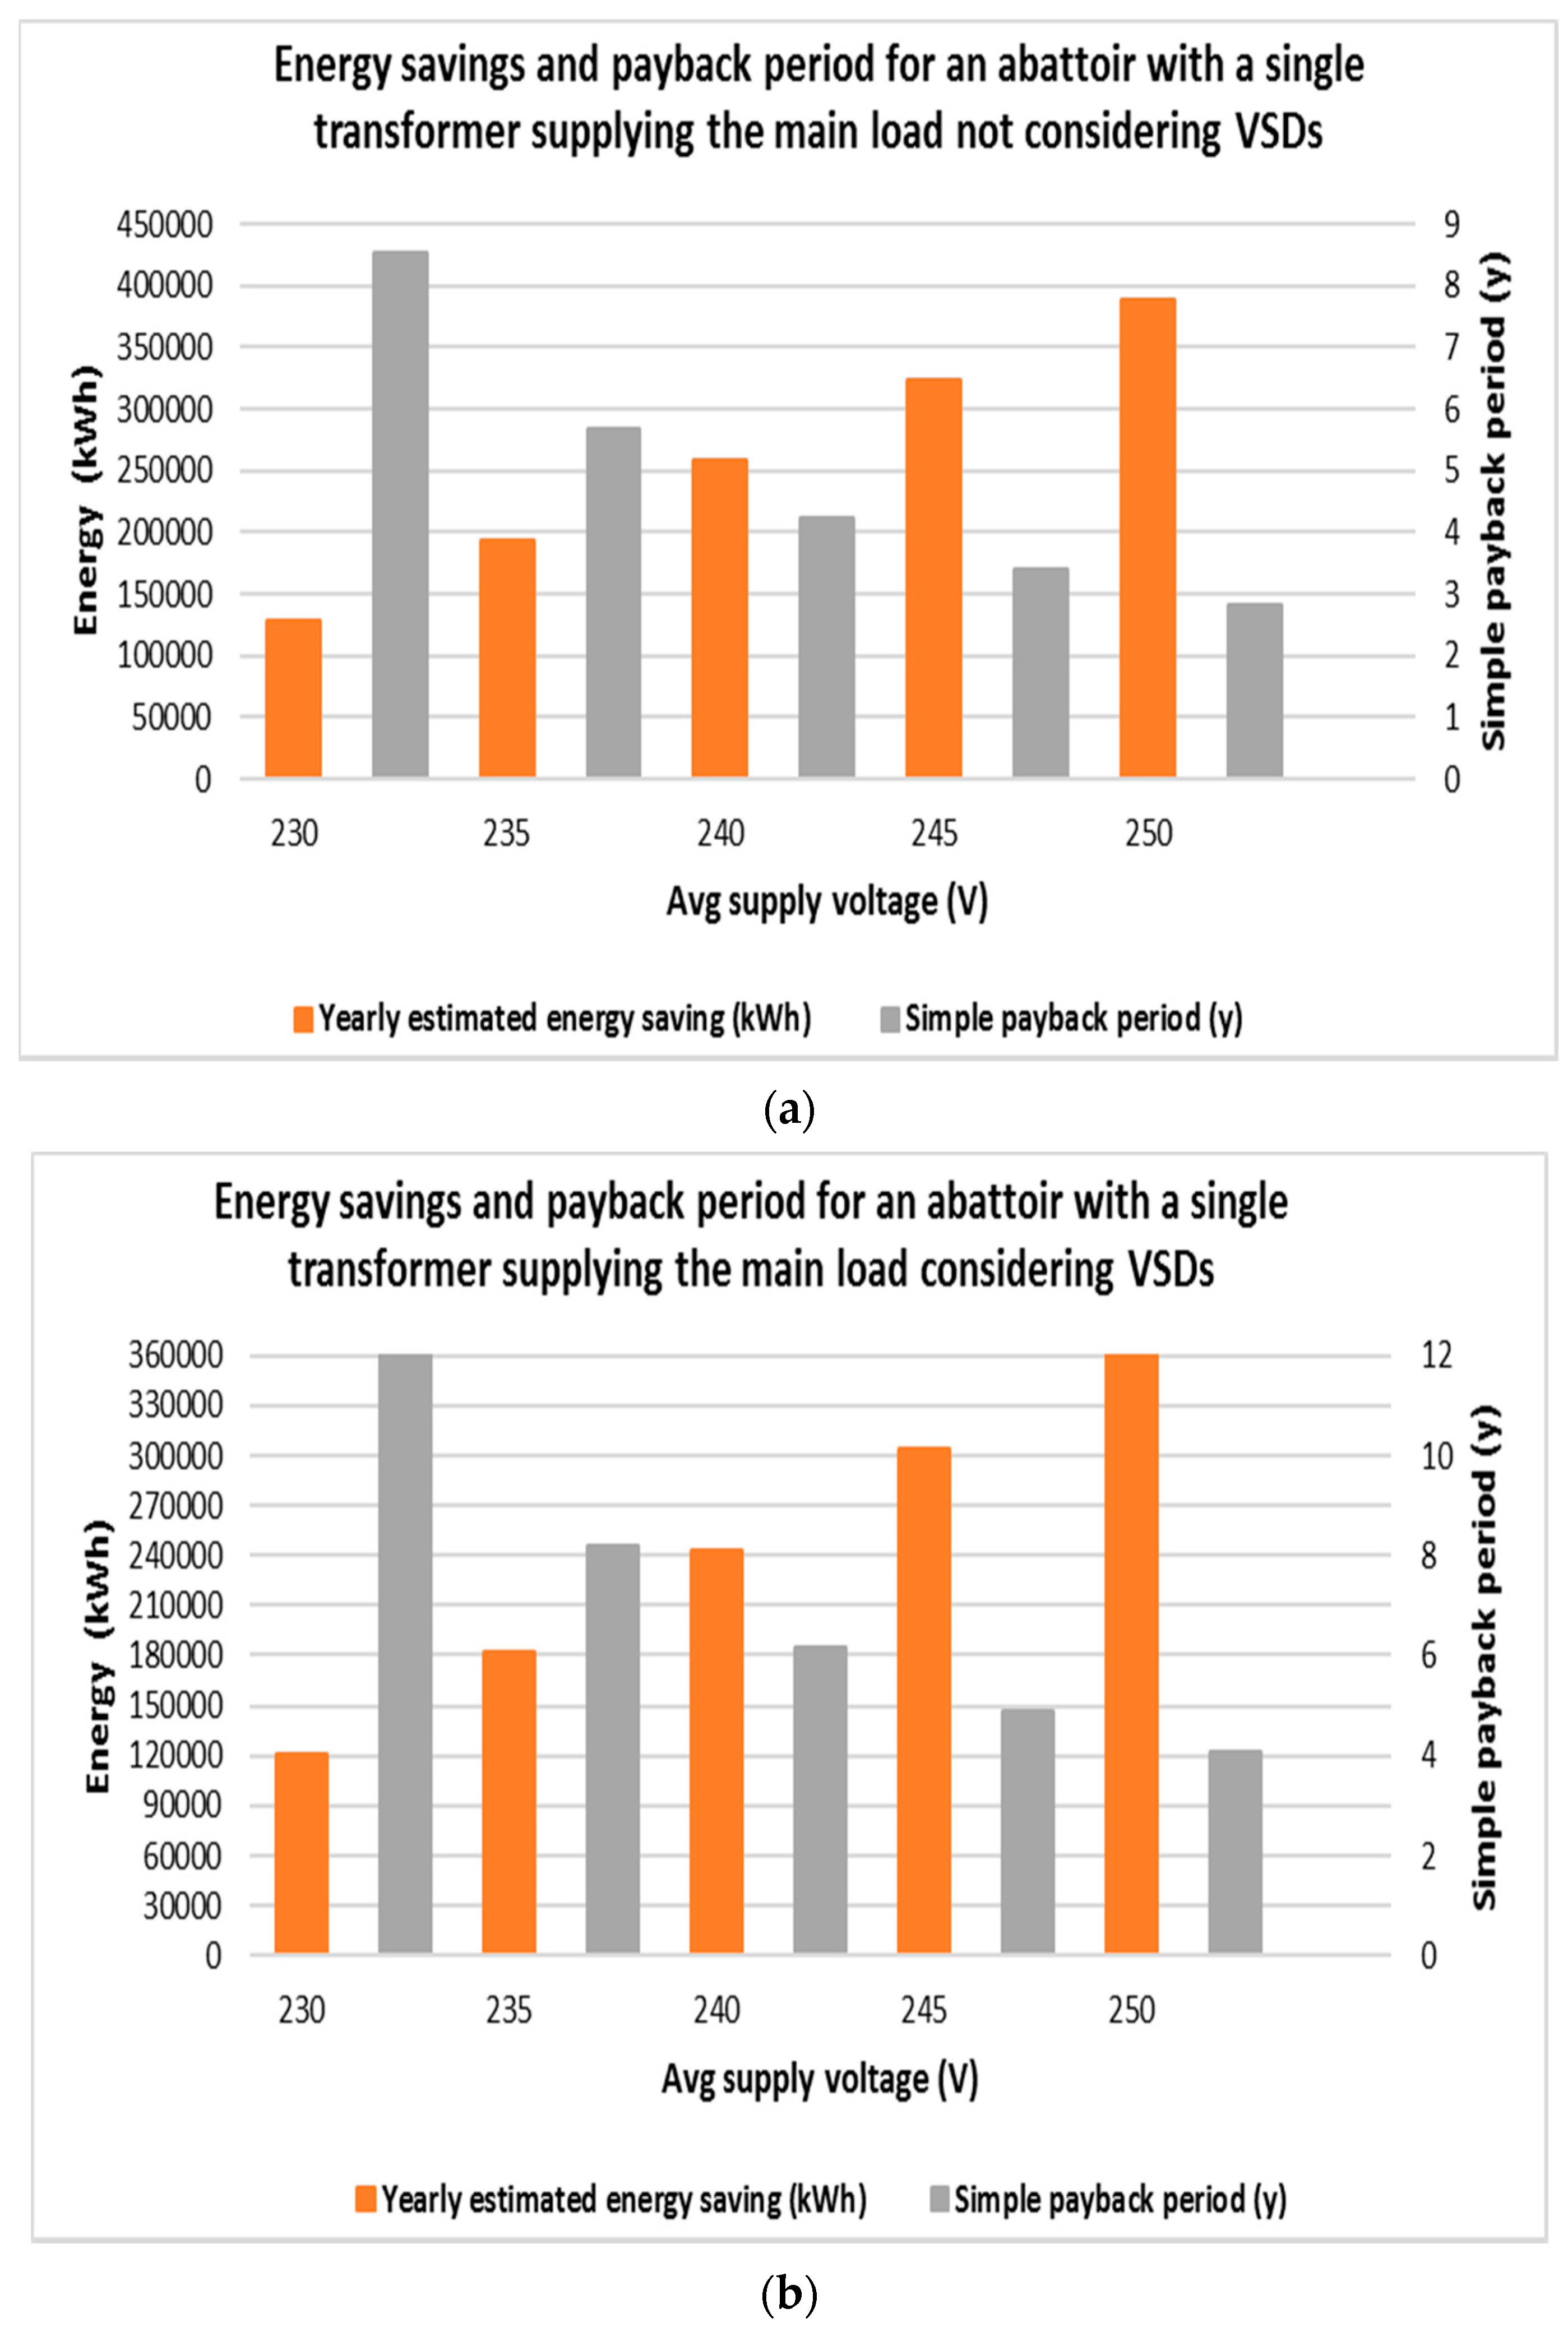
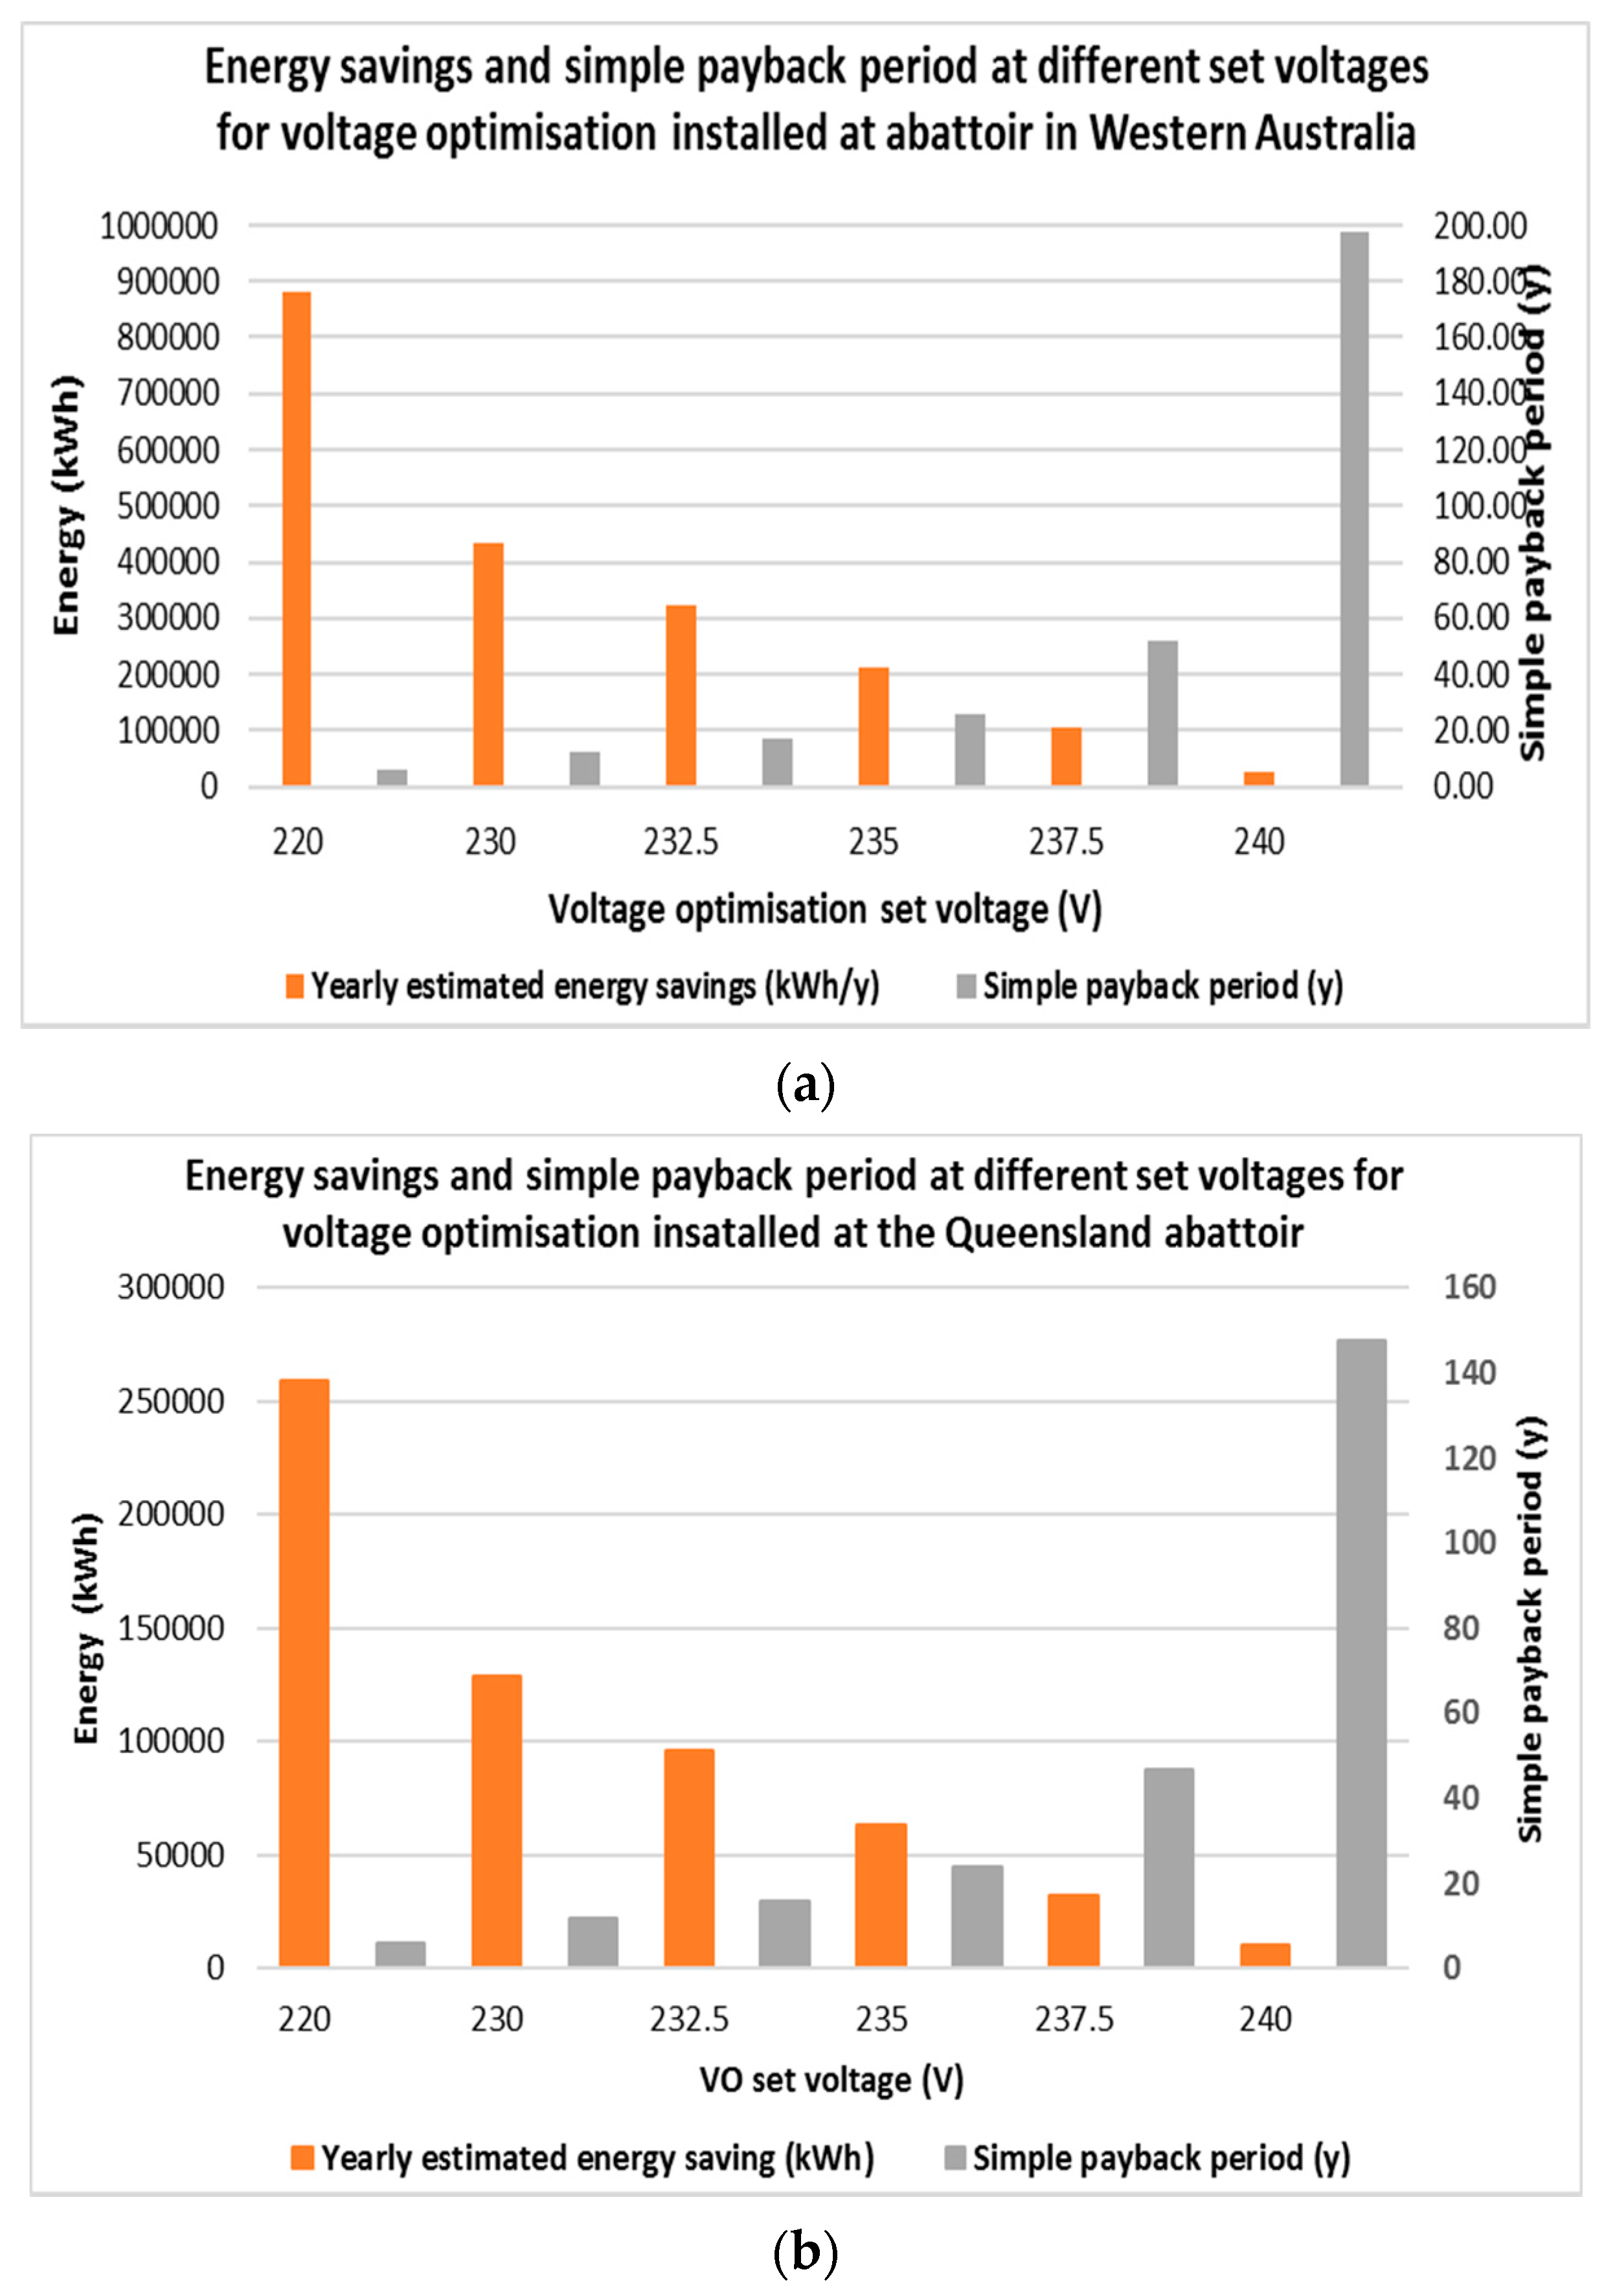
Figure 18a,b represents the energy savings and payback period for a single transformer supplying the main load (1 MVA transformer) at the abattoir in Queensland with or without VSD, respectively. Energy savings and simple payback period for the abattoirs at WA and QLD are shown in
Figure 19a,b, respectively, with different VO set voltages for a supply voltage of 240 V. From the figures, it is evident, as expected, that the highest energy savings and the lowest payback period can be achieved with a VO set voltage of 220 V. Conversely, the lowest energy savings and the highest payback period is for a VO set voltage of 240 V.
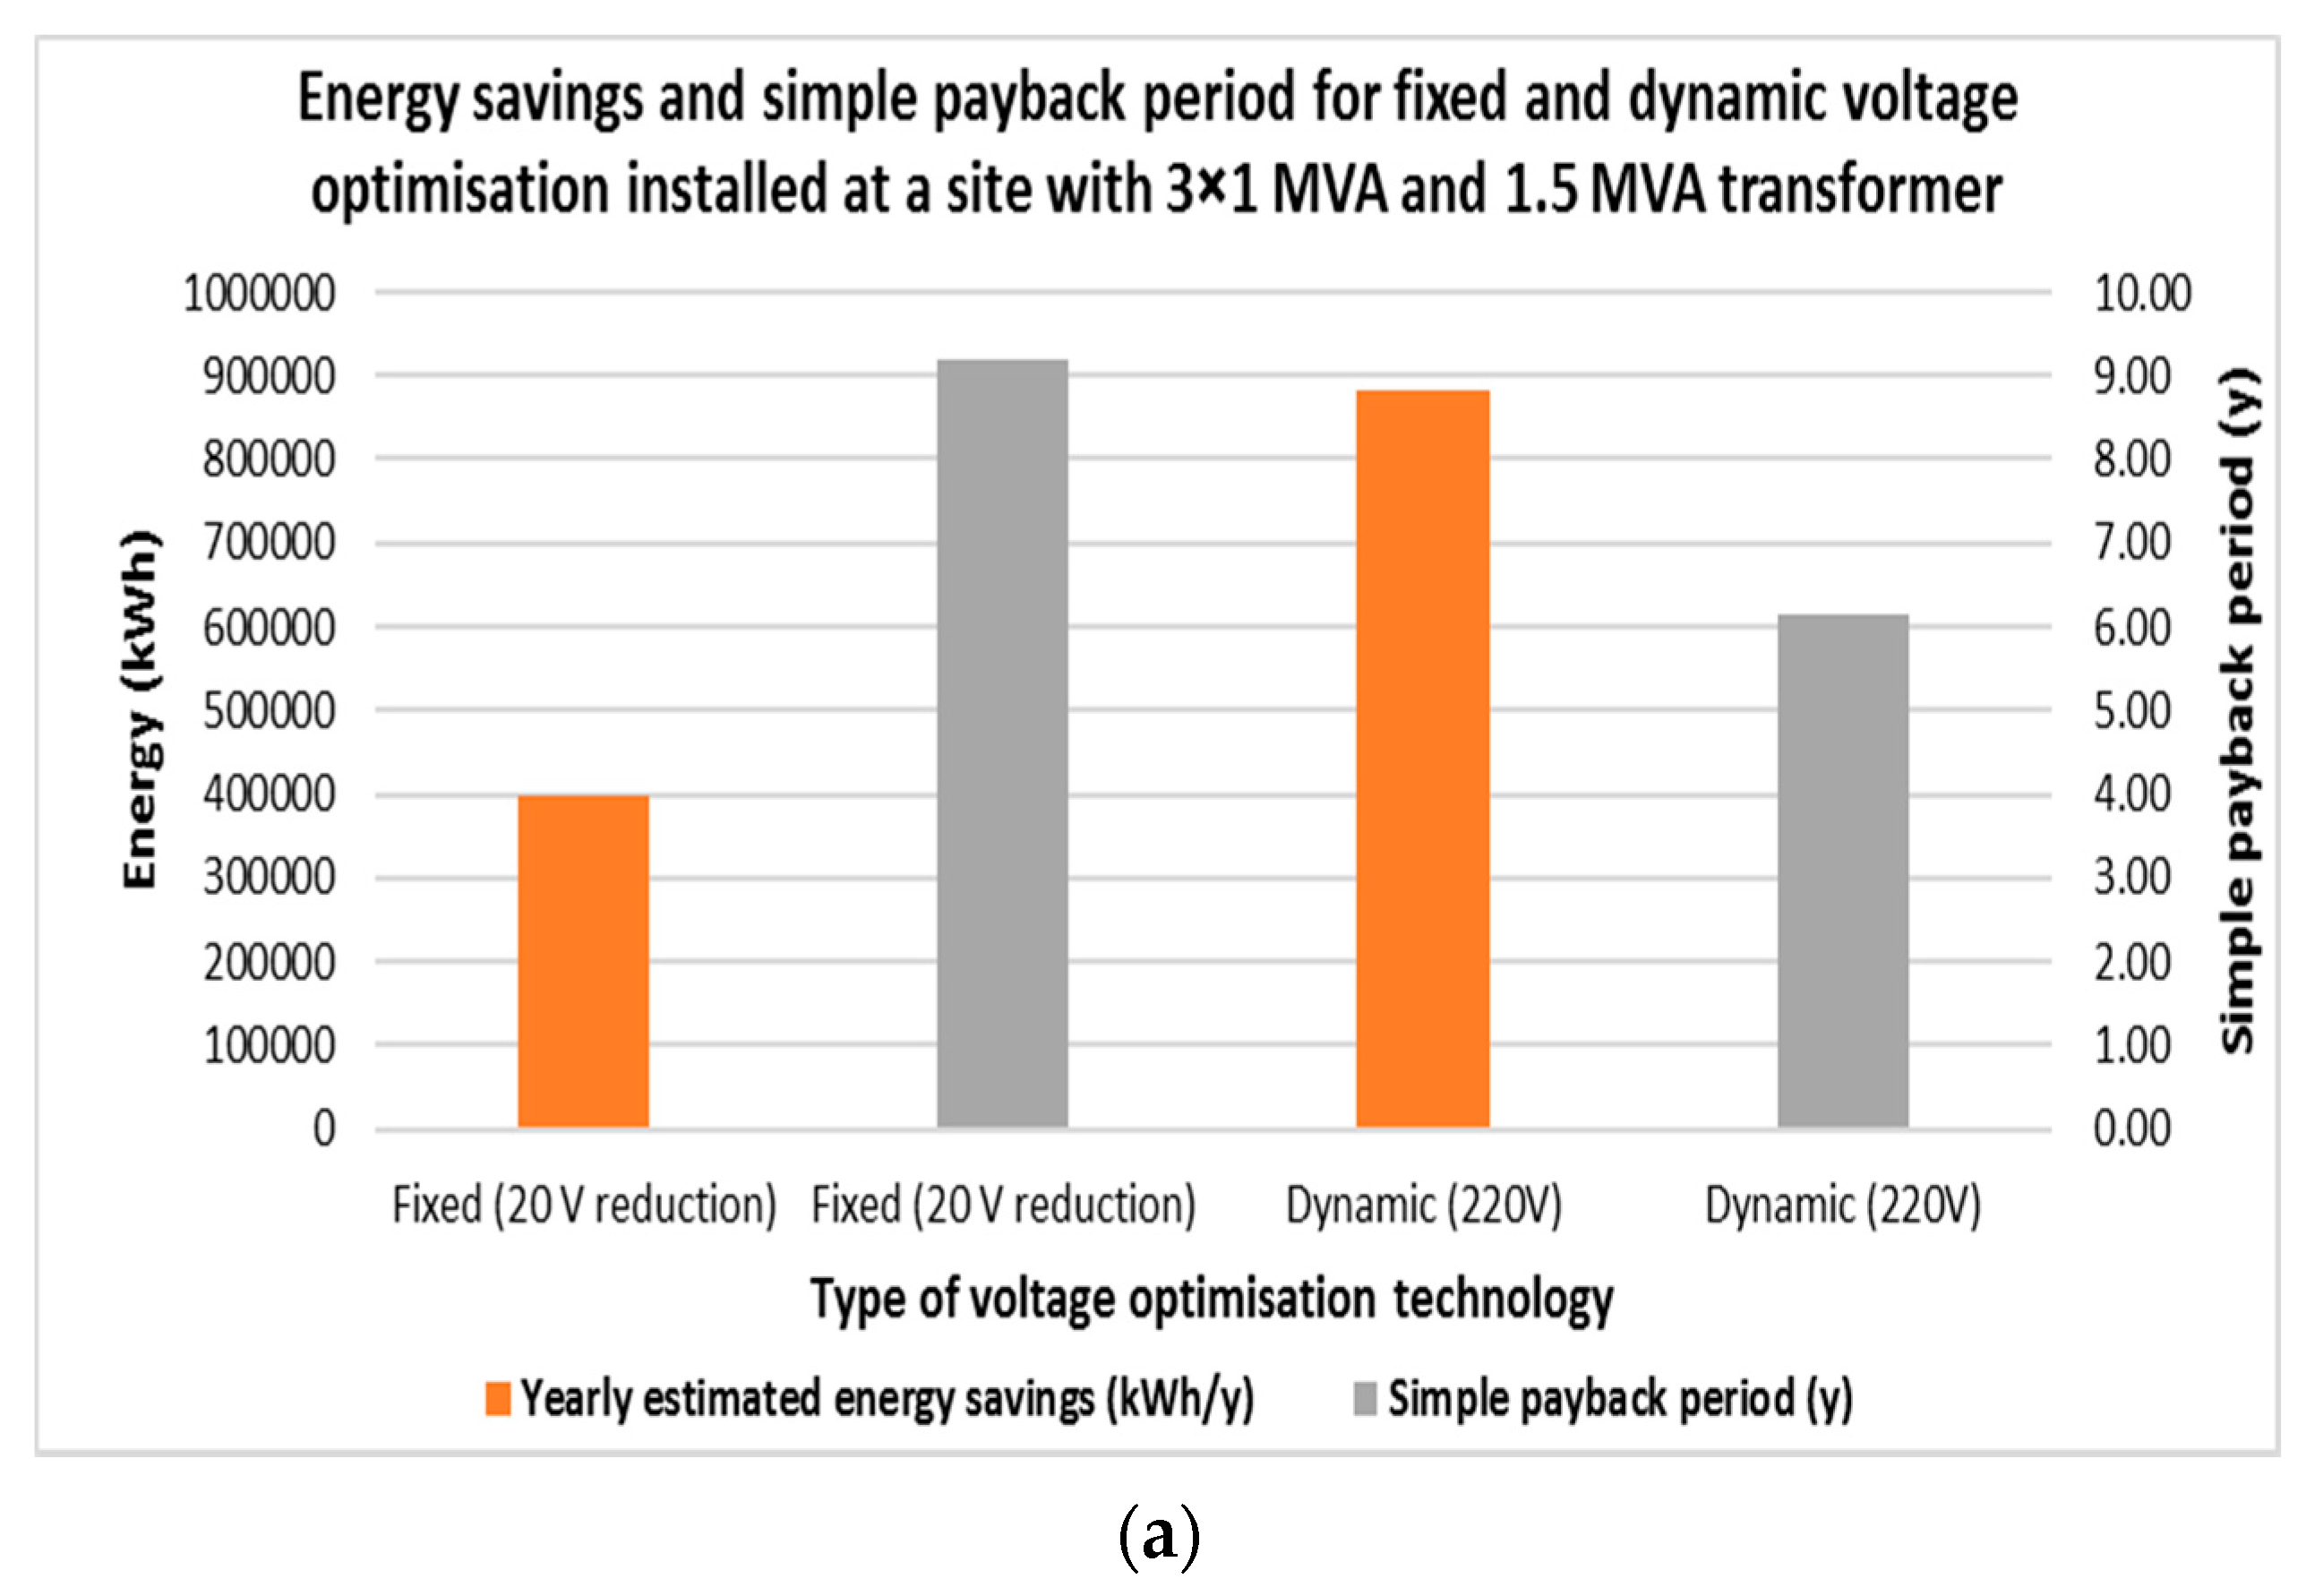
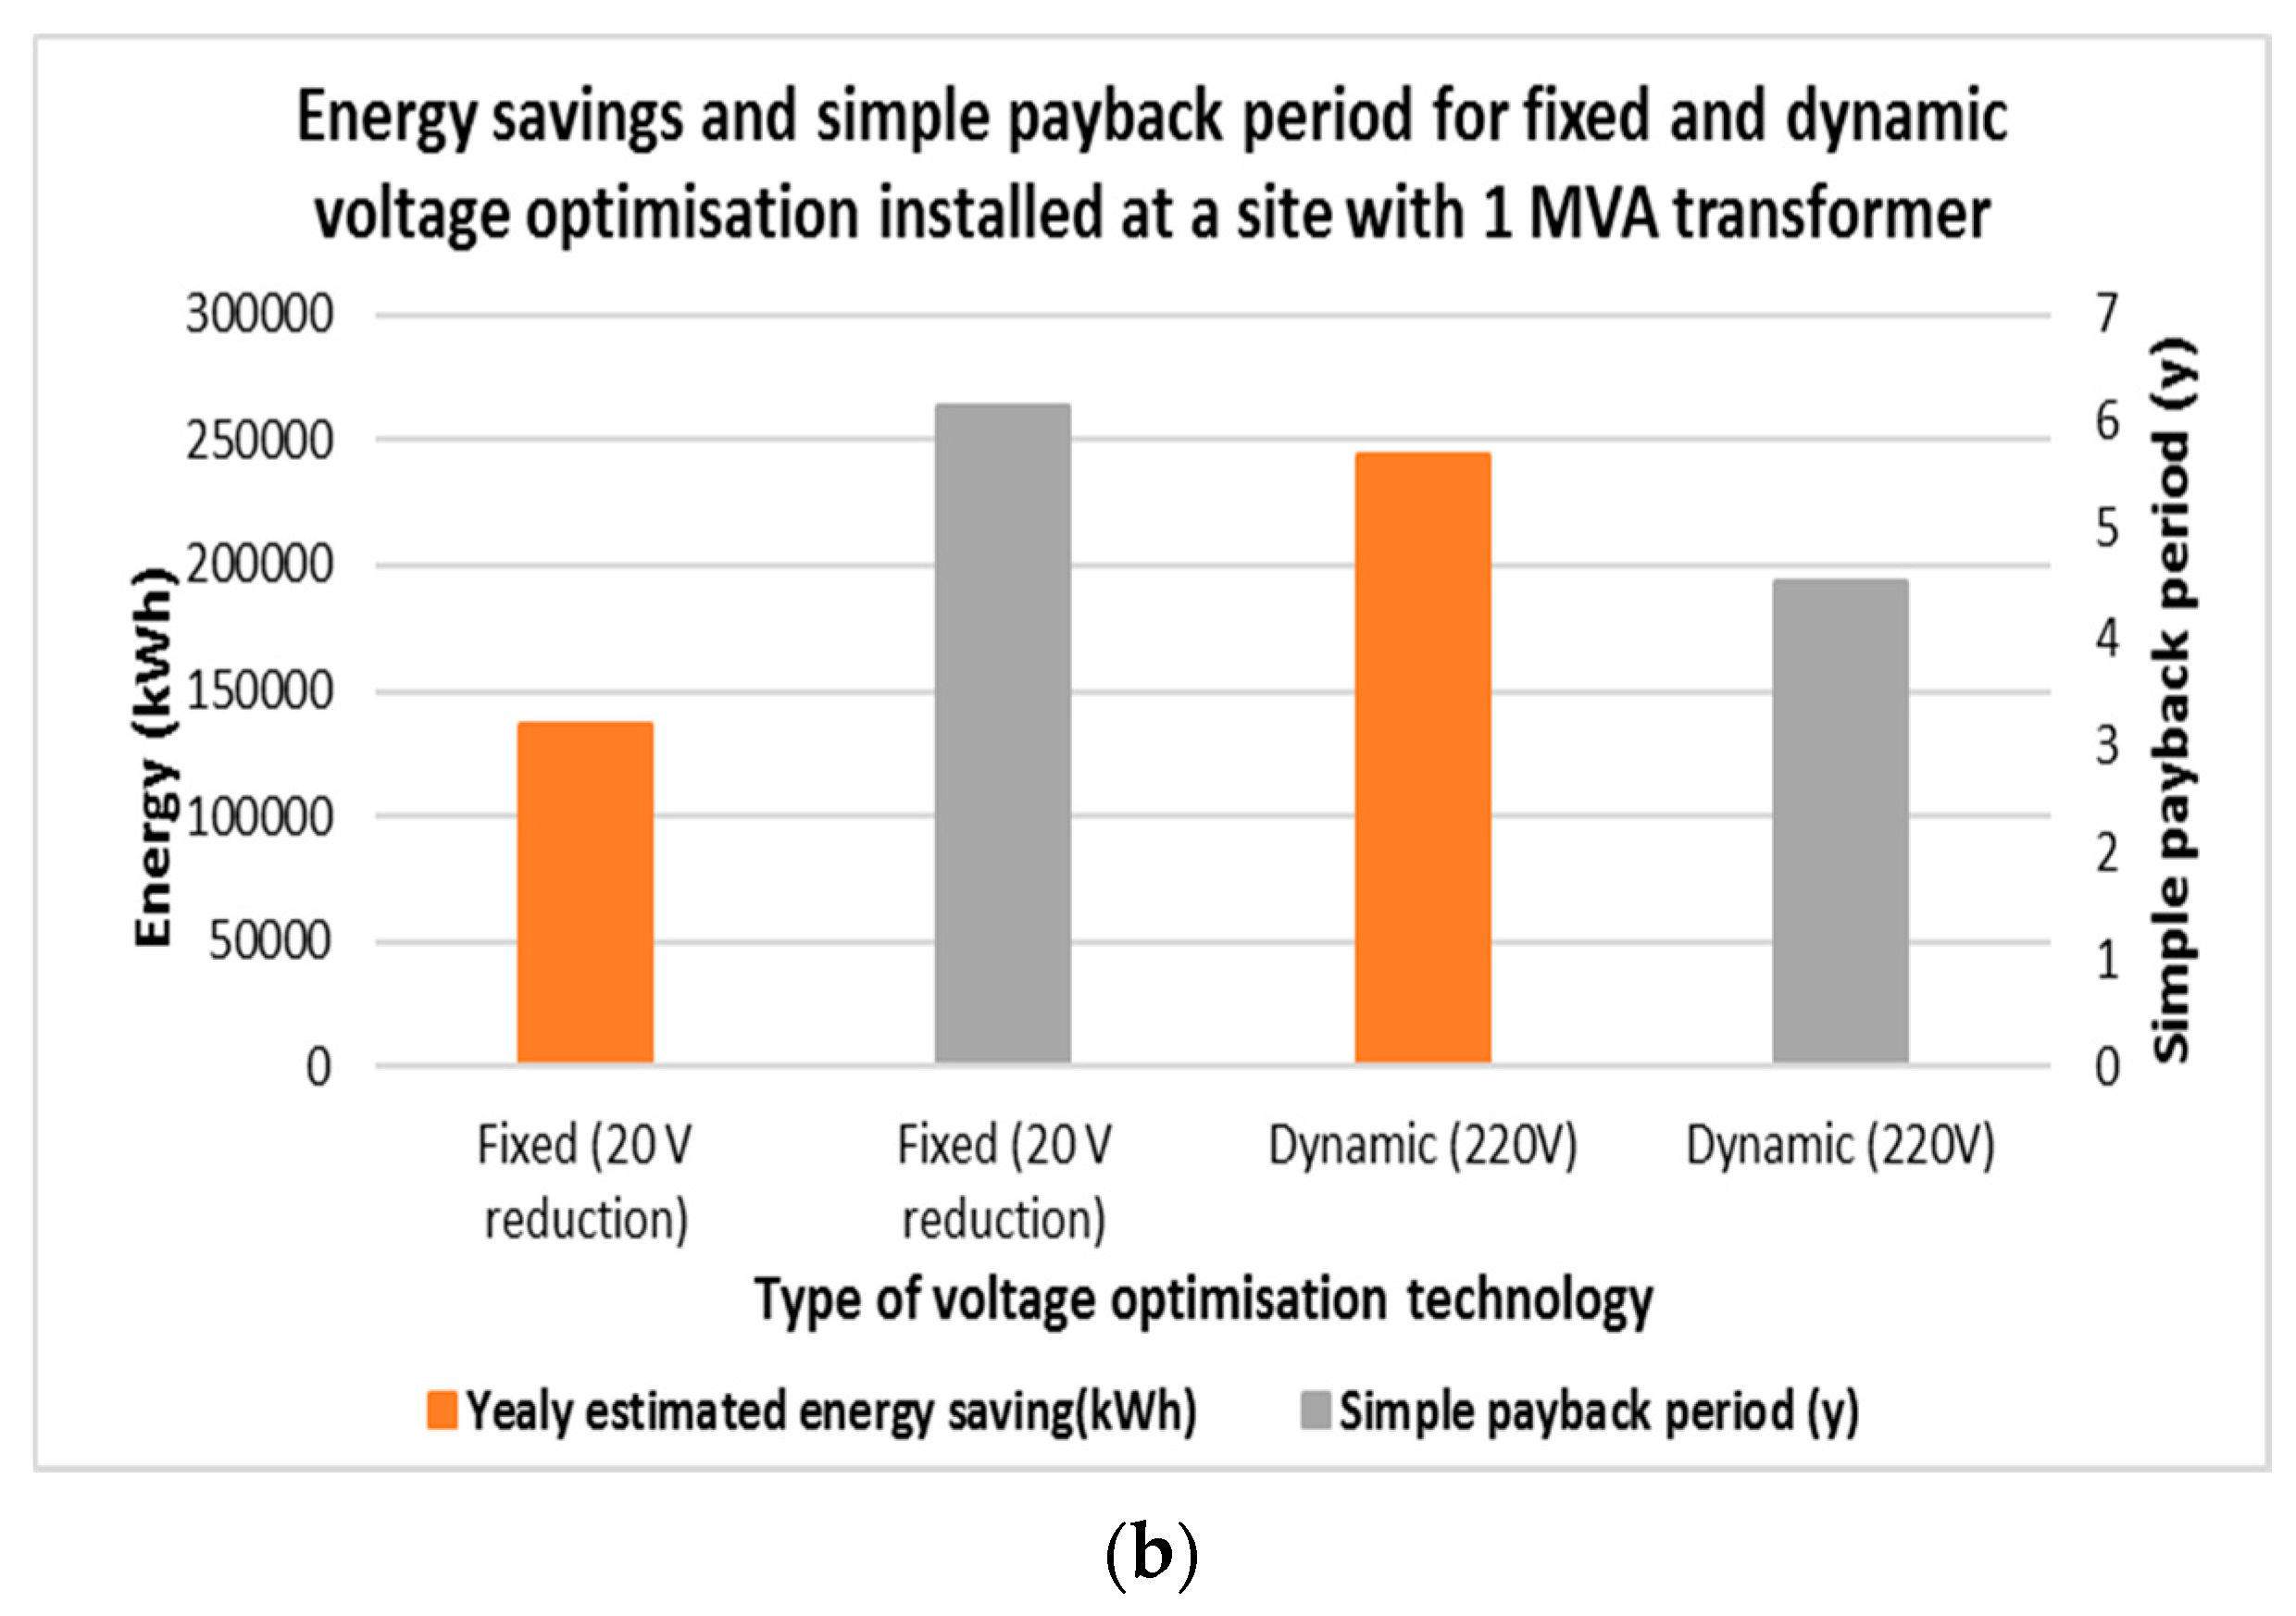
The energy savings and payback period for 3 × 1 MVA and a 1.5 MVA unit are shown in
Figure 20a comparing the introduction of fixed and dynamic voltage optimisation technology at the abattoir in WA, while
Figure 20b shows the energy savings and payback period for a 1 MVA unit at the abattoir in QLD.
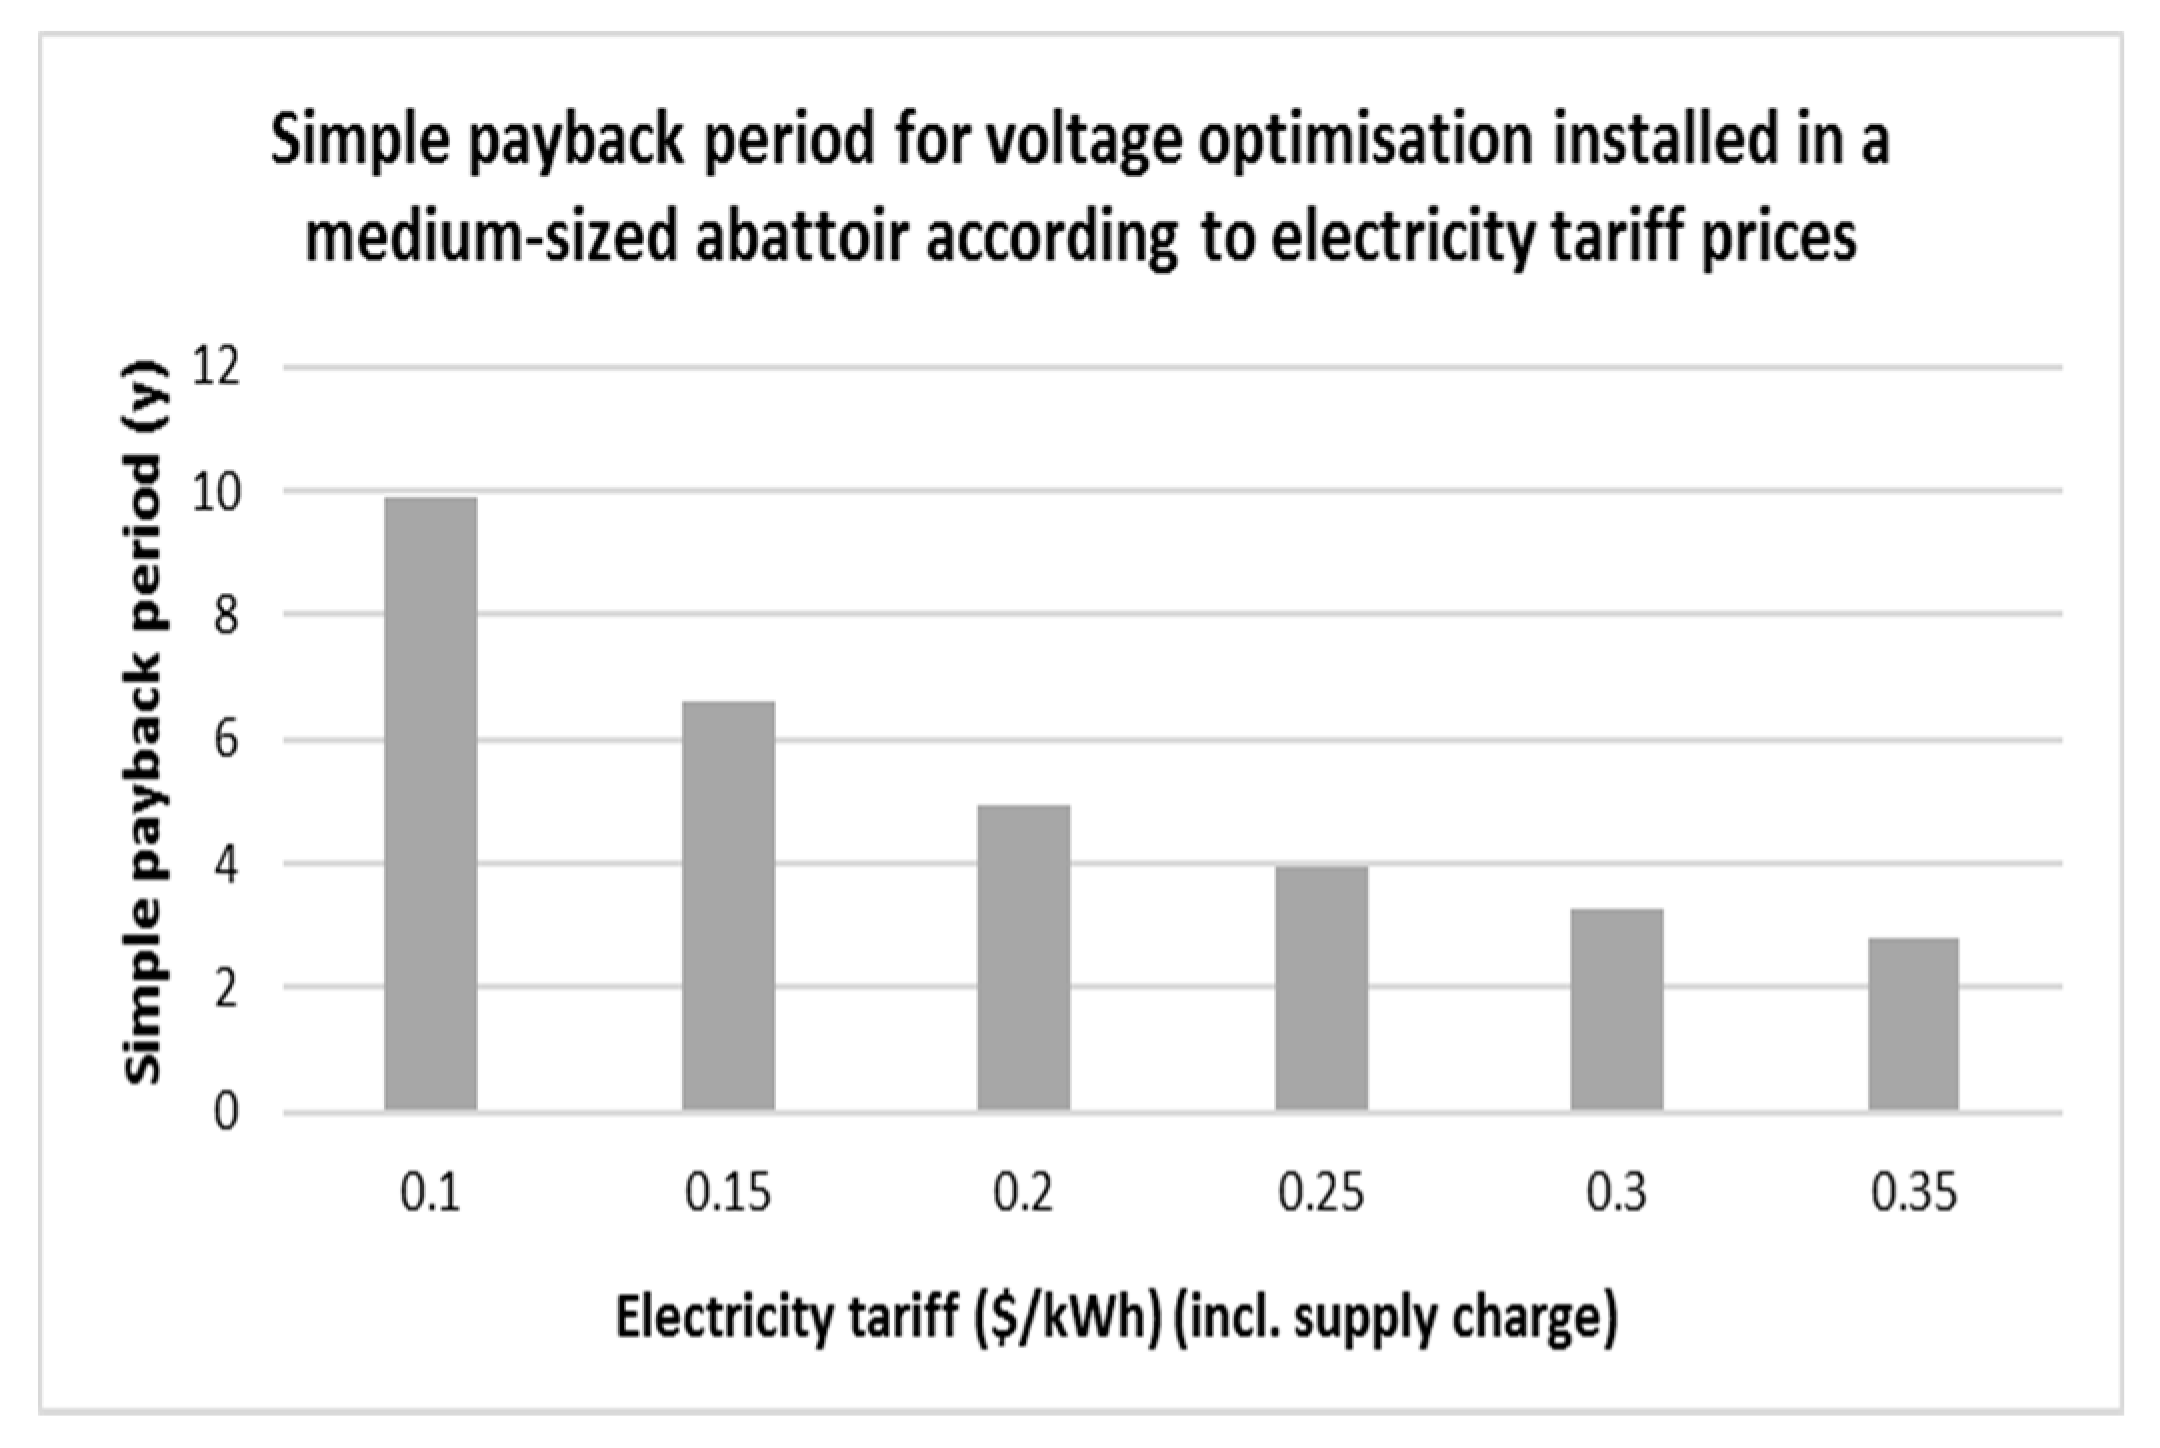
Figure 21 shows the simple payback period of dynamic voltage optimisation technologies for a range of electricity tariffs for a medium size abattoir (3 × 1 MVA and a 1.5 MVA Unit) with a set voltage of 220 V.
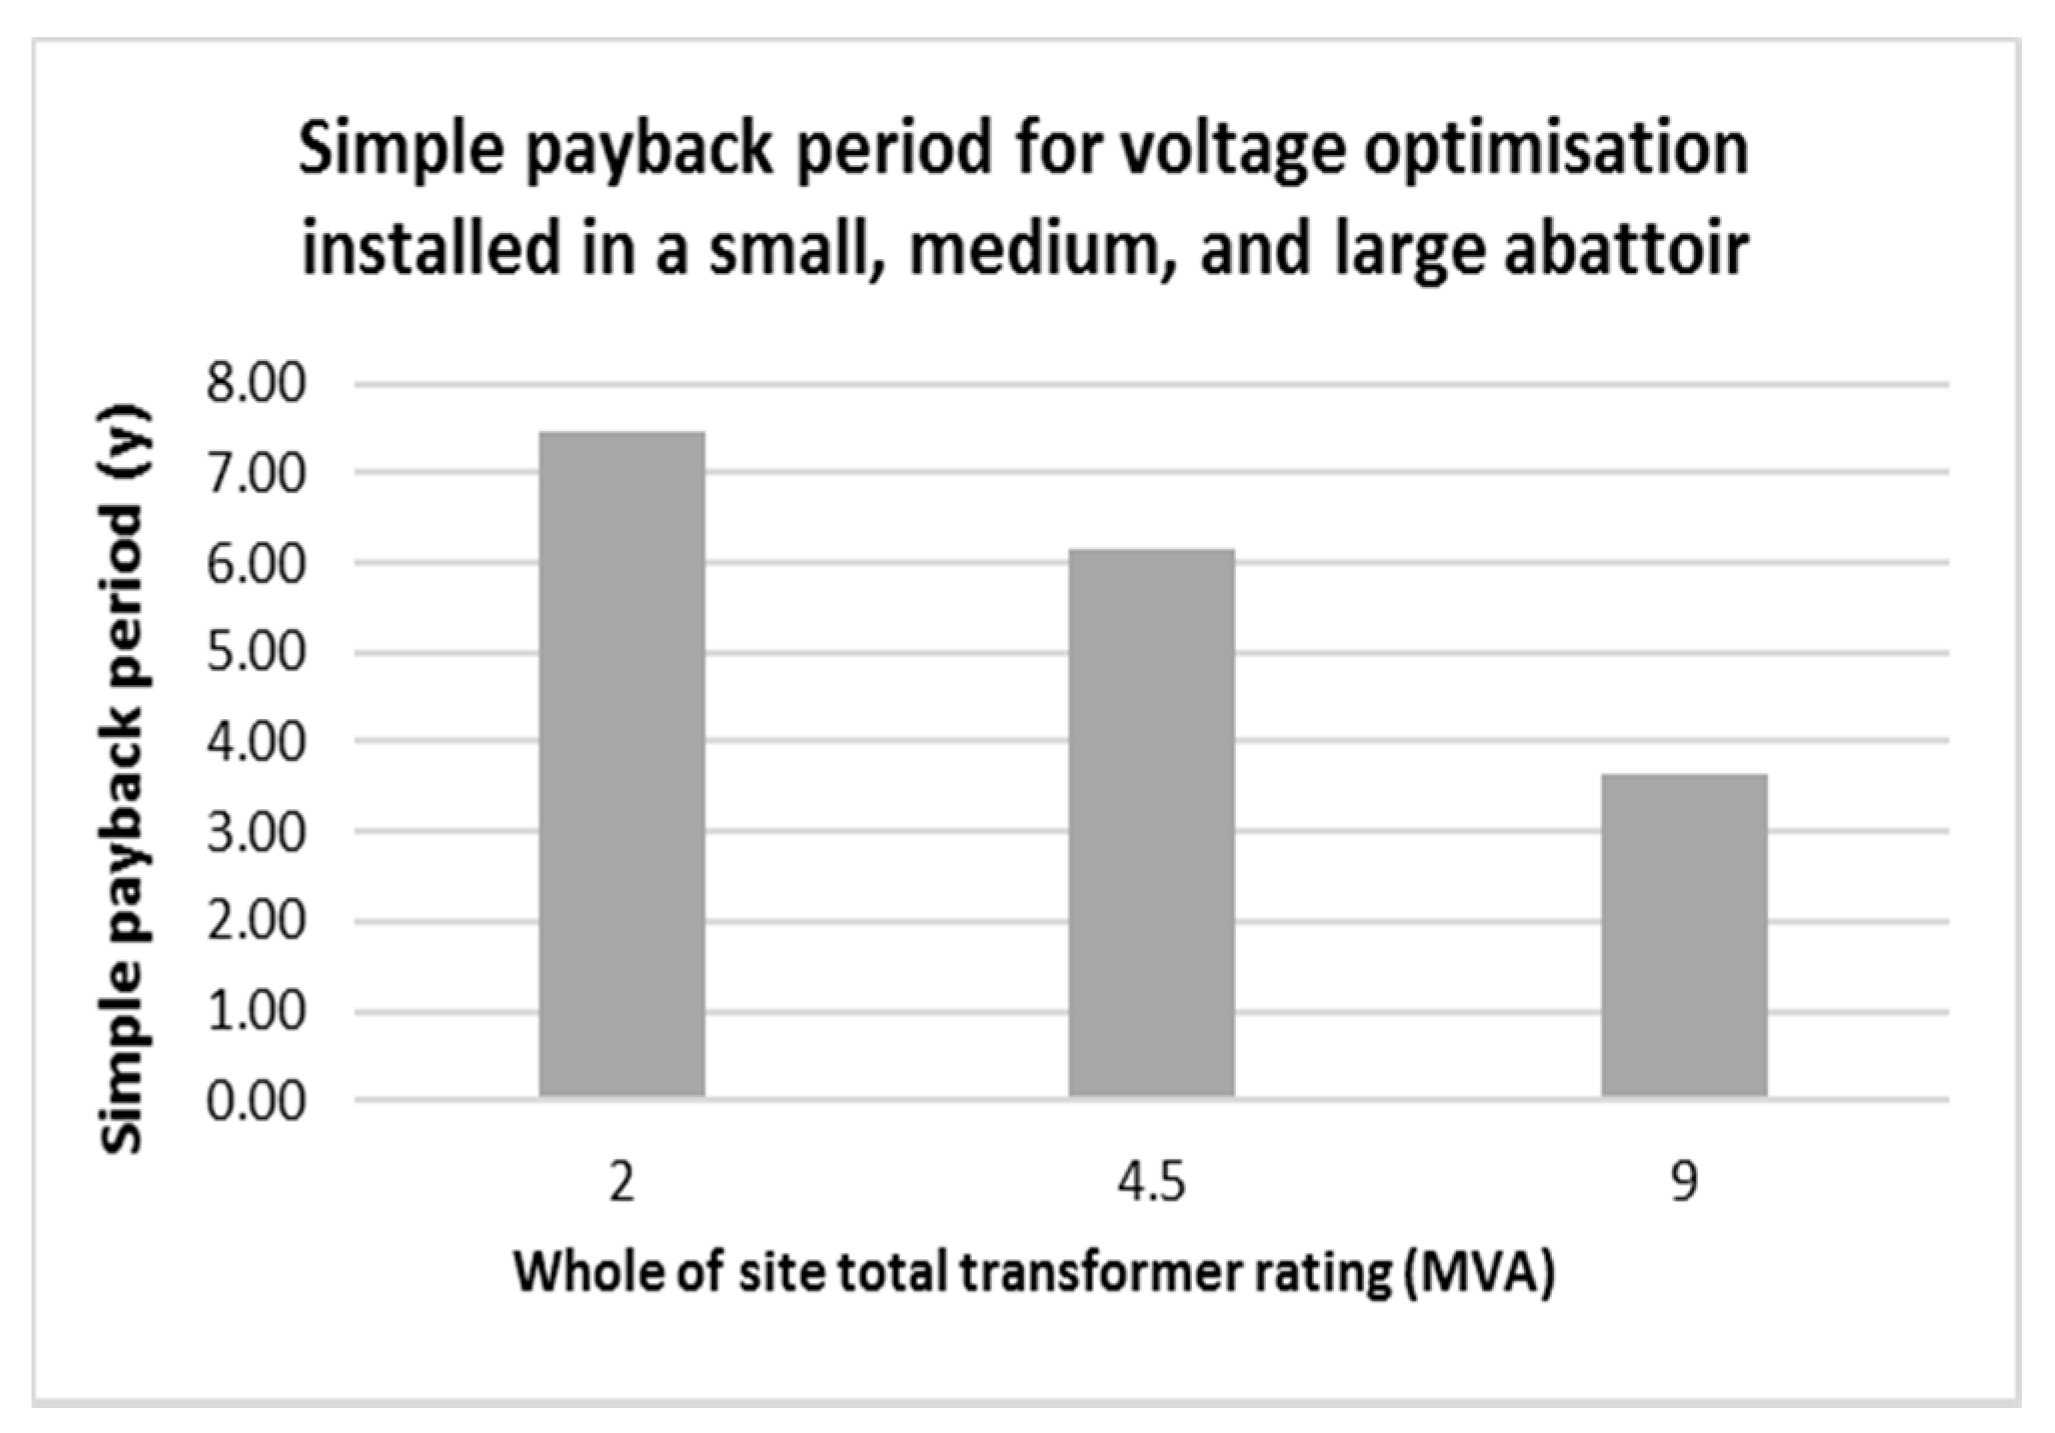
Figure 22 shows the simple payback period of dynamic voltage optimisation technologies at a small (200 head/day), medium (600 head/day), and large abattoir (1200 head/day) with a set voltage of 220 V installed with VO units of 2 MVA (2 × 1 MVA), 4.5 MVA (3 × 1 MVA and a 1.5 MVA), and 9 MVA (2 MVA and 2 × 3.5 MVA), respectively.
6. Discussion
From the review of the literature, it is evident that there is a significant scope for the Australian red meat processing industry to reduce their energy consumption and improve power quality by optimising voltage levels through the application of voltage optimisation technologies. The literature review has demonstrated that voltage optimisation technologies have been widely deployed in different types of industries including meat processing plants around the world and are still in use, providing benefits to industrial-scale electricity consumers. However, up until now, no installation of VO technologies within the Australian red meat processing industry has been reported. It is clearly evident from the literature that, by adopting VO technologies, it is possible to reduce energy costs significantly in the industry and improve power quality.
The potential energy savings from VO are achieved by reducing the losses in the equipment being supplied, and vary according to the type of equipment. If the load is linear, a reduction in voltage from 240 to 230 V will reduce the energy consumption by 8%, while a reduction to 220 V will yield a saving of 16% [
35]. The equipment will still operate correctly at the reduced voltage, if it is still well within the statutory limits (i.e., 220 V), and there will usually also be benefits of increased life and reduced maintenance of the equipment.
Voltage reduction does not work with all types of loads. Variable-speed inverter drives, high-frequency lighting ballasts, and switch-mode power supplies, for example, will generally not yield significant savings at a reduced voltage because the voltage fed to the load is generated electronically and is not affected by the supply voltage. Temperature-controlled heating is another type of load where no energy saving will be obtained, as the heater will still need to consume the same amount of energy to perform its required function [
35].
The analysis for Case Study Site 1 showed that, if 230 V could be supplied and maintained for one main transformer alone, then annual energy and cost savings could potentially be 70,348 kWh. The analysis for Case Study Site 2 showed that maintaining the voltage level at 230 V for the site as a whole could potentially save 122,758 kWh annually. Apart from the savings in energy, other benefits include less stress on electrical equipment and therefore improved lifetimes with less maintenance, as well as (depending on the technology used) improved power factors and less loss due to harmonics. The economic analysis has shown that, for a typical mid-sized (600 head a day) abattoir with a supply voltage of 240 volts and an electricity price of AU $0.15 a kWh, the installation of a voltage optimiser will have a payback period of 3–6 years, depending on the supply voltage, type of feeder line, and number of VSDs installed. Due to their larger electricity consumption, larger abattoirs will have a lower payback period, as will the use of voltage optimisers on individual large electricity feeder lines, such as refrigeration, compared to the whole site. The use of dynamic voltage optimisation is more economically favourable than using voltage reduction.
The output of the project will also enable engineering and operations staff to be better informed about the economic and technical benefits of using voltage stabilisation and optimisation technologies for abattoir. They can then use this to undertake a full feasibility and costing study for their site. It is anticipated that with the information provided in the project outcomes will:
Save upfront time and costs;
Mitigate risk and enable a more targeted assessment by facilities;
Consider the total cost of ownership;
Expedite the implementation of the technology; and
Enable the performance of the procurement process to be carried out in an efficient manner.
This is the first study of its kind and therefore further research is required to develop a comprehensive techno-economic evaluation that overcomes the limitations of the current study in the following areas:
Conduct the study with one-year load profiles: The current study has considered only one week of collected data, which cannot capture all of the voltage disturbances and variations in the demand at the case study sites; therefore, the presented results, specifically the energy savings and payback periods, are intended to be more indicative rather than descriptive. To capture a more realistic actual scenario, it is necessary to run a similar analysis with one-years’ worth of data.
Considering operational and maintenance costs: The operational costs of voltage optimisation technologies are not considered in the study in order for the results to remain indicative and applicable to any Australian meat processing facility, since operation costs will vary significantly according to the type of VO technology applied, where it is applied (location of the site), and how it is applied. However, a site-specific analysis will require details on the operational costs of VO technologies specific to the site under consideration.
7. Conclusions
Voltage optimisation technologies have been widely deployed in different types of industries around the world to keep the site voltage within an optimum level that will reduce energy consumption and greenhouse gas emissions, along with maintaining adequate power quality at the site. To determine the suitability of voltage optimisation technology for the Australian red meat processing industry, this study has undertaken a techno-economic assessment. Through the analysis of collected electricity characteristics (e.g., voltage, current, active power, and power factor) and power quality (harmonic distortion and under- and overvoltage events) data over time, it was found that most feeders on a typical red meat processing site would be able to save energy and ensure enhanced power quality with the targeted implementation of voltage optimisation equipment. The techno-economic analysis has shown that there are no technical reasons why voltage optimisers should not be installed in red meat abattoirs, and there are in fact many advantages in doing so. Apart from the savings in energy, these include less stress on electrical equipment and therefore improved lifetimes with less maintenance, as well as (depending on the technology used) improved power factors and less losses due to harmonics. The uptake and implementation of voltage optimisation technology at one abattoir could serve as the catalyst for widespread installation at meat processing facilities throughout Australia. This study potentially serves as a catalyst for improved energy consumption, power quality and, therefore, potentially improved returns on equipment life right across the red meat processing industry.

 ,
, 


