Article

Disturbance Elimination for Partial Discharge Detection in the Spacer of Gas-Insulated Switchgears

1
Department of Electrical and Electronics Engineering, Korea Maritime and Ocean University, Busan 49112, Korea
2
Forensic Safety Section, National Forensic Service Busan Institute, Yangsan 50612, Korea
3
HVDC Production Team, LSIS Co., Ltd., Busan 46739, Korea
*
Author to whom correspondence should be addressed.
Energies 2017, 10(11), 1762; https://doi.org/10.3390/en10111762
Submission received: 26 September 2017 / Revised: 18 October 2017 / Accepted: 30 October 2017 / Published: 2 November 2017
(This article belongs to the Section F: Electrical Engineering)

Abstract

:
With the increasing demand for precise condition monitoring and diagnosis of gas-insulated switchgears (GISs), it has become a challenge to improve the detection sensitivity of partial discharge (PD) induced in the GIS spacer. This paper deals with the elimination of the capacitive component from the phase-resolved partial discharge (PRPD) signal generated in GIS spacers based on discrete wavelet transform (WT). Three types of typical insulation defects were simulated using PD cells. The single PD pulses were detected and were further used to determine the optimal mother wavelet. As a result, the bior6.8 was selected to decompose the PD signal into 8 levels and the signal energy at each level was calculated. The decomposed components related with capacitive disturbance were discarded, whereas those associated with PD were de-noised by a threshold and a thresholding function. Finally, the PRPD signals were reconstructed using the de-noised components.

1. Introduction

Detection and analysis of partial discharge (PD) in insulation structures for gas-insulated switchgears (GISs), transformers, cables, and rotating machines are important to ensure their stable and reliable operation [1,2,3,4,5,6]. Among the components of GISs, the epoxy spacer is a critical part and can result in the eventual failure of GISs. It is usually examined by AC withstand voltage tests with high electrical stress and by PD tests [7,8]. It is specified that the maximum permissible PD level for GISs should not exceed 5 picocoulombs (pC) [9]. It is also indicated that the spacer should be replaced if the PD induced in spacer is greater than 1 pC [7]. However, the sensitivity of PD measurement is influenced by the capacitive current flowing in the GIS test section, especially in the spacer.
Figure 1 shows a PD signal detected within a cycle of the applied voltage, accumulation of such signals forms the phase-resolved partial discharge (PRPD) pattern. It can be seen that the disturbance due to the capacitive component is so high that the PD signal is seriously overlapped. Since the PRPD pattern is extracted using the peak detection technique, such distortion lowers the sensitivity of PD measurement and invalidates the specific feature of a defect, consequently making defect identification inaccurate. This problem has been dealt with by applying a high pass filter (HPF); however, it is difficult to determine the exact cutoff frequency of the filter since an improper filter attenuates the magnitude of PD. In addition, the filter cannot remove the disturbance completely.
The wavelet transform (WT) is an effective signal processing method and has achieved its application in the field of condition monitoring and diagnosis. It has been used for de-noising of the ultra-high frequency signal and eliminating the corona from PD signal [10,11,12,13,14,15,16]. In addition, parameters derived from wavelet decomposition are implemented in the feature extraction for defect classification [17,18]. Satish and Nazneen studied the de-noising of PD signals buried in excessive discrete spectral, stochastic, and random interferences using the WT method. The simulated signals and pulses detected from a point–plane gap were analyzed. The results revealed that the wavelet method was successful in rejecting all the three types of interference [11]. Ma et al. proposed the automatic level-dependent thresholding criterion for de-noising the damped exponential and damped oscillatory pulses immersed in noise when the narrow-band and the ultra-band detection circuit were used [12]. Zhou et al. introduced the filter pairs for wavelet decomposition and analyzed the frequency bands of the wavelet coefficients. By investigating the energy distribution at each decomposition level, the de-noising effect was significantly improved [13]. Zhang et al. implemented a WT technique to reject noise in on-site PD measurement in cables. The continuous sinusoidal noise, pulse-like noise, and white noise were successfully rejected [14,15]. Chang et al. presented a separation of corona from the PD signal by wavelet packet transform and a neural network method. The parameters including node energy, kurtosis, and skewness were calculated and used for characterizing PD signal and corona [16].
However, few works have been carried out to deal with the capacitive current for PD detection in GIS spacers using the WT method. This paper discusses the elimination of the capacitive component based on the WT technique for the purpose of improving the PD detection sensitivity in GIS spacers.

2. Insulation Defects in Spacer

Although various types of insulation defects have been introduced and evaluated, the ones existing in an epoxy spacer are regarded as the most critical and initiate the failure of GISs. Such defects are usually minute imperfections that are difficult to be detected, including a void inside spacer (VIS), a particle on spacer (POS), and a crack [6,19,20]. The VIS is the result from air bubbles produced during the manufacturing process of solid spacers, such as high temperature casting and curing of epoxy. The POS is a conductive contaminant or particle that adheres to the surface of insulating materials. Cracks are one of the most common defects in GISs, which are formed due to mechanical impacts from the outside, operations of the circuit breaker, and strains generated by heat shock [7,8,21]. These three types of defects were simulated using artificial PD cells, and the epoxy resin insulator for GIS spacer was used. The PD cells were filled with SF6 gas with a pressure of 0.5 MPa. Figure 2 shows a PD cell for POS. The plane electrodes were made of tungsten–copper alloy with a diameter of 80 mm and a thickness of 20 mm. Their edges were rounded to prevent the concentration of the electric field [22]. An epoxy insulator with a height of 30 mm, and a length as well as a width of 10 mm was placed between the high-voltage electrode (upper) and the grounding electrode (lower). The metallic particle was attached to the insulator by a very small amount of epoxy compound. For VIS and crack cells, epoxy plates with a diameter of 80 mm and a thickness of 20 mm were used, and both of them were collected from a GIS manufacturer.

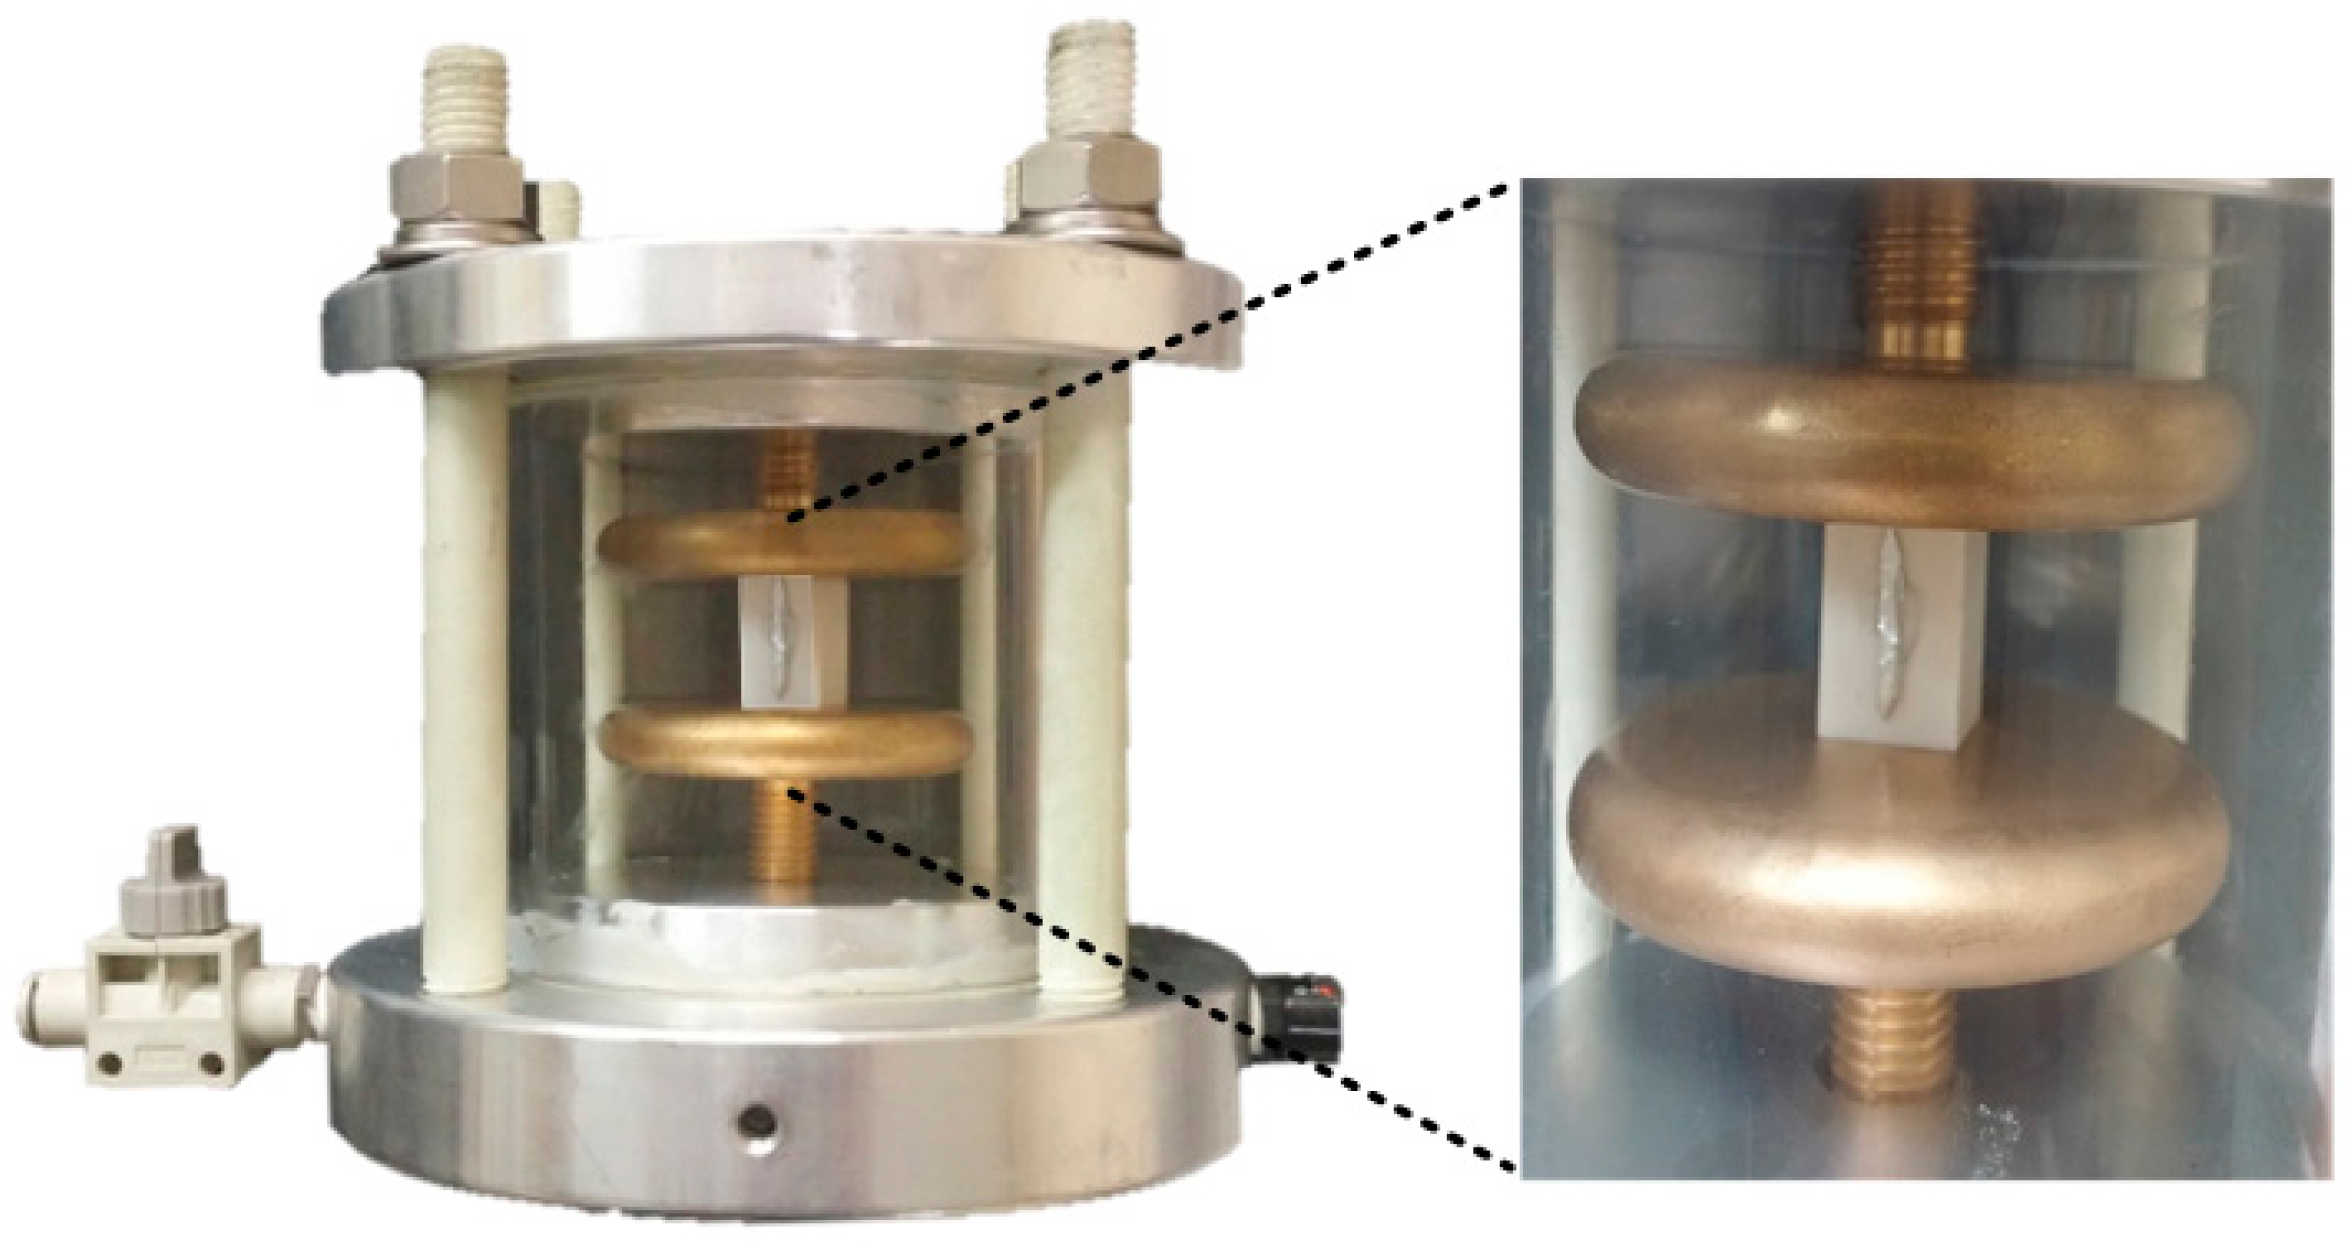
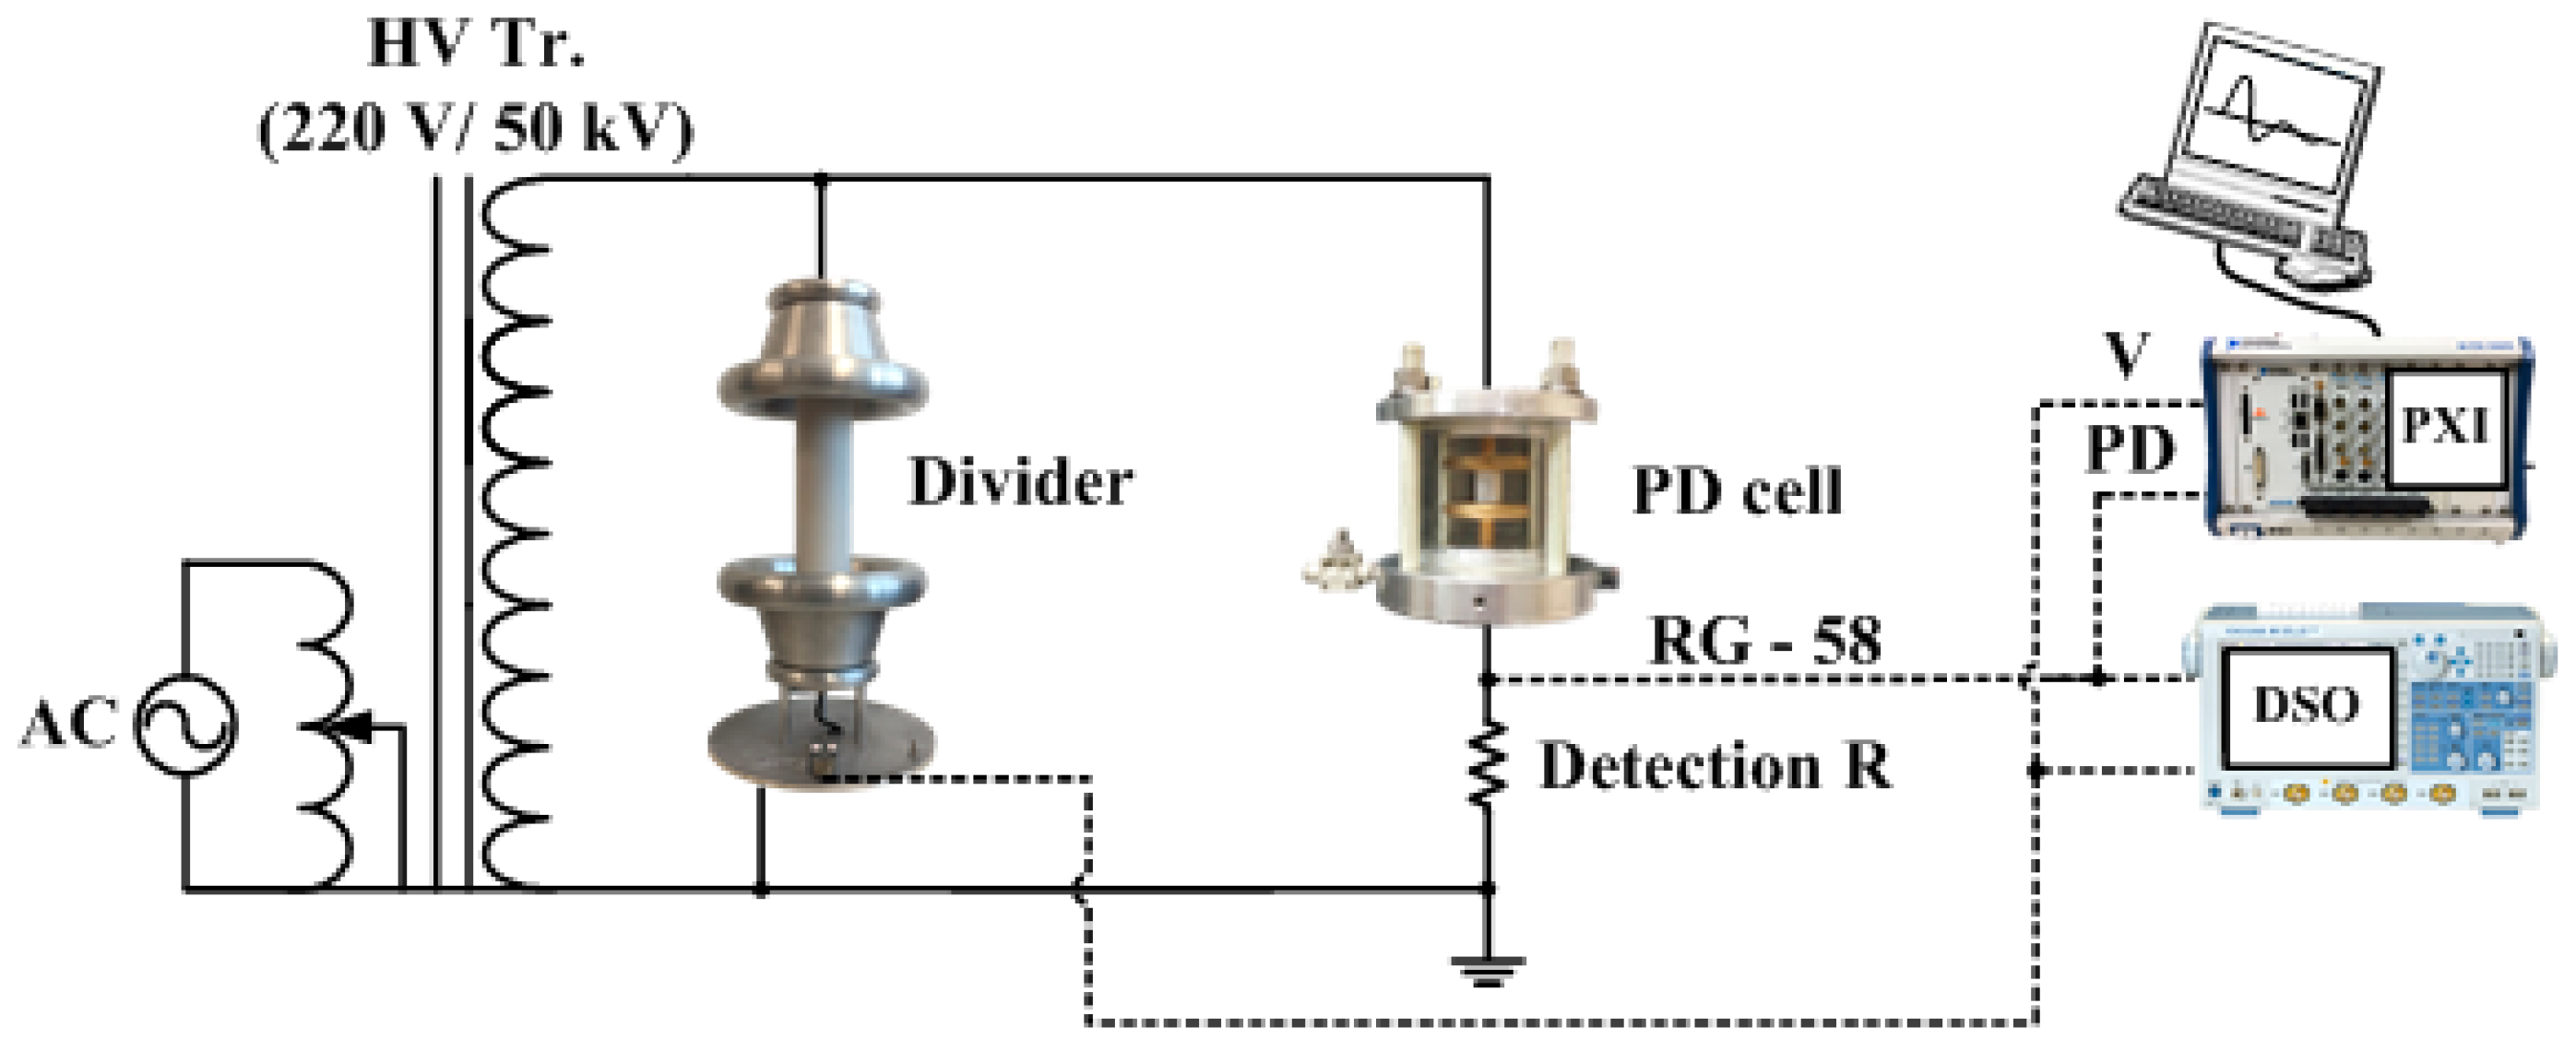
3. Experimental Setup

Figure 3 illustrates the experimental setup. A 220 V/50 kV PD-free dry-type transformer was used to apply high voltage to the PD cell. The transformer was immersed in insulation oil to ensure that there is no PD occurring adjacent to the transformer at high voltage. The applied voltage was tested using a high-voltage divider with a ratio of 10,000:1. The artificial PD cell was filled with SF6 gas with a pressure of 0.5 MPa. For accurate measurement, PD signals were detected by a 50 Ω non-inductive resistor. A digital storage oscilloscope (DSO) with a sampling rate of 5 GS/s and an NI PXI (National Instruments, Austin, TX, USA) with a sampling rate of 250 MS/s were used for signal acquisition and analysis. The input impedance of DSO and PXI were set as 50 Ω for impedance matching.

4. Wavelet Transform

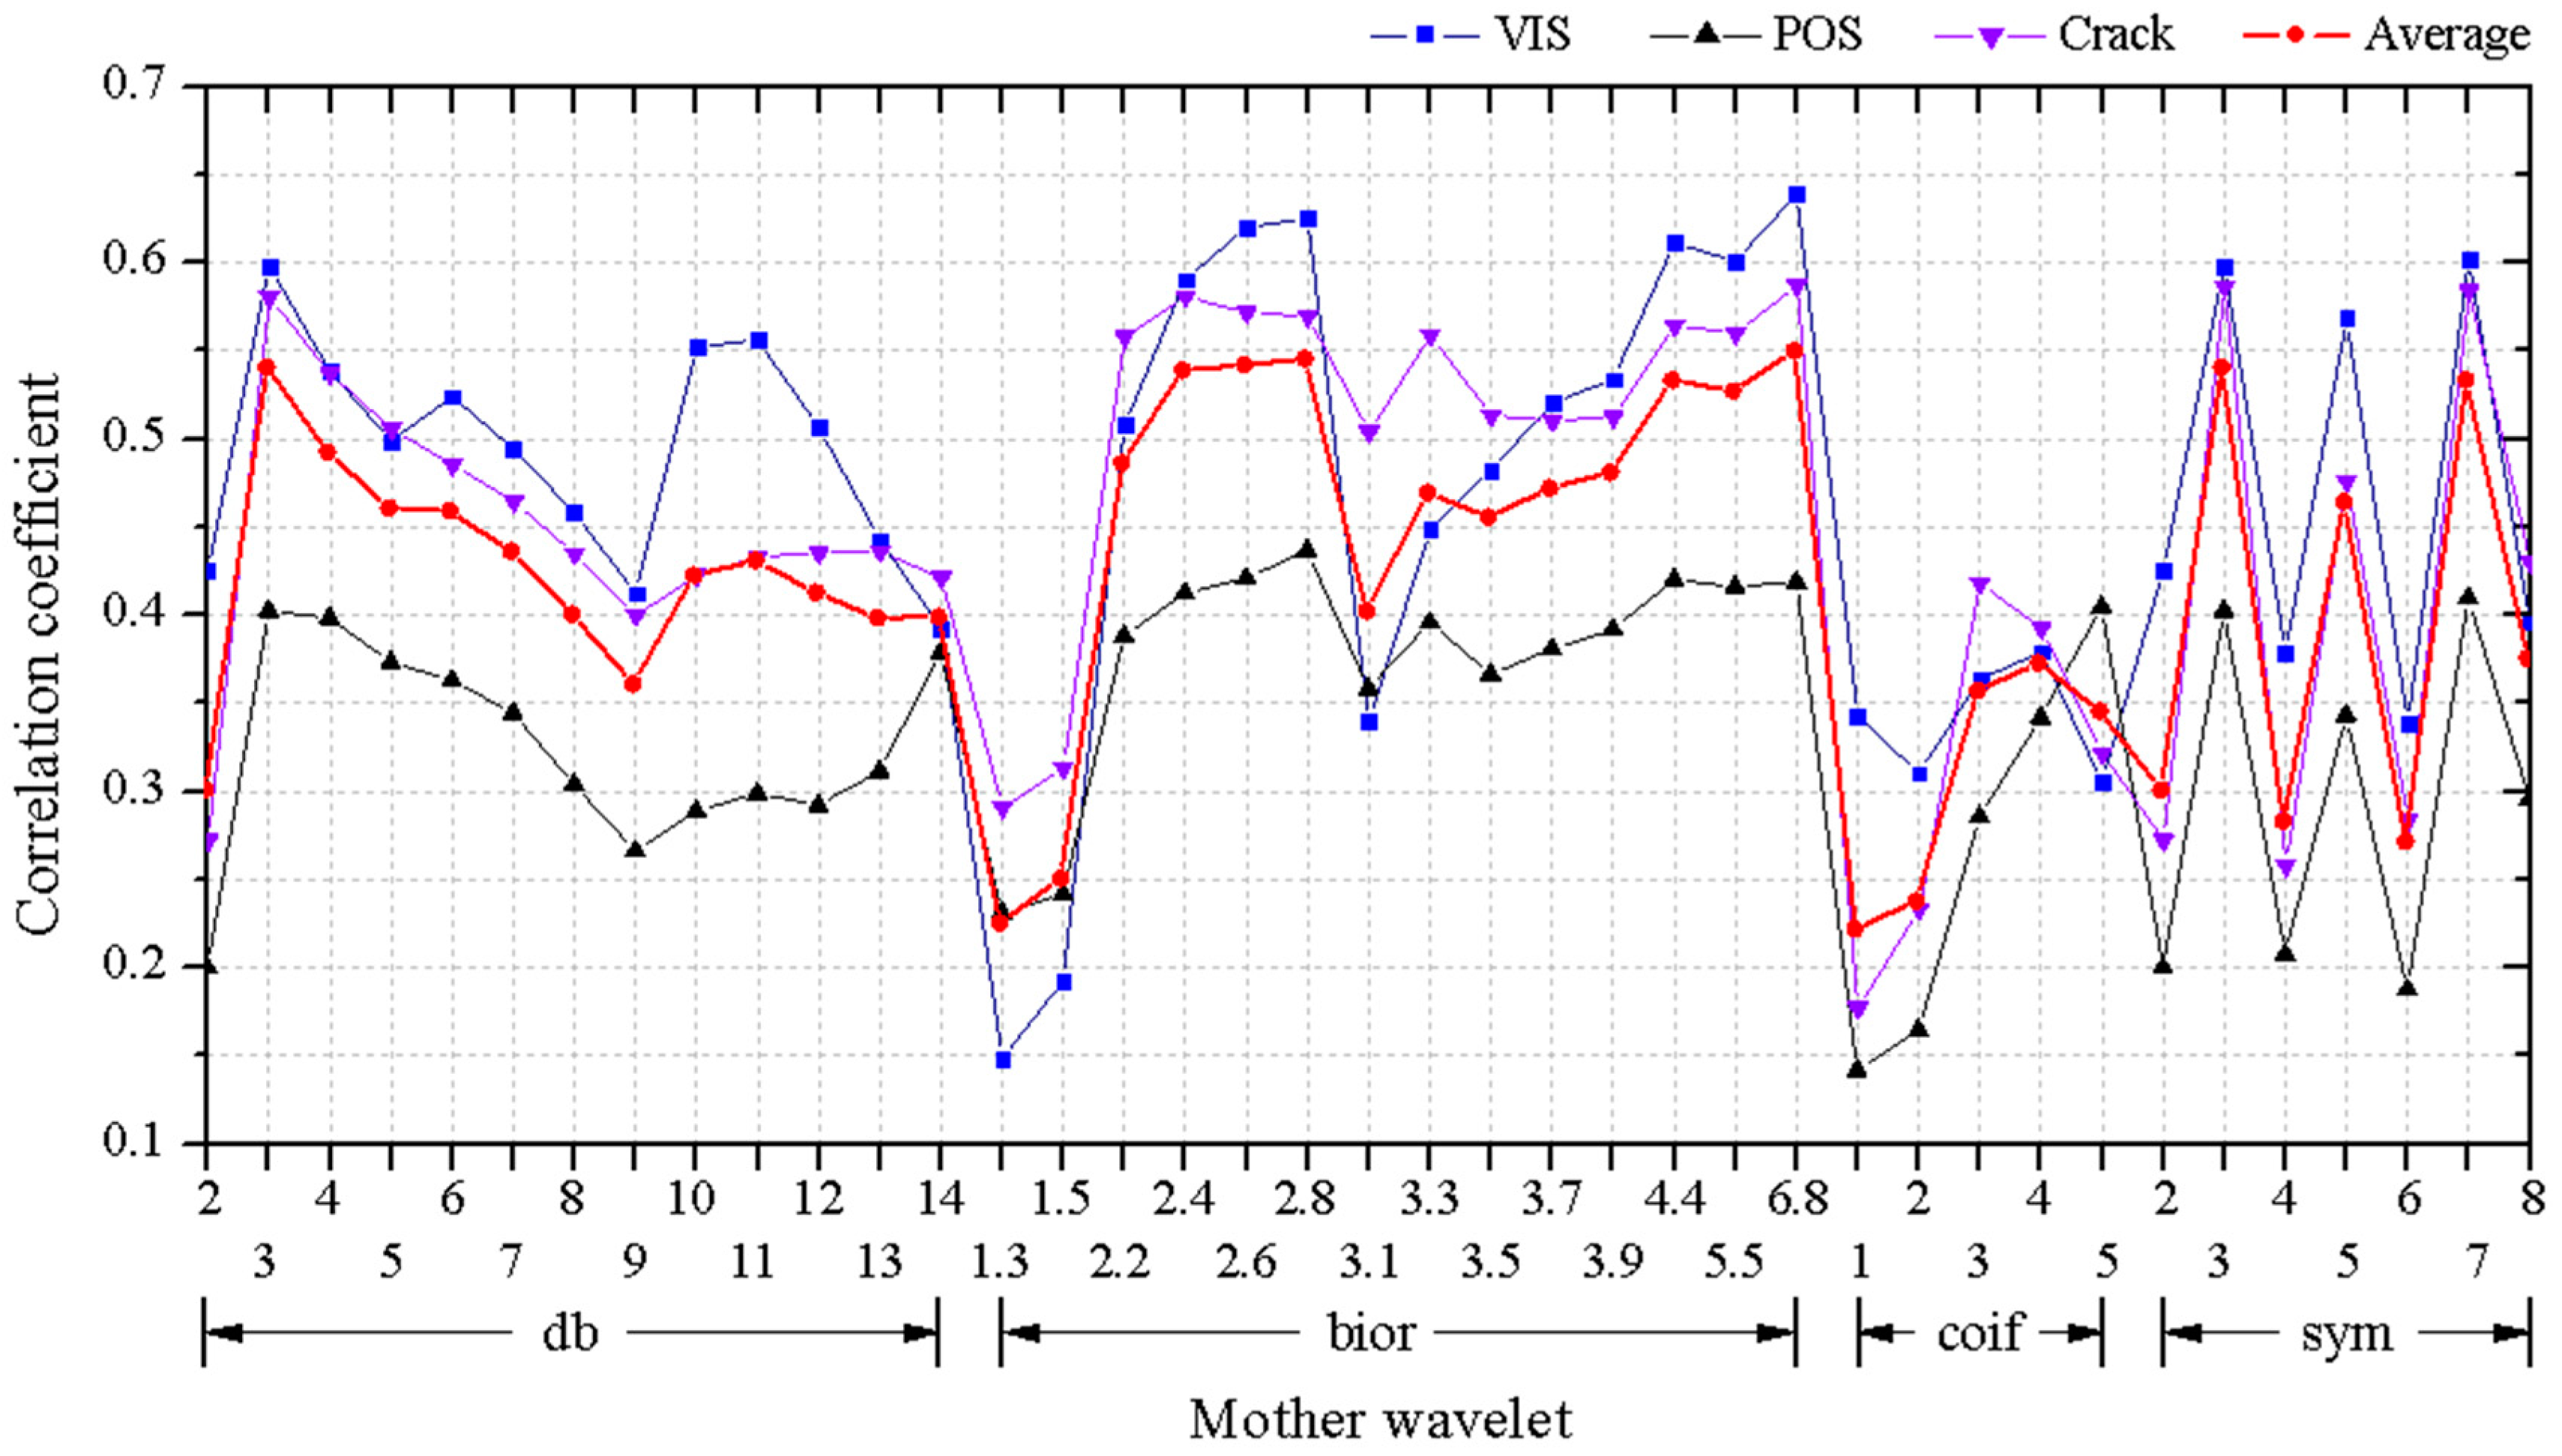
4.1. Selection of Mother Wavelet

The WT analyzes a signal in both time and frequency domains simultaneously using the scaled and shifted versions of the mother wavelet [23]. Therefore, a proper mother wavelet is of great importance to characterize a given signal. The mother wavelet can be categorized into the orthogonal wavelets (Daubechies (dbX), Coiflets (coifX), Symmlets (symX)) that are suitable for signal de-noising and compression, and the bi-orthogonal wavelets (biorX) that are fit for signal de-noising and feature extraction, where X is the order of the wavelet. The higher the order, the smoother the wavelet [12,24,25]. Two kinds of mother wavelets were considered in this section.
Since the PRPD pattern is the accumulation of single pulses within a certain period of time, the single PD pulses rather than the PD signal detected in a cycle of the applied voltage used to determine the optimal mother wavelet. Single PD pulses were extracted from three types of artificial PD cells. Figure 4 shows the typical detected pulses. The apparent charge values of PD pulses in the VIS, POS, and crack were 17.5 pC, 13.9 pC, and 20.4 pC, respectively [26].
Such pulses were compared with the mother wavelets by calculating their correlation coefficient that is given by
γ = i = 1 N 1 [ X ( i ) X ¯ ] [ Y ( i ) Y ¯ ] i = 1 N 1 [ X ( i ) X ¯ ] 2 · i = 1 N 1 [ Y ( i ) Y ¯ ] 2
where X(i) and Y(i) are the single PD pulse and the mother wavelet, respectively, and X ¯ and Y ¯ are their mean values. A larger value of correlation coefficient indicates a higher similarity between these two signals. The calculation results of correlation coefficient are shown in Figure 5.
The results show that bior6.8 has the highest similarity with PD pulses occurring in the VIS and crack. In the POS, the mother wavelet that has the highest γ value of 0.421 with discharge pulses was bior2.8, and γ value of bior6.8 with pulses was 0.419. According to the average correlation coefficient value, bior6.8 was selected as the optimal mother wavelet for further investigation.

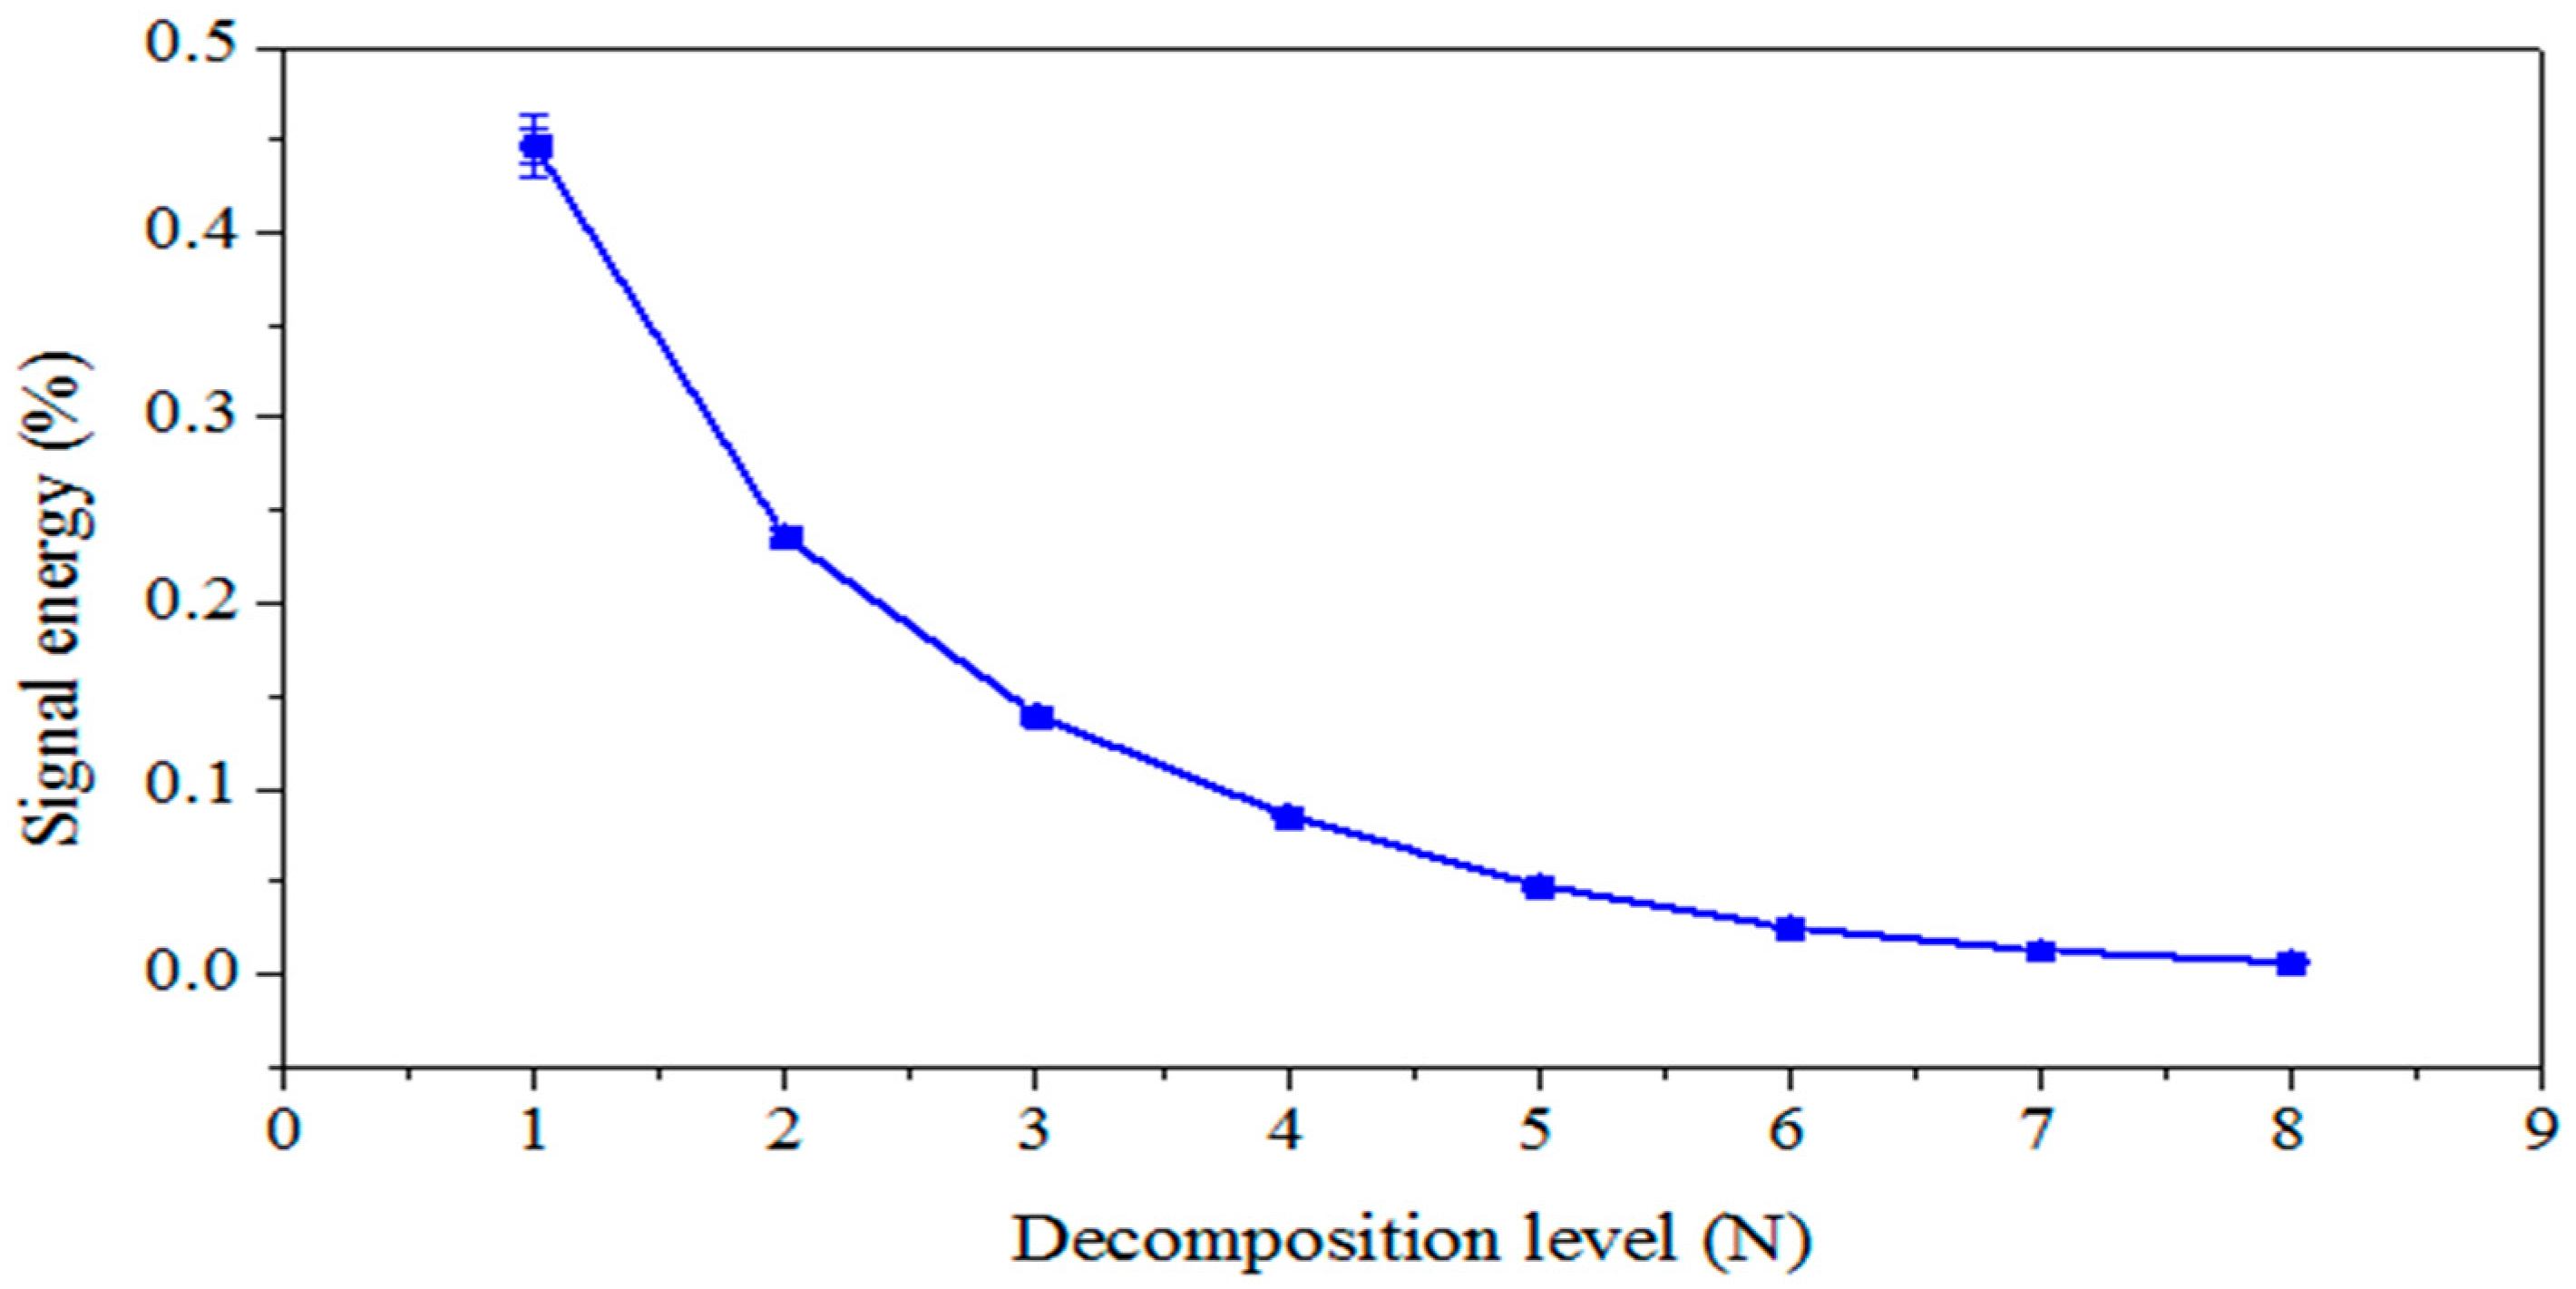
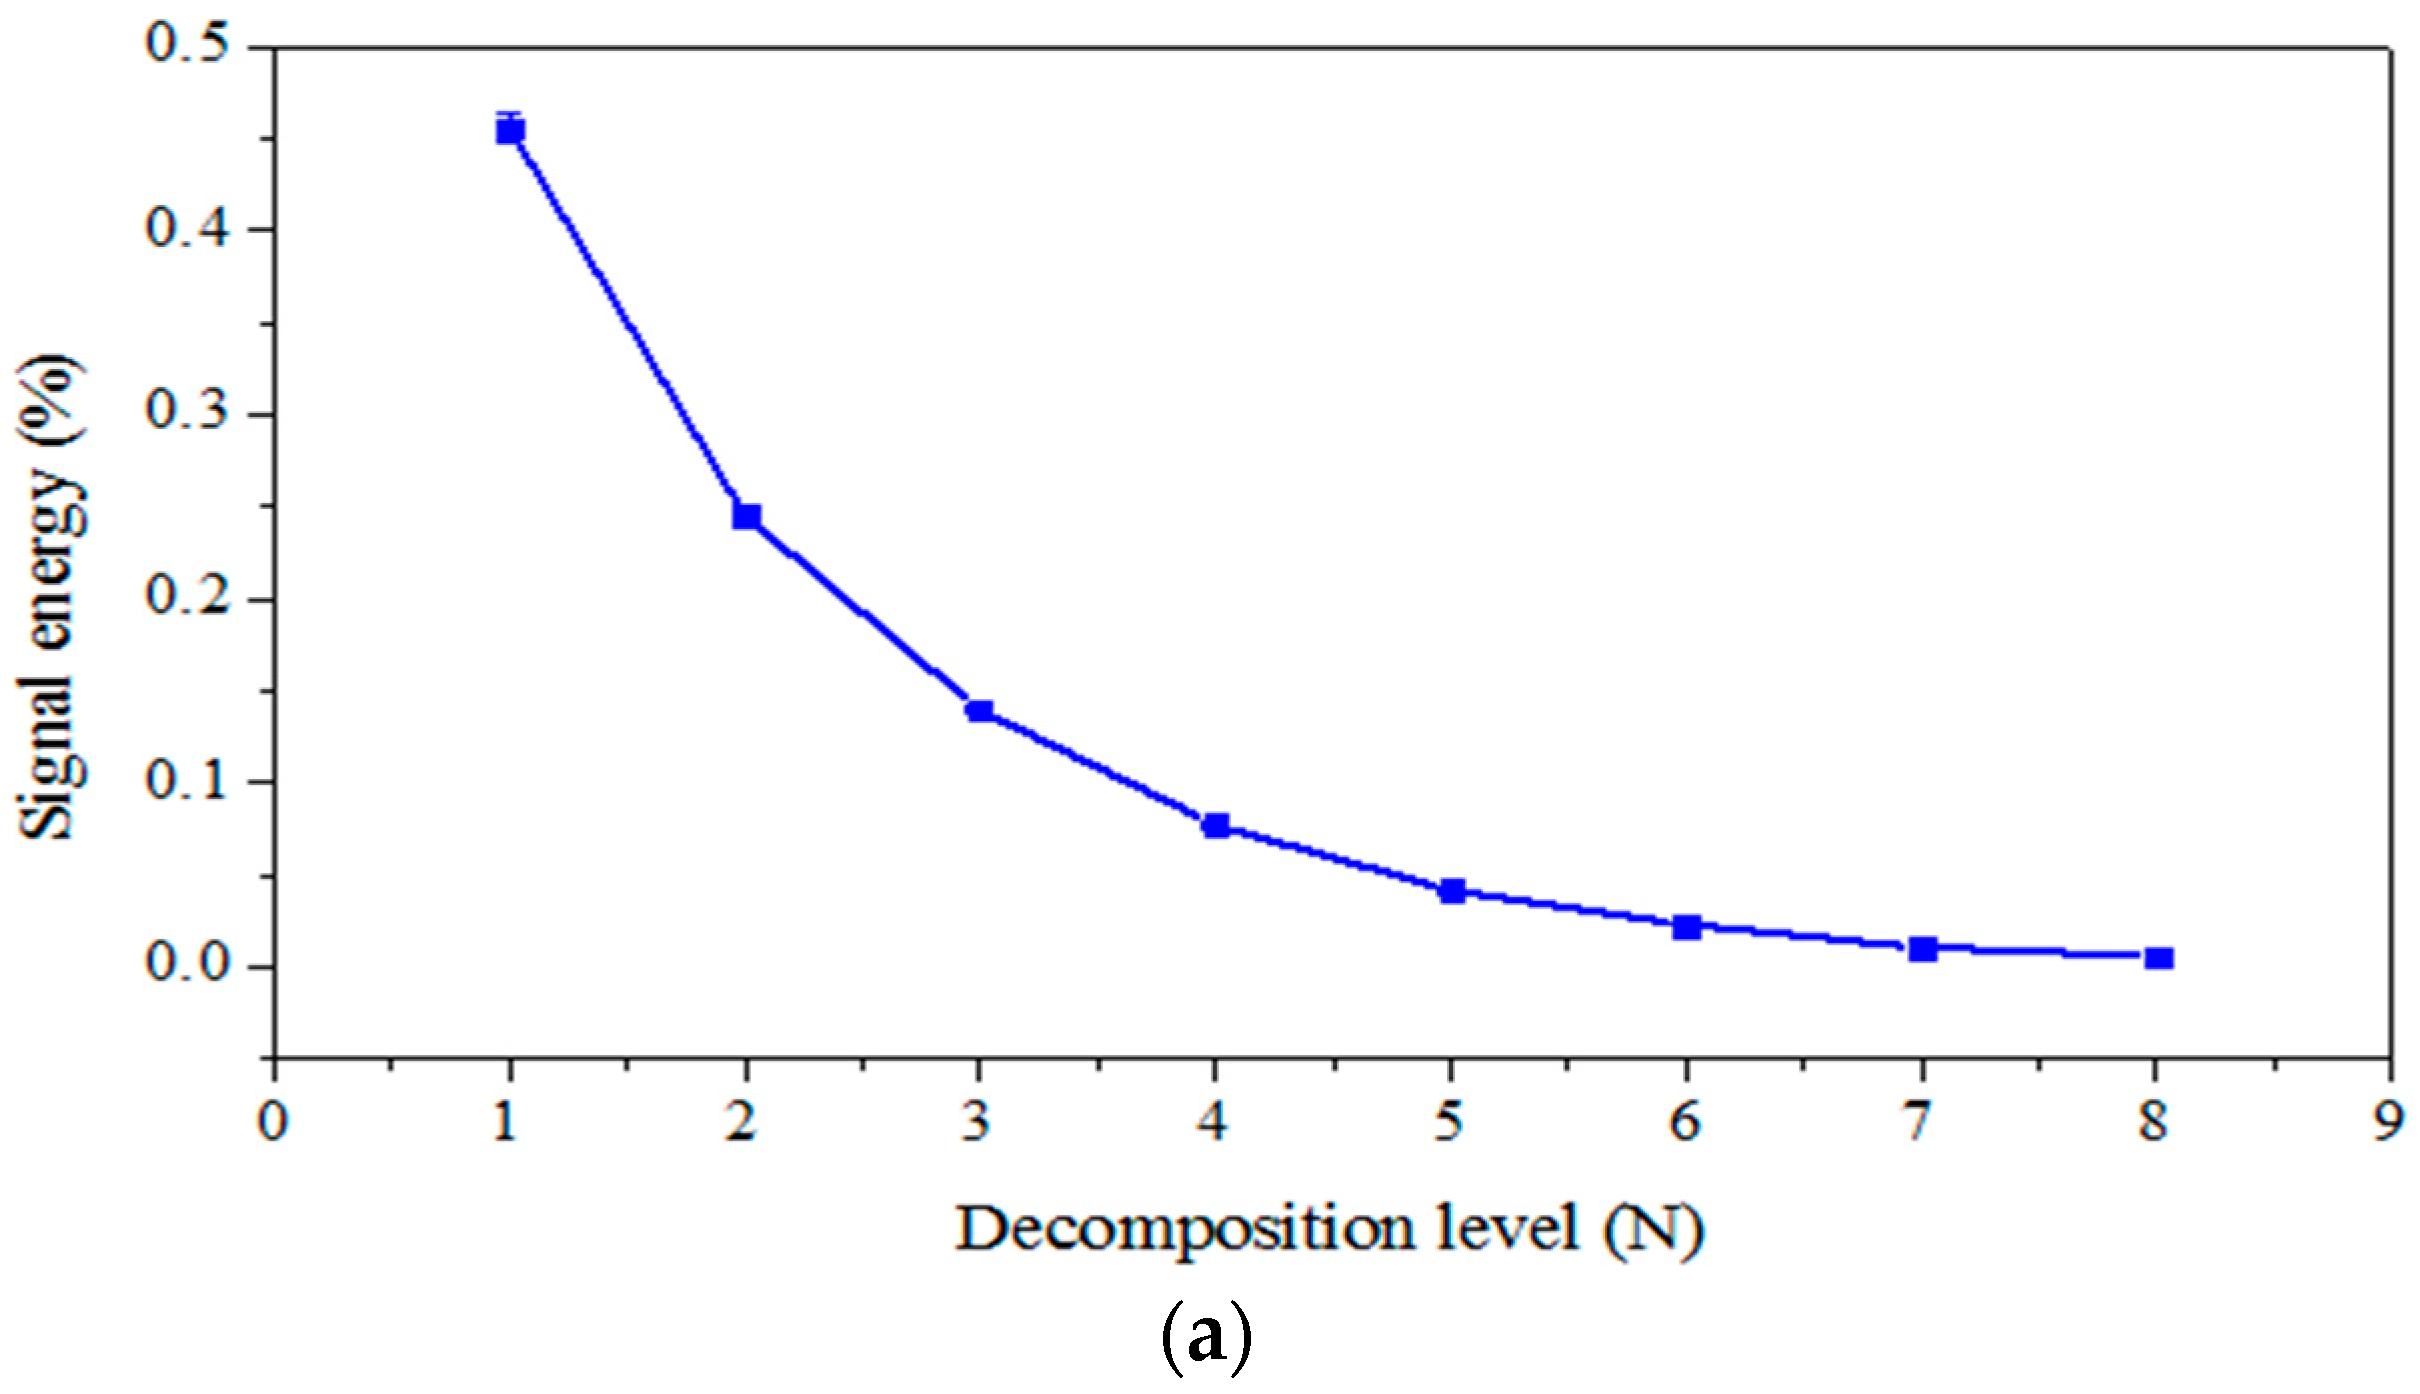
4.2. The Determination of Decomposition Level

A desirable decomposition level should avoid being redundant and have sufficient resolution to decompose a signal. According to Equation (2), the maximum number of decomposition level Jmax depends on the record length (LR) of signals, which is given by
J m a x = f i x ( l o g 2 L R )
where fix specifies the level to be the largest integer no greater than log2LR [24]. In this paper, the record length of the PRPD signal was 125 k bit, thus the maximum decomposition level was 16. This value was too high to cause a large amount of computation and a waste of time. The decomposition level can be also determined by
J m a x = f i x ( l o g 2 L R L W 1 )
where LW is the length of the octave band filter associated with the corresponding mother wavelet [13,27]. The length of the selected wavelet bior6.8 is 17, so the maximum decomposition level was 12. In this paper, the decomposition level was selected as 8, which could characterize the PRPD signal with a sufficient resolution.

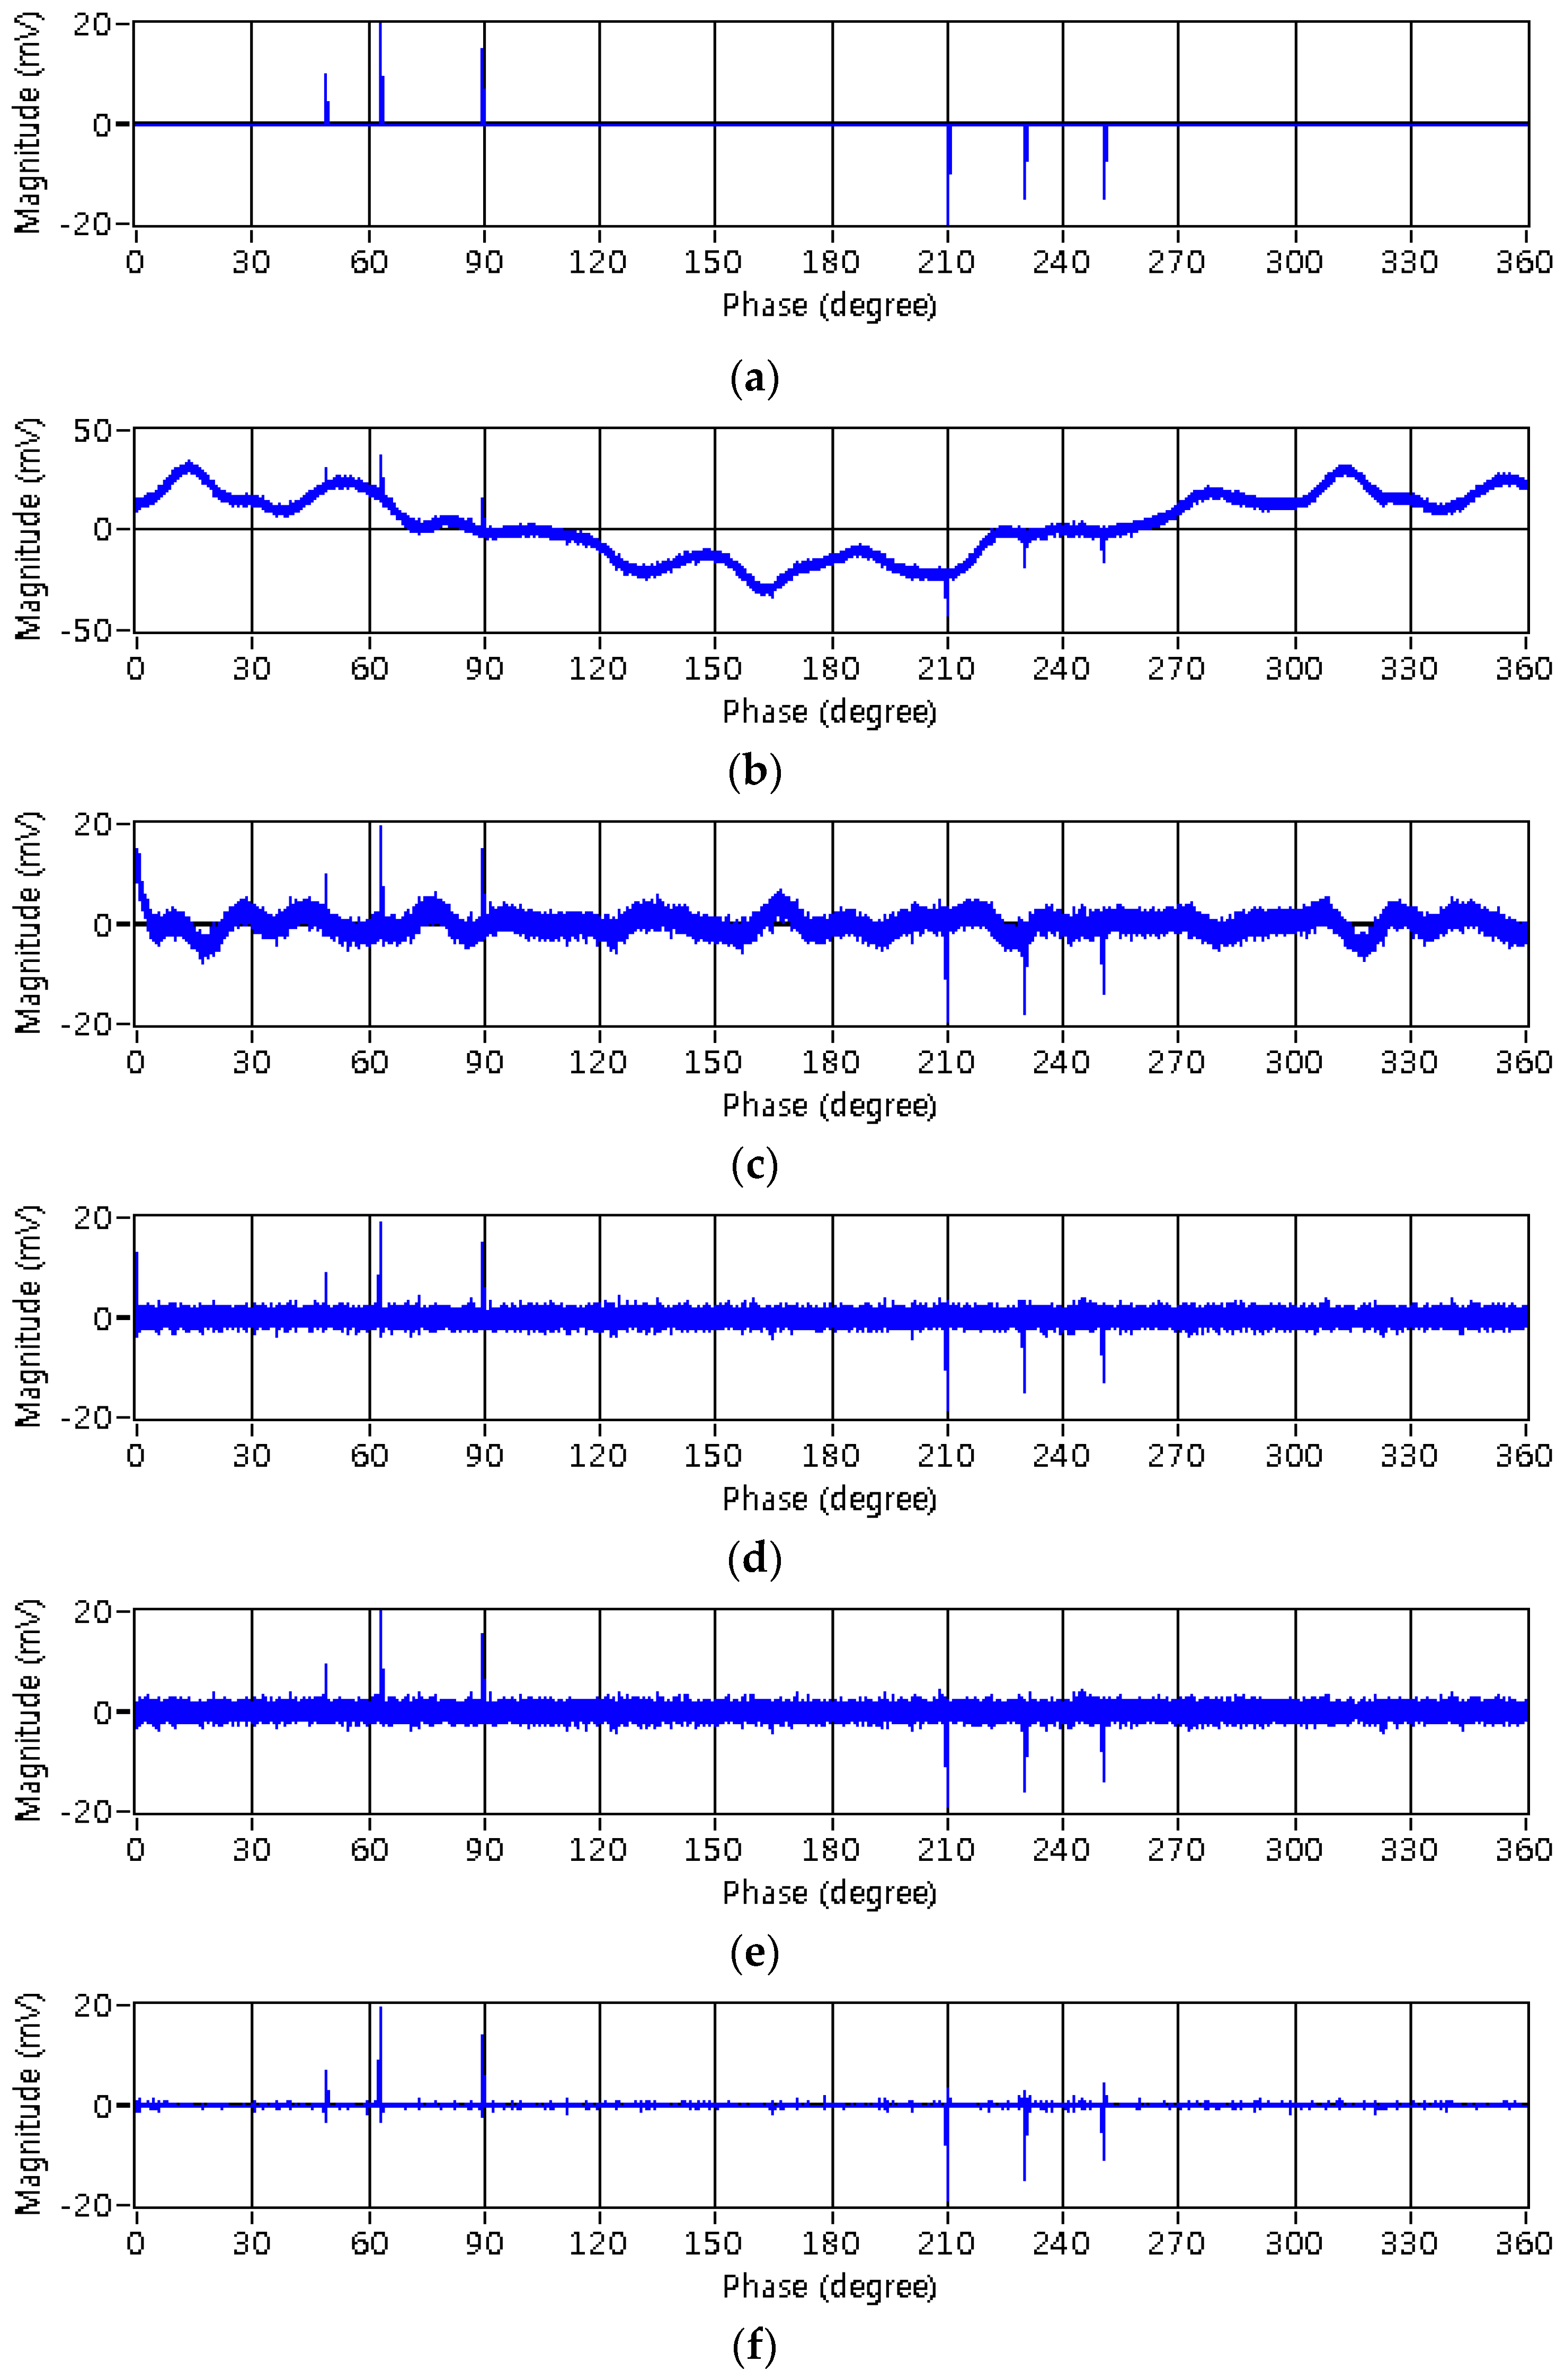
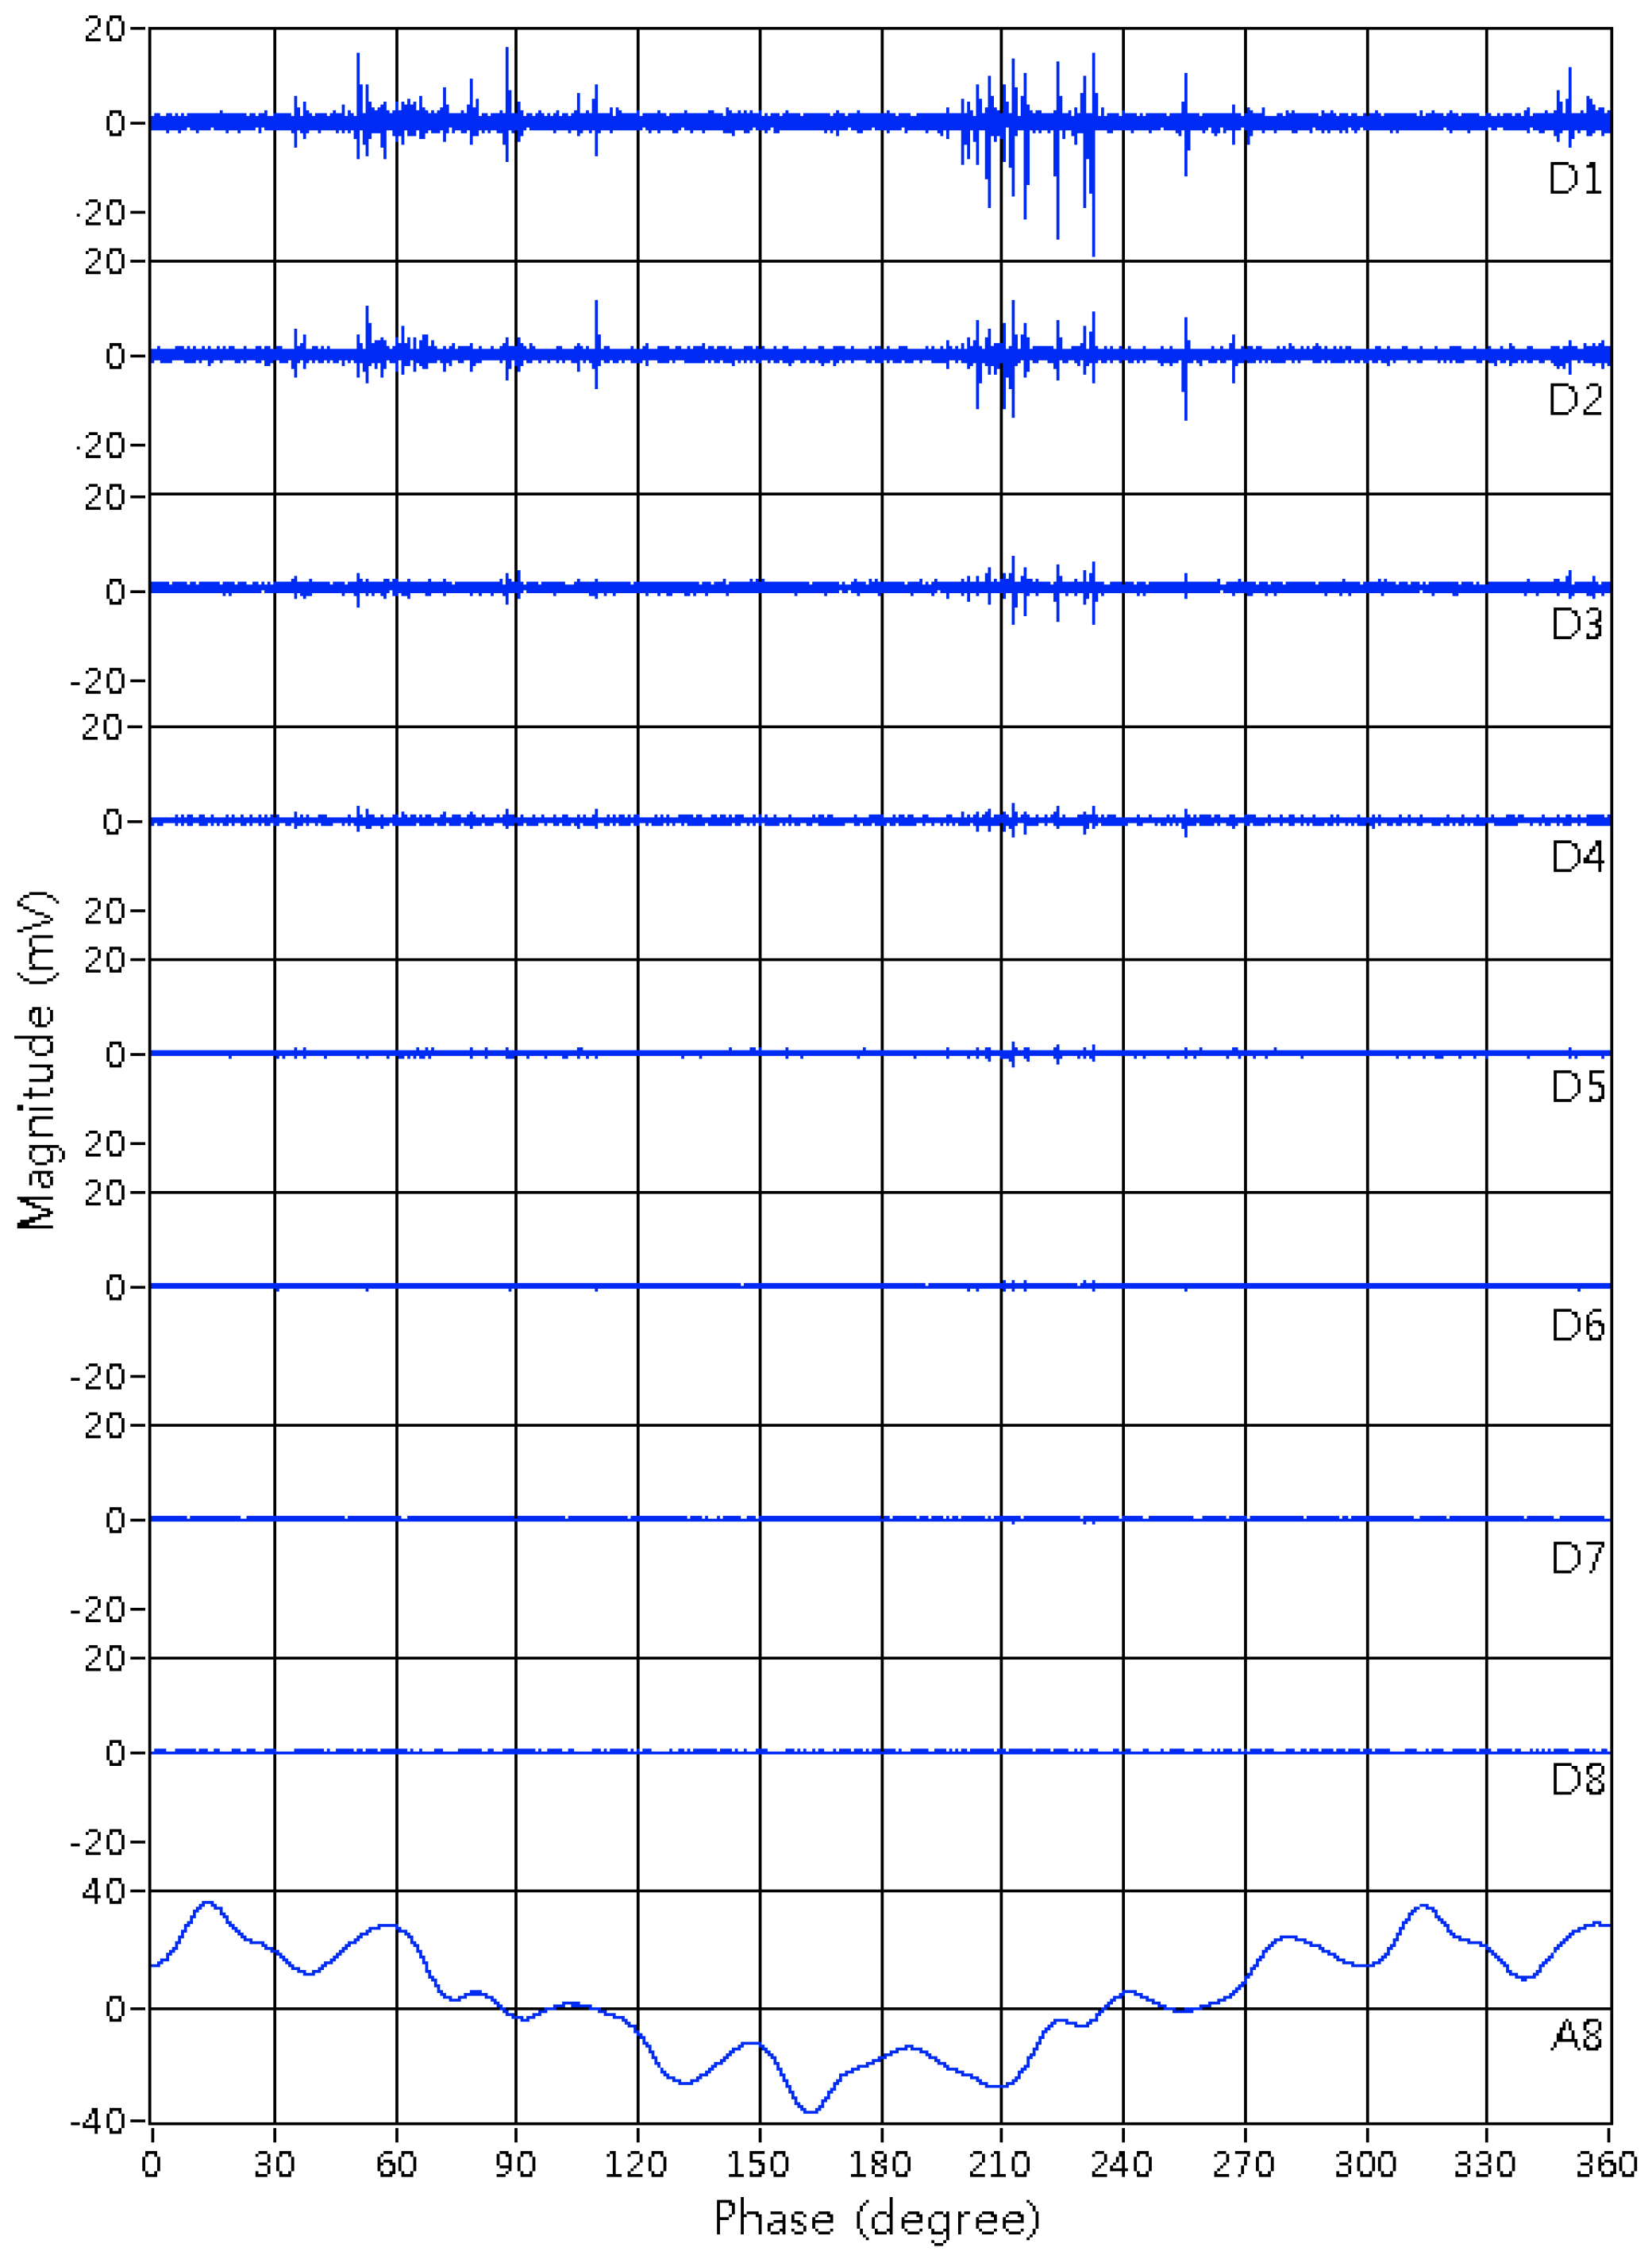
4.3. Decomposition of PRPD and Signal Energy

After selecting the optimal mother wavelet and determining the decomposition level, the PRPD signals were decomposed by discrete wavelet transform (DWT), using filter banks to calculate the wavelet coefficients. The signal was first down-sampled by an HPF and a low pass filter (LPF), generating the detail (D) and approximation (A) coefficient, respectively. The approximation component was then fed through another filter pair and down-sampled to the maximum decomposition level. This process is also known as multi-resolution analysis (MRA) [2,12,28,29,30]. Therefore, the result of MRA is the detail component at each level and an approximation component at the highest level.
Figure 6 demonstrates the decomposition of the PRPD signal in the VIS into 8 levels, generating the detail components D1–D8 at Levels 1–8 and the approximation component A8 at the 8th level. It can be seen that the detail components D1–D5, which are in the high frequency range, are associated with the PD signal, whereas the components D6–D8 that are in the low frequency range do not contain any PD information since they are related to the background noise. In addition, the approximate component A8 is regarded as a capacitive component.
The signal energy of the detail component at each level was calculated by
Signal   energy = i = 1 N x i 2
where xi is the signal at each level and N is the signal length. The result is shown in Figure 7. In the detail components, 95.6% of signal energy was distributed in D1–D5, which were expected to be used for signal reconstruction. However, as indicated in Figure 6, there is still background noise interfering with the decomposed components. Therefore, a threshold and a thresholding function were implemented for de-noising the signals in D1–D5.

4.4. Threshold and Thresholding Function

The automatic scale-dependent threshold was used, which is given by
λ = m j 0.6745 2 l o g ( N )
where mj are the median values of detail components at each level [13,25].
The intermediate thresholding function is defined as
η ( x ) = { s i g n ( x ) ( | x | λ exp [ | x | λ δ ] )   | x | λ 0   | x | < λ
where δ is a positive integer [31]. The intermediate thresholding function is between the hard and the soft function and provides good continuity at ±λ. Figure 8 shows the result of de-noising D1.

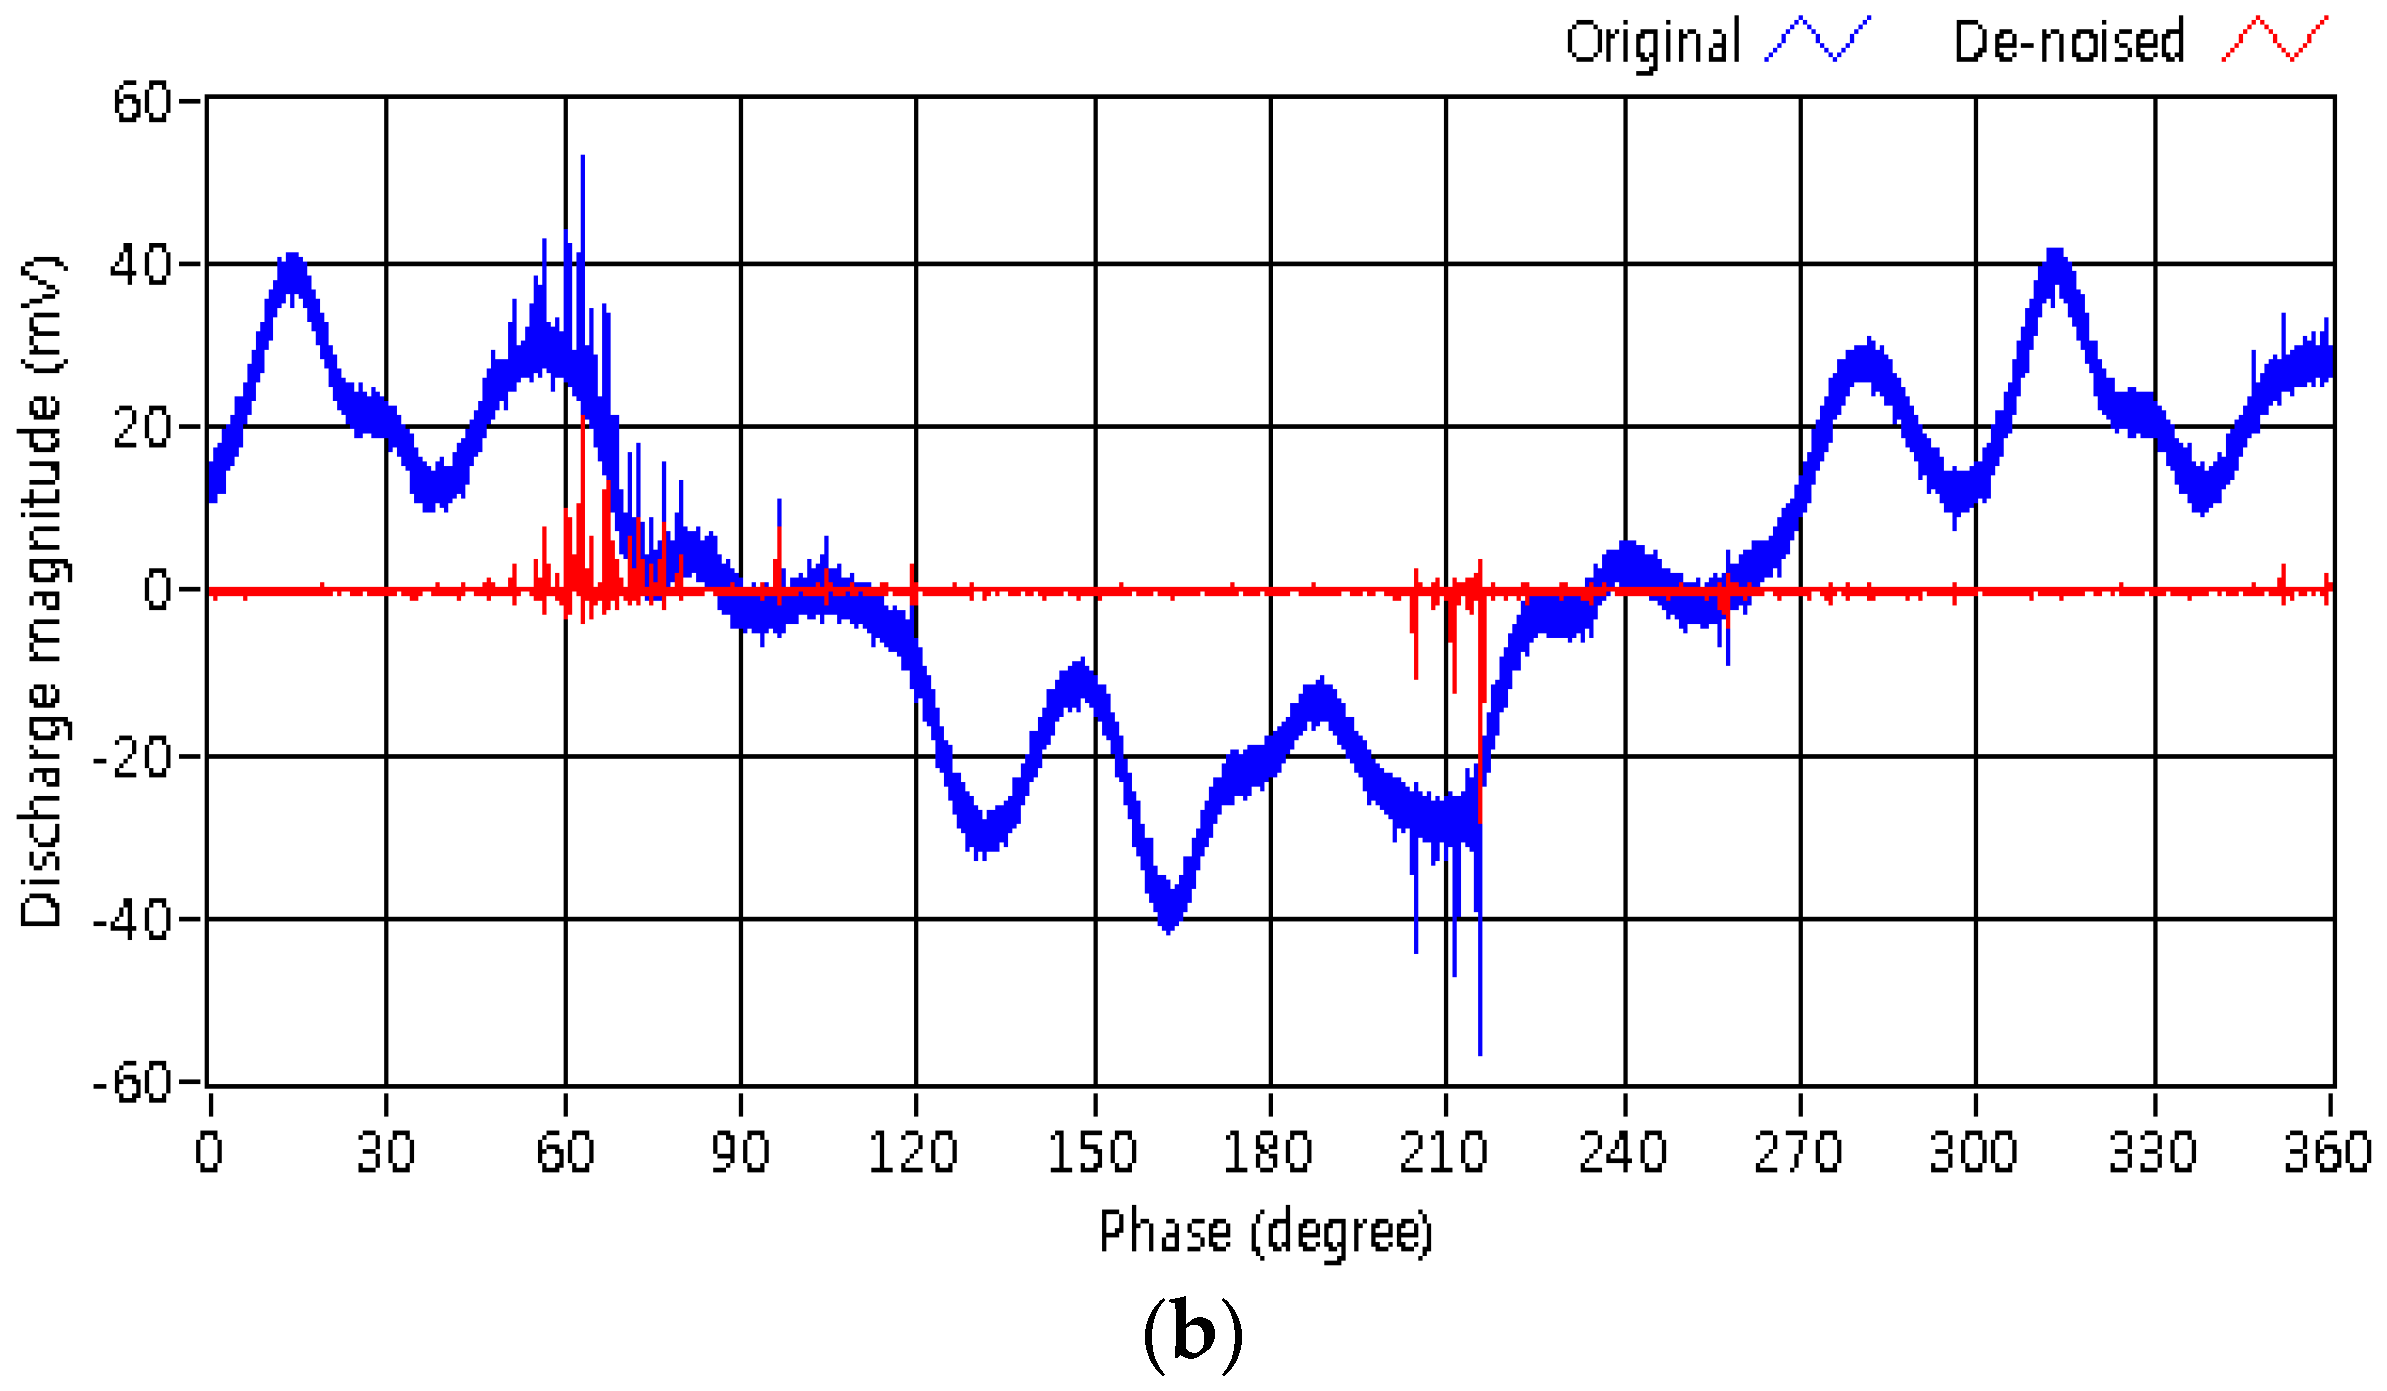
4.5. Signal Reconstruction

The decomposed signals were reconstructed using inverse DWT. Based on the above analysis, the de-noised detail components D1–D5 were used for signal reconstruction. The result is illustrated in Figure 9, which led a reduction in noise level of 16.83 dB compared with the original detected signal and of −11.43 dB relative to the noised D1–D5.

5. Results and Discussions
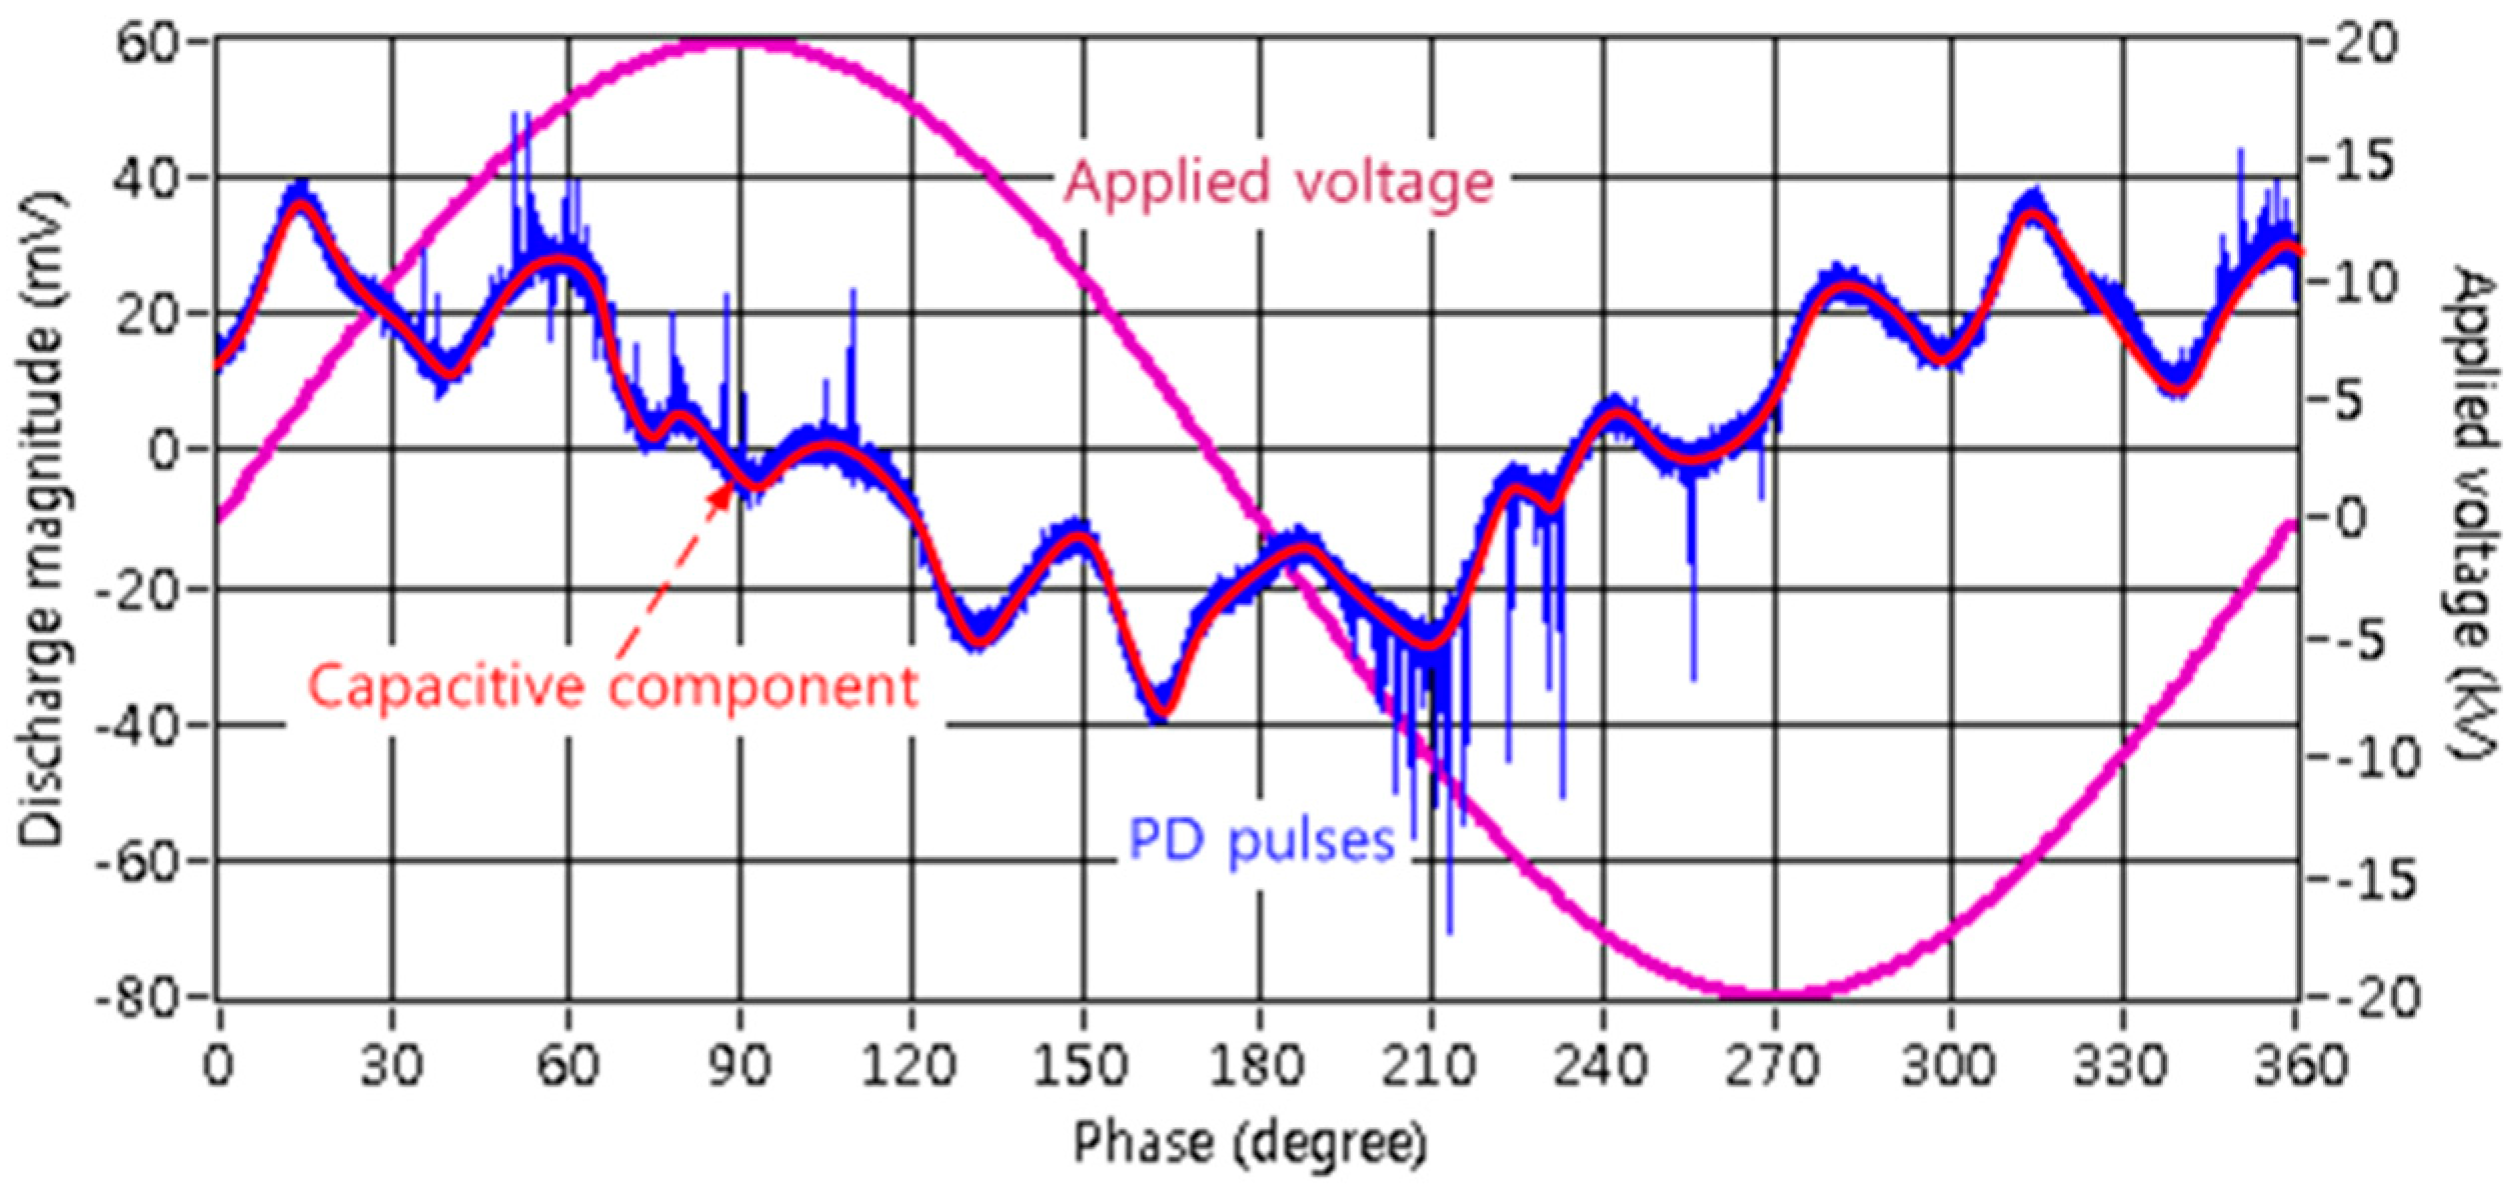
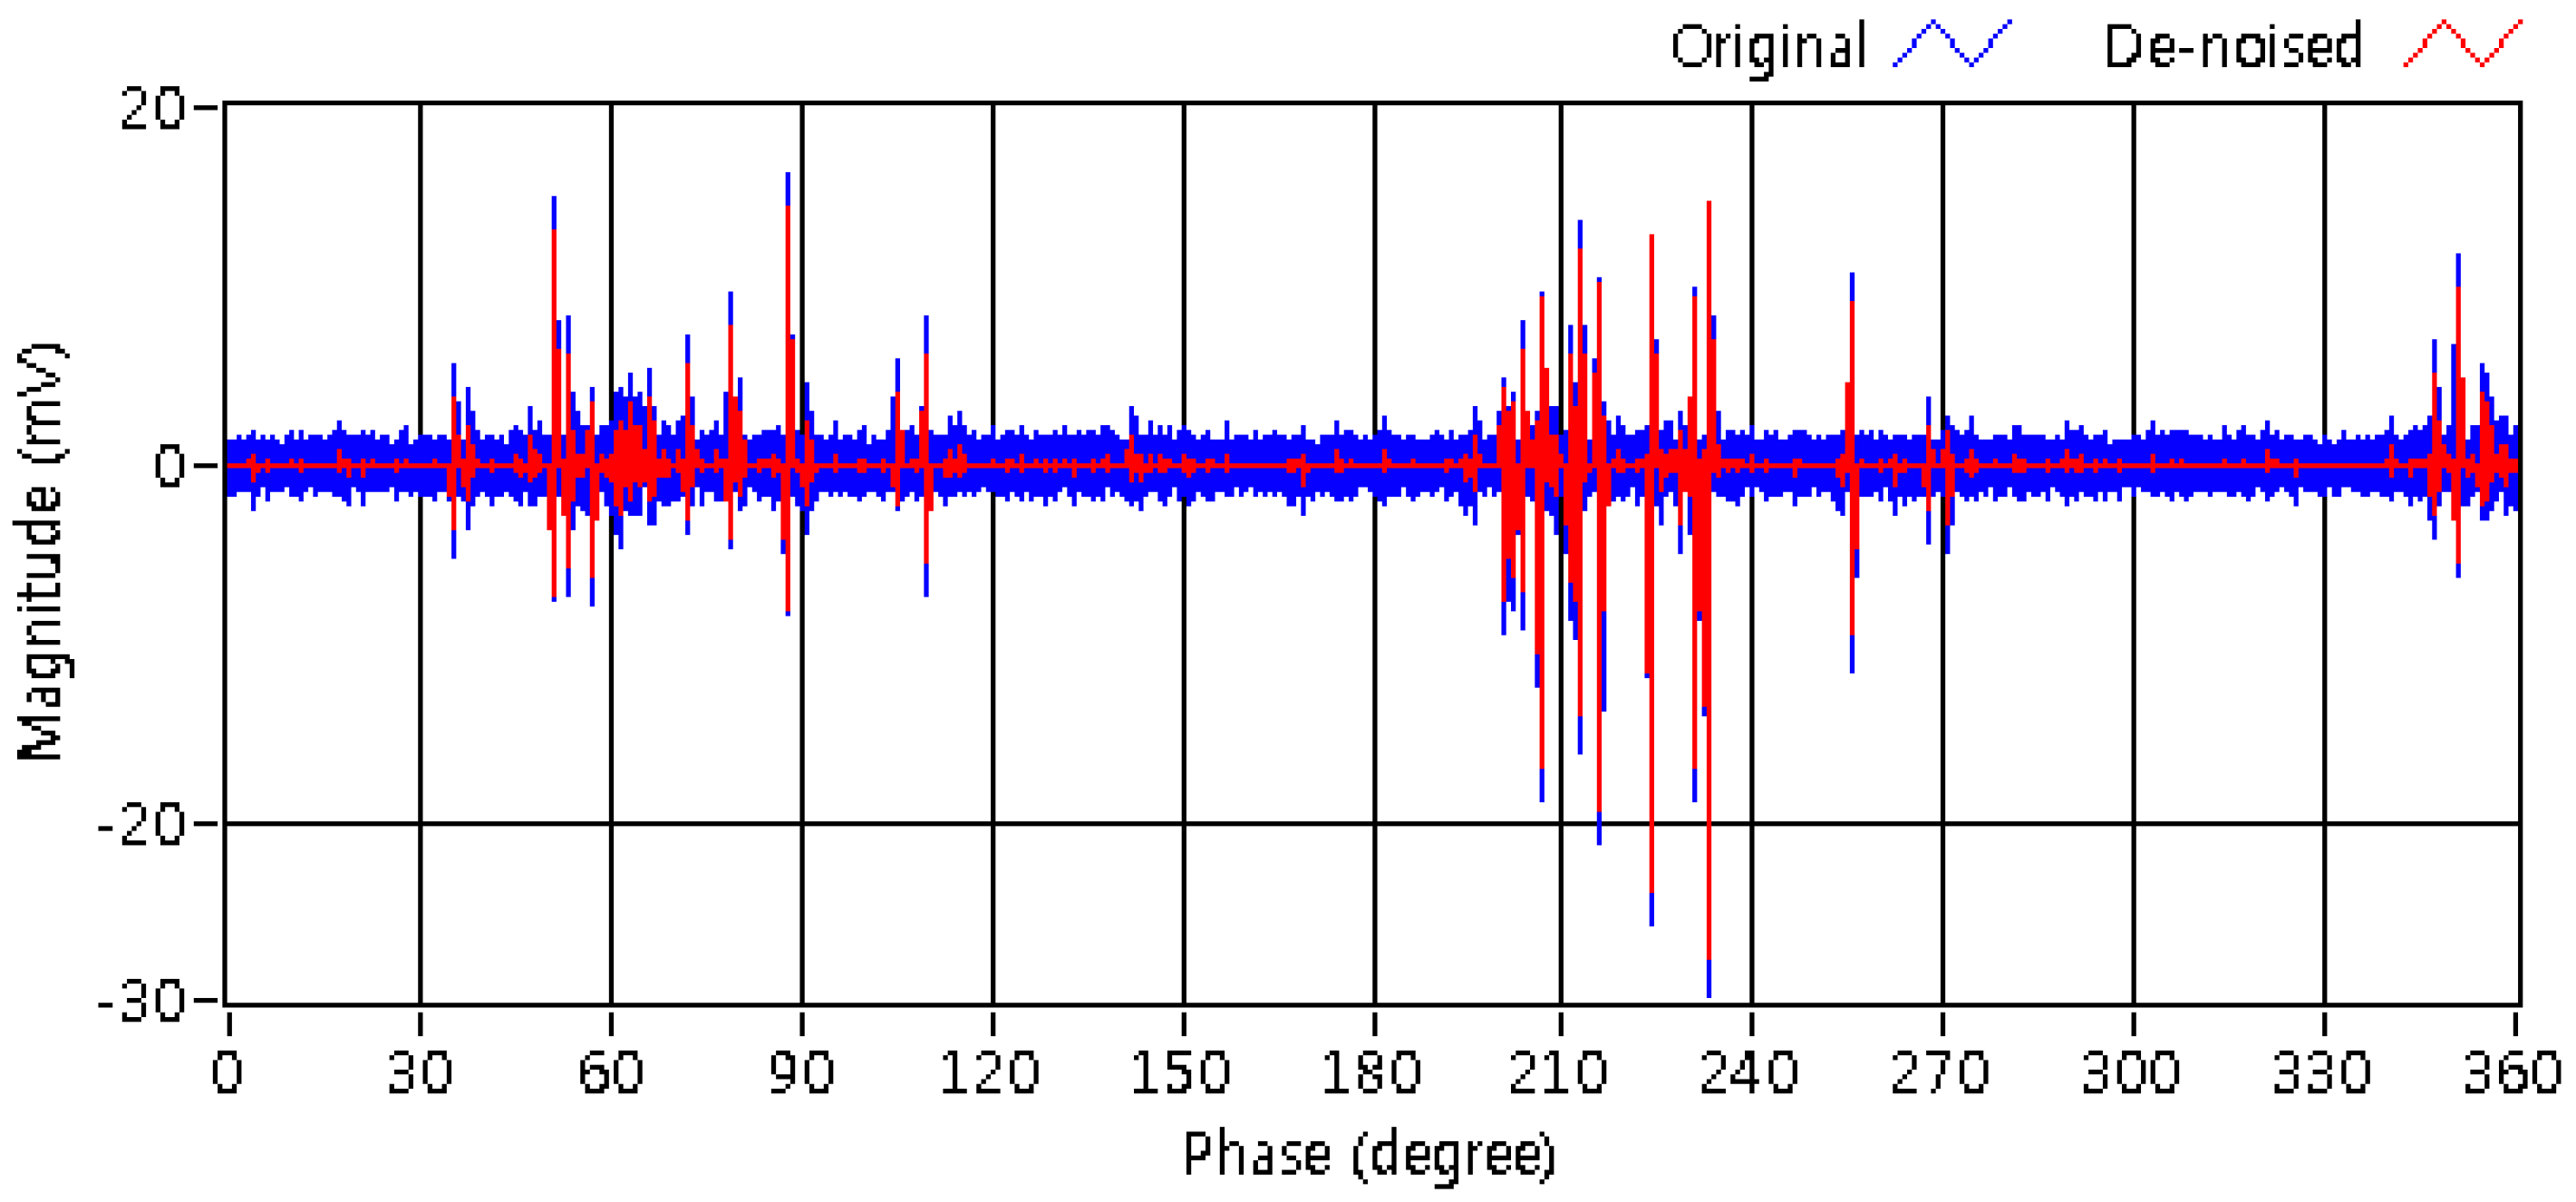
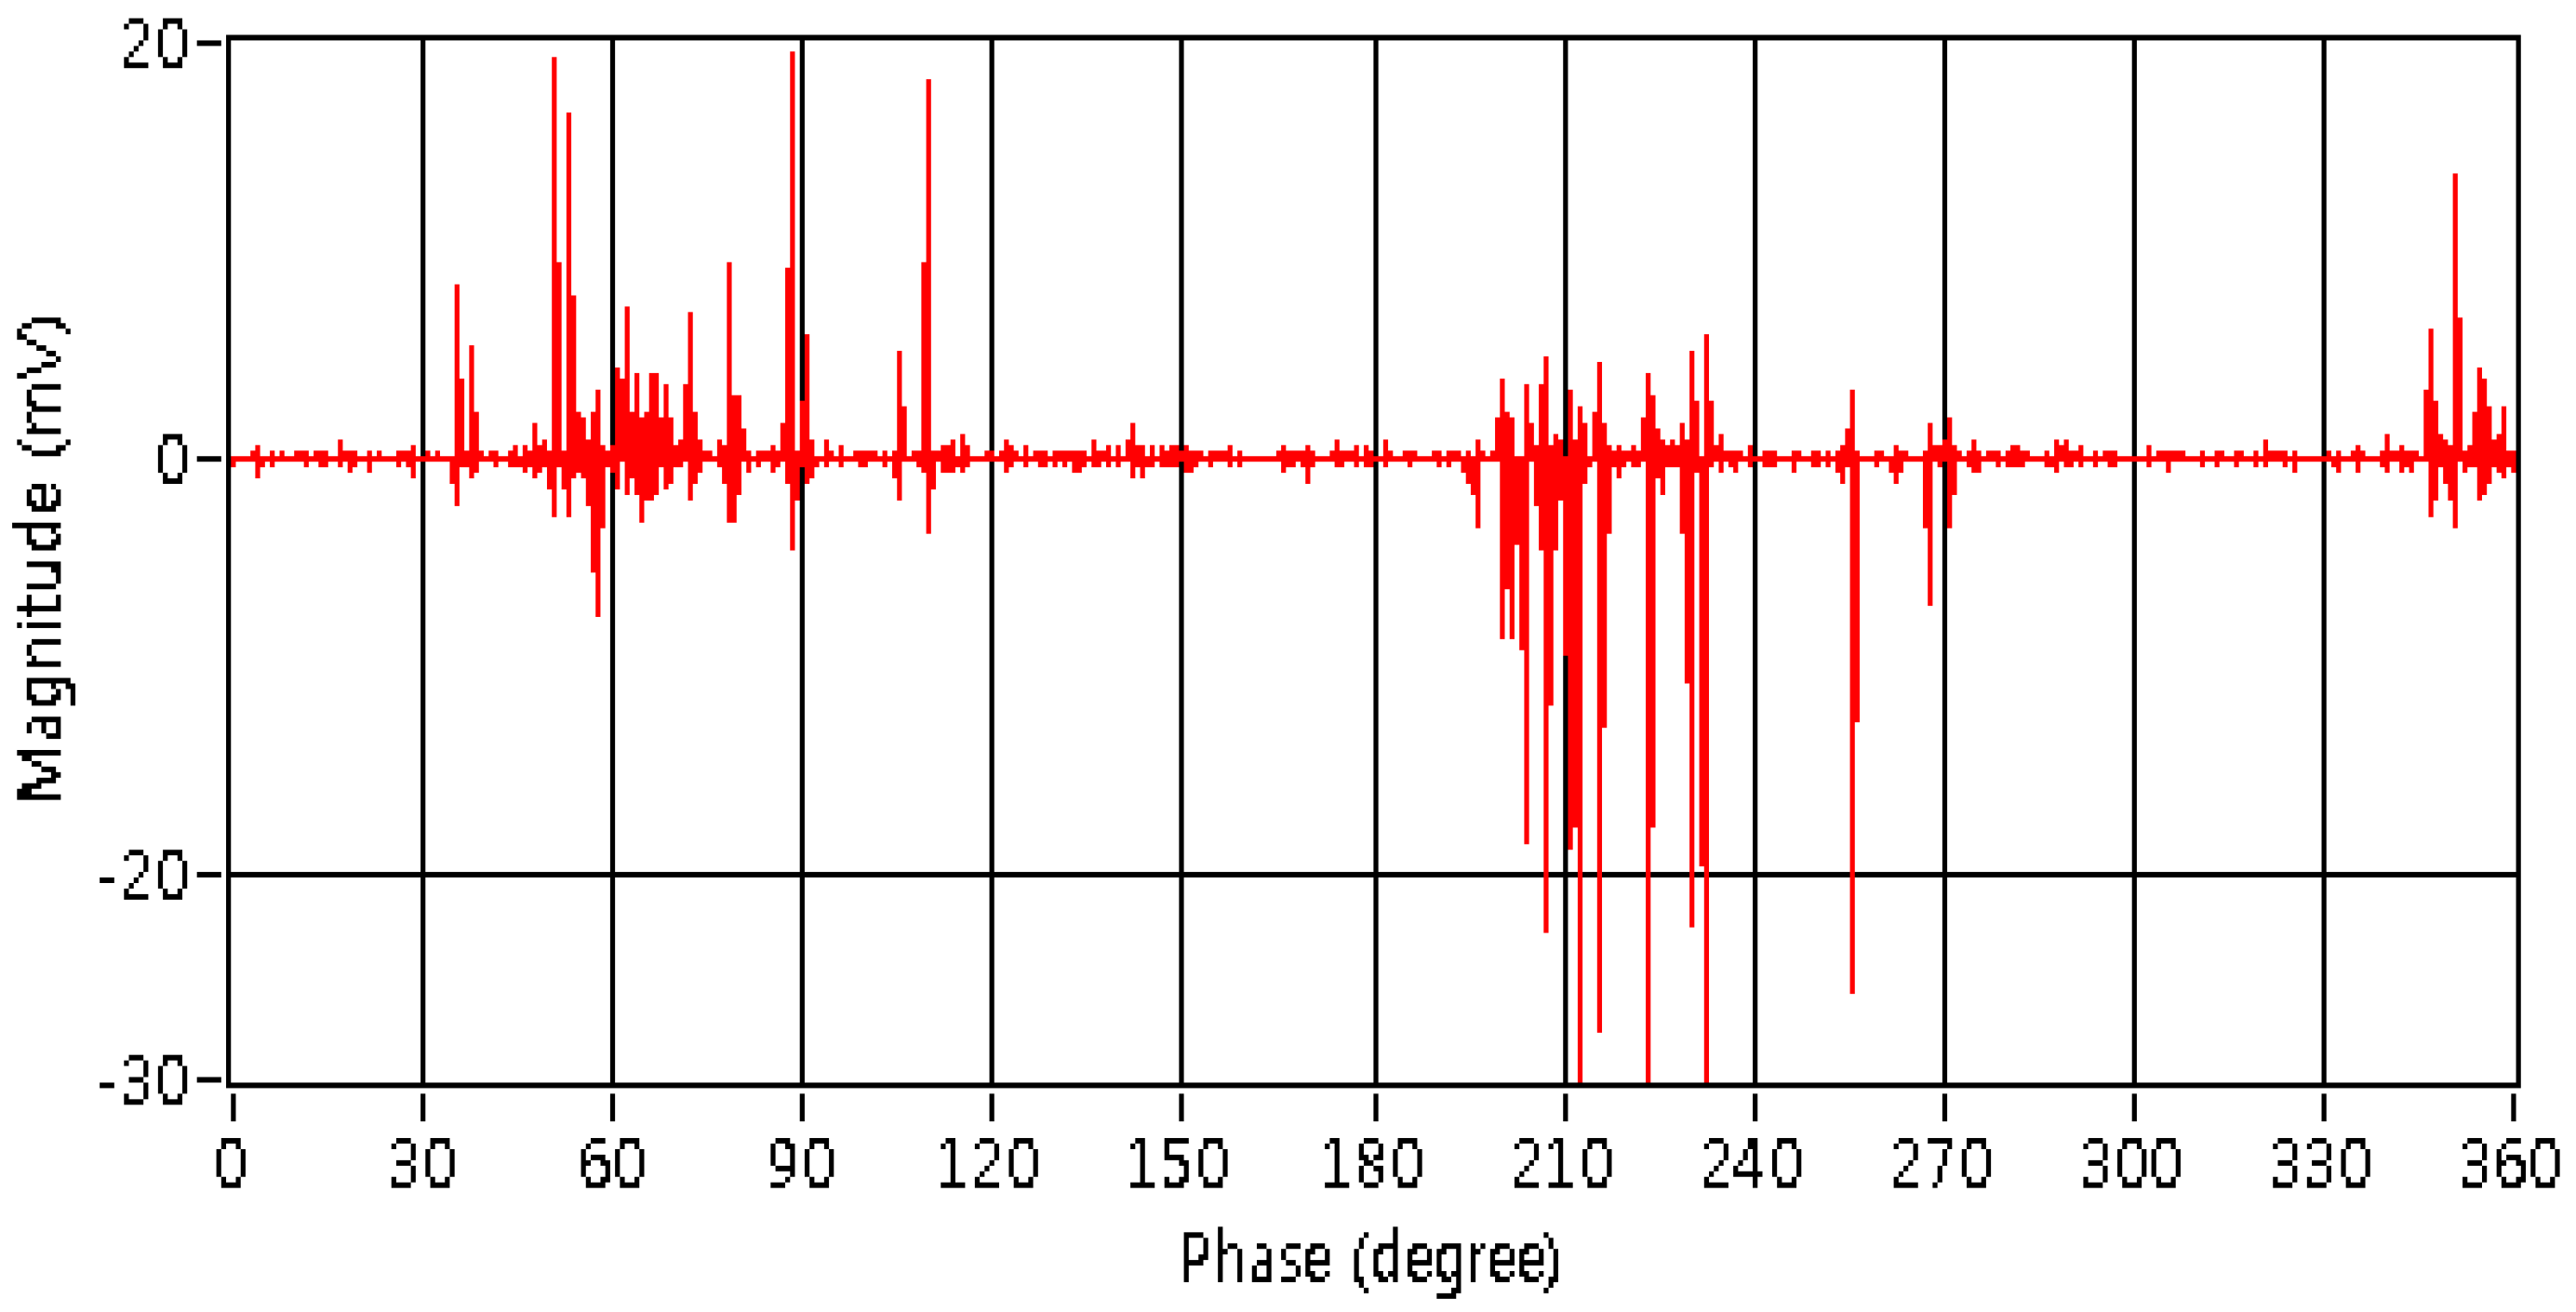
From the above analysis, the optimal mother wavelet for analyzing PD pulses in spacer was bior6.8, and the decomposition level of 8 was implemented to decompose the PRPD signal. After applying the MRA, it was investigated that the PD events in the VIS were associated with components of D1–D5, which were then de-noised using the automatic scale-dependent threshold and the intermediate thresholding to eliminate the background noise and capacitive disturbance. Finally, the PRPD signal was reconstructed with the de-noised D1–D5.
To verify the validity of the proposed method, a simulated PRPD signal and the signals detected in the POS and crack were analyzed.

5.1. Simulated PRPD

Figure 10a shows the simulated PD pulse sequences with different magnitudes and phase distributions. They were mixed with the applied voltage detected at 0.8 time of the discharge inception voltage in the VIS, resulting in a signal–noise ratio (SNR) of −43.08 dB. The simulated PRPD signal is demonstrated in Figure 10b. Its disturbance was eliminated by the proposed wavelet de-noising method and by the HPF with cutoff frequencies of 1 kHz, 9 kHz, and 100 kHz. The results evaluated in terms of correlation coefficient and SNR are shown in Table 1.
Figure 10c,d shows the signals de-noised by the filters with the cutoff frequencies of 1 kHz and 100 kHz, respectively. It is indicated that the filter with a low cutoff frequency could not completely eliminate the disturbance and even that with a high cutoff frequency still could not completely eliminate the background noise. As a result, the correlated coefficients as well as the SNRs between the simulated signal and de-noised signal were very low.
Figure 10e,f illustrates the signals reconstructed using the noisy and de-noised components D1–D5, respectively. Both the capacitive disturbance and background noise were well eliminated after applying the threshold and thresholding function. The signal reconstructed by noisy D1–D5 resulted in a correlation coefficient of 0.141 and an SNR of −16.76 dB, whereas that processed by the de-noised D1–D5 led to a correlation coefficient of 0.814 and an SNR of 4.17 dB, achieving an improvement in SNR of 47.25 dB. Table 1 also gives the results of extraction of PRPD using all of the de-noised detail components. However, an increase in the reconstruction level could not improve the correlation coefficient or SNR, but causes the computational complexity. From Table 1, the application of the WT method may cause reduction in pulse amplitude, but the reduction is much lower compared with using filters. In addition, the implementation of filters resulted in a lower SNR.

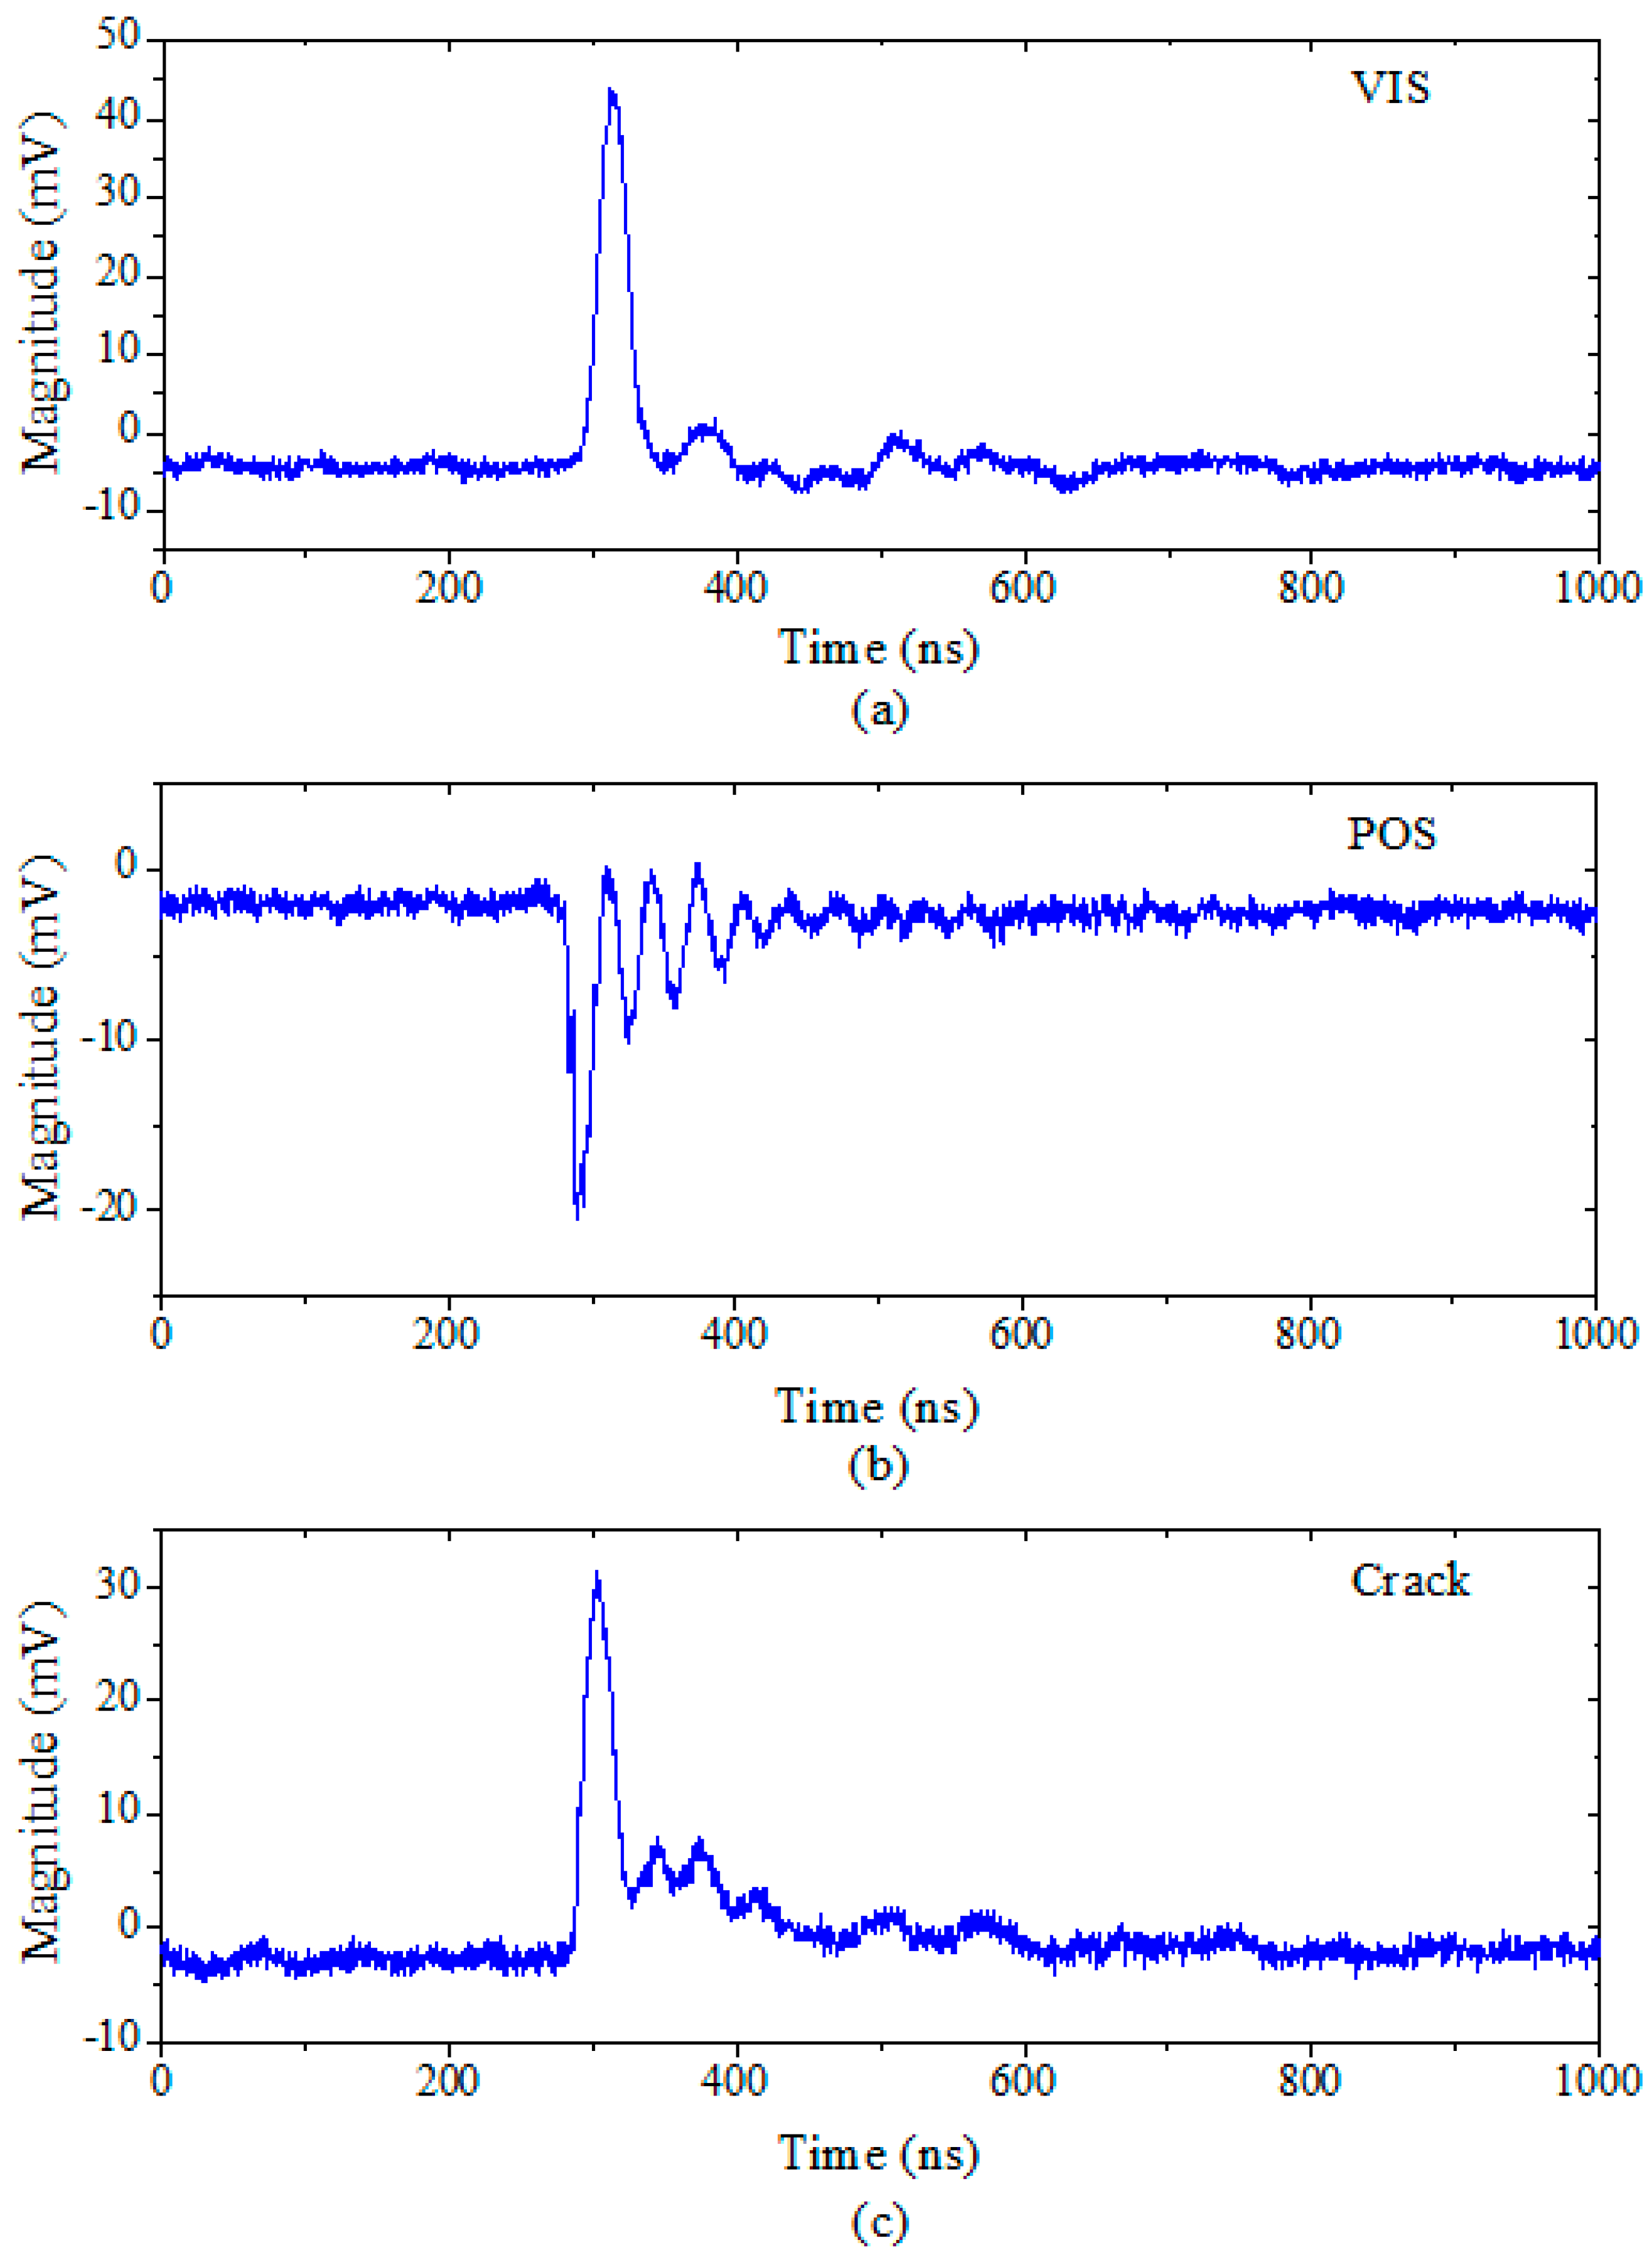
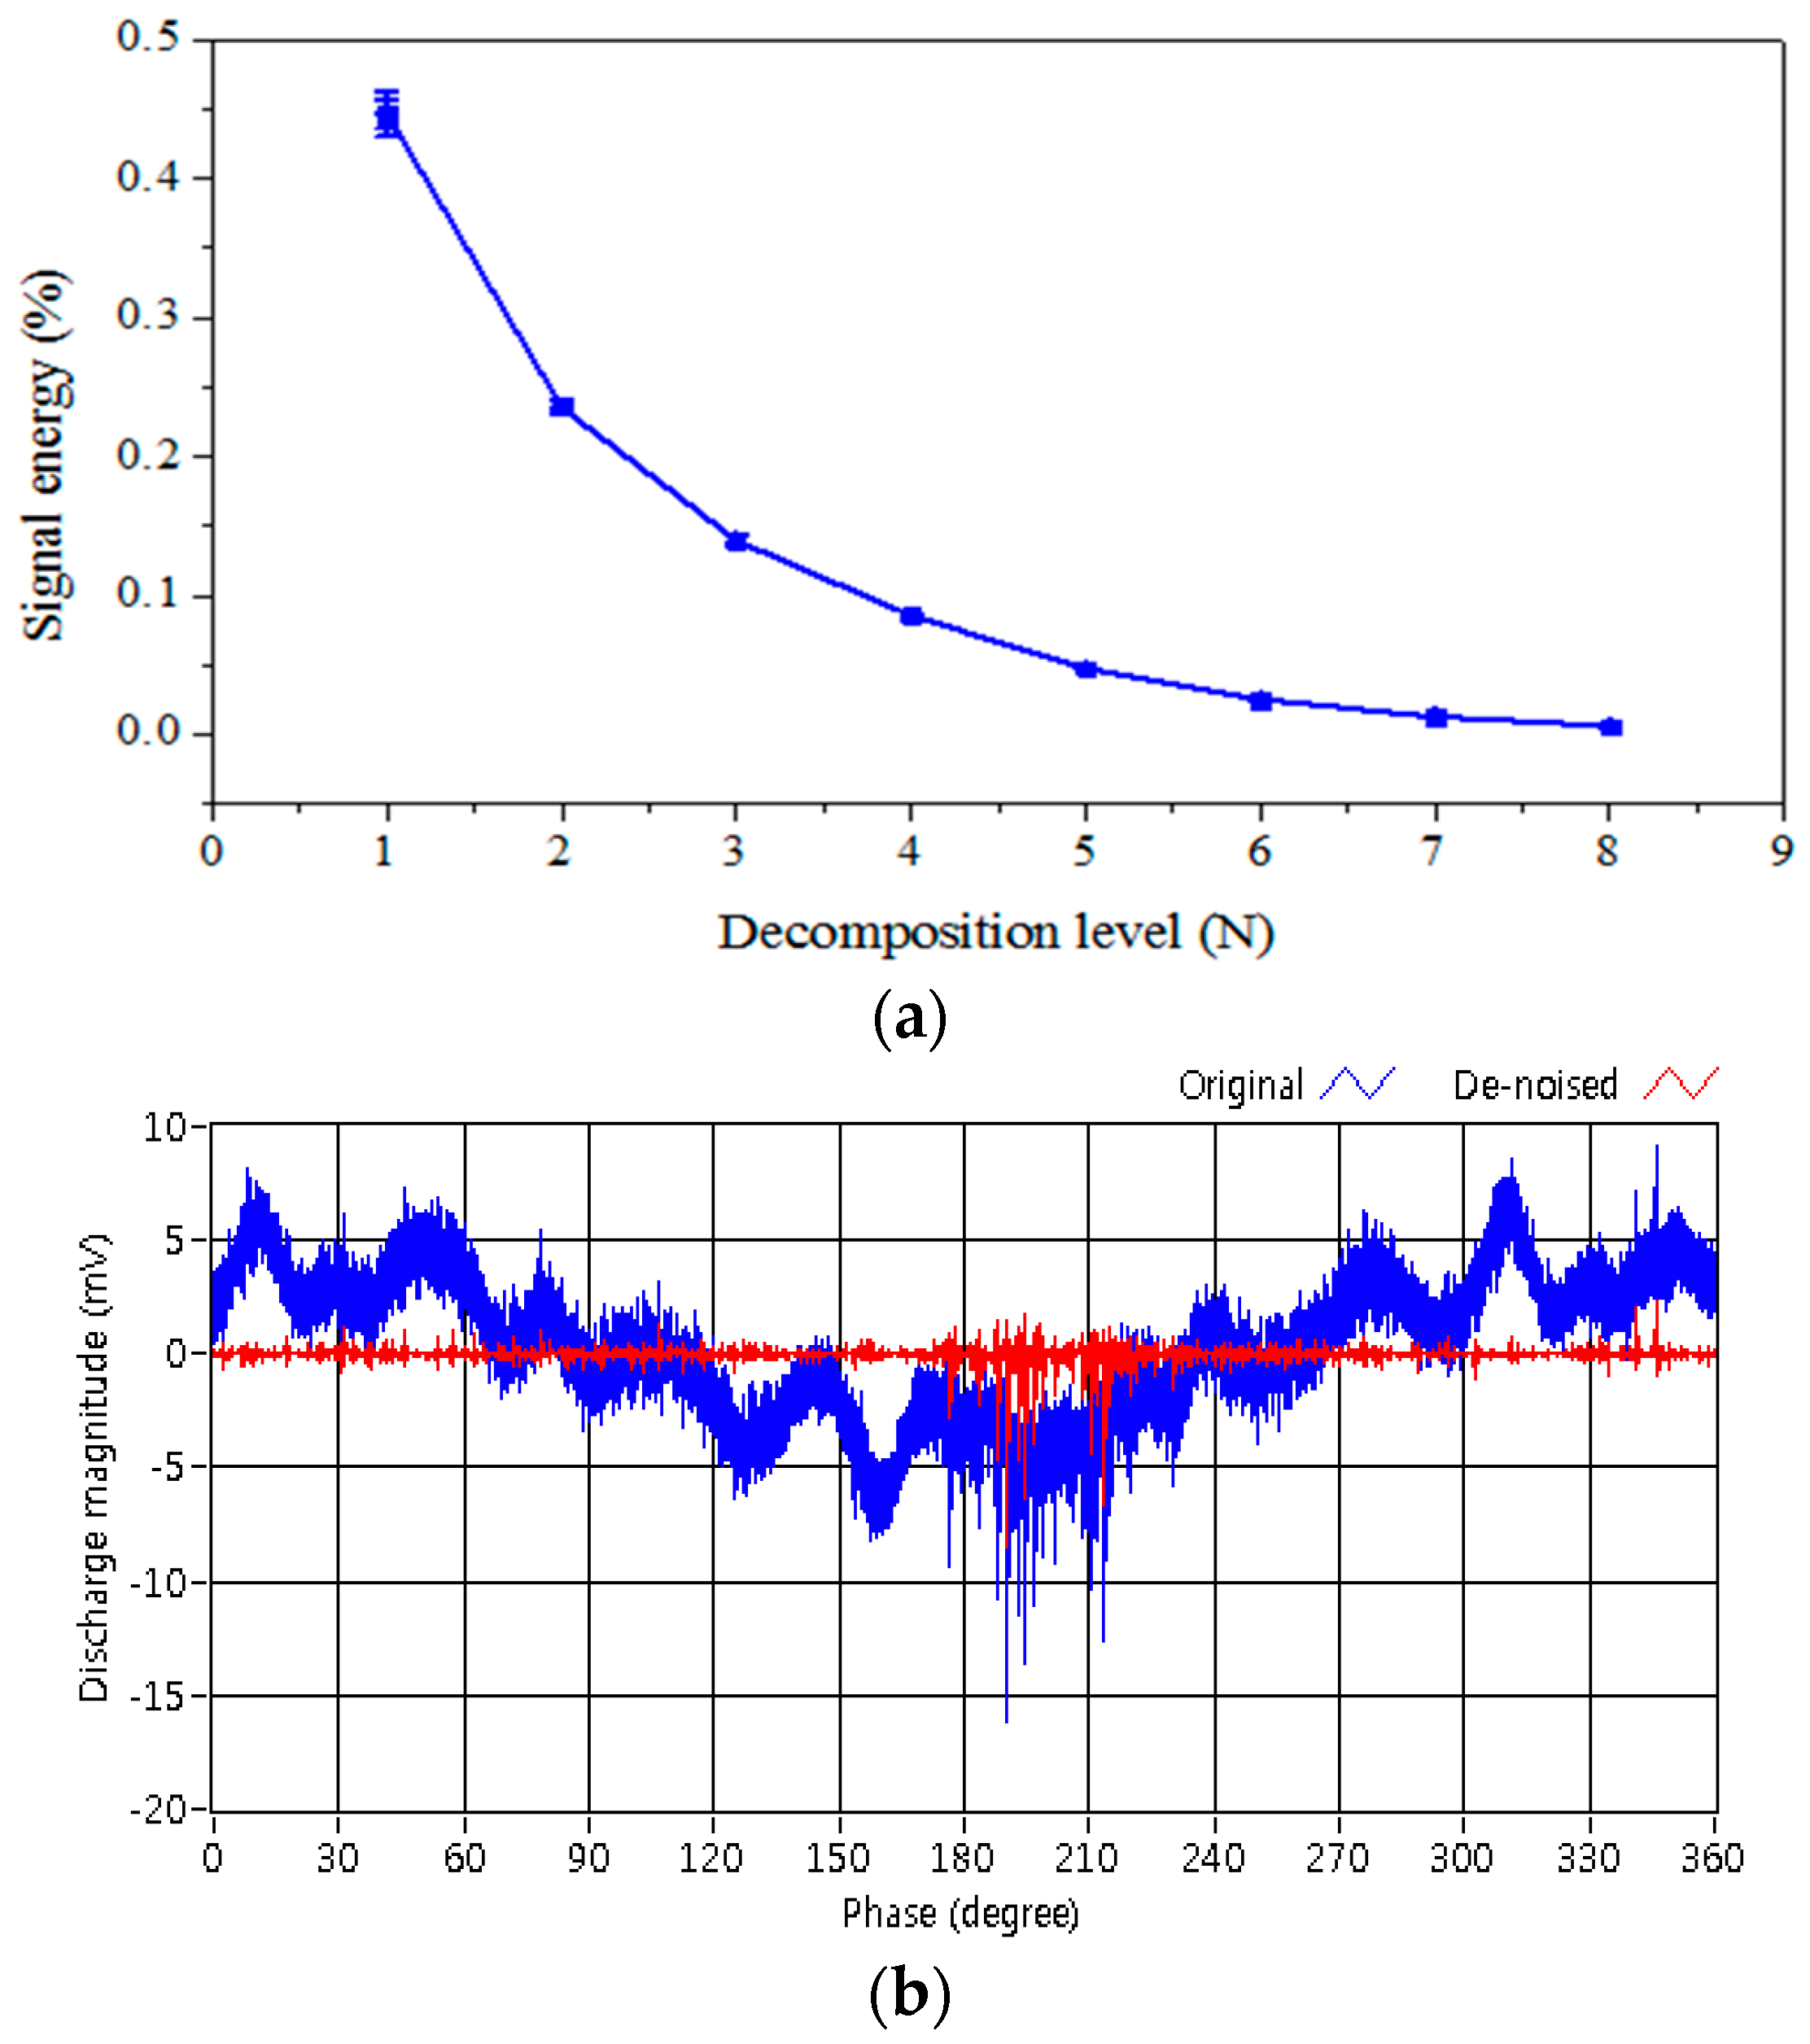
5.2. PRPD in the POS and the Crack

Figure 11 and Figure 12 demonstrate the results of disturbance elimination for PRPD in the POS and crack, respectively. In the POS, 95.4% of the signal energy was distributed in the components of D1–D5, and the disturbance elimination resulted in a reduction in a noise level of 0.46 dB. D1–D5 occupied 96.0% of the energy of PRPD signal in the crack, and a reduction in noise level of 17.18 dB was achieved.

6. Conclusions

In this paper, the WT was used to eliminate the capacitive disturbance from PD signals induced by typical defects in GIS spacers. The optimal mother wavelet was determined as bior6.8 by calculating the correlation coefficients with single PD pulses. The PRPD signals were decomposed into 8 levels using the MRA method. It was revealed that more than 95% of signal energy was distributed in the detail components of D1–D5, whereas the components of D6–D8 and A8, which were related to background noise and capacitive component, respectively, were discarded. Furthermore, components of D1–D5 were de-noised by the automatic scale-dependent threshold and the intermediate thresholding function. The PRPD signals were reconstructed using the de-noised D1–D5. Compared to dealing with filters, the proposed method extracted the PRPD signals with a higher correlation coefficient and SNR, resulting in a high sensitivity for PD detection in GISs.

Author Contributions

Guoming Wang and Hong-Keun Ji conceived the experiments and wrote the manuscript. Guoming Wang and Jong-Hyuk Lee performed the experiments and analyzed the data. Gyung-Suk Kil was the supervisor of this work and provided the insight and technical expertise to improve the quality of this paper.

Conflicts of Interest

The authors declare no conflict of interest.

References

  1. Bartnikas, R. Partial discharges their mechanism, detection and measurement. IEEE Trans. Dielectr. Electr. Insul. 2002, 9, 763–808. [Google Scholar] [CrossRef]
  2. Liu, M.; Tang, J.; Yao, Q.; Miao, Y. Study on the characteristic decomposition components of DC SF6-insulated equipment under positive DC partial discharge. Energies 2017, 10, 640. [Google Scholar] [CrossRef]
  3. Tang, J.; Yang, X.; Yang, D.; Yao, Q.; Miao, Y.; Zhang, C.; Zeng, F. Using SF6 decomposed component analysis for the diagnosis of partial discharge severity initialted by free metal particle defect. Energies 2017, 10, 1119. [Google Scholar] [CrossRef]
  4. Zhu, M.X.; Zhang, J.N.; Li, Y.; Wei, Y.H.; Xue, J.Y.; Deng, J.B.; Mu, H.B.; Zhang, G.J.; Shao, X.J. Partial discharge signals separation using cummulative energy function and mathematical morphology gradient. IEEE Trans. Dielectr. Electr. Insul. 2015, 23, 482–493. [Google Scholar] [CrossRef]
  5. Neumann, C.; Rusek, B.; Balzer, G.; Jeromin, I. End of Life Estimation and Optimisation of Maintenance of HV Switchgear and GIS Substations; A3 202; CIGRE: Paris, France, 2012; pp. 1–12. [Google Scholar]
  6. CIGRE Working Groups. Long-Term Performance of SF6 Insulated Systems; CIGRE: Paris, France, 2002. [Google Scholar]
  7. Ueta, G.; Wada, J.; Okabe, S.; Miyashita, M.; Nishida, C.; Kamei, M. Insulation performance of three types of micro-defects in inner epoxy insulators. IEEE Trans. Dielectr. Electr. Insul. 2012, 19, 947–954. [Google Scholar] [CrossRef]
  8. Braun, J.M.; Ford, G.L.; Fujimoto, N.; Rizzetto, S.; Stone, G.C. Reliability of GIS EHV epoxy insulators: The need and prospects for more stringent acceptance criteria. IEEE Trans. Power Deliv. 1993, 8, 121–131. [Google Scholar] [CrossRef]
  9. International Electrotechnical Commission. High-Voltage Switchgear and Controlgear-Part 203: Gas-Insulated Metal-Enclosed Switchgear for Rated Voltages above 52 Kv; IEC 62271-203; IEC: Geneva, Switzerland, 2003. [Google Scholar]
  10. Yang, L.; Judd, M.D.; Bennoch, C.J. Denoising UHF signal for PD detection in transformers based on wavelet technique. In Proceedings of the 2004 Annual Report Conference on Electrical Insulation and Dielectric Phenomena, Boulder, CO, USA, 20 October 2004. [Google Scholar]
  11. Satish, L.; Nazneen, B. Wavelet-based denoising of partial discharge signals buried in excessive noise and interference. IEEE Trans. Dielectr. Electr. Insul. 2003, 10, 354–367. [Google Scholar] [CrossRef]
  12. Ma, X.; Zhou, C.; Kemp, I.J. Automated wavelet selection and thresholding for PD detection. IEEE Electr. Insul. Mag. 2002, 18, 37–45. [Google Scholar] [CrossRef]
  13. Zhou, X.; Zhou, C.; Kemp, I.J. An improved methodology for application of wavelet transform to partial discharge measurement denoising. IEEE Trans. Dielectr. Electr. Insul. 2015, 12, 586–594. [Google Scholar] [CrossRef]
  14. Zhang, H.; Blackburn, T.R.; Phung, B.T.; Sen, D. A novel wavelet transform technique for on-line partial discharge measurements part 1: WT de-nosing algorithm. IEEE Trans. Dielectr. Electr. Insul. 2007, 14, 3–14. [Google Scholar] [CrossRef]
  15. Zhang, H.; Blackburn, T.R.; Phung, B.T.; Sen, D. A novel wavelet transform technique for on-line partial discharge measurements part 2: On-site nois rejection application. IEEE Trans. Dielectr. Electr. Insul. 2007, 14, 15–22. [Google Scholar] [CrossRef]
  16. Chang, C.S.; Jin, J.; Chang, C.; Hoshino, T.; Hanai, M.; Kobayashi, N. Separation of corona using wavelet packet transform and neural network for detection of partial discharge in gas-insulated substations. IEEE Trans. Power Deliv. 2005, 20, 1363–1369. [Google Scholar] [CrossRef]
  17. Wu, M.; Cao, H.; Cao, J.; Nguyen, H.L.; Gomes, J.B.; Krishnaswamy, S.P. An overview of state-of-the-art partial discharge analysis techniques for condition monitoring. IEEE Electr. Insul. Mag. 2015, 31, 22–35. [Google Scholar] [CrossRef]
  18. Ma, H.; Chan, J.C.; Saha, T.K.; Ekanayake, C. Pattern recognition techniques and their applications for automatic classification of artificial partial discharge sources. IEEE Trans. Dielectr. Electr. Insul. 2013, 20, 468–478. [Google Scholar] [CrossRef]
  19. CIGRE Working Groups. Risk Assessment on Defects in GIS Based on PD Diagnosis; CIGRE: Paris, France, 2013. [Google Scholar]
  20. Mansour, D.A.; Kojima, H.; Hayakawa, N.; Endo, F.; Okubo, H. Partial discharges and associated mechanisms for micro gap delamination at epoxy spacer in GIS. IEEE Trans. Dielectr. Electr. Insul. 2010, 17, 855–861. [Google Scholar] [CrossRef]
  21. Ji, H.X.; Li, C.R.; Ma, G.M.; Pang, Z.K.; Tang, Z.G.; Wen, H.; Cui, B.Y. Partial discharge occurrence induced by crack defect on GIS insulator operated at 1100 kV. IEEE Trans. Dielectr. Electr. Insul. 2016, 23, 2250–2257. [Google Scholar] [CrossRef]
  22. Wang, G.M.; Jo, H.E.; Kim, S.J.; Kim, S.W.; Kil, G.S. Measurement and analysis of partial discharge in SF6 gas under HVDC. Measurement 2016, 91, 351–359. [Google Scholar] [CrossRef]
  23. Grgic, S.; Grgic, M.; Zovko-Cihlar, B. Performance analysis of image compression using wavelets. IEEE Trans. Ind. Electron. 2001, 48, 682–695. [Google Scholar] [CrossRef]
  24. Moula, B.; Mekhaldil, A.; Teguar, M.; Haddad, A. Characteristics of discharge on non-uniformly polluted glass surface using a wavelet transform approach. IEEE Trans. Dielectr. Electr. Insul. 2013, 20, 1457–1466. [Google Scholar] [CrossRef]
  25. Carvalho, A.T.; Lima, A.C.S.; Cunha, C.F.F.C.; Petraglia, M. Identification of partial discharge immersed in noise in large hydro-generators based on improved wavelet selection methods. Measurement 2015, 75, 122–133. [Google Scholar] [CrossRef]
  26. International Electrotechnical Commission. High-Voltage Test Techniques-Partial Discharge Measurements; IEC 60270; IEC: Geneva, Switzerland, 2000. [Google Scholar]
  27. Ma, X.; Zhou, C.; Kemp, I.J. Interpretation of wavelet analysis and its application in partial discharge detection. IEEE Trans. Dielectr. Electr. Insul. 2002, 9, 446–457. [Google Scholar] [CrossRef] [Green Version]
  28. Hsieh, M.S.; Tseng, D.C.; Huang, Y.H. Hiding digital watermarks using multiresolution wavelet transform. IEEE Trans. Ind. Electron. 2001, 48, 875–882. [Google Scholar] [CrossRef]
  29. Li, J.; Jiang, T.; Grzybowski, S.; Cheng, C. Scale dependent wavelet selection for de-noising of partial discharge detection. IEEE Trans. Dielectr. Electr. Insul. 2010, 17, 1705–1714. [Google Scholar] [CrossRef]
  30. Shim, I.; Soraghan, J.J.; Siew, W.H. Detection of PD utilizing digital singal processing method. Part 3: Open-loop noise reduction. IEEE Electr. Insul. Mag. 2001, 17, 6–13. [Google Scholar] [CrossRef]
  31. Wang, G.M.; Kim, S.J.; Kil, G.S.; Kim, S.W. Optimization of wavelet and thresholding for partial discharge detection under HVDC. IEEE Trans. Dielectr. Electr. Insul. 2017, 24, 200–208. [Google Scholar] [CrossRef]
Figure 1. Partial discharge (PD) signal detected within a cycle of applied voltage in gas-insulated switchgear (GIS) spacer.
Energies 10 01762 g001
Figure 2. PD cell for a particle on spacer (POS).
Energies 10 01762 g002
Figure 3. Experimental setup.
Energies 10 01762 g003
Figure 4. Typical detected PD pulses. (a) In the void inside spacer (VIS); (b) in the POS; (c) in the crack.
Energies 10 01762 g004
Figure 5. Correlation coefficient between the single PD pulses and the mother wavelets.
Energies 10 01762 g005
Figure 6. Decomposition of the phase-resolved partial discharge (PRPD) signal in the VIS into 8 levels.
Energies 10 01762 g006
Figure 7. Signal energies distribution of detail components in the VIS.
Energies 10 01762 g007
Figure 8. De-noising of detail component D1.
Energies 10 01762 g008
Figure 9. Reconstruction of PRPD signal in the VIS using D1–D5.
Energies 10 01762 g009
Figure 10. Disturbance elimination for simulated PRPD signal. (a) Simulated PD pulse sequences; (b) simulated PRPD; (c) with a 1 kHz filter; (d) with a 100 kHz filter; (e) via noisy D1–D5; (f) via de-noised D1–D5.
Energies 10 01762 g010
Figure 11. Disturbance elimination for PRPD in the POS. (a) Signal energy distribution; (b) extraction of PRPD.
Energies 10 01762 g011
Figure 12. Disturbance elimination for PRPD in the crack. (a) Signal energy distribution; (b) extraction of PRPD.
Energies 10 01762 g012aEnergies 10 01762 g012b
Table 1. Results of disturbance elimination. SNR: signal–noise ratio.
MethodCorrelation CoefficientSNRReduction in Amplitude [%]
1 kHz filter0.063−23.912.69
9 kHz filter0.135−17.353.02
100 kHz filter0.134−16.775.51
Wavelet, noisy D1–D50.141−16.760.19
Wavelet, de-noised D1–D50.8144.172.30
Wavelet, de-noised D1–D80.8134.091.70

