Lean Maintenance Applied to Improve Maintenance Efficiency in Thermoelectric Power Plants

1
Mechanical Engineering School, Pontificia Universidad Católica de Valparaíso, Valparaiso 2430000, Chile
2
Department of Mechanical Engineering, Politécnico de Milán, Politecnico de Milán, 20133 Milano MI, Italy
3
Inacap Valparaiso, Universidad Tecnológica de Chile INACAP, Valparaiso 2430000, Chile
*
Author to whom correspondence should be addressed.
Energies 2017, 10(10), 1653; https://doi.org/10.3390/en10101653
Submission received: 22 September 2017
/
Revised: 12 October 2017
/
Accepted: 16 October 2017
/
Published: 19 October 2017
(This article belongs to the Section F: Electrical Engineering)
Abstract
:Thermoelectric power plants consist of a set of critical equipment that require high levels of availability and reliability. Due to this, maintenance of these physical assets is gaining momentum in industry. Maintenance is considered as an activity that contributes to improving the availability, efficiency and productivity of each piece of equipment. Several techniques have been used to achieve greater efficiencies in maintenance, among which we can find the lean maintenance philosophy. Despite the wide diffusion of lean maintenance, there is no structured method that supports the prescription of lean tools applied to the maintenance function. This paper presents the experience gathered in two lean maintenance projects in thermoelectric power plants. The application of lean techniques was based on using a previously developed multicriterial decision making process that uses the Fuzzy Analytic Hierarchy Process (AHP) methodology to carry out a diagnosis and prescription tasks. That methodology allowed the prescription of the appropriated lean techniques to resolve the main deficiencies in maintenance function. The results of applying such lean tools show that important results can be obtained, making the maintenance function in thermoelectric power plants more efficient and lean.
1. Introduction
Maintenance has become crucial in capital-intensive production systems [1,2]. A paradigm shift towards efficient asset life cycle management has led to the incorporation of different techniques, philosophies and technologies to attain higher levels of system performance and sustainability. In recent years, efforts have been made to propose and improve maintenance strategies that aim to extend the useful life of every piece of existent equipment, increase its availability and guarantee higher levels of reliability. One such effort has recently materialised in the application of the so-called “lean thinking” philosophy to maintenance operations. This philosophy was created by Toyota in the 1940s, when Japanese companies implemented radical changes in production systems to supply larger markets with a wider variety of vehicles. This led to the birth of a methodology that allows production systems to better adapt to demand fluctuations by producing only the necessary amount of products at the correct moment. In recent years, lean thinking has become popular in many different sectors, for instance, food, manufacturing and process industry. Lean maintenance is an approach based on lean thinking applied in maintenance operations (the term was coined at the Massachusetts Institute of Technology by Womack and Jones in the 1990s) [3]. It is based on addressing the root causes of inefficiency in an organization. It is similar to the well-known “doing more with less”. In industry, lean operation means reducing or eliminating activities that do not add value, such as inventory, overproduction, inspections, and transport. Table 1 shows the correspondences between the sources of waste in lean manufacturing and lean maintenance.
1.1. Maintenance in Thermoelectric Plants
An electric power system has the basic task of providing reliable electricity to its consumers [4]. Power plants consist of a set of sophisticated systems which must have the highest level of availability [5]. The obsolescence of these systems increases the risk of unavailability because they have a high degree of mechanical wear due to the high temperatures and chemicals products used for the production of electric energy [6]. In addition, in most electrical systems, the equipment works close to its rated capacity [7]. Therefore, any failures, especially catastrophic ones, can result in reliability reductions of the electrical systems that may cause important social and economic losses (low reliability result in few savings and high expenses). Therefore, a balance between reliability and cost is required. On the other hand, the optimal maintenance actions, suggested by sophisticated maintenance models, cannot be applied to all the equipment in an electrical system, as may be desired, mainly due to budget constraints. Thus, it is imperative that maintenance actions be developed and executed with high levels of efficiency, besides a continuous improvement process.
In power plants, as in many other areas of the industry, physical asset management seeks to reduce the costs associated with maintenance along with increasing availability. Several strategies have been developed and employed to achieve these goals, such as Total Productive Maintenance (TPM), Root Cause Analysis (RCA) [8], preventive maintenance, Reliability Centered Maintenance (RCM) [9], among others [10].
On the other hand, one of the most important tools for optimization and cost reduction in maintenance, is to implement an effective and complete predictive maintenance program [11,12]. Predictive maintenance is an equipment intervention methodology, based on the analysis of condition parameters to determine the appropriate timing for the intervention. In addition, improved operation and maintenance of thermal power plants can be achieved through integrated monitoring systems that continuously monitor the intrinsic variables of the various processes to reveal the true condition of specialized components and systems. In addition, any degradation of a thermal energy plant can be continuously monitored and recorded using standard computer systems and plant instrumentation [13].
1.2. Lean Maintenance
One of the strategies which have been used in the recent years to improve maintenance functions is Lean Maintenance [14]. In every improvement project, it is necessary to define and apply a procedure to lead to better operational results. Lean Maintenance is not an exception. Therefore, we developed a procedure that covers all the phases needed to implement the lean thinking in maintenance operations in a thermoelectric power plant (Figure 1).
The first phase involves training, capacitation, personnel awareness and team formation. The second one corresponds to the diagnosis and it is based on the application of a questionnaire while the third one corresponds to the implementation phase. The latter consists mainly of the selection of the appropriate lean tools. These can be considered as performance drivers able to bring important benefits from their adoption.
The objective of the tool is to tackle the deficiencies detected during the diagnosis phase. In addition, implementation phase considers lean tools prioritization and the correspondent application plan. Finally, the phase of evaluation and continuous improvement is executed, with a permanent motivation and involvement of the workforce. Summing up, through the application of the lean principles, the waste elimination process is carried out. In terms of maintenance function, waste elimination can be categorized as: reduction of over maintenance, more and better organization is spare parts warehouses, better maintainability (shorter Mean Time to Repair—MTTR), better maintenance organization and maintenance procedures standardization (Figure 2). The rest of the paper is organized as follows: Section 2 describes the diagnosis phase of the proposed methodology. Section 3 presents the steps related to the lean tools selection. Section 4 proposes a mechanism to prioritize the lean tools to apply in a specific implementation plan. Section 5 reports two case studies of thermoelectric power station. Finally, Section 6 draws the conclusions.
2. Diagnostic Phase
Through the implementation of lean thinking, maintenance organizations have attained higher levels of productivity and competitiveness. Other important objectives such as cost reduction, personnel involvement and strategic alignment are also possible through the lean thinking philosophy. Therefore, it becomes imperative to determine leanness degree achieved by the organization, the progress of the lean implementation processes and the extent of potential improvements. Through the understanding of the leanness degree it is possible to direct the efforts towards the maintenance processes improvement.
To start the implementation of lean thinking, a diagnosis phase aiming to measuring the leanness degree present in maintenance function has to be performed. Therefore, the creation and application of standardized evaluation tools is required. There are two reference documents available in the literature which can be used to define evaluation and diagnostic instruments: ISO 55000 and SAE J4000 standards [15,16]. SAE J4000 is a standard created by the Society of Automotive Engineers (SAE) in 1999. Initially created as an improvement tool focused on production systems, it outlines a set of characteristics which a system should have in order to be considered as lean. It also defines a roadmap to assist managers to make the transition to a superior leanness degree. The standard consists of two basic documents: (i) a list of criteria based on which the concept of lean manufacturing can be achieved and (ii) a division of the criteria into a set of performance measurements.
The main section of the standard is made up of 52 elements assessing characteristics and requirements for a correct implementation of lean manufacturing. These elements are subdivided into six principles that offer measurable reference points for the implementation of lean thinking successfully. The six principles are used as a guide to the evaluation and improvement process implementation. The standard also includes a measurement scale to compare the levels of satisfaction for each principle as a function of best practices (Table 2 and Table 3).
As commented before, the SAE J4000 standard was defined to assess the leanness degree in production scenarios, so we used the standard to generate a diagnosis and prescription instrument in maintenance contexts. In the following paragraphs a brief description of the structure of such an instrument is given.
Based on SAE J4000, a maintenance-oriented questionnaire was built and applied. It comprises the same 52 elements distributed over the six principles as the standard (those shown in Table 1). Therefore, for Principle 1, Management/Responsibility, 11 questions were created, for Principle 2, 12 questions; for Principle 3, 5 questions; for Principle 4, 4 questions; for Principle 5, 5 questions, and for the final principle, 13 questions. The questionnaire is applied to a group of technicians from the maintenance area, either direct workers or maintenance managers.
To perform the diagnosis, a set of 16 strategic dimensions were defined (Table 4). Each one of these dimensions is related to one or more of the 52 elements considered by the standard. That allowed a quick and simple diagnostic of the maintenance function based on the lean principles.
After applying the assessment instrument the average of the results obtained is calculated for each question. Depending on the value of this result, the objective is classified as “Poor”, “Medium” and “Good”, according to the following scale:
- “Poor” if
- “Medium” if
- “Good” if
Addressing the results for each strategic dimension (using the questionnaire results), the diagnosis is attained by measuring the level of fulfilment of each lean maintenance principles in the organization. The results obtained in the diagnostic phase could also be compared with a benchmark to determine which areas can be considered more deficient in relation to the levels of excellence in maintenance management. Figure 3 shows an example of the comparison of the diagnosis results between a hypothetic power plant (thermoelectric I) and another which is the benchmark.
3. Lean Tools Selection
After the quantification of the actual leanness degree in maintenance, the development of a prescription plan focusing on waste reduction in maintenance is needed. One important factor for promoting this reduction is the implementation of standardized procedures that, once defined, will guarantee the correct and successful use of maintenance resources [17]. Besides, it is imperative to use appropriate performance indexes aligned to the maintenance strategy [18,19,20].
Lean maintenance brings together a series of techniques and tools whose objective is to reduce or eliminate the unnecessary wastes (Muda in Japanese). Some examples of such lean tools are: visual management systems (VMS), set-up time reduction [21] (Single Minute Exchange of Dies—SMED), the 5S method (sort, streamline, shine, standardize and sustain), Value Stream Mapping (VSM) and Total Productive Maintenance (TPM). Through the application of such tools, organizations can achieve important objectives regarding cost reduction, personnel involvement and strategic alignment [22].
Bayou defined a systematic leanness measurement using seven characteristics to compare the levels of leanness in the Ford Motor Company with the Japanese firm Honda. Vinodh [23] designed a model to measure leanness using fuzzy logic as the modelling tool. Vimal and Vinodh [24] proposed a leanness evaluation technique using a set of IF-THEN rules based on fuzzy logic and targeting five enablers: management responsibility, manufacturing management, workforce leanness, technology leanness and manufacturing strategy. Vinodh and Prakash [25], proposed the application of Fuzzy Association Rules Mining (FARM) to analyse the level of leanness of a manufacturing company in India. Seven attributes were considered to reflect the performance from a perspective of leanness: cost, profitability, productivity, quality, lead time, defects and availability. All these studies address leanness evaluation in production systems, but they lack focusing on the prescription stage for recommending or selecting lean tools that could help to improve a specific aspect of lean thinking.
Pavnaskar, Gershenson, and Jambekar [26] proposed a system for classifying and relating lean tools with the problems identified in a production organization. An interesting aspect of this study is the large number of lean techniques found through an exhaustive bibliographic review, thus making the system complex and difficult to implement. More recently, Hu et al. [27] proposed a multi-objective model to support decision-making in the selection of a portfolio of lean implementation projects in manufacturing companies. Anand and Kodali [28] presented a reference framework comprising 65 lean elements or tools, classified by the competitive priorities of the organization. Amin and Karim [29] developed a method to quantitatively measure the performance of a manufacturing system, establish its state of maturity, and detect the causes of inefficiency to then, select appropriate lean strategies. In this study, lean techniques are grouped into three categories: (a) tools for quality/continuous improvement; (b) tools and techniques for process improvement; and (c) lean tools for production support systems. Karim and Arif-Uz-Zaman [30] proposed a method to systematically identify waste in a production area and then assist in the selection of the appropriate lean tools. Key indicators to accompany the process were also identified.
Anvari et al. [31] propose an approach to measure the value of the influence of lean attributes on manufacturing systems by using fuzzy membership functions. That approach allows the user to measure the leanness degree and provide managers an insight to further improvement in the manufacturing systems.
Anvari et al. [32] proposed the integration of AHP and Data Envelopment Analysis (DEA) to select lean tools and techniques. The authors suggest a procedure to measure the efficacy of lean tools on leanness and to prioritize them to lean implementation processes.
Anvari, Zulkifli and Arghish [33] presented a modified VIKOR method to address the lean tool selection problem in manufacturing systems. The authors developed a methodology for lean tools selection to assist practitioners in defining the objectives and implementing of Lean Manufacturing.
To the best of the authors’ knowledge, all the methods published in the literature have been essentially applied in the manufacturing context. So far, only few works deal with the issue of measuring the effectiveness of maintenance strategies based on lean thinking.
Mostafa [34] used Quality Function Deployment (QFD) to assign lean tools to each type of waste. However, the study was conducted in a manufacturing environment and not in a specific maintenance functions. On the other hand, Tendayi [35] applied QFD together with AHP to classify maintenance excellence criteria with some lean tools. Unfortunately, this study only focuses on a case of maintenance of the rolling stock, in addition to not addressing the waste related to maintenance and consider a reduced number of lean tools. More recently, Irajpour et al. [36] proposed a framework to determine the effectiveness of maintenance strategies based on lean thinking approach. The proposed approach is not based on any standard to define the characteristics of lean thinking as applied to maintenance and considers a little number of lean tools. Mostafa et al. [37] proposed a scheme to demonstrate the association between maintenance wastes and the lean tools. The lean tools considered in that work are structured into two level four bundles and 26 lean practices/tools. The scheme is based on a variation of the House of Quality method developing the so called “House of Waste”. Unfortunately, this work does not include evidence of application in such a way as to validate the proposed scheme.
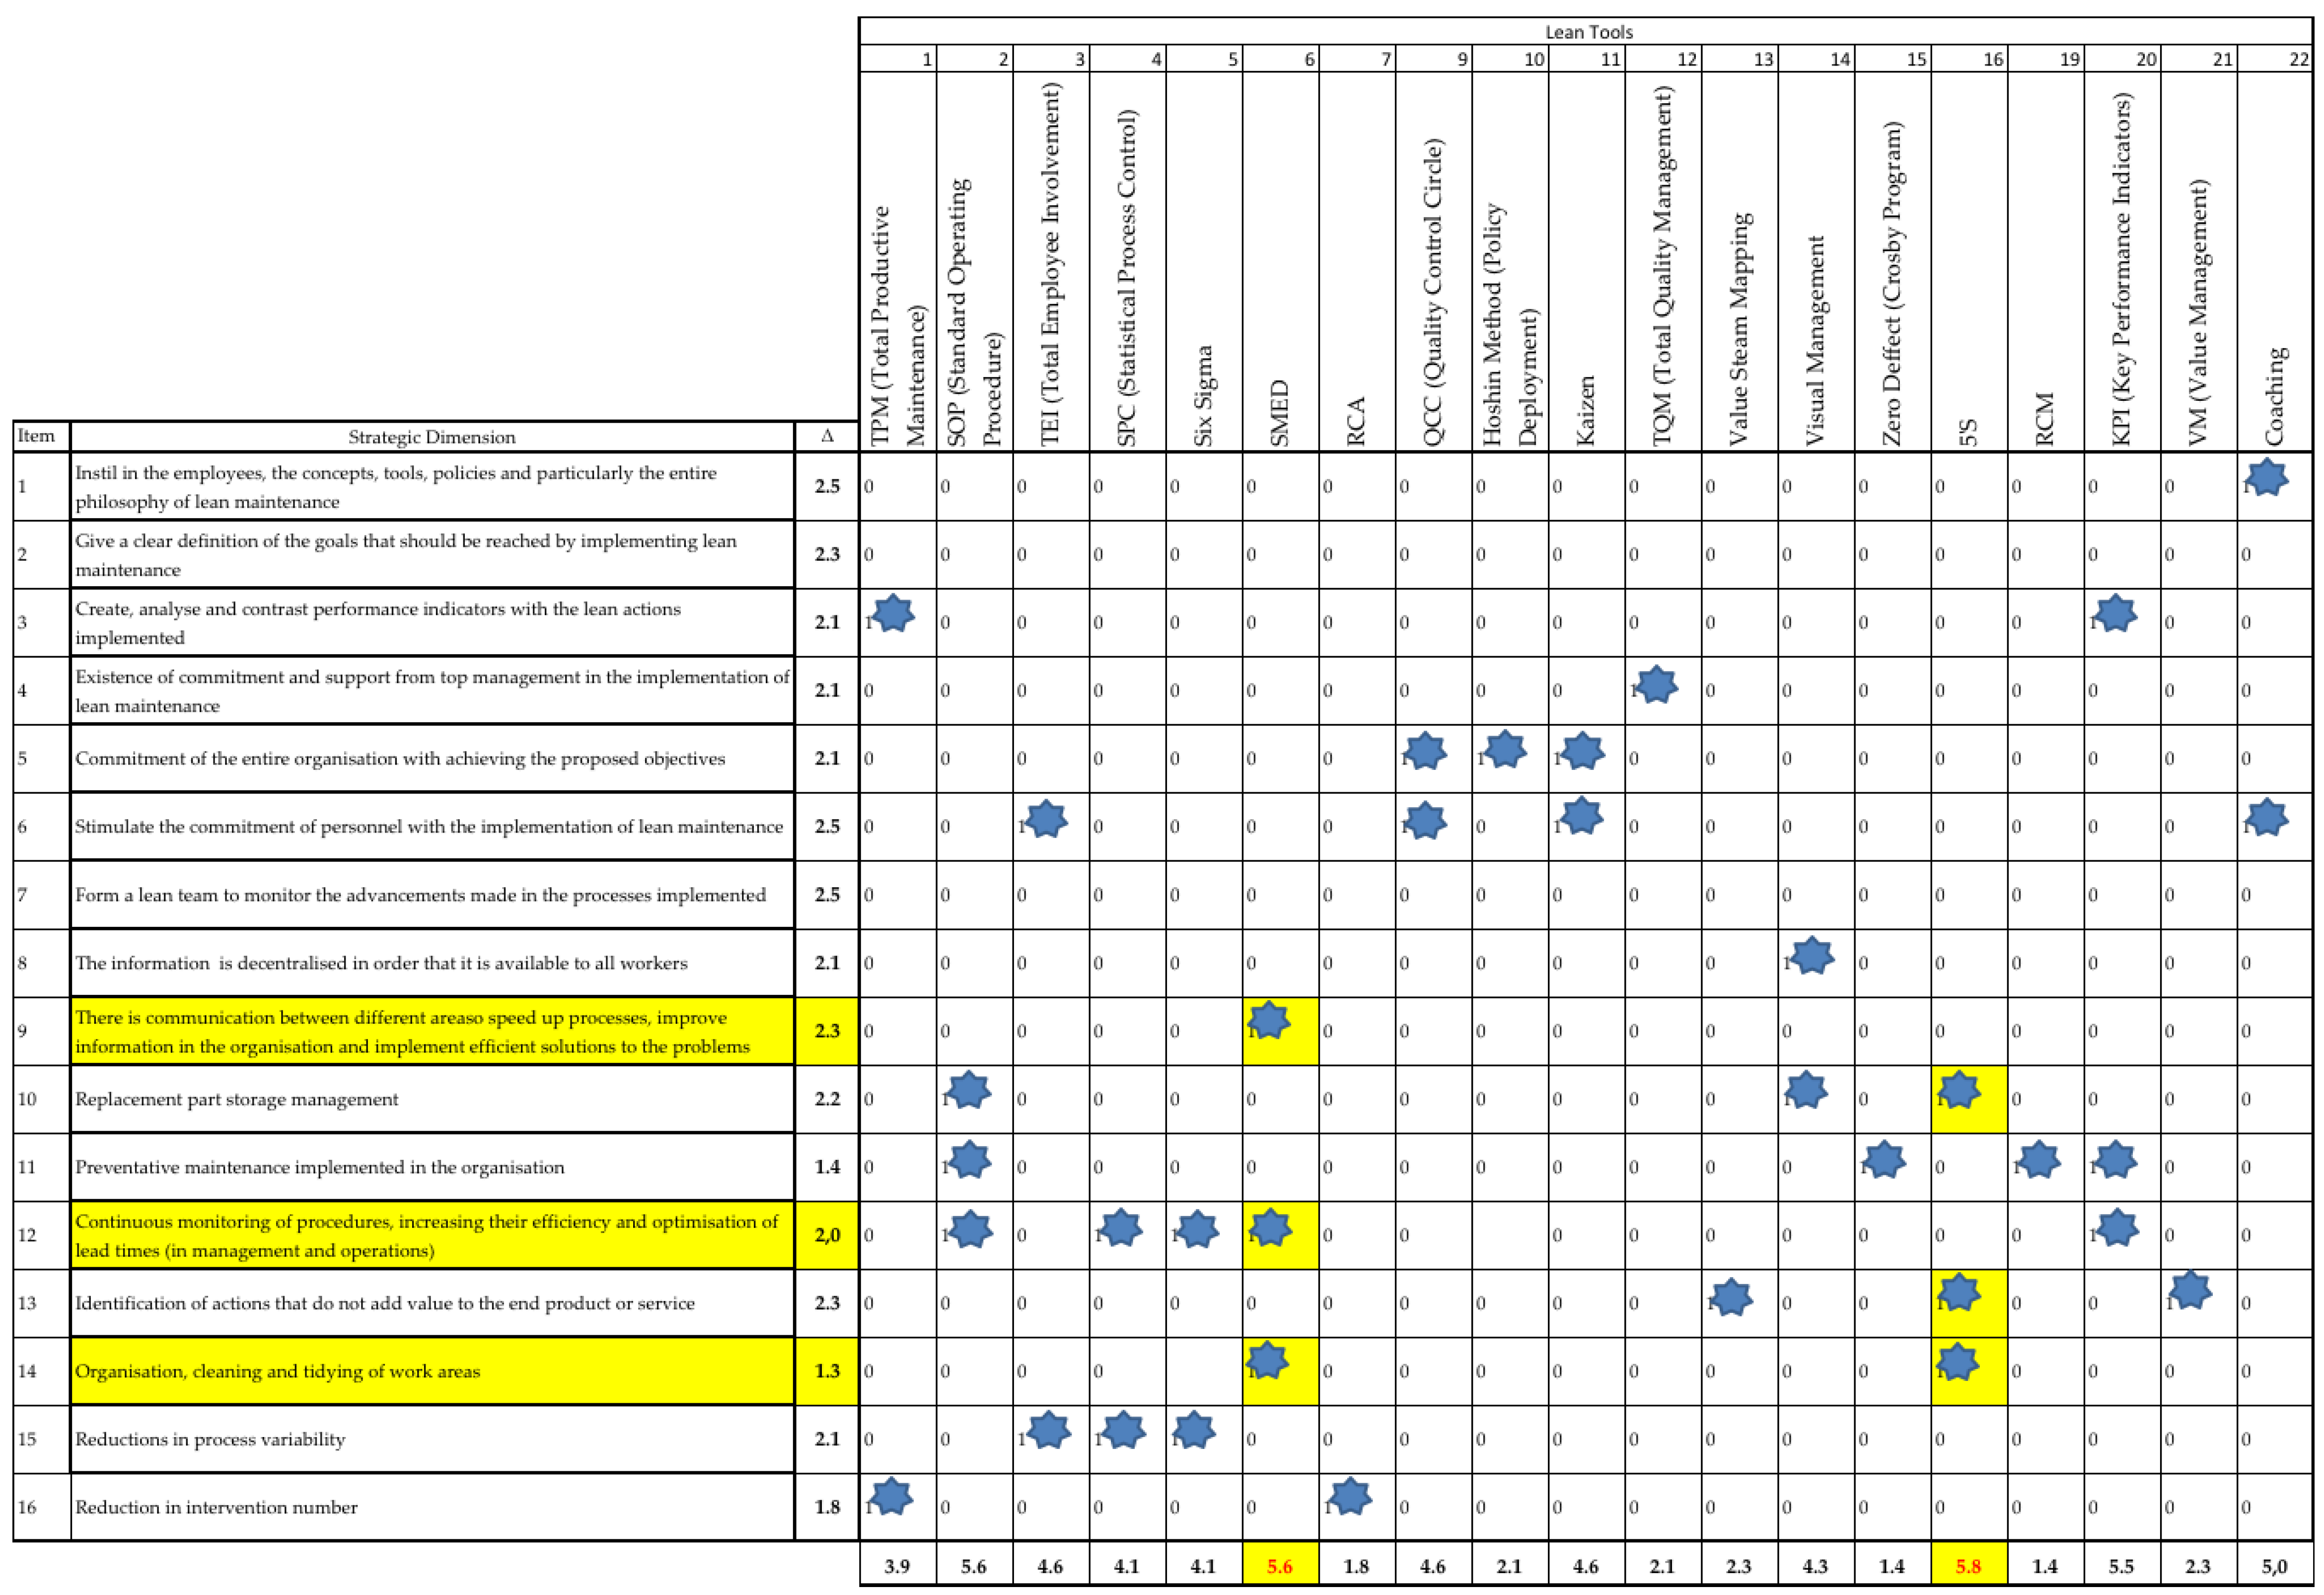
At this point, the present work proposes the use of a previously defined prescription procedure, for the selection of lean tools focused on the maintenance function improvement according to lean thinking. To do so, a “Decision Table”, that relates the objective of each lean tool with one or more strategic dimensions as specified by SAE J4000 was used [38]. Figure 4 indicates which strategic dimension could be benefited by each of the available lean tools.
The aforementioned decision table was prepared with the assistance of a staff of maintenance and lean specialists and it is based on a multicriteria decision technique using a fuzzy AHP approach [38]. The aforementioned Multi Criteria Decision technique was based on the study presented by [39], who listed a series of lean techniques applied to different “contexts”, such as waste elimination and supplier involvement. In general terms, the Fuzzy AHP technique uses a hierarchy where the overall target is located in the top level. To that level, a set of criteria is linked and so on down to the lower level of the hierarchy. At this last level, we will find decision alternatives or candidates to better solve the problem in question.
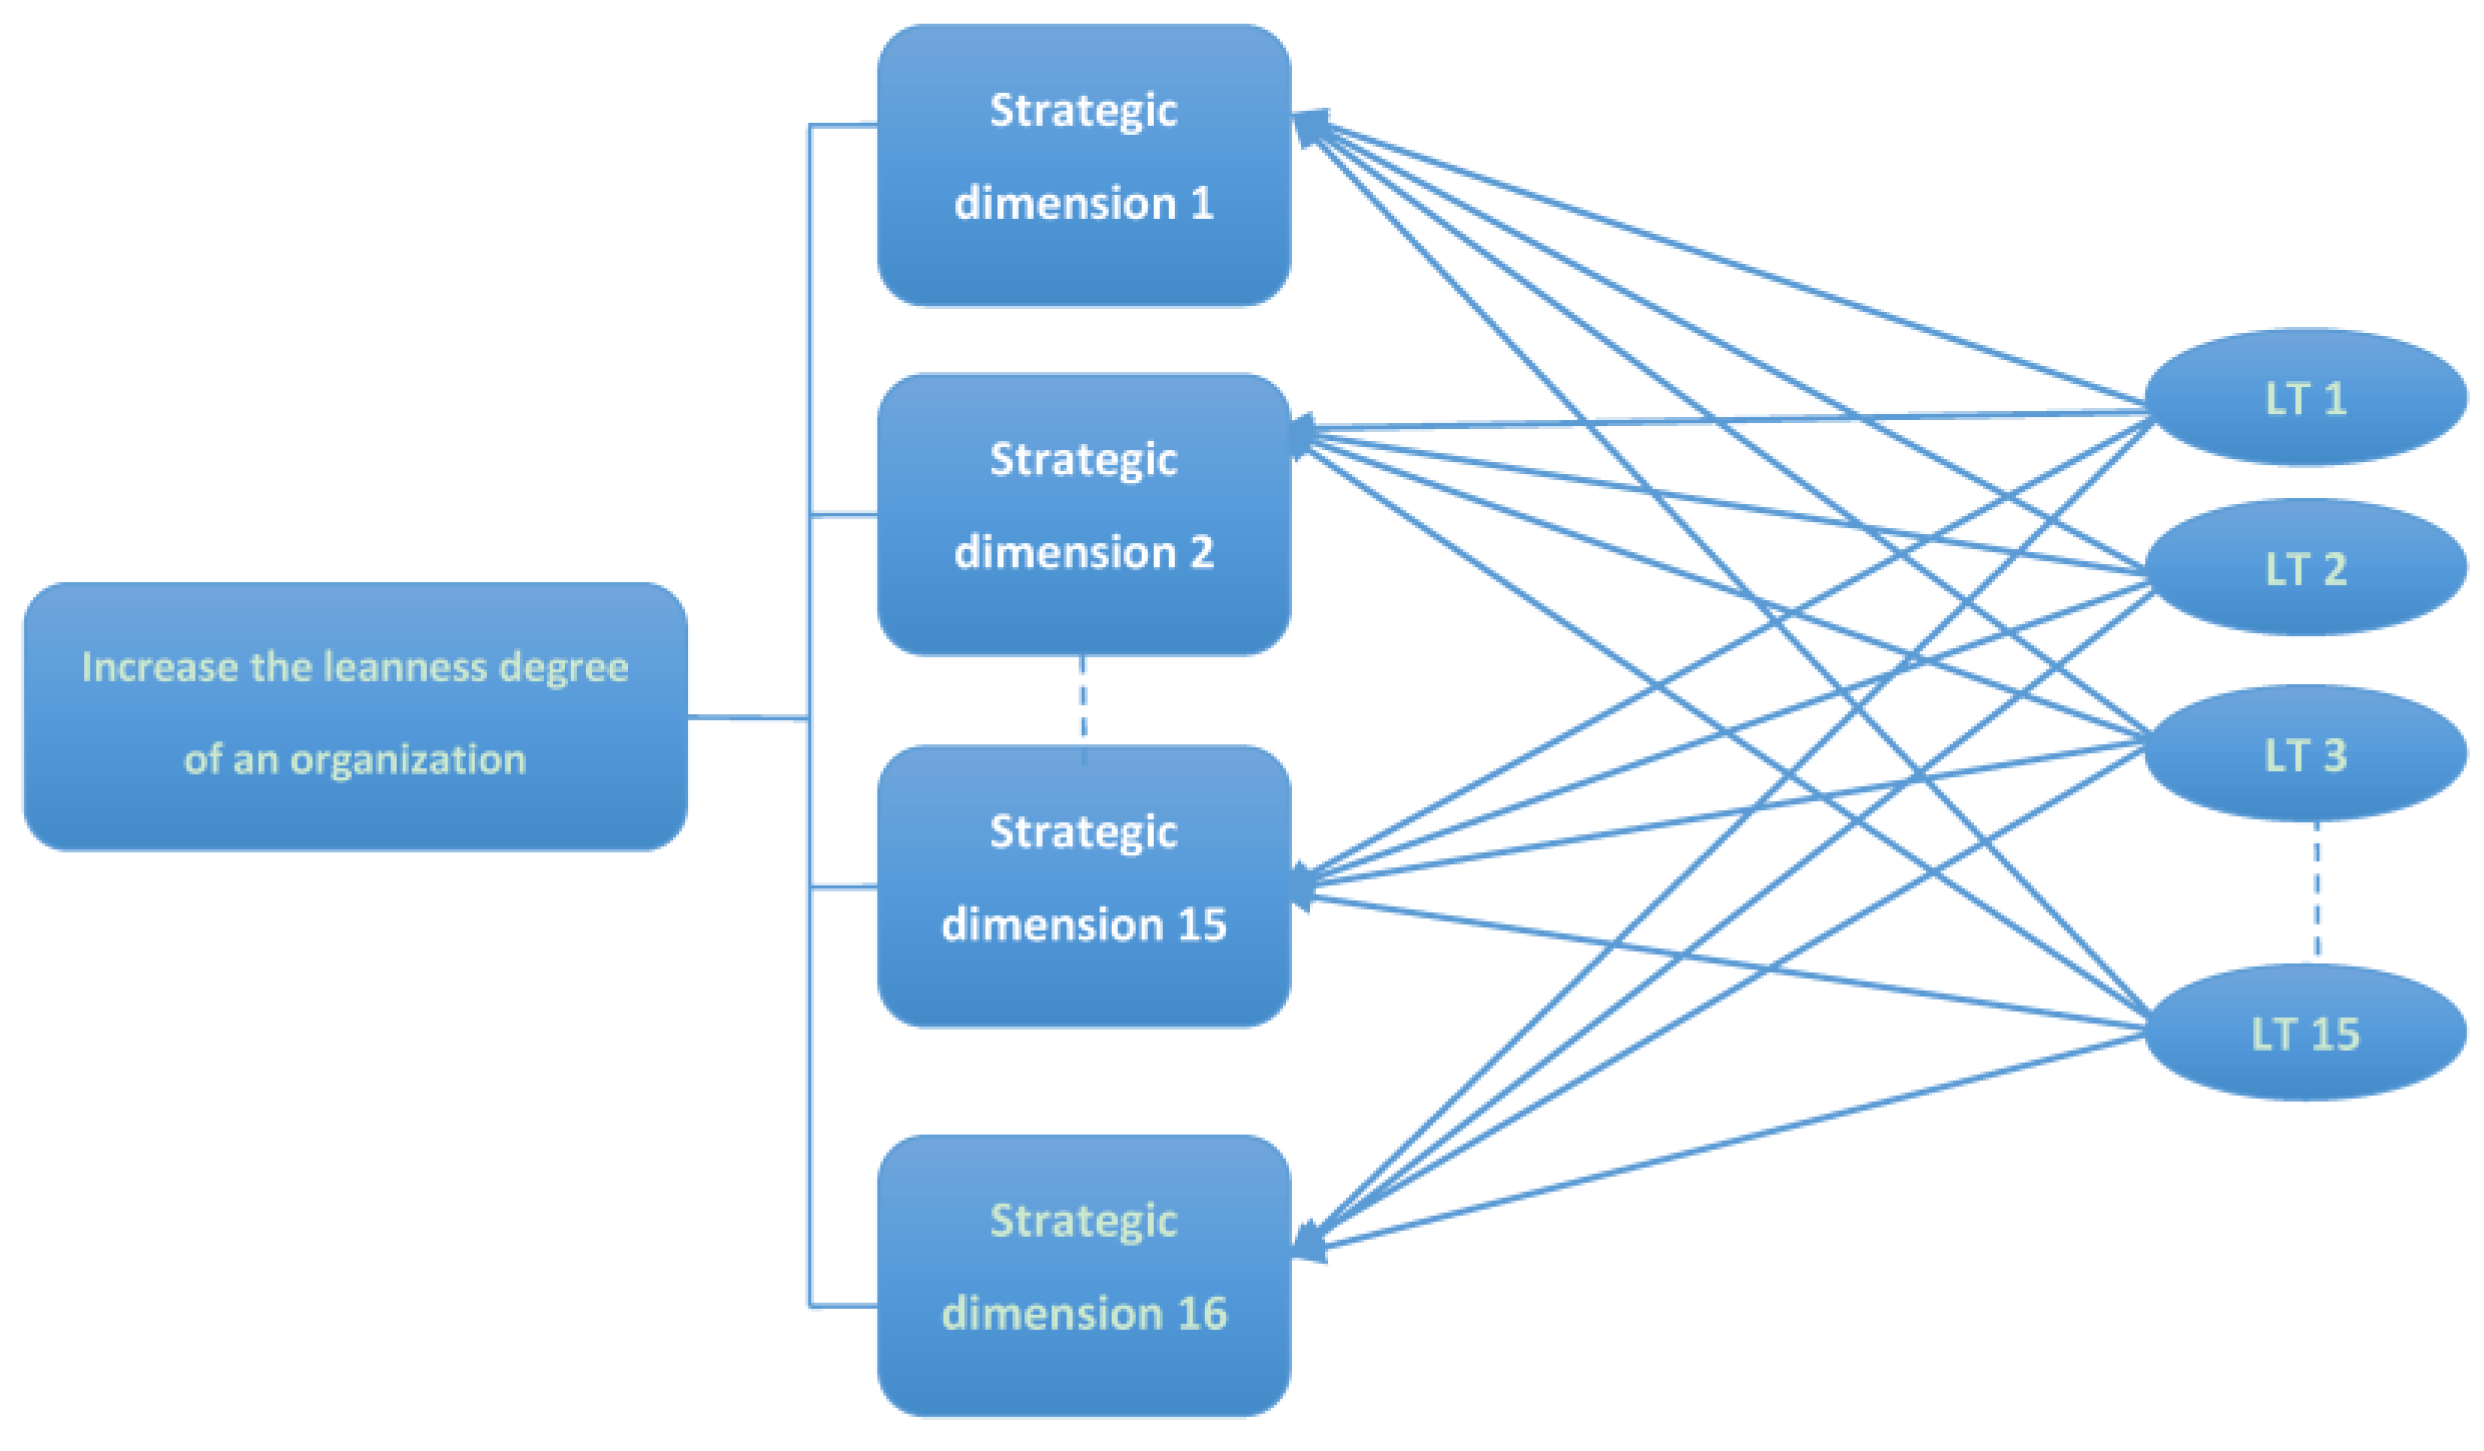
Three levels make up the hierarchy of the evaluation system (Figure 5). The first level was the objective of the problem, that is, selecting the most appropriate lean technique to solve the detected deficiency (low leanness degree) and so, increasing the leanness degree of maintenance function. The 16 strategic dimensions were located on the second level, meanwhile, the third level corresponded to the lean techniques. Those techniques will be prioritized later according to their potential to increase the performance of each one of the strategic dimensions listed in level 2. After that, and using triangular numbers the AHP technique was applied.
Through the utilization of such fuzzy AHP technique, each strategic dimension is linked to a set of lean techniques that best contribute to the improvement of such dimension. By implementing the selected lean tools, it was expected that maintenance organisation could comply with the lean principles. In addition, this could allow a continuous improvement process that leads to higher levels of efficiency and leanness degrees.
Once this phase is completed, it is possible to identify and assess the actions and tools that will move the maintenance organization towards higher leanness degrees. As might be expected, a given lean tool may be appropriate to improve more than one strategic dimension simultaneously. Therefore, to generate a better impact on the results, it is necessary to prioritize the application of the selected techniques and thus to maximize the impact on the leanness degree of the maintenance function. In the next section, we describe the lean tool prioritization process.
4. Lean Tools Prioritization
As it was commented before, the prioritization of lean tools to define an appropriate sequence of implementation is needed. Therefore, the results obtained from the diagnosis phase are used to examine the gap between the performance goals and the averages obtained by each dimension. Since some lean tools could affect positively more than one strategic dimension, in this phase, the lean tools which could improve simultaneously the higher number of strategic dimensions are identified and ranked. Using the decision table, a special selection mechanism was created. That mechanism was set up to guide the selection of lean tools that solve simultaneously the highest number of deficiencies in the maintenance function. In the following we describe briefly the designed prioritization mechanism.
The prioritization mechanism begins by calculating the difference (∆) between the maximum value of all strategic dimensions and that obtained by each one of them. In Figure 6, the three highest values have been highlighted; they correspond to dimensions 9, 12 and 14. They refer to “There is communication between different areas in order to speed up processes, improve information in the organization and implement a more efficient solution to the problems”, “Continuous monitoring of procedures, increasing their efficiency and optimization of lead times (in management and operations)”, and “Organization, cleaning and tidying of work areas”.
Subsequently, each one of the differences (∆) is multiplied by the binary value indicating whether the lean technique is related or not to a given strategic dimension. Since a given tool can impact more than one “Strategic Dimension”, a sum of all the results obtained for each of these techniques will be made. The lean tool with the highest value will be selected first, and so on.
Once the lean tools have been selected and the sequence of application has been set, teams will be formed to create projects to develop and implement the tools in the organization. The lean teams are also in charge of designing controls, along with the leader of the area that is requiring improvement. Those controls will help managers to identify the level of progress in the implementation projects of the selected lean tools. Also, the leanness degree evolution can also be measured through the use of benchmarking.
In the following we present a detailed description of the experiences gathered through the development of two case studies in a thermoelectric power station. The organization of such a thermoelectric plant aimed at optimizing its maintenance processes and, through that, attaining world class performance. Therefore, the main managers decided to implement the lean thinking throughout the totality of maintenance operations.
The last row in Figure 6 shows the weight obtained for each lean tool available. As shown by this row, the 5S tool has a score of 5.8. This score is obtained by the following operation: (1 × 2.2) + (1 × 2.3) + (1 × 1.3). Clearly in this example, 5S is the first lean tool to be selected. The technique which obtained the second highest score corresponds to SMED, with a score equal to 5.6.
5. Case Studies
The diagnostic stage consisted in the application of the questionnaire to twelve people, including the head of maintenance and specialists from each area. All of them fulfilled the prerequisite of working at the company for more than 1 year. Once the completed questionnaires were collected, the average values were calculated. These were then compared to a benchmark thermoelectric power station located in Spain and owned by the same company. The benchmark power station was chosen because of its world-renowned efficiency, its experience with lean projects and its technical similarity to Thermoelectric I. Besides, both power stations have approximately the same size and capacity and, therefore, they are perfectly comparable.
For Thermoelectric I, the lean tool with the highest score is the 5S. This technique can address the highest number of strategic dimensions lacking in “excellence” but does not affect the worst evaluated dimensions. The second highest score is obtained by the Single Minute Exchange of Dies (SMED) and are also linked with three strategic dimensions with low assessments. The table then successively recommends tools that have less impact on the deficiencies identified in the organization. From that results, an action plan was established and approved, considering the application of both aforementioned lean tools, the implementation teams formation was then carried out, and the project times were defined. The main achievements of this method are discussed below.
As it was commented before, after the diagnostic phase, the work teams elaborated the projects selecting the proper lean tools which are most adequate to improve the performance standards in the deficient areas. These projects were established in a simple manner, as a sequence of implementation steps, with a planned completion time to each one of them and the estimated cost of their implementation. It was the responsibility of top management to analyze the cost-benefit ratio that the implementation of the tool will provide. This stage constitutes the final filter that let the implementation activities start. Once the action plan was established and approved, the department head assigned each member his/her responsibilities within the plan, in addition to establishing the completion times. Once the projects were started, each area dedicated to a given project had to publish its monthly results and the compliance level of each parameter were evaluated.
In order to show how the improvement projects are defined and implemented, two pilot lean tools implementation will be discussed in the following paragraphs. The selected lean tools correspond to the 5S technique, which was applied in-between the repair and maintenance shop and the spare parts warehouse. The second one corresponds to the SMED technique that was applied to a preventive and repair interventions in a set of coal pulverizers.
5.1. Project I, 5S
In order to solve some of the shortcomings detected by the organization’s diagnosis, such as the lack of management of spare parts and supplies, the lack of adherence to the procedures in the warehouse and the lack of organization and order in some work areas, 5S was implemented in the facilities mentioned above.
In conjunction with the mechanical engineering area, before beginning the first phase of the 5S implementation, an assessment was made of the shop’s current situation. Then, the team discussed and listed the activities required to complete the implementation and defined a Gantt chart where dates, executors, responsible and percentages of fulfilment were stablished.
Among the most important steps in the implementation of 5S in the shop we can mention: identification and classification of manual tools discarding the unnecessary or unused ones, creation of a 5S map where the localization of each manual tool in the shop is indicated, relocation of the existing equipment according to repair routines, definition of cleaning routines where the main responsible is the corresponding operator, etc. In addition, the visual management implemented allows to know the state in which the machines are. With this, both the operator and the maintainer can know if they are in conditions for their operation or if they require any maintenance action. Through a new distribution of equipment and workstations in the workshop, it was possible to define routes with complete safety, well-defined operating locations, emergency exits and therefore, the optimization of available space.
The case of the spare parts warehouse was totally different from the one of the workshop. Lack of organization, poor distribution of space and lost spare parts have a larger impact on the maintenance and maintainability of equipment. The effort that was made in the warehouse was much greater than in the workshop. For this case, new racks were incorporated in order to be able to achieve an optimal distribution of the used space, classifying materials and spare parts by generating unit, frequency of use, dimensions, and other characteristics. A lot of material was eliminated, such as already used spare parts, obsolete parts and unusable structural material. These were sold, generating about USD 20,000 in extra profits that were used to finance other parts of the projects. It was possible to verify important advances in cleaning, new distribution of physical space, use of visual management for information, recognition of existing inventory, establishment of new management indicators and standardization of logistic procedures inside the warehouse.
As an illustration of the positive effects that the implementation of 5S in the spare parts warehouse caused, let us analyze those used in corrective maintenance interventions at the water treatment plant. Looking at the warehouse activities related to that plant, a reduction of 50% in spare parts search and delivery times was obtained. After the application of the 5S technique MTTR was recalculated as a form to evaluate the effect of the reduction in spare part logistic times maintainability. The mean time in corrective maintenance activities before 5S implementation, 10.36 h, was reduced to 5.18 h. Considering that the cost per man-hour of personnel is USD 15/h, the reduction in costs could be USD 8500 per year (with almost 100 search and delivery operations for spare parts in the year). Table 5 shows the obtained results (Mean Time to Repair and Mean Time between Failures) from that evaluation.
The columns called “Before 5S” show the values of the MMTR and MTBF for different failure modes. The columns called “After 5S” show the results obtained for both parameters after application of the 5S method (assuming a 50% reduction in search times of the correspondent spare parts). The results were used to calculate the new availability of the water treatment plant. Using a simulator, new MTTR and MTBF values were obtained for each piece of equipment in the system. From the simulation study, and as result of the implementation of 5S in the spare part storage system, an increase of 1.17% in plant availability was predicted. This difference in availability can be associated with the generation of additional electricity throughout the year and an increased capacity of 6225.18 MW. The results indicate that by implementing 5S in the spare part storage system, annual profits may increase by approximately USD 300,000. The numbers clearly show the potential impact of implementing this type of tool in the spare parts storage system.
5.2. Project II, SMED and VSM
The overall objective of this project was to demonstrate that by using the Single Minute Exchange of Dies and Value Stream Mapping method, maintenance procedures could be improved, reducing the duration of interventions (corrective and preventive maintenance), positively impacting the availability of a set of Coal Pulverizers.
The application of the SMED method is very useful for maintenance tasks, since it impacts on the maintainability and availability of physical assets, increasing their use and production and improving the efficiency of the entire production system. Figure 7 shows the steps followed to apply the SMED methodology.
The first step of the SMED method, and the most important, is to distinguish between internal and external set-ups, activities and times. Internal set-ups correspond to those operations that are performed only when machines are down, leading to production time losses. External set-ups correspond to operations that could be performed with the machine in operation, i.e., without penalizing production times. The second step of the method consists into the transformation of the internal times into external ones. The third step aims to reduce the total setup time. Indeed, minimization is achieved not only transforming internal times into external ones, but also rationalizing setup activities in terms of reducing the maintenance time, impacting positively in the total available time even more.
The application of this technique was performed in the process of inspection of Coal Sprayers of the thermoelectric plant. This was intended to reduce the time lost in the execution of the activities due to inspections and the replacement of certain of equipment components.
For the development of this project, the following steps were followed: measurement of the times of each activity during the interventions, study of the current conditions of the interventions, interview with mechanical supervisors and photographic record of the activities.
In order to apply this method, all the general operations performed on the pulverizers must be identified. Table 6 shows the operations performed on the sprayers.
Initially, in the current state, all operations performed on the pulverizers are considered internal, since all were performed while the equipment was stopped. Subsequently, operations that could be transformed into external operations were identified, these are:
- Transfer of Tools to the Work Sector.
- Transfer of Parts and Components to the Work Sector.
- Installation of Electrical Plates for Plugs and Lighting to the working area.
Analyzing the results obtained previously, it is possible to conclude the following: 35.45% of the total intervention time is required for pulverizer cooling. It is the one that requires the longer time during the inspection process. At the moment, it was not possible to reduce this time. Considerable time is invested both in preparing tools and in finding those that are not in the corresponding inspection place, and that time varies between each inspection. 26.21% of the total time is wasted in cleaning the coal feeder. Preparation of gaskets requires in average 8.69% of the total time. Considerable time was wasted (and may vary) in treating pinched pins.
After the analysis, it was recommended to convert the following internal tasks into external ones. All tools, materials and spare parts to be used must be transferred to the equipment sector before it is taken out of service. Make available on the shop floor the appropriate gaskets for the coal feeder and pyrite traps. The same with a set of bolts for the carbon feeder gate and pyrite trap. For the reduction of the times of both the internal and external tasks, the following actions were implemented: Have a set of bolts for the coal feeder available on the shop floor. Make available to the maintainers a set of bolts for each gate of the pyrite trap. Search or development of a tool to clean the coal feeder. Training of mechanical labour in aspects related to the SMED method.
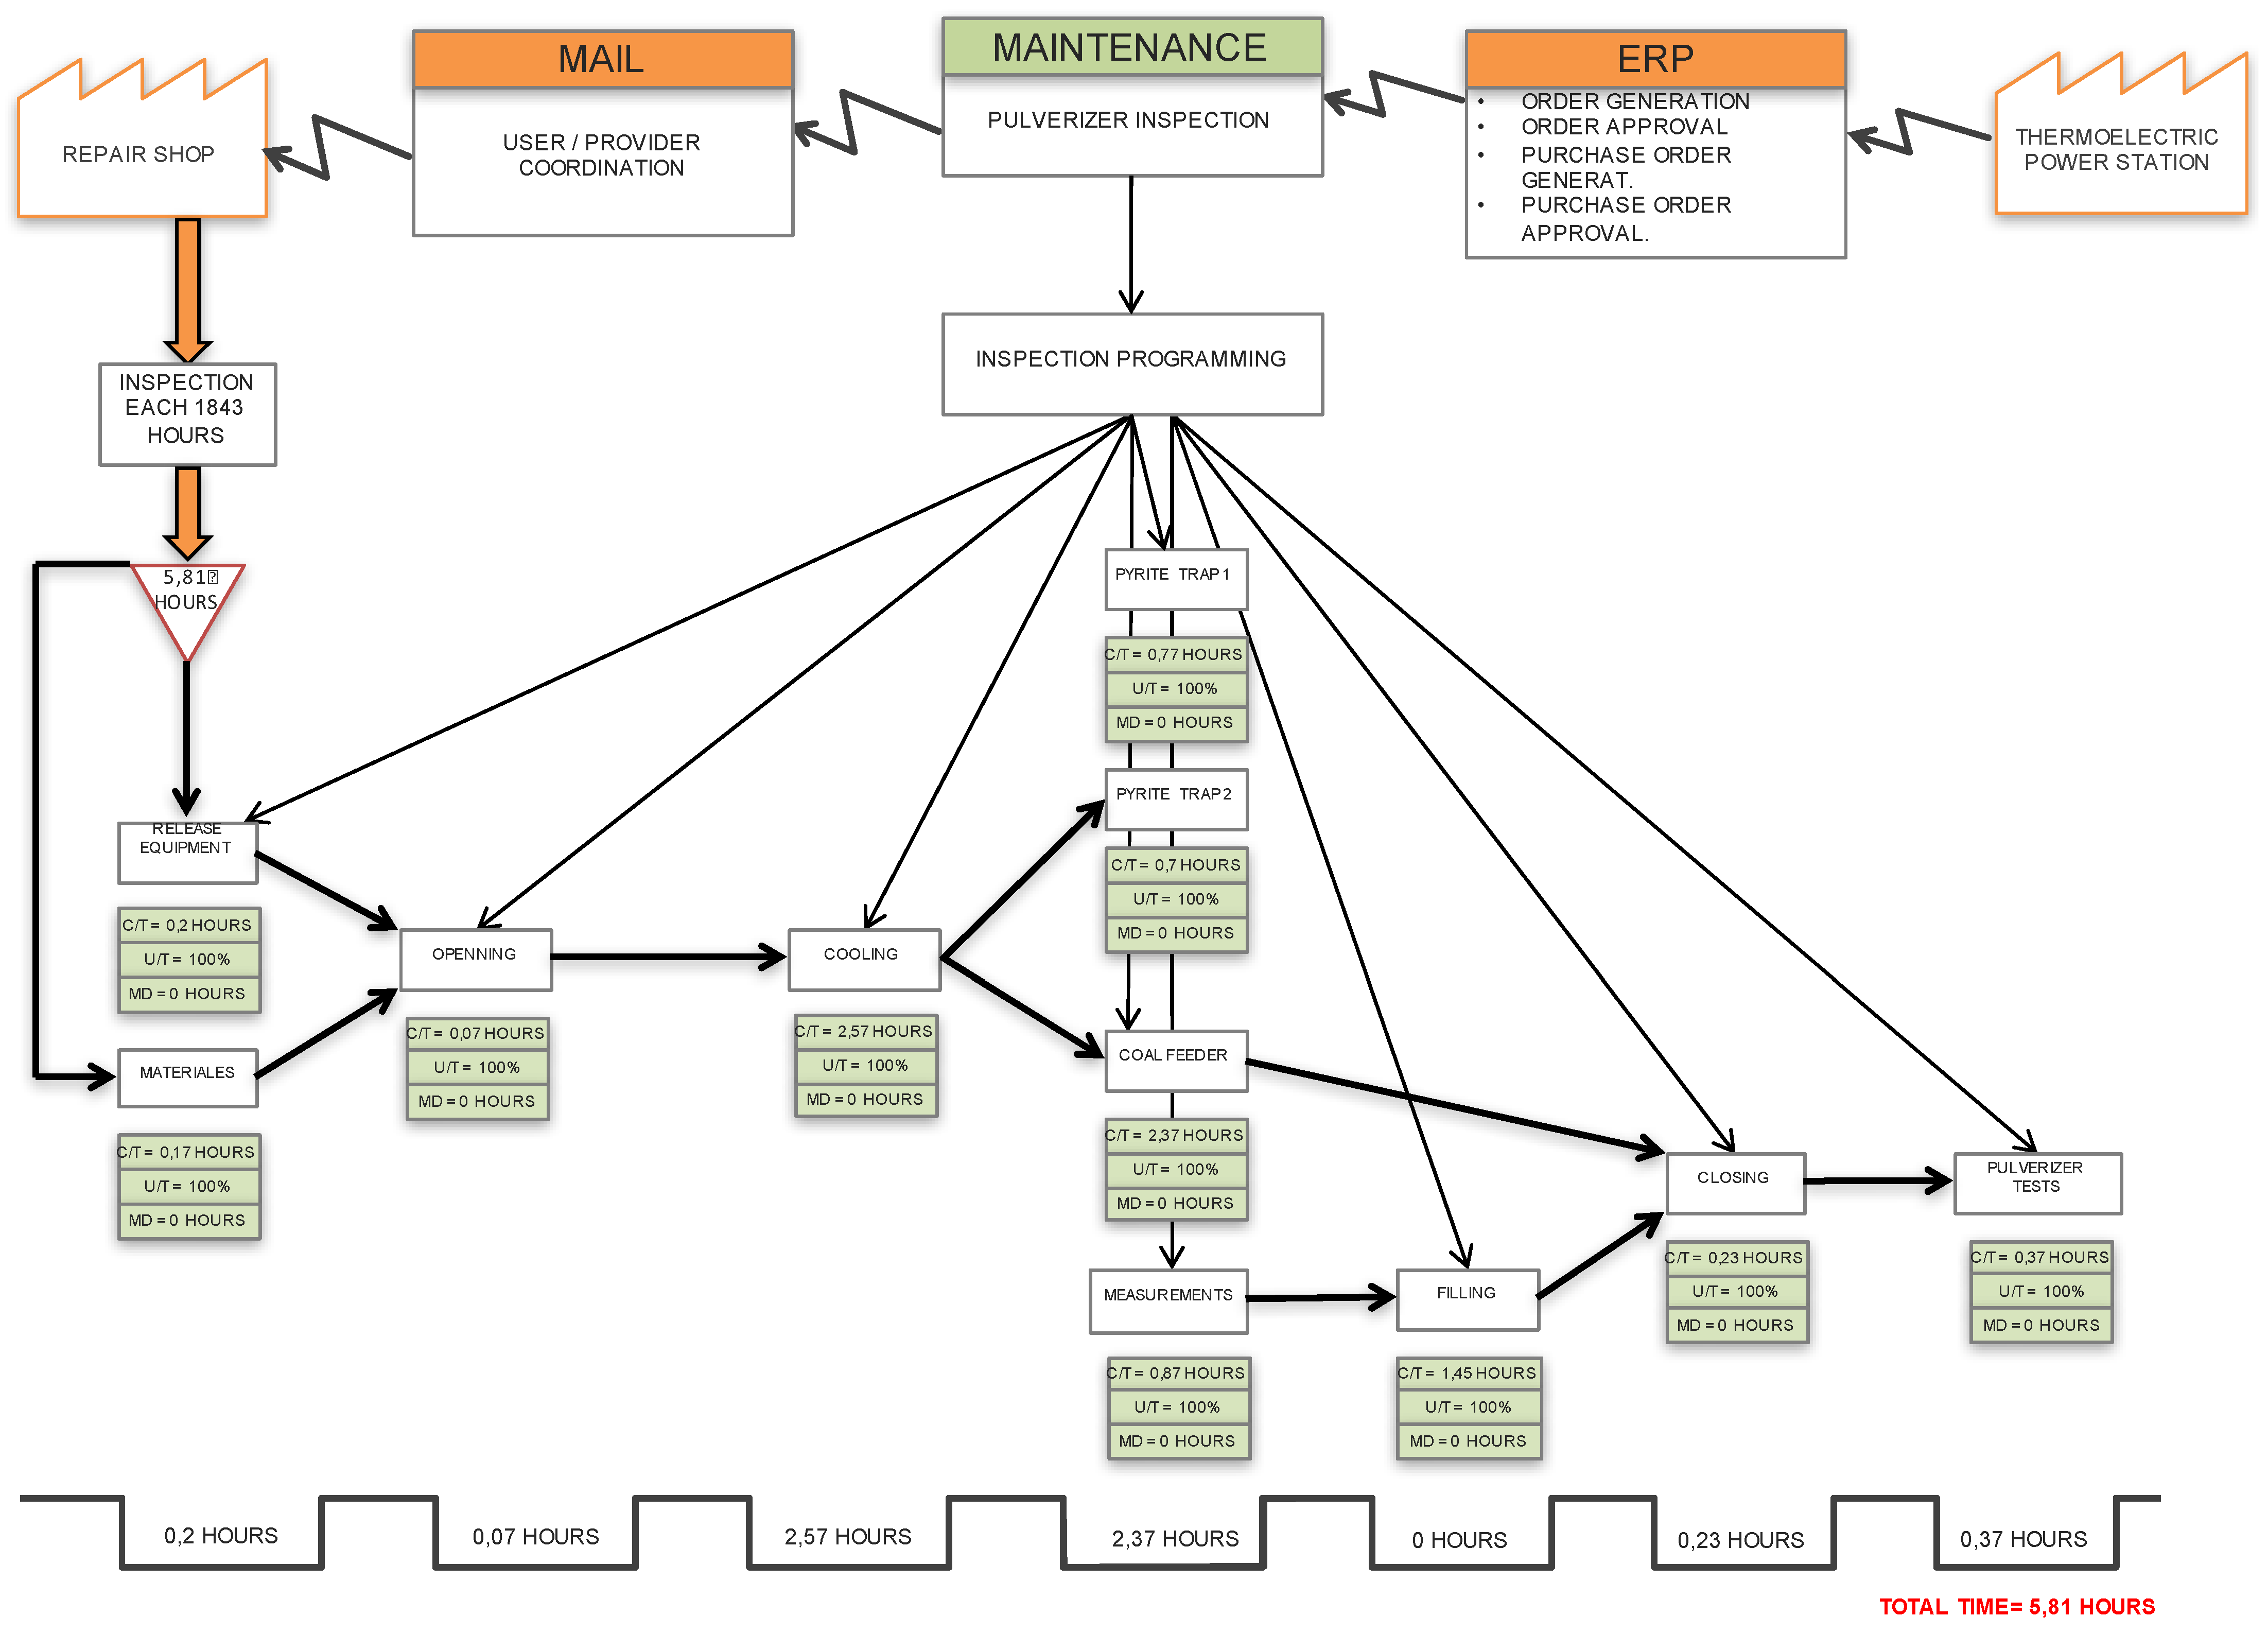
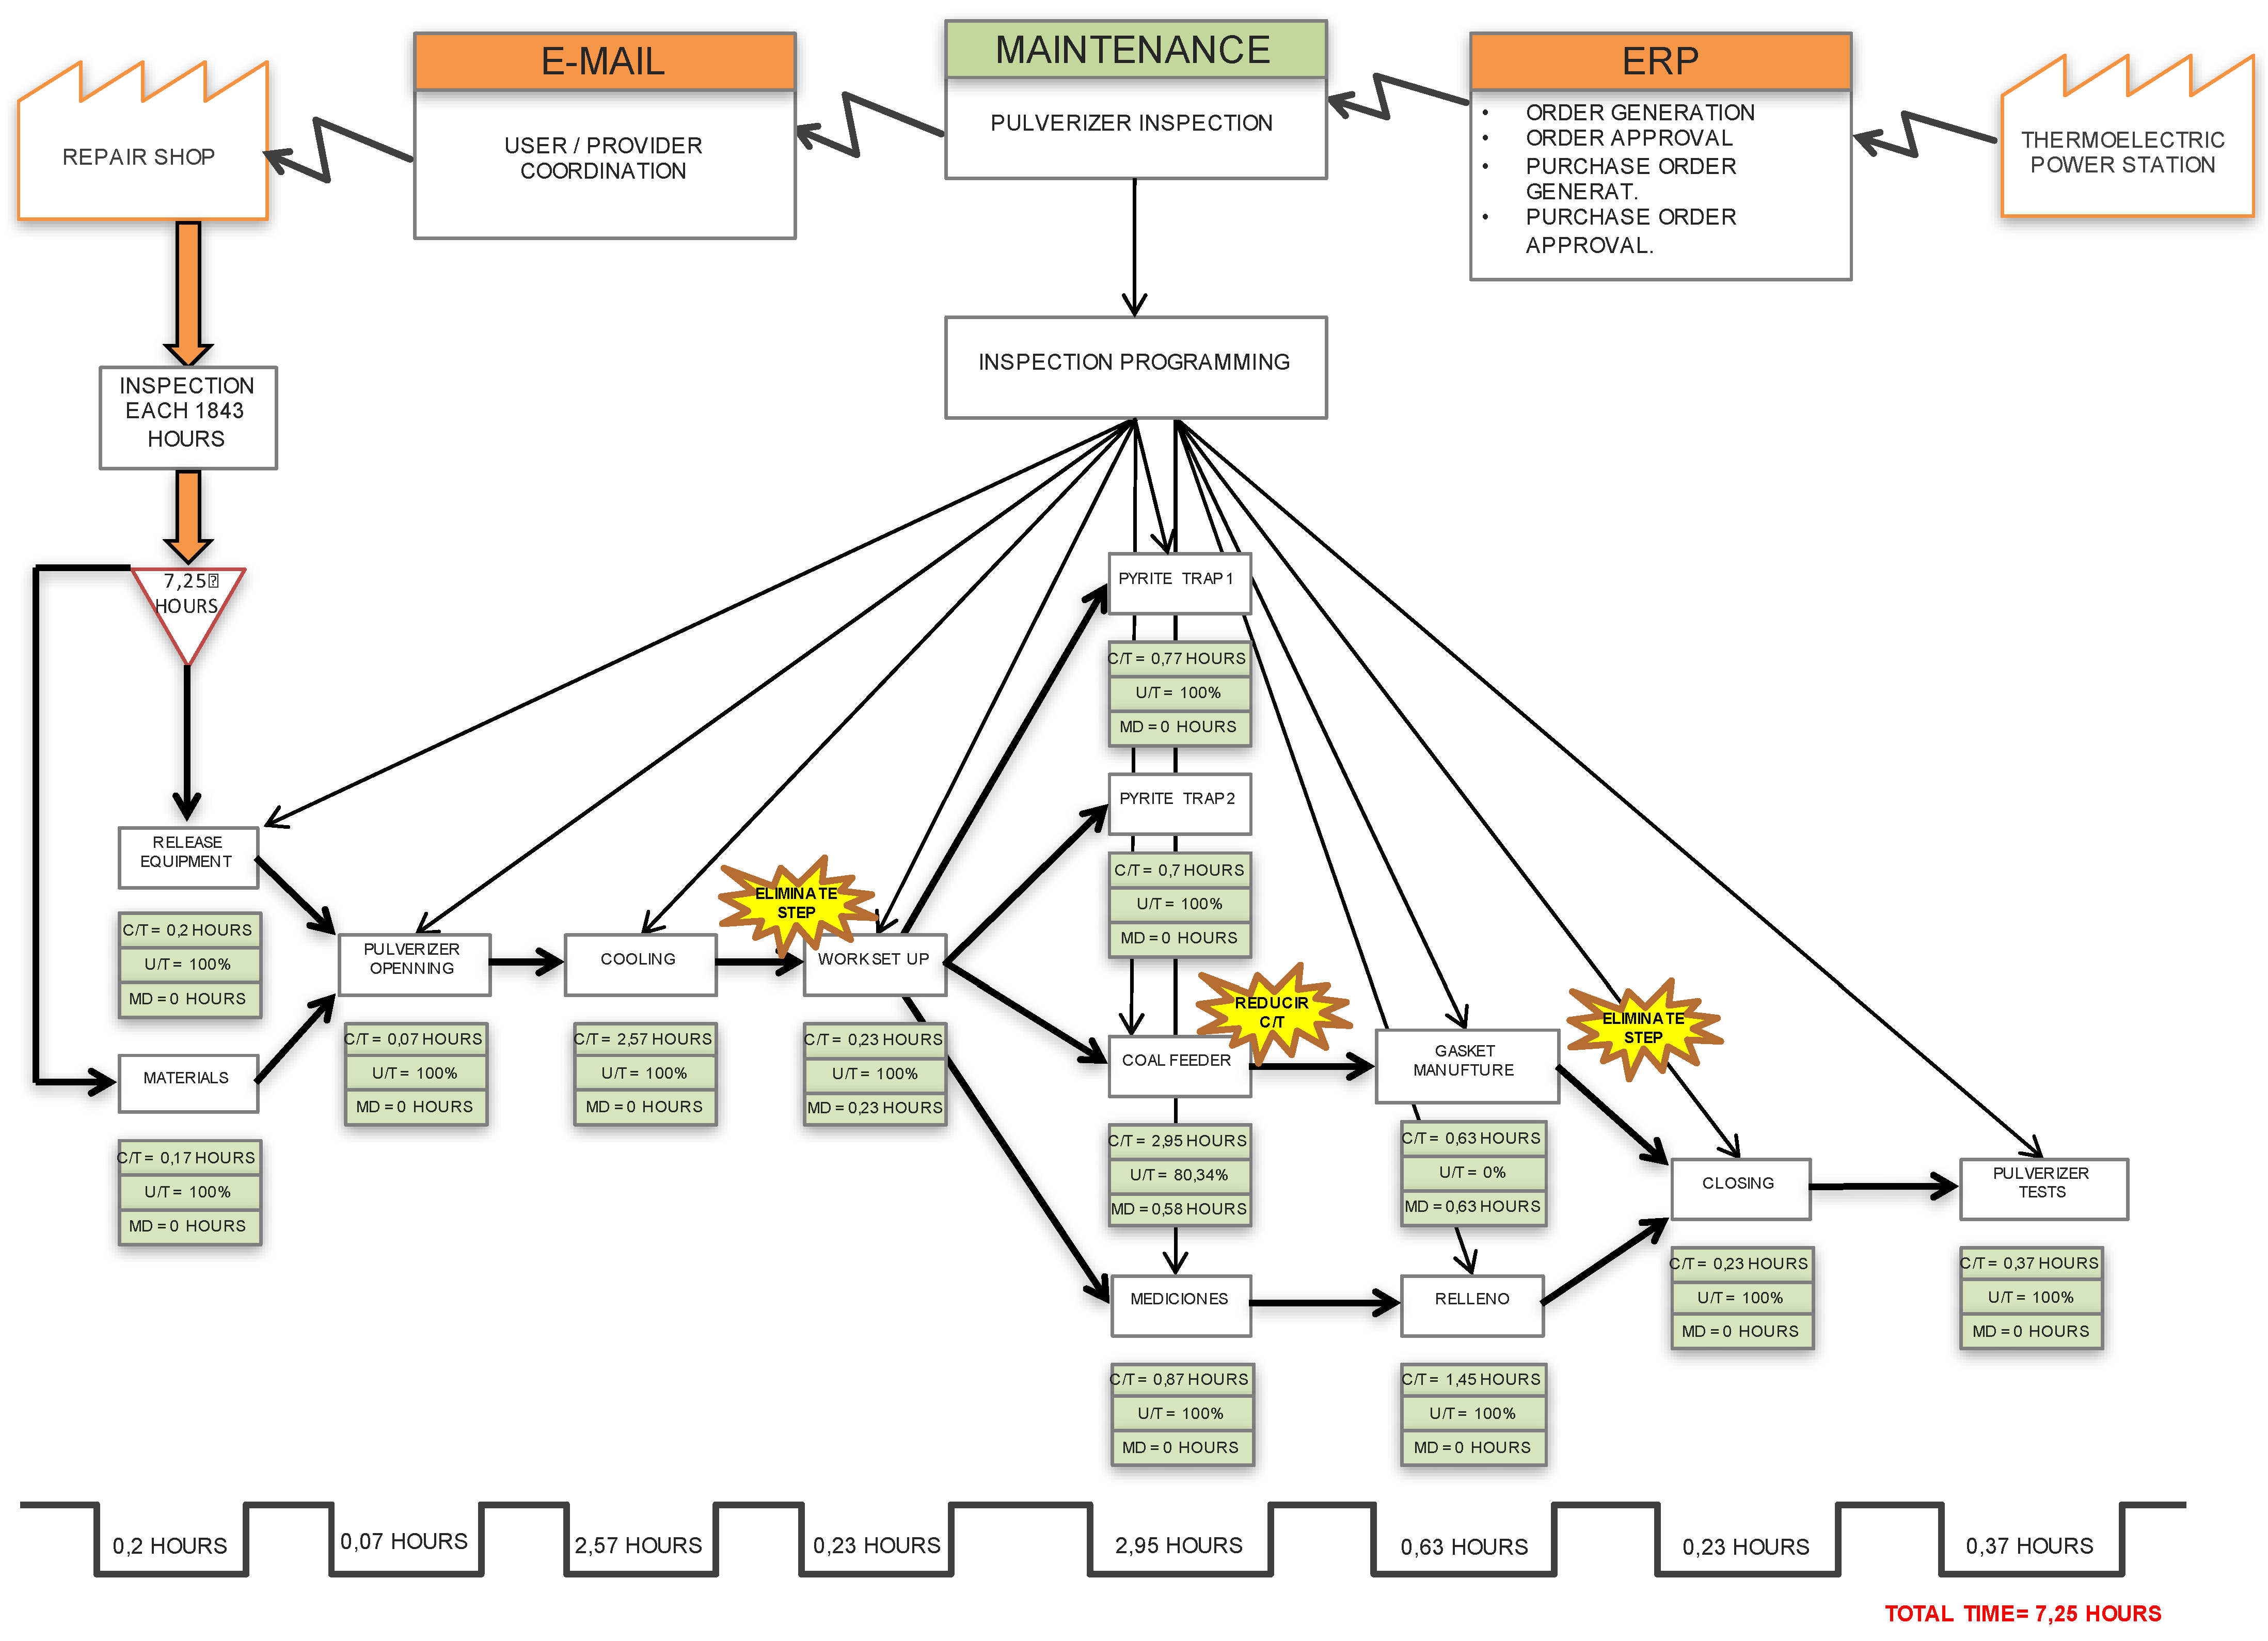
In order to support the analysis mentioned above, the Value Stream Mapping technique was used (Figure 8). These maps specified the current status of interventions in the pulverizers and the state to be implemented, following the modifications already discussed. Figure 9 shows the value stream map of the current state, while Figure 10 specifies the projected situation for the pulverizer interventions. Table 7 shows the times involved if the actual state. According to this proposed situation, savings of 1.44 h of maintenance per intervention are possible, which means that the execution of these activities could last 5.81 h (25% reduction in time).
Projecting the results and reductions obtained in the implementation of the SMED method, as we can see in Table 8, an improvement of 0.078% in the availability. Although this does not appear to be a significant figure, in the following paragraphs we will show its great relevance, since it directly affects the costs involved in stopping a sprayer. To begin the evaluation, the following definitions must be kept in mind.
Loss of generation [MW/h]: This is the loss that occurs when a pulverizers stops. In this case, stopping a sprayer implies a drop of the plant at 40 [MW/h].
Average Marginal Cost [USD/MW]: the cost of producing an additional Mega Watt. This cost is defined by a state regulatory agency. During the period of analysis, it corresponded to USD 151 dollars per Mega Watt.
Cost of inefficiency (Cinef) [USD/h]: This is the cost of stopping a pulverizer an hour. This cost is calculated with the following formula:
Expected annual downtime (Unavailability) [hours]: It is the time that a pulverizer is estimated to be out of service during one year, i.e., is the unavailability of the equipment, and is calculated as follows:
Annual level of value destruction (AVD) [USD]: This is what it is lost annually by having an out-of-service pulverizer. It is calculated as follows:
Global Cost (CG) ([USD]: The cost of the maintenance process is calculated as follows:
where Fa is the actualization factor and corresponds to:
For the power station considered in these case studies, an interest rate of 12%, a horizon of 1 year, a marginal cost of 151 [USD/MW], a zero variable cost and an inspection every 1843 h was estimated. Table 9 shows a table with the original situation and the modified situation, with all its variables, and with the overall cost calculation. After application of the SMED methodology, and considering eight sprayers, it was possible to reduce the overall cost by USD 287,088 in one year.
6. Conclusions
This study presented the application of a framework for increasing the degree of leanness in maintenance organizations. The framework is based on SAE J4000, and it focuses on assessment, diagnostic and prescription of lean tools to achieve higher levels of efficiency in maintenance. The method is described and its main procedures and fundamental elements are discussed.
To validate the application of the proposed method, two case studies were presented. Once the faults in the organization were detected, the method presented above was used to create a proposal for lean operation in the maintenance sector of a thermoelectric power station. In the first case we applied the 5S technique in two sectors: the repair shop and the spare parts warehouse. The results of the case study indicate that by applying 5S to the spare part storage system, the power station could decrease costs and increase profit by approximately USD 300,000.00 per year. The second case study was based on the application of the SMED technique in inspection activities performed on a set of coal pulverizers and the utilization of the Value Stream Mapping to support the analysis and improvement of such activities. Identifying the waste and making the necessary modifications, we were able to save 1.44 h in the maintenance of the sprayer, increasing the availability by 0.078%. The annual global cost could be reduced by USD 287,088 for the eight sprayers that make up the plant.
The aforementioned results were encouraging, but to properly validate the quality of the proposed method other applications are in progress. Certainly, the proposal can be improved, but because of its simplicity and structured characteristics, we believe that its application can be made with ease in any industrial context. Through that simple project an important increment in availability at plant level is possible, with the corresponding economic added value to the organization.
The focus of the lean philosophy, as shown in this study, is the elimination of all types of waste. It is therefore important to develop a strategic thinking for doing “more with less” and to provide a way to create a more agreeable and satisfactory environment through timely feedback regarding efforts to convert waste into value.
Author Contributions
Orlando Durán designed the research; Andrea Capaldo and Paulo Andrés Duran Acevedo wrote or contributed to the writing and editing of the manuscript.
Conflicts of Interest
The authors declare no conflict of interest.
References
- Mazidi, P.; Tohidi, Y.; Sanz-Bobi, M.A. Strategic maintenance scheduling of an offshore wind farm in a deregulated power system. Energies 2017, 10, 313. [Google Scholar] [CrossRef]
- Pliego Marugán, A.; García Márquez, F.P.; Pinar Pérez, J.M. Optimal maintenance management of offshore wind farms. Energies 2016, 9, 46. [Google Scholar] [CrossRef]
- Womack, J.; Jones, D.T. The Machine That Changed the World; Free Press: New York, NY, USA, 2007. [Google Scholar]
- Fan, Y.; Zhang, D. Reliability evaluation of power systems incorporating maintenance policy with partial information. In Proceedings of the International Conference on Probabilistic Methods Applied to Power Systems (PMAPS), Beijing, China, 16–20 October 2016; pp. 1–5. [Google Scholar]
- Junior, M.F.; Bezerra, U.H.; Leite, J.C.; Moya Rodríguez, J.L. Maintenance Tools applied to Electric Generators to Improve Energy Efficiency and Power Quality of Thermoelectric Power Plants. Energies 2017, 10, 1091. [Google Scholar] [CrossRef]
- Fonseca, M.; Holanda, U.; Reyes, T. Maintenance management program through the implementation of predictive tools and TPM as a contribution to improving energy efficiency in power plants. Dyna 2015, 82, 139–149. [Google Scholar] [CrossRef]
- Abeygunawardane, S.K.; Jirutitijaroen, P.; Xu, H. Power system maintenance planning using value function approximation. In Proceedings of the International Conference on Probabilistic Methods Applied to Power Systems (PMAPS), Durham, UK, 7–10 July 2014; pp. 1–7. [Google Scholar]
- Bhangu, N.S.; Pahuja, G.L.; Singh, R. Application of Fault Tree Analysis for Evaluating Reliability and Risk Assessment of a Thermal Power Plant. Energy Sources Part A Recover. Util. Environ. Effects 2015, 37, 2004–2012. [Google Scholar] [CrossRef]
- Dos Santos, E.C.; Do Nascimento, M.A.R. Method of determination of critical components of power generation systems. In Proceedings of the COBEM 2009 20th International Congress of Mechanical Engineering, Gramado, Brazil, 15–20 November 2009. [Google Scholar]
- Guevara, F.J.C.; De Souza, G.F.M. RCM application for availability improvement of gas turbines used in combined cycle power stations. IEEE Latin Am. Trans. 2008, 6. [Google Scholar] [CrossRef]
- Zeravcic, V.S.; Bakic, G.; Djukic, M.; Markovic, D.; Rajicic, B. Contemporary maintenance management of power plant life exhaustion components. Tech. Technol. Educ. Manag. 2010, 5, 431–436. [Google Scholar]
- Bhangu, N.S.; Pahuja, G.L.; Singh, R. Enhancing reliability of thermal power plant by implementing RCM policy and developing reliability prediction model: A case study. Int. J. Syst. Assur. Eng. Manag. 2016, 1–14. [Google Scholar] [CrossRef]
- Botamede, B.; Leucas, L.; Pelegrini, M. Maintenance Management and Case Studies in the Luís Carlos Prestes Thermoelectric Power Plant. In Probabilistic Prognostics and Health Management of Energy Systems; Springer International Publishing: Cham, Switzerland, 2017; pp. 263–269. [Google Scholar]
- Hsieh, H.N.; Chen, J.F.; Do, Q.H. Applying TRIZ and Fuzzy AHP Based on Lean Production to Develop an Innovative Design of a New Shape for Machine Tools. Information 2015, 6, 89–110. [Google Scholar] [CrossRef]
- Society for Automotive Engineers. SAE J4000—Identification and Measurement of Best Practice in Implementation of Lean Operation; Society for Automotive Engineers: Warrendale, PA, USA, 1999. [Google Scholar]
- Society for Automotive Engineers. SAE J4001—Implementation of Lean Operation User Manual; Society for Automotive Engineers: Warrendale, PA, USA, 1999. [Google Scholar]
- Dora, M.; Kumar, M.; Gellynck, X. Determinants and Barriers to Lean Implementation in Food-Processing SMEs—A Multiple Case Analysis. Prod. Plan. Control 2016, 27, 1–23. [Google Scholar] [CrossRef]
- Darlington, J.; Francis, M. Pauline Found, and Andrew Thomas. Targeting Lean Process Improvement Projects for Maximum Financial Impact. Prod. Plan. Control 2015, 27, 114–132. [Google Scholar] [CrossRef]
- Elnadi, M.; Shehab, E. A Conceptual Model for Evaluating Product-Service Systems Leanness in UK Manufacturing Companies. Procedia CIRP 2014, 22, 281–286. [Google Scholar] [CrossRef]
- Wong, W.P.; Ignatius, J.; Soh, K.L. What Is the Leanness Level of Your Organisation in Lean Transformation Implementation? An Integrated Lean Index Using ANP Approach. Prod. Plan. Control 2014, 25, 273–287. [Google Scholar] [CrossRef]
- Díaz-Reza, J.R.; García-Alcaraz, J.L.; Martínez-Loya, V.; Blanco-Fernández, J.; Jiménez-Macías, E.; Avelar-Sosa, L. The Effect of SMED on Benefits Gained in Maquiladora Industry. Sustainability 2016, 8, 1237. [Google Scholar] [CrossRef]
- Bayou, M.E.; De Korvin, A. Measuring the Leanness of Manufacturing Systems—A Case Study of Ford Motor Company and General Motors. J. Eng. Technol. Manag. 2008, 25, 287–304. [Google Scholar] [CrossRef]
- Vinodh, S.; Chintha, S.K. Leanness Assessment Using Multi-Grade Fuzzy Approach. Int. J. Prod. Res. 2011, 49, 431–445. [Google Scholar] [CrossRef]
- Vimal, K.E.K.; Vinodh, S. Leanness Evaluation Using IF—THEN Rules. Int. J. Adv. Manuf. Technol. 2012, 63, 407–413. [Google Scholar] [CrossRef]
- Vinodh, S.; Prakash, N.H.; Selvan, K.E. Evaluation of Leanness Using Fuzzy Association Rules Mining. Int. J. Adv. Manuf. Technol. 2011, 57, 343–353. [Google Scholar] [CrossRef]
- Pavnaskar, S.J.; Gershenson, J.K.; Jambekar, A.B. Classification Scheme for Lean Manufacturing Tools. Int. J. Prod. Res. 2003, 41, 3075–3090. [Google Scholar] [CrossRef]
- Hu, G.; Wang, L.; Fetch, S.; Bidanda, B. A Multiobjective Model for Project Portfolio Selection to Implement Lean and Six Sigma Concepts. Int. J. Prod. Res. 2008, 46, 6611–6625. [Google Scholar] [CrossRef]
- Anand, G.; Kodali, R. Development of a Framework for Lean Manufacturing Systems. Int. J. Serv. Oper. Manag. 2009, 5, 687–716. [Google Scholar] [CrossRef]
- Amin, M.A.; Karim, M.A. A Systematic Approach to Evaluate the Process Improvement in Lean Manufacturing Organizations. In Sustainable Manufacturing: Shaping Global Value Creation: Proceedings of the the 9th Global Conference on Sustainable Manufacturing; Seliger, G., Ed.; Springer: Berlin/Heidelberg, Germany, 2011; pp. 65–70. [Google Scholar]
- Karim, A.; Arif-Uz-Zaman, K. A Methodology for Effective Implementation of Lean Strategies and Its Performance Evaluation in Manufacturing Organizations. Bus. Process Manag. J. 2013, 19, 169–196. [Google Scholar] [CrossRef]
- Anvari, A.; Zulkifli, N.; Sorooshian, S.; Boyerhassani, O. An integrated design methodology based on the use of group AHP-DEA approach for measuring lean tools efficiency with undesirable output. Int. J. Adv. Manuf. Technol. 2014, 70, 2169–2186. [Google Scholar] [CrossRef]
- Anvari, A.; Zulkifli, N.; Yusuff, R.M. A dynamic modeling to measure lean performance within lean attributes. Int. J. Adv. Manuf. Technol. 2013, 66, 663–677. [Google Scholar] [CrossRef]
- Anvari, A.; Zulkifli, N.; Arghish, O. Application of a modified VIKOR method for decision-making problems in lean tool selection. Int. J. Adv. Manuf. Technol. 2014, 71, 829–841. [Google Scholar] [CrossRef]
- Mostafa, S. A Lean Framework for Maintenance Decisions (Master of Industrial Engineering); Mansoura University: Mansoura, Egypt, 2011. [Google Scholar]
- Tendayi, T.G.; Fourie, C.J. The combined AHP-QFD approach and its use in lean maintenance. In Proceedings of the 25th Annual Salle Conference, Spier, South Africa, 9–11 July 2013. [Google Scholar]
- Irajpour, A.; Fallahian-Najafabadi, A.; Mahbod, M.A.; Karimi, M. A Framework to Determine the Effectiveness of Maintenance Strategies Lean Thinking Approach. Math. Probl. Eng. 2014. [Google Scholar] [CrossRef]
- Mostafa, S.; Lee, S.H.; Dumrak, J.; Chileshe, N.; Soltan, H. Lean Thinking for a Maintenance Process. Prod. Manuf. Res. 2015, 3, 236–272. [Google Scholar] [CrossRef]
- Duran, O.; Duran-Acevedo, P. Lean maintenance oriented tools selection using fuzzy analitic hierarchy process (AHP). Dyna Manag. 2017, 5, 16. [Google Scholar] [CrossRef]
- Panwar, A.; Nepal, B.P.; Jain, R.; Rathore, A.P.S. On the Adoption of Lean Manufacturing Principles in Process Industries. Prod. Plan. Control 2015, 26, 564–587. [Google Scholar] [CrossRef]
Figure 1.
Proposed procedure.
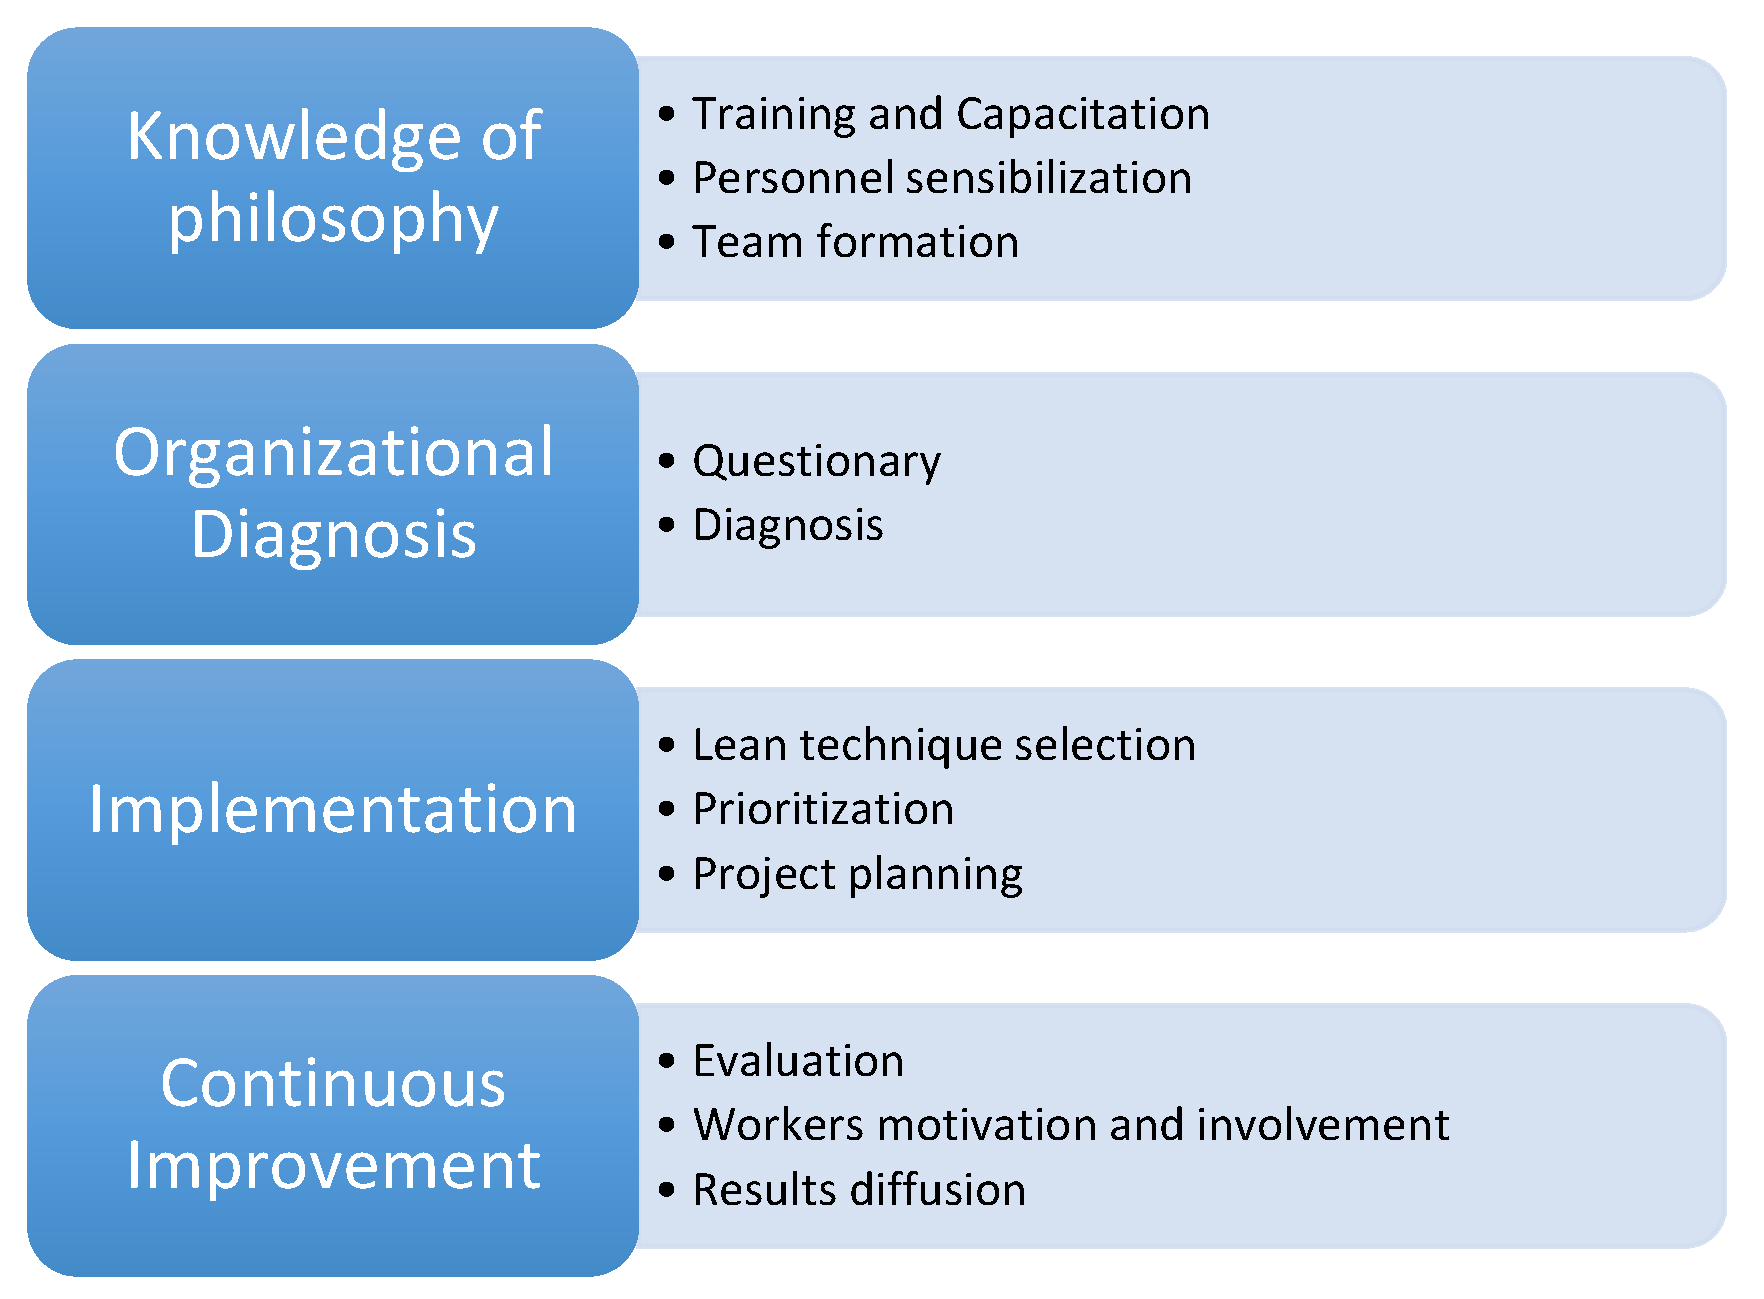
Figure 2.
Effects of lean principles in maintenance functions.
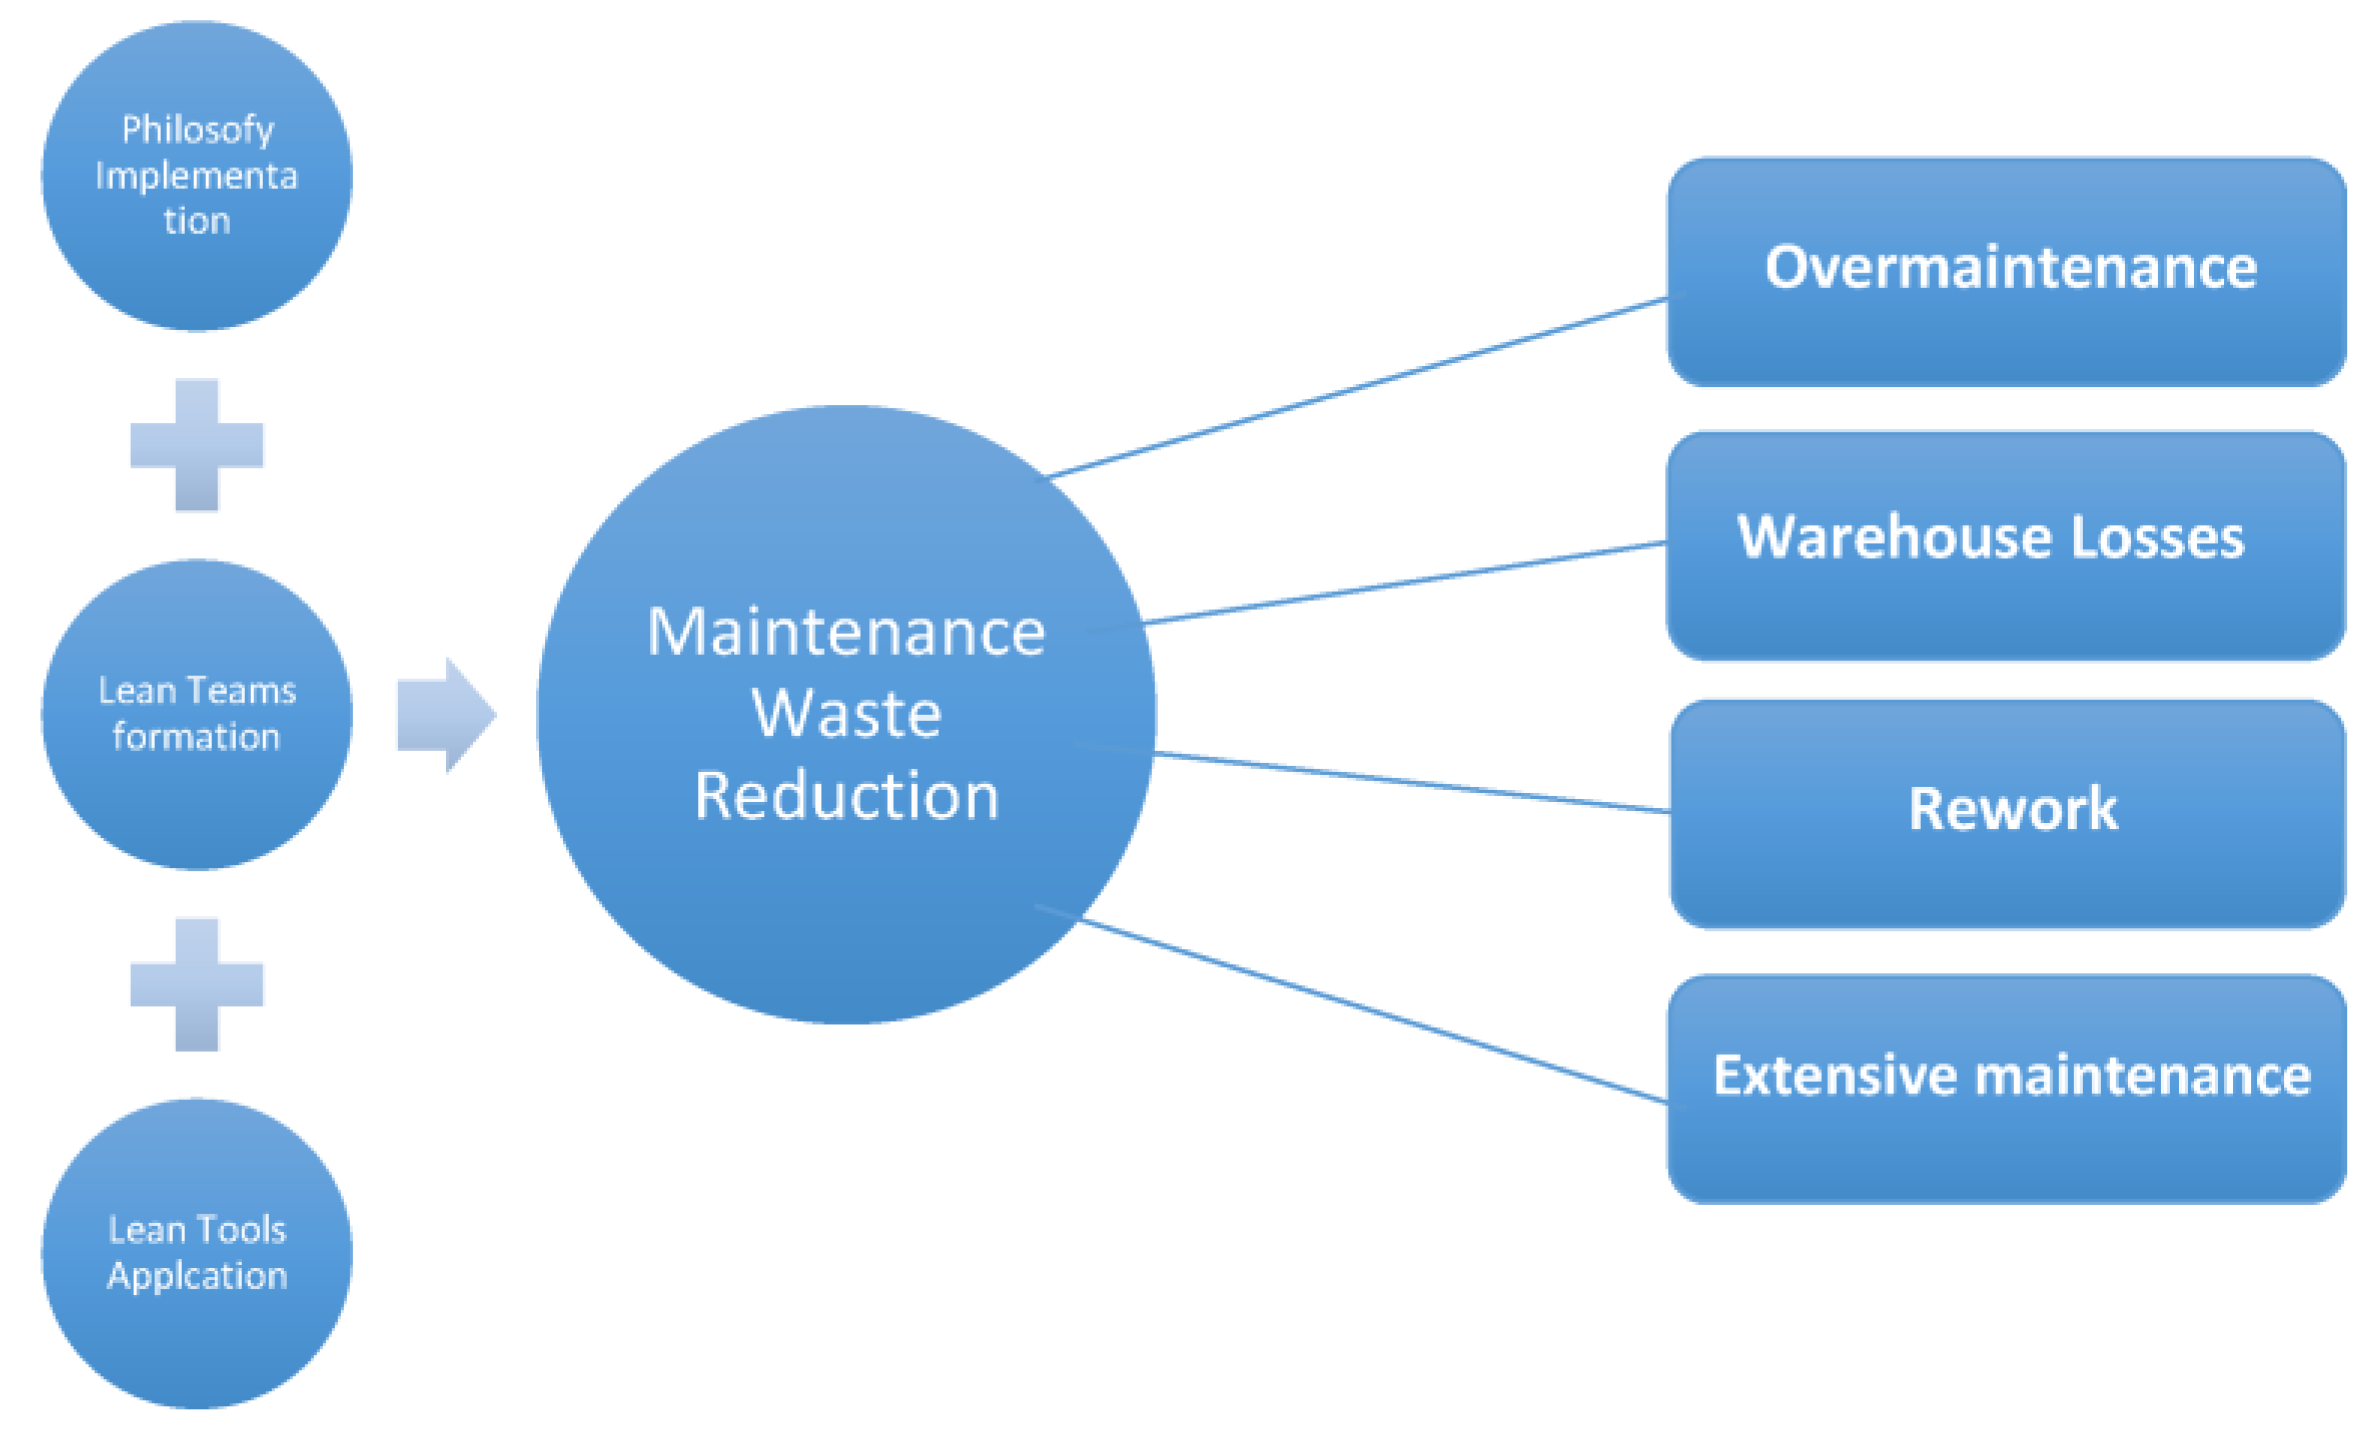
Figure 3.
Lean performance comparison between Thermoelectric Plant I and its benchmark.
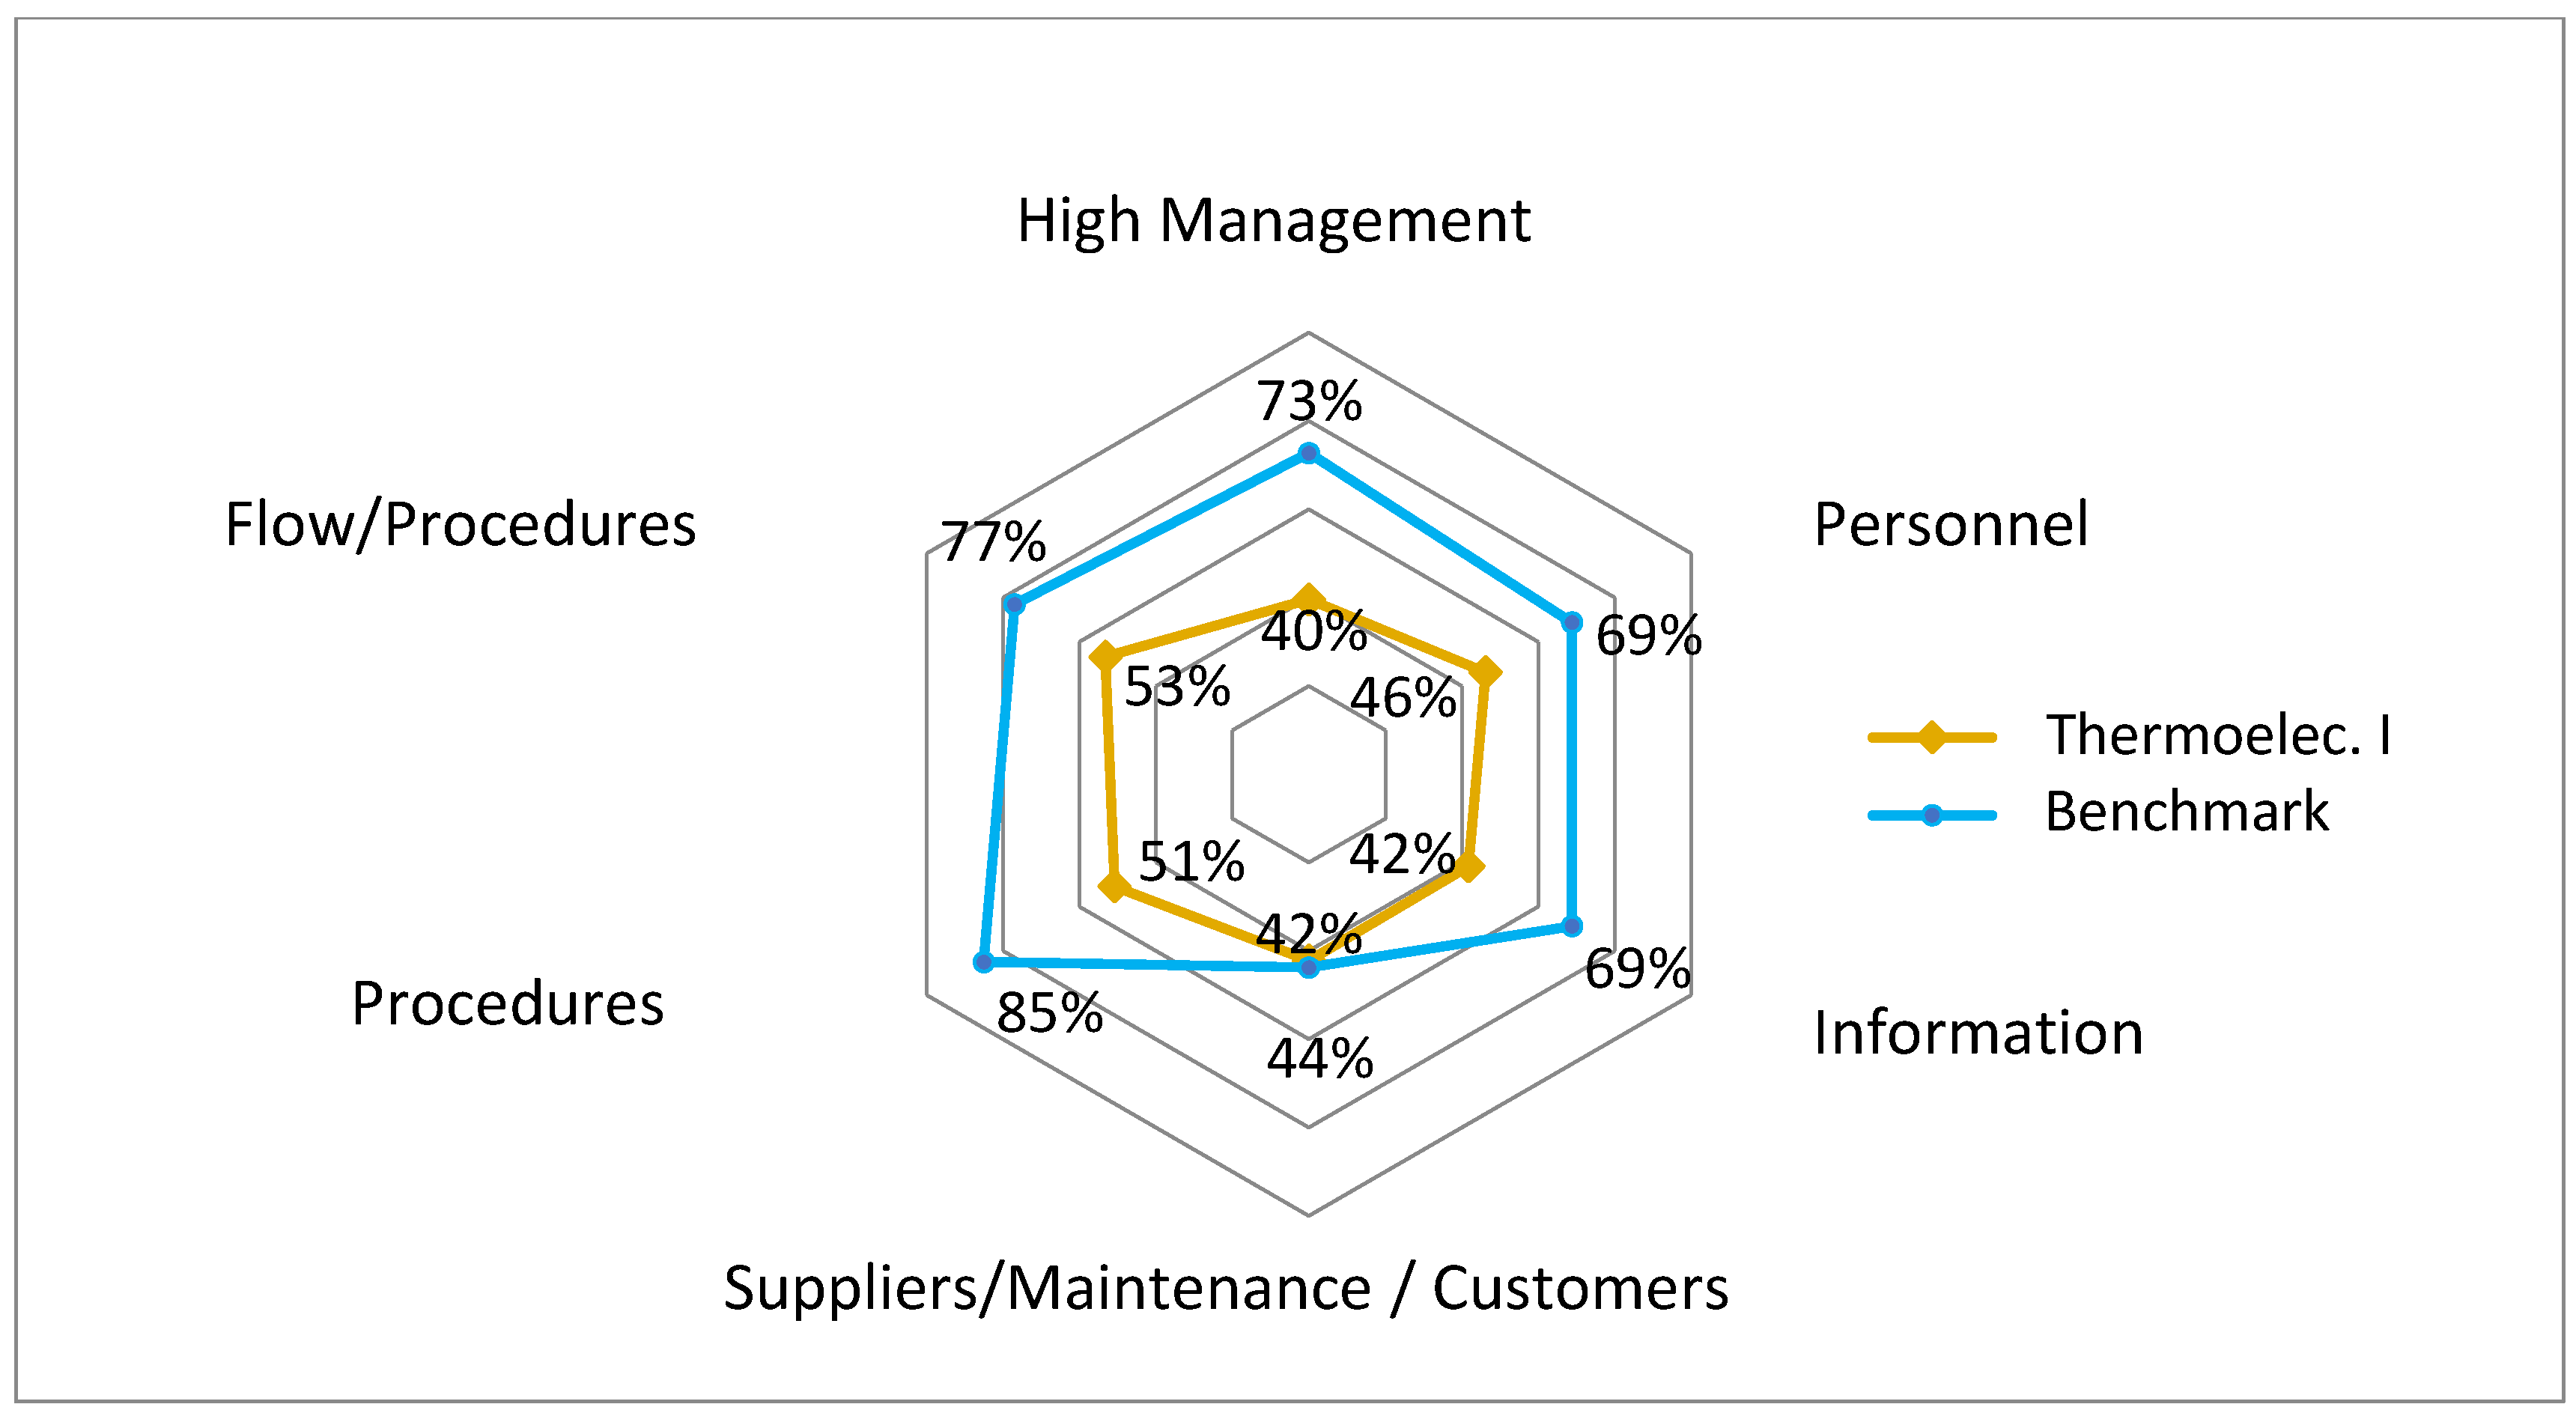
Figure 4.
Decision table for linking strategic dimensions with lean tools.
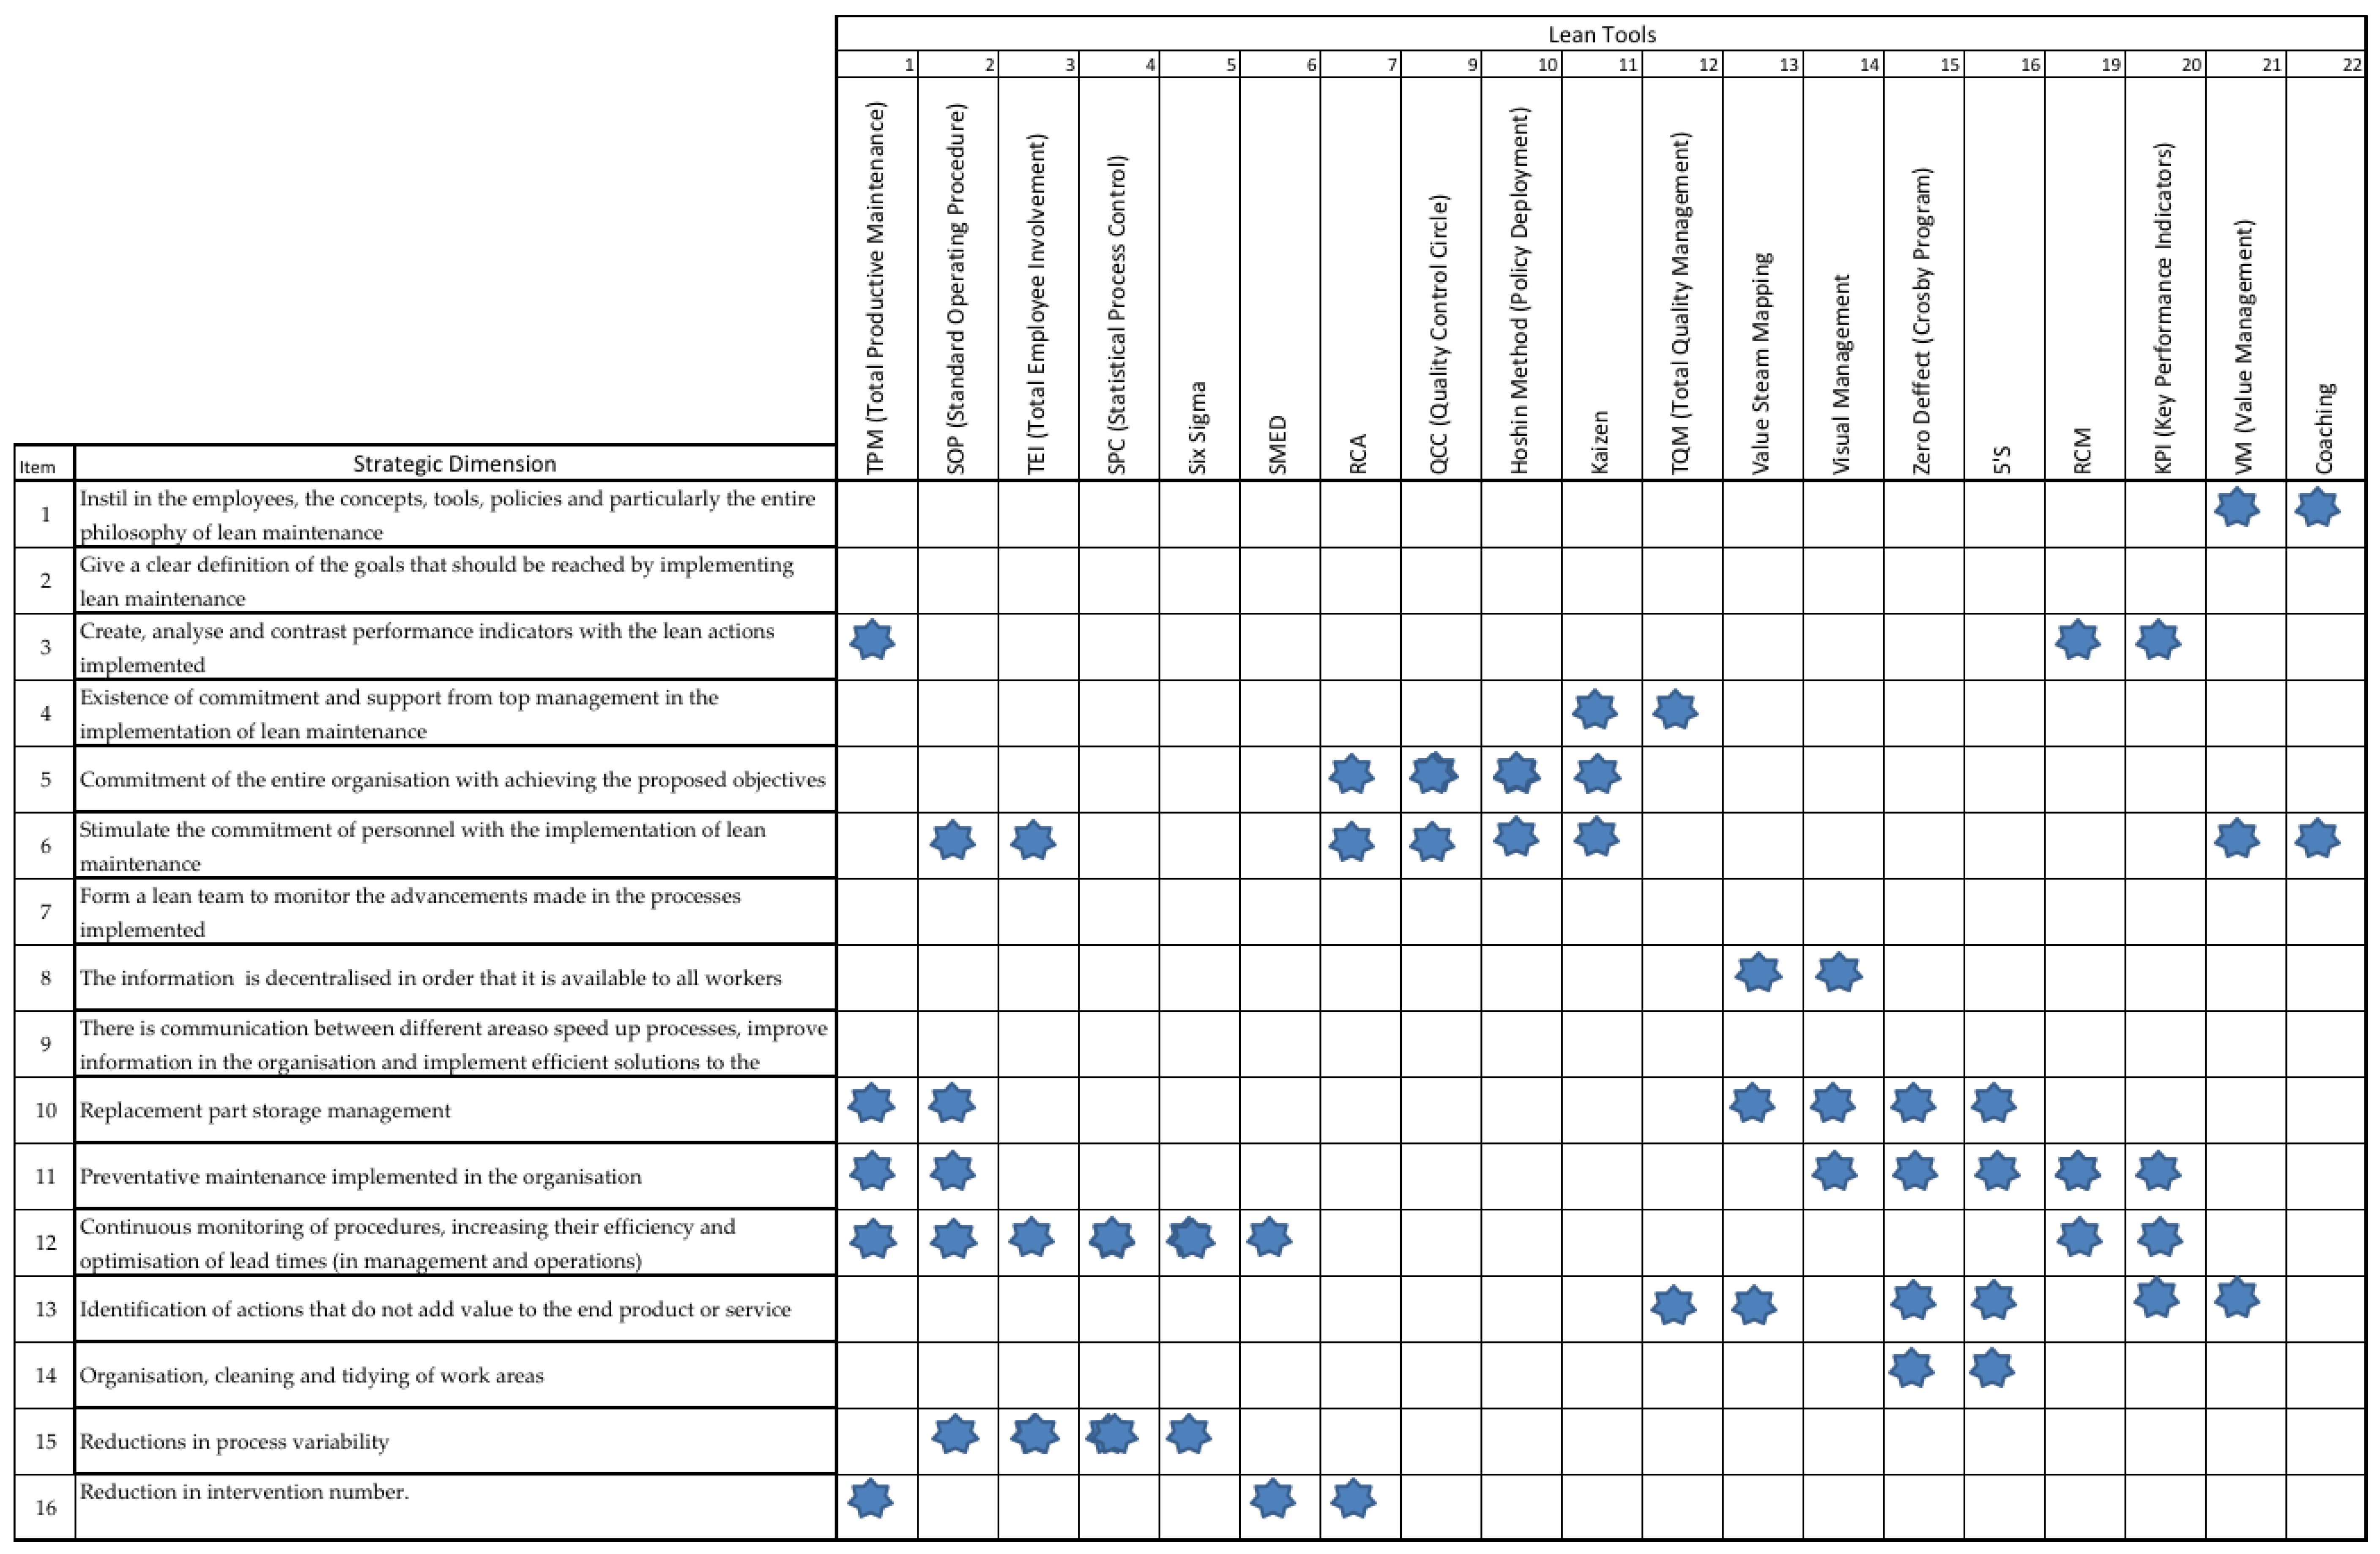
Figure 5.
Hierarchic decomposition of the problem.

Figure 6.
Lean tools prioritization mechanism using the decision table.

Figure 7.
SMED application procedure.
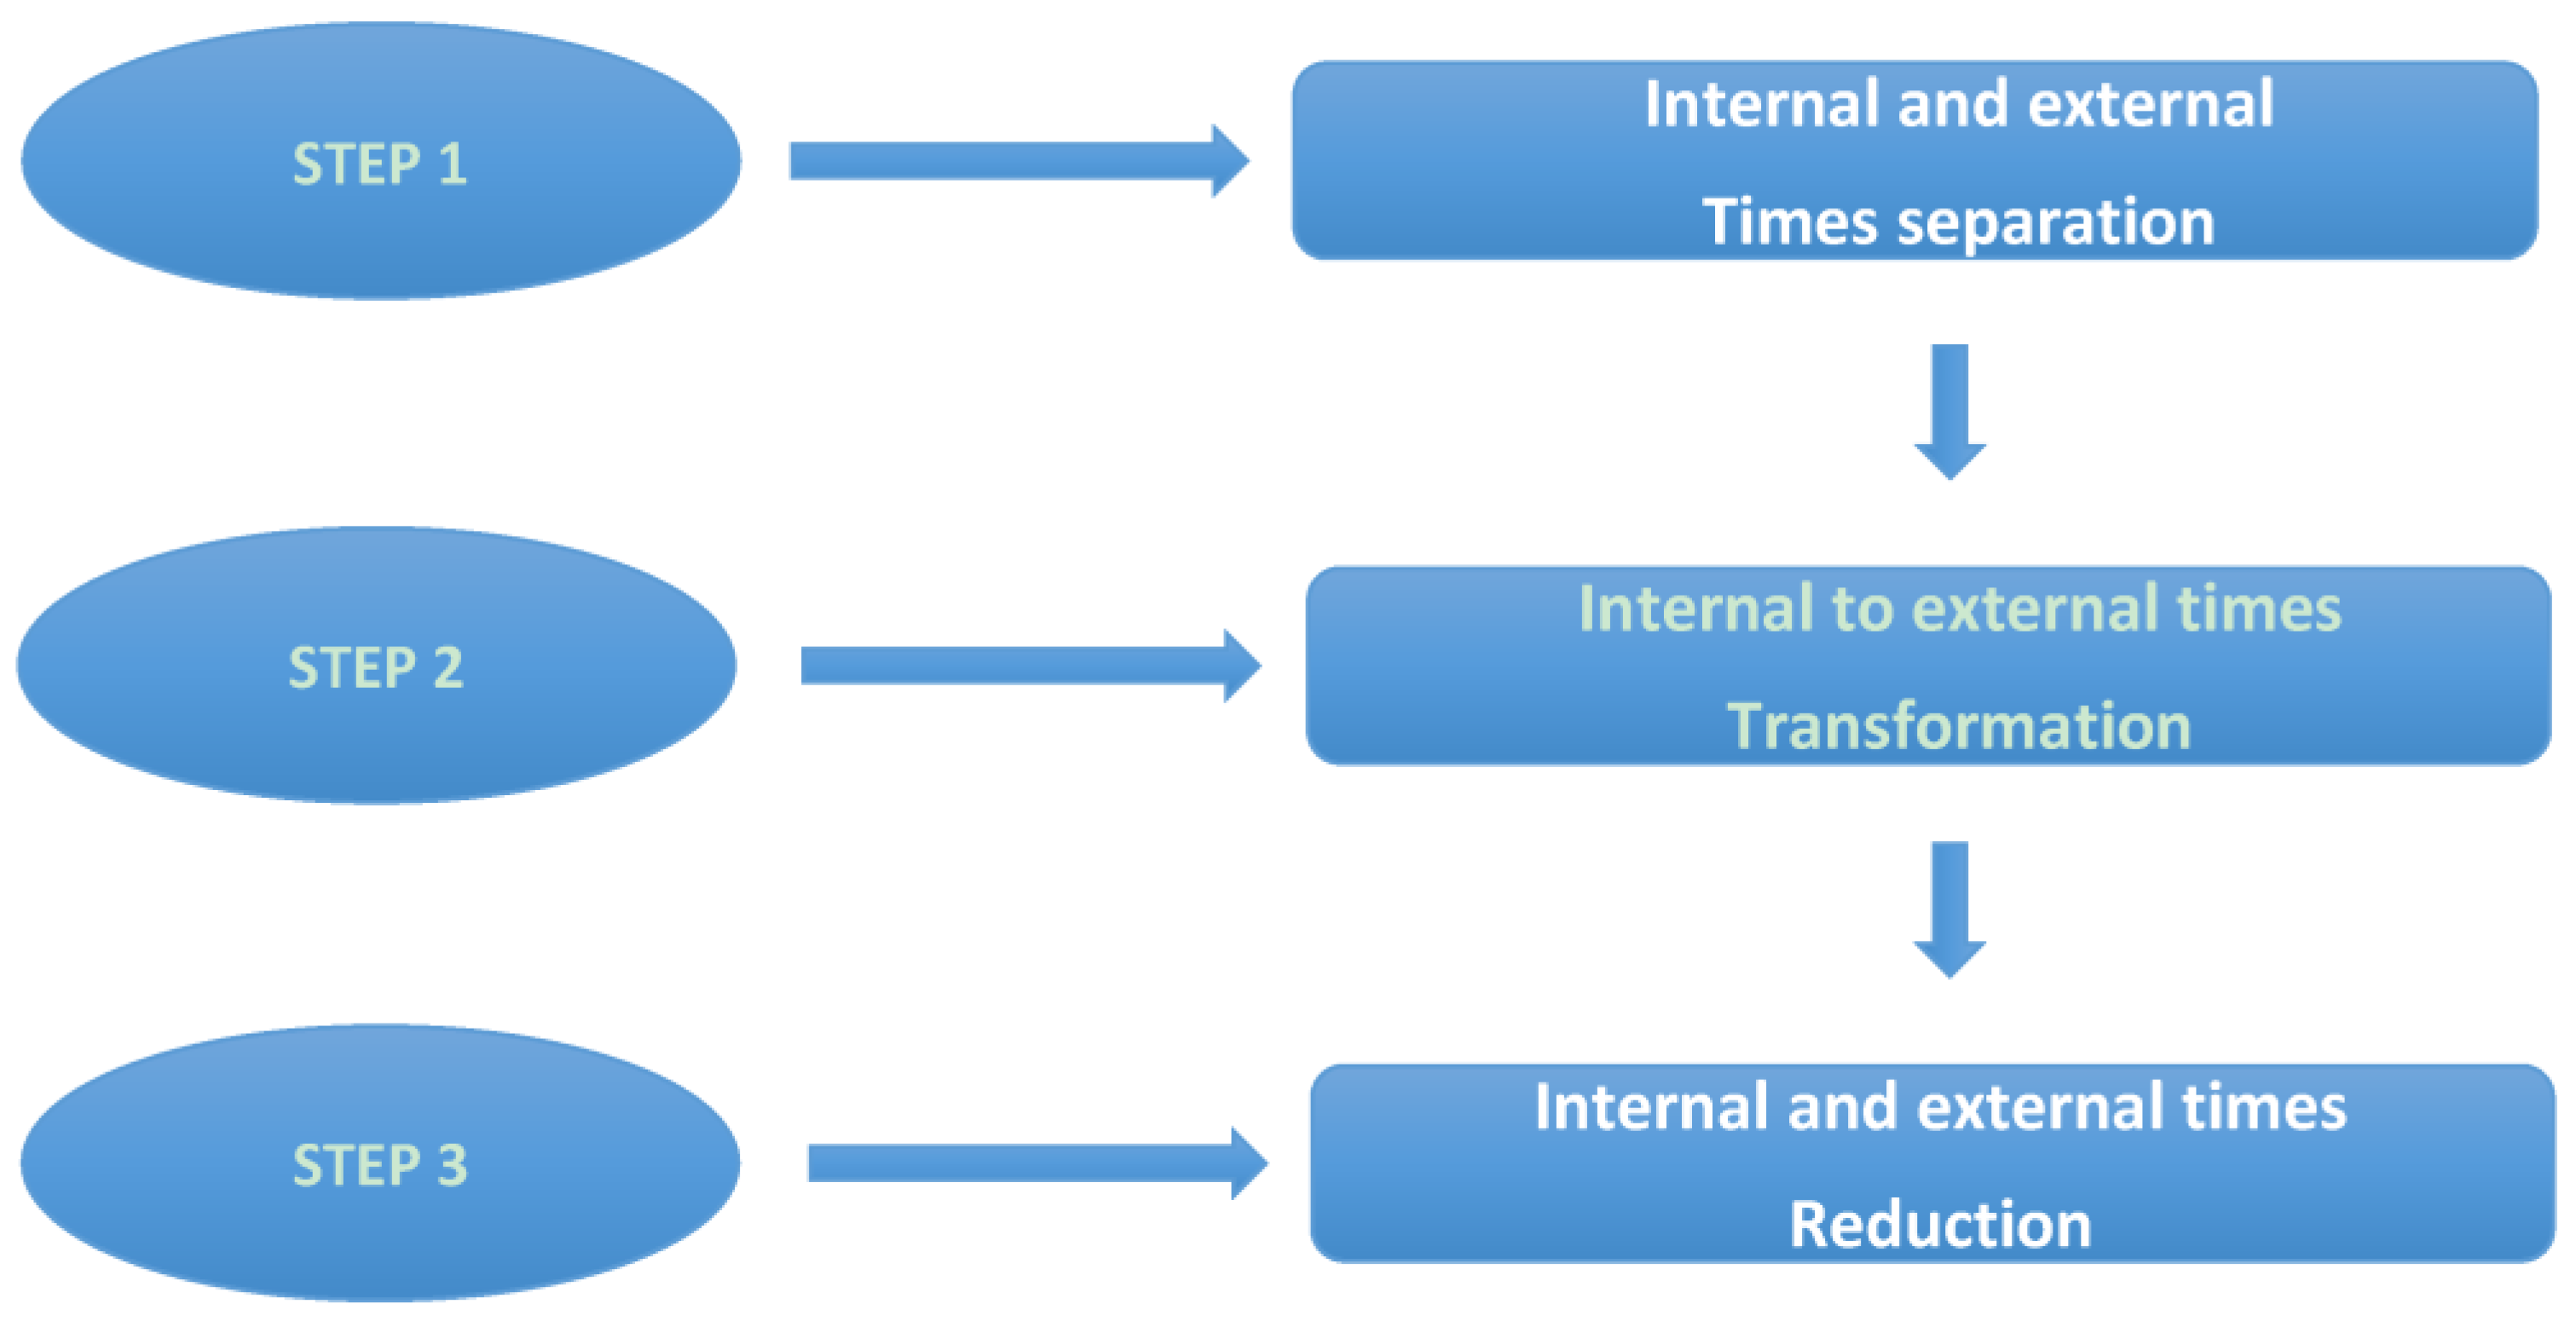
Figure 8.
Procedure for performing the value stream mapping.
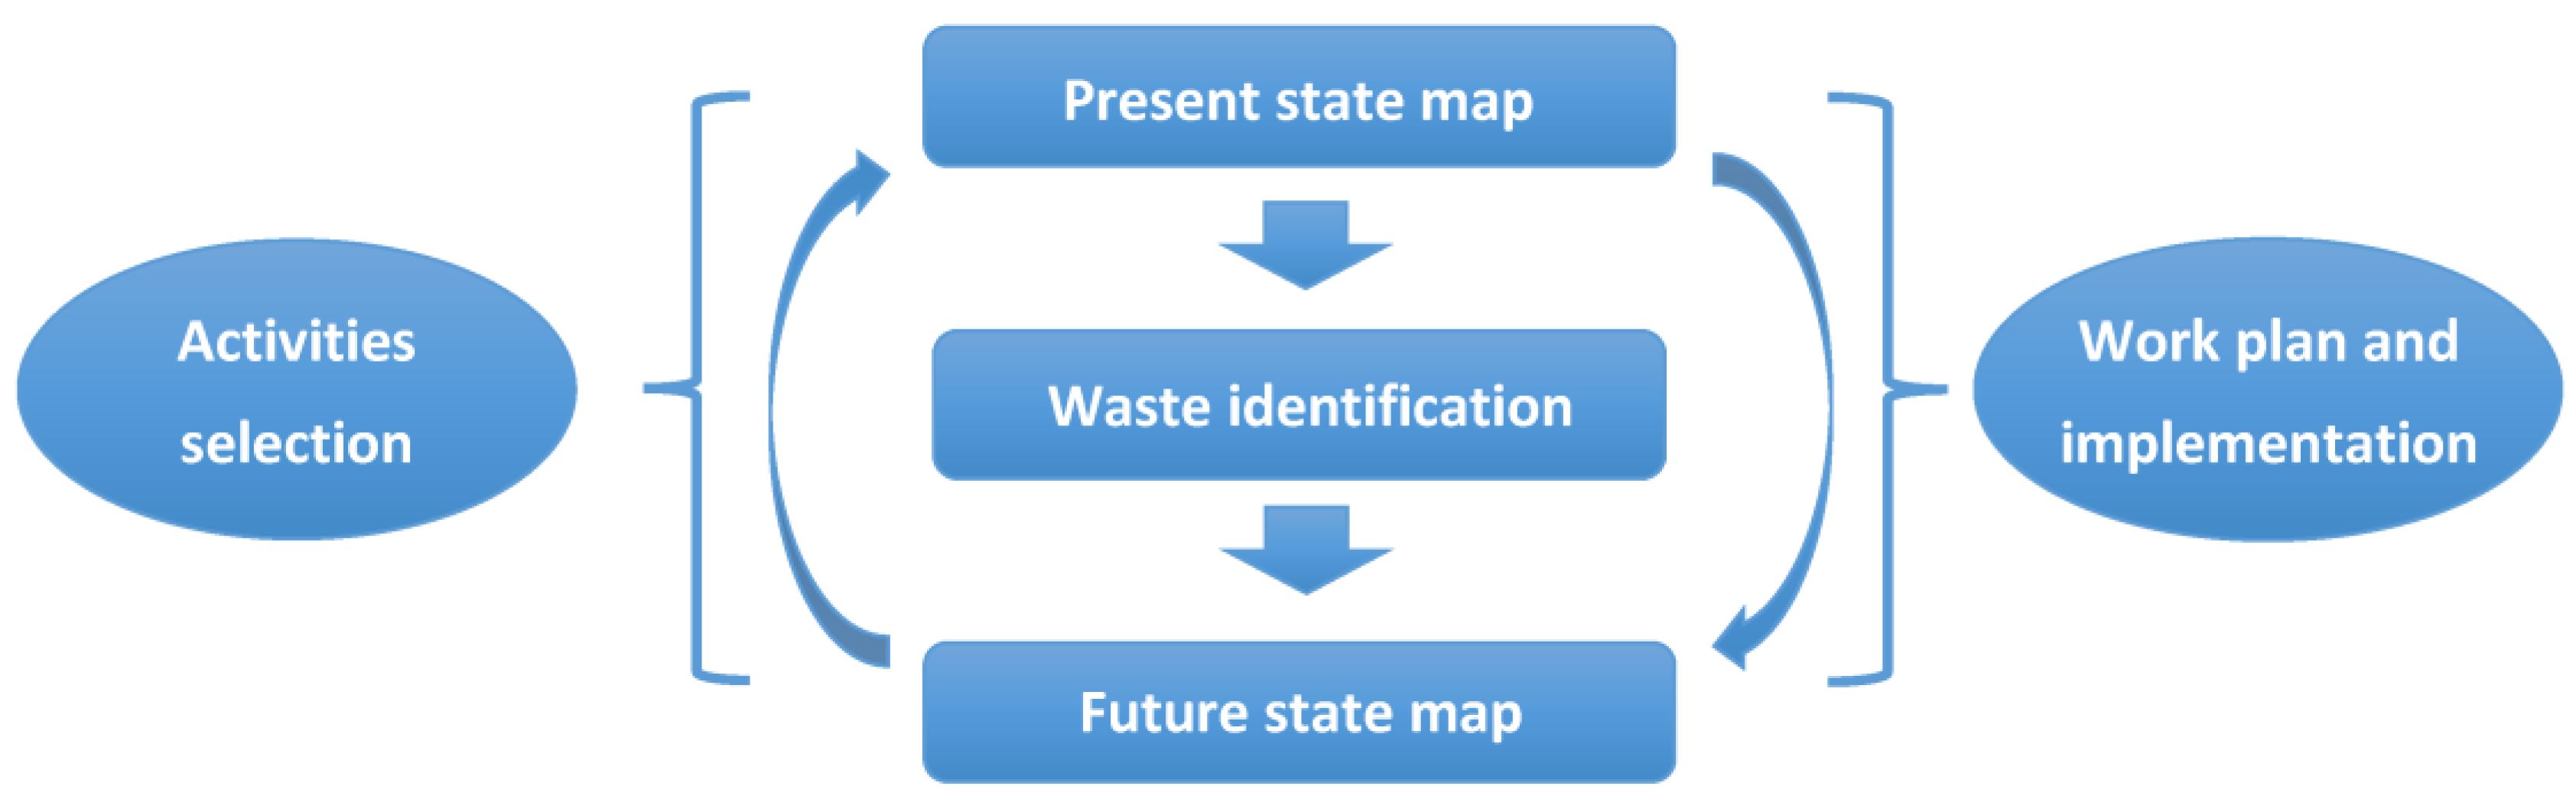
Figure 9.
The value stream map of the current state.

Figure 10.
The value stream map of the future state.

Table 1.
Correspondence between the sources of waste in lean manufacturing and maintenance.
| Graphical Representation | Manufacturing | Maintenance |
|---|---|---|
 | Material transportation | Spare parts and tools transportation |
 | Production of not requested products. | Over maintenance. |
 | Waiting times between operations or during an operation. | Waiting times between maintenance activities or procedures. |
 | Overstocked materials and raw materials | Excessive spare parts inventories |
 | Overprocessing | Excessive or frequent maintenance actions |
 | The products do not meet the quality standards and must be remanufactured. | Poorly performed maintenance activities |
Table 2.
Principles contained in SAE J4000 and the relative weighting assigned to them.
| Principle 1 | Management/Responsibility | 25.0% |
| Principle 2 | Personnel | 12.5% |
| Principle 3 | Information | 12.5% |
| Principle 4 | Supplier/Organization/Client | 12.5% |
| Principle 5 | Product | 12.5% |
| Principle 6 | Process/Flow | 25.0% |
Table 3.
Scale for measuring level of satisfaction in comparison to best practices.
| Level 0 | The component is not implemented or there are fundamental inconsistencies in its implementation |
| Level 1 | The component is implemented but there are still less significant inconsistencies in its implementation |
| Level 2 | The component is satisfactorily implemented |
| Level 3 | The component is satisfactorily implemented and has shown continuous improvement over the last 12 months |
Table 4.
Strategic dimensions used in diagnosis.
| No. | Strategic Dimension |
|---|---|
| 1 | Instill in the employees, the concepts, tools, policies and particularly the entire philosophy of lean maintenance |
| 2 | Give a clear definition of the goals that should be reached by implementing lean maintenance |
| 3 | Create, analyze and contrast performance indicators with the lean actions implemented |
| 4 | Existence of commitment and support from top management in the implementation of lean maintenance |
| 5 | Commitment of the entire organization with achieving the proposed objectives |
| 6 | Stimulate the commitment of personnel with the implementation of lean maintenance |
| 7 | Form a lean team to monitor the advancements made in the processes implemented |
| 8 | The information is decentralized in order that it is available to all workers |
| 9 | There is communication between different areas in order to speed up processes, improve information in the organization and implement a more efficient solution to the problems |
| 10 | Replacement part storage management |
| 11 | Preventative maintenance implemented in the organization |
| 12 | Continuous monitoring of procedures, increasing their efficiency and optimization of lead times (in management and operations) |
| 13 | Identification of actions that do not add value to the end product or service |
| 14 | Organization, cleaning and housekeeping in working areas |
| 15 | Reductions in process variability |
| 16 | Reduction in intervention number |
Table 5.
Comparisons of operational parameters before and after applying 5S.
| Equip. Code | Equipment | Before 5’S | After 5’S | ||
|---|---|---|---|---|---|
| MTTR (h) | MTBF (h) | MTTR (h) | MTBF (h) | ||
| GMB01 | Pump N° 1 Filters service | 364 | 1314 | 354 | 1324 |
| GMB02 | Pump N° 2 Filters service | 364 | 1314 | 354 | 1324 |
| GMB03 | Pump N° 1 Filters retro washing | 364 | 1314 | 354 | 1324 |
| GMB04 | Pump N° 2 Filters retro washing | 364 | 1314 | 354 | 1324 |
| F-01 | Tank sand filtering N° 1 | 0 | 100,000 | 0 | 100,000 |
| F-02 | Tank sand filtering N° 2 | 0 | 100,000 | 0 | 100,000 |
| TK02 | Tank of filtered water 80 m3 | 0 | 100,000 | 0 | 100,000 |
| GMB05 | Filtered water Pump N° 1 | 57 | 1179 | 55 | 1181 |
| GMB06 | Filtered water Pump N° 2 | 64 | 2474 | 62 | 2476 |
| MF01-03 | Micro filters stand | 29 | 3446 | 28 | 3447 |
| MF02-04 | Micro filters stand | 29 | 3446 | 28 | 3447 |
| GMB07 | Pump N° 1 of osmosis high pressure | 19 | 1847 | 18 | 1848 |
| GMB08 | Pump N° 2 of osmosis high pressure | 19 | 1847 | 18 | 1848 |
| GMB09 | Pump N° 3 of osmosis high pressure | 19 | 1847 | 18 | 1848 |
| GMBOI-01 | Inverse osmosis Filters | 620 | 2856 | 603 | 2873 |
| GMBOI-02 | Inverse osmosis Filters | 620 | 2856 | 603 | 2873 |
| TK-03 | decarbonisation Tower | 0 | 100,000 | 0 | 100,000 |
| GMB10 | Feeder (mixed bed) Pump N° 1 | 19 | 1847 | 18 | 1848 |
| GMB11 | Feeder (mixed bed) Pump N° 2 | 19 | 1847 | 18 | 1848 |
| GMB12 | Feeder (mixed bed) Pump N° 3 | 19 | 1847 | 18 | 1848 |
| GMB16 | Bba Sulfuric Acid transfer UGD | 66 | 1847 | 64 | 1842 |
| TD-05 | Tk. Sulfuric Acid t Dosing | 0 | 100,000 | 0 | 100,000 |
| BD-12 | Sulfuric Acid t Dosing Pump N° 1 | 620 | 1053 | 603 | 1070 |
| BD-13 | Sulfuric Acid t Dosing Pump N° 2 | 620 | 1053 | 603 | 1070 |
| GMB17 | Caustic soda Transfer Pump UGD | 66 | 1840 | 64 | 1842 |
| TD-06 | Tk. Caustic soda Dosing | 0 | 100,000 | 0 | 100,000 |
| BD-10 | Sulfuric Acid t Dosing Pump N° 1 | 181 | 3008 | 173 | 3016 |
| BD-11 | Sulfuric Acid t Dosing Pump N° 2 | 181 | 3008 | 173 | 3016 |
| LM01 | Mixed bed Tank N° 1 | 225 | 9912 | 215 | 9921 |
| LM02 | Mixed bed Tank N° 2 | 225 | 9912 | 215 | 9921 |
| TK-04 | Treated water Tank | 0 | 100,000 | 0 | 100,000 |
Table 6.
Operations performed on the sprayers.
| Item | Operation |
|---|---|
| 1 | Pulverizer cap removal |
| 2 | Inspection and maintenance pyrite trap |
| 3 | Pulverizer cooling |
| 4 | Maintenance of the interior of the mill |
| 5 | Coal feeder maintenance |
| 6 | Transfer of tools to the working area |
| 7 | Transfer of spare parts and components to the working area |
| 8 | Installation of electrical panels to energize the working area |
Table 7.
List of activities performed during the maintenance of pulverizers.
| Item | Activity | Time (h) | Waste (1/0) |
|---|---|---|---|
| A | Work Order sending | 0.20 | 0 |
| B | Materials | 0.17 | 0 |
| C | Pulverizer opening | 0.07 | 0 |
| D | Cooling | 2.57 | 0 |
| E | Work preparation | 0.23 | 0.23 |
| F | Open pyrite trap 1 | 0.77 | 0 |
| G | Open pyrite trap 2 | 0.77 | 0 |
| H | Coal feeder | 2.95 | 0.58 |
| I | Gasket fabrication | 0.63 | 0.63 |
| J | Measures | 0.87 | 0 |
| K | Filling | 1.45 | 0 |
| L | Closing | 0.23 | 0 |
| M | Pulverizer test | 0.37 | 0 |
| TOTAL | 7.25 | 1.44 |
Table 8.
List of activities performed during the maintenance of pulverizers after the SMED application.
Table 8.
List of activities performed during the maintenance of pulverizers after the SMED application.
| Item | Activity | Time (h) | Waste (1/0) |
|---|---|---|---|
| A | Work Order sending | 0.20 | 0 |
| B | Materials | 0.17 | 0 |
| C | Pulverizer opening | 0.07 | 0 |
| D | Cooling | 2.57 | 0 |
| E | Open pyrite trap 1 | 0.77 | 0 |
| F | Open pyrite trap 2 | 0.70 | 0 |
| G | Coal feeder | 2.37 | 0 |
| H | Measures | 0.87 | 0 |
| I | Filling | 1.45 | 0 |
| J | Closing | 0.23 | 0 |
| K | Pulverizer test | 0.37 | 0 |
| TOTAL | 9.77 | 0 |
Table 9.
Costs and operational parameters before and after the application of SMED.
| Parameters | Base | After SMED |
|---|---|---|
| Loss of Generation (MW/h) | 40 | 40 |
| Average Marginal Costs (USD/MW) | 151 | 151 |
| Inefficiency Costs (USD/h) | 6040 | 6040 |
| Working hours per year | 8760 | 8760 |
| MTBF (h) | 1843 | 1843 |
| MTTR (h) | 7.25 | 5.81 |
| Availability (%) | 0.9907 | 0.9968 |
| Unavailability (h) | 34.46 | 27.62 |
| Annual Level of Business Destruction (USD) | 208,138 | 66,825 |
| Investments (USD) | 0 | 1000 |
| Planning horizon (years) | 1 | 1 |
| Interest Rate (%) | 0.12 | 0.12 |
| Global Costs (USD) | 0.8929 | 0.8929 |
| Global Costs (USD) × 8 pulverizers | 1,486,696 | 1,199,608 |
© 2017 by the authors. Licensee MDPI, Basel, Switzerland. This article is an open access article distributed under the terms and conditions of the Creative Commons Attribution (CC BY) license (http://creativecommons.org/licenses/by/4.0/).
Share and Cite
MDPI and ACS Style
Duran, O.; Capaldo, A.; Duran Acevedo, P.A. Lean Maintenance Applied to Improve Maintenance Efficiency in Thermoelectric Power Plants. Energies 2017, 10, 1653. https://doi.org/10.3390/en10101653
AMA Style
Duran O, Capaldo A, Duran Acevedo PA. Lean Maintenance Applied to Improve Maintenance Efficiency in Thermoelectric Power Plants. Energies. 2017; 10(10):1653. https://doi.org/10.3390/en10101653
Chicago/Turabian StyleDuran, Orlando, Andrea Capaldo, and Paulo Andrés Duran Acevedo. 2017. "Lean Maintenance Applied to Improve Maintenance Efficiency in Thermoelectric Power Plants" Energies 10, no. 10: 1653. https://doi.org/10.3390/en10101653
Note that from the first issue of 2016, this journal uses article numbers instead of page numbers. See further details here.