
A Survey on PEV Charging Infrastructure: Impact Assessment and Planning


Department of Electrical and Computer Engineering, University of Waterloo, 200 University Avenue West, Waterloo, ON N2L 3G1, Canada
*
Author to whom correspondence should be addressed.
Energies 2017, 10(10), 1650; https://doi.org/10.3390/en10101650
Submission received: 18 September 2017
/
Revised: 16 October 2017
/
Accepted: 17 October 2017
/
Published: 20 October 2017
Abstract
:Plug-in electric vehicles (PEVs) represent a huge step forward in a green transportation system, contribute in reduction of greenhouse gas emission, and reduce the dependence on fossil fuel. Integration of PEVs into the electric power system will result in a considerable addition to electricity demand. Due to PEV mobility, this demand has a random distribution in space and time among distribution system nodes. Therefore, short term forecast of PEV charging demand is more challenging than that for conventional loads. Assessment of PEV impacts on the power system is essential to mitigate the impairments from PEV loads. Optimal planning of PEV charging infrastructure will promote the penetration rate of PEVs and minimize the negative impacts of PEVs on the electric power distribution system and transportation road network. Design of charging facilities with integrated distributed energy resources (DER) is considered a solution to alleviate strain on the grid, reduce the integration cost with the distribution network and the charging cost. In this paper, we present a comprehensive literature survey on modelling of PEV charging demand, impact assessment approaches and tools, and charging infrastructure planning. Moreover, an overview on charging facility design with integrated DER is given. Some future research directions are identified.
1. Introduction
The introduction of plug-in electric vehicles (PEVs), whether as battery electric vehicles (BEVs) or plug-in hybrid electric vehicles (PHEVs), is considered a viable solution to reduce carbon emissions and decrease the dependence on fossil fuel, for an economic and environmentally friendly transportation system. According to the International Energy Agency forecast [1], the number of on-road electrical vehicles reached 1.26 million in 2015, which is more than 100 times the number of electrical vehicles on 2010, as shown in Figure 1. This number is expected to rapidly increase in the near future, and the Electric Vehicles Initiative (EVI) sets a target of 20 million electrical vehicles on roads by 2020 [1]. To achieve this ambitious goal, there are some barriers hindering the mass adoption of PEVs that should be overcome. These barriers include PEV cost, negative impacts on the power system, and the availability of charging infrastructure [2].
Although the operating cost of PEVs is lower than for conventional vehicles, the PEV and associated battery costs are still higher than that of conventional vehicles. The PEV charging demand of electricity is not only high, but also appears dynamically and randomly at any node on the distribution system at any time due to PEV mobility [3]. The future deployment of PEV will lead to an increase in system electricity demand, and a large-scale penetration of PEVs is expected to significantly influence peak demand, feeder loss, and voltage fluctuations in distribution systems [4]. Availability of charging infrastructure is another concern to the PEV users. At the moment, charging infrastructure is not widely deployed as ordinary gas stations, because establishing charging facilities requires a huge investment. Also, charging time of PEVs is longer than that for refueling gas in conventional vehicles.
To overcome the increasing electricity demand due to PEV charging loads and its negative impacts on power systems, various solutions are proposed in literature. One solution is to integrate the distributed energy resources (DERs), such as renewable energy sources (RESs) and energy storage systems (ESSs), in charging facilities [5,6,7]. The output power from the RESs is used to charge the connected PEV batteries. However, RESs are characterized by its intermittent power generation and heavily depend on the weather situation. ESSs can be used to store the surplus output energy of RESs when the PEV charging demand is low. Integration of RES and ESS in charging facilities decreases the required power from the grid, hence, mitigates the negative impact on the power system. Even though RESs and ESSs introduce additional cost to the charging facility, the integration cost of charging facility with the distribution system can be reduced [8]. Accurate information of PEV load demand is required for the design of charging facilities and for determining the required capacity of the integrated RESs and ESSs to satisfy power system constraints. Another solution is to coordinate the charging of PEVs, which provides some control to the charging start time and charging rate. Two basic categories of coordination are centralized coordination and decentralized coordination [9,10]. In the former, a central control unit estimates the current PEV charging demands, and then directly schedules the charging process of PEVs that request a charging service [9]. A decentralized charging mechanism does not have a central control unit, but uses price based mechanisms to allow PEV users to decide their own charging schedules. Coordination of PEV charging enables the system to better satisfy the power system constraints [9]. PEVs can also positively impact on the power system through the vehicle-to-grid (V2G) technology, which is the capability of PEVs to inject power back to the power grid, in order to provide ancillary services and peak load shaving for the power system.
Proper planning of a charging infrastructure is essential for mass adoption of PEVs. Satisfactory charging service is required to promote the penetration of PEVs. The charging infrastructure planning is technically challenging, since PEVs are characterized by their limited driving range, long charging duration, and high charging power, in addition to the randomness in driving patterns and charging decisions of PEV users. Charging stations cannot simply be combined with the conventional gas stations as PEVs take a relatively longer time for charging, which can saturate the limited space of gas stations [11], and the locations of gas stations may not be suitable for integration with the power system. Planning of a PEV charging infrastructure depends on several factors, such as PEV characteristics, PEV owner driving behaviors, the road network and electric distribution system constraints, in addition to economic and security issues in the power system [12].
In this paper, we first present an overview of the modelling of PEV charging load demand, which is essential for planning and operation of the power distribution system in order to accommodate the dynamics of PEV charging demand. Such charging characteristics are necessary to efficiently operate and/or upgrade the power distribution systems, and coordinate PEV charging schedules. Then, we discuss impact of PEV load demand on the power distribution system. The existing impact assessment indexes are presented, along with the assessment approaches and tools. Afterwards, we study issues in PEV charging infrastructure planning. The sitting and sizing problem of charging facilities is presented from the prospective of electric power system, vehicle transportation system, and both of them combined. Additionally, designing charging facilities with integrated DER is reviewed.
The remainder of this paper is organized as follows: Section 2 presents modelling of the PEV charging demand. Impact assessment of PEV charging demand on electric power distribution system is discussed in Section 3. The state-of-the-art of charging infrastructure planning is presented in Section 4. Section 5 provides a review on designing the PEV charging facilities with integrated DER. Section 6 summarizes this study and identifies future research directions.
2. Modelling of PEV Charging Demand
Modelling the PEV charging demand is a complex task, because the demand is a stochastic process, depending on various factors such as the driving behavior, remaining battery state of charge (SOC), charging location and charging time, which vary from one customer to another. PEV charging demand estimation can be loosely grouped in three levels, as follows:
- System-wide PEV charging demand estimation, which is used for the charging profile of all PEVs in the system—Utilities use this estimation method in evaluating impacts of PEV integration on the power system [4], to upgrade the distribution system (including transformers, cables, and protection devices). Moreover, this estimation can be used when utilities need to establish new generation sources [13], to dispatch of current generation sources, and to apply demand side management (DSM) programs [14];
- Single charging facility demand estimation, which is used to estimate the charging profile of a certain charging station or parking lot. Utilities use this type of estimation to assess the impact of certain charging facility—Service providers also use this type of estimation in determination of charging station capacity, such as the numbers of chargers and waiting positions of a new charging facility based on the targeted blocking probability of new customers [15];
- Network of charging station demand estimation, which is used to analyze the interactions among multiple charging stations [16]—utilities and service providers use this estimation to allocate power among charging facilities based on the expected charging profile [17]. Moreover, this estimation is used to allocate (route) customers among charging stations either by direct control or by incentives such as charging price [17]. The joint allocation of power and customers for the stations in such a network is to maximize the operator’s profit and ensure the highest quality of service for customers.
2.1. System-Wide PEV Charging Demand Modelling
System-wide PEV demand estimation has both spatial and temporal characteristics [3,9]. Spatial characteristics are due to PEV mobility. Electricity usage is affected by the driving behaviors and vehicle traffic conditions. Users can charge their PEVs at any charging facility in the system, which adds a randomness to the demand characteristics. Moreover, PEVs can start or terminate the charging process at any time of the day with various charging durations, depending on the available SOC, travelling schedule, user preferences, etc. Therefore, the PEV load demand has a temporal random characteristic, when viewed at a large number of PEVs.
In order to model the PEV charging demand, three subsystem models are used in tandem, where each model utilizes the outcomes of the previous model(s). These models are travel pattern, energy consumption, and power consumption [18,19]. The travel pattern model determines the daily travel distance of PEVs, in addition to where and when a PEV will be charged. The information can be represented by a time varying distribution of the number of simultaneously charging PEVs at each charging node. The energy consumption model estimates the PEV battery SOC at the time of starting the charging process. It captures PEV battery discharging characteristics. The power consumption model estimates the charging power of the aggregated PEV load profiles at the charging locations. Different charging scenarios, charging rates and durations, and charging circuits should be taken into account during power consumption modelling. More details of these models are discussed in the following subsections.
2.1.1. Travel Pattern Model
The travel pattern model captures the driving behaviors of PEV users. Distances covered by PEVs and the number of simultaneously charging PEVs at each charging facility are the output of this model. In most cases, typical daily driving for a user starts from home, but the destination of most driving patterns is highly random. The average distance traveled during any given day has been resolved to be around 26 miles [20]. However, using an expected value for the number of miles driven per day is not sufficient, and a more realistic model should be established, such by using stochastic models.
There are two methods to analyze PEV travel patterns. The first method is based on deterministic approach in analyzing the travel pattern of PEVs. It uses national travel surveys or database obtained by global positioning system (GPS) recording devices installed in PEVs [13]. The second method is based on stochastic models, also relying on travel survey data, in order to capture the uncertainty of main variables describing PEV travel behaviors.
Due to lack of traveling statistics of PEVs, the traveling behaviors of PEV users are assumed to be similar to those of conventional vehicle users, with the argument that the traveling demand of drivers are not affected by whether or not their vehicles are PEVs. However, the assumption may not hold because PEV traveling distance per charging may affect the travel patterns, or PEV users have a certain income level with certain traveling patterns [18]. Deterministic methods can utilize travel survey data such as National Household Travel Survey (NHTS) for U.S. light duty vehicle fleet [18,21,22,23], and U.K. National Travel Survey [19]. Surveys data contains information about trip origin, and trip distance, in addition to information about trip purposes (e.g., commuting, shopping, and holyday trip). It also has information about vehicle parking start/end times, and parking locations (e.g., home, work, and shopping). Vehicle travel patterns vary by household area, whether it is urban or rural area, and by the day of week, whether it is weekday or weekend [2,23]. When survey data is directly used, the inherent uncertainty of the driving patterns cannot be modeled. Deterministic methods can also explore database obtained by GPS recording devices installed in PEVs [13]. These devices record daily traveled distances, home arrival and departure times, which can be used to accurately estimate the PEV travel behaviors. However, this method requires installation of GPS devices in a large number of PEVs, and can be difficult in reality due to user privacy concerns.
Stochastic methods can characterize the uncertainty of main variables describing PEV behaviors, and account the travel habits of PEV users, via probability distribution functions of PEV travel variables. The variables include the arrival time to a charging area, departure time from the charging area, and distance traveled in between charging [13,18,19,21]. Monte-Carlo Simulation (MCS) can be used to generate virtual trip distances for each trip purpose. The outcomes can be finished trips per hour per trip purpose for each PEV and the distance covered by each PEV [24]. The accuracy of stochastic methods increases when the correlation between random variables are accounted for [13,25]. A multivariate joint distribution function is created using a copula function in [25], to characterize the dependence structure between three critical variables describing PEV travel patterns, which are charging stat time, charging end time, and traveled distance. Modeling the spatial-temporal dynamics of PEVs is studied in [26,27], in which a probabilistic modeling of trip chains is used to represent the spatial randomness of PEV movements. A trip chain is a time-ordered trip sequence, which consists of locations and routes of daily trips. The traveling and parking behavior is stochastically modeled in order to predict the traveling distance and route. The input parameters for each PEV are type of parking or charging location, occupations of driver, and combinations of daily trip chain. The spatial randomness of PEV dynamics are probabilistically modeled as a daily trip chain of destinations and distances. Modelling the temporal PEV dynamics captures the randomness in driving time, parking duration, and charging duration.
2.1.2. Energy Consumption Model
The energy consumption model characterizes the SOC of PEV batteries at the starting time of charging process. It captures the PEV battery discharging characteristics. The SOC of a PEV battery is a function of various system variables, which include the following:
- The energy consumed by PEV per unit travel distance—This variable depends on vehicle characteristic (e.g., vehicle weight, and aerodynamics drag coefficient), driving habits, geographical location, road conditions, and so on. The variable is random and is assumed to have a normal distribution with the mean depending on the vehicle class [18];
- The daily travel distance of PEV—This variable is dependent on vehicle travel pattern, as discussed in the preceding subsection. Therefore, the PEV energy consumption model utilizes the outcomes of a travel pattern model of PEVs [18]. A linear relationship between the SOC at the beginning of charging and the traveled distance since last charging can be applied [23,25];
- Other variables such as the energy required to keep up a comfortable cabin temperature for the vehicle driver and passengers are taken into consideration in [19].
2.1.3. Power Consumption Model
The power consumption model estimates the charging power of the aggregated PEV load profiles at the charging locations. This model requires various system state information, as discussed in the following:
- Number of simultaneously charging PEVs in the system—The statistics of this variable can be extracted from a travel pattern model which provides the spatial and temporal distribution of the number of PEVs in charging state [3];
- Charging scenarios—It includes both controlled and uncontrolled charging [28]. Charging scenarios determine the charging start time and charging rate. In uncontrolled charging, a PEV starts charging immediately after plugged into the power grid, and the charging rate is fixed. Controlled charging, on the other hand, can be price based control or direct control (smart charging). It adds some coordination over charging process of multiple PEVs, in order to shape the aggregated PEV charging profile. In price based control, utilities use time of use (TOU) electricity price to shift the charging load of PEVs to off-peak times. In smart charging, utilities directly adjust the charging start time and charging rate. Controlled charging can optimize the scheduling of PEVs charging process, in order to maximize the benefits of utilities and users. Utilities can use controlled charging in load flattening, frequency regulation and voltage regulation. Additionally, users can reduce the PEV charging cost. A survey on various smart charging algorithms is given in [9].
- Charging level—The standard charging levels for PEVs include the alternating current (AC) level 1, AC level 2, and direct current (DC) fast charging [29], as summarized in Table 1. Slow charging facilities contain level 1 and level 2 chargers and take 3–17 hours (h) to charge a PEV battery. Usually, slow charging facilities are deployed in homes, parking lots in workplaces, and shopping malls. Fast charging stations contain DC fast chargers, which can charge a PEV battery in approximately 20 minutes (min);
- Charging duration—There are different types of PEV batteries, and each battery type has its unique characteristics. Charging duration can be calculated based on information about charging level, charging rate, and PEV battery capacity, in addition to the available SOC at the beginning of charging process, which can be extracted from the energy consumption model [28].
2.2. Demand Modelling of Single PEV Charging Facility
In contrast to the system-wide PEV charging demand estimation, only a single charging facility is considered, and the demand profile of this facility is estimated. Queueing theory is widely used in demand modelling of charging facilities, in which a charging facility is modeled as a queue, while PEVs are modelled as customers in the queue. These PEVs acquire a charging service from a limited number of identical chargers (servers). Fast charging stations are modelled by M/M/c queues [4,30]. The first M denotes a Markovian (memoryless) arrival process, which follows the Poisson process with exponential interarrival times. The second M denotes exponential service (charging) time distribution. There are c identical chargers in the charging facility, which also indicates the maximum number of PEVs that can be charged simultaneously. This model assumes that all the arrived PEVs will wait for the charging service, which means unlimited waiting positions in the charging facility. In order to consider the limited waiting positions in charging stations, M/M/c/S queues employed in [15], where S denotes the number of waiting spaces. If all the waiting positions in the facility are occupied, the newly arrived PEV will leave the facility without charging. Parking lots are modelled by M/M/c/k/Nmax (c ≤ k ≤ Nmax) queues [30], where Nmax denotes the number of users. The chargers in the parking lots are considered privately owned or shared only by a limited number of users, while an unlimited number of users are considered for fast charging stations [30]. The queue modeling of a single charging facility is based on the following assumptions:
- The charging (service) process is independent among chargers and exponentially distributed [31]. PEV battery charging behavior should be taken into account when modeling the service time [4]. The relation between the charging time and PEV battery SOC is nonlinear, which may be approximated by a piece-wise linear relationship.
Previous studies assume the charging station location and charging time are fixed, which is not accurate as PEV charging demand varies in space and time. A spatial-temporal demand estimation model for a rapid charging station at a highway exit is presented in [31]. The arrival rate is predicted by the fluid dynamic model. Then, M/M/c queue is employed to model the spatial-temporal demand of charging stations. Based on queuing analysis, the expected number of PEVs being simultaneously charged at any time can be derived. Then, the PEV charging power during the charging period is determined based on the daily recharge energy of a PEV, charging duration, and charging voltage. Based on PEV charging demand, the number of chargers and the size of waiting space in the charging facility can be determined to meet the specified blocking probability for incoming customers. The numbers of chargers and waiting positions can be optimized to maximize the profit of services providers [15]. For parking lots, the decision variables include the charging rate as well as charging start time. These variables can be optimized to shape a target charging profile. Various load profile shaping approaches can be applied, such as valley-filling and peak clipping [15].
2.3. Demand Modeling of PEV Charging Station Network
Estimation of PEV charging demand among a network of charging stations and the utilization of each station depend on the dynamics and random mobility of PEVs, and hence traffic density in the surrounding areas. This estimation is essential for utilities and system operators to allocate power and customers among charging stations in the network, to ensure the lowest blocking probability of new customers. Hence, it aims at highest quality of service and profit for the system operator. Utilities have limited power sources to be allocated among charging stations to meet the PEV charging demand at each charging station, to satisfy a certain blocking probability of new customers for every charging station in the network. Allocation of electrical power and customers in a network of charging stations is studied in [17]. Each charging station is assumed equipped with ESS to meet stochastic charging demand. A charging station is modelled by two-dimensional continuous time Markov chain, whose states depend on the available grid resources and level of energy stored in ESS. The quality of service (QoS) of each charging station is determined based on the long-term blocking probability of new customers. Allocation of grid resources and routing of customers are optimized in order to meet the QoS target at each station and serve more customers with the available grid power resources, thus increasing the profit of station operator. Computing the minimum amount of grid resources to guarantee certain QoS for customers in a network of charging stations is presented in [32]. Two frameworks are proposed in this work. The first is price based control, in which charging price is varied in order to control the arrival rate of customers to the charging facilities for a given amount of available grid resources. This framework aims to maximize the social welfare of utilities. It is suitable for charging stations located in metropolitan areas, which contain a large PEV population. The second framework is for resource provision, in which the objective is to compute the minimum amount of grid resources in order to achieve a certain level of QoS for PEV users. It is suitable for small areas with fewer PEV users. This problem can be formulated, given the customer arrival rate to each station. Modelling the interaction among charging stations is presented in [16], in which the arrivals of PEV users to charging stations vary in response to charging prices. Charging demands of adjacent charging facilities are correlated to each other and rely upon the reaction of PEV users to charging prices. A network of charging stations is modelled by the BCMP (Baskett, Chandy, Muntz and Palacios) queueing network model, which characterizes the interaction among the charging demand of multiple charging stations. Factors such as PEV traffic flow, transportation network, charging demand of a single PEV, and charging decision making processes of PEV users are considered. The output of this model is the upper-bound of charging station demands versus charging price and the number of chargers.
In this section, estimation of the PEV charging demand is grouped in three levels: (1) system-wide PEV demand estimation, (2) single charging facility demand estimation, and (3) network of charging facilities demand estimation. The usage of each estimation level is presented. The methodology and the scope of each estimation level are also discussed. Impacts of PEVs on power system, in addition to charging infrastructure planning and design, are discussed in details in the following sections.
3. Impact Assessment of PEVs on Power System
In Section 2, the estimation of PEV charging profile is discussed, whether for system-wide PEVs, single charging station, or a network of charging stations. In addition, utilities have an estimation of the conventional load demand of different customer classes on the power system, i.e., residential, commercial, and industrial. The total load of the system includes both the conventional load demand profile and the PEVs charging profile. Load growth should be taken into consideration in studying PEV impacts, which account for addition of new customers and new uses of electricity, during the time period of study [23,33]. After the total system load is estimated, impact assessment of PEV charging loads on the operation of distribution system, transmission system, and power generation can be conducted.
Impact assessment of PEV charging load on the distribution system can be done by two approaches: uncontrolled operation and optimal operation of the distribution system [4]. A summary of the approaches along with analysis tools is given in Table 2. In the uncontrolled operation, power flow (PF) analysis is used to determine the impacts of total load on the distribution system. PF is a tool that provides a steady state analysis (a snapshot) for the state of the system. An assessment of PEV impacts on the low voltage (LV) and medium voltage (MV) parts of the distribution system is presented in [33]. The objective is to determine the impacts of total system load, which include both conventional load and PEV charging load, on the high voltage (HV)/MV transformers, MV transmission cables, MV distribution cables, and MV/LV transformers. PF analysis is used to calculate node voltages, line currents, transformer loadings, and peak losses in both lines and transformers. Deterministic PF analysis uses specific power generation and load profile in calculating system states. However, the randomness and uncertainty in power system and the variation of load demand are ignored in this calculation [34]. To capture the randomness and uncertainty of the PEV charging load demand, probabilistic power flow (PPF) is proposed to assess the impacts on distribution system [30]. The probability density function (PDF) and cumulative distribution function (CDF) of the PEV charging demand are obtained as the input to PPF, which is then calculated based on the point estimation method in order to determine the system states and power flows in terms of the PDF or CDF. Uncertainty of PEV charging demand is considered in this method. MCS is another method to take the uncertainties of PEV charging load into account [35,36]. A distribution based on roulette wheel selection concept can be used to characterize the occurrence frequency of the PEV charging load [35]. MCS is then used to generate scenarios based on the PEV load profile distribution. PF analysis can be conducted to determine average losses, ranges of voltages and branch currents variations at feeder nodes and sections. In this approach, local distribution company (LDC), which is responsible for operation and control of the distribution network, does not take any operational and control action to manage the system voltages or loading on system components [4].
In optimal operation of the distribution system, optimal power flow (OPF) is used to determine the instantaneous optimal steady state of various control variables in the system, such as output power of generating units, voltage at generating units, position of transformer taps, and status of switched capacitors and reactors. LDC operational and control actions are taken based on OPF in order to control system voltages to ensure system stability. These actions alleviate the impacts of PEV demand on the distribution system. OPF can be carried out to minimize feeder losses [4]. The problem is constrained by the demand-supply balance represented by PF equations, bus voltage limits, and substation capacity limits. To capture the uncertainty of PEV charging demand, stochastic OPF can be used to examine the impact of total system loads on distribution system operation. Various objective functions can be used in the stochastic OPF such as minimization of expected loss, minimization of expected energy drawn, and minimization of expected cost of PEVs charging [21]. The problem is constrained by the demand-supply balance, bus voltage limits, limits on capacitor support, and substation capacity limits.
Two system performance metrics can be used to assess the impacts of PEV charging profile on the distribution system [36]. One is the percentage of customers with voltage problems. This metric checks the voltage characteristics for customers and checks compliance with the standard BS EN 50160, which states that node voltage must be between 0.9 and 1.1 per-unit during 95% of the time and never below 0.85 or above 1.1 per-unit. Customers with different voltage characteristics are considered to have voltage problems. The other metric is the loading level, which is an indication of the potential congestion in the system. At the feeder level, the loading level is determined by dividing the hourly maximum current at the feeder by the ampacity (maximum ampere capacity) of the head feeder. At the transformer level, this matric is determined by dividing the hourly maximum apparent power by the transformer capacity.
To evaluate the dynamic impacts of PEVs on the transmission system level, three nodal time-varying impact indices can be used [37]: The first is line congestion, which indicates the shortage in transmission line capacity to meet the waiting load; The second index is nodal voltage deviation, which determines the voltage drop in system nodes; The third index is system energy loss rate, which represents the percentage system daily energy loss in the total daily energy consumption. The time sequential PF analysis can be used to calculate the nodal impact indices on the transmission system.
To assess the impacts of PEV charging loads on generation units, a stochastic security-constrained unit commitment (Stochastic SCUC) model can be used in order to coordinate PEV aggregated charging profile with wind energy in the power system [38]. The objective is to minimize the expected grid operation cost, while considering the uncertainty of PEV charging loads. The model solution computes the hourly unit commitment and dispatch of generating units, in addition to charge/discharge schedules of PEVs.
To summarize, there are various tools and approaches to asses and to mitigate the impacts of PEV charging loads on distribution system, transmission system, and power generation. In the following sections, PEV charging infrastructure planning and charging facilities design are discussed.
4. Charging Infrastructure Planning
One of the major barriers towards mass adoption of PEVs is the availability of charging infrastructure. Planning of charging facilities has several challenges: Firstly, PEVs are characterized by the limiting driving range, and it is difficult to increase the driving range significantly in the near future. Consequently, charging facilities should be pervasive and widely spread over a given area, so that PEVs can go easily to every corner of the given area with an available charging facility nearby [11]. Planning of charging infrastructure must solve the drive-range anxiety problem. Secondly, PEV users may not accept long waiting queues at charging facilities. Planning of charging infrastructure must ensure a suitable number of charging facilities on demand zones to prevent traffic congestion [26]. On the other hand, the initial investment of charging infrastructure construction is more likely to take place in the current densely populated regions. Therefore, planning of charging facilities should not match the peak time charging demand to ensure the economic benefits and high utilization of each charging facility [39]. Proper determination of the number of chargers and waiting spaces in charging facilities is required to achieve the charging QoS for PEV users. Thirdly, PEVs need high charging power, which may increase the peak load in some parts of electric power distribution network. Thus, PEV charging profile can cause voltage deviation and high power loss in some feeders in the power distribution system [12,40]. Planning of charging infrastructure must guarantee safe and reliable operation of the power system.
Planning of charging facilities involves sizing and sitting problems. Sizing of the facility determines the number of chargers, charging level, and size of waiting space. Capacity of feeders and transformer that connect the facility with the power system are also determined in this problem. Sitting of the charging facilities is to select the most suitable locations for facility construction. These places should be easily accessible by PEV users, and suitable for integration with both the vehicle transportation and the power distribution networks. Various demand coverage models and planning objectives can be used in the sizing and sitting of PEV charging infrastructure. Demand coverage models are the techniques to estimate the potential PEV charging demand. Based on the estimation, various planning objectives can be defined in order to size and site the charging faculties. These objectives can be related to transportation network, power system, or both of them. Demand coverage models and planning objectives of the sizing and sitting problems are discussed in the following subsections.
4.1. Sizing and Sitting Problems: Demand Coverage Models
Planning of charging infrastructure should be based on an accurate estimation of the potential PEV charging demand. Estimation of PEV charging demand, as discussed in Section 2, is different from that for planning problem. When the PEV charging profile is estimated, the locations of charging facilities are assumed to be defined, and the PEV load demand at these facilities are estimated. This is not the case in the planning problem, since charging facilities are not yet deployed. Demand coverage models are responsible for estimating the locations and time, in which PEVs request charging services. There are four basic demand coverage models in sizing and sitting of charging facilities: nodal PEV density-based model, traffic flow-based model, real data based model, and stochastic planning model. A summary of the models along with the main feature of each method is given in Table 3.
4.1.1. Nodal PEV Density-Based Model
The basic assumption in this model is that PEV charging demand (request) is in a certain location, such as residential area or shopping center. PEV users need to travel from their locations (demand point) to charging facility locations to charge their PEV batteries [12,48].
In this model, a given area, in which charging infrastructure planned, is divided into small unit areas (cells). A charging facility is assumed to be in the center of each unit area. This area is defined as the service area of the charging facility. The service radius of the charging facility is set to be less than or equal to the driving range of PEVs, and the distance between any two nearby charging facilities is larger than the PEVs driving range and less than double the driving range [40]. The service area of each charging facility is divided as a Voronoi diagram, which is used in geographic information systems (GIS) [40]. The potential demand in the unit area is proportion to the average number of PEVs parked at the service area of charging facility. The number of PEVs within the service area of a charging station can be known by real time, historical, or statistical data about PEV locations [42,43]. The density of PEVs in each cell reflects the potential PEV charging demand in that cell. In order to model the PEV parking traffic, every PEV is characterized as being located in one of three area types, which are residential, commercial, and hospital area. The PEV parking density in these areas can be estimated by plateau shaped functions with the curved tails defined using Gaussian function [41]. This function estimates the number of parked PEVs in these areas as a function of time. After the PEV density at each cell is determined, the planning model is used to find the facility locations that maximize the number of covered nodal demand [12]. PEV travel distance and time are the key system utility indicators, since dedicated charging trips by PEV users are assumed from demand points to facility locations [48]. Planning objectives based on the nodal PEV density model are discussed in Section 4.2.
Multi-objective planning can take account of the network geographical information and the nodal demand differences [12]. However, this method cannot estimate the potential PEV charging demand accurately, since it treats PEV demand as static and fixed in each node. Moreover, PEV users usually prefer to charge their PEVs during the trip to the destination locations, instead of engaging in a dedicated trip to the charging facility [48]. Therefore, PEVs mobility, which depends on factors such as user behaviors and local traffic condition, must be considered in the potential PEV demand estimation.
4.1.2. Traffic Flow-Based Model
To account for PEV mobility, the potential charging demand can be represented as a flow on the transportation network. This representation is based on the assumption that PEV users tend to charge their vehicles during the travel to the destination locations [48]. Hence, the traffic flow conditions on the road system can be used in reflecting the charging behavior of PEVs. When the traffic flow in a certain road is high, there is a high probability that the charging demand at that road will be high. Therefore, the distribution of traffic flows can be used in planning charging infrastructure [44].
Traffic flow is defined as the number of PEVs, which travel along the lines that connect different transportation system nodes along a pre-determined travel route [12,45]. To determine the traffic flow, origin-destination (OD) matrix can be employed to model the demand distribution in the area of interest. PEV users are assumed to prefer traveling on the route with the shortest distance between the origin and destination. This route can be identified by Dijkstra or Floyd algorithms [12]. The potential PEV charging demand is satisfied if at least one charging facility is located along the pre-determined travel route. Traffic flows between each OD pair can be provided by navigation systems [44], generated based on household traffic survey [53], or artificially generated by traffic simulator models [12]. After the PEV traffic flows are determined, charging facilities can be located on the traveling routes in order to maximize the captured PEV flows. Various planning objectives based on traffic flow model are discussed in Section 4.2.
Traffic flow based model estimates the spatial charging characteristics of a large number of PEVs with diversified travelling patterns [12]. However, the temporal characteristics of the charging demand are not considered in this method. Therefore, information about time of demand, service time, and waiting time cannot be estimated [48]. Such information is needed in the sizing of charging facilities.
4.1.3. Real Data-Based Model
Real world GPS data of a large PEV fleet or real traffic information can be used to estimate the potential PEV charging demand. A large volume of electric taxi trajectory GPS data is used to record data concerning vehicle identification, time, position, speed, and working condition [48,49]. This information is coupled with accurate information about the transportation network to recover PEV trajectories and dynamics, which indicates the spatial-temporal distribution of the potential PEV charging demand.
To overcome the drawbacks of traffic-flow based model, a spatial-temporal demand coverage model should be used [48]. Based on a large volume of raw taxi GPS data, this model is used to maximize electrical taxi service on roads and charging service at the stations. Electrical taxi service level is represented by the aggregated distance that a taxi travels. The longer total distances, the better level of taxi service. One charging service quality measure is the waiting time of the user in the charging facility. A shorter waiting time means better charging service. Results of this model include the spatial and temporal patterns of covered demands, in addition to charging and waiting behaviors, and the impact of charging speed. Due to differences between the PEVs and conventional vehicles, the behaviors of PEV users are expected to be different. For example, instead of charging the vehicle in the middle of a trip, PEV users are more likely to charge the PEVs at the destination, since charging time is relatively longer than refueling conventional vehicles. Additionally, PEV users can charge PEVs at home, if available. Therefore, representing the potential PEV demand based on traffic flows is not accurate. To address these gaps, real world GPS vehicle trajectory data can be used to accurately model the potential PEV charging demand [49].
This method can estimate the potential spatial-temporal PEV charging demand. However, a GPS receiver is required for each vehicle. In addition, the real time data are not very accurate, as the number of PEVs is currently low and PEV characteristics are different from conventional vehicles in terms of driving range and charging characteristics.
4.1.4. Stochastic Planning Model
A stochastic approach in estimating the potential PEV charging demand takes account of the uncertainty of PEV characteristics and driving behaviors. Variables such as the distance that a PEV travels, PEV arriving/departure time to/from the charging location, and the initial SOC of PEV battery are considered input variables of the probabilistic model [50,51]. For example, the distance travelled can be represented by a long-normal distribution function [50]. Arriving and departure time are modelled by a Gaussian distribution function. Initial SOC can be modelled by a long-normal distribution function [52]. Based on the distributions, a scenario generation approach can be used to model the PEV behaviors [50]. Different scenarios for the PEVs number, total aggregated SOC, and total aggregated battery capacities in a given area in each hour are generated. Based on these scenarios, a planner can distribute the PEVs among power distribution network buses to achieve the planning objectives. One way of estimating the number of PEVs in the zones of the distribution system is to use k-mean clustering method [51,52]. This method classifies the distribution system into zones, and determines the borders of zones. Then, the number of PEVs on the system zones is estimated, which is an indication of the potential PEV charging demand in the given area. In modelling the spatial-temporal characteristics of PEV charging loads, there are three decisive factors to characterize the charging loads: charging start time, charging power profile, and charging duration [54]. Based on these factors, charging traffic flow (CTF) can be simulated using urban traffic data to account the spatial-temporal characteristics of the charging loads. The stochastic modelling of potential PEV charging demand can represent the uncertainty of PEV characteristics and driving behaviors. However, this method is not commonly used in literature.
4.2. Sizing and Sitting Problem: Planning Objectives
In Section 4.1, various demand coverage models are presented for estimating the potential PEV charging demand. Sizing and sitting of charging infrastructure can be determined based on these models to achieve certain objective functions. The planning objectives can be related to the transportation network, power system, or both of them. Inappropriate siting and sizing of PEV charging facilities can have negative impacts on the penetration of PEVs, in addition to the transportation and distribution networks. The road network can encounter traffic congestion, and poor charging service quality for PEVs. Moreover, the distribution power network may have an increase in energy loss and degradation in voltage profiles at some distribution system nodes. In this subsection, various planning objectives are discussed. A summary of these planning objectives, for charging infrastructure sizing and sitting, is presented in Table 4.
4.2.1. Objective Functions Associated with Power System
PEV charging is a challenging process from view point of the electric power system, because PEV demand on charging power is huge. Additionally, time of charging and charging point are uncertain due to PEV mobility. Hence, impacts of improper planning of charging infrastructure will be significant to the power distribution system when a large number of PEVs charge simultaneously at the same distribution point. Several factors should be considered when planning charging facilities from the prospective of the power system, such as grid power loss, bus voltage deviation, and proximity to the substation.
Electrical power loss in the distribution system increases when charging facilities located far away from substations. The substations can be far from urban areas, which have high load density of PEVs. In such case, PEVs will encounter energy loss in order to reach the charging facilities. Therefore, sizing and sizing of charging stations can be formulated as an optimization problem with the objective function to minimize the electrical grid loss and PEV energy loss. Electrical grid loss is calculated via PF analysis, and PEV energy loss by using geographical information to estimate the distance between PEVs and charging facilities [55].
Planning of charging facilities in the distribution system should also minimize the total real power loss across the network as well as minimizing the total voltage deviation across all the buses. A multi-objective sizing and sitting problem can be formulated with objectives of minimizing total power loss and total voltage deviation. Power loss can be translated as an additional system operational cost, and high voltage deviation as unreliable performance at consumers end. The problem is subjected to several constraints related the voltage and power limits at the buses, and the number of waiting PEVs at each charging point [41].
The total charging infrastructure cost is a significant measure in the planning problem [40,42,52]. The total cost includes investment cost, operation cost, maintenance cost, and network loss cost. The investment cost includes the cost of charging devices, feeders, and transformers. The operational cost includes charging cost, active power filters cost, reactive power compensation cost, and human resource cost. The maintenance cost includes the per-unit capacity maintenance cost of the transformers, charging devices, and other devices in the charging station. The network loss cost is related to the amount of power loss and the cost of electricity. Problem constraints are the number of charging facilities, buses voltage and current limits, and capacity limitations of charging stations and its components.
4.2.2. Objective Functions Associated with Transportation System
One of the major challenges facing wide adoption of PEVs is the limited driving range and long charging time. Irrational placement of PEV charging stations with respect to the transportation network will lead to an extra driving distance, potentially exceeding the driving capability of PEVs. Limited PEV battery capacities will have a significant influence on the sitting of charging facilities [12]. Therefore, the planning of charging infrastructure must ensure satisfactory charging service to significantly promote the penetration of PEVs. This can be done by sitting the charging facilities in locations which are accessible by PEVs users in every corner of the given area [11]. Moreover, the sizing of a charging facility should be proportional to the expected number of PEVs reaching the charging facility without causing a traffic congestion and with an acceptable waiting time.
Several solutions are proposed in literature to solve this planning problem, which are based on a famous problem in transportation research, the so called facility location problem [48]. Some planning objectives are based on the flow demand model to estimate the potential PEV charging demand. Flow-capturing location model (FCLM) is one of the early models, which is a maximum coverage model. Charging facilities are sized and sited in order to maximize the captured passing flows. The flow is considered captured if there is a charging facility located on the flow path [47,56]. When the limited driving range of PEVs is considered, an extended version of FCLM is developed, referred to as flow-refueling location model (FRLM) [57]. The FRLM allows PEV users to have long distance trips via multi-stop charging [45,47]. In order to minimize the number of required charging facilities, the FCLM can be farther developed to allow deviation paths under an assumption that PEV users may accept slightly longer trips to charge their vehicles, which adds flexibility in charging infrastructure planning. The multipath-refueling location model (MPRLM) enables PEV users to utilize multiple deviation paths between every OD pairs on the transportation network [47]. Other planning objectives based on the nodal demand density model can be used in sizing and sitting of charging facilities [48,53]. One objective is called p-median, to minimize the total travel cost between demand points and facility locations. Another objective is called p-center, to minimize the maximum travel cost among all the users and charging facilities. The maximal covering location problem (MLCP) model maximizes the served users within the maximum service radius, given a certain number of facilities.
4.2.3. Multi-Objective Planning Associated with Transportation and Power Systems
A multi-objective collaborative planning model can be developed, when considering both transportation and distribution networks in the planning problem. The objective is to integrate charging facilities with the electrical power distribution network and the vehicle transportation network, such as by minimizing total energy loss and buses voltage deviation, in addition to FCLM with constraints on PEV battery capacity [12]. The cross-entropy method can be used to solve the multi-objective planning model and obtain the Pareto solutions. Also, the multi-objective problem can be converted into a single objective optimization problem via weighted sum of objectives. Coupled distribution and transportation networks can be considered for the planning problem. For example, a hierarchical optimization model with three layers is presented in [58]. The first layer is a modified FCLM, considering limited power grid resources, duration of charging process, and battery characteristics. The second layer optimizes the allocation of the limited grid resources to minimize the customer blocking probability. The third layer maximizes the system profit by computing the maximum charging level, considering battery degradation costs and charging characteristics. Minimizing the total investment and operational cost, in addition to the FCLM model, can be done using a decomposition based multi-objective evolutionary algorithm (MOEA/D), which is used to solve the multi-objective problem [43,44]. A combined distribution and assignment (CDA) model is presented in [46], to account the availability of charging stations and price of electricity at the destination of each trip. This model also maximizes the social welfare, which determines the locational marginal price (LMP) of electricity at each location.
5. Design of PEV Charging Facilities with Integrated DER
One main challenge in the construction of PEV charging infrastructure is the high integration cost of charging stations with the distribution network. The capacity of charging facility, which determines the ratings of transformers and feeders, is designed to meet the expected peak PEV load demand. As a result, the cost of charging facilities increases as a function of the designed capacity due to the high cost of transformers and feeders [59]. PEV load demand is random and time variant by nature, which means that capacity of charging facilities will not be fully utilized all the time. Moreover, high PEV charging demand usually occurs in high electricity price periods, which leads to a high charging cost of PEVs [5].
Integration of PEV charging infrastructure with DER, such as RES, diesel generators, and ESS, is a potential solution to minimize the dependency on power grid as the only source of energy. This solution reduces the strain on the grid and reduces the integration cost of charging facilities with the distribution system. The reduction of integration cost can be higher than the cost of adding a DER to the charging facilities. When an RES is combined with the charging facility, a considerable amount of PEV charging demand can be supplied from the output power of RES. However, the output power from an RES is intermitted and depends on weather conditions. An ESS can be combined with an RES in charging facilities to overcome the variation in RES electricity generation. In this case, the ESS is used to store the excessive output power of the RES, when the output of RES is more than PEV charging demand, and the ESS can charge the PEVs when the RES output power is insufficient [8,29]. ESSs can also be integrated in charging facilities without the existence of an RES. The benefits of ESSs is to reduce the PEV charging time by increasing the rate of power transfer. Additionally, an ESS helps in decreasing the strain on the power grid during the peak PEV charging demand [6,60]. Peak electricity generation and transmission congestion are also alleviated when an ESS is employed, as ESSs help to flatten the PEV charging demand curve [59,61]. In addition to aforementioned benefits, charging cost can be reduced through energy arbitrage when time of use (TOU) pricing in electricity market is employed. During low electricity prices, an ESS will store energy, and the charging facility will serve the PEV charging demand from the imported grid power. During high electricity prices, PEV charging demand is covered by the energy stored in ESSs [62].
PEVs can be treated as dynamic DER through the V2G technology, which exploits the aggregated PEVs battery capacity by storing energy for the power system benefits. Two-way power flows can be interchanged between PEVs and the power system when V2G technology is employed [9]. V2G technology can be used to provide two main services [8]: active power support and frequency regulation. When V2G technology is used for active power support, PEV batteries can be discharged to the power system during peak load hours, while PEVs can be charged again on off-peak hours. PEV users can then benefit from the electricity price changes between peak and off-peak hours. On the other hand, V2G technology can be used to provide ancillary services, such as frequency regulation, by ensuring the demand-supply balance in the power system. Aggregated capacity of a large number of PEVs is used to provide capacity reserve for power system, which is able to provide a rapid response to frequency fluctuations that occur due to demand-supply imbalance.
Various energy sources are suitable for integration with charging facilities. The most common integrated energy sources are the RES, especially photovoltaic (PV) solar systems and wind turbines. The integration with RESs is very attractive, since RESs are sustainable sources of electrical power. Additionally, the capital and operating costs of RESs decrease over time. Intensive research is done in this area and various system topologies are proposed. Reviews on this research area are presented in [8,29,63]. Non-renewable energy sources such as diesel generators can also be used as a supplemental source of energy in the charging facilities in countries which rely on diesel as a primary source of energy [64].
Different energy storage technologies are suitable to be integrated with PEV charging facilities, including batteries, flywheels, and super-capacitors [6,65,66]. Batteries store energy in the form of electrochemical energy. In the charging process, electrical potential is applied and chemical reaction takes place. This chemical reaction is reversed in the discharging process. Different battery technologies are available in the market today, such as lead-acid batteries, lithium ion batteries, and Li-polymer batteries. The characteristics of the batteries depend on battery type. In general, main advantage of batteries is the high energy density, and main disadvantage is the limited lifetime which depends on the number of charging-discharging cycles. Also, the performance depends on the ambient temperature. Lithium ion batteries are considered the most common ESS implemented in charging facilities due to its relatively high energy and power density. However, the replacement cost of batteries is what make them less desirable.
Flywheels store the energy in the form of kinetic energy. In the charging process, a flywheel is accelerated by a motor. This motor is used as a generator in the discharging process. The life cycle and power density of flywheels are around 10 times of the batteries. The lifetime of flywheels does not depend on charging-discharging cycles. The operating temperature range of flywheels is wider than that of batteries. However, flywheels are characterized by a short discharging time (seconds-minutes), and higher capital cost as compared to batteries. Flywheels are incapable to provide power for a long period of time, so it is not the best option in the application of PEV charging facilities. Super-capacitors store energy electrostatically, and are characterized by a very high power density and a low energy density in comparison with batteries. The number of super-capacitor charging-discharging cycles does not affect its lifetime. Moreover, high efficiency and fast charging time are among the advantages of super-capacitors. Super-capacitors (or ultra-capacitors) have higher capital cost than batteries. Also, for the same energy storage, super-capacitor size is larger than that of batteries. Typical values of energy density, power density and energy efficiency for the three energy storage technologies are summerized in Figure 2 [6]. A comparison among the different types of ESS, which can be integrated with the distribution system as well as the PEV charging facilities, can be found in [66].
The integration of PEV charging facilities with a DER can be designed via three basic integration schemes: DER integrated within the charging facility, DER integrated in a microgrid containing a charging facility, and integrating of both DER and charging facility in a distribution system. A summary of the research works in this area is given in Table 5.
The first scheme is to design charging facilities with an on-roof PV system and/or an ESS. The main research problem is to size the PV system and determine the capacity of ESS, which minimize the grid dependency and maximize the utilization of the on-roof PV system. Technical benefits of using PV systems in charging facilities are investigated in [67], by first estimating the daily production of the PV system in charging facility, considering different factors such as facility location, solar panels technology, panel orientation (azimuth and tilt angles), and time of the year. A PEV charging profile is also estimated. Then, PF analysis is conducted with consideration of the PV system output power, PEV charging profile, and imported/exported power from the grid, in order to determine a strategy that maximizes the self-consumption energy in the charging facility, and hence to increase the profitability of the PV system installed in the charging facility. A design model based on Markov chains is proposed in [61,68], in which the sizing of PV system and ESS is studied based on the required charging QoS defined by the customer blocking probability. In [61], the charging station is assumed drawing a constant power from the grid, and ESS is used to meet the stochastic PEV load demand. The available power from the grid, which is not used in PEV charging, is used to charge the ESS. If the PEV charging demand is higher than the available power from the grid, the available energy stored in the ESS is also used to serve the PEV charging demand. In order to relate the size of ESS to QoS of the charging facility, a two-dimensional Markov chain is used to model this system. One dimension of the state space corresponds to the PEV arrivals to the station, while the other dimension represents the charge level of the ESS. Performance of the charging facility with respect to the PEV arrivals, PEV charging demand, and ESS size is then evaluated. Optimal size of charging facility components, which are battery ESS, PV system, and grid transformer, is studied in [69]. The objective is to maximize the utilization of system components. The problem is constrained by the maximum allowable grid transformer size, and maximum allowable energy exchange between the charging station and the power grid. Optimizing the size of Flywheel ESS to minimize the energy cost and storage cost is presented in [60]. Energy flows between the station and the grid is also optimized. The objective function minimizes the cost of one-year scheduling horizon of a charging facility with ESS, which includes the annual cost of ESS and the cost of purchasing electricity from the grid. The annual cost of ESS is calculated by adding the investment cost, the maintenance cost, and the replacement cost of ESS, which represents the life cycle analysis of ESS. On the other hand, optimal orientation of PV panels with consideration of seasonal variations of the PV system yield is an important design factor [70]. The seasonal and daily variations in solar insolation should be analyzed in order to determine the availability of solar energy. Hence, the necessary grid connection can be determined in order to serve the expected PEV charging demand. The design objectives are to minimize the dependency on grid supply and maximize the usage of solar energy in PEVs charging. Dynamic PEV charging can minimize the grid dependency by varying the charging power based on the available solar energy. In [59], optimizing the size of ESS to minimize the integration cost of the charging facility and minimize the charging cost through energy arbitrage is investigated. The objective is to minimize the investment cost of the charging facility, and to minimize the electricity purchase from the grid, by choosing optimal capacities of the transformer, feeder, and ESS. Operation of the ESS can be also optimized by scheduling the charging/discharging power to make use of the time-variant electricity prices. The integration cost of the charging facility can be farther reduced, if peak charging power can be deferred to decrease the capacity requirements of transformer and feeder.
The second scheme is associated with a microgrid that contains PEV charging facilities, RES and ESS. The main objective is to find an appropriate energy management system that efficiently manages the energy transfer between system components in both grid-connected and standalone configuration. In the grid-connected microgrid configuration, charging facility is connected to the main grid with a possible exchange of energy between the charging facility and the grid. Charging facilities in cities and areas that have an access to a reliable grid will operate in this configuration most of the time. In the standalone microgrid configuration, the charging facility is isolated and not connected to the main grid. It can serve the PEV charging demand through the output power from the attached power generators and ESS. Such isolated charging facilities can be established along highways, where it is expensive to connect with the main grid. Optimal design and comparative economics studies of charging facilities in the two configurations are presented in [64]. The design of charging facility microgrid in both configurations is to minimize the total net present cost of the station, which contains the capital cost, replacement cost, operation and maintenance cost, fuel consumption cost, and cost of purchased power from the grid. The optimal break-even distance for the grid connected charging facility to be a viable option can be determined, as designing the charging facility (whether as standalone microgrid or grid-connected) depends on the distance to the grid connection. In [71], optimal scheduling of power generating units in a microgrid with a charging facility is investigated, while considering the stochastic nature of RES. The microgrid central controller should determine the optimal dispatch of power units and charging/discharging scheme for PEVs in order to minimize the total operational cost, and the cost of energy not supplied which represents system reliability. Stochastic PF analysis based on unscented transform method can be used to model the forecasted errors in the hourly load demand, electricity price, output power of RES, and PEV charging demand. In [72], a control algorithm of the ESS is presented for a charging facility in grid-connected and standalone configurations. In the grid-connected configuration, the optimal charging point of ESS is determined, while considering the constraints on the power flow at the point of connection with the grid and the PEVs charging demand. The charging demand is fully provided by the grid and the energy store in the ESS. In the standalone configuration, full charging or discharging point of ESS is avoided, in addition to minimize the deviation of PEV charging power from the nominal value. The power provided to the PEVs in this configuration depends on the current SoC of ESS. A real-time predictive control model is used to control the ESS in the two different configurations. Experimental implementation of a microgrid containing a charging facility, with integrated smart grid technologies such as smart meters, ESS, and information and communication technologies (ICT), is presented in [6]. In the proposed system prototype, ICT is implemented to manage the communication between the smart meter systems on the microgrid and on the charging station. V2G technology also plays a vital role in microgrid design. Because most PEVs are parked around 95% of the time, parked PEV batteries can be used as energy storage units, to increase RES utilization [73,74]. To ensure the balance between energy production and supply, a two-level control algorithm based on model predictive control can be used to manage the interaction of hybrid storage systems (batteries and fuel cells), RES, and V2G system [73]. The first level controls the power flow exchange between the different components on the microgrid and the charging facility, while the second level optimizes the exchange of energy between the microgrid and the external power grid. A coordination dispatch model can be used to exploit PEV battery capacity in utilizing the intermitted RES output within the microgrid [74]. The coordination model aims to minimize the variance of equivalent load by scheduling the charging/discharging of the PEVs with considering the intermitted characteristics of RES. The V2G enabled PEVs can be scheduled to charge when there are excessive RES energy production and to discharge when the load demand is higher than the energy production.
In the third scheme, PEV charging facilities and DER are integrated into the distribution system. The research problem is how to manage the co-existence of charging facilities and DER in the distribution system. Alleviating the impacts of PEV charging loads on the system performance, in addition to energy management for the benefits of distribution system, is the main objective. For example, designing PEV charging facilities with ESSs to regulate the voltage at the distribution system feeders with high PV penetration is proposed in [75]. PV energy penetration level in a feeder is defined as the ratio of the amount of generated energy from PV to the total energy consumption. High penetration of a PV system affects the voltage quality in the case of high generation and low load condition. Coordination of charging facilities with ESSs is used to provide a voltage support in feeders with PV, which avoids the need of distribution system reinforcement and active power curtailment. How to determine the optimal value of the ESS storage power is studied for voltage support in the feeder in a particular location. The ability of charging facility with integrated DER to serve as a smart energy microhub is investigated in [5]. The energy hub is a facility which has the capability to exchange power with the surrounding systems, and serves as an interface between various energy sources and loads. Such charging facility is designed to provide capacity support service to the distribution system under contingency conditions, which reduces the system loss and avoids system upgrades. Various models are used to evaluate the feasibility of this charging facility: The PEV charging profile is firstly estimated; A distribution margin assessment model is used to maximize the load serving at a charging facility bus in the distribution system; A DG penetration assessment model is used to estimate the maximum DG unit capacity that can be integrated into charging facility bus over the planning period; An economic assessment model optimizes the prospective investor plan of the new design of charging facility; Finally, a distribution operation model is used to evaluate the investment decisions and determine the most suitable design at that particular location from the LDC’s point of view. Optimal sizing and sitting of DGs in a distribution system with integrated PEV charging facilities are investigated in [19,76]. DGs are basically used to support the power system and active power generation. Additionally, the injected active power from DG units can adjust the voltage profile and positively reduce the power losses for related buses and the line, if it is placed in an appropriate location. The integrated charging stations to the distribution system are characterized by a high load demand, which causes degradation in the voltage profile and increases power loss in the distribution system. DG units can be used to compensate for the load profile of these stations, hence adjust the voltage profile and power loss on distribution system feeders. In this case, the planning objectives of DG units are to minimize the power loss and improve the voltage profile in the distribution system. Various benefits for the power distribution system can be achieved by introducing V2G enabled PEVs. One is the valley filling concept, which is implemented by coordinating the PEVs to charge at the off-peak hours and during the periods that the production of RES exceeds the load demand. In this case, PEV users can buy (charge) energy with cheap electricity prices in off-peak hours. During the peak hours, PEVs can support the grid by supplying active power stored in batteries through V2G technology. PEV users can then sell (discharge) energy to the distribution system with higher prices. A price based coordination mechanism can be used to allocate the PEV charging demand on the valley hours and enabling V2G capability on the peak hours to minimize the load variance [77]. To enable such PEV management structure, a communication system is needed for information exchange between PEV users and the system operator. Reactive power compensation is another benefit that can be gained by integrating V2G technology in the distribution system. Reactive loads on the grid are inductive type, hence reactive power can be compensated by allowing the PEV bidirectional battery charger to absorb reactive power of capacitor type [78]. Different from the V2G in the valley filling concept, the usage of V2G in reactive power compensation does not involve any exchange of energy. Therefore, the concerns about degradation of PEV batteries due to additional charging/discharging cycles or the availability of adequate energy in the batteries for PEV user needs no longer exist.
6. Summary and Future Research Directions
In this paper, we have presented recent studies on PEVs charging infrastructure impact assessment and planning. Modelling of different levels of PEV charging demand is investigated to account for the uncertainty of driving behaviors and PEV characteristics. Impact assessment approaches, tools, and indexes of PEV charging loads on power system are presented. Moreover, a comprehensive literature review on various demand coverage models and planning objectives of PEV charging infrastructure is given. A review on designing charging facilities with integrated DER is also presented. There are many open research issues in this area, some of which are summarized in the following:
- PEV behavior modelling: Existing models of PEV charging demand are based on the assumption that PEV users have the same behaviors as conventional vehicle users. This assumption is not accurate as PEVs have a limited driving range, limited battery capacities, and a relatively longer charging time than gas refueling. In addition, PEV users are expected to have a relatively higher income level, due to high cost of PEVs. These differences will affect the PEV usage patterns. Specialized studies, travel surveys, and field measurements are needed in order to extract the exact PEV usage patterns and travel behaviors. One such study is presented on [13], based on 76 vehicles with installed GPS devices over a one year period. The harvested data from this study includes the actual SOC of the battery, parking durations, parking locations, and vehicle powertrain characteristics. Studies on larger PEV fleets in various countries in the world will be necessary to accurately model the usage patterns and driving behaviors of PEVs. Such data can be used in modelling of PEV charging demand, which enables optimizing of charging infrastructure planning and alleviating the negative impacts of PEVs on power and transportation systems;
- Co-planning of DG and PEV charging infrastructure: As discussed, integration of DG units into the distribution system can mitigate the negative impacts of PEV loads on the distribution system [19]. However, how to simultaneously locate DG units and PEV charging infrastructure in the distribution system, while considering the uncertainty in both DG outputs and PEV load, needs further investigation. The co-planning problem should address challenges such as voltage control, harmonic distortions, fault current, and flickers. Integration of new operational approaches for the distribution system to manage co-existence of these technologies is a non-trivial task. A stochastic modelling of this system is necessary to deal with many random phenomena in the system. Reliability analysis and system protection are essential;
- Wireless charging of PEVs: Wireless power transfer technology is a relatively new charging technology, which is introduced to enable PEV charging without cables. Wireless charging can be classified to either stationary or dynamic charging [79,80]. Stationary charging enables the PEVs to be charged when they are parked. It is successfully introduced in electrical transient buses, which are frequently stopped during loading and unloading passengers. When stationary wireless chargers are deployed in bus stations, bus battery sizes can be reduced by two thirds. SAE international approves the standard TIR J2954 for stationary wireless charging [81]. On the other hand, dynamic charging enables PEVs to be charged when moving on-roads. The on-board battery back can be significantly reduced; hence PEVs become lighter in weight and may be less expensive. Moreover, range anxiety and concerns about charging time will be eliminated if a large scale charging infrastructure based on dynamic wireless charging is deployed. However, wireless charging suffers from low efficiency, high power loss, and lack of standards for dynamic charging [80]. Also, power flow management of simultaneously charging PEVs on the same dynamic charging lane and the impacts on the distribution system are still open issues. Intensive research is needed to enable such technology and features such as V2G via wireless charging;
- Charging station selection: PEV users may select a charging facility based on their preference, for example, charging facility that is closest to the driver or that the driver is familiar with. This preference may not conform to power system constraints, which can cause power loss or stress on the distribution system. Therefore, further studies are needed to firstly define PEVs users’ personal preferences, then identify a charging spot which is close to customer choice and is confined with power system constraints. Vehicular ad hoc networks (VANETs) can be used as a method of exchanging such information between PEVs user and LDC [82]. In such network, road side units (RSUs) deployed along the roads will facilitate information exchange with vehicles. This communication network can help to obtain a real-time information of the SOC of PEVs, trip route and destination, in addition to user preferences and acceptable charging price. LDC can also collect information about the occupancy status of the charging stations, and loading on the distribution system. LDC can then advice PEV users to use certain charging stations, to manage the integration of a large fleet of PEVs in the system with minimal negatively impact the power system and to ensure the high QoS for PEV users.
Acknowledgments
This work was supported by a research grant from the Natural Sciences and Engineering Research Council (NSERC) of Canada.
Author Contributions
The work is jointly done by Ahmed Abdalrahman and Weihua Zhuang.
Conflicts of Interest
The authors declare no conflict of interest.
References
- International Energy Agency. Global EV Outlook 2016: Beyond One Million Electric Cars; International Energy Agency: Paris, France, 2016. [Google Scholar]
- Rautiainen, A.; Repo, S.; Jarventausta, P.; Mutanen, A.; Vuorilehto, K.; Jalkanen, K. Statistical charging load modeling of PHEVs in electricity distribution networks using national travel survey data. IEEE Trans. Smart Grid 2012, 3, 1650–1659. [Google Scholar] [CrossRef]
- Tang, D.; Wang, P. Probabilistic modeling of nodal charging demand based on spatial-temporal dynamics of moving electric vehicles. IEEE Trans. Smart Grid 2016, 7, 627–636. [Google Scholar] [CrossRef]
- Hafez, O.; Bhattacharya, K. Queuing analysis based PEV load modeling considering battery charging behavior and their impact on distribution system operation. IEEE Trans. Smart Grid 2016. [Google Scholar] [CrossRef]
- Alharbi, W.; Bhattacharya, K. Electric vehicle charging facility as a smart energy microhub. IEEE Trans. Sustain. Energy 2017, 8, 616–628. [Google Scholar] [CrossRef]
- Sbordone, D.; Bertini, I.; Di Pietra, B.; Falvo, M.C.; Genovese, A.; Martirano, L. EV fast charging stations and energy storage technologies: A real implementation in the smart micro grid paradigm. Electr. Power Syst. Res. 2015, 120, 96–108. [Google Scholar] [CrossRef]
- Jin, C.; Sheng, X.; Ghosh, P. Optimized electric vehicle charging with intermittent renewable energy sources. IEEE J. Sel. Top. Signal Process. 2014, 8, 1063–1072. [Google Scholar] [CrossRef]
- Yong, J.Y.; Ramachandaramurthy, V.K.; Tan, K.M.; Mithulananthan, N. A review on the state-of-the-art technologies of electric vehicle, its impacts and prospects. Renew. Sustain. Energy Rev. 2015, 49, 365–385. [Google Scholar] [CrossRef]
- Wang, Q.; Liu, X.; Du, J.; Kong, F. Smart charging for electric vehicles: A survey from the algorithmic perspective. IEEE Commun. Surv. Tutor. 2016, 18, 1500–1517. [Google Scholar] [CrossRef]
- Hu, J.; Morais, H.; Sousa, T.; Lind, M. Electric vehicle fleet management in smart grids: A review of services, optimization and control aspects. Renew. Sustain. Energy Rev. 2016, 56, 1207–1226. [Google Scholar] [CrossRef] [Green Version]
- Lam, A.; Leung, Y.-W.; Chu, X. Electric vehicle charging station placement: Formulation, complexity, and solutions. IEEE Trans. Smart Grid 2014, 5, 2846–2856. [Google Scholar] [CrossRef]
- Wang, G.; Xu, Z.; Wen, F.; Wong, K.P. Traffic-constrained multiobjective planning of electric-vehicle charging stations. IEEE Trans. Power Deliv. 2013, 28, 2363–2372. [Google Scholar] [CrossRef]
- Ashtari, A.; Bibeau, E.; Shahidinejad, S.; Molinski, T. PEV charging profile prediction and analysis based on vehicle usage data. IEEE Trans. Smart Grid 2012, 3, 341–350. [Google Scholar] [CrossRef]
- Alizadeh, M.; Scaglione, A.; Davies, J.; Kurani, K.S. A scalable stochastic model for the electricity demand of electric and plug-in hybrid vehicles. IEEE Trans. Smart Grid 2014, 5, 848–860. [Google Scholar] [CrossRef]
- Ismail, M.; Bayram, I.S.; Abdallah, M.; Serpedin, E.; Qaraqe, K. Optimal Planning of Fast PEV Charging Facilities. In Proceedings of the First Workshop on Smart Grid and Renewable Energy (SGRE), Doha, Qatar, 22–23 March 2015; pp. 1–6. [Google Scholar]
- Liang, H.; Sharma, I.; Zhuang, W.; Bhattacharya, K. Plug-in Electric Vehicle Charging Demand Estimation based on Queueing Network Analysis. In Proceedings of the IEEE PES General Meeting, National Harbor, MD, USA, 27–31 July 2014; pp. 1–5. [Google Scholar]
- Bayram, I.S.; Michailidis, G.; Devetsikiotis, M.; Granelli, F. Electric power allocation in a network of fast charging stations. IEEE J. Sel. Areas Commun. 2013, 31, 1235–1246. [Google Scholar] [CrossRef]
- Wu, D.; Aliprantis, D.C.; Gkritza, K. Electric energy and power consumption by light-duty plug-in electric vehicles. IEEE Trans. Power Syst. 2011, 26, 738–746. [Google Scholar] [CrossRef]
- Shaaban, M.F.; Atwa, Y.M.; El-Saadany, E.F. PEVs modeling and impacts mitigation in distribution networks. IEEE Trans. Power Syst. 2013, 28, 1122–1131. [Google Scholar] [CrossRef]
- Green, R.C.; Wang, L.; Alam, M. The impact of plug-in hybrid electric vehicles on distribution networks: A review and outlook. Renew. Sustain. Energy Rev. 2011, 15, 544–553. [Google Scholar] [CrossRef]
- Shetty, S.; Bhattacharya, K. A Stochastic Distribution Operations Framework to Study the Impact of PEV Charging Loads. In Proceedings of the North American Power Symposium (NAPS), Charlotte, NC, USA, 4–6 October 2015; pp. 1–6. [Google Scholar]
- Tehrani, N.H.; Wang, P. Probabilistic estimation of plug-in electric vehicles charging load profile. Electr. Power Syst. Res. 2015, 124, 133–143. [Google Scholar] [CrossRef]
- Shafiee, S.; Fotuhi-Firuzabad, M.; Rastegar, M. Investigating the impacts of plug-in hybrid electric vehicles on power distribution systems. IEEE Trans. Smart Grid 2013, 4, 1351–1360. [Google Scholar] [CrossRef]
- Shaaban, M.F.; Ismail, M.; El-Saadany, E.F.; Zhuang, W. Real-time PEV charging/discharging coordination in smart distribution systems. IEEE Trans. Smart Grid 2014, 5, 1797–1807. [Google Scholar] [CrossRef]
- Lojowska, A.; Kurowicka, D.; Papaefthymiou, G.; van der Sluis, L. Stochastic modeling of power demand due to EVs using copula. IEEE Trans. Power Syst. 2012, 27, 1960–1968. [Google Scholar] [CrossRef]
- Tang, D.; Wang, P.; Wu, Q. Probabilistic Modeling of Nodal Electric Vehicle Load due to Fast Charging Stations. In Proceedings of the IEEE International Conference on Probabilistic Methods Applied to Power Systems (PMAPS), Beijing, China, 16–20 October 2016; pp. 1–7. [Google Scholar]
- Xiong, J.; Zhang, K.; Guo, Y.; Su, W. Investigate the impacts of PEV charging facilities on integrated electric distribution system and electrified transportation system. IEEE Trans. Transp. Electrific. 2015, 1, 178–187. [Google Scholar] [CrossRef]
- Jiang, C.; Torquato, R.; Salles, D.; Xu, W. Method to assess the power-quality impact of plug-in electric vehicles. IEEE Trans. Power Deliv. 2014, 29, 958–965. [Google Scholar] [CrossRef]
- Mwasilu, F.; Justo, J.J.; Kim, E.-K.; Do, T.D.; Jung, J.-W. Electric vehicles and smart grid interaction: A review on vehicle to grid and renewable energy sources integration. Renew. Sustain. Energy Rev. 2014, 43, 501–516. [Google Scholar] [CrossRef]
- Li, G.; Zhang, X.-P. Modeling of plug-in hybrid electric vehicle charging demand in probabilistic power flow calculations. IEEE Trans. Smart Grid 2012, 3, 492–499. [Google Scholar] [CrossRef]
- Bae, S.; Kwasinski, A. Spatial and temporal model of electric vehicle charging demand. IEEE Trans. Smart Grid 2012, 3, 394–403. [Google Scholar] [CrossRef]
- Bayram, I.S.; Tajer, A.; Abdallah, M.; Qaraqe, K. Capacity planning frameworks for electric vehicle charging stations with multiclass customers. IEEE Trans. Smart Grid 2015, 6, 1934–1943. [Google Scholar] [CrossRef]
- Verzijlbergh, R.A.; Grond, M.O.; Lukszo, Z.; Slootweg, J.G.; Ilic, M.D. Network impacts and cost savings of controlled EV charging. IEEE Trans. Smart Grid 2012, 3, 1203–1212. [Google Scholar] [CrossRef]
- Chen, P.; Chen, Z.; Bak-Jensen, B. Probabilistic Load Flow: A Review. In Proceedings of the 3rd International Conference Electric Utility Deregulation Restructuring Power Technologies, Nanjing, China, 6–9 April 2008; pp. 1586–1591. [Google Scholar]
- Leou, R.; Su, C.; Lu, C. Stochastic analyses of electric vehicle charging impacts on distribution network. IEEE Trans. Power Syst. 2014, 29, 1055–1063. [Google Scholar] [CrossRef]
- Navarro-Espinosa, A.; Ochoa, L.F. Probabilistic impact assessment of low carbon technologies in LV distribution systems. IEEE Trans. Power Syst. 2016, 31, 2192–2203. [Google Scholar] [CrossRef]
- Tang, D.; Wang, P. Nodal impact assessment and alleviation of moving electric vehicle loads: From traffic flow to power flow. IEEE Trans. Power Syst. 2016, 31, 4231–4242. [Google Scholar] [CrossRef]
- Khodayar, M.E.; Wu, L.; Shahidehpour, M. Hourly coordination of electric vehicle operation and volatile wind power generation in SCUC. IEEE Trans. Smart Grid 2012, 3, 1271–1279. [Google Scholar] [CrossRef]
- Ahn, Y.; Yeo, H. An analytical planning model to estimate the optimal density of charging stations for electric vehicles. PLoS ONE 2015, 10, e0141307. [Google Scholar] [CrossRef] [PubMed]
- Liu, Z.; Wen, F.; Ledwich, G. Optimal planning of electric-vehicle charging stations in distribution systems. IEEE Trans. Power Deliv. 2013, 28, 102–110. [Google Scholar] [CrossRef]
- Trivedi, A.; Menon, B.; Srinivasan, D.; Sharma, A.; Nicholas, W.F.D. Multi-Objective Siting and Sizing of E Charging Stations in the Distribution System. In Proceedings of the IEEE Smart Grid Technologies-Asia (ISGT ASIA), Bangkok, Thailand, 3–6 November 2015; pp. 1–6. [Google Scholar]
- Lin, X.; Sun, J.; Ai, S.; Xiong, X.; Wan, Y.; Yang, D. Distribution network planning integrating charging stations of electric vehicle with V2G. Int. J. Electr. Power 2014, 63, 507–512. [Google Scholar] [CrossRef]
- Yao, W.; Zhao, J.; Wen, F.; Dong, Z.; Xue, Y.; Xu, Y.; Meng, K. A multi-objective collaborative planning strategy for integrated power distribution and electric vehicle charging systems. IEEE Trans. Power Syst. 2014, 29, 1811–1821. [Google Scholar] [CrossRef]
- Xiang, Y.; Liu, J.; Li, R.; Li, F.; Gu, C.; Tang, S. Economic planning of electric vehicle charging stations considering traffic constraints and load profile templates. Appl. Energy 2016, 178, 647–659. [Google Scholar] [CrossRef]
- Chung, S.H.; Kwon, C. Multi-period planning for electric car charging station locations: A case of Korean expressways. Eur. J. Oper. Res. 2015, 242, 677–687. [Google Scholar] [CrossRef]
- He, F.; Wu, D.; Yin, Y.; Guan, Y. Optimal deployment of public charging stations for plug-in hybrid electric vehicles. Trans. Res. Part B Methodol. 2013, 47, 87–101. [Google Scholar] [CrossRef]
- Huang, Y.; Li, S.; Qian, Z.S. Optimal deployment of alternative fueling stations on transportation networks considering deviation paths. Netw. Spat. Econ. 2015, 15, 183–204. [Google Scholar] [CrossRef]
- Tu, W.; Li, Q.; Fang, Z.; Shaw, S.-L.; Zhou, B.; Chang, X. Optimizing the locations of electric taxi charging stations: A spatial—Temporal demand coverage approach. Transp. Res. C-Emerg. 2016, 65, 172–189. [Google Scholar] [CrossRef]
- Shahraki, N.; Cai, H.; Turkay, M.; Xu, M. Optimal locations of electric public charging stations using real world vehicle travel pattern. Transp. Res. D-Transp. Environ. 2015, 41, 165–176. [Google Scholar] [CrossRef]
- Neyestani, N.; Damavandi, M.Y.; Shafie-Khah, M.; Contreras, J.; Catalão, J.P. Allocation of plug-In vehicles’ parking lots in distribution systems considering network-constrained objectives. IEEE Trans. Power Syst. 2015, 30, 2643–2656. [Google Scholar] [CrossRef]
- Kazemi, M.A.; Sedighizadeh, M.; Mirzaei, M.J.; Homaee, O. Optimal siting and sizing of distribution system operator owned EV parking lots. Appl. Energy 2016, 179, 1176–1184. [Google Scholar] [CrossRef]
- Mirzaei, M.J.; Kazemi, A.; Homaee, O. A Probabilistic approach to determine optimal capacity and location of electric vehicles parking lots in distribution networks. IEEE Trans. Ind. Inf. 2016, 12, 1963–1972. [Google Scholar] [CrossRef]
- Baouche, F.; Billot, R.; Trigui, R.; El Faouzi, N.-E. Efficient allocation of electric vehicles charging stations: Optimization model and application to a dense urban network. IEEE Intell. Transp. Syst. Mag. 2014, 6, 33–43. [Google Scholar] [CrossRef]
- Yang, S.; Wu, M.; Yao, X.; Jiang, J. Load modeling and identification based on ant colony algorithms for ev charging stations. IEEE Trans. Power Syst. 2015, 30, 1997–2003. [Google Scholar] [CrossRef]
- Sadeghi-Barzani, P.; Rajabi-Ghahnavieh, A.; Kazemi-Karegar, H. Optimal fast charging station placing and sizing. Appl. Energy 2014, 125, 289–299. [Google Scholar] [CrossRef]
- Hodgson, M.J. A flow-capturing location-allocation model. Geogr. Anal. 1990, 22, 270–279. [Google Scholar] [CrossRef]
- Kuby, M.; Lim, S. The flow-refueling location problem for alternative-fuel vehicles. Socio-Econ. Plan. Sci. 2005, 39, 125–145. [Google Scholar] [CrossRef]
- Kong, C.; Jovanovic, R.; Bayram, I.S.; Devetsikiotis, M. A hierarchical optimization model for a network of electric vehicle charging stations. Energies 2017, 10, 675. [Google Scholar] [CrossRef]
- Ding, H.; Hu, Z.; Song, Y. Value of the energy storage system in an electric bus fast charging station. Appl. Energy 2015, 178, 630–639. [Google Scholar] [CrossRef]
- Negarestani, S.; Fotuhi-Firuzabad, M.; Rastegar, M.; Rajabi-Ghahnavieh, A. Optimal sizing of storage system in a fast charging station for plug-in hybrid electric vehicles. IEEE Trans. Transp. Electrific. 2016, 2, 443–453. [Google Scholar] [CrossRef]
- Bayram, I.S.; Michailidis, G.; Devetsikiotis, M.; Bhattacharya, S.; Chakrabortty, A.; Granelli, F. Local Energy Storage Sizing in Plug-in Hybrid Electric Vehicle Charging Stations under Blocking Probability Constraints. In Proceedings of the International Conference on Smart Grid Communications (SmartGridComm), Brussels, Belgium, 17–20 October 2011; pp. 78–83. [Google Scholar]
- Chaudhari, K.; Ukil, A. TOU Pricing based Energy Management of Public EV Charging Stations Using Energy Storage System. In Proceedings of the IEEE International Conference on Industrial Technology (ICIT), Taipei, Taiwan, 14–17 March 2016; pp. 460–465. [Google Scholar]
- Liu, L.; Kong, F.; Liu, X.; Peng, Y.; Wang, Q. A review on electric vehicles interacting with renewable energy in smart grid. Renew. Sustain. Energy Rev. 2015, 51, 648–661. [Google Scholar] [CrossRef]
- Hafez, O.; Bhattacharya, K. Optimal design of electric vehicle charging stations considering various energy resources. Renew. Energy 2017, 107, 576–589. [Google Scholar] [CrossRef]
- Haq, A.U.; Chadhry, M.J.; Saleemi, F. A Smart Charging Station for EVs with Evaluation of Different Energy Storage Technologies. In Proceedings of the IEEE Conference on Clean Energy and Technology (CEAT), Lankgkawi, Malaysia, 18–20 November 2013; pp. 248–253. [Google Scholar]
- Alhamali, A.; Farrag, M.E.; Bevan, G.; Hepburn, D.M. Review of Energy Storage Systems in Electric Grid and their Potential in Distribution Networks. In Proceedings of the 18th International Middle East Power Systems Conference (MEPCON), Cairo, Egypt, 27–29 December 2016; pp. 546–551. [Google Scholar]
- Brenna, M.; Dolara, A.; Foiadelli, F.; Leva, S.; Longo, M. Urban scale photovoltaic charging stations for electric vehicles. IEEE Trans. Sustain. Energy 2014, 5, 1234–1241. [Google Scholar] [CrossRef]
- Cairo, J.; Sumper, A. Requirements for EV Charge Stations with Photovoltaic Generation and Storage. In Proceedings of the 3rd IEEE PES International Conference and Exhibition on Innovative Smart Grid Technologies (ISGT Europe), Berlin, Germany, 14–17 October 2012; pp. 1–6. [Google Scholar]
- Islam, M.S.; Mithulananthan, N.; Bhumkittipich, K.; Sode-Yome, A. EV Charging Station Design with PV and Energy Storage Using Energy Balance Analysis. In Proceedings of the IEEE Innovative Smart Grid Technologies-Asia (ISGT ASIA), Bangkok, Thailand, 3–6 November 2015; pp. 1–5. [Google Scholar]
- Mouli, G.C.; Bauer, P.; Zeman, M. System design for a solar powered electric vehicle charging station for workplaces. Appl. Energy 2016, 168, 434–443. [Google Scholar] [CrossRef]
- Tabatabaee, S.; Mortazavi, S.S.; Niknam, T. Stochastic scheduling of local distribution systems considering high penetration of plug-in electric vehicles and renewable energy sources. Energy 2017, 121, 480–490. [Google Scholar] [CrossRef]
- Di Giorgio, A.; Liberati, F.; Germana, R.; Presciuttini, M.; Celsi, L.R.; Priscoli, F.D. On the Control of Energy Storage Systems for Electric Vehicles Fast Charging in Service Areas. In Proceedings of the 24th Mediterranean Conference on Control and Automation (MED), Athens, Greece, 21–24 June 2016; pp. 955–960. [Google Scholar]
- Mendes, P.R.; Isorna, L.V.; Bordons, C.; Normey-Rico, J.E. Energy management of an experimental microgrid coupled to a V2G system. J. Power Sources 2016, 327, 702–713. [Google Scholar] [CrossRef]
- Jiang, X.; Wang, J.; Han, Y.; Zhao, Q. Coordination Dispatch of Electric Vehicles Charging/Discharging and Renewable Energy Resources Power in Microgrid. Procedia Comput. Sci. 2017, 107, 157–163. [Google Scholar] [CrossRef]
- Marra, F.; Yang, G.Y.; Træholt, C.; Larsen, E.; Ostergaard, J.; Blažič, B.; Deprez, W. EV charging facilities and their application in LV feeders with photovoltaics. IEEE Trans. Smart Grid 2013, 4, 1533–1540. [Google Scholar] [CrossRef]
- Fazelpour, F.; Vafaeipour, M.; Rahbari, O.; Rosen, M.A. Intelligent optimization to integrate a plug-in hybrid electric vehicle smart parking lot with renewable energy resources and enhance grid characteristics. Energy Convers. Manag. 2014, 77, 250–261. [Google Scholar] [CrossRef]
- Karfopoulos, E.L.; Panourgias, K.A.; Hatziargyriou, N.D. Distributed coordination of electric vehicles providing V2G regulation services. IEEE Trans. Power Syst. 2016, 31, 2834–2846. [Google Scholar] [CrossRef]
- Buja, G.; Bertoluzzo, M.; Fontana, C. Reactive power compensation capabilities of V2G-enabled electric vehicles. IEEE Trans. Power Electron. 2017, 32, 9447–9459. [Google Scholar] [CrossRef]
- Jeong, S.; Jang, Y.J.; Kum, D. Economic analysis of the dynamic charging electric vehicle. IEEE Trans. Power Electron. 2015, 30, 6368–6377. [Google Scholar] [CrossRef]
- Ou, C.-H.; Liang, H.; Zhuang, W. Investigating wireless charging and mobility of electric vehicles on electricity market. IEEE Trans. Ind. Electron. 2015, 62, 3123–3133. [Google Scholar] [CrossRef]
- Bi, Z.; Kan, T.; Mi, C.C.; Zhang, Y.; Zhao, Z.; Keoleian, G.A. A review of wireless power transfer for electric vehicles: Prospects to enhance sustainable mobility. Appl. Energy 2016, 179, 413–425. [Google Scholar] [CrossRef]
- Wang, M.; Shen, X.S.; Zhang, R. Mobile Electric Vehicles; Springer: Berlin, Germany, 2016. [Google Scholar]
Figure 1.
Evaluation of the global electrical car stock, 2010–2015 [1].
Figure 1.
Evaluation of the global electrical car stock, 2010–2015 [1].

Figure 2.
Comparison between different energy storage technologies [6].
Figure 2.
Comparison between different energy storage technologies [6].


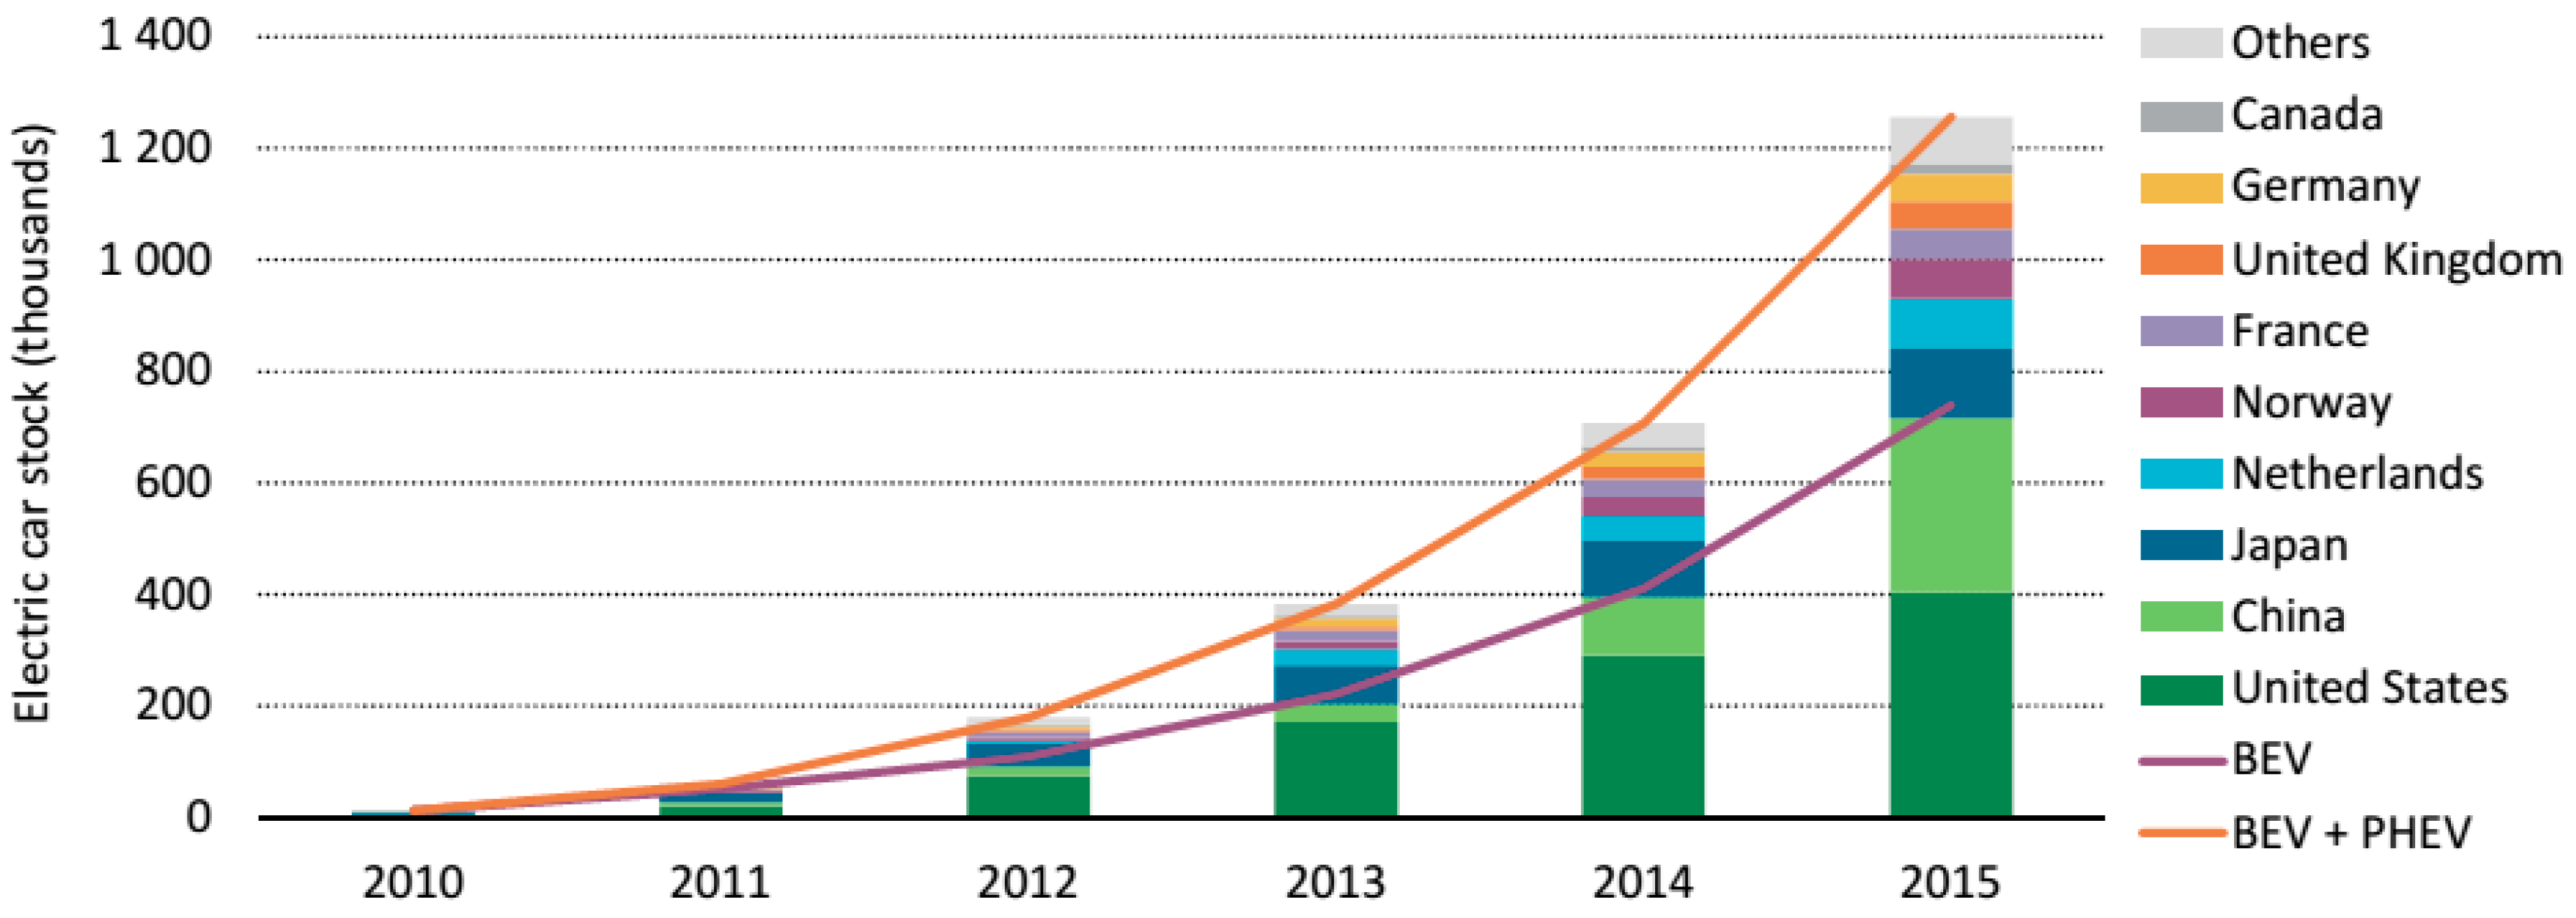
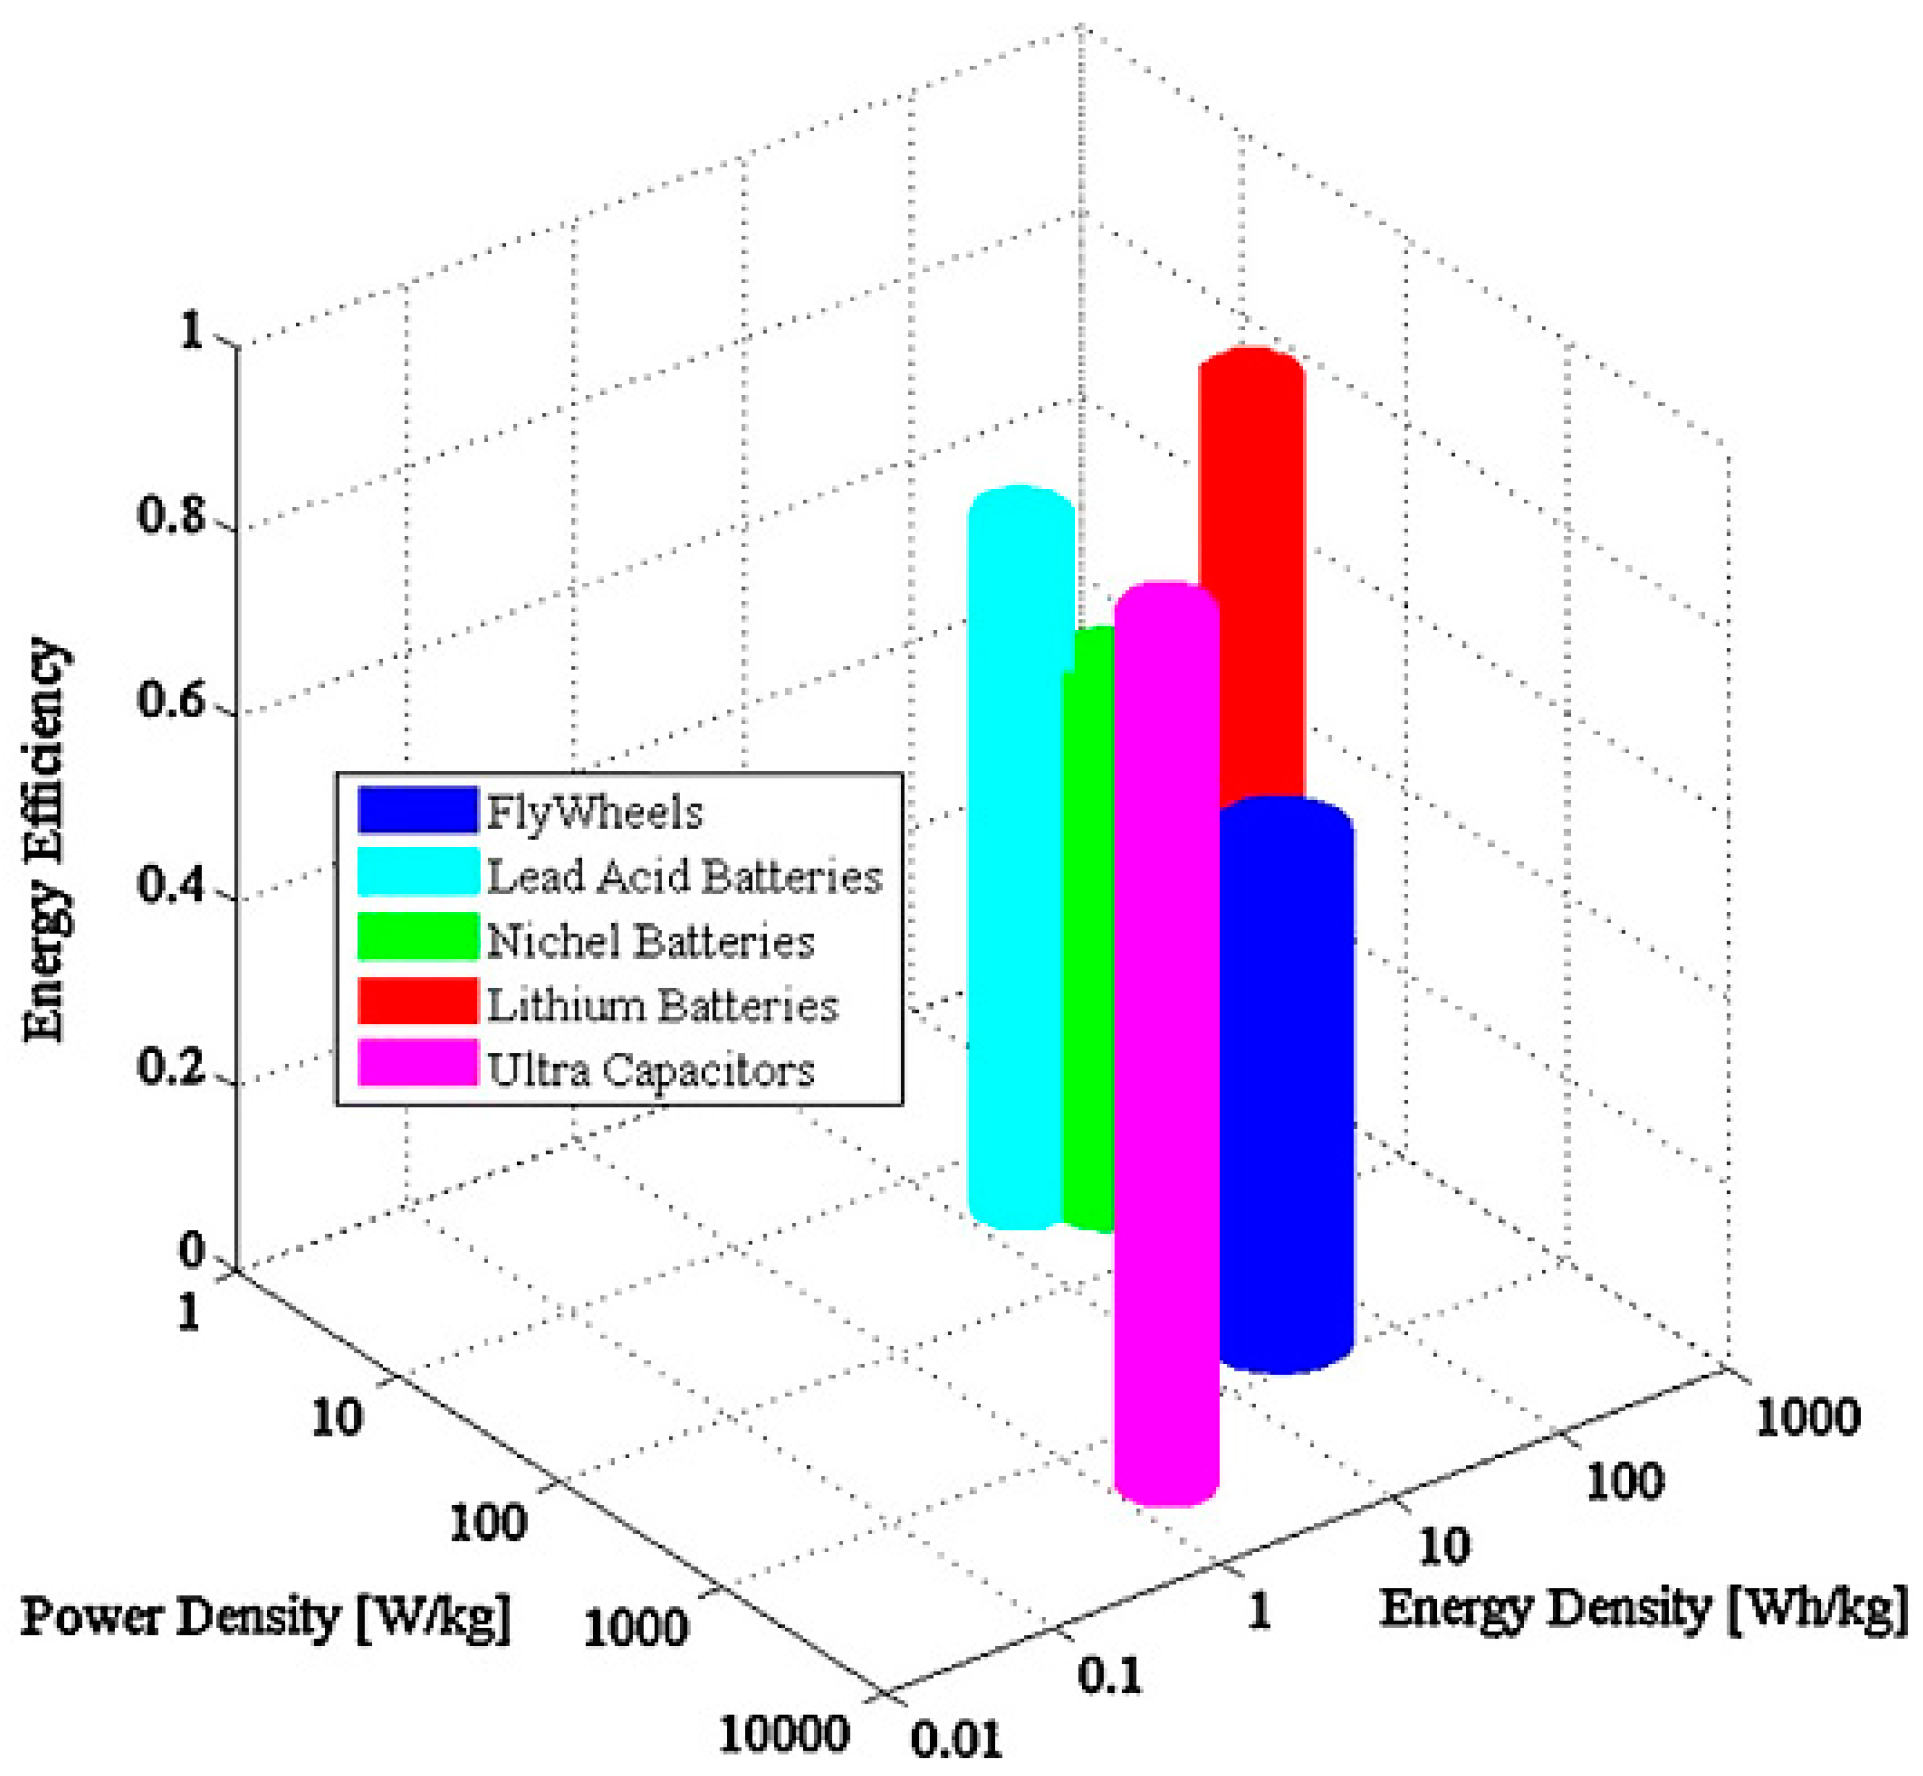
Table 1.
Standard charging levels for PEVs.
| Charging Level | Voltage | Current | Rated Power | Charging Time |
|---|---|---|---|---|
| AC level 1 | 120 V AC, single phase | 12–16 A | 1.4–1.9 kW | 7–17 h |
| AC level 2 | 240 V AC, single or three phase | Up to 80 A | 19.2 kW | 3–7 h |
| DC fast charging | 200–450 V DC | Up to 80 A | Up to 40 kW | 1.2 h–20 min |
Table 2.
Impact assessment approaches and tools.
| Function | Tool | Main Feature |
|---|---|---|
| Uncontrolled Operation | Power flow analysis [33,37] | Steady state analysis |
| Probabilistic power flow [30] Monte-Carlo simulation [35,36] | Capture of the uncertainty of the load demand | |
| Optimal Operation | Optimal power flow [4] | Optimization of state variables |
| Stochastic OPF [4,21] | Capturing the uncertainty of the demand and optimizing the state variables |
Table 3.
Comparison between different demand coverage models.
| Demand Coverage Model | Main Feature |
|---|---|
| Nodal PEV density model [39,40,41,42] | Estimation of the stationary demand density at system nodes |
| Traffic flow model [12,43,44,45,46,47] | Estimation of the spatial demand and mobility of PEVs |
| Real data-based model [48,49] | Estimation of the spatial-temporal PEV demand |
| Stochastic model [50,51,52] | Considering the uncertainty of PEVs |
Table 4.
Various planning objectives for charging infrastructure sizing and sitting.
| Objectives Category | Planning Objective |
|---|---|
| Power system objectives | Minimizing the grid loss and PEV loss [55] Minimizing total energy loss and total voltage deviation [41] Minimizing total charging infrastructure cost [40,42,52] |
| Transportation system objectives | Flow-capturing location model (FCLM) [56] Flow-refueling location model (FRLM) [57] Multipath-refueling location model (MPRLM) [47] |
| Multi-objectives planning | Minimizing the overall annual investment cost and energy loss, as well as FCLM [43] Minimizing total energy loss and total voltage deviation, as well as FCLM [12] Minimizing the operational and investment cost, as well as minimizing the traveling cost [44] Maximizing utilization of the facilities and system profit, as well as FCLM [58] Maximizing the social welfare, and combined distribution and assignment (CDA) model [46] |
Table 5.
Summary of integration schemes between DER and PEV charging facilities.
| Integration Scheme | Research Work |
|---|---|
| Within the charging facility | Benefits of using PV systems in charging facilities [67] Charging facility design based on Markov chains [61,68] Sizing of system components to minimize operation cost [60,69] On-roof PV system design considering seasonal variation [70] Sizing the ESS to benefit from energy arbitrage [59] |
| Within a microgrid | Design of charging facility microgrids [64] Scheduling of distributed generation (DG) units in a charging facility microgrid [71] Control of the ESS in a charging facility microgrid [72] Expremental implementation of a charging facility microgrid [6] Control of the microgrid interaction with V2G technology [73] Schedulling PEVs charging/discharging to minimize the load variance [74] |
| Within the distribution system | Design of charging facilities to regulate voltage in distribution system with high PV penetration [75] Design of a smart energy microhub [5] Sizing and sitting of DG units in the distribution system with integrated charging facilities [19,76] PEVs coordination to acheive valley filling concept via V2G technology [77] Investigating the cababilty of V2G enabled PEVs in reactive power compansation [78] |
© 2017 by the authors. Licensee MDPI, Basel, Switzerland. This article is an open access article distributed under the terms and conditions of the Creative Commons Attribution (CC BY) license (http://creativecommons.org/licenses/by/4.0/).
Share and Cite
MDPI and ACS Style
Abdalrahman, A.; Zhuang, W. A Survey on PEV Charging Infrastructure: Impact Assessment and Planning. Energies 2017, 10, 1650. https://doi.org/10.3390/en10101650
AMA Style
Abdalrahman A, Zhuang W. A Survey on PEV Charging Infrastructure: Impact Assessment and Planning. Energies. 2017; 10(10):1650. https://doi.org/10.3390/en10101650
Chicago/Turabian StyleAbdalrahman, Ahmed, and Weihua Zhuang. 2017. "A Survey on PEV Charging Infrastructure: Impact Assessment and Planning" Energies 10, no. 10: 1650. https://doi.org/10.3390/en10101650
Note that from the first issue of 2016, this journal uses article numbers instead of page numbers. See further details here.