Article

Transactive Demand Side Management Programs in Smart Grids with High Penetration of EVs †

1
Department of Computer Science, The State University of New York Korea, Incheon 21985, Korea
2
Department of Computer Science, Stony Brook University, Stony Brook, NY 11794, USA
3
Department of Electric Power and Energy Systems, KTH Royal Institute of Technology, 114 28 Stockholm, Sweden
4
Department of Electrical and Computer Engineering, University of Alberta, Edmonton, AB T6G 2R3, Canada
*
Author to whom correspondence should be addressed.
A preliminary version of this paper was presented at The 7th IEEE International Conference on Smart Grid Communications (SmartGridComm 2016) in Sydney, Australia, November 2016.
Energies 2017, 10(10), 1640; https://doi.org/10.3390/en10101640
Submission received: 18 September 2017 / Revised: 6 October 2017 / Accepted: 13 October 2017 / Published: 18 October 2017
(This article belongs to the Special Issue Energy Management in Vehicle–Grid–Traffic Nexus)

Abstract

:
Due to environmental concerns, economic issues, and emerging new loads, such as electrical vehicles (EVs), the importance of demand side management (DSM) programs has increased in recent years. DSM programs using a dynamic real-time pricing (RTP) method can help to adaptively control the electricity consumption. However, the existing RTP methods, particularly when they consider the EVs and the power system constraints, have many limitations, such as computational complexity and the need for centralized control. Therefore, a new transactive DSM program is proposed in this paper using an imperfect competition model with high EV penetration levels. In particular, a heuristic two-stage iterative method, considering the influence of decisions made independently by customers to minimize their own costs, is developed to find the market equilibrium quickly in a distributed manner. Simulations in the IEEE 37-bus system with 1141 customers and 670 EVs are performed to demonstrate the effectiveness of the proposed method. The results show that the proposed method can better manage the EVs and elastic appliances than the existing methods in terms of power constraints and cost. Also, the proposed method can solve the optimization problem quick enough to run in real-time.

1. Introduction

The conventional transportation system, just like the conventional power system, consumes a massive amount of energy and produces an enormous amount of greenhouse gases [1]. Therefore, electrical vehicles (EVs) interactively working in smart grids (SGs) having renewable energy sources can be an effective and practical solution to reduce the greenhouse gas emissions and the energy cost. However, supplying the energy demand of EVs, while their penetration level is predicted up to 60% by 2040 [2], has a major impact on the power systems [3] and magnifies the importance of demand side management (DSM) programs.
The DSM programs include all activities that alter the demand profile of customers from their normal consumption patterns in response to incentive payments designed to match the supply profile [4]. In particular, customer motivation methods in DSM programs have a major role in the customers’ participation. Generally, the motivation methods can be divided into two main categories: incentive-based and time-based. The incentive based methods offer payments to customers who reduce their electricity usage during the times of system need or stress [5]. However, the task of determining the amount of reduction is complex and imprecise [6]. On the other hand, the time-based methods change the price of electricity based on the time of use to encourage customers to consume electricity during off-peak hours [7]. Some popular time-based methods are a flat rate (FR), time of use (TOU), and real-time pricing (RTP). In FR, the energy price, which is fixed during a day, may change for different seasons. In TOU, the energy price is varied during different hours of a day. However, since the price during each time interval is independent of the real-time behavior of customers and each customer can decide individually, it is possible that many customers decide to use electricity during off-peak hours simultaneously. This can cause an undesirable new (rebound) peak [8,9]. In order to prevent this problem, retailers must determine the price of each time interval based on the real-time consumption. However, implementation of RTP methods requires complicated computational process and two-way real-time communication for determining the optimal price due to nonlinear multi-variable equations [10]. We reviewed DSM program in SGs [11] and identified limitations and remaining challenges:
(1)
The technical constraints of the power system need to be considered. EVs considerably increase the electricity demand and have significant influences on the power system. The adverse effects of high penetration level of EVs on the power grid when they charge themselves in the grid to vehicle (G2V) mode are briefly reviewed in [3]. However, in the vehicle to grid (V2G) mode, active and reactive power injected to the network by EVs, if controlled well, can decrease the peak power [12] and provide ancillary services [13] instead of causing adverse effects. Therefore, although most of existing DSM programs neglect the technical constraints of the power system to simplify mathematical calculations [11], considering the technical constraints is critical for practical deployment of future power systems.
(2)
Individual benefit of each customer needs to be taken into account. If whole network welfare is selected as a goal function, customers may be discouraged from participating in the DSM program. A multi-agent framework is proposed in [14] to minimize the electricity bill of each household while considering the piecewise linear function for each customer’s cost. Still, this method neglects the influence of customers’ decision on each other and so it cannot prevent rebounding peaks.
(3)
Indirect control methods are needed to give decision authorities to the customers. Generally, DSM programs can be categorized into two types based on the control method used: direct and indirect. In direct control methods, elastic loads, including EVs, are directly controlled by a central entity of aggregators or retailers in their region. On the other hand, in indirect control methods, customers make their own decisions on elastic loads. Here, the job of the retailers is to indirectly lead customers to the desirable optimum by changing the price electricity or giving incentives to them. Since direct methods can relatively better handle the uncertainties associated with charging of EVs, e.g., departure or arrival times, most of the researchers prefer direct methods. For example, the demand peak is minimized by directly controlling EVs in [15], the cost of the whole network is decreased using a day-ahead pricing model in the presence of EVs in [16], and the direct charging and discharging method is developed to sell spinning reserve in the wholesale market in [17]. However, the common problem of direct methods is that they take away the decision authority from customers, which may decrease the popularity and security of DSM programs [18]. Therefore, indirect methods are more promising as they are more likely to lead to consumer’s acceptance than the direct methods [19]. An indirect scheduling algorithm for EVs having an experimental demonstration at the National Technical University of Athens is presented in [20]. Although in indirect methods implementing, considering the effects of other customers’ decision is crucial. For instance, in a real system, since all customers want to optimize their own cost, they may make similar decisions, simultaneously and/or collectively, to produce a major impact on the power system known as an avalanche effect [19] or a rebound peak [8,9].
(4)
Imperfect competition model needs to be used to more accurately model the effects of independent customers. There are two models for competitive markets: perfect and imperfect. The perfect competition model assumes that the market price is not dependent on the decision of each participant. This model is relatively simple and many researchers adopt this model. However, an independent price may lead to rebound peaks. On the other hand, an imperfect competition or oligopoly model can be used to consider the effects of all customers’ decisions. In particular, Cournot competition model, which is an oligopoly model used to describe a market with multiple players competing for production, can be used to independently maximize their profit given their competitors’ decisions [21]. However, since using this model on a system having many participants increases the complexity of the problem, some simplification or approximation is necessary to have a feasible problem. In this direction, the authors of [22] used Cournot competition to model a dynamic price for an intelligent building without EVs and made some simplifying assumptions, such as linear inverse demand curve or having exclusive energy storage device, to solve their problem. This however limits the practicability of their approach.
Learning from the limitations of the existing methods, an indirect RTP based method with two-way communications, called a transactive control method [23], is suggested to be the state of the art approach to manage demand in SG and solve the above mentioned challenges. The proposed method considers the technical constraints of the power system and in the same time by implementing imperfect competition model takes each customer individually decision into account. One of the major challenges of implementing transactive control methods with an imperfect competition model is the complexity of the optimization problem, as will be explained in section II. Therefore, in this paper, we propose a new heuristic two-stage iterative method that can quickly find the optimal power of each customer in a decentralize manner such that the cost of each customer is minimized and the technical constraints of the power system are also satisfied. The main contributions of this paper, in relation to the identified challenges, are summarized as follows:
  • Solving the first challenge: Technical constraints of the power system are considered to prevent rebound peaks.
  • Solving the second challenge: Customer participation is encouraged by minimizing the cost of each customer instead of the whole network.
  • Solving the third challenge: Use of indirect method gives decision authorities to customers.
  • Solving the fourth challenge: Cournot imperfect competition model takes into account the effect of decisions made by individual customers.
  • Solving the implementation difficulties: The proposed heuristic two-stage iterative method solves the non-linear optimization problem quick enough for real-time operations.
The rest of this paper is organized as follows. The mathematical modeling of the transactive DSM program is presented in Section 2. The proposed method is presented in Section 3. The simulation network and results are detailed in Section 4. Finally, the conclusions are presented in Section 5.

2. Problem Formulation

In our transactive DSM program, the cost of each customer is minimized by scheduling appliances and EVs in such a way that the influence from other customers based on the Cournot oligopoly model is reflected and the system constraints are satisfied. There are two basic types of loads: inelastic loads, which cannot be shifted, such as lightings, and elastic loads, which can be shifted, such as EVs.

2.1. Power System Model

The real-time market price (π(t)) is updated based on the total real-time power consumption of all customers based on Cournot model in each time interval as follows:
π ( t ) = S ( i = 1 n ( P i e , i ( t ) + k = 1 n e , i P e , i k ( t ) + P E V , i ( t ) ) + P l o s s ( t ) ) ,
where n is the number of customers; Pie,i, Pe,ik, and PEV,i are the active power of inelastic loads, the k-th elastic appliance, and EV load of the i-th customer, respectively; ne,i is the number of the i-th customer’s elastic appliances; Ploss is the power loss of the system; which can be calculated as [24]:
P l o s s = i = 1 m k = 1 m | V i | | V k | | Y i k | cos ( δ i δ k θ i k ) ,
where |V| and δ are the magnitude and phase of the bus voltage; m is the total number of network buses; and |Y| and θ are the magnitude and phase of the admittance matrix, respectively. The voltage of all buses can be calculated from nonlinear power flow equations as described in the literature and the backward/forward sweep method [25] is used.
In (1), S is the supply function of the power grid, which gives the cost of the supplied energy for the power grid. It can be calculated from the marginal cost of all generators same as the existing electrical market, e.g., the pool market. Since this paper focuses on the demand side management, the supply management is not the concern of this paper; the supply function, without losing the generality of the method, will model by a given function in simulation section.
The proposed method considers constraints from both the power network and customers. The overload of power lines and voltage regulation constraints are as follows:
I k ( τ ) < I k , max        τ ,
V min < V j ( τ ) < V max        τ ,
where Ik is the magnitude of the k-th branch current; Ik,max is the k-th branch capacity; Vmin and Vmax are the minimum and maximum levels of the network voltage, respectively. Each customer also has a specific maximum allowable apparent power (Smax,i). Therefore, the total consumption of the i-th customer in each time interval should satisfy the following constraint:
( p i e , i ( τ ) + k = 1 n e , i p e , i k ( τ ) + p E V , i ( τ ) ) 2 + ( Q i e , i ( τ ) + k = 1 n e , i Q e , i k ( τ ) + Q E V , i ( τ ) ) 2 S max , i 2     τ ,
where Qie,i, Qe,ik, and QEV,i are the reactive power of inelastic loads, the k-th elastic appliance, and EV load of the i-th customer, respectively.

2.2. Electrical Vehicle Model

Charging and discharging of an EV is limited by the maximum capacity of the convertor and battery. The input power of an EV should be kept between the maximum charging capacity (pmax,ch,i) and the maximum discharging capacity (pmax,dch,i) as:
p max , d c h , i p E V , i ( τ ) p max , c h , i .
In addition, the state of charge (SOC) of the battery for each time interval is calculated as:
S O C i ( τ + 1 ) = S O C i ( τ ) + ( S G 2 V η c h + ( 1 S G 2 V ) / η d c h ) P E V , i ,
where ηch and ηdch are the charger efficiency in G2V and V2G mode, respectively; and SG2V is a binary state variable that equals to 1 in G2V mode and equal to zero otherwise. The SOC should reach the desired value (SOCd,i) before the EV’s departure time (td,i) and must be between the minimum value (SOCmin,i) and the maximum value (SOCmax,i) as:
S O C min , i S O C i ( τ ) S O C max , i ,
S O C ( t d , i ) S O C d , i .
Lastly, the degradation cost is another important factor for EVs. In the V2G mode, when EVs inject some active power to the network, batteries are used more than during their normal condition, which reduces the lifetime of the batteries [26]. The degradation cost (Cd,i) is finally added to EVs cost function as:
Cost E V , i ( t ) = P E V , i ( t ) . π ( t ) + r b . P E V , i ( t ) . η d c h . S G 2 V C d , i ,
where rb is the degradation coefficient based on $/kW, and CostEV,i is the cost of the i-th EV.

2.3. Elastic Appliances Model

The main difference between elastic appliances and EVs is that the appliances have a continuous operation period. In other words, they continue their operation until their given task is done. Under this condition, each customer needs to determine the optimum starting time of elastic loads (t0,ik) that minimizes the cost. As the task should be finished before the desired finishing time (tend,ik), the starting time should be selected as:
t t 0 , i k < t e n d , i k t d , i k          k ,
where t is the present time; td,ik is the operation duration of the k-th appliance of the i-th customer. Since the appliances have a continuous operation period, the cost for the whole periods is considered. Therefore, the elastic loads’ cost of i-th customer in time t can be calculated as:
C o s t e , i ( t ) = k = 1 n e , i t = t         t + t d , i k P e , i k ( t ) π ( t ) if t =    t 0 , i k .
More details about elastic appliances model can be found in [27].

2.4. Transactive DSM Model

Finally, the optimization problem of the transactive DSM program using the Cournot oligopoly competition model considering the effect of other consumptions in the market price can be formulated as:
Min t 0 , i k ,    P E V , i ( t )    O b j = ( P E V , i ( t ) + k = 1 n e , i P e , i k ( t ) ) . S ( i = 1 n ( P i e , i ( t ) + k = 1 n e , i P e , i k ( t ) + P E V , i ( t ) ) + P l o s s ( t ) )                                                          + k = 1 n e , i     if t = t 0 , ik , τ = t + 1 t + t d , i k P e , i k ( τ ) . π P ( τ ) + C d , i s .    t .         Power flow equations ,        P l o s s = i = 1 m k = 1 m | V i | . | V k | . | Y i k | . cos ( δ j δ k θ i k ) ,        I k e ( τ ) < I k , max    k , τ ,        V min < V i ( τ ) < V max τ ,        ( p i e , i ( τ ) + k = 1 n e , i p e , i k ( τ ) + P E V , i ( τ ) ) 2 + ( Q i e , i ( τ ) + k = 1 n e , i Q e , i k ( τ ) + Q E V , i ( τ ) ) 2 S max , i 2       k , τ ,        p max , d c h , i p E V , i ( τ ) p max , c h , i       i ,        S O C i ( τ + 1 ) = S O C i ( τ ) + ( S G 2 V η c h + ( 1 S G 2 V ) / η d c h ) P E V , i           S O C min , i S O C i ( τ ) S O C max , i             S O C ( t d , i ) S O C d , i              t t 0 , i k < t e n d , i k t d , i k k .           
where πP(τ) is the predicted energy price for future time intervals. There is two main terms in (13): the first term is the energy cost of i-th customer in the current time interval (t); the second term is the energy cost of the customer in the future time interval for elastic appliances, which start to work in the current time interval but finish their task later. The current price is calculated from Cournot model, while the price of the future time interval should be predicted. It is worth mentioning that since customers cannot change the inelastic loads, the cost of providing energy for inelastic load excluded from the optimization problem. However, the effect of the inelastic consumption in energy price is considered in the supply curve (S).
The equilibrium point (i.e., real-time price) of the network can be calculated from solving the above optimization problem (13) by each customer, simultaneously. In order to solve this optimization problem, each customer first needs to predict its own consumption for the future time intervals and estimate other customers’ consumptions in the present time interval and for the future time intervals. Note that, this is a nonlinear non-convex multi-objective optimization problem with many variables, and it is complicated to be solved in this form. So, in the next section, a heuristic two-stage iterative method that can quickly calculate the equilibrium point of the network is proposed.

3. The Heuristic Two-Stage Iterative Method

In order to solve the optimization problem of the transactive DSM program (13) in a distributed approach, a heuristic two-stage iterative method is proposed. In the first stage, each customer solves a modified optimization problem that focuses on quickly finding the optimal power consumption of EVs and elastic loads. Although this modified optimization problem does not consider other constrains, such as the power network constraints and the dependency of price due to other customers, they are later compensated in the second stage. The second stage gathers results from all customers and calculates the whole network states and updates the price and compensates the modifications made in the first stage by an iterative algorithm to approach the equilibrium point. Figure 1 depicts the outline of the proposed heuristic two-stage iterative method.

3.1. First Stage: Customer Side

In the first stage, customers minimize their own cost with a given market price (πd(τ)) considering the local constraints. Therefore, the optimization problem of (13) transforms to (14) as follows:
Min t 0 , i k ,    P E V , i ( t )    O b j = ( P E V , i ( t ) + k = 1 n e , i     P e , i k ( t ) ) . π d ( t )                                   + k = 1 n e , i     if t = t 0 , ik , τ = t + 1 t + t d , i k P e , i k ( τ ) . π P ( τ ) + C d , i s .    t .                ( p i e , i ( τ ) + k = 1 n e , i p e , i k ( τ ) + P E V , i ( τ ) ) 2                                               + ( Q i e , i ( τ ) + k = 1 n e , i Q e , i k ( τ ) + Q E V , i ( τ ) ) 2 S max , i 2    k , τ ,                p max , d c h , i p E V , i ( τ ) p max , c h , i ,               S O C i ( τ + 1 ) = S O C i ( τ ) + ( S G 2 V η c h + ( 1 S G 2 V ) / η d c h ) P E V , i ,               S O C min , i S O C i ( τ ) S O C max , i ,              S O C ( t d , i ) S O C d , i ,               t t 0 , i k < t e n d , i k t d , i k k .                       
Although the optimization problem of (14) is much easier to solve than (13) and some of the existing optimization methods can be used to solve this problem, a heuristic method can be used to find the optimum solution of (14) quickly, so that it can be implemented on simple computing devices such as smart meters. As the elastic appliances operate until their task completion, each smart meter first finds the optimal starting time of all elastic appliances and then determines the optimal power of EVs. Then, in the second stage, the market price for a given time interval τ is updated considering the network constraints and the effect of each customer to other customers.

3.2. Scheduling Start Time of Elastic Appliances

In order to schedule different appliances, a higher priority is given to the appliance that needs to finish its task sooner than others. In other words, the earliest deadline first (EDF) method, which is a traditional real-time scheduling in the field of computing systems [28] is used. For this purpose, the plugged elastic appliances of the i-th customer are ordered from the earliest desired completion time. Then, the starting time of each appliance (t0,ik) is selected, sequentially, in such a way that the cost becomes minimum. Here, in order to determine t0,ik, the electricity cost of the task for different starting times is calculated and the cheapest one that satisfies (5) is selected. Note that if the algorithm decides to turn on an appliance, the active and reactive consumption of the appliance should be taken in to account during the scheduling of other loads. Algorithm 1 details the scheduling of elastic appliances.
Algorithm 1. First Stage—Part 1: Schedule Elastic Appliances
1: Order the i-th customer’s elastic appliances from the smallest tend,iktd,ik (k = 1) to the largest tend,iktd,ik (k = ne,i).
2: For k = 1 to ne,i do
3:   Calculate τ = t 0 , i k t 0 , k + t d , i k P e , i k ( τ ) . π d ( τ ) for t 0 , i k ( t , t e n d , i k t d , i k ) .
4:   Check the constraint (5) for all τ ( t 0 , i k , t 0 , i k + t d , i k ) .
5: Select the lowest cost that satisfies (5).

3.3. Scheduling Charging and Discharging of EVs

Determining the optimal charging and discharging power of EVs has two substages: the first sub-stage only investigates the G2V mode, while the second sub-stage adds the effects of V2G mode. In the first sub-stage, the net energy that should be charged in the i-th EV’s battery (Et,i), can be obtained as:
E t , i = S O C d , i S O C 0 , i ,
where SOC0,i is the initial state of the i-th battery when it connects to the grid. In order to minimize the energy cost, EVs should be charged in the time intervals with low prices as much as possible. Therefore, the algorithm orders the time intervals from the lowest price to the highest price, then assigns Et,i to each time interval in the order of the list. In each time interval, pEV,i(t) is calculated to satisfy all EV’s constraints as follows:
p E V , i ( t ) = min ( E t , i / η c h , p max , c h , i , P max , i ( τ ) ) , P max , i ( τ ) = S max , i 2 ( Q i e , i ( τ ) + k = 1 n e , i Q e , i k ( τ ) ) 2 ( p i e , i ( τ ) + k = 1 n e , i p e , i k ( τ ) ) .
After assigning some power to the interval with the lowest price, Et,i and pmax,ch,i(t) are updated as follows:
E t , i n e w = E t , i min ( E t , i , p E V , i ( t ) ) ,
p max , c h , i n e w ( t ) = p max , c h , i ( t ) min ( E t , i , p E V , i ( t ) ) .
here, if Et,inew is greater than zero, the interval with the next lowest price is determined and repeated until Et,inew becomes zero. At the end of the first sub-stage, the battery’s SOC is calculated from (7). Hence, the first sub-stage of the proposed algorithm guarantees that each EV minimizes its cost considering all local constraints in G2V mode.
In the V2G mode, EVs can utilize energy stored in their batteries to also sell their stored energy during high price time intervals and replace it during lower price time intervals. This task could be beneficial to the EV owner only when the difference between these prices is larger than the cost of the loss of charging/discharging processes and the cost of battery degradation. The profit gained from this process, by selling some energy in time interval th and buying the equivalent amount of energy in time interval tl, is calculated as:
Profit V 2 G , i h l = p s e l l , i h l . ( π ( t h ) r b / η d c h π ( t l ) / η c h . η d c h ) ,
where psellhl is the amount of energy that i-th EV sells in interval th according to all EV’s constraints and is calculated as:
p s e l l , i h l = { min ( min ( S O C i ( t h : t d , i ) S O C min , i ) . η d c h , i , p max , d c h , i ( t h ) , p max , c h , i ( t l ) . η c h , i . η d c h , i , P max , i ( τ ) P E V , i ( τ ) )         t h > t l min ( min ( S O C max , i S O C , i ( t l : t d , i ) ) / η c h , i , p max , d c h , i ( t h ) , p max , c h , i ( t l ) . η c h , i . η d c h , i , P max , i ( τ ) P E V , i ( τ ) )          t h < t l .
The maximum and minimum SOC of the battery in all time interval, the maximum charging and discharging power of the battery, and the maximum demand of the customer limit the amount of the energy that an EV can sell [29]. All of these constraints considering the charging and discharging efficiency are considered in (20).
Then, all possible combination of gains (thtl) are ordered from the largest. Then, pEV,i, pmax,dch,i(th), and pmax,ch,i(tl) are repeatedly updated from the list until ProfitV2G,ihl > 0 as:
p E V , i ( t h ) = p E V , i ( t h ) + p s e l l h l .
p E V , i ( t l ) = p E V , i ( t l ) + p s e l l h l / ( η c h . η d c h ) .
p max , d c h , i n e w ( t h ) = p max , d c h , i ( t h ) p s e l l h l .
p max , c h , i n e w ( t l ) = p max , c h , i ( t l ) p s e l l h l / ( η c h . η d c h ) .
Also, SOC of the battery is updated from (9). Algorithm 2, explains the heuristic method to optimize the EVs power.
Algorithm 2. First Stage—Part 2: Schedule EVs
1: Calculate Et,i from (15).
2: Order the time interval (from the lowest price to the highest price).
3: While Et,i > 0 do (sequentially from the list of line 2)
4:   Calculate PEV,i(t) using (16).
5:   Update Et,i and pmax,ch,i(t) using (17) and (18).
6: Calculate the SOC for all intervals from (7).
7: Order all possible combinations of (thtl) (in decreasing order).
8: While ProfitV2G,ihl > 0 do (sequentially from the list created in line 7)
9:   Calculate ProfitV2G,ihl using (19) and (20).
10: Update pEV,i, pmax,dch,i(td), and pmax,ch,i(tl) using (21)–(24).

3.4. Second Stage: Grid Side

The aim of the second stage is to find the equilibrium point. For this purpose, our algorithm first calculates the supply price (πs) for the total power from the supply curve. If πs matches the demand price (πd), then the equilibrium point (π*) is reached. Otherwise, the algorithm updates the new price to be used in the next iteration to approach the equilibrium point.
Generally, in a rational power market, a supply curve is a non-decreasing function and a demand curve is a non-increasing function. The intersection of these two curves is the equilibrium point as illustrated in Figure 2a. Therefore, if πs is greater than πd, the price of the equilibrium point is also greater than πd, and vice versa. The proposed algorithm uses this idea and bisects the difference between these two prices (i.e., πsπd) to find the equilibrium point. Algorithm 3 details the procedure of updating the new price (πnew) for the next iteration. In this algorithm, πmin and πmax are the upper and lower limit of the equilibrium price, respectively. The convergence of this algorithm is proved in appendix.
Algorithm 3. Second Stage—Part 1: Update New Price and Equilibrium Limits
1: For i = 1 to k (k = the iteration count) do
2:   If πi < πi+1 then πmin = min(πmin, πi)
3:   If πi > πi+1 then πmax = max(πmax, πi)
4: πnew = (πmin + πmax)/2
Since in the proposed method, the price of energy for each customer can change their consumption, the price of different nodes can be altered to have more control over the power system constraints [30]. For this purpose, a different controlling price can be added to πnew for each bus to satisfy the system constraints. However, in our simulation, same price for all buses keeps the system in defined constrained; therefore, we did not change price for different node in this implementation.
Since all customers in indirect methods try to minimize their own cost, they may make similar decisions and cause a sudden change in the demand curve as was shown in Figure 2b. In these circumstances, the consumption power corresponding to πmin and πmax are not similar. Therefore, the consumption power of equilibrium point (P*) must be calculated from the supply curve, and the difference between P* and P (πmax), called the residual power, needs be assigned to some customers. For this purpose, the price of some customers is changed from πmax to πmin. Although πmax and πmin are almost same, this method changes the power consumption of the system and solves the convergence issue. Algorithm 4 details the proposed method to handle this problem.
Algorithm 4. Second Stage—Part 2: Allocate of Residual Power
1: Select πmax as π*.
2: Calculate P (πmax) from Algorithm 1 and 2.
3: Calculate P* from supply curve.
4: Pres = P* − P (πmax)
3: While Pres > 0 do
4:   Select an EV randomly, change its price to πmin, and calculate Pi (πmax).
5:   Pres = Pres − (Pi (πmin) − Pi (πmax))

4. Case Study

4.1. Simulation Setup

Figure 3, shows the single line diagram of the IEEE-37 bus test system used for our simulation. The line data and the maximum power of buses are taken from [31]. We generate the system load profiles based on residential loads modeled in [32]. Here, a group of different home profiles is created by the simulator given in [33]. Then, an adequate number of them is randomly assigned to each bus to match the maximum power consumption reported in [31]. This procedure results in 1141 customers connected consuming about 11.2 MWh in a day.
We consider EVs, dish washers (wet1), and washing machines with dryers (wet2) as elastic loads. The average consumption profiles of the dish and clothes washers are shown in Figure 4. Both profiles have a long operation period and the second type consumes high power near the end. When these appliances start, they should operate until the task is completed. The electricity price may change during the operation and handling of these dynamic profiles for DSM programs consequently becomes very difficult. However, the simulation results in the next subsection show that the proposed method can manage this problem as well.
Based on the reference from [32], we assume that the dish washers are turned on between 6 and 8 p.m. with a probability of 23% and the task needs to be done before 6 to 9 a.m. the next day, with the uniform distribution. Also, the washing machines with dryers are turned on between 8 and 10 a.m. with a probability of 28% [32] and the task needs to be done before 2 to 5 p.m., with the uniform distribution. These wet appliances consume about 2 MWh each day.
The departure and the arrival times of EVs are selected based on a normal distribution [11] with the standard deviation of one hour and the mean values of 7 a.m. and 7 p.m., respectively. The desired SOC is selected based on the uniform distribution between 60% and 100% of the maximum SOC. The initial SOC is set to a value less than the desired SOC generated by a normal distribution with the standard deviation of 2 kWh and the mean value of 10 kWh, which translates into about 28 miles of travel by a typical EV with an energy consumption rate of 0.36 kW/mile [34]. The penetration level of EVs is assumed to be 50% (670 EVs), which consumes about 5.46 MWh each day.
In the simulation, three different types of EVs are used. The type one uses the charger level one having pmax = 2 kW, Smax = 5 kVA, and the battery size of 10 kWh. The type two and three use the charger level two having pmax = 9 kW [35], Smax = 10 kVA, and the battery size of 20 and 30 kWh, respectively. The charging and discharging efficiencies are assumed to be 95% and the minimum and maximum SOC are selected to be 0 and 100%, respectively. The degradation coefficient is set to be 0.05 $/kW [26].
The supply function is formulated so that the average energy price bought from the upper network without EVs for off-peak and peak time will be about 17 and 4 ¢/kW, respectively, according to [36] as:
S ( P t o t a l ) = 1.88 * 10 7 P t o t a l 2 + 3.67 * 10 5 P t o t a l + 4.12 * 10 2 ,
where Ptotal is the total input power of the network including the power loss, and S is the cost in $/kW. The error of the inelastic power prediction and the price forecasting is modeled by a normal distribution with a standard deviation of 3%.

4.2. Simulation Result

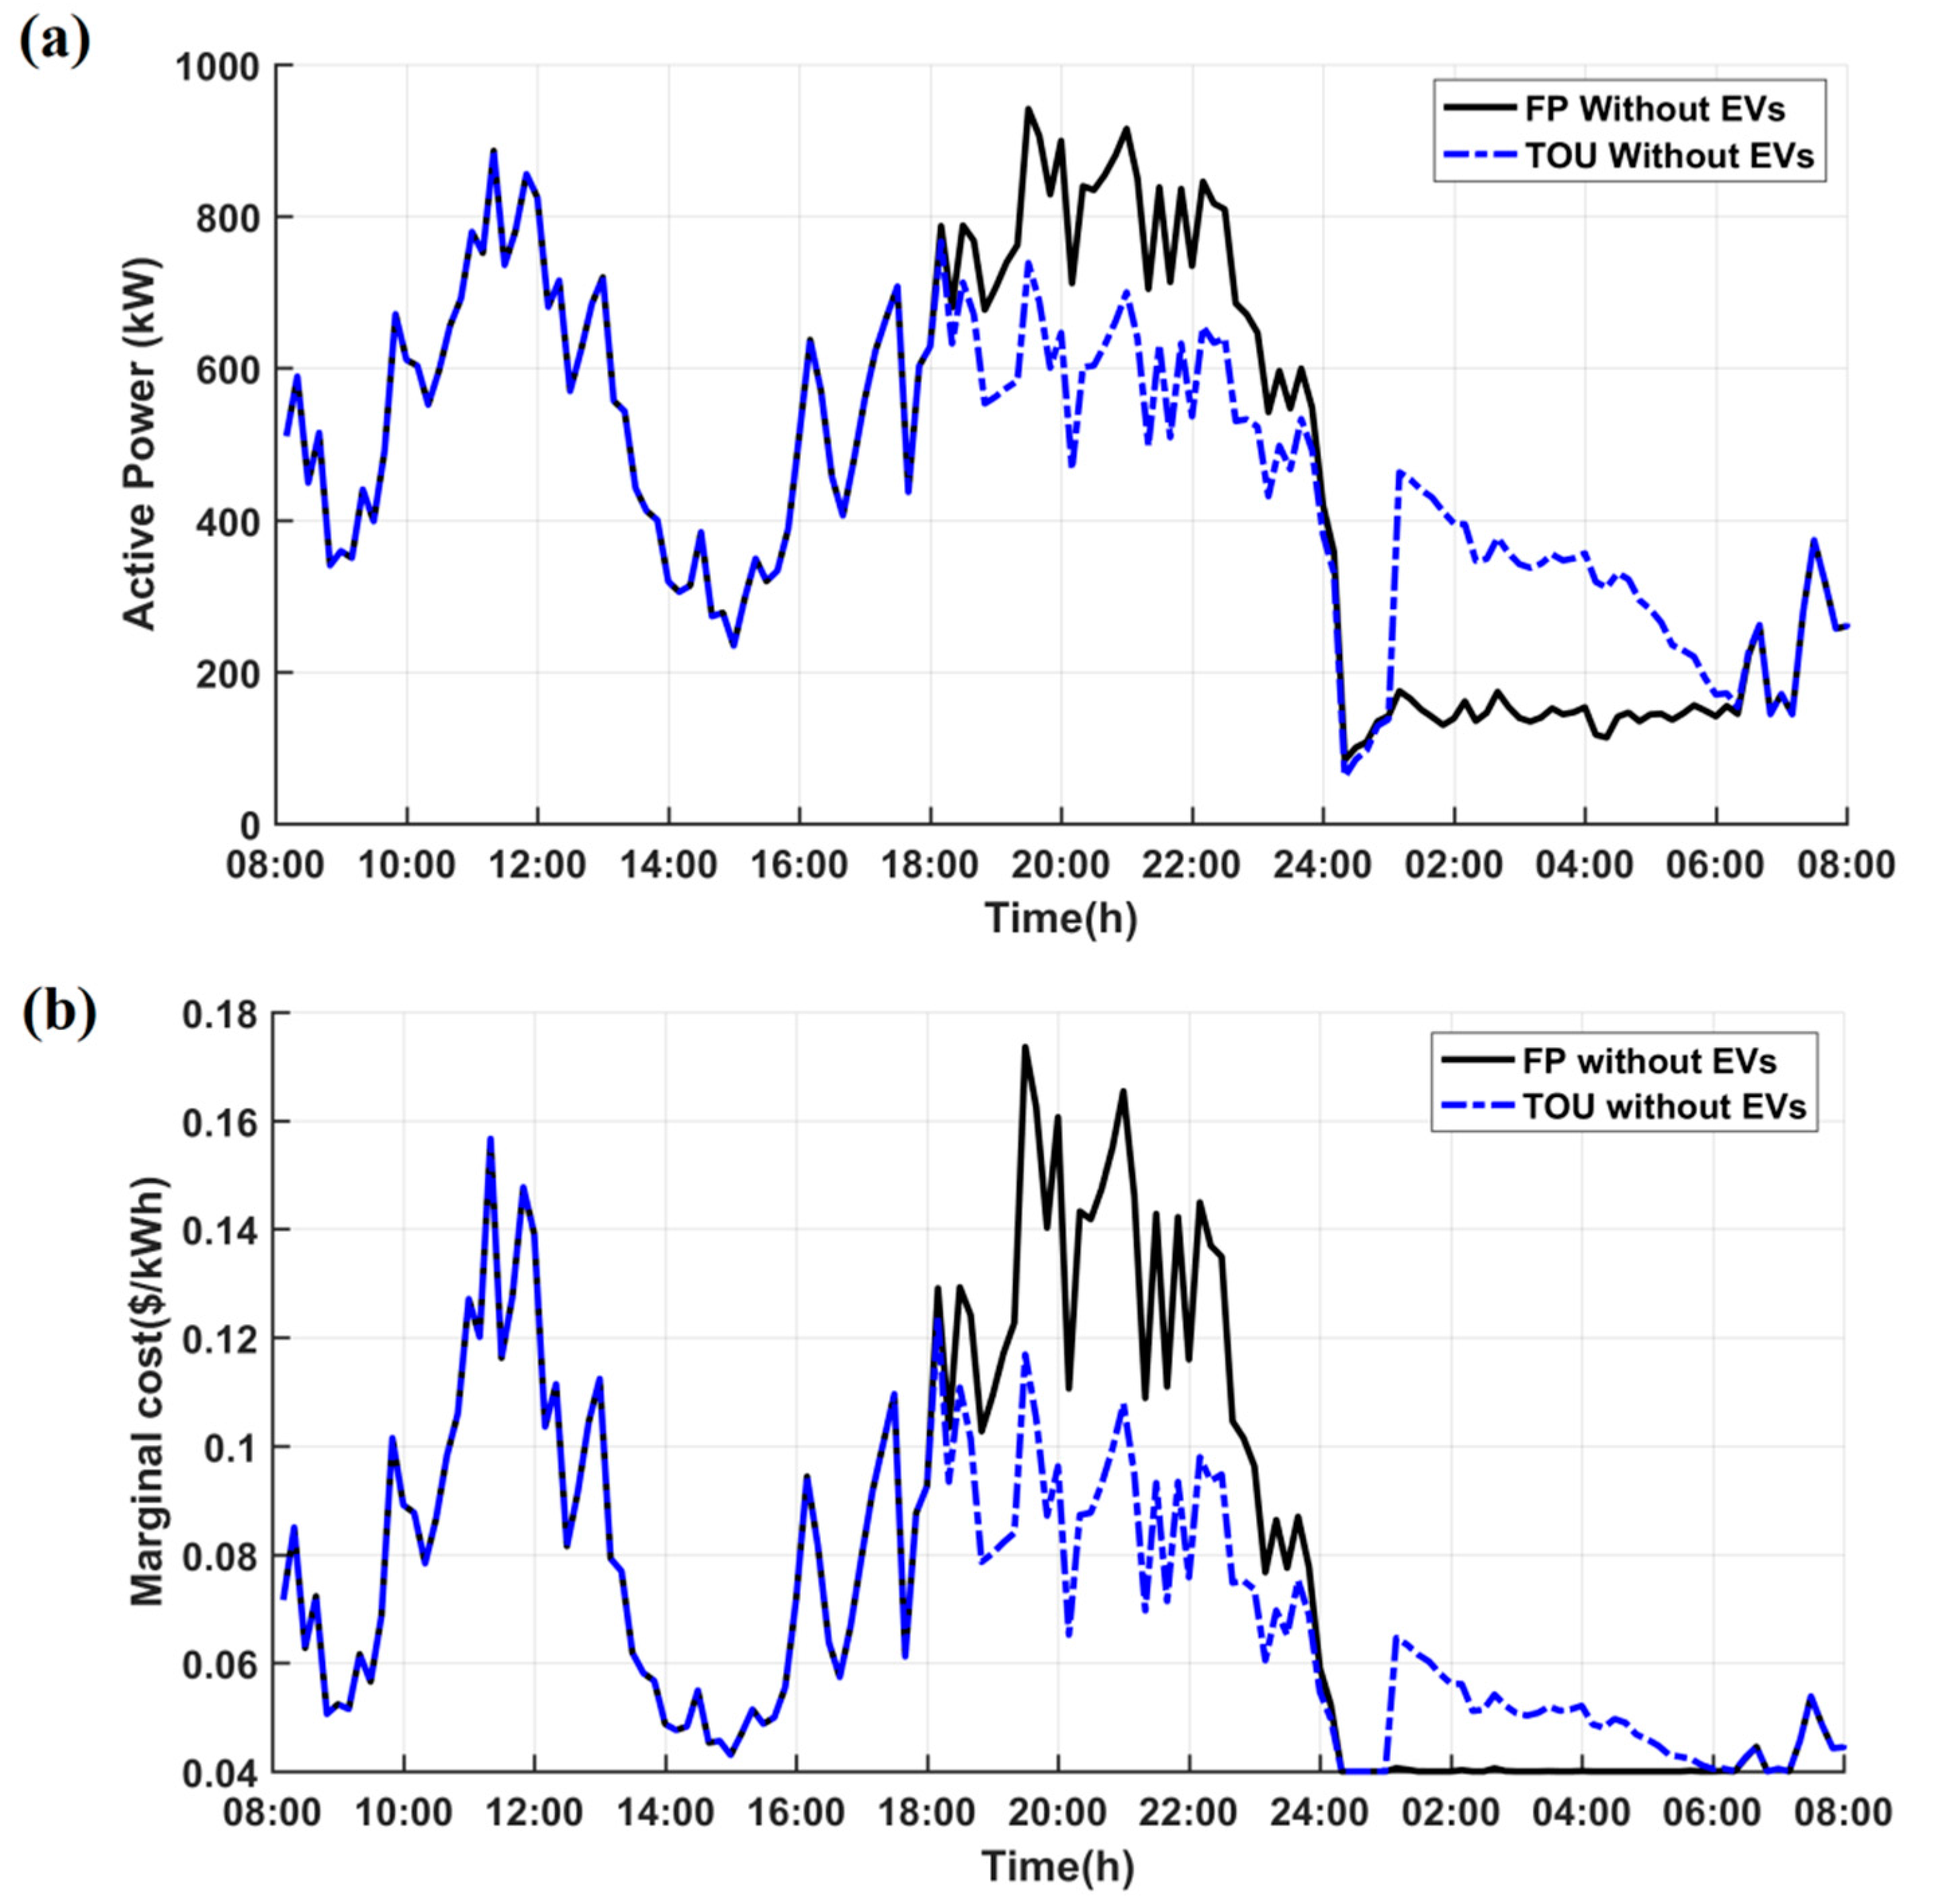
Figure 5 compares the results of the FR method and the TOU method, two most well-known and widely used DSM programs, in the abovementioned grid, when there is no EV. As it is shown in this figure, TOU can decrease the power peak and the cost of the production in compare to the FR method, when there is no EV in the power system.
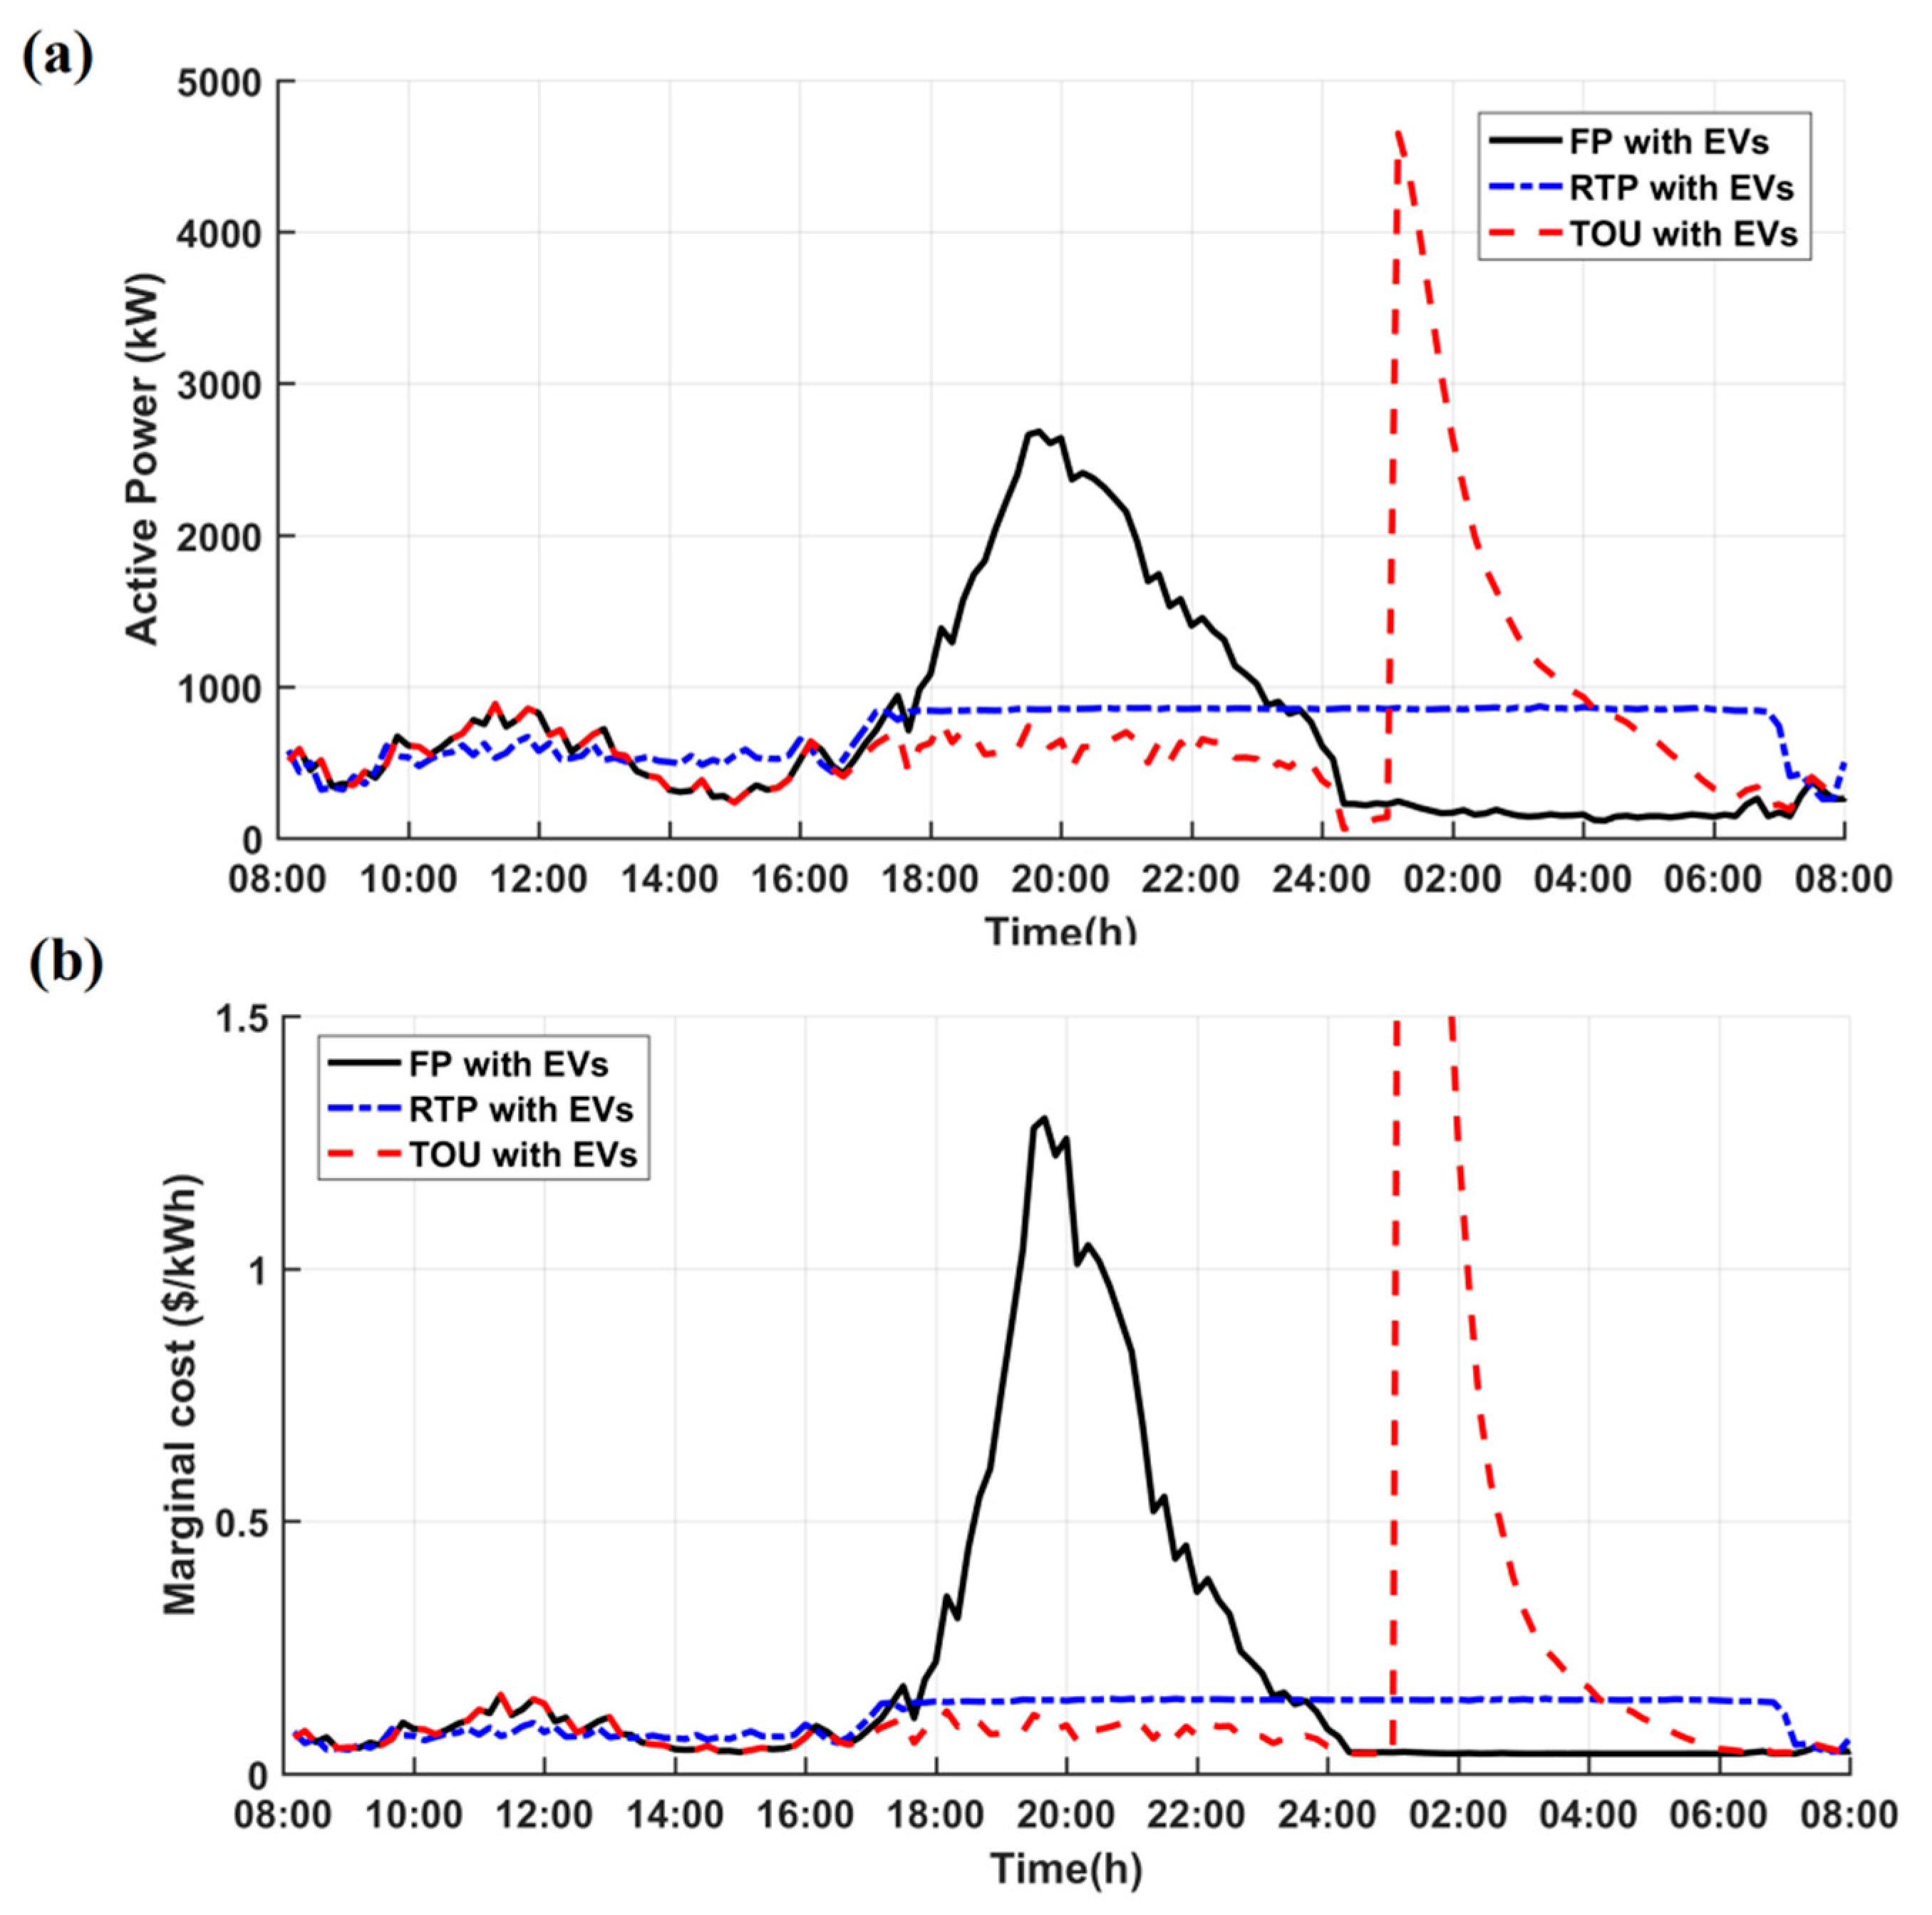
However, when there is high penetration of EVs and elastic loads in the power system, the TOU method face with new challenges, as shown in Figure 6. In the FR method, since the utility does not apply any incentive, each appliance starts to consume power as soon as it connects to the network. Consequently, between around 18:00 and 19:30, EVs’ load increases the peak power of the system from 941 kW to more than 2.6 MW and the maximum marginal cost (MC) from 17 cents to 1.3 dollars. The TOU method can neither help to manage a lot of sudden additional loads of EVs. Since the EVs and dish washers need to complete their tasks by the next morning, they wait for the low tariff and start to consume power simultaneously from the beginning of the off-peak interval (e.g., 01:00). Therefore, a rebound peak is formed. Although the TOU method can reduce the power peak to 886 kW without EVs, it cannot manage the peak of the network with EVs and it consumes 4.65 MW with the maximum MC of 3.94 dollars.
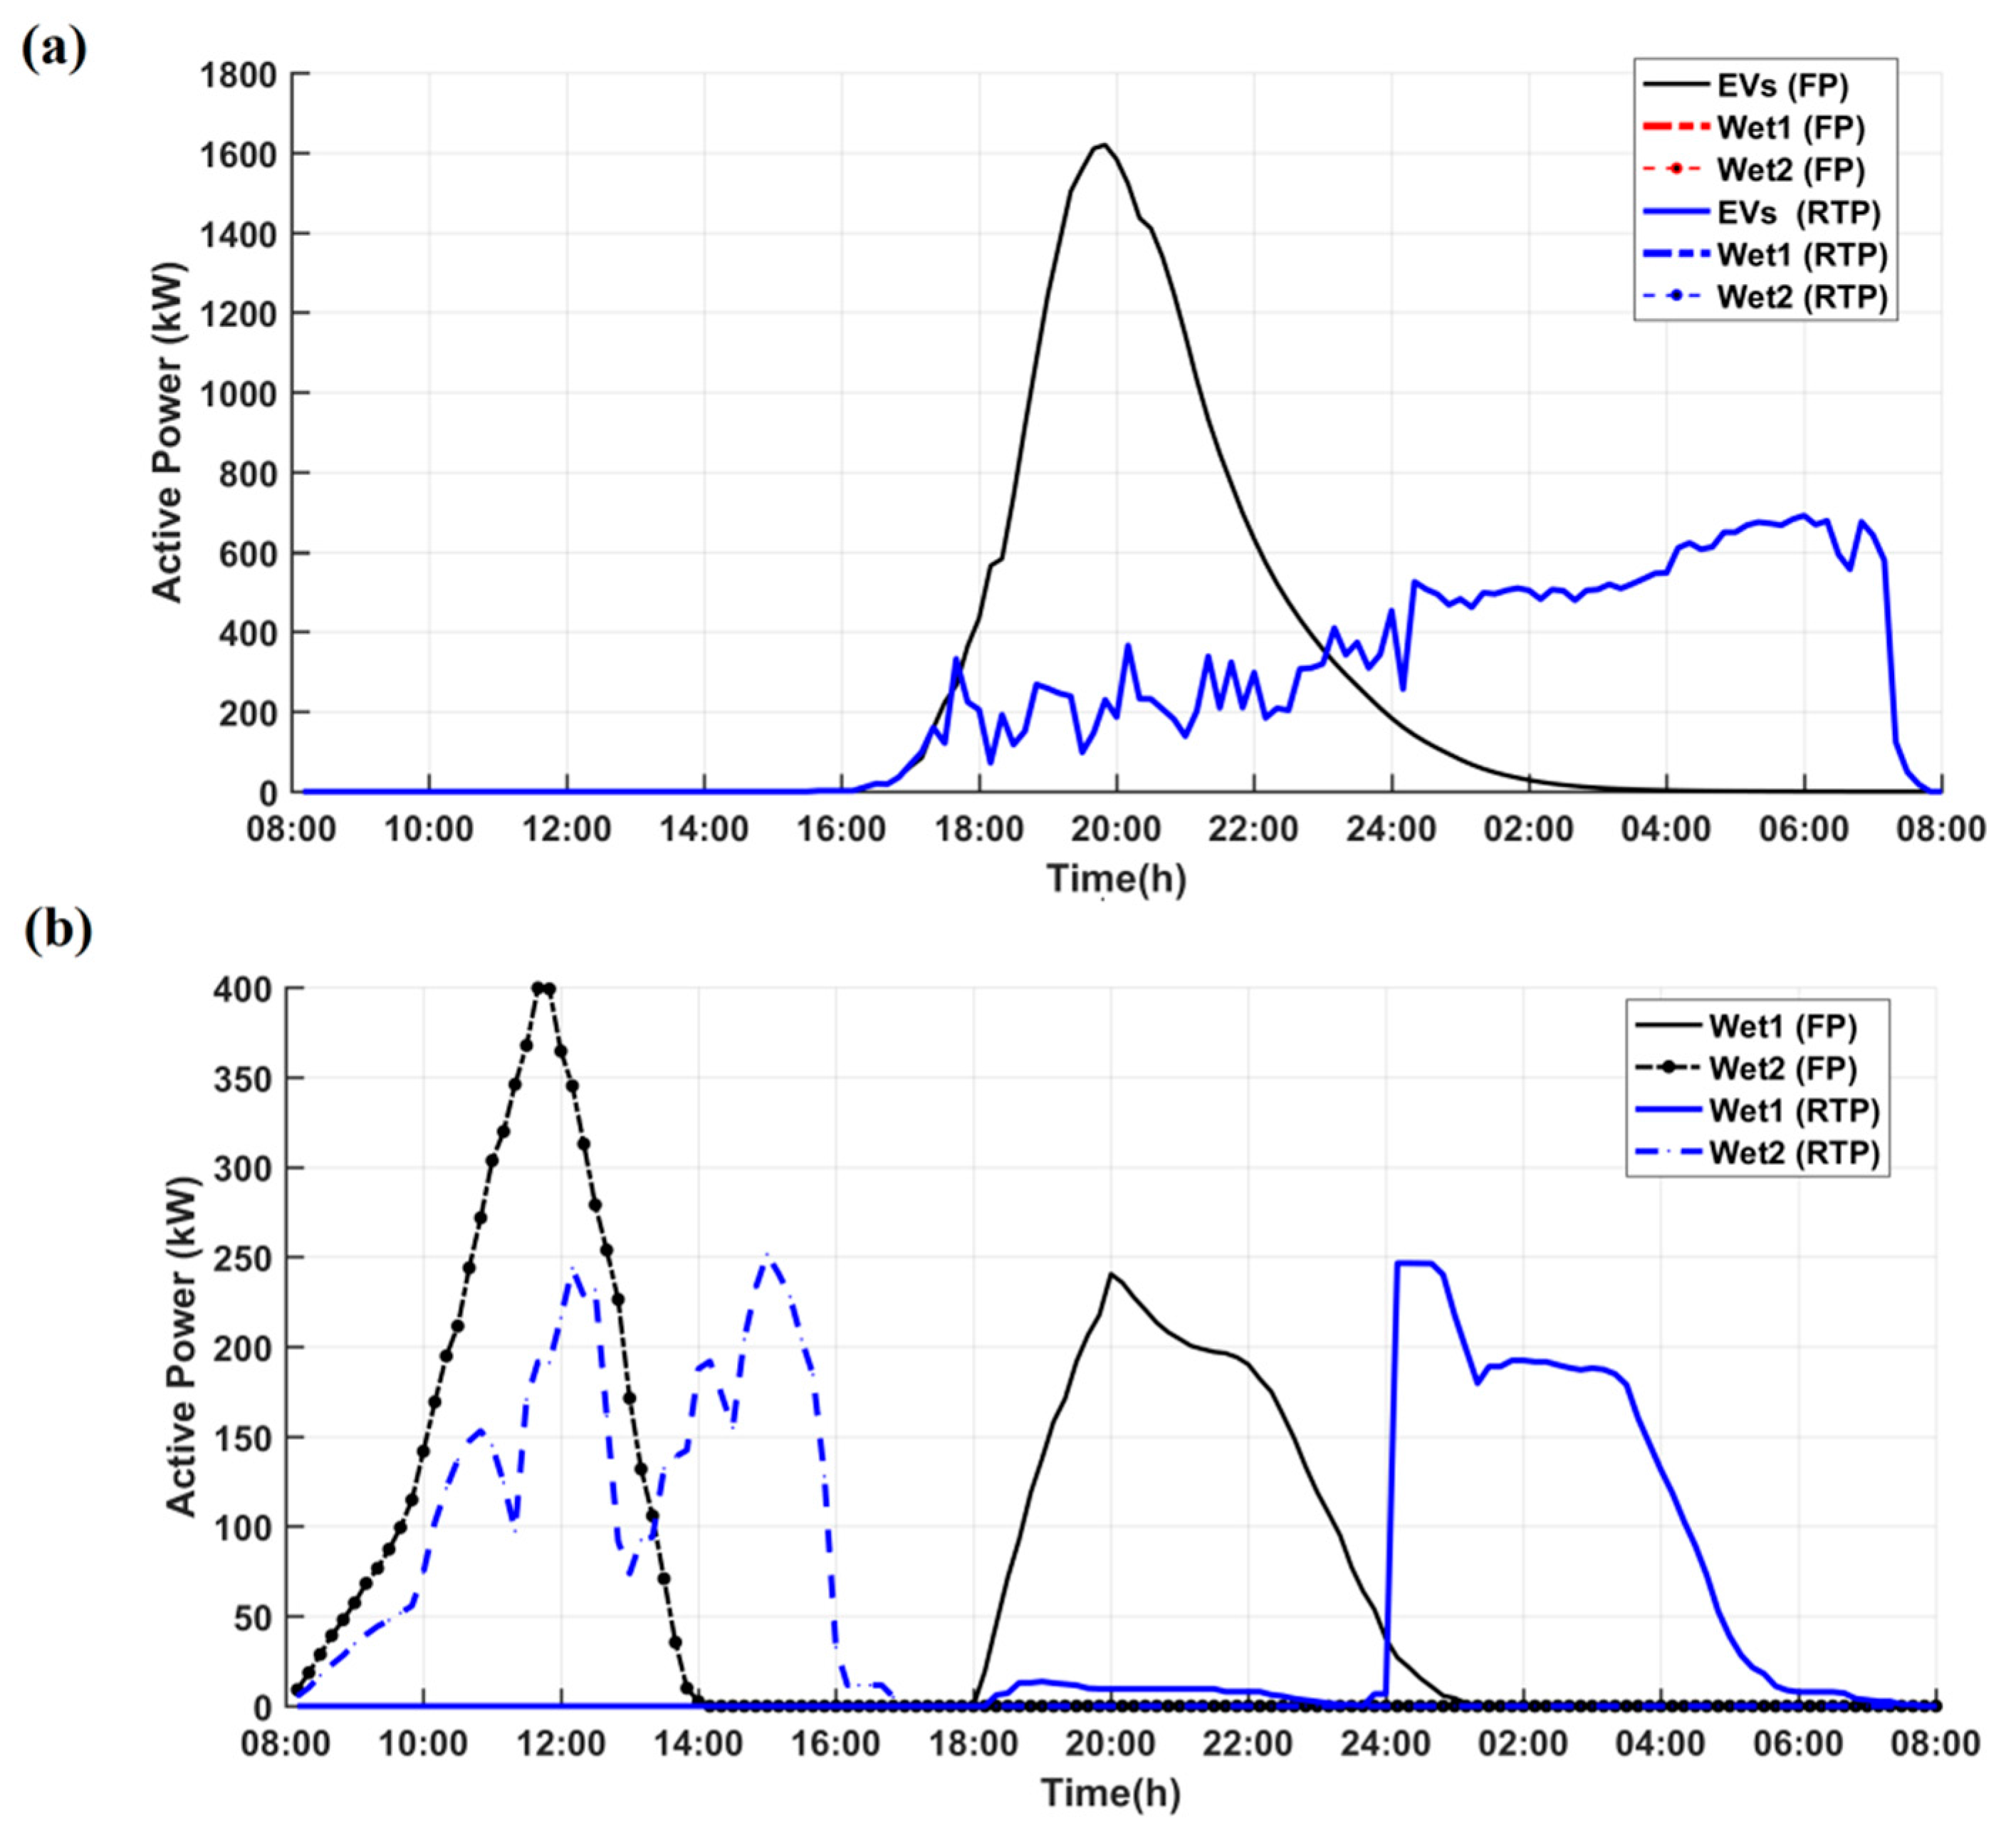
The proposed transactive method can indirectly manage EVs’ loads same as the other elastic loads, even in the presence of high penetration level of EVs (50%). The proposed transactive method is changing the RTP to encourage customers to shift the elastic loads to time intervals with the lowest price. As a result, the proposed method reduces the power peak to 870 kW and the maximum MC to 14.9 cents. Figure 7 shows the original (FR) and the shifted elastic loads, by implementing the proposed RTP method. This new load profile minimizes the cost for each customer and also satisfies the constraints of both the network and customers.
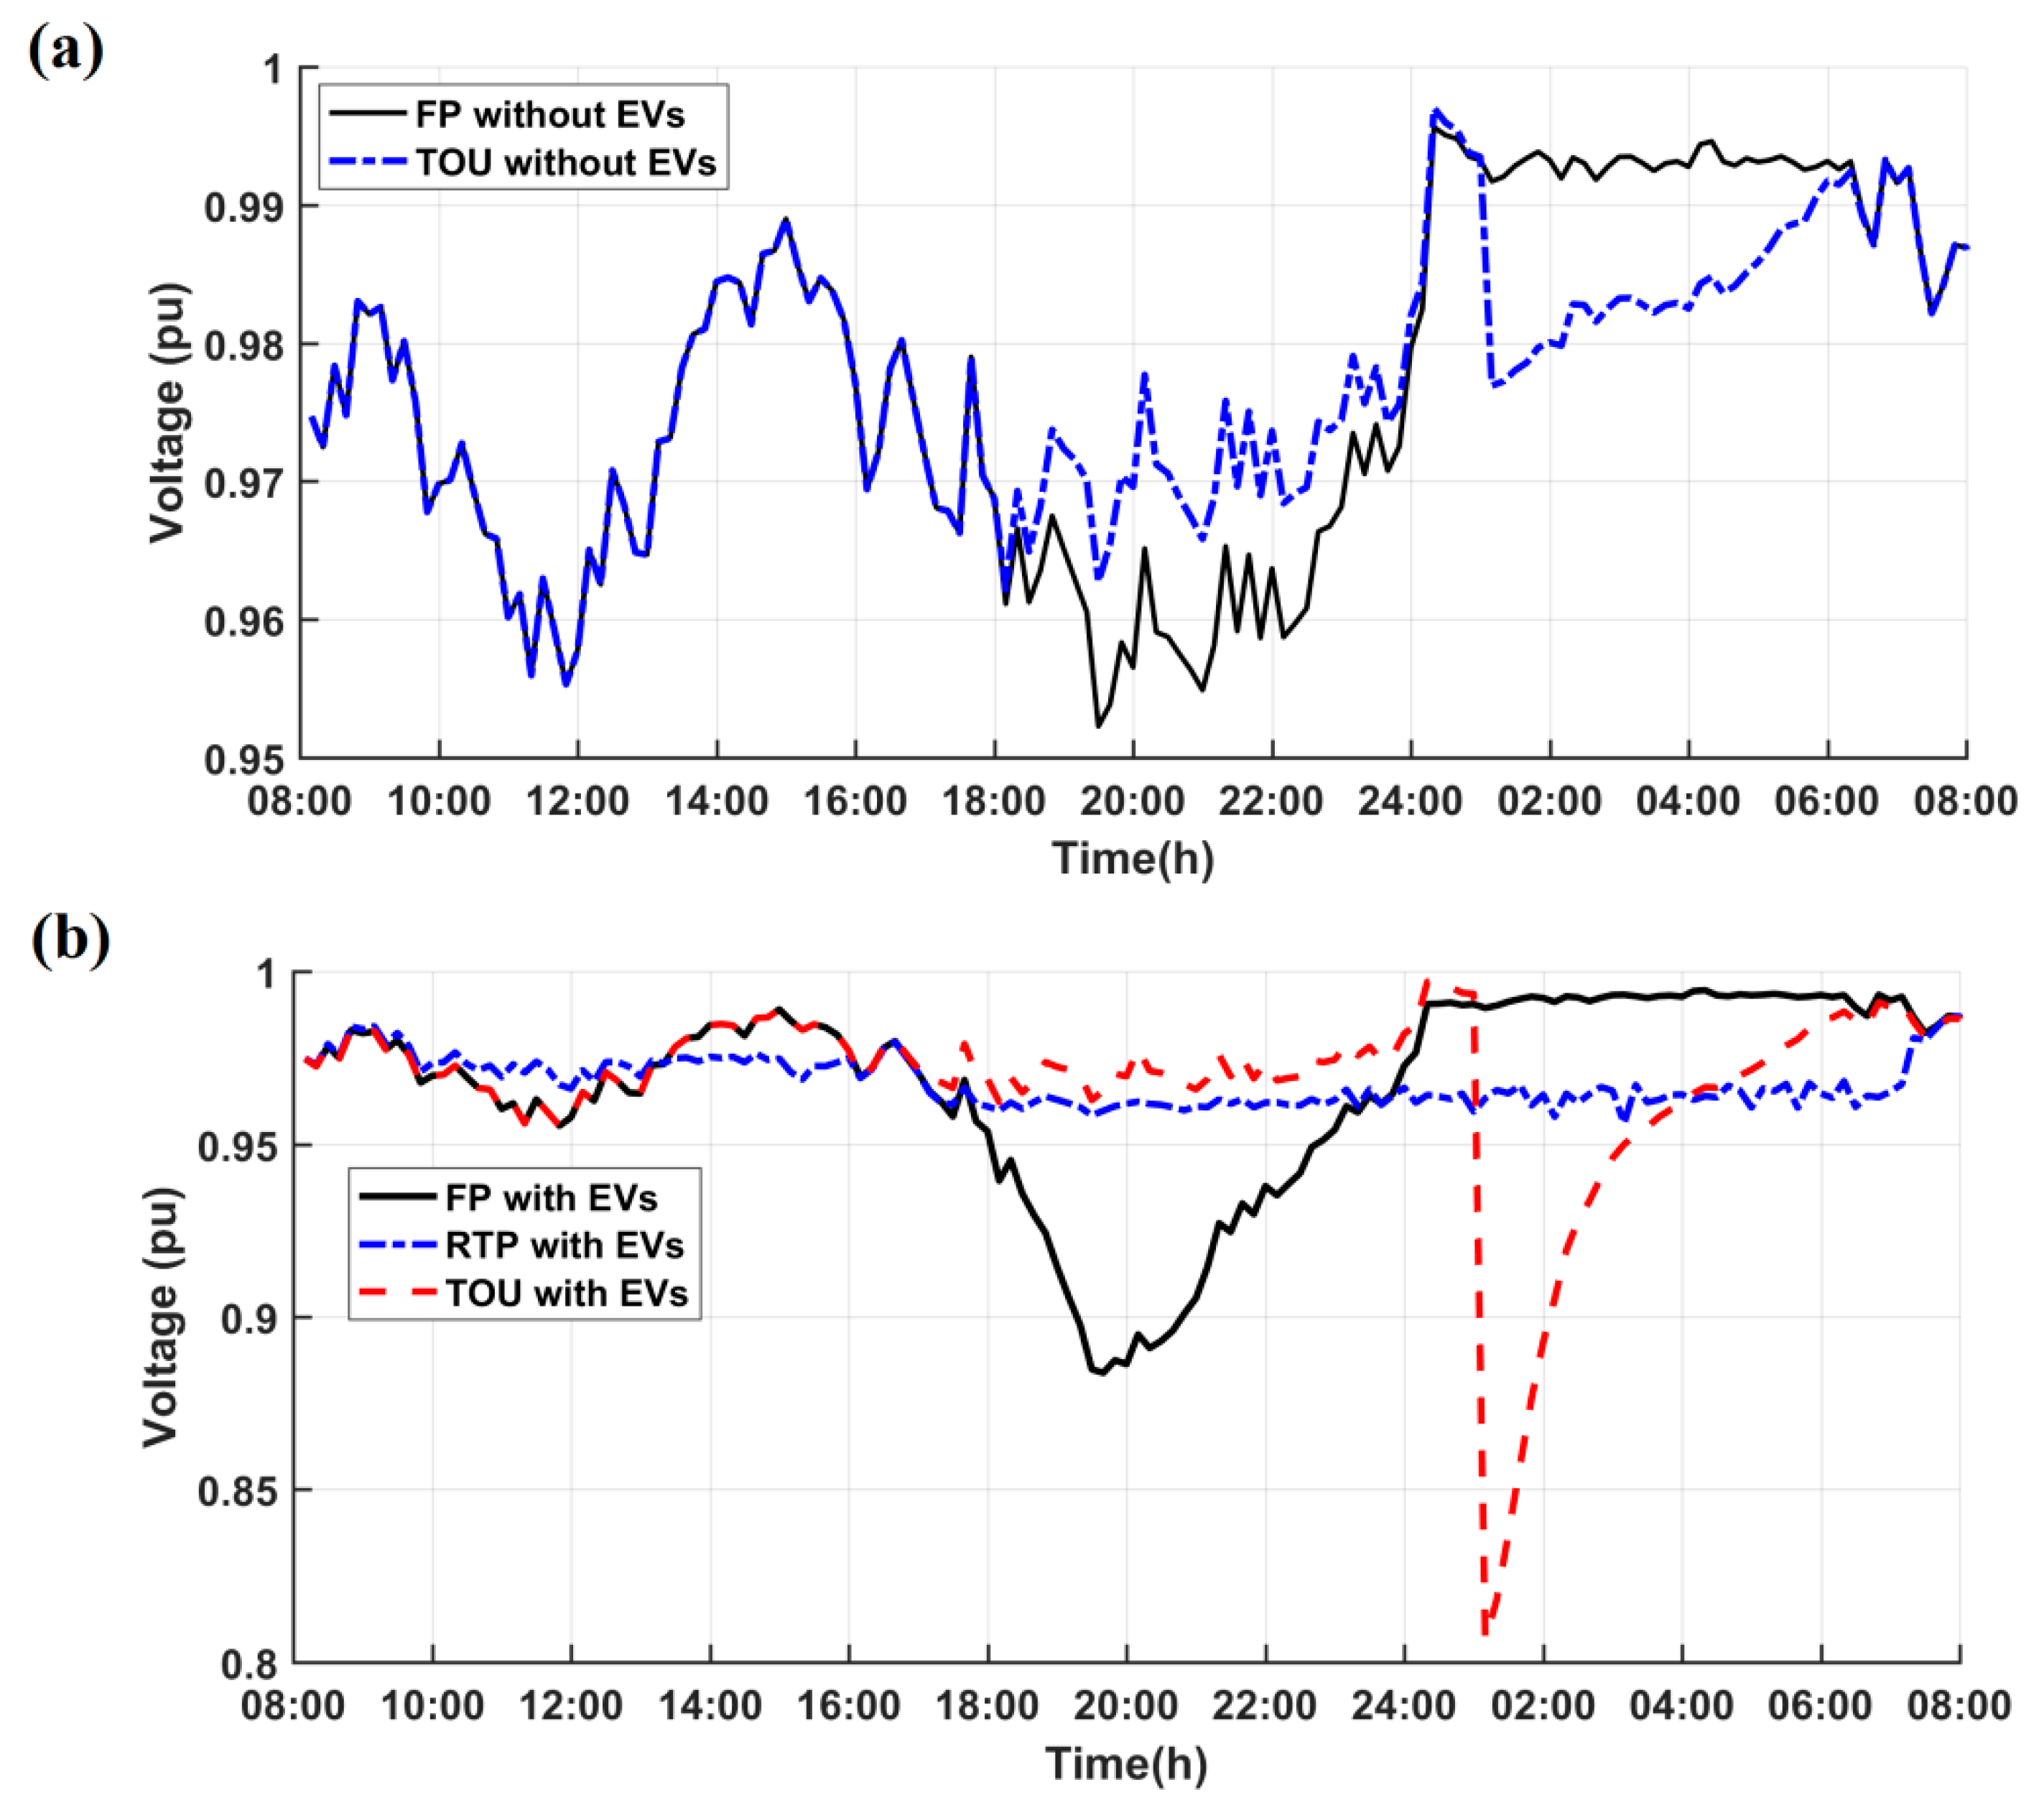
Figure 8 shows the voltage of the bus #26 that experiences the lowest voltage. The minimum voltage of the network with EVs in the FR and TOU methods are 0.88 pu and 0.81 pu, respectively. However, the proposed method can maintain a voltage above 0.95 pu, which is even better than the base load (FR without EVs).
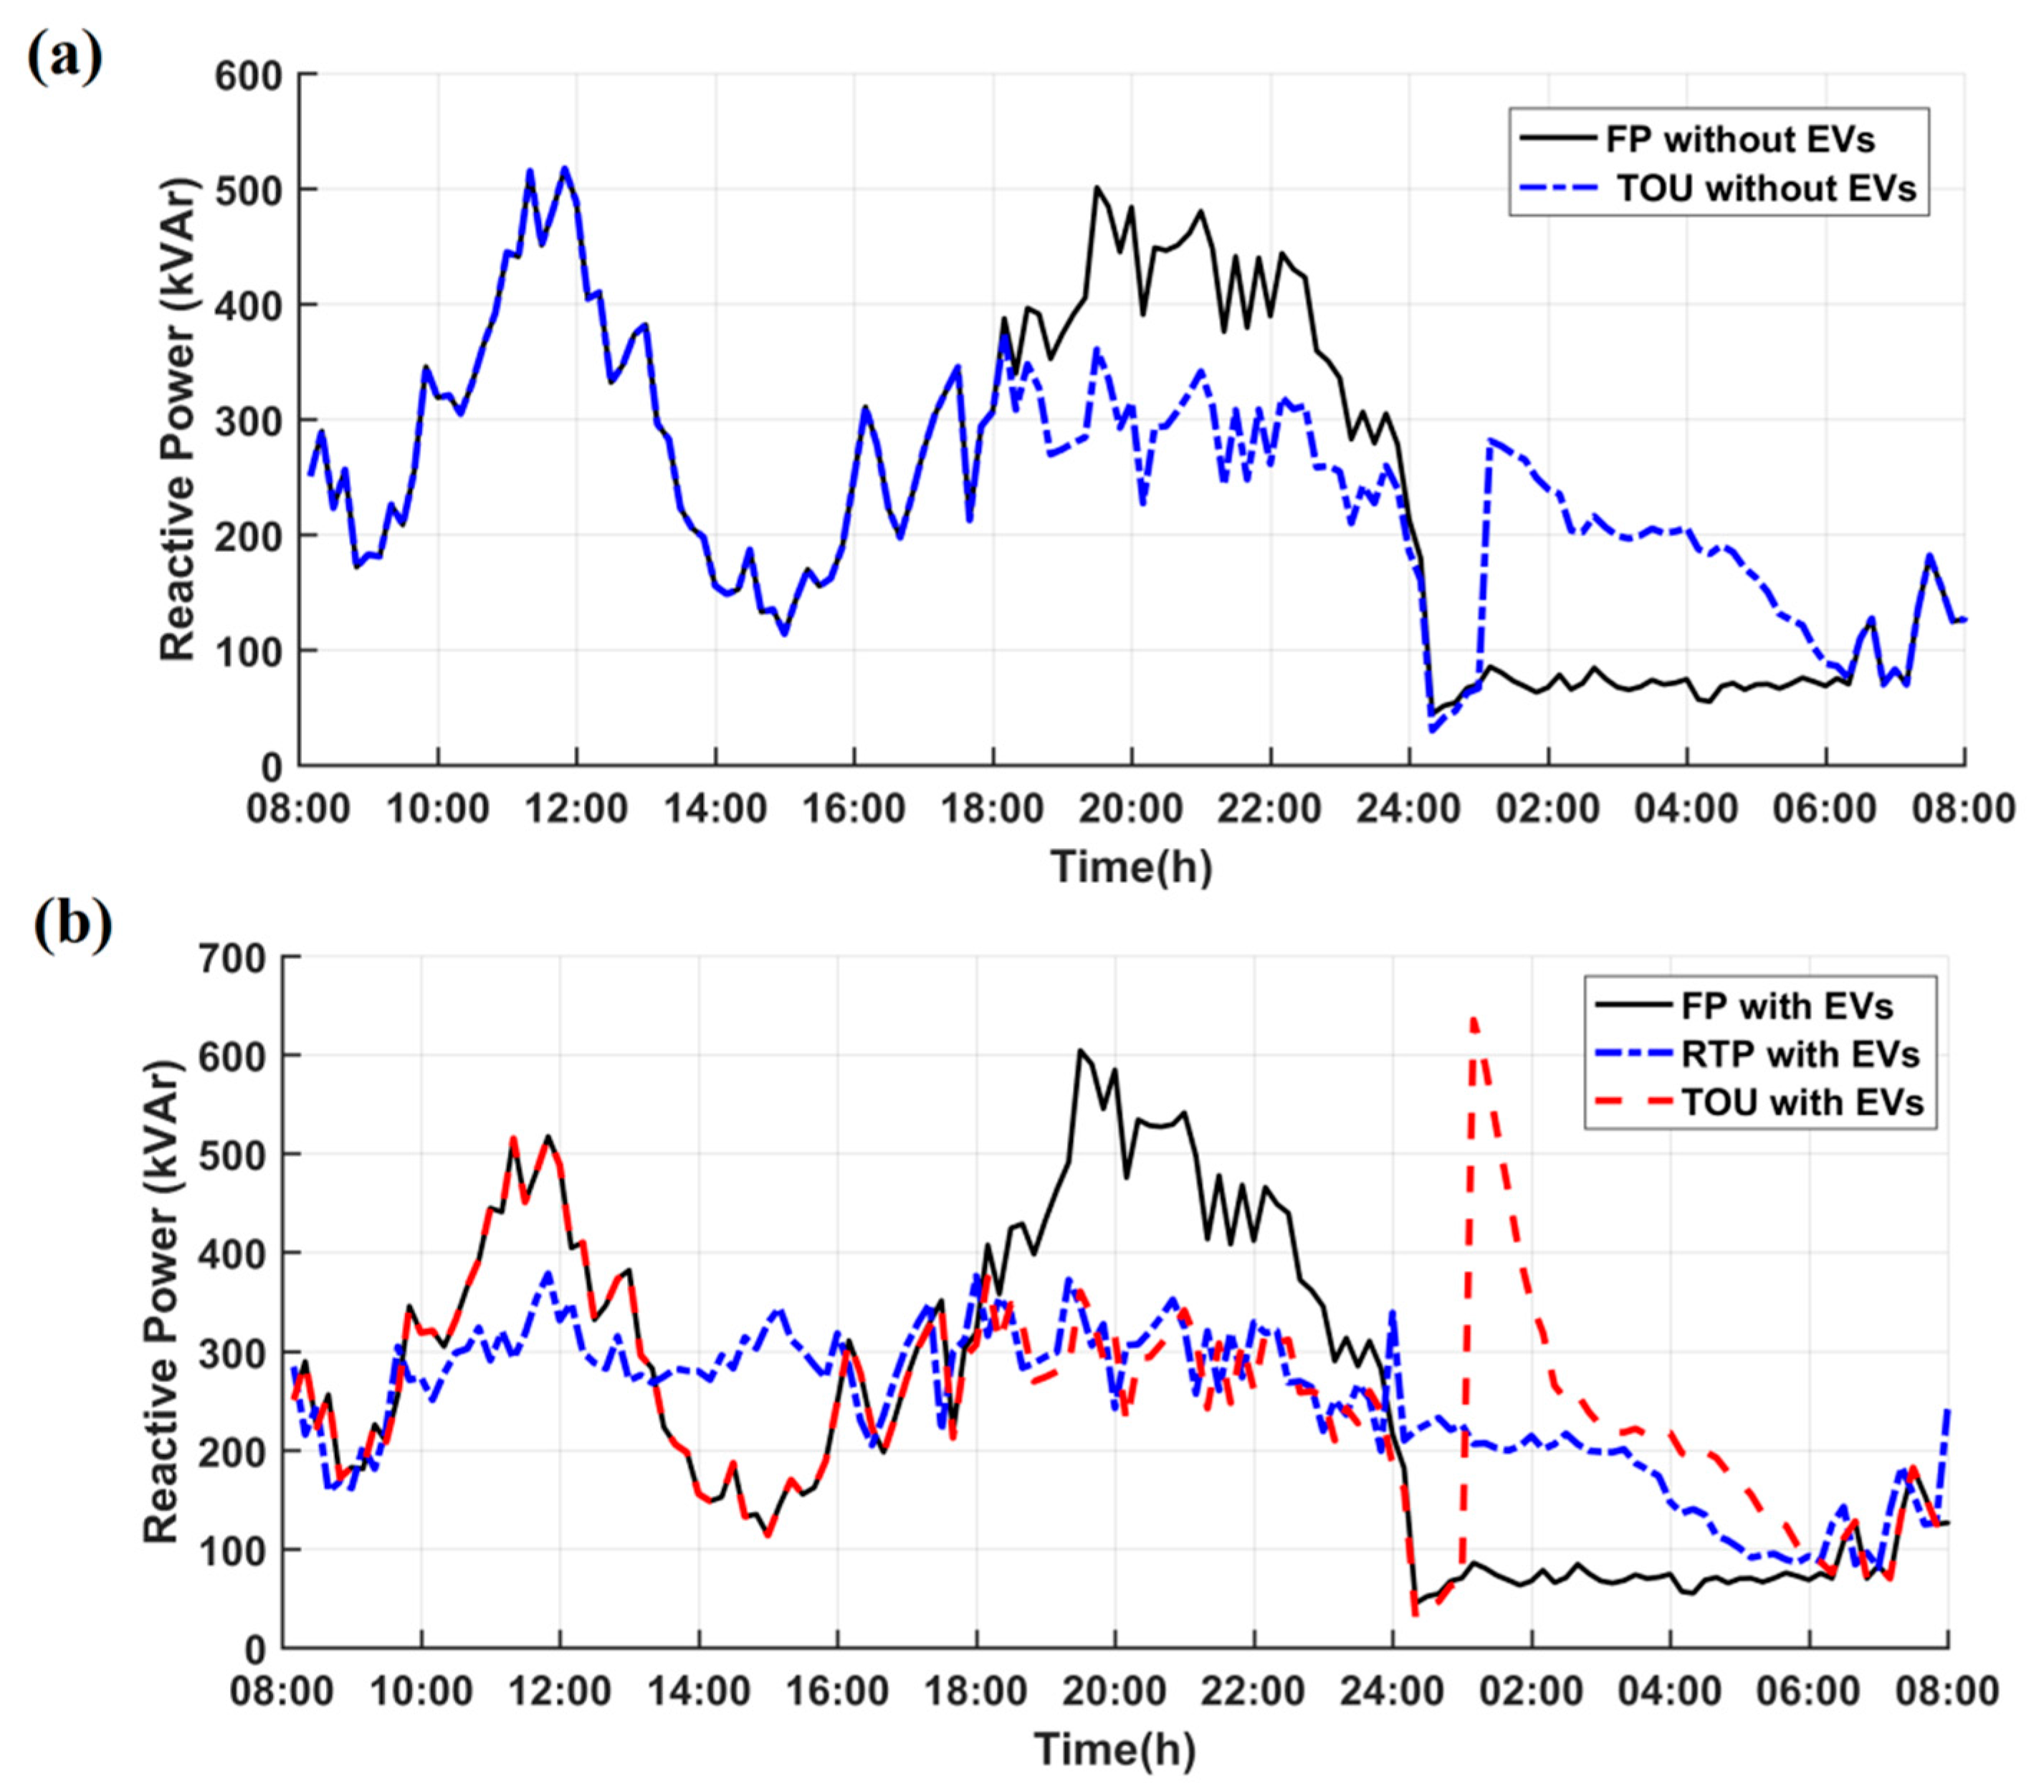
The reactive power of the network is shown in Figure 9. Although the EV chargers have unit power factor, the reactance of power lines increases the total reactive power consumption of the network.
The maximum active and reactive power (Pmax and Qmax), the maximum MC (MCmax), the percentage of energy loss (Eloss/∑P), and the energy cost of all loads in different cases are listed in Table 1. The results show that the TOU method can reduce energy cost and improve some technical issues, such as peak power and voltage regulation, but is not so effective in scenarios with a high penetration level of EVs as it can create rebound peaks. On the other hand, the proposed transactive method can well manage the EVs’ loads and other elastic appliances, such that the peak power and the maximum MC are kept even less than the base load (FR without EVs). The case 9 in Table 1, shows the effect of V2G mode. As expected, because of the flat MC of the proposed method, the V2G mode can slightly improve the performance even with the low degradation coefficient.
One of the important challenges of implementing the RTP method is the calculation time. The calculation time has to be short enough to cope with the dynamic changes in the system. In order to test the calculation time, we implemented the proposed method using MATLAB on a workstation with an 8-core 2.3 GHz CPU and 8 GB RAM. In this implementation, each time interval is assumed to be 10 min long, which is a practical assumption in SGs. The number of iterations and the calculation time for each time interval are shown in Figure 10. The results show that the calculation time of the proposed heuristic two-stage iterative method is less than 4 s. Note that the first stage of the proposed method is done by the customers and can be executed simultaneously by smart meters in parallel. In detail, the average execution times of the customer side (First Stage) and the grid side (Second Stage) are measured 0.0023 s and 0.0031 s, respectively.

5. Conclusions

In the modern power grid, DSM program is imperative to cope with the dynamic nature of output power produced by renewable energy source and extra demand of EVs. In this paper, a transactive DSM program under an imperfect competition market model in the presence of high penetration level of EVs is proposed. The transactive DSM program gives the decision authority to customers and can attract more customers to participate in the program, while the imperfect competition market model prevents the rebounding peaks and satisfies the power system constraints. Although the indirect demand control in an imperfect competition market leads to a complicated nonlinear non-convex multi-objective optimization problem, a heuristic two-stage iterative method is proposed to quickly solve the problem. The method is simulated in MATLAB on the IEEE 37-bus test system having 1141 customers with actual load profiles and different elastic appliances and EVs. The results show that the proposed method not only decreases energy cost of individual customers and power loss and maintains power system constraints within their limits, but also solves the problem quickly enough to be feasible in real-time operations.

Acknowledgments

This research was funded by the MSIP, Korea, under the “ICT Consilience Creative Program” (IITP-2015-R0346-15-1007) supervised by the IITP, Korea, and under the “Basic Science Research Program” (2015R1C1A1A01053788) through the NRF, Korea.

Author Contributions

Poria Astero and Bong Jun Choi propose a new transactive DSM program for high penetration levels of EVs using an imperfect competition model. Hao Liang and Lennart Söder check the ability of the method to overcome the limitations and impractical assumptions of existing works, such as high computational complexity due to power system constraints and need for centralized control.

Conflicts of Interest

The authors declare no conflict of interest.

Appendix A

Theorem A1.
Algorithm 3 converges to the equilibrium of the market.
Proof. 
In a rational market the following assumption are always true: (1) Supply curve (S) is a non-decreasing function; (2) Demand curve (D) is a non-increasing function; (3) The initial cost of production (S(0)) is less than the price that customers would be willing to pay for the first unit of production (D(0)); and (4) demand curve always has positive value, so D() ≥ 0 and S()→. In these circumstances, the function (F), which is defined as F = DS is a non-increasing function whose root is the market equilibrium (RTP). Since F(0) > 0 and F() < 0, the bisecting method can find the root of F. Therefore, Algorithm 3, which is bisecting the difference of supply and demand curve, converges to the market equilibrium. □

References

  1. Richardson, D.B. Electric vehicles and the electric grid: A review of modeling approaches, impacts, and renewable energy integration. Renew. Sustain. Energy Rev. 2013, 19, 247–254. [Google Scholar] [CrossRef]
  2. Al-Alawi, B.M.; Bradley, T.H. Review of hybrid, plug-in hybrid, and electric vehicle market modeling studies. Renew. Sustain. Energy Rev. 2013, 21, 190–203. [Google Scholar] [CrossRef]
  3. Han, X.; Yuan, H.; Wei, C.; Li, H. A survey of influence of electrics vehicle charging on power grid. In Proceedings of the 2014 IEEE 9th Conference on Industrial Electronics and Applications (ICIEA), Hangzhou, China, 9–11 June 2014; pp. 121–126. [Google Scholar]
  4. Benefits of Demand Response in Electricity Markets and Recommendations for Achieving Them; Department of Energy: Washington, DC, USA, 2006.
  5. Parvania, M.; Fotuhi-Firuzabad, M. Demand response scheduling by stochastic scuc. IEEE Trans. Smart Grid 2010, 1, 89–98. [Google Scholar] [CrossRef]
  6. Braithwait, S. Behavior modification. IEEE Power Energy Mag. 2010, 8, 36–45. [Google Scholar] [CrossRef]
  7. Berger, A.W.; Schweppe, F.C. Real time pricing to assist in load frequency control. IEEE Trans. Power Syst. 1989, 4, 920–926. [Google Scholar] [CrossRef]
  8. Safdarian, A.; Fotuhi-Firuzabad, M.; Lehtonen, M. A distributed algorithm for managing residential demand response in smart grids. IEEE Trans. Ind. Inform. 2014, 10, 2385–2393. [Google Scholar] [CrossRef]
  9. Chang, T.-H.; Alizadeh, M.; Scaglione, A. Real-time power balancing via decentralized coordinated home energy scheduling. IEEE Trans. Smart Grid 2013, 4, 1490–1504. [Google Scholar] [CrossRef]
  10. Vardakas, J.S.; Zorba, N.; Verikoukis, C.V. A survey on demand response programs in smart grids: Pricing methods and optimization algorithms. Commun. Surv. Tutor. 2015, 17, 152–178. [Google Scholar] [CrossRef]
  11. Divshali, P.H.; Choi, B.J. Electrical market management considering power system constraints in smart distribution grids. Energies 2016, 9, 405. [Google Scholar] [CrossRef]
  12. Kempton, W.; Letendre, S.E. Electric vehicles as a new power source for electric utilities. Transp. Res. Part D Transp. Environ. 1997, 2, 157–175. [Google Scholar] [CrossRef]
  13. Weiller, C. Plug-in hybrid electric vehicle impacts on hourly electricity demand in the united states. Energy Policy 2011, 39, 3766–3778. [Google Scholar] [CrossRef]
  14. Yue, M.; Wang, X. Grid inertial response-based probabilistic determination of energy storage system capacity under high solar penetration. IEEE Trans. Sustain. Energy 2015, 6, 1039–1049. [Google Scholar] [CrossRef]
  15. McNamara, P.; McLoone, S. Hierarchical demand response for peak minimization using dantzig-wolfe decomposition. IEEE Trans. Smart Grid 2015, 6, 2807–2815. [Google Scholar] [CrossRef]
  16. Logenthiran, T.; Srinivasan, D.; Shun, T.Z. Demand side management in smart grid using heuristic optimization. IEEE Trans. Smart Grid 2012, 3, 1244–1252. [Google Scholar] [CrossRef]
  17. O’Brien, G.; El Gamal, A.; Rajagopal, R. Shapley value estimation for compensation of participants in demand response programs. IEEE Trans. Smart Grid 2015, 6, 2837–2844. [Google Scholar] [CrossRef]
  18. Kuran, M.S.; Viana, A.C.; Iannone, L.; Kofman, D.; Mermoud, G.; Vasseur, J.P. A smart parking lot management system for scheduling the recharging of electric vehicles. IEEE Trans. Smart Grid 2015, 6, 2942–2953. [Google Scholar] [CrossRef]
  19. Dallinger, D.; Wietschel, M. Grid integration of intermittent renewable energy sources using price-responsive plug-in electric vehicles. Renew. Sustain. Energy Rev. 2012, 16, 3370–3382. [Google Scholar] [CrossRef]
  20. Xydas, E.; Marmaras, C.; Cipcigan, L.M. A multi-agent based scheduling algorithm for adaptive electric vehicles charging. Appl. Energy 2016, 177, 345–365. [Google Scholar] [CrossRef]
  21. Kirschen, D.S.; Strbac, G. Fundamentals of Power System Economic; John Wiley & Sons: New York, NY, USA, 2004. [Google Scholar]
  22. La, Q.D.; Chan, Y.W.E.; Soong, B.-H. Power management of intelligent buildings facilitated by smart grid: A market approach. IEEE Trans. Smart Grid 2016, 7, 1389–1400. [Google Scholar] [CrossRef]
  23. Kok, K.; Widergren, S. A society of devices: Integrating intelligent distributed resources with transactive energy. IEEE Power Energy Mag. 2016, 14, 34–45. [Google Scholar] [CrossRef]
  24. Grainger, J.G.; Stevenson, W.D., Jr. Power System Analysis; McGraw-Hill Education: Bhopal, Madhya Pradesh, India, 2003. [Google Scholar]
  25. Chang, G.; Chu, S.; Wang, H. An improved backward/forward sweep load flow algorithm for radial distribution systems. IEEE Trans. Power Syst. 2007, 22, 882–884. [Google Scholar] [CrossRef]
  26. Shafie-Khah, M.; Heydarian-Forushani, E.; Osorio, G.J.; Gil, F.A.; Aghaei, J.; Barani, M.; Catalao, J.P. Optimal behavior of electric vehicle parking lots as demand response aggregation agents. IEEE Trans. Smart Grid 2016, 7, 2654–2665. [Google Scholar] [CrossRef]
  27. Divshali, P.H.; Choi, B.J. Indirect demand side management program under realtime pricing in smart grids using oligopoly market model. In Proceedings of the First International Conference on Green Communications, Computing and Technologies (GREEN 2016), Nice, France, 24–28 July 2016. [Google Scholar]
  28. Della Vedova, M.L.; Facchinetti, T. Real-time scheduling for peak load reduction in a large set of hvac loads. In Proceedings of the Third International Conference on Smart Grids, Green Communications and IT Energy-aware Technologies (ENERGY), Lisbon, Portugal, 24–29 March 2013; IARIA: Lisbon, Portugal, 2013; pp. 161–166. [Google Scholar]
  29. Divshali, P.H.; Choi, B.J. Indirect real-time evs charging technique based on an imperfect competition market. In Proceedings of the IEEE International Conference on Smart Grid Communications (SmartGridComm), Sydney, Australia, 6–9 November 2016. [Google Scholar]
  30. Moradzadeh, B.; Tomsovic, K. Two-stage residential energy management considering network operational constraints. IEEE Trans. Smart Grid 2013, 4, 2339–2346. [Google Scholar] [CrossRef]
  31. Al-Hinai, A.; Sedhisigarchi, K.; Feliachi, A. Stability enhancement of a distribution network comprising a fuel cell and a microturbine. In Proceedings of the IEEE Power Engineering Society General Meeting, Denvor, CO, USA, 6–10 June 2004; IEEE: Denvor, CO, USA, 2014; pp. 2156–2161. [Google Scholar]
  32. Richardson, I.; Thomson, M.; Infield, D.; Clifford, C. Domestic electricity use: A high-resolution energy demand model. Energy Build. 2010, 42, 1878–1887. [Google Scholar] [CrossRef]
  33. Richardson, I.T. Domestic Electricity Demand Model—Simulation Example. Available online: https://dspace.lboro.ac.uk/dspace-jspui/handle/2134/5786CREST_Domestic_electricity_demand_model_1.0e(1).xlsm (accessed on 13 June 2016).
  34. Neubauer, J.; Brooker, A.; Wood, E. Sensitivity of battery electric vehicle economics to drive patterns, vehicle range, and charge strategies. J. Power Sources 2012, 209, 269–277. [Google Scholar] [CrossRef]
  35. Morrow, K.; Karner, D.; Francfort, J. Plug-In Hybrid Electric Vehicle Charging Infrastructure Review. Available online: https://avt.inl.gov/sites/default/files/pdf/phev/phevInfrastructureReport08.pdf (accessed on 18 October 2017).
  36. Smartgridcity Pricing Plan Comparison Chart. Available online: http://smartgridcity.xcelenergy.com/media/pdf/SGC-pricing-plan-chart.pdf (accessed on 13 June 2016).
Figure 1. Proposed heuristic two-stage iterative method to solve transactive DSM optimization problem.
Energies 10 01640 g001
Figure 2. The demand and supply curve in a rational power market; (a) a general form; (b) when customers decide similarly.
Energies 10 01640 g002
Figure 3. The single line diagram of IEEE-37 bus test system.
Energies 10 01640 g003
Figure 4. The average consumption profile of elastic appliances.
Energies 10 01640 g004
Figure 5. (a) Total active power and (b) Marginal cost of the FR and TOU, in a grid with no EV.
Energies 10 01640 g005
Figure 6. (a) Total active power and (b) Marginal cost of the proposed transactive method, FR, and TOU, in a grid with high penetration of EVS.
Energies 10 01640 g006
Figure 7. The total active power of elastic loads in FR and the RTP (the proposed method), (a) total power of EVs; (b) Total active power of other elastic loads.
Energies 10 01640 g007
Figure 8. Voltage of the worse bus (#26) using FR, TOU and the proposed transactive method (RTP): (a) without EV; (b) With EVs.
Energies 10 01640 g008
Figure 9. Total reactive power using FR, TOU and the proposed transactive method (RTP): (a) without EV; (b) With EVs.
Energies 10 01640 g009
Figure 10. The number of iterations and the calculation time.
Energies 10 01640 g010
Table 1. Performance comparison of customer motivation methods under various EV settings.
CaseDescriptionPmax (kW)Qmax (kVAr)MCmax ($/kW)Eloss/∑P (%)Vmin (%)Inelastic Cost ($)Wet1 Cost ($)Wet2 Cost ($)EVs Cost ($)Total Energy Cost ($)
1FR without EVs9415170.17361.8695.235019720677-6416
2FR with EVs26826041.29793.5788.3815,496387167725,37045,414
3TOU without EVs8865170.15671.6395.534301298677-5275
4TOU with EVs46506353.94183.7480.647340548467754,46567,966
5Proposed RTP without EVs7673780.12391.5596.224160269486-4915
6Proposed RTP with EVs8603790.14812.0395.826159808499484912,314
7Proposed RTP with EVs in V2G mode (rb = 5 ¢/kW)8613790.14732.0395.826150807499484812,304