Energy Efficiency and Scalability of Metallic Nanoparticle Production Using Arc/Spark Discharge


1
Thermal and Flow Engineering, Åbo Akademi University, 20500 Turku, Finland
2
Paroc Group Oy, 21600 Parainen, Finland
*
Author to whom correspondence should be addressed.
Energies 2017, 10(10), 1605; https://doi.org/10.3390/en10101605
Submission received: 28 June 2017
/
Revised: 5 October 2017
/
Accepted: 9 October 2017
/
Published: 13 October 2017
Abstract
:The increased global demand for metallic nanoparticles for an ever growing number of applications has given rise to a need for larger scale and more efficient nanoparticle (NP) production processes. In this paper one such process is evaluated from the viewpoints of scalability and energy efficiency. Multiple setups of different scale of an arc/spark process were evaluated for energy efficiency and scalability using exergy analysis, heat loss evaluation and life cycle impact assessment, based on data collected from EU FP7 project partners. The energy efficiency of the process is quite low, with e.g., a specific electricity consumption (SEC) of producing ~80 nm copper NP of 180 kWh/kg while the thermodynamic minimum energy need is 0.03 kWh/kg. This is due to thermal energy use characteristics of the system. During scale-up of the process the SEC remained similar to that of smaller setups. Loss of NP mass in the tubing of larger setups gives a lower material yield. The variation in material yield has a significant impact on the life cycle impact for the produced NP in both the Human Health and Ecosystem Quality categories while the impact is smaller in the Global Warming and Resource Depletion categories.
1. Introduction
Global demand for nanoparticles (NPs) is growing as new applications are invented. Currently hundreds of tons of just silver NPs are produced annually and are used in medical products, paints and coatings as well as in textiles and cosmetics. In addition to this, large quantities of other metallic NPs are also produced each year.
The increasing demand for NPs has given rise to a need for better and more efficient methods of production. For new methods to be “better” and “more efficient” they need to have fewer or simpler processing routes that use less toxic, less hard to recover, cheaper or simply no chemicals while using less energy. It is also required that in the end the new methods be economically competitive.
For metallic NPs, one such method could be the electric arc/spark discharge evaporation and condensation method studied in the EU Framework 7 project BUONAPART-E (2012–2016) [1]. The goal of the BOUNAPART-E project was to study the arc/spark evaporation process for making metallic NPs, scale up the production rates to up to 100 kg/day and to evaluate a portfolio of applications for the produced NPs. The arc/spark discharge evaporation and condensation method is a gas-phase NP synthesis method of which there are two types: thermal decomposition and evaporation and condensation processes. In the thermal decomposition processes, precursors containing metal are used while in the evaporation and condensation processes pure metals are used. Several different types of reactor and energy sources have been used to study evaporation and condensation processes for NP production [2,3,4,5,6,7]. Other processes for metallic NP production include chemical reduction methods, electrochemical methods, flame spray pyrolysis, vapour deposition and ablation and sputtering methods [8,9]. The environmental impact of silver NPs for example, produced using these routes have been compared by Pourzahedi and Eckelman [10]. They found that chemical reduction routes for NP production of silver have the lowest environmental impact while arc plasma and flame spray pyrolysis have the second highest and highest environmental impacts, respectively. The arc plasma method evaluated by Pourzahedi and Eckelman is similar to the arc discharge method discussed in this paper. The benefit of the arc and spark methods is that it does not require any chemicals, fuels or solvents. Another benefit of the arc and spark method is that the particles are formed in a gas phase and can easily be separated by the use of particle filters. Data on NP production by electrical discharge evaporation has been produced by several project partners in the BUONAPART-E project. The data was collected from six equipment setups, with two types of discharges, arc or spark, at two different production scales for six metals and two metal alloys. These were selected on the basis of application in commercial products in a near future, in most cases by the industry partners of the project. The processed data included the evaporation rate of metal, the collection rate of NPs on the product filter, carrier gas type, flow and consumption, specific electricity consumption (SEC) and NP product primary particle size.
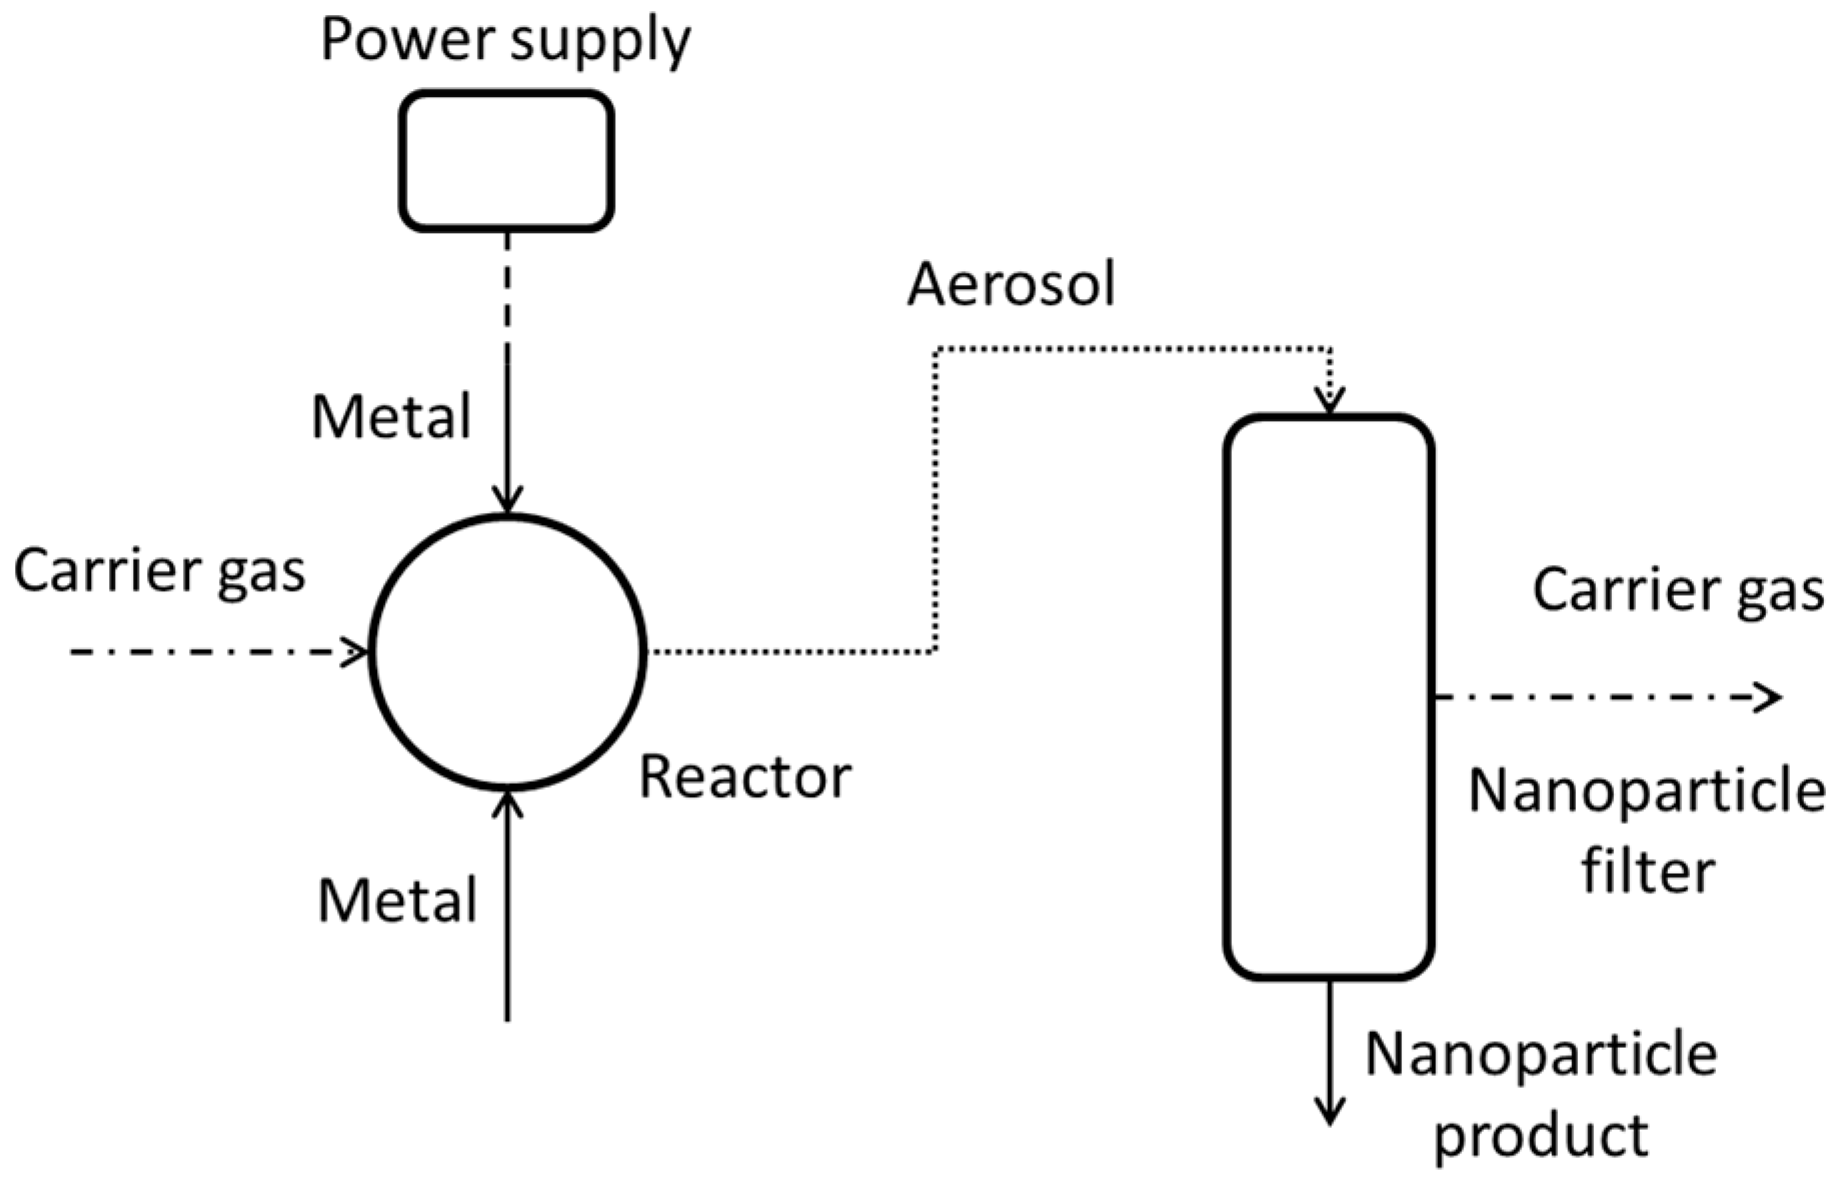
The setups studied were low or high frequency spark discharge units, an arc discharge unit as well as multiple discharge units connected in parallel for both low and high frequency sparks as well as for arc discharge. An evaporation unit developed by the BUONAPART-E project is referred to as an “optimized single unit” (OSU) while multiple connected units are refered to as a “multiple opitimized single unit” (mOSU). The groups at the University of Duisburg-Essen (UDE, Duisburg-Essen, Germany) and Metal Nanopowders Ltd. (MNL, Birmingham, UK) operated systems based on arc discharge while the Delft University of Technology (TUD, Delft, The Netherlands) operated both low and high frequency spark systems and Karlsruhe Institute of Technology (KIT-S, Karlsruhe, Germany) operated a low frequency spark system. Figure 1 shows the basic function scheme for a NP production unit consisting of an evaporation reactor, a power supply and a NP collection filter.
During the BUONAPART-E project data was collected for six metals (silver, copper, zinc, nickel, aluminium and gold) and two alloys (nickel copper and iron chromium). For this paper, the data for silver, copper and zinc allowed for a more detailed evaluation than the data for the other metals and alloys. The collected data is evaluated in order to assess the feasibility of NP production rate scale-up and the environmental impact of the processes.
The goals of this paper are to: (1) evaluate the environmental impact of the arc and spark processes by comparing the specific electricity consumption (SEC) for producing the NPs in two carrier gases, nitrogen and argon; and (2) to evaluate the efficiency of energy use in the process by comparing the measured SEC to the thermodynamic minimum energy required to produce the particles, with the help of exergy analysis; Finally also (3) a life cycle assessment (LCA) is given for the three metals for which most data was available, silver, copper and zinc, and for three applications containing these three metal NPs. The in-depth assessment is given for the three cases studies (studied by three of the project’s industrial partners) that were considered to be the most advanced and well defined at the end of the BUONAPART-E project: (1) use of copper NP as nanofluid dispersion in water for iron- and steelmaking cooling application; (2) use of zinc NP co-extruded into poly propylene (PP) plastic as to enhance flame retarding properties; and (3) use of silver NP in textile application, giving it anti-bacterial properties.
Aspects related to process economy, the final cost of the NP product and how this is affected by the scale-up were addressed by other BUONAPART-E partners and are outside the scope of this paper: some brief reporting for the public domain can be found elsewhere [11]. With price ranges from 0.58 €/g for 210 nm Zn NP to 2928 €/g for 12 nm Ag NP, one outcome of the project was that based on estimated costs the arc/spark produced metallic NP are competitive with similar, commercially available NPs. Ag (120 nm) production costs are similar to other routes, Cu (80 nm) can be produced more cheaply, for Zn only large (210 nm) particle production is profitable. Scale-up as described below brings down the costs, for example from 1.04 to 0.43 €/g for 80 nm Cu NP when going from a 16 unit mOSU to a 192 units production facility (prOSU).
2. Equipment and Research Methods
2.1. OSU/mOSU and Scale-Up Approach
The electrical arc and spark methods used to produce pure metallic NPs consist of evaporating a pure metal with energy delivered through an electrical discharge. This occurs under an inert atmosphere at atmospheric or a slight under-pressure. The inert gas acts as a carrier gas, carrying the metal vapour away from the evaporation zone in the evaporation unit and cooling it. Once the metal vapour reaches a low enough temperature it starts to nucleate. Subsequently, the formed nuclei then form NPs through agglomeration. The main difference between arc and spark setups is how the energy is delivered to the electrodes: in the arc setup a continuous arc discharge supplies the energy while in the spark setup the energy is supplied by sparks at varying frequencies [12].
The arc setup was mainly studied at two partners UDE and MNL while the spark setup was studied at TUD and KIT-S. Tests with various OSU setups have shown that the size distribution, morphology, composition and yield of the produced particles are dependent on the electrode material, carrier gas composition and the type and energy input of the electrical discharge [12,13,14].
Several evaporation reactors can be built and connected in parallel in order to increase the production rate of NPs in a setup referred to as mOSU. Figure 2 shows an arc OSU and a mOSU setup located at UDE. In Figure 2a a partly dismantled single OSU is shown, while Figure 2b shows a mOSU setup consisting of two parallel reactor systems containing eight parallel OSUs each. For the mOSU setup each OSU has its own power supply and metal pellet feeding system while the gas feed and circulation system and NP collection filters are shared; for the OSU setup all this is dedicated to just the one evaporation unit.
NP size measurements were carried out by project partners assisting other project partners, using methods such as SMPS (consisting of a DMA and an AEM, or a DMA and a CNC), ELPI, TEOM and SWAXS—see [15,16,17,18] for more detail. For the mOSU arc set-up at UDE, 1–2 mm metal “shots” were fed to drop into a tungsten crucible using a specially designed feeding device [14], for the spark system the two electrodes form the metal to be processes into NPs [17]. Temperatures of several 1000 K are reached in the evaporator zone of the reactors, peaking for very short (few µs) periods well above 10,000 K. For the UDE arc system the gas flow through the mOSU is of the order of 80 L/min per OSU, with NP product removal on four parallel PTFE filter cartridges [16].
The scale-up approach chosen for BUONAPART-E, the parallelization of multiple arc units in one housing for metal NP production, is a mix of classic and linear scale-up procedures. The parallelization of multiple arcs follows the linear scale-up procedure (a linear increase in resources gives a corresponding linear increase in throughput) in terms of costs. However, for many other parts of the setup a classic scale-up is applicable (an increase in equipment size gives a higher throughput at a lower cost per product unit mass) giving an economy of scale benefit. Parts that benefit this way are for example the reactor housing, pump and filtration unit and monitoring equipment. Particle monitoring equipment is classically scalable, because a single instrument is sufficient for a production plant, lowering the monitoring cost per produced mass. Monitoring of the process can also be classically scalable due to the use of multiplexing where a single detector can be used for many electrode pairs.
2.2. Efficiency of Energy Use: Exergy
One of the tasks of BUONAPART-E was to assess the energy efficiency of the arc/spark metallic NP production route, especially when compared with other, more conventional routes for producing these NP. More conventional are wet chemical routes like those reported on by Lee et al., Lisiecki et al. and Ghanta et al. for silver, copper and zinc NP, respectively [19,20,21]. The energy efficiency was assessed based on experimental data collected by the BUONAPART-E project partners. Exergy assessment was used to evaluate the collected data by comparing it to the thermodynamic minimum. For a given amount of energy in any form, exergy is the part of the energy that can be obtained for use as work, which is dependent on the surrounding environment conditions [22]. Exergy analysis is here made relatively easy since the input energy is in the form of electricity. On the other hand, a thermodynamic minimum for the energy input requirements must be quantified as the reference value against which process data can be mirrored as to determine an “efficiency”. The necessary model expressions will be given below.
With only metal entering and leaving the process differing only in particle size (which can be quantified as increased surface energy) the only other form of energy involved besides electricity is heat. Thus, exergy analysis, based on the Second Law of Thermodynamics, quantifying all energy forms into capacity to do work is highly suitable for determining the efficiency of energy use [18].
In short, the exergy of work W or power/electricity P is equal to W or P, respectively, while for heat Q of temperature T, and surroundings temperature T° (both in K!) the exergy is equal to Q × (1 − T°/T). This can be extended to chemical exergy of species, which is not necessary here since no chemical conversions are considered. More detail on the approach followed here was reported elsewhere [23].
For calculation of the increased surface energy for NP material atoms, literature data for surface free energy (SFE) γ could be used, given typically as a linear function of temperature T, and (bulk) melting temperature Tm,bulk, with two material parameters γ(Tm,bulk) and b:
The creation of particle surface A = 6/(ρ × D) per unit mass (m2/kg) for spherical NP with diameter D and density ρ requires work W, i.e., exergy quantified by the SFE equals to:
Here, the last term (1 − P/D) accounts for the fact that SFE decreases with diameter for small NP, which becomes significant for NP smaller than 50 nm, as elaborated by Xiong et al. [24]. They also show how temperatures of melting and evaporation, Tm and Tv, as well as the enthalpies for this, ΔHm and ΔHv are lowered for small NP compared to bulk material properties:
which define parameter P (m), with diameter d for one atom (this ≈ 0.3 nm for the metals considered in this paper).
The finding that temperatures for melting/solidification and evaporation/condensation depend on NP size results in a second energy penalty for the thermal NP production method using arc/spark discharges. Energy that is used as heat for melting and evaporation of (bulk) metal is later released as heat of condensation and solidification of NP material, however for both processes this release takes place at a lower temperature. For the melting and solidification this gives an overall energy input requirement as electricity equal to an exergy difference quantified by:
A similar expression can be given for the overall energy effect of evaporation and condensation. Below, this result will be used to compare de facto energy (i.e., electricity) use with what is calculated as exergy minimum consumption using Equations (1)–(4).
2.3. LCA
Life cycle assessment (LCA) was used as a tool to evaluate the environmental footprint of the process and how the scale-up affects itm according to the ISO 14040:2006 standard [25]. The standard defines LCA as “compilation and valuation of the inputs, outputs and potential environmental impacts of a product system throughout its life cycle”. The commercial LCA software: SimaPro v. 7.3 using the Ecoinvent v2.2 database was used to calculate the environmental impact for the different NP production scales. This was done using the IMPACT 2002+ method, which implies that the life cycle impact is calculated for fourteen so-called midpoint categories, which are then summarized into four damage categories: Human Health, Ecosystem Quality, Climate Change and Resource Depletion [26].
The Human Health category takes Human toxicity, Respiratory effects, Ionizing radiation, Ozone layer depletion and Photochemical oxidation. Ecosystem Quality in turn takes into account Ozone depletion, Photochemical oxidation, Aquatic ecotoxicity, Terrestial ecotoxicity, Aquatic acidification, Aquatic eutrophication, Terrestial acidification and nitrification and Land occupation. The Climate Change category takes into consideration emissions that cause Global warming while the Resource Depletion category takes into account Non-renewable energy use and Mineral extraction.
The categories are quantified by the following units: DALY, (Disability Adjusted Life Years), for Human health, PDF·m2·year, (Potentially Disappeared Fraction multiplied by area and years), for Ecosystem quality, kilogram CO2 equivalents, for Climate change and MJ primary energy for the Resource depletion category. DALY is a measure of overall disease burden, expressed as years lost due to ill-health, disability or death. PDF is a measure for species affected by toxins at certain concentrations. CO2 equivalents are defined as the amount of CO2 that would have the same global warming effect for a given gas mixture. The gas mixture components considered in this study for CO2 equivalents consists of; carbon dioxide, carbon monoxide, chloroform, nitrogen dioxide, ethane, methane and sulphur hexafluoride. The MJ primary energy needed is the energy needed to extract the same minerals in the future as were used presently.
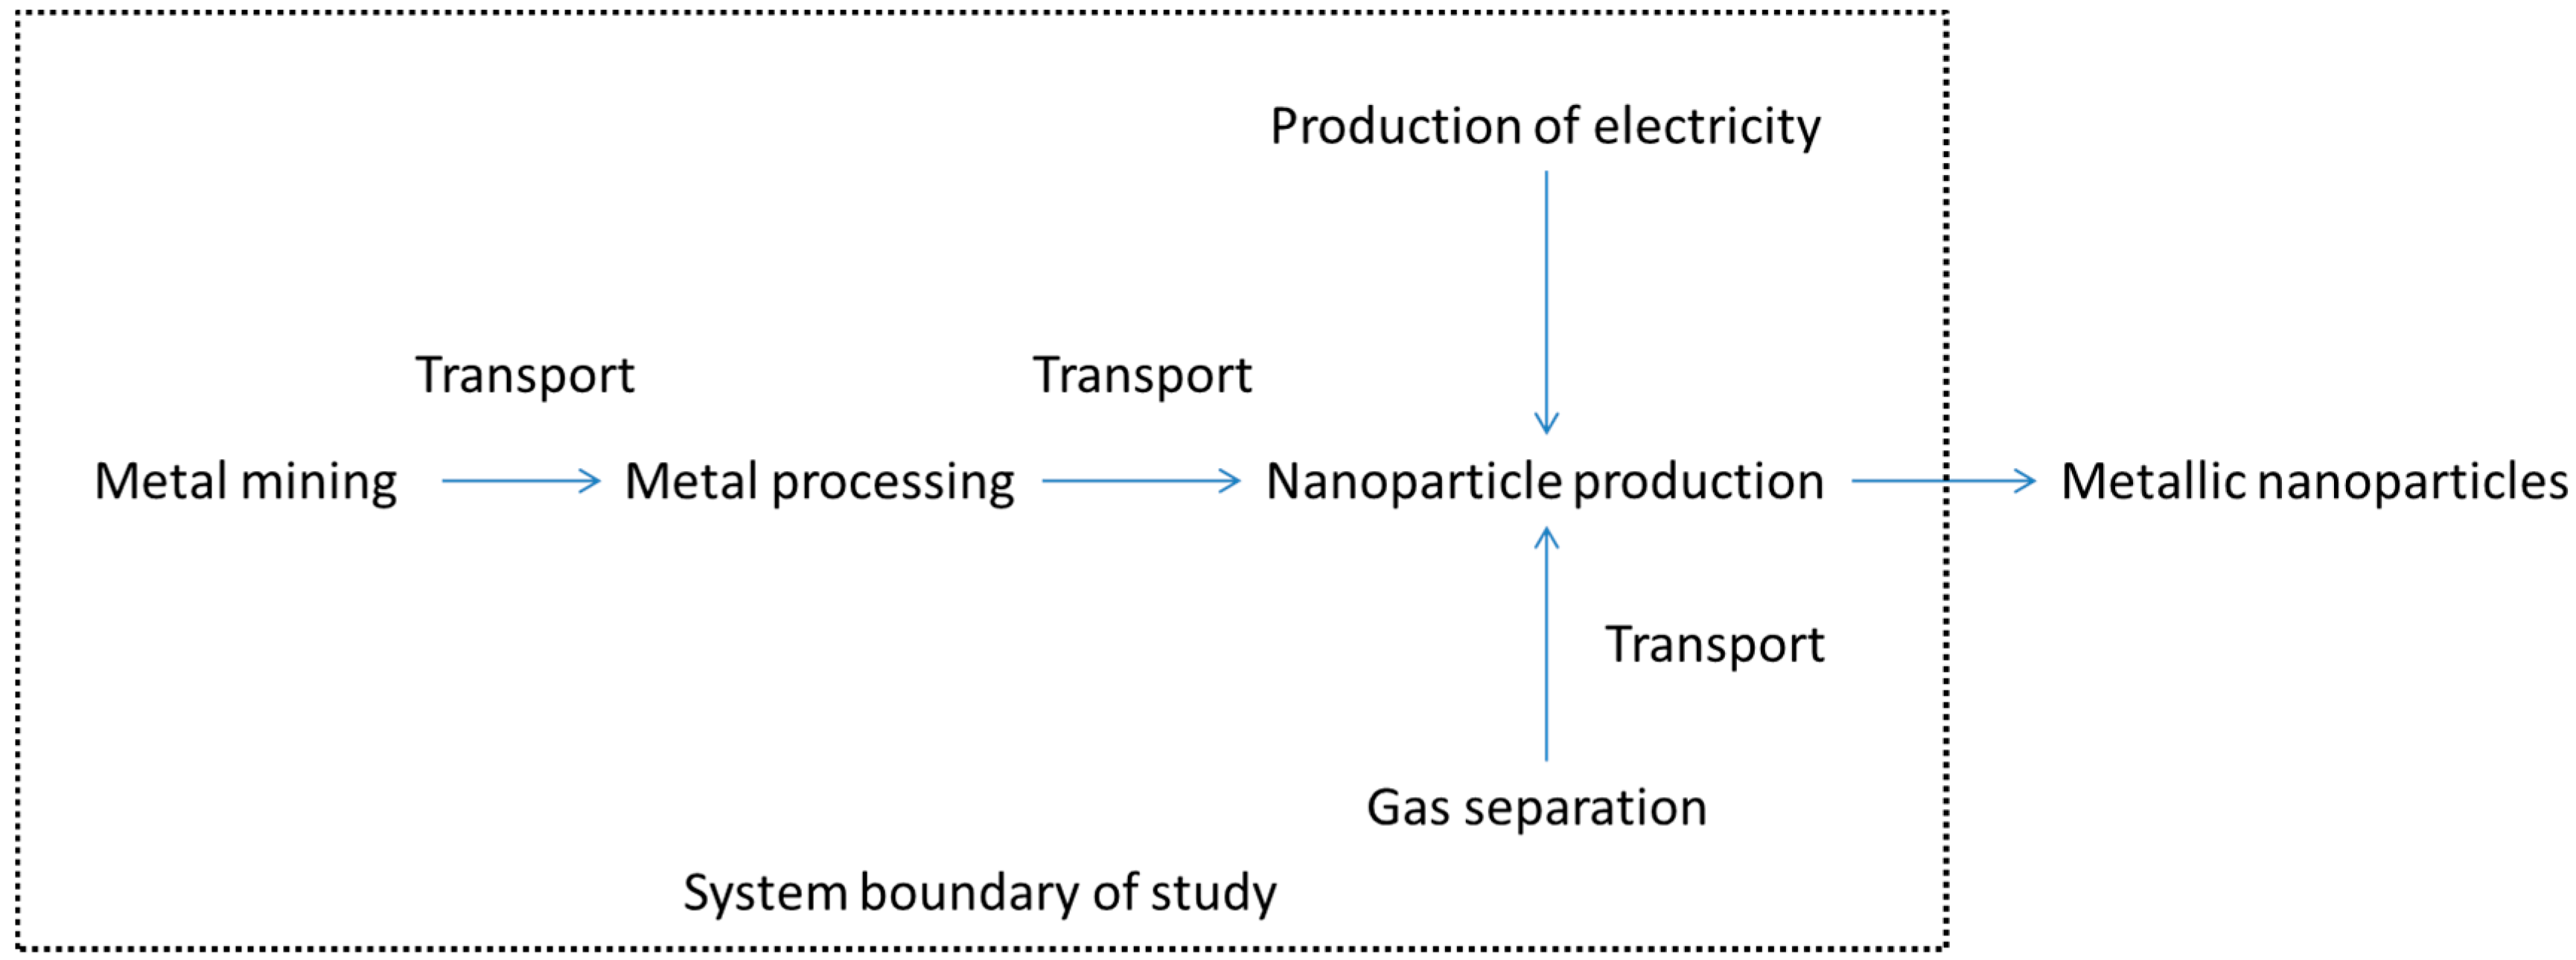
The goal for the LCA study of the electrical arc/spark process is to analyse how the environmental impact of the production of the NPs change as the production unit is scaled up. In order to achieve this, experimental data from tests done at different scales and production rates are compared to each other. The functional unit for the LCA studies was the production of one kilogram NPs and the LCA study was done as a cradle to gate study. Mass of NP produced was chosen over surface area as the goal of the BUONAPART-E project was to scale-up to a certain mass production rate. In the study the mining and refining of metals used for NP production, production of carrier gas and electricity used in the process and the shipping of the metals and gases were included. Product use and end-of-life product handling are not considered as no data is available on the environmental impact for these life-cycle-stages. The system boundary for the studies can be seen in Figure 3. Some detail on the database information used is listed in Appendix A.
Generation of electricity, based on the low voltage grid-mix for Germany, Spain and The Netherlands for the copper, silver and zinc NPs, respectively, used to evaporate the metals in the NP production process was also taken into account. The environmental impact caused by production process infrastructure, however, was considered to be outside the scope of the current study. The life cycle impact of producing pure metal NPs using the arc and spark methods and comparing the life cycle impact with (wet) chemical or other more conventional methods of producing similar NPs was published earlier by Slotte et al. [27].
3. Nanoparticle Production Results
Even though the production of six pure metals and two alloys were studied in the project not all of them were studied by all project partners or with more than one or two production setups.
Most of the experiments with the various NP production setups were done with silver, copper and zinc electrodes. Due to the smaller amount of data for the other three metals and the alloys the comparison of the production setups focused on the results obtained with silver, copper and zinc NPs. Production data collected from four project partners for these three metals is listed in Table 1.
As can be seen in Table 1 most of the spark discharge experiments were carried out in argon while most of the arc discharge experiments were done in nitrogen. Argon was chosen as the carrier gas for some experiments as it facilitated the production of smaller NPs but against a higher energy cost. (Although not discussed in detail here, NP of Al, for example, cannot be produced in nitrogen, since it would give nitrides).
Focusing on scale-up, the tests results obtained for OSU and mOSU production of Ag, Cu and Zn NP are summarised in Table 2, for arc discharges in N2, as obtained at UDE. Recent reporting by Stein and Kruis [13] on producing Cu NP using 15 of the 16 units of the UDE 2 × 8 mOSU gave specific electricity consumption (SEC) values that are in the same range as the variation between different single OSU experiments. For Ag and Zn an estimate is given assuming similar scale-up performance as Cu. The somewhat different SEC for copper NP for OSU vs. mOSU can be the result of the different product particle size. Zn NP can be produced at a much lower SEC (and with higher efficiency), but particle size is much above 100 nm. (As mentioned, finer particles, although with a lower production rate, can be produced when using Ar as the carrier gas).
The results obtained with Cu NP the scale-up show no significant effect on the SEC for powering the arc. More general problems/challenges seem to be (1) how to get a high metal-to-NP production/collection efficiency; and (2) how to guarantee a high production rate while producing small particles, <100 nm with N2 as the carrier gas.
As can be seen in Table 2 the arc OSUs and mOSUs are optimized for producing more mass of NPs at the cost of a larger primary NP size. The spark OSUs and mOSUs are on the other hand optimized for producing small NP but with a significantly lower production rate than the arc setups. The primary particle size of the product NPs from spark experiments are around 5 nm in diameter. This is probably the result of the lower energies per spark and subsequently less metal vapour in the carrier gas, leading to fewer nuclei that can agglomerate into larger particles. Evaporation rates are much higher for arc setups leading to significantly higher amounts of metal vapour in the carrier gas may explain the resulting larger primary particles.
NP production data for the other metals studied during the project is summarized in Table 3. As the data for these metals is limited it cannot be further assessed as extensively as the data for Ag, Cu and Zn. Nonetheless, very significant differences in SEC and production yields were found.
4. Discussion
4.1. Energy Use Efficiency
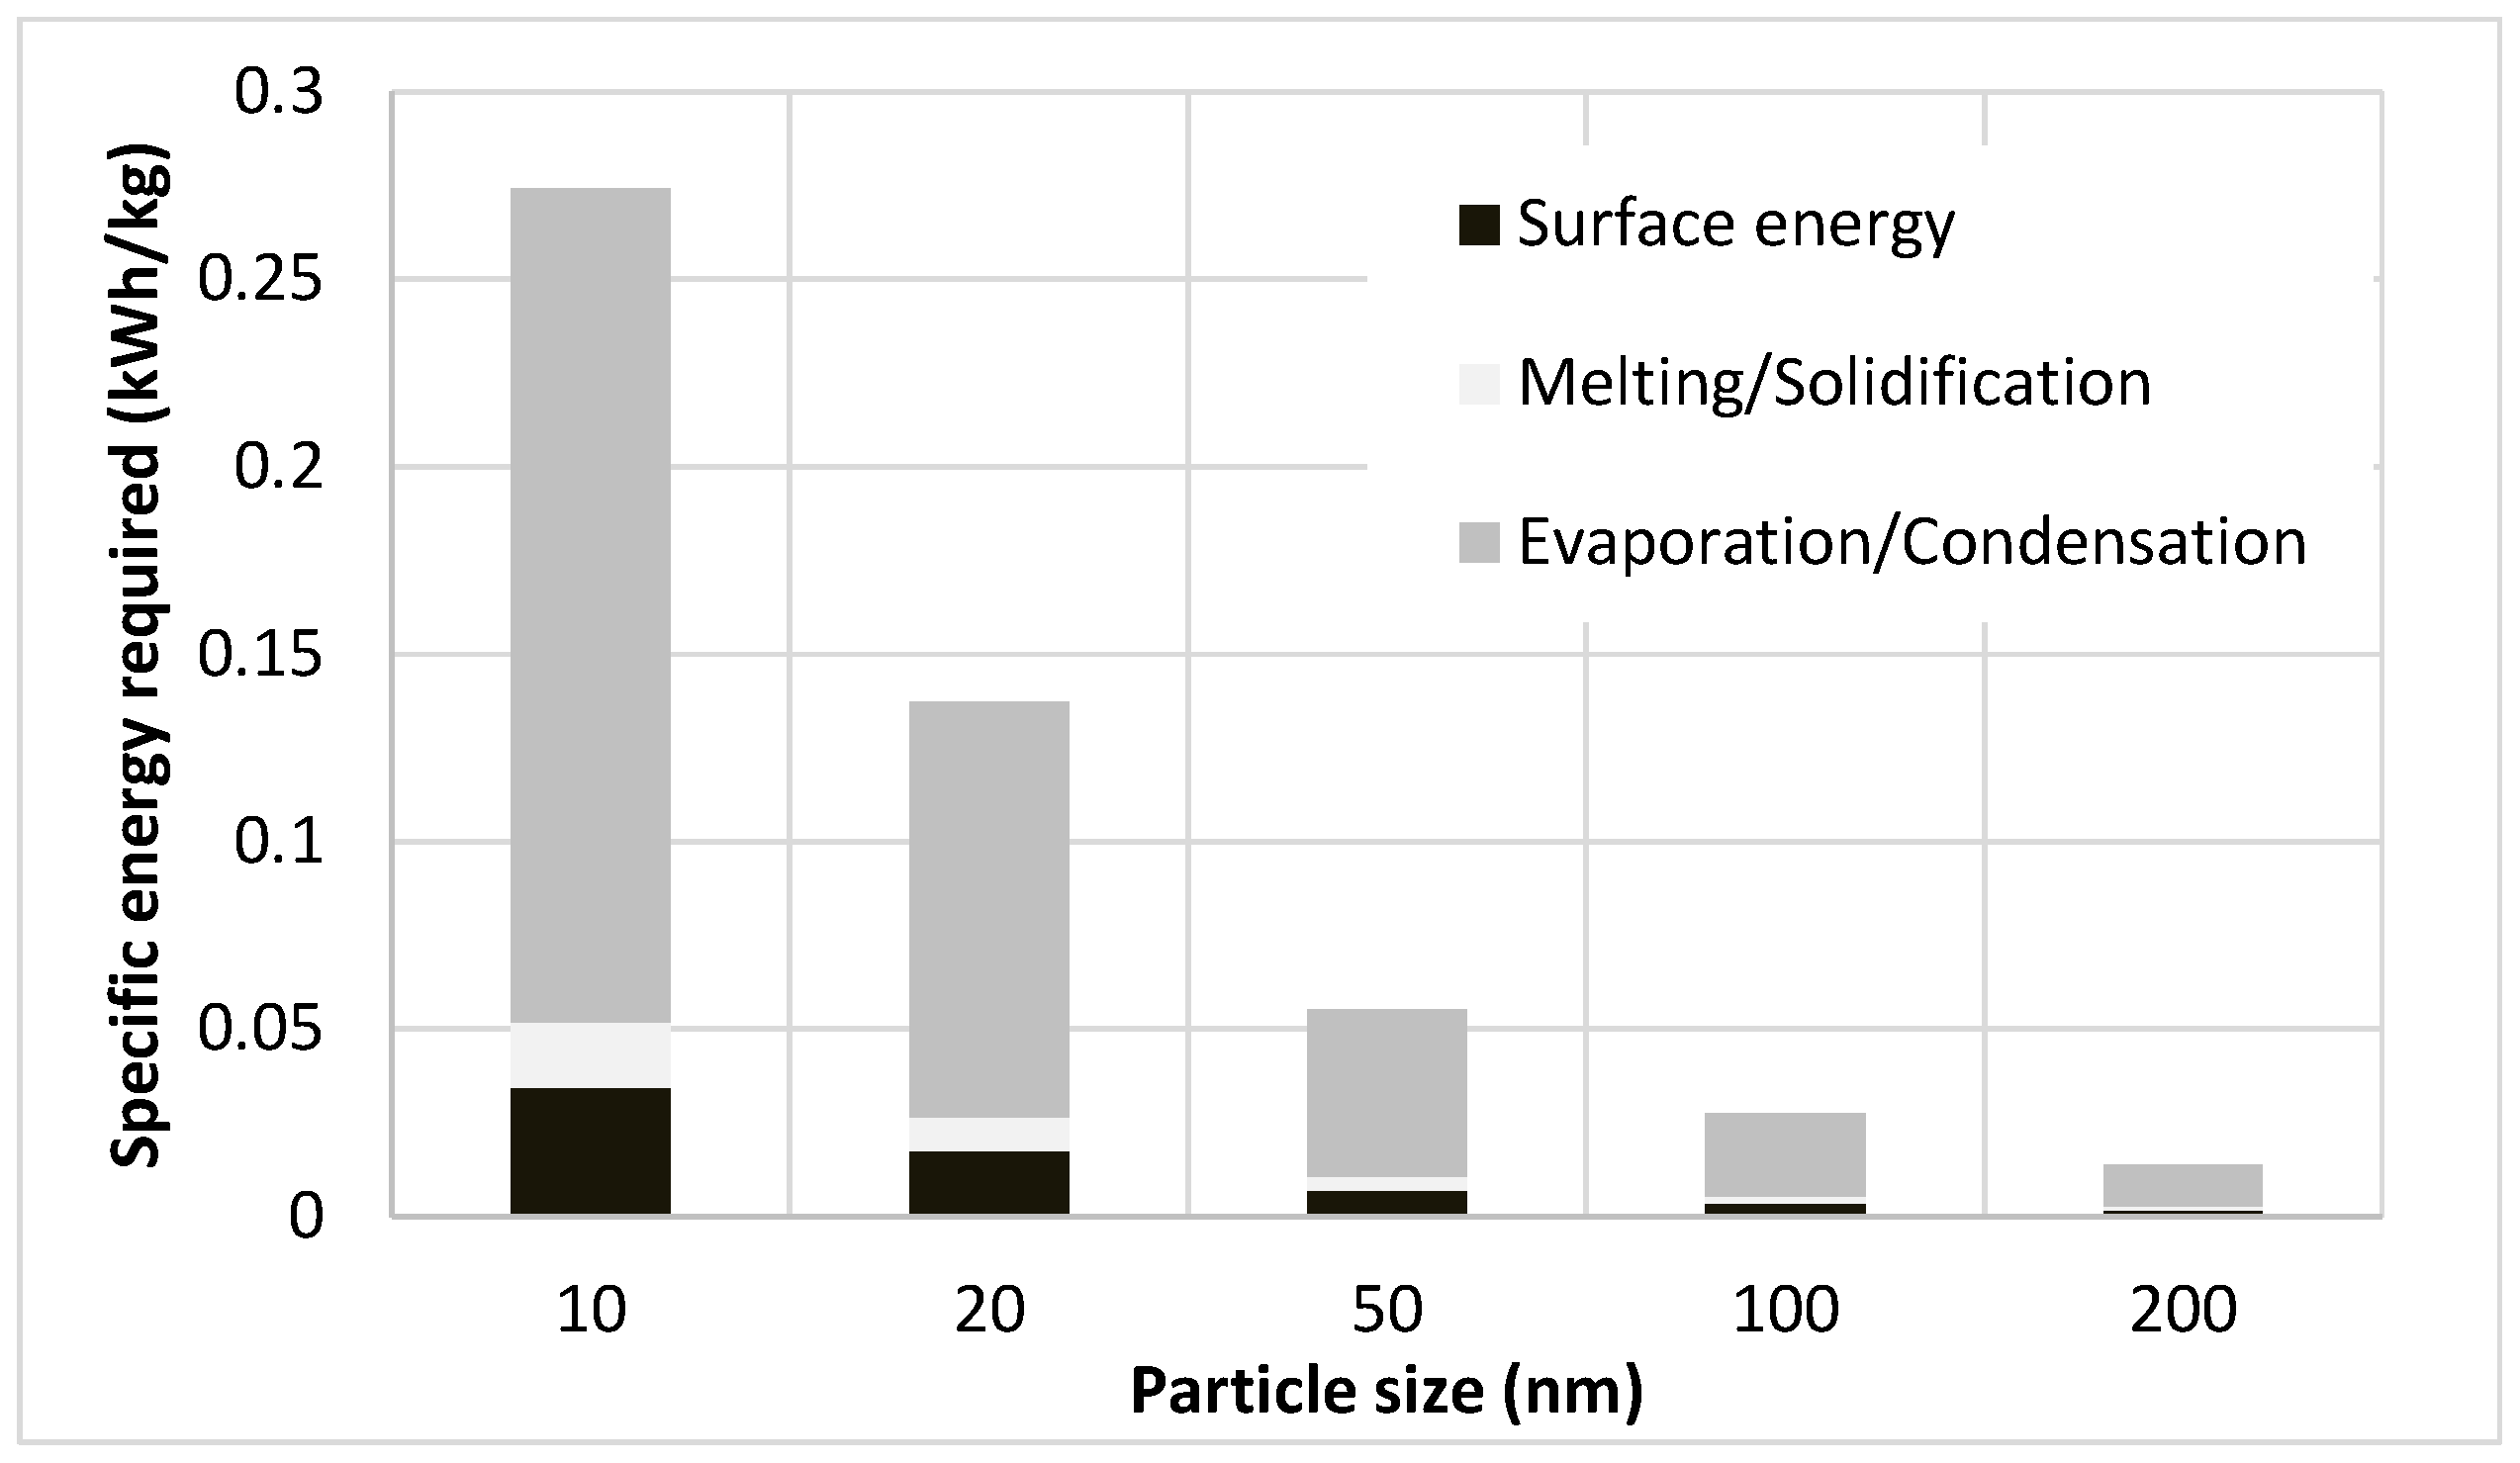
Referring to the exergy analysis given above (Equations (1)–(4)): calculating the electrical energy input requirements for copper NP, for example, (γ (Tmb) = 1.576 J/m2, b = −0.338 mJ/m2·K, d = 0.283 nm, P = 1.497 nm, T° = 298 K) gives the results as given in Figure 4, for five different NP sizes. Thus, the thermal effects give a much larger contribution to the energy input requirements than the actual creation of surface energy. Moreover, the calculated value is several orders of magnitude lower than experimental values: for ~80 nm copper NP [14] recently reported a specific electricity consumption of 179 kWh/kg. A similar difference was found for other metals, motivating the energy use assessment reported here, including the measurements at the mOSU set-up at UDE.
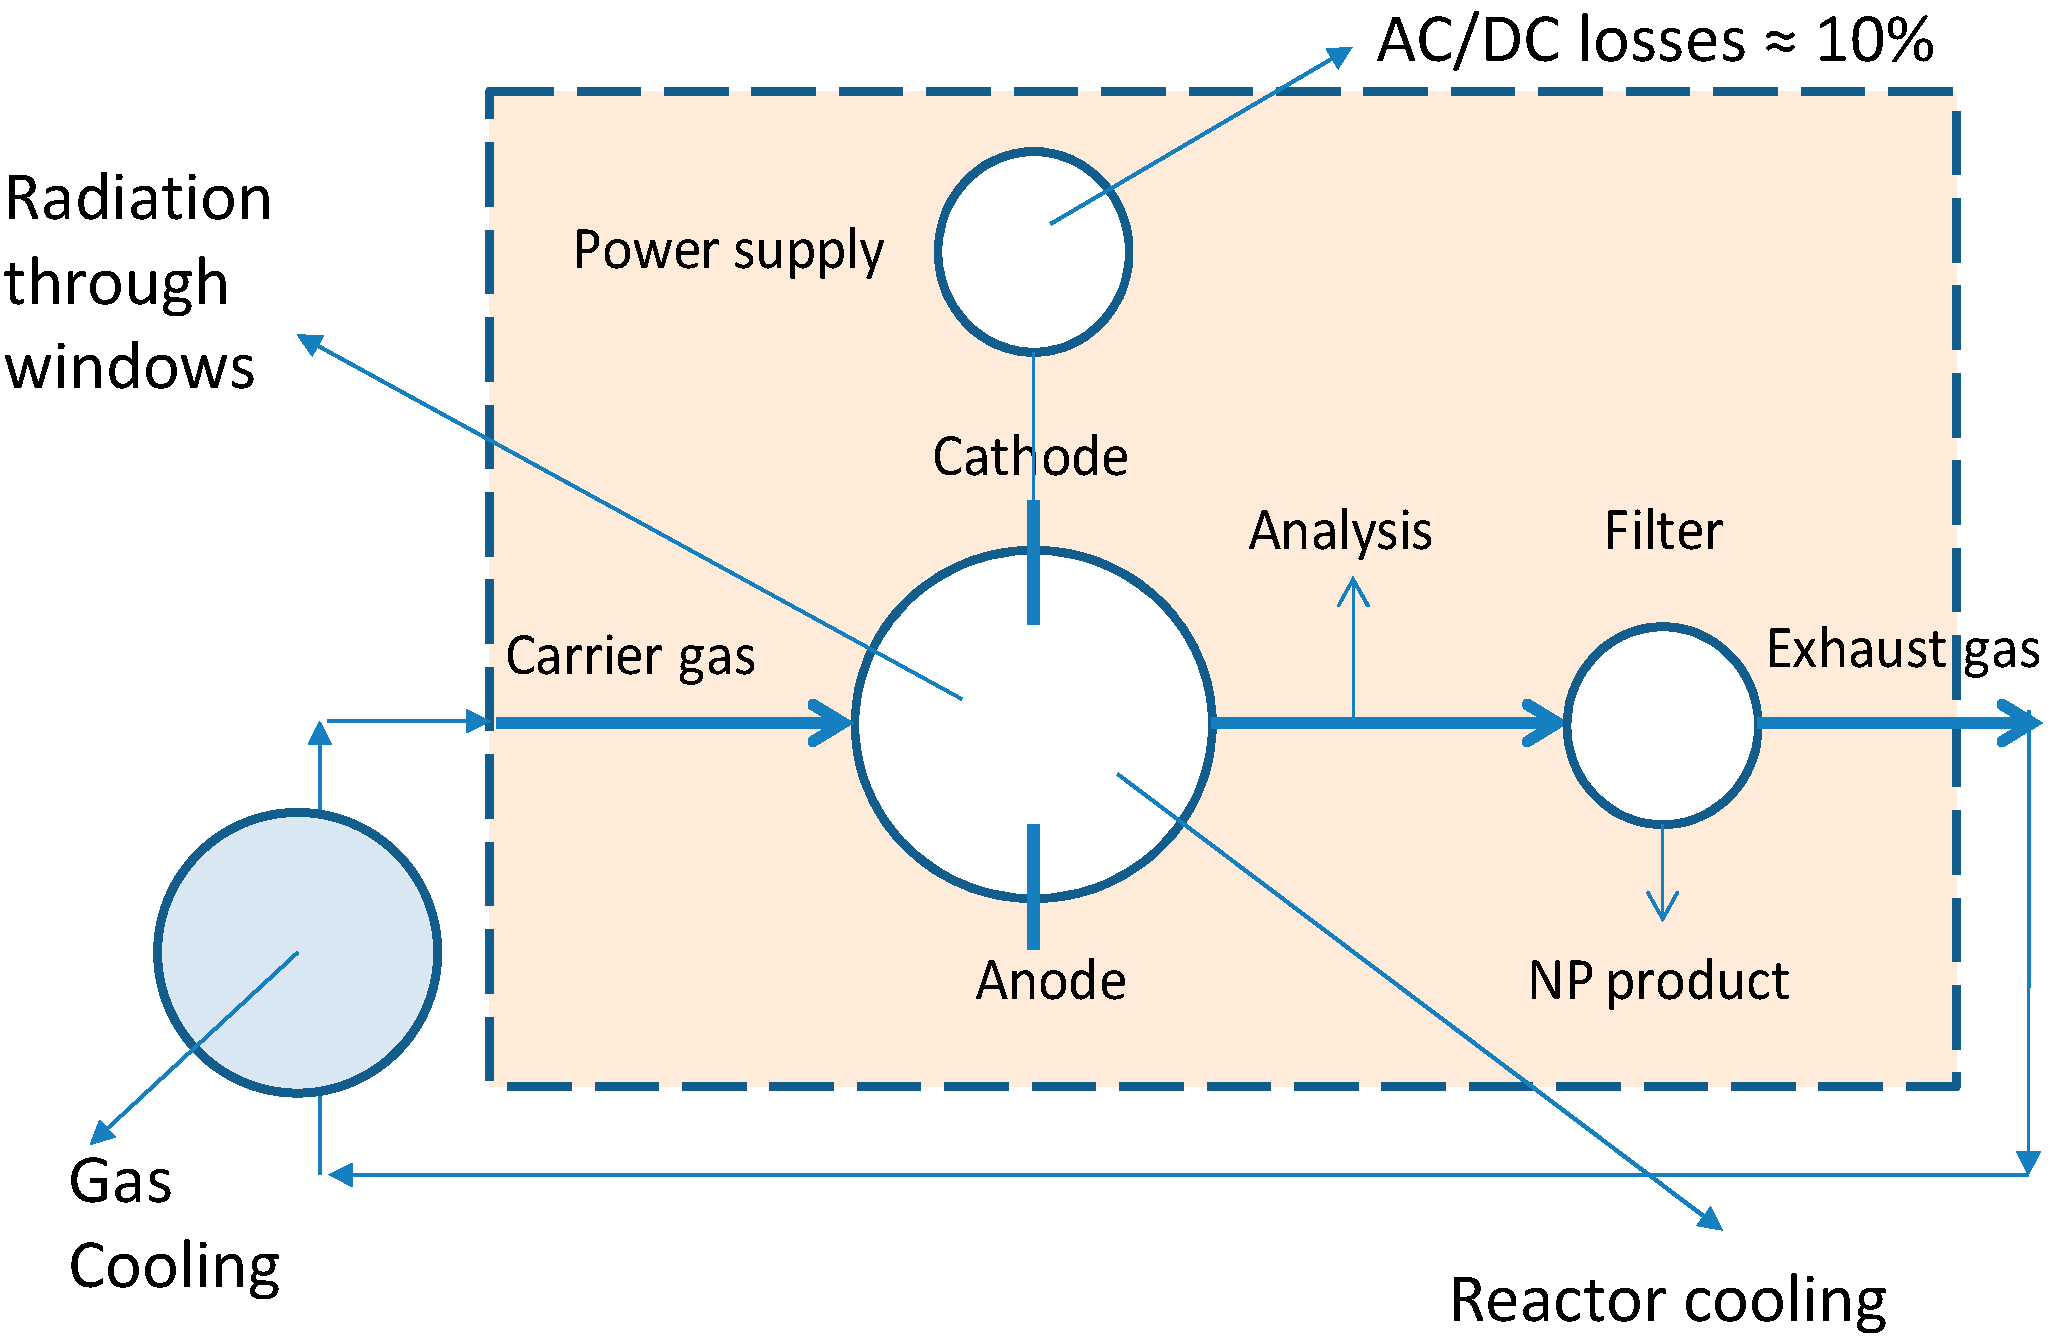
The measured SEC for all of the tests carried out by all project teams are 2–4 orders of magnitude, depending on NP size, larger than what would be expected by the exergy analysis as given above. In order to find out reasons for this, the heat and power loss of the setups was studied. During two test campaigns at the UDE 2 × 8 mOSU facility measurements of temperatures and electrical input were made. The goal was to determine how the electrical energy input eventually leaves the system as, for example, cooling heat. The layout of the process from the viewpoint of these assessments is given in Figure 5.
During the first test, while producing Cu NP (at ~4.6 g/h) using one mOSU consisting of eight OSU, temperatures were measured using an infrared (IR) camera (Ti9, Fluke, Everett, WA, USA) and an infrared thermometer (Quicktemp 860-T2, Testo, Lenzkirch, Germany), respectively. The flow and temperatures of in- and outgoing cooling water was recorded during roughly 2 h using a flow and temperature instrument on the cooling water hose, until a steady state appeared to have been reached. M. Stein at UDE (personal communication) suggested that a thermal steady state (constant temperature) is for most of the stainless steel components reached after 45–90 min.
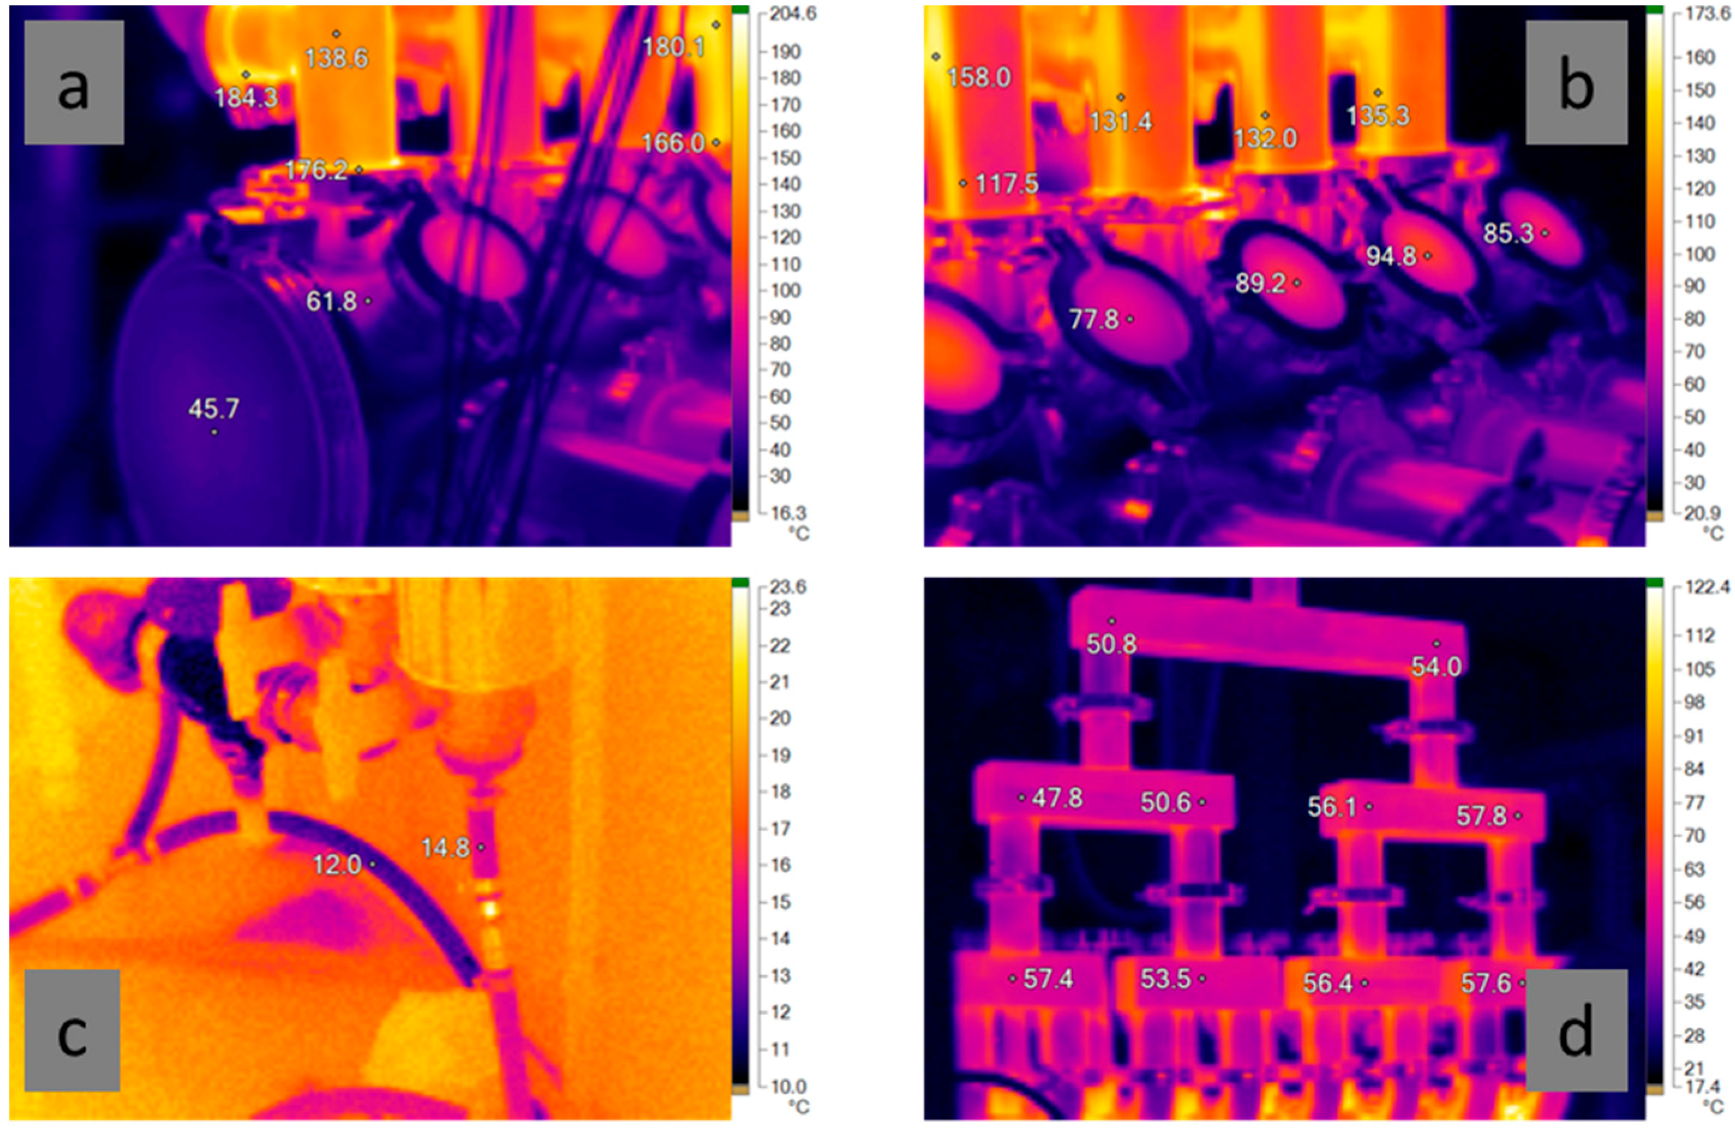
Figure 6 shows a few examples of IR temperature recordings made during the mOSU tests. As seen in Figure 6a,b the reactor housing is significantly cooler, thanks to the water cooling, than the uncooled reactor outlets. The reactor housing is between 40–70 °C and the viewing windows at 75–95 °C while the outlets are well over 100 °C, in some places closer to 200 °C. As shown in Figure 6c the temperature rise of the cooling water was only a few degrees. After leaving the reactor housing the gas rapidly cools to around 55 °C in the gas collection tubing as seen in Figure 6d.
For the electric input of 1810 W per arc unit, giving a combined electric input of 14,480 W for the mOSU, 10% will be dissipated as AC/DC transformer losses while 17–34% (300–600 W per OSU) was taken out of the system by the cooling water. Convective + radiative losses were estimated at 22 + 2%, respectively, based on measurements of temperatures and ventilation air flows in the laboratory combined with system size data and literature expressions for calculating heat transfer rates (e.g., [28]). This gives an overall energy balance closure of 55–70%, noting that the system did probably not reach a thermal steady state while many (metal) parts were still heating up. Unfortunately, no information could be obtained for the recycled gas cooling water unit. Also the gas (at ~70 L/min per OSU) from the mOSU half consisting of eight OSUs in operation was mixed (and cooled) downstream of the production chamber with gas flowing through the other mOSU (8 OSUs) that were not in use. The gas flowing through the unused mOSU is cooler as no arc discharge is taking place that would introduce energy into the chambers.
Therefore, a second test was made, operating 6 + 4 OSU of the 2 × 8 mOSU unit again producing Cu NP. The total gas flow was 1600–1700 L/min (~100 L/min per OSU). According to the cooling water temperatures, ~255 W per OSU cooling corresponds to 14% of the arc power supply energy use, significantly lower than the first test. Unfortunately, the power consumption of the gas circulation pump could not be determined. Nonetheless, it was confirmed that most (more than 99%) input energy (electricity) used leaves the system as heat via various cooling systems. After all, there was no mass leaving the system and only a fraction of the input energy was used to produce the NP surface area, as discussed above.
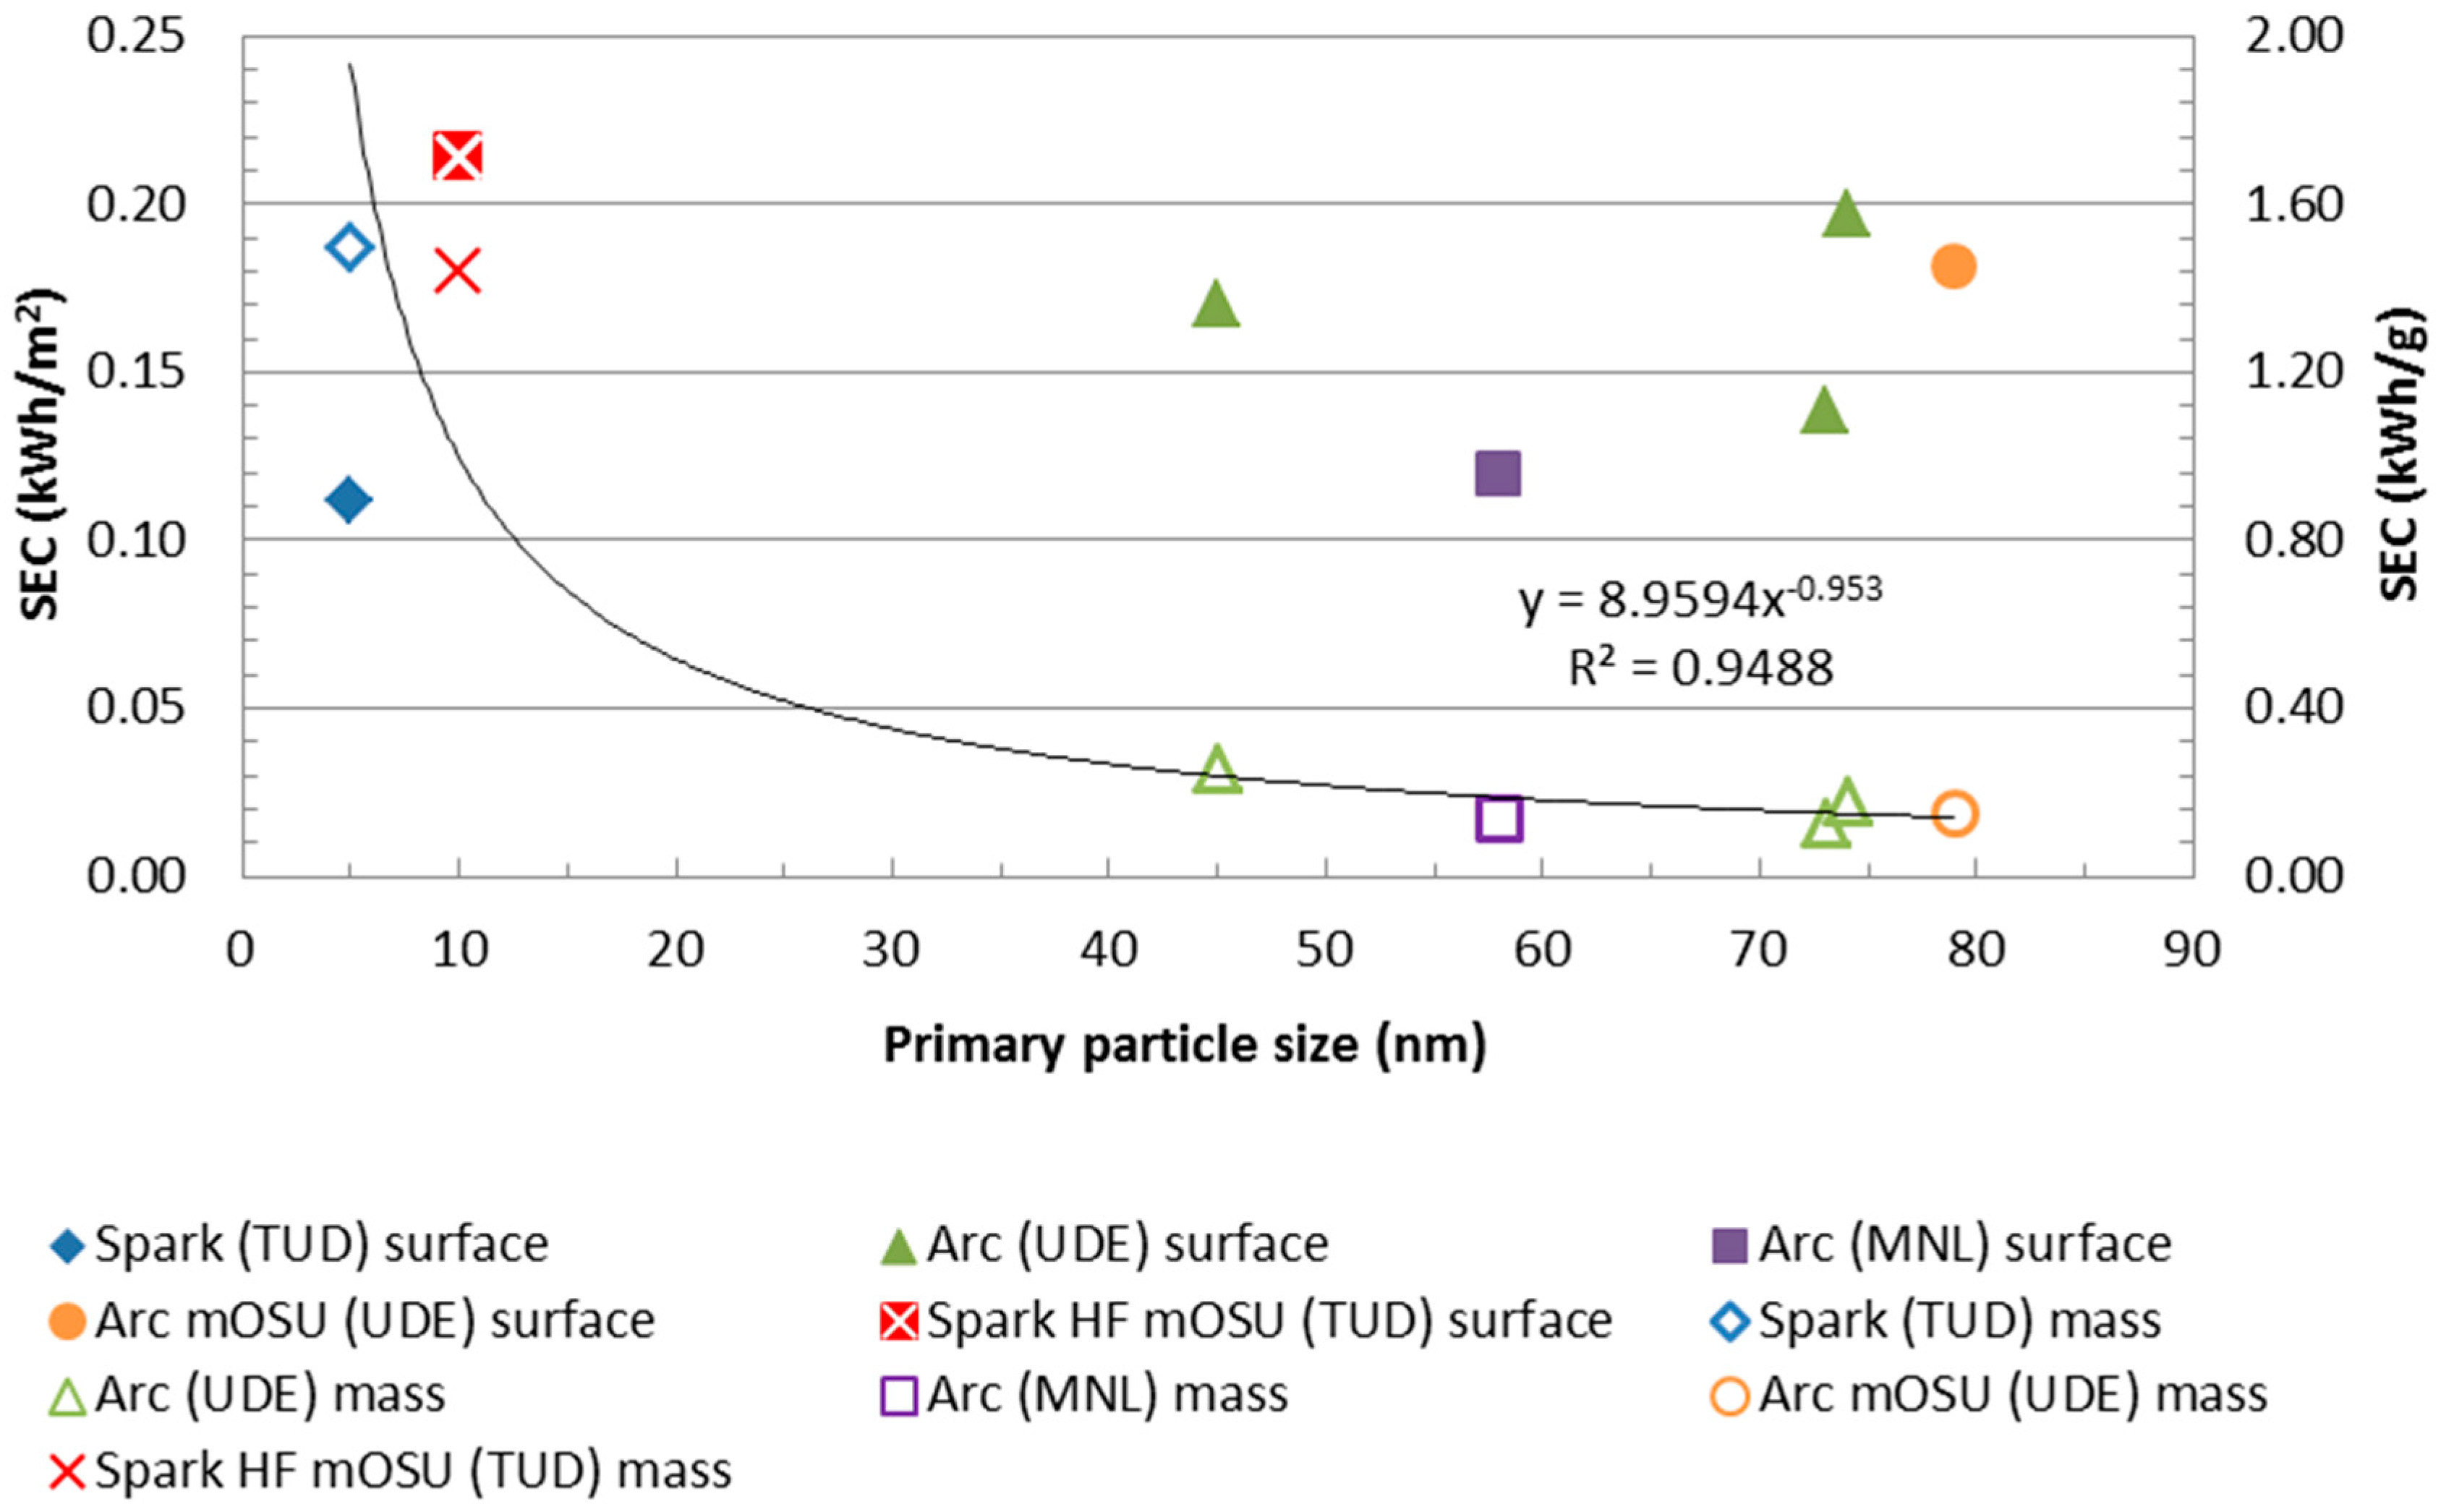
Previously the power consumption of the electrical discharge evaporation and condensation process for producing the NPs was evaluated based on the SEC per NP mass. Another way to compare the power demand for the process is to compare the electricity use per generated primary particle surface area.
The SEC per surface area appears to be hardly a function of primary particle size. As can be seen in Figure 7 the SEC per NP mass is similar for particles the size of 45 to 80 nm while the SEC for the 5 nm particles was significantly higher: this can be explained using the exergy analysis as decribed in Section 2.1. There seems to be a clear correlation in the SEC needed to produce one gram of NP as can be seen by the trend line in the figure. The regression coefficient, R2, for the correlation is good being 0.95 for a power law correlation (less good correlations were obtained with other few-parameter expressions). For the SEC per produced NP surface area no good correlation could be found, the closest fit giving an R2 of only 0.02.
4.2. LCA and Production Scale-Up
Experimental data from a series of tests performed using the mOSU setup (2 × 8 OSUs) at UDE was analysed and used to calculate the environmental impact for the particles as a function of the number of OSUs used. The input and outputs of the study can be seen in Table 4 and are based on Table 2. For all cases the feedstock is copper and the carrier gas is nitrogen. Production and transportation of the metal and gas are included and taken into consideration as discussed in Section 2.3. The table only shows the input and outputs for four out of fifteen points used in the LCA. Values for the remaining points are in-between values given. The electricity used in the study is according to the EU-27 consumer grid mix, under 1 kV.
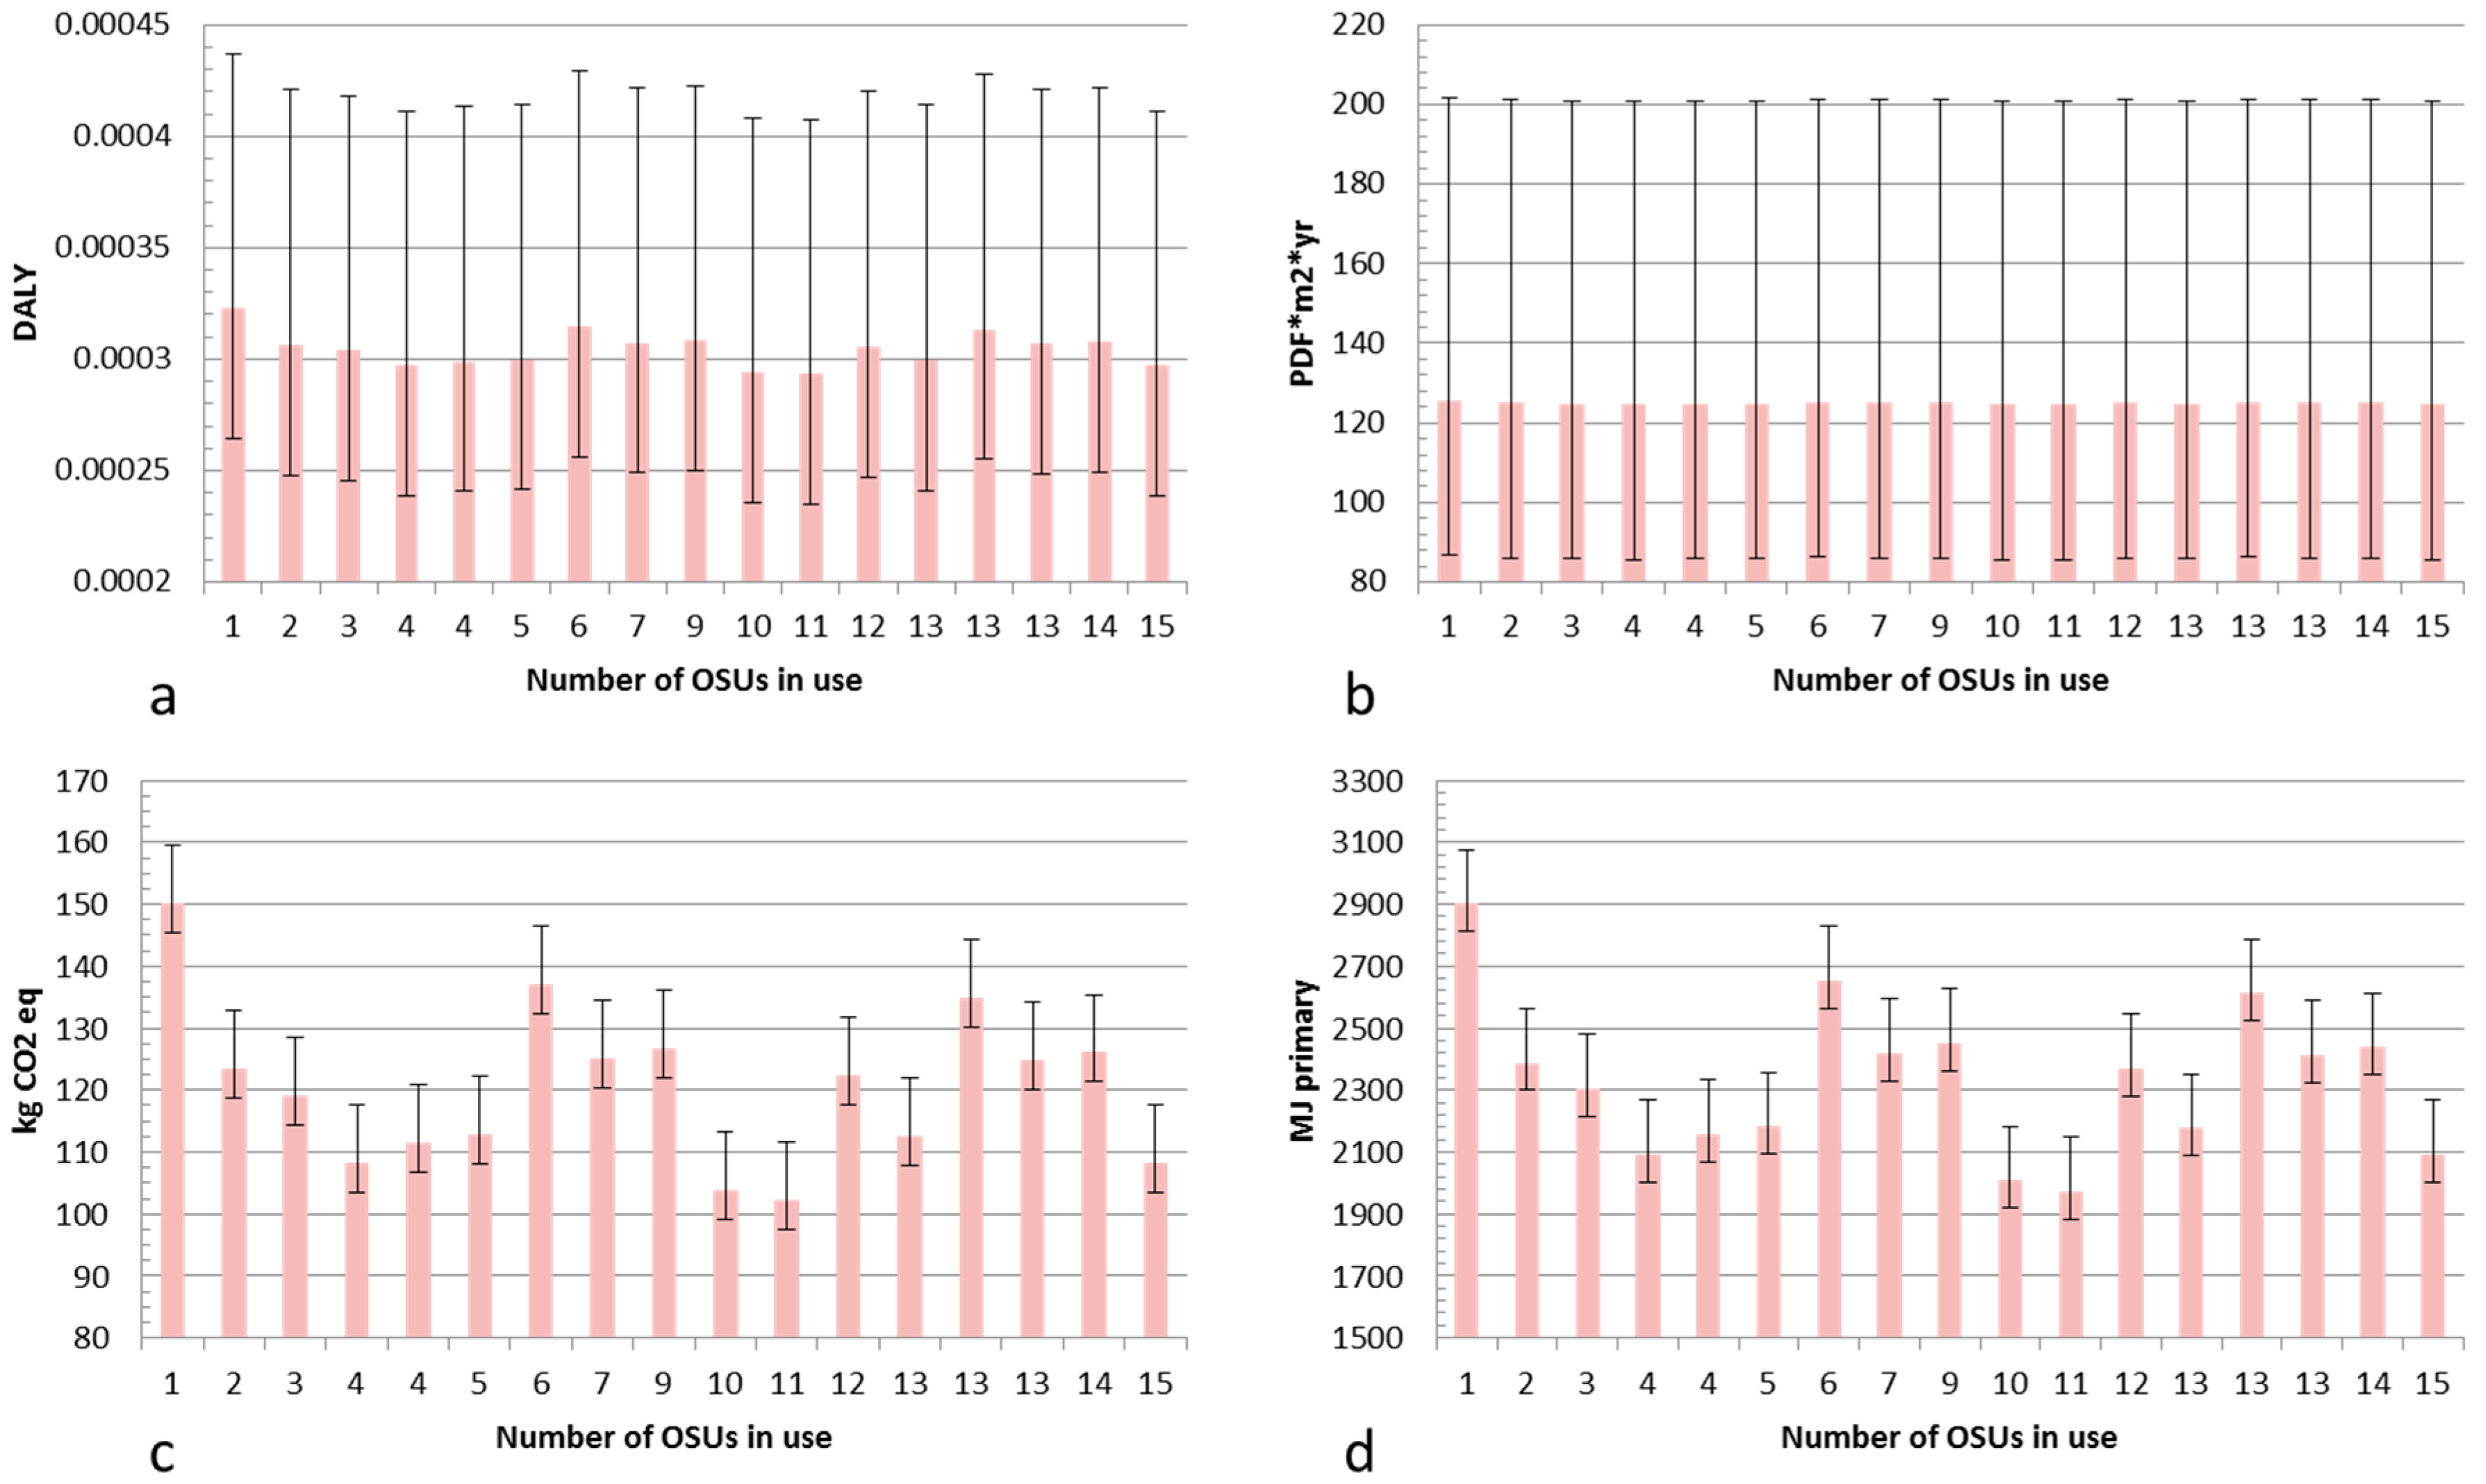
The LCA results for Cu NPs produced using an mOSU with arc discharge evaporation are shown in Figure 8. The results are given for a material yield (production efficiency) of 25% while the “error bars” show the impact for particles produced with an NP material yield ranging from 17% (bar upwards error) to 32% (bar downwards). These material yields were chosen as they show attainable yields for a mOSU based on experimental data (17% and 25%) and a good yield for a single OSU setup (32%). Most of the experiments carried out gave product yields close to 25% with significantly higher or lower yields were achieved in only a few cases. Therefore, the bars in Figure 8 are given for a yield of 25%.
As can be seen in Figure 8a–d the environmental impact is not dependent on the number of OSUs in use but rather on other factors. The lowest impact was from NPs produced using 11 OSUs as in that test the SEC was the lowest at 143 kWh/kg NP while it was the highest with only one OSU with an SEC of 208 kWh/kg NP. The variation in material yield has a significant impact on the life cycle impact for the particles in both the Human Health and Ecosystem Quality categories while the impact is smaller in the Global Warming and Resource Depletion categories. Apparently, the additional tubing in the mOSU setup give rise to material losses that result in a higher life cycle impact compared to an OSU. This can be seen in Table 1 when comparing the collection efficiency of the OSU and mOSU.
Table 5 shows the environmental impact of the three main contributors, i.e., the carrier gas, the copper metal and the electricity used in the process. As seen, the copper metal contributes most in the Human health and Ecosystem quality categories while the electricity dominates the environmental impact in the Climate change and Resource depletion categories.
When it comes to the scale-up by parallelization from OSU to mOSU: as mentioned above there is no significant difference between the SEC for Cu NP production. Assuming that this holds likewise for the other metals it makes the LCA study outcome fully dependent on the metal-to-NP production efficiency. The feeding rate of Cu to the mOSU, equal to the evaporation rate can be estimated (based on the outcome of experimental work) to be equal to 4× the above-mentioned production of 4.17 g/h per OSU, hence, about 16 g/h per OSU. No Ag or Zn NPs were produced with UDE’s 2 × 8 mOSU and therefore a similar evaluation cannot be given for Ag and Zn as for Cu.
The life cycle impact for Cu NPs produced in arc OSU and mOSUs as well as in a spark OSU could be calculated and compared. In both arc setups nitrogen was used as carrier gas while argon gas was used in the spark setup. The spark setup with argon can be compared with the arc setups in order to see how the carrier gas and discharge modes affect the environmental impact of the NP production processes. The inputs and outputs of the study are given in Table 6. For the data marked mOSU and UDE EU-27 consumer grid mix was assumed for the electricity while Dutch consumer grid mix electricity was assumed for the TUD tests.
Figure 9 shows the life cycle impact for one experiment with a mOSU using 15 OSUs, three experiments with arc OSUs and one experiment with a spark OSU. The arc OSU and mOSU experiments were carried out by UDE while the spark OSU experiment was done at TUD. As can be seen the life cycle impact in the Human Health category is similar for all five experiments. In the Ecosystem Quality category the impact of the NPs produced with the spark method is smaller than for the arc methods. In both the Climate Change and Resource Depletion categories the life cycle impact of the spark process is significantly larger as a result of the much higher SEC for producing NP in argon, giving smaller NP than in nitrogen. The impact of carrier gas production itself is clearly visible for argon but not for for nitrogen but this does not give a significantly different overall result. A higher product yield for the TUD spark process compared to the UDE arcs explains the smaller environmental footprint for producing the input copper material for the spark unit.
Scale-up from OSU to mOSU showed no significant differences in SEC, as was shown in Table 1, apparently reducing scale-up to a linear addition, which implies “adding up” OSUs or mOSUs until the required production rate is obtained [4]. While the SEC of the power supplies for each arc is independent of scale for the design of the system, it is very important for the metal-to-NP production efficiency and electricity use for gas circulation. For all three metals Ag, Cu and Zn much can be gained if electricity consumption (i.e., cooling needs) can be reduced. For silver, however, it may be challenging to be competitive with conventional (wet chemistry) NP production, due to the high SEC for producing Ag NP with the arc or spark process. Nonetheless, the use of an arc or spark discharge system offers the opportunity of substituting for the use complex chemicals in wet routes, as we analysed and reported earlier [27].
The life cycle impact contributions for NP metal production using an arc discharge depends on SEC and consumption of carrier gas (in this study a 99.5% recycling efficiency is assumed), besides the life cycle impact for producing the input metal which is independent of the scale of NP production. The other contribution to life cycle impact is the type of carrier gas used which will affect NP particle size and production rate: for nitrogen the life cycle impact contribution will be of the order of a few % whilst for argon that could increase to 20% for Cu NP (based on experience at project partner MNL).
4.3. Commercial Product Application of Metallic NPs
An important part of the BUONAPART-E project was to find and study applications for the produced NPs. Three such applications were studied in greater detail: silver NPs in textiles for anti-bacterial properties, copper NPs as nanofluid dispersion in water for iron- and steelmaking cooling application and zinc NPs mixed into poly propylene (PP) plastic as to enhance flame retarding properties, respectively. The life cycle impact of these product applications has recently been presented in detail elsewhere by Slotte and Zevenhoven [29].
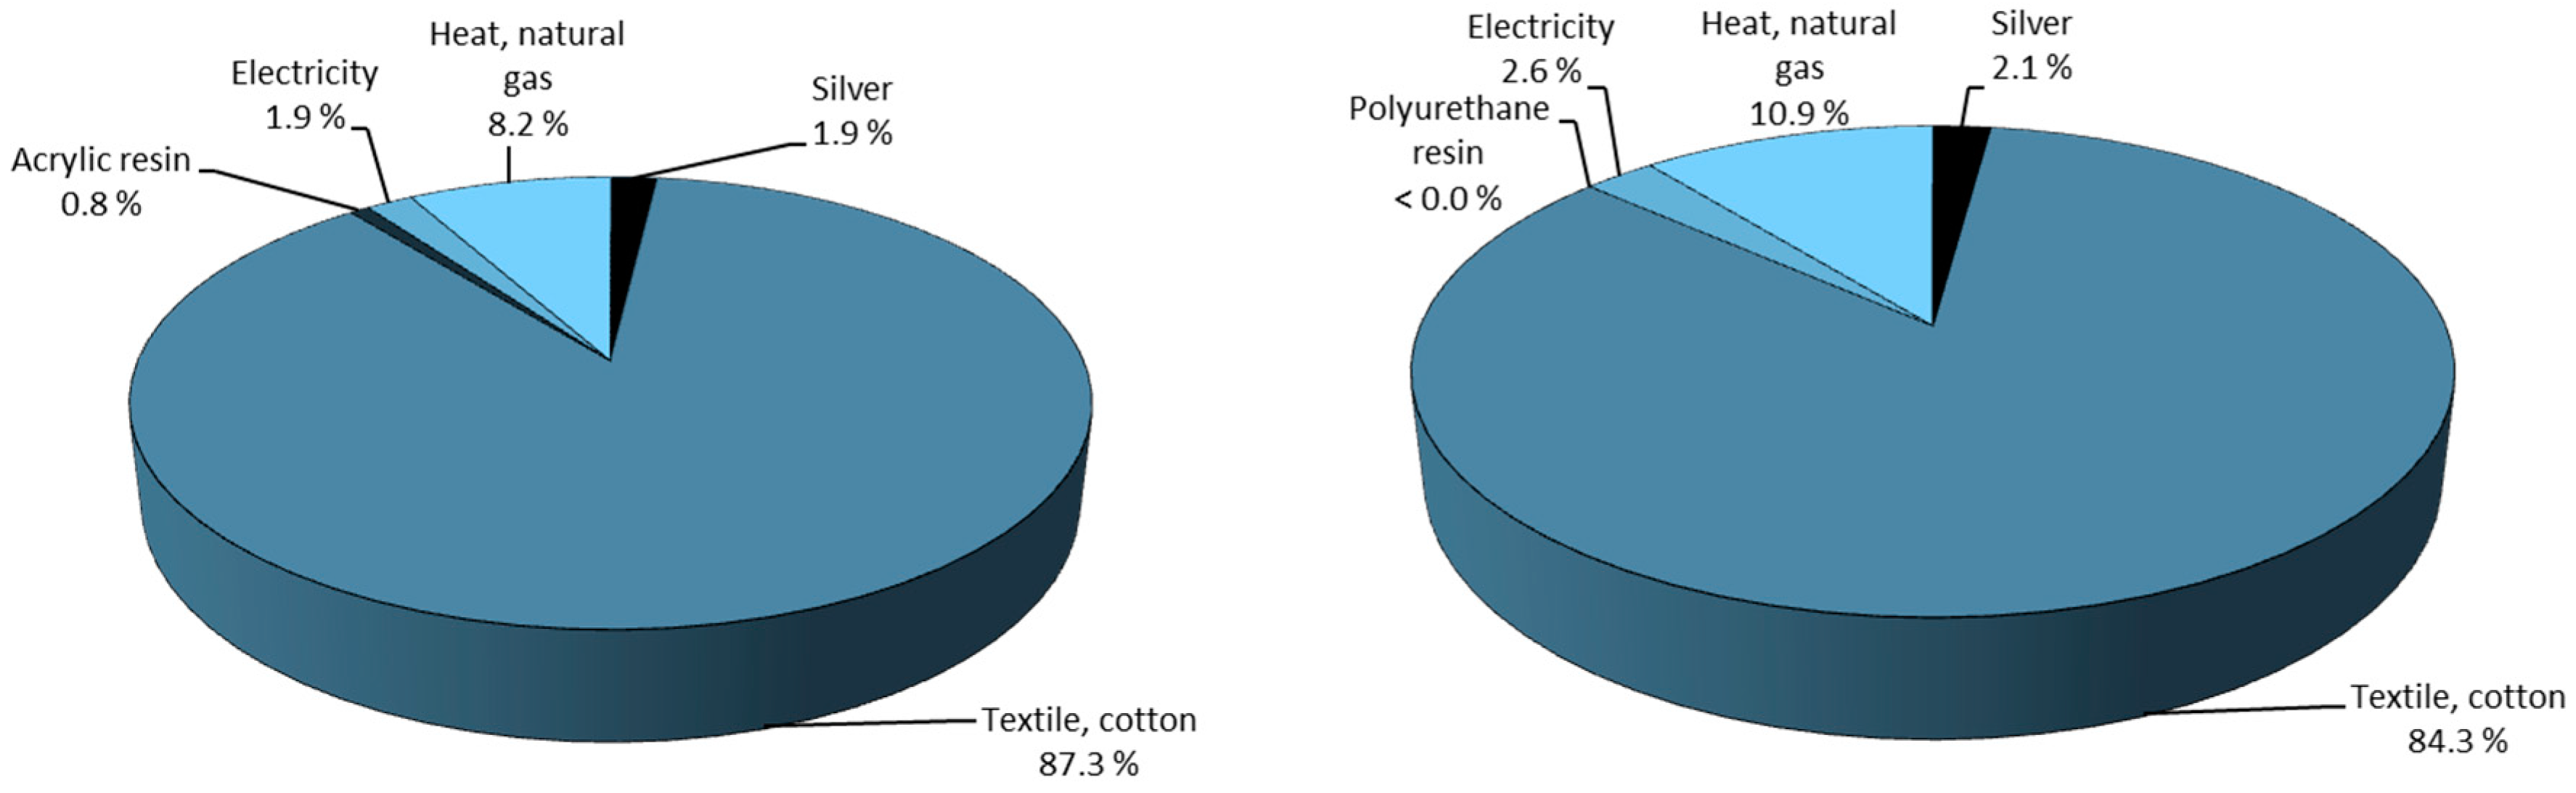
To illustrate this, the life cycle impact breakdown for the production of silver nano-coated cotton textile for medical applications using acrylic or polyurethane resin is given in Figure 10. As shown, the majority of the environmental impact comes from the production of cotton textile while the production of the silver NPs only makes up for 2%. Slotte and Zevenhoven concluded that the CO2 equivalent emissions for both the arc process are comparable to those presented by Walser et al. [30] for T-shirts treated with silver NPs.
Treating one T-shirt required 0.021 g nano-Ag and gave a global warming impact of 0.20 kg CO2 equivalents. Production of the Ag NP-containing resin containing the same amount of Ag NP produced by the arc process released 0.0000577 kg CO2 equivalents. The impact of producing the resin coating for the cotton textile has a significantly lower impact compared to the T-shirt coatings. It shows that when considering the contribution to global warming the impact of the production method for the Ag NP and the paste used to bind the NP to the textile, the electrical discharge method has a lower impact than the method described by Walser et al. Regardless of this it is important to point out that the environmental impact of Ag NP treated textiles primarily depends on the Ag loading of the textile as shown by Hicks et al. [31] and Hicks and Theis [32].
5. Conclusions
An improved metallic NP production method was studied by several partners within the recent EU FP7 BUONAPART-E project. The studied process was first optimized on a laboratory scale and later scaled up to a pilot scale aiming at producing several kg/day NP. The scale up of the process was done by parallelization of multiple OSU units into one larger facility. A significant amount of data was collected during the experiments done with both arc and spark setups in both lab and pilot scales. The collected data suggests that scaling up the NP production by parallelization of OSUs is a valid approach as the specific electricity consumption (SEC) remains similar for a mOSU section compared to an OSU. The goals of this paper were to, based on the collected data: (1) evaluate the environmental impact of the arc and spark processes by comparing the SEC for producing the NPs in two carrier gases, to (2) evaluate the energy efficiency of the process by comparing the measured SEC to the thermodynamic minimum energy required to produce the particles making use of exergy analysis and finally (3) to assess the life cycle impact for the three metals with the most extensive data available and for three applications containing these NPs.
Exergy analysis of the NP production system together with the energy use evaluation showed that almost all of the power fed to the OSU/mOSU leaves the system as cooling heat instead of creating particle surface energy. Due to this the energy requirement of the process is several orders of magnitude higher than that suggested by the thermodynamic minimum energy: the measured SEC for the production of ~80 nm copper NP, for example, was around 180 kWh/kg while the thermodynamic minimum is 0.03 kWh/kg. There seems to be a clear correlation for the SEC needed to produce one gram of NP as a function of primary particle size, unlike the production of primary particle surface area. The material yield varies from setup to setup: small setups with short tubing give the highest yields while the larger setups with more tubing give lower yields. The variation in material yield has a significant impact on the life cycle impact for the produced NP in both the Human Health and Ecosystem Quality categories while the impact is smaller in the Global Warming and Resource Depletion categories. Apparently, the additional tubing in the mOSU setup causes material losses resulting in a higher life cycle impact compared to an OSU. By minimizing the tubing and improve the collection rate of produced NP the energy efficiency and the life cycle impact of the process can be improved greatly as the LCA study outcome is fully dependent on the metal-to-NP efficiency.
Acknowledgments
The authors want to acknowledge the support from the European Union’s Seventh Framework (FP7) program under grant agreement n° 280765 (BUONAPART-E) http://www.buonapart-e.eu/ (2012–2016) and Academy of Finland’s Graduate School of Energy Efficiency and Systems (2012–2015) for the financial support for the research. The authors would also like to thank the project partners for providing the production data and especially UDE for support during energy use and heat measurements at their site.
Author Contributions
Martin Slotte and Ron Zevenhoven developed the approaches to NP production energy use assessment and the cradle-to-gate LCIA, and carried out the energy use and heat measurements at UDE. Martin Slotte carried out and processed the LCIA calculations while Ron Zevenhoven took care of exergy and energy efficiency assessment. Martin Slotte wrote the first draft of this~paper.
Conflicts of Interest
The authors declare no conflict of interest.
Abbreviations
| AEM | Aerosol Electro-Meter (Faraday cup) |
| CNC | Condensation Nucleus Counter |
| DMA | Differential Mobility Analyser |
| ELPI | Electrical Low Pressure Impactor |
| KIT-S | Karlsruhe Institute of Technology, Karlsruhe, Germany |
| LCA | Life cycle assessment |
| LCI | Life cycle impact |
| LCIA | Life cycle impact assessment |
| MNL | Metal Nanopowders Ltd., Birmingham, United Kingdom |
| mOSU | Multiple electrode pair unit(s), pilot scale |
| NP | Nanoparticle |
| OSU | Optimized single electrode pair unit(s), lab scale |
| prOSU | Production unit, full scale |
| PTFE | Polytetrafluoroethylene (Teflon) |
| SEC | Specific electricity consumption |
| SFE | Surface free energy |
| SMPS | Scanning Mobility Particle Sizer |
| SWAXS | Small- and Wide-Angle X-ray Scattering |
| TEOM | Tapered Element Oscillating Microbalance |
| TUD | Delft University of Technology, Delft, the Netherlands |
| UDE | University of Duisburg-Essen, Duisburg, Germany |
Appendix A
Database Information Used for the LCA.
- Ecoinvent 2.2 datasets used
- Copper, primary, at refinery/RNA S
- Nitrogen, liquid, at plant/RER U
- Argon, liquid, at plant/RER S
- Electricity mix, AC, consumption mix, at consumer, <1 kV DE S
- Lorry transport, Euro 0, 1, 2, 3, 4 mix, 22 t total wight, 17.3 t max payload RER S
- Container ship ocean, technology mix, 27.500 dwt pay load capacity RER S
References
- BUONAPART-E Website. Available online: http://www.buonapart-e.eu/ (accessed on 18 June 2017).
- Backman, U.; Jokiniemi, J.; Auvinen, A.; Lehtinen, K.E.J. The effect of boundary conditions on gas-phase synthesized silver nanoparticles. J. Nanoparticle Res. 2002, 4, 325–3351. [Google Scholar] [CrossRef]
- Boulaud, D.; Chouard, J.C.; Briand, A.; Chartier, F.; Lacour, J.L.; Mauchien, P.; Mermet, J.M.J. Experimental study of aerosol production by laser ablation. J. Aerosol Sci. 1992, 23, S225–S228. [Google Scholar] [CrossRef]
- Byeon, J.H.; Park, J.H.; Hwang, J. Spark generation of monometallic and bimetallic aerosol nanoparticles. J. Aerosol Sci. 2008, 39, 888–896. [Google Scholar] [CrossRef]
- Chen, J.; Lu, G.; Zhu, L.; Flagen, R.C. A simple and versatile mini-arc plasma source for nanocrystal synthesis. J. Nanoparticle Res. 2007, 9, 203–213. [Google Scholar] [CrossRef]
- Mäkelä, J.M.; Aalto, P.; Gorbunov, B.Z.; Korhonen, P. Size distributions from aerosol spark generator. J. Aerosol Sci. 1992, 23, S233–S236. [Google Scholar] [CrossRef]
- Stein, M.; Kiesler, D.; Kruis, F.E. Effect of carrier gas composition on transferred arc metal nanoparticle synthesis. J. Nanoparticle Res. 2013, 15, 1400. [Google Scholar] [CrossRef]
- Sengul, H.; Theis, T.L.; Ghosh, S. Toward Sustainable Nanoproducts An Overview of Nanomanufacturing Methods. J. Ind. Ecol. 2008, 12, 329–359. [Google Scholar] [CrossRef]
- Cushing, B.L.; Kolesnichenko, V.L.; O’Connor, C.J. Recent Advances in the Liquid-Phase Syntheses of Inorganic Nanoparticles. Chem. Rev. 2004, 104, 3893–3946. [Google Scholar] [CrossRef] [PubMed]
- Pourzahedi, L.; Eckelman, M.J. Comparative life cycle assessment of silver nanoparticle synthesis routes. Environ. Sci. Nano 2015, 2, 361–369. [Google Scholar] [CrossRef]
- Final Report Summary—BUONAPART-E (Better Upscaling and Optimization of Nanoparticle and Nanostructure Production by Means of Electrical Discharges). Available online: http://cordis.europa.eu/result/rcn/185102_en.html (accessed on 4 September 2017).
- Hontañón, E.; Palomares, J.M.; Stein, M.; Guo, X.; Engeln, R.; Nirschl, H.; Kruis, E. The transition from spark to arc discharge and its implications with respect to nanoparticle production. J. Nanoparticle Res. 2013, 15, 1957. [Google Scholar] [CrossRef]
- Stein, M.; Kruis, F.E. Scale-up of metal nanoparticle production. Presented at TechConnect World Innovation Conference & Expo, Washington, DC, USA, 14–17 June 2015. [Google Scholar]
- Stein, M.; Kruis, E. Optimization of a transferred arc reactor for metal nanoparticle synthesis. J. Mater. Sci. Chem. Eng. 2016, 18, 258. [Google Scholar] [CrossRef] [PubMed]
- Stein, M.; Kiesler, D.; Kruis, F.E. Adjustments and online determination of primary particle size in transferred arc synthesis of copper nanoparticles. Aerosol Sci. Technol. 2013, 47, 1276–1284. [Google Scholar] [CrossRef]
- Stein, M. Synthesis of Metal Nanoparticles by Transferred Arc Discharge. Ph.D. Thesis, University of Duisburg-Essen, Duisburg, Germany, 2015. [Google Scholar]
- Feng, J.; Biskos, G.; Schmidt-Ott, A. Toward industrial scale synthesis of ultrapure singlet nanoparticles with controllable sizes in a continuous gas-phase process. Nat. Sci. Rep. 2015, 5, 15788. [Google Scholar] [CrossRef] [PubMed]
- Guo, X.; Wagner, M.; Gutsche, A.; Meyer, J.; Seipenbusch, M.; Nirschl, H. Laboratory SWAXS combined with a low-pressure impactor for quasi-online analysis of nanoparticles generated by spark discharge. J. Aerosol Sci. 2015, 85, 17–29. [Google Scholar] [CrossRef]
- Lee, P.C.; Meisel, D. Adsorption and Surface-Enhanced Raman of Dyes on Silver and Gold Sols. J. Phys. Chem. 1982, 86, 3391–3395. [Google Scholar] [CrossRef]
- Lisiecki, I.; Billoudet, F.; Pileni, M.P. Control of the Shape and the Size of Copper Metallic Particles. J. Phys. Chem. 1996, 100, 4160–4166. [Google Scholar] [CrossRef]
- Ghanta, S.R.; Rao, M.H.; Muralidharan, K. Single-pot synthesis of zinc nanoparticles, borane (BH3) and closo-dodecaborate (B12H12)2− using LiBH4 under mild conditions. Dalton Trans. 2013, 42, 8420–8425. [Google Scholar] [CrossRef] [PubMed]
- Szargut, J.; Morris, D.R.; Steward, F.R. Exergy Analysis of Thermal, Chemical and Metallurgical Processes; Hemisphere Publ. Corp.: New York, NY, USA, 1988; ISBN 978-0891165743. [Google Scholar]
- Zevenhoven, R.; Beyene, A. The exergy of nano-particulate materials. Int. J. Thermodyn. 2014, 17, 145–151. [Google Scholar] [CrossRef]
- Xiong, S.Y.; Qi, W.H.; Cheng, Y.J.; Huang, B.Y.; Wang, M.P.; Li, Y.J. Universal relation for size dependent thermodynamic properties of metallic nanoparticles. Phys. Chem. Chem. Phys. 2011, 13, 10652–10660. [Google Scholar] [CrossRef] [PubMed]
- International Organisation for Standardisation. ISO 14040:2006 Standard, Environmental Management—Life Cycle Assessment—Principles and Framework. 2006. Available online: https://www.iso.org/obp/ui/#iso:std:iso:14040:ed-2:v1:en (accessed on 18 June 2017).
- Margni, M.; Charles, R.; Humbert, S.; Payet, J.; Rebitzer, G.; Rosenbaum, R.; Jolliet, O. IMPACT 2002+: A new life cycle impact assessment methodology. Int. J. Life Cycle Assess. 2003, 8, 324–330. [Google Scholar] [CrossRef]
- Slotte, M.; Mehta, G.; Zevenhoven, R. Life cycle indicator comparison of copper, silver, zinc and aluminum nanoparticle production through electric arc/spark evaporation or chemical reduction. Int. J. Energy Environ. Eng. 2015, 6, 233–243. [Google Scholar] [CrossRef]
- Bird, R.B.; Stewart, W.E.; Lightfoot, E.N. Transport Phenomena; Wiley: New York, NY, USA, 1960. [Google Scholar]
- Slotte, M.; Zevenhoven, R. Energy requirements and Life Cycle Assessment of production and product integration of silver, copper and zinc nanoparticles. J. Clean. Prod. 2017, 148, 948–957. [Google Scholar] [CrossRef]
- Walser, T.; Demou, E.; Lang, D.J.; Hellweg, S. Prospective Environmental Life Cycle Assessment of Nanosilver T-Shirts. Environ. Sci. Technol. 2011, 45, 4570–4578. [Google Scholar] [CrossRef] [PubMed]
- Hicks, A.L.; Gilbertson, L.M.; Yamani, J.S.; Theis, T.L.; Zimmerman, J.B. Life Cycle Payback of Nanosilver Enabled Textiles under Different Loading, Release, And Laundering Scenarios Informed by Literature Review. Environ. Sci. Technol. 2015, 49, 7529–7542. [Google Scholar] [CrossRef] [PubMed]
- Hicks, A.L.; Theis, T.L. A comparative life cycle assessment of commercially available household silver-enabled polyester textiles. Int. J. Life Cycle Assess. 2017, 22, 256–265. [Google Scholar] [CrossRef]
Figure 1.
Basic function scheme for NP production unit.

Figure 2.
Pictures of evaporation units, (a) single OSU and (b) multiple OSU, both at UDE.
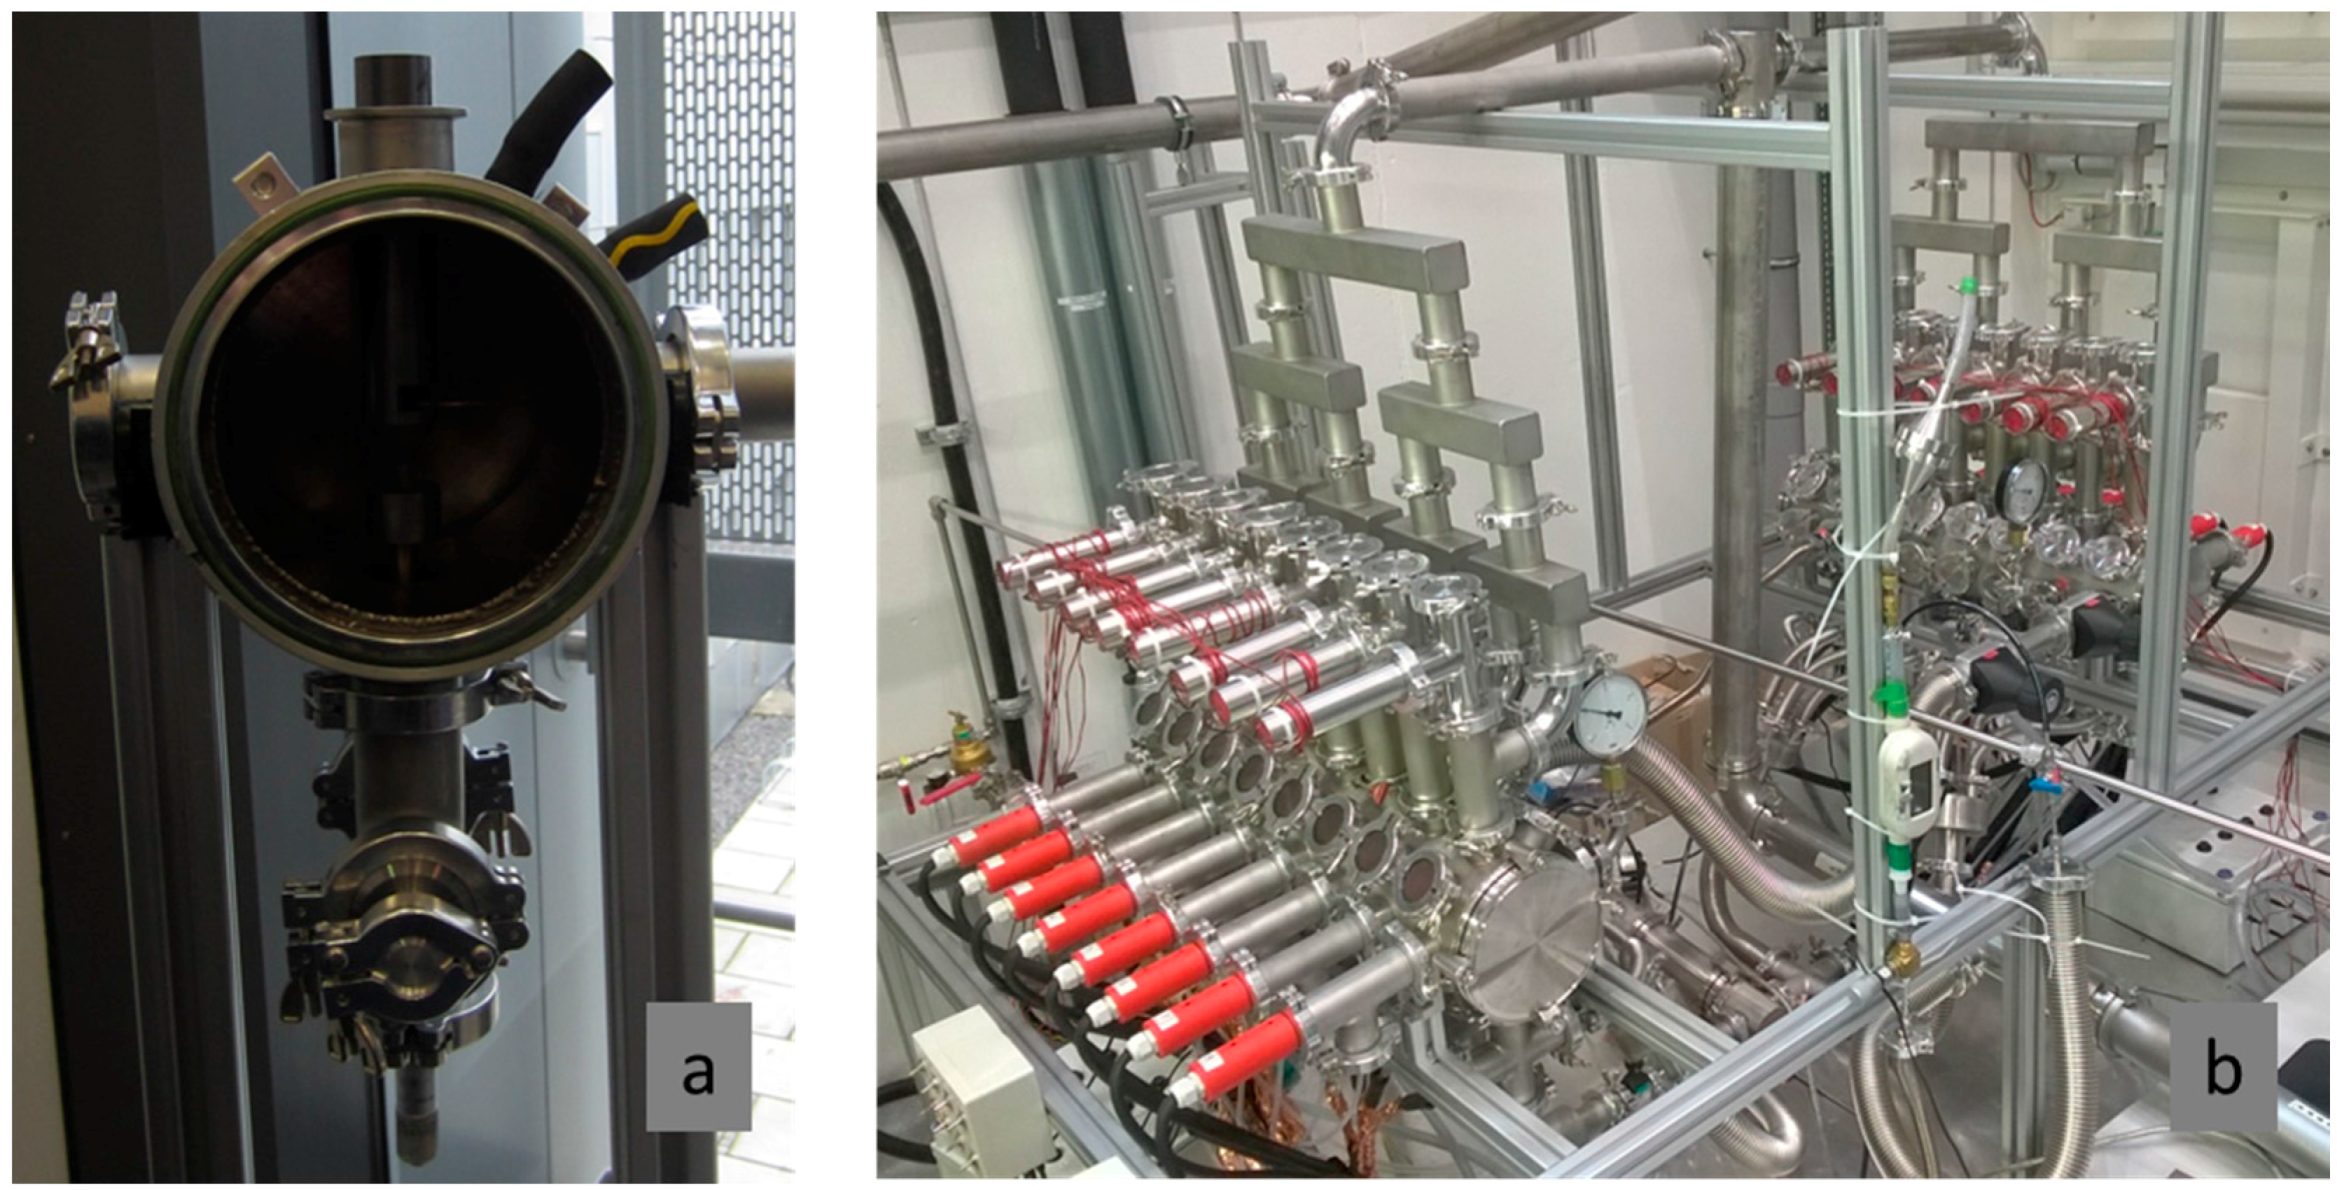
Figure 3.
LCA study system boundary.

Figure 4.
Theoretical minimum electricity input requirements for producing copper NP.

Figure 5.
mOSU system layout for energy use assessment.

Figure 6.
Examples of infrared images obtained from the mOSU setup, with temperatures in °C, (a) end of mOSU reactor; (b) side view of mOSU; (c) cooling water inlet and outlet hoses; (d) mOSU outlet gas collection tubing.
Figure 6.
Examples of infrared images obtained from the mOSU setup, with temperatures in °C, (a) end of mOSU reactor; (b) side view of mOSU; (c) cooling water inlet and outlet hoses; (d) mOSU outlet gas collection tubing.

Figure 7.
Specific electricity consumption for NP production; filled points: surface area, open points: mass. The trend line shown is for SEC versus NP mass (open symbols).
Figure 7.
Specific electricity consumption for NP production; filled points: surface area, open points: mass. The trend line shown is for SEC versus NP mass (open symbols).

Figure 8.
LCIA results for mOSU test series done at UDE with varying number of OSUs, for the impact categories (a) Human Health; (b) Ecosystem Quality; (c) Climate Change and (d) Resource Depletion, respectively. One OSU of the 2 × 8 OSU was not working and therefore results for 15 units are shown. The bars show the change when varying from 25% yield to 17% or 32%.

Figure 9.
LCA comparison for copper NPs produced by arc mOSUx2 and mOSU and spark OSU, for the impact categories (a) Human Health; (b) Ecosystem Quality; (c) Climate Change and (d) Resource Depletion, respectively.
Figure 9.
LCA comparison for copper NPs produced by arc mOSUx2 and mOSU and spark OSU, for the impact categories (a) Human Health; (b) Ecosystem Quality; (c) Climate Change and (d) Resource Depletion, respectively.
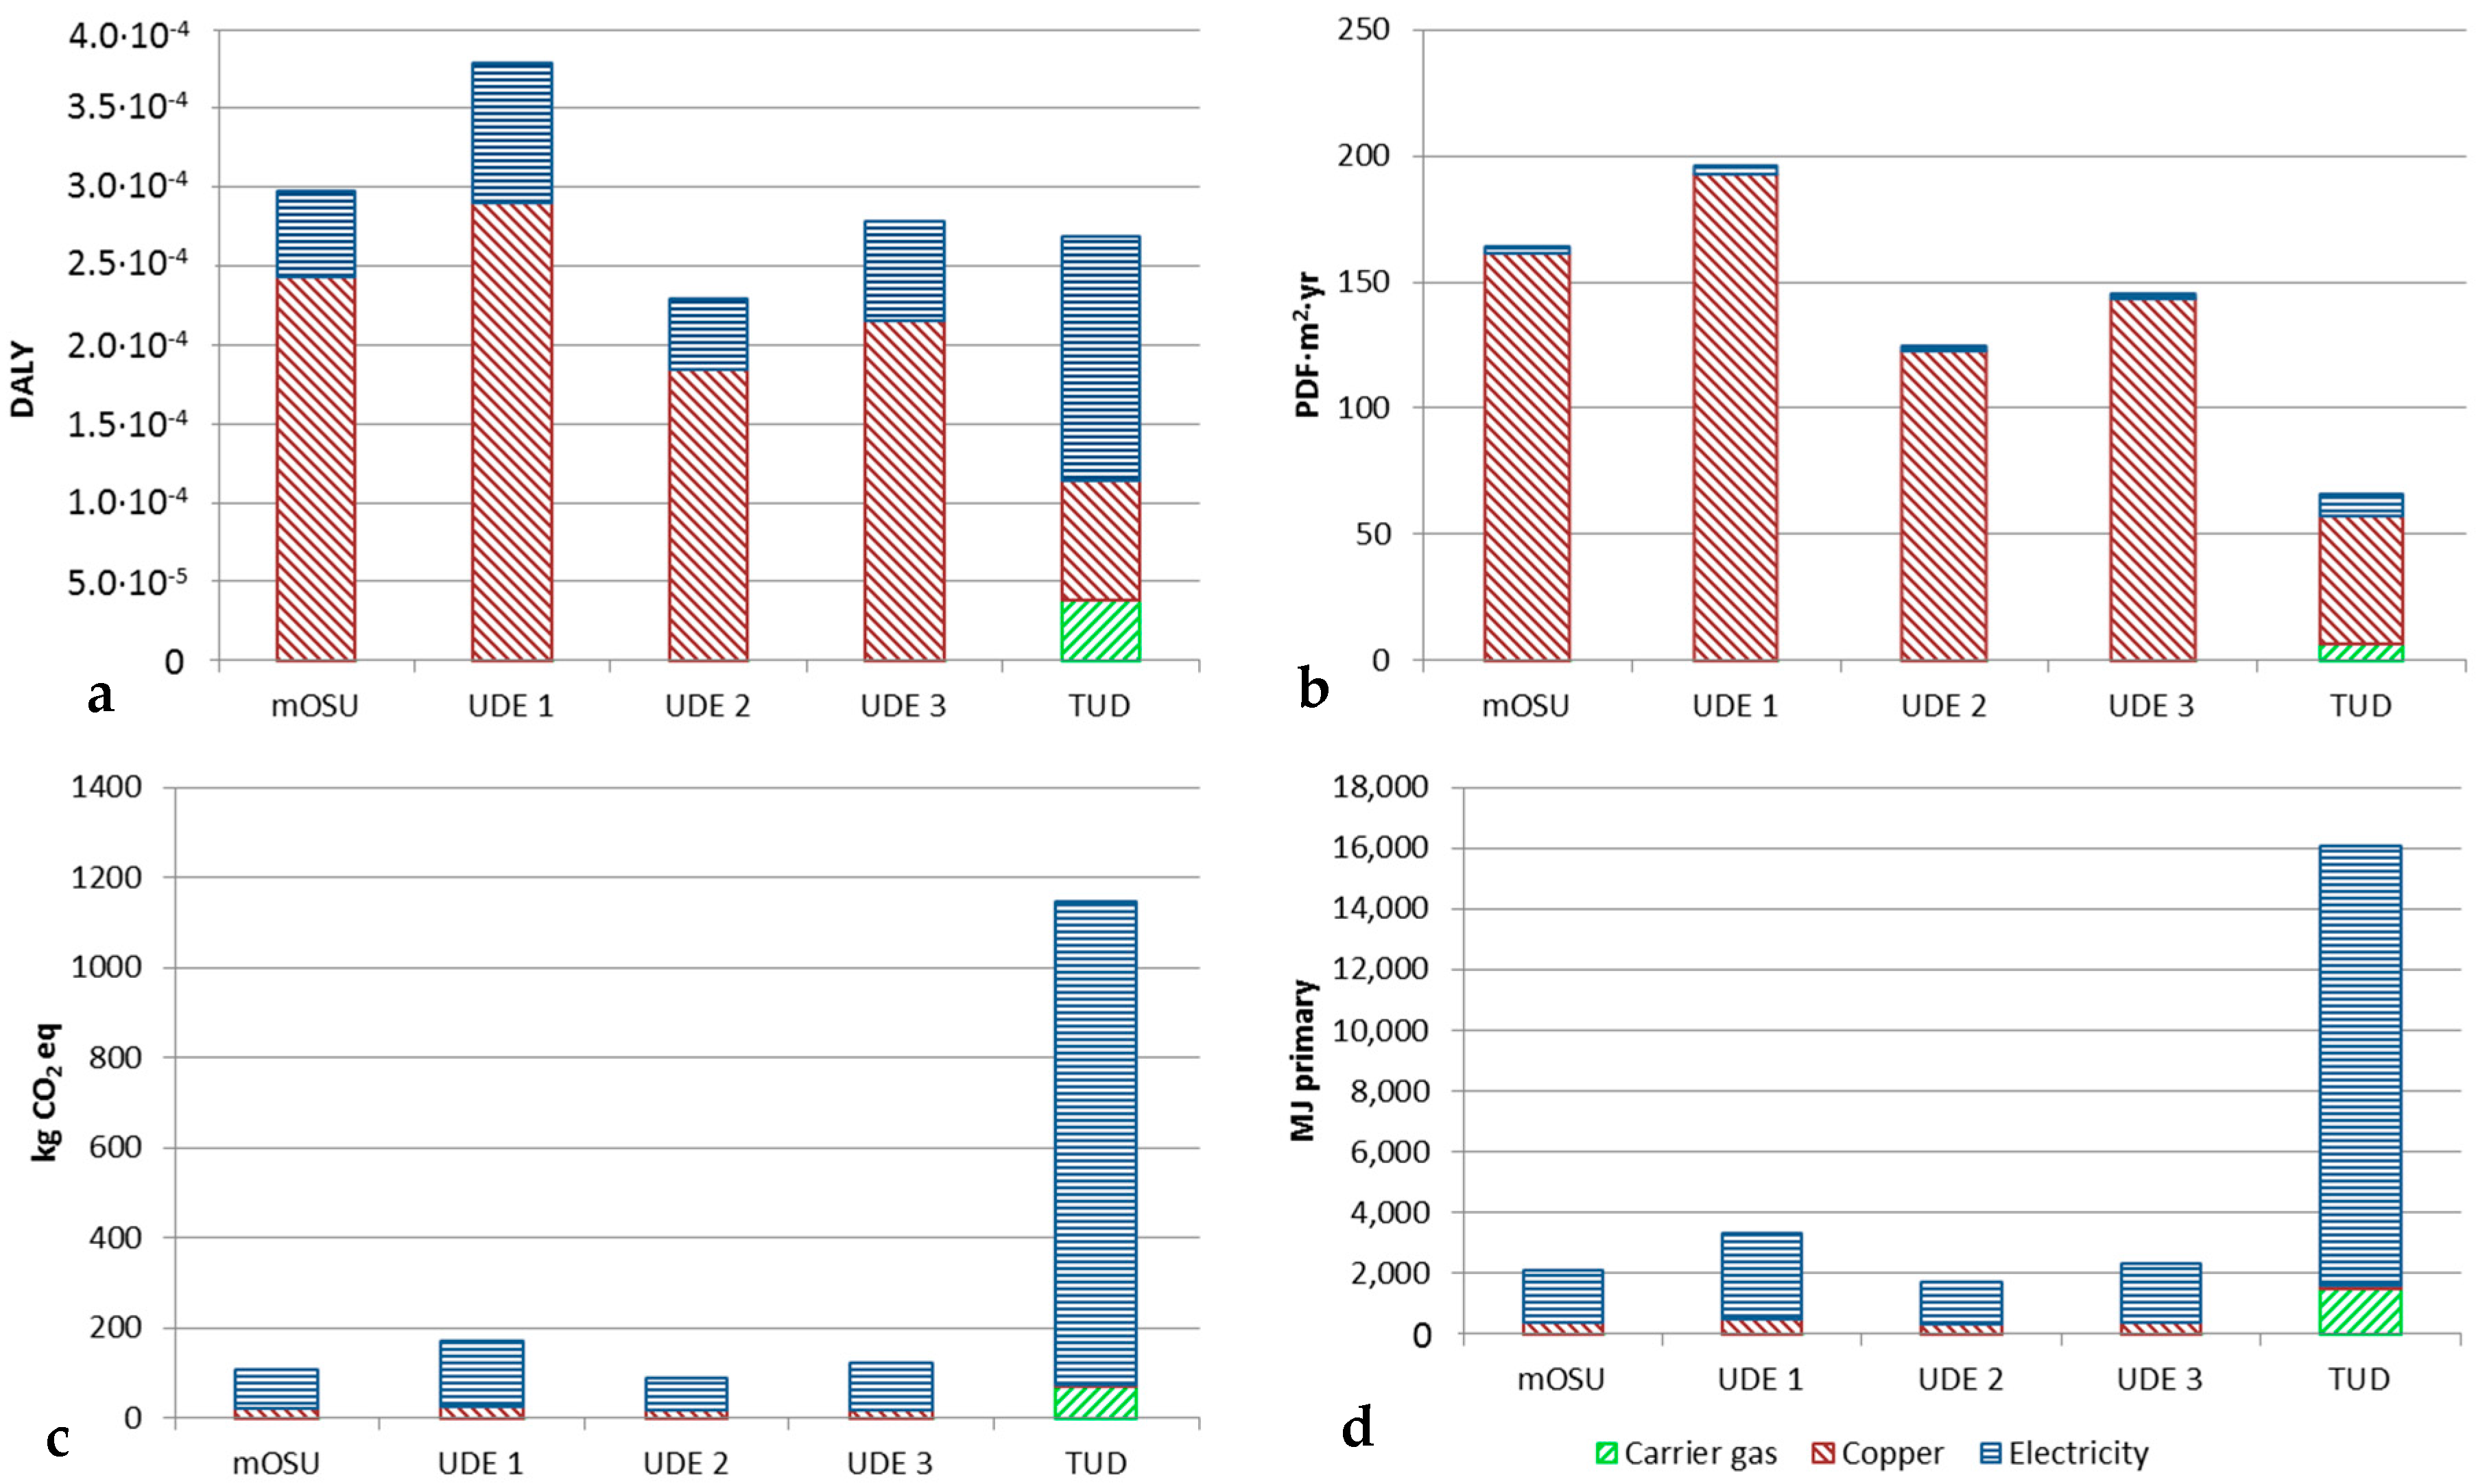
Figure 10.
Life cycle impact breakdown (single points) for production of nano-silver coated cotton textile using either acrylic or polyurethane resin binders.
Figure 10.
Life cycle impact breakdown (single points) for production of nano-silver coated cotton textile using either acrylic or polyurethane resin binders.

Table 1.
Summary of NP production data: silver, copper, zinc.
| Project Partners | Carrier Gas | Production Rate | Collected Mass | Collection Efficiency | Power Use | SEC | SEC | Primary Particle Size | |
|---|---|---|---|---|---|---|---|---|---|
| g/h | g/h | % | kWh | kWh/g | kWh/m2 | nm | |||
| Silver | |||||||||
| OSU spark | TUD | Ar | 0.09 | 0.072 | 80 | 0.036 | 0.500 | 0.037 | 5 |
| mOSU HF spark | TUD | N2 | 1.2 | 0.96 | 80 | 1.5 | 1.56 | 0.23 | 10 |
| OSU arc | UDE | N2 | 1.6–7.2 | 0.2–1.0 | 13.9–31.3 | 0.29–0.96 | 0.57–0.96 | 1.05–1.64 | 115–128 |
| MNL | 13.9 | 2.6 | 18.7 | 1.6 | 0.62 | 0.14 | 15.7 | ||
| Copper | |||||||||
| OSU spark | TUD | Ar | 0.03 | 0.024 | 80 | 0.036 | 1.50 | 0.112 | 5 |
| KIT-S | N2 | 0.0009 | 0.000405 | 45 | 0.020 | 49.3 | 3.157 | 4.3 | |
| mOSU HF spark | TUD | N2 | 1.3 | 1.04 | 80 | 1.5 | 1.44 | 0.21 | 10 |
| OSU arc | UDE | N2 | 6.2–20.2 | 1.3–5.7 | 21–33 | 0.33–1.02 | 0.13–0.25 | 0.14–0.20 | 45–74 |
| MNL | 71 | 13.5 | 19 | 1.88 | 0.14 | 0.12 | 58 | ||
| mOSU arc | UDE | N2 | 272.16 | 68.04 | 25 | 10.5 | 0.154 | 0.181 | 79 |
| Zinc | |||||||||
| OSU spark | TUD | Ar | 0.09 | 0.072 | 0.036 | 0.5 | 6.944 | 0.516 | 5 |
| KIT-S | |||||||||
| OSU arc | UDE | N2 | 6.6–42 | 4.9–21 | 50–74.2 | 0.11–0.3 | 0.014–0.022 | 0.05–0.057 | 150–270 |
| MNL | Ar | 27.8 | 5.3 | 19.1 | 0.4 | 0.075 | 0.165 | 147 | |
Table 2.
Energy use comparison of OSU vs. 2 × 8 mOSU (UDE) for Ag, Cu and Zn (arc in N2).
| Process Parameter | Ag | Cu | Zn | |||
|---|---|---|---|---|---|---|
| OSU | mOSU | OSU | mOSU | OSU | mOSU | |
| SEC (kWh/g) | 0.63–0.99 | No data | 0.13–0.28 | 0.14–0.21 | 0.016–0.029 | No data |
| Evaporation & collection efficiency (%) | 13.9–31.3 | No data | 21–33 | 17 | 21.2–71.4 | No data |
| Particle size (nm) | 115–128 | 98 1 | 45–74 | 89 | 150–270 | 180 |
| Production rate (g/h per OSU) collected NP | 0.5 | 0.9 1 | 5.5 | 4.17 | 21 | 22.3 1 |
1 Extrapolated from OSU data and Cu data for mOSU [13].
Table 3.
NP production data reported by project partners. The efficiency gives the material yield given as a percentage.
Table 3.
NP production data reported by project partners. The efficiency gives the material yield given as a percentage.
| Metal | Arc/Spark | Carrier Gas | Project Partner | SEC (kWh/kg) | Efficiency (%) |
|---|---|---|---|---|---|
| Al | Arc | Ar | UDE | 413–799 | 2.5–3.1 |
| Al | Spark | Ar | TUD | 1.29 | 80 |
| Au | Spark | Ar | TUD | 0.84 | 80 |
| Ni | Spark | N2 | KIT-S | 15.87 | 45 |
| Ni | Spark | Ar | TUD | 0.90 | 80 |
| CuNi | Spark | N2 | KIT-S | 15.87 | 45 |
| CuNi | Spark | Ar | TUD | 1.03 | 80 |
| FeCr | Spark | N2 | KIT-S | 42.55 | 45 |
| FeCr | Arc | Ar | UDE | 389.89 | 37.5 |
Table 4.
LCI data, inputs and outputs for mOSU comparison.
| Number of OSUs | |||||
|---|---|---|---|---|---|
| Process Parameter | Unit | 1 | 5 | 10 | 15 |
| Input | |||||
| Energy | kWh | 0.7 | 3.5 | 7.0 | 10.5 |
| Thereof electricity | kWh | 0.7 | 3.5 | 7.0 | 10.5 |
| Feedstock material at site, copper | g | 13.44 | 87.36 | 191.52 | 272.16 |
| Carrier material at site, nitrogen | g | 420 | 420 | 420 | 420 |
| Output | |||||
| Nano copper | g | 3.36 | 21.84 | 47.88 | 68.04 |
| Nitrogen released to atmosphere | g | 420 | 420 | 420 | 420 |
| Copper for recycling | g | 10.08 | 65.52 | 143.64 | 204.12 |
Table 5.
LCIA results for mOSU tests for copper NP production.
| Number of OSUs | Carrier Gas | Copper | Electricity | |
|---|---|---|---|---|
| Human Health | ||||
| 1 | DALY | 7.40 × 10⁻⁶ | 2.43 × 10⁻⁴ | 7.30 × 10⁻⁵ |
| 5 | DALY | 1.14 × 10⁻⁶ | 2.43 × 10⁻⁴ | 5.62 × 10⁻⁵ |
| 10 | DALY | 5.19 × 10⁻⁷ | 2.43 × 10⁻⁴ | 5.13 × 10⁻⁵ |
| 15 | DALY | 3.65 × 10⁻⁷ | 2.43 × 10⁻⁴ | 5.41 × 10⁻⁵ |
| Ecosystem Quality | ||||
| 1 | PDF·m2·year | 0.293 | 161.6 | 2.7 |
| 5 | PDF·m2·year | 0.122 | 161.6 | 2.3 |
| 10 | PDF·m2·year | 0.079 | 161.6 | 2.2 |
| 15 | PDF·m2·year | 0.053 | 161.6 | 2.0 |
| Climate Change | ||||
| 1 | kg CO2 eq | 11.57 | 19.9 | 118.7 |
| 5 | kg CO2 eq | 4.82 | 19.9 | 98.9 |
| 10 | kg CO2 eq | 3.13 | 19.9 | 96.2 |
| 15 | kg CO2 eq | 2.10 | 19.9 | 86.3 |
| Resource Depletion | ||||
| 1 | MJ primary | 220 | 373 | 2309 |
| 5 | MJ primary | 92 | 373 | 1924 |
| 10 | MJ primary | 60 | 373 | 1872 |
| 15 | MJ primary | 40 | 373 | 1679 |
Table 6.
LCI data, inputs and outputs for mOSU (arc) and OSU (arc and spark) comparison.
| Test | ||||||
|---|---|---|---|---|---|---|
| Process Parameter | Unit | mOSU | UDE 1 Arc | UDE 2 Arc | UDE 3 Arc | TUD Spark |
| Input | ||||||
| Energy | kWh | 10.5 | 0.33 | 0.7 | 1.02 | 0.036 |
| Thereof electricity | kWh | 10.5 | 0.33 | 0.7 | 1.02 | 0.036 |
| Feedstock material at site, copper | g | 272.16 | 6.2 | 16.7 | 20.2 | 0.03 |
| Carrier material at site, N2 or Ar | g | 420 N2 | 16.1 N2 | 48.4 N2 | 48.4 N2 | 5.3 Ar |
| Output | ||||||
| NP copper | g | 68.04 | 1.3 | 5.5 | 5.7 | 0.024 |
| Nitrogen released to atmosphere | g | 420 | 16.1 | 48.4 | 48.4 | - |
| Argon released to atmosphere | g | - | - | - | - | 5.3 |
| Copper for recycling | g | 204.12 | 4.9 | 11.2 | 14.5 | 0.006 |
© 2017 by the authors. Licensee MDPI, Basel, Switzerland. This article is an open access article distributed under the terms and conditions of the Creative Commons Attribution (CC BY) license (http://creativecommons.org/licenses/by/4.0/).
Share and Cite
MDPI and ACS Style
Slotte, M.; Zevenhoven, R. Energy Efficiency and Scalability of Metallic Nanoparticle Production Using Arc/Spark Discharge. Energies 2017, 10, 1605. https://doi.org/10.3390/en10101605
AMA Style
Slotte M, Zevenhoven R. Energy Efficiency and Scalability of Metallic Nanoparticle Production Using Arc/Spark Discharge. Energies. 2017; 10(10):1605. https://doi.org/10.3390/en10101605
Chicago/Turabian StyleSlotte, Martin, and Ron Zevenhoven. 2017. "Energy Efficiency and Scalability of Metallic Nanoparticle Production Using Arc/Spark Discharge" Energies 10, no. 10: 1605. https://doi.org/10.3390/en10101605
Note that from the first issue of 2016, this journal uses article numbers instead of page numbers. See further details here.