1. Introduction
Voltage instability has become a challenging issue in power grids since several major blackouts worldwide have been mainly attributed to voltage collapse [
1,
2,
3]. Voltage collapse tends to occur during heavy loading, especially when the generating capacity is insufficient. Indeed, it can also be caused by a contingency, such as the loss of a crucial generator or transmission line, or some of the critical buses in the system not providing adequate reactive power support [
4,
5].
Since the wide-area measurement system (WAMS) has become a core technology in future smart grids, the ability commended from this technology has been perceived globally with its effective analysis on a variety of applications in power grid monitoring, control, and protection [
6,
7]. A typical WAMS comprises of phasor measurement units (PMUs), phasor data concentrators (PDCs), control center, and high-speed data communication infrastructures. Over the past years, several countries have installed PMUs to form WAMS on their power systems [
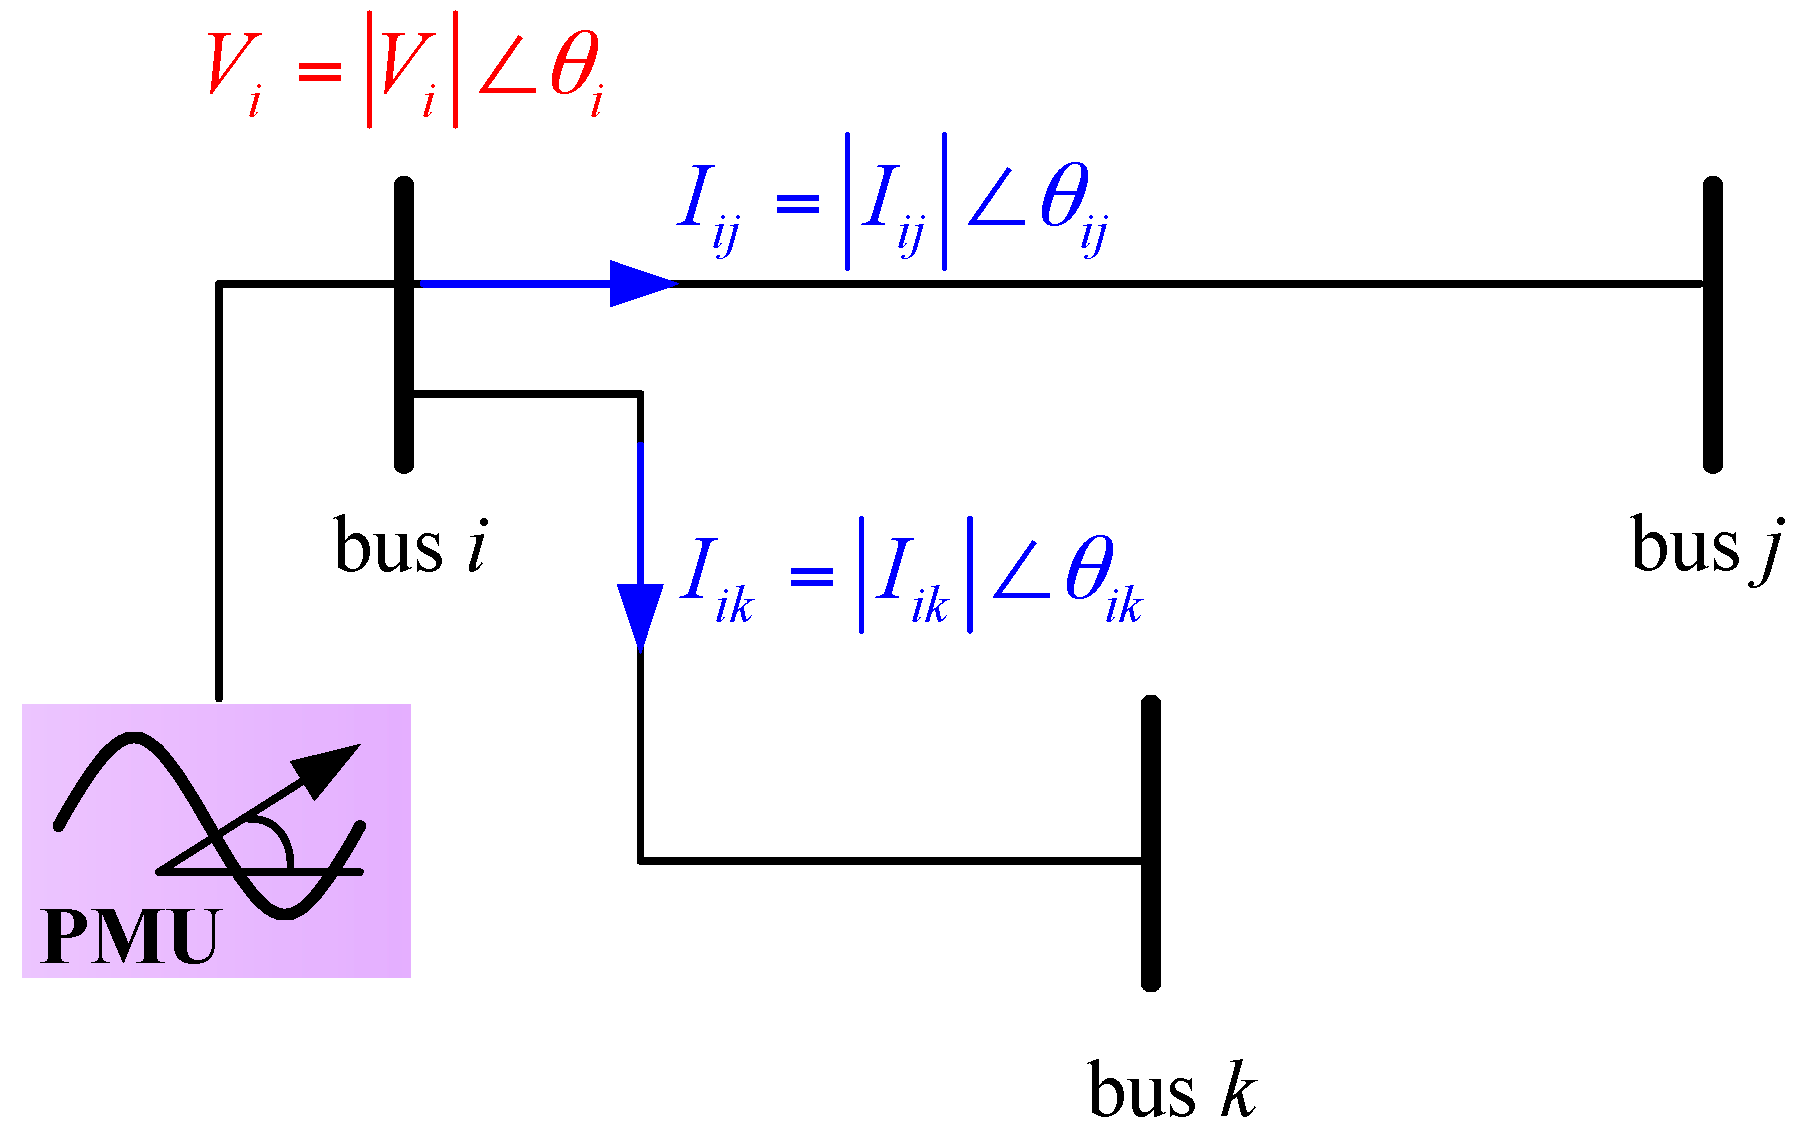
8]. PMUs are precise power system measuring devices that provide the information of voltage and current phasors and frequency at a very high speed (usually 30 measurements per second). Measurements from PMUs are then time-stamped according to a high precision common time reference given by global positioning system (GPS). These time-synchronized phasor (synchrophasor) measurements include sufficient information for monitoring voltage stability of a transmission grid [
9,
10,
11,
12].
To examine the proximity to voltage instability, a variety of approaches were presented, such as singular value decomposition [
13], continuation power flow [
14,
15], and Thevenin equivalent (TE) model [
16,
17,
18,
19,
20,
21,
22,
23,
24]. Many of these studies have developed voltage stability indices, which aims to show how far the system is away from a possible instability event. In [
18], for example, a local voltage stability index using single-port TE model to estimate voltage stability margin was developed. To enhance the performance of single-port TE, several voltage stability indices based on coupled single-port TE were presented in [
19,
20,
21,
22,
23,
24], where the work [
24] develops a L-index for system voltage stability analysis. The L-index is well suited for online applications. However, the original L-index fails to perform as expected in some cases [
25]. In addition, an accurate system model is required for this kind of index. Nevertheless, model parameters and the transmission network topology usually vary with time. In other words, it is difficult to obtain a correct modeling. Without correct transmission grid modeling, the performance of this index would be degraded.
In this context, the main contribution of this study is to develop a novel online voltage stability monitoring approach for secure and reliable grid operations. To this aim, a new voltage stability indicator based on the GECM and the PMU technique is proposed. With the utilization of PMU measured data in real-time, wide-area voltage stability situational awareness for system operators can be enhanced. Moreover, the proposed approach is able to handle the cases with generator Q limits violation.
In this paper, a brief description of the synchrophasor technique and the basic concept of the L-index for voltage stability assessment are provided in
Section 2.
Section 3 describes the GECM and the synchrophasor technique used to track changing parameters of transmission grid impedance models, considering the dynamic behavior of system generators. After that, an enhanced voltage stability index with GECMs incorporated is thoroughly described. The capability of utilizing the presented methodology in voltage stability assessment is verified in
Section 4, followed by the conclusions given in
Section 5.
3. Proposed Methodology
In this research, a WAMS-based method to online voltage stability monitoring is presented. It was designed to cope with the cases of generator Q limits violated. This justifies its use for practical voltage stability analysis.
The overall diagram of the proposed method is shown in
Figure 2, in which the proposed method is demonstrated with the section surrounded by a dashed line. Indeed, the proposed method consists of three stages in computational procedures. The first stage aims at determining the GECMs using generator parameters and PMU data. At the second stage, the RLS algorithm with PMU data are employed to estimate the single-branch TE circuits with GECMs. Then, the enhanced voltage stability index with GECMs can be obtained. Details of the proposed method are described as follows.
3.1. Generator Equivalent Circuit Model
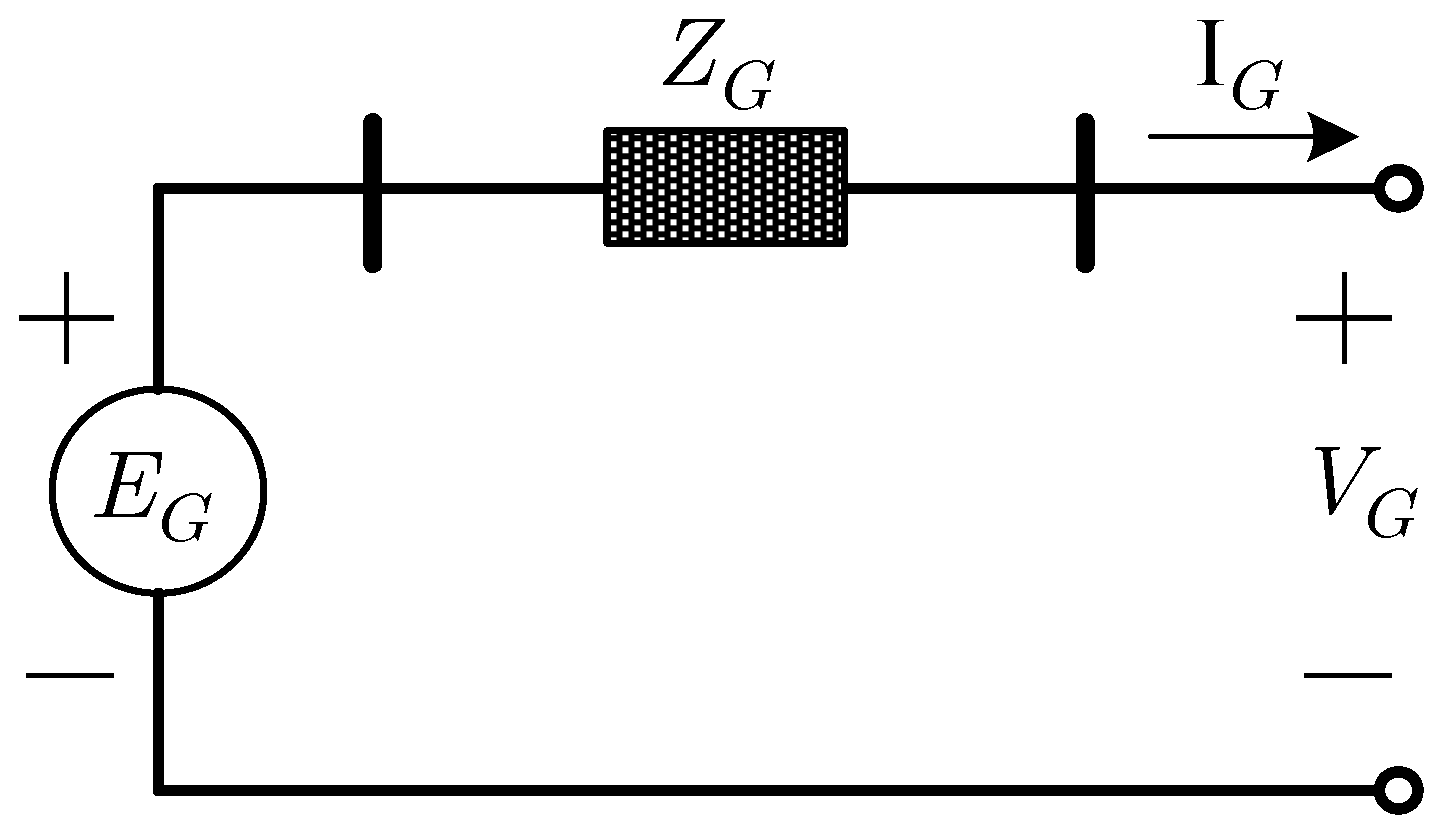
In order to deal with generator Q limits violation cases, the GECM is employed in this study. When considering generator dynamic behaviors, it is assumed that a synchronous generator can be modeled by an internal voltage
in series with a generator equivalent impedance
, as shown in
Figure 3, in which
and
are terminal voltage phasor and current phasor of the generator, respectively.
In
Figure 3, applying Kirchoff’s voltage law (KVL) to the network yields
Given the generator parameters and direct current and quadrature current,
can be acquired [
26,
27]. For instance, the 4th-order generator internal impedance
is modeled by
where
Suppose that generator parameters are known and and are acquired from PMUs, time-varying parameters and can be estimated, i.e., the GECMs can be obtained.
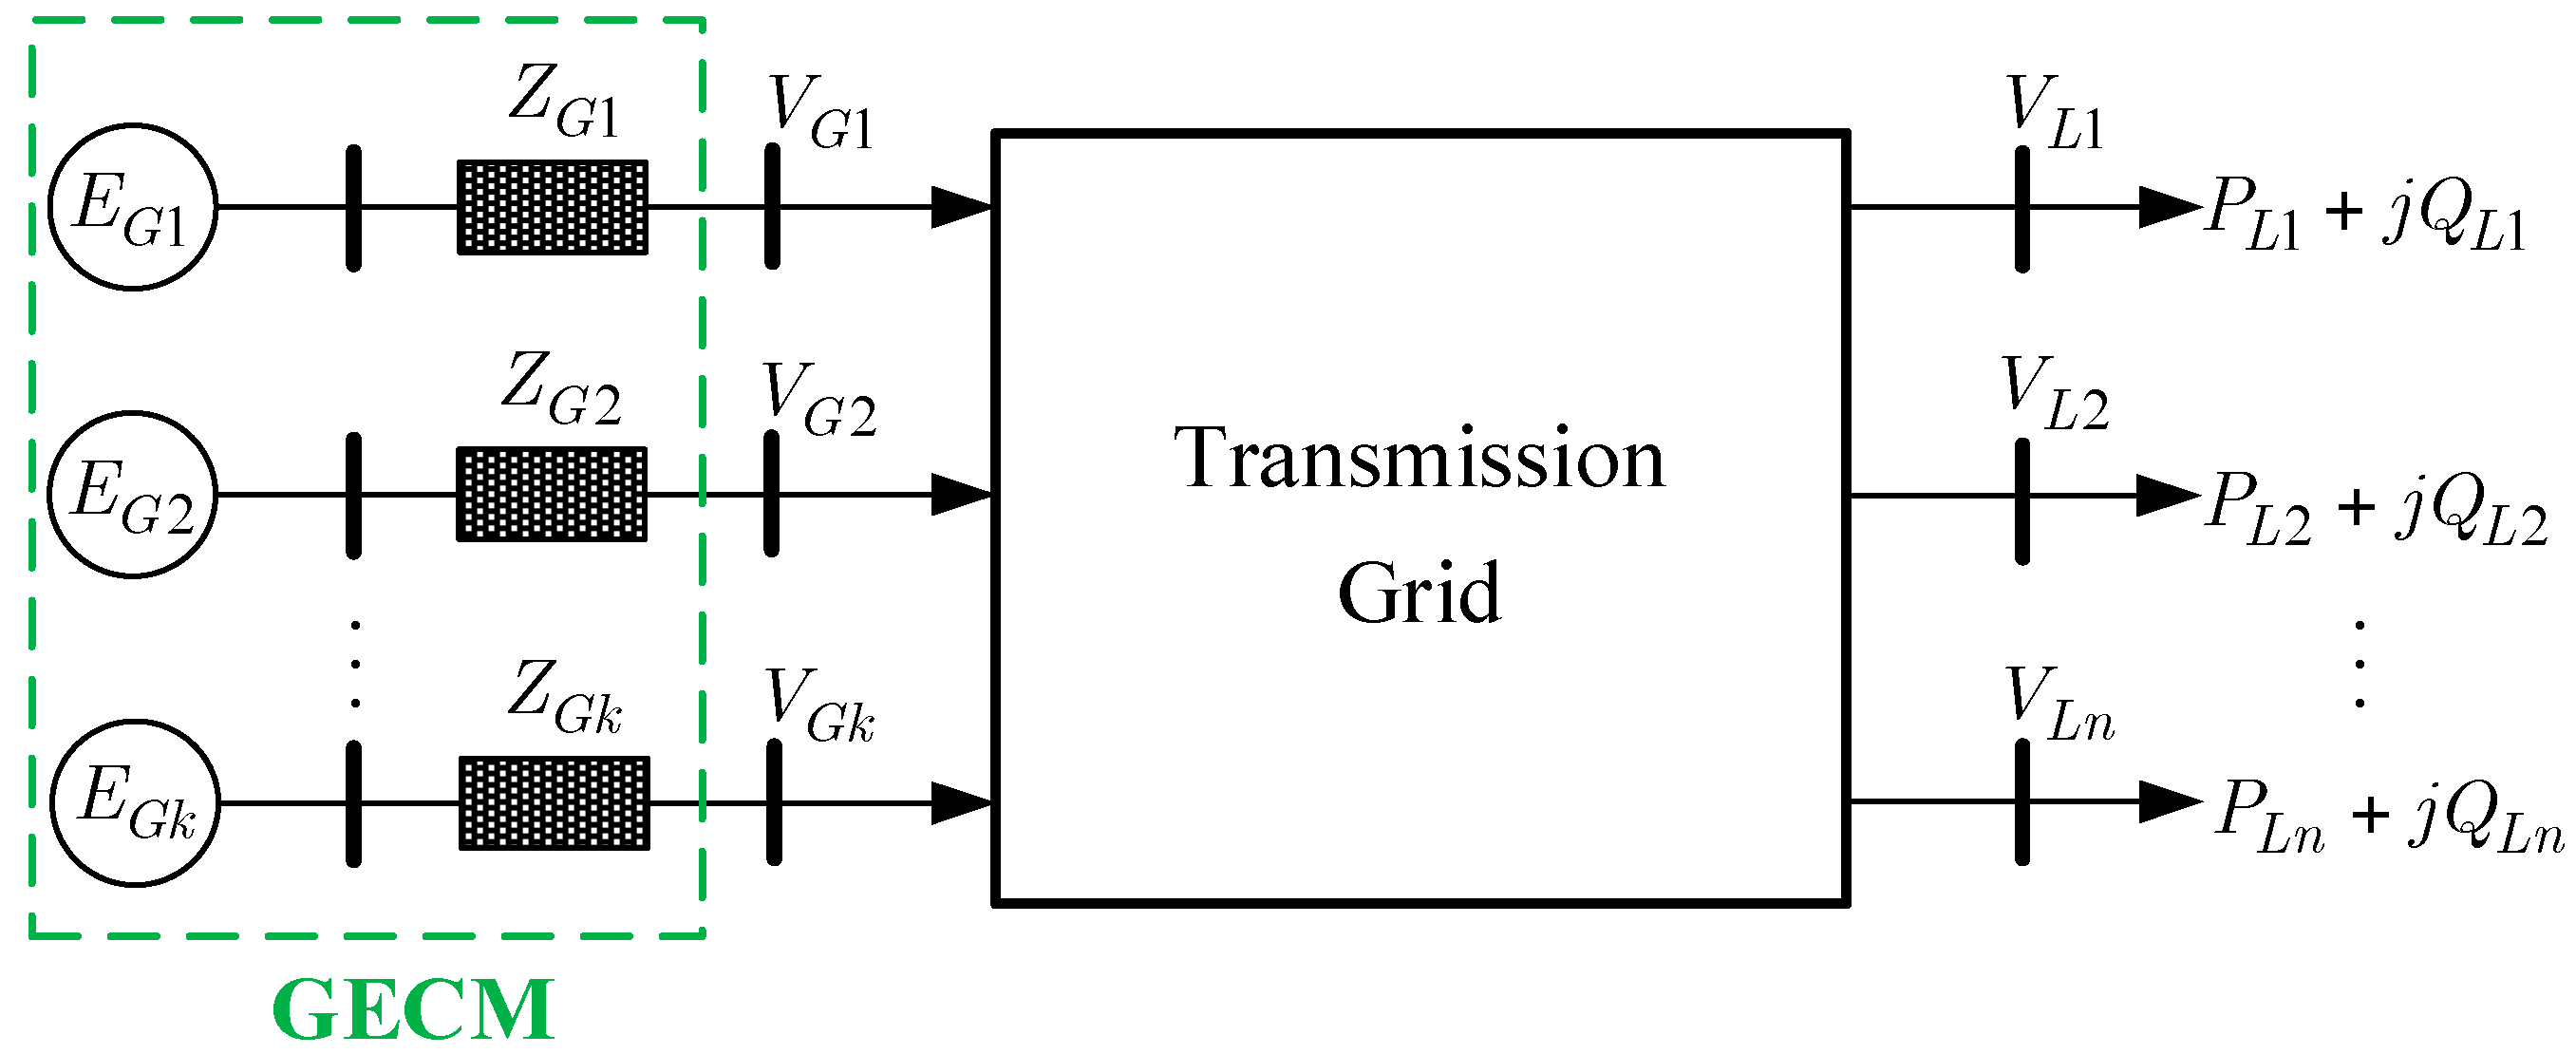
3.2. Transmission Grid Modeling with GECMs
A general transmission grid model is illustrated in
Figure 4. Suppose that such grid model is composed of
k generators and
n loads. When considering the dynamic behavior of system generators, the GECM, which is able to track generator dynamic behaviors, is utilized. That is,
k generators in this study are modeled by their GECMs with time-varying
and
. It is noteworthy that the GECM is adequate for both PV generators and PQ generators [
26,
27].
Indeed, the network shown in
Figure 4 can be modeled by a multi-branch TE circuit. Let
be the vector of bus currents and
be the vector of bus voltages. The node-voltage equation, which includes the internal nodes of the machines, is written as
where
and
;
is the system admittance matrix with generator equivalent admittance denoted by
; and, the subscripts
G and
L denote generator buses and load buses, respectively. In Equation (6),
can be expresses by
where
and
denote the transmission grid voltage gain matrix and impedance matrix, respectively. In this work, an approach based on synchrophasors is presented to estimate
and
.
3.3. Online Estimation of Transmission Grid Model with GECMs
With increasing deployment of PMUs across transmission grids, wide are the measurements that can be obtained from WAMS. In order to make the transmission grid be fully observable, suppose that PMUs are deployed optimally by means of the approach presented in [
8]. In this case, time-synchronized
and
are available. Also,
of GECM can be estimated from PMU measured data via Equation (4).
Suppose that there are
measurements obtained from PMUs, Equation (7) can be expressed as
for each
. The above equation is further rearranged as
where
The least-square estimate of the parameters
in Equation (9) is
In our application, the data from PMU is coming in sequentially, which means that the size of will be increased if a new data point is available. This can also result in computational complexity for the estimation of via Equation (13). Due to memory and computational issues, the traditional least-square method is not suitable for on-line applications.
In this study, the recursive least square (RLS) algorithm, which combines the old estimate and the new data, is applied to solve the unknown
in Equation (9) iteratively. First, define
as
, such that
where
. Also, the term
in Equation (13) can be written as
Substituting Equations (14) and (15) into Equation (13) gives
Since
, then
Substituting for
in Equation (16) gives
Rearrange Equation (14) as
. Substituting for
into Equation (18) and rewriting this equation, yields
From Equation (14), we conclude that
. Substituting for
in Equation (19) and using the matrix inversion lemma, we get
where
I is the identity matrix. In order to track time-varying parameters, the forgetting factor approach is used to modify Equation (20). The modified RLS algorithm with the forgetting factor
becomes
Note that the smaller the value of , the quicker information obtained from previous data will be forgotten.
3.4. Enhanced Voltage Stability Index
In order to handle generator reactive power limits violation cases, a new index with GECMs incorporated is described here.
Using the method presented in
Section 3.3, single-branch TE circuits with GECMs can be estimated by using PMU data. That is the matrix
, which includes the effects of generator reactive-power limits, is acquired. In addition, instead of using constant
as Equation (3) for original L-index, the time-varying
of GECMs is utilized. Thus, the enhanced index
for a load bus
i is given by
Note that the range of
is
. When voltage collapse occurs,
. Thus, the overall system index can be expressed as
The main steps of the proposed PMU-based algorithm to voltage stability assessment are presented in Algorithm 1.
In Algorithm 1, the proposed method uses the given generator parameters and the measured PMU data to determine time-varying and of GECMs (steps 2 to 5). The transmission grid model with GECMs is estimated by means of the RLS algorithm (step 6). is then obtained (step 7). For each load bus i, is calculated by using the estimated and the computed (steps 8 to 10). After that, find the maximum value of which is utilized to represent the voltage stability index of the entire system (step 11).
| Algorithm 1 Proposed PMU-Based Algorithm to Voltage Stability Assessment. |
1: Input: , , and ;
2: for do
3: Compute by Equation (5);
4: Compute by Equation (4);
5: end for
6: Estimate using the RLS algorithm;
7: submatrix of ;
8: for do
9: Compute by Equation (22);
10: end for
11: ;
12: return |
4. Simulation Results
The proposed methodology in voltage stability assessment has been tested on several IEEE power networks and the Taipower system. For all of the examples, the generators are modeled by their GECMs. The GECM used in this study is the IV order synchronous generator model.
To test the performance of the presented approach for voltage stability assessment, a lot of experiments have been studied. In this research, the following scenarios are considered.
Load Type: PQ load model and ZIP (constant impedance, current and power) load model
Load Change Pattern: Single load change, several load change, and all load change
Generator Q Limits: With and without consideration of generator Q limits
All the test examples were built by the software package of Power System Analysis Toolbox (PSAT) [
28], and PSAT is used for running the simulations.
4.1. Case Studies without Generator Q Limits Violation
The IEEE 14 and 118-bus power networks are adopted to illustrate the performance of both the reference method (RM) [
24] and the proposed one. System data for the test systems can be found in [
29]. The simulations have been carried out to examine the voltage stability index on the test networks. In this case study, all of the loads are increased simultaneously until system loses voltage stability. Also, suppose that there is no generator Q limits violation when the load is increased.
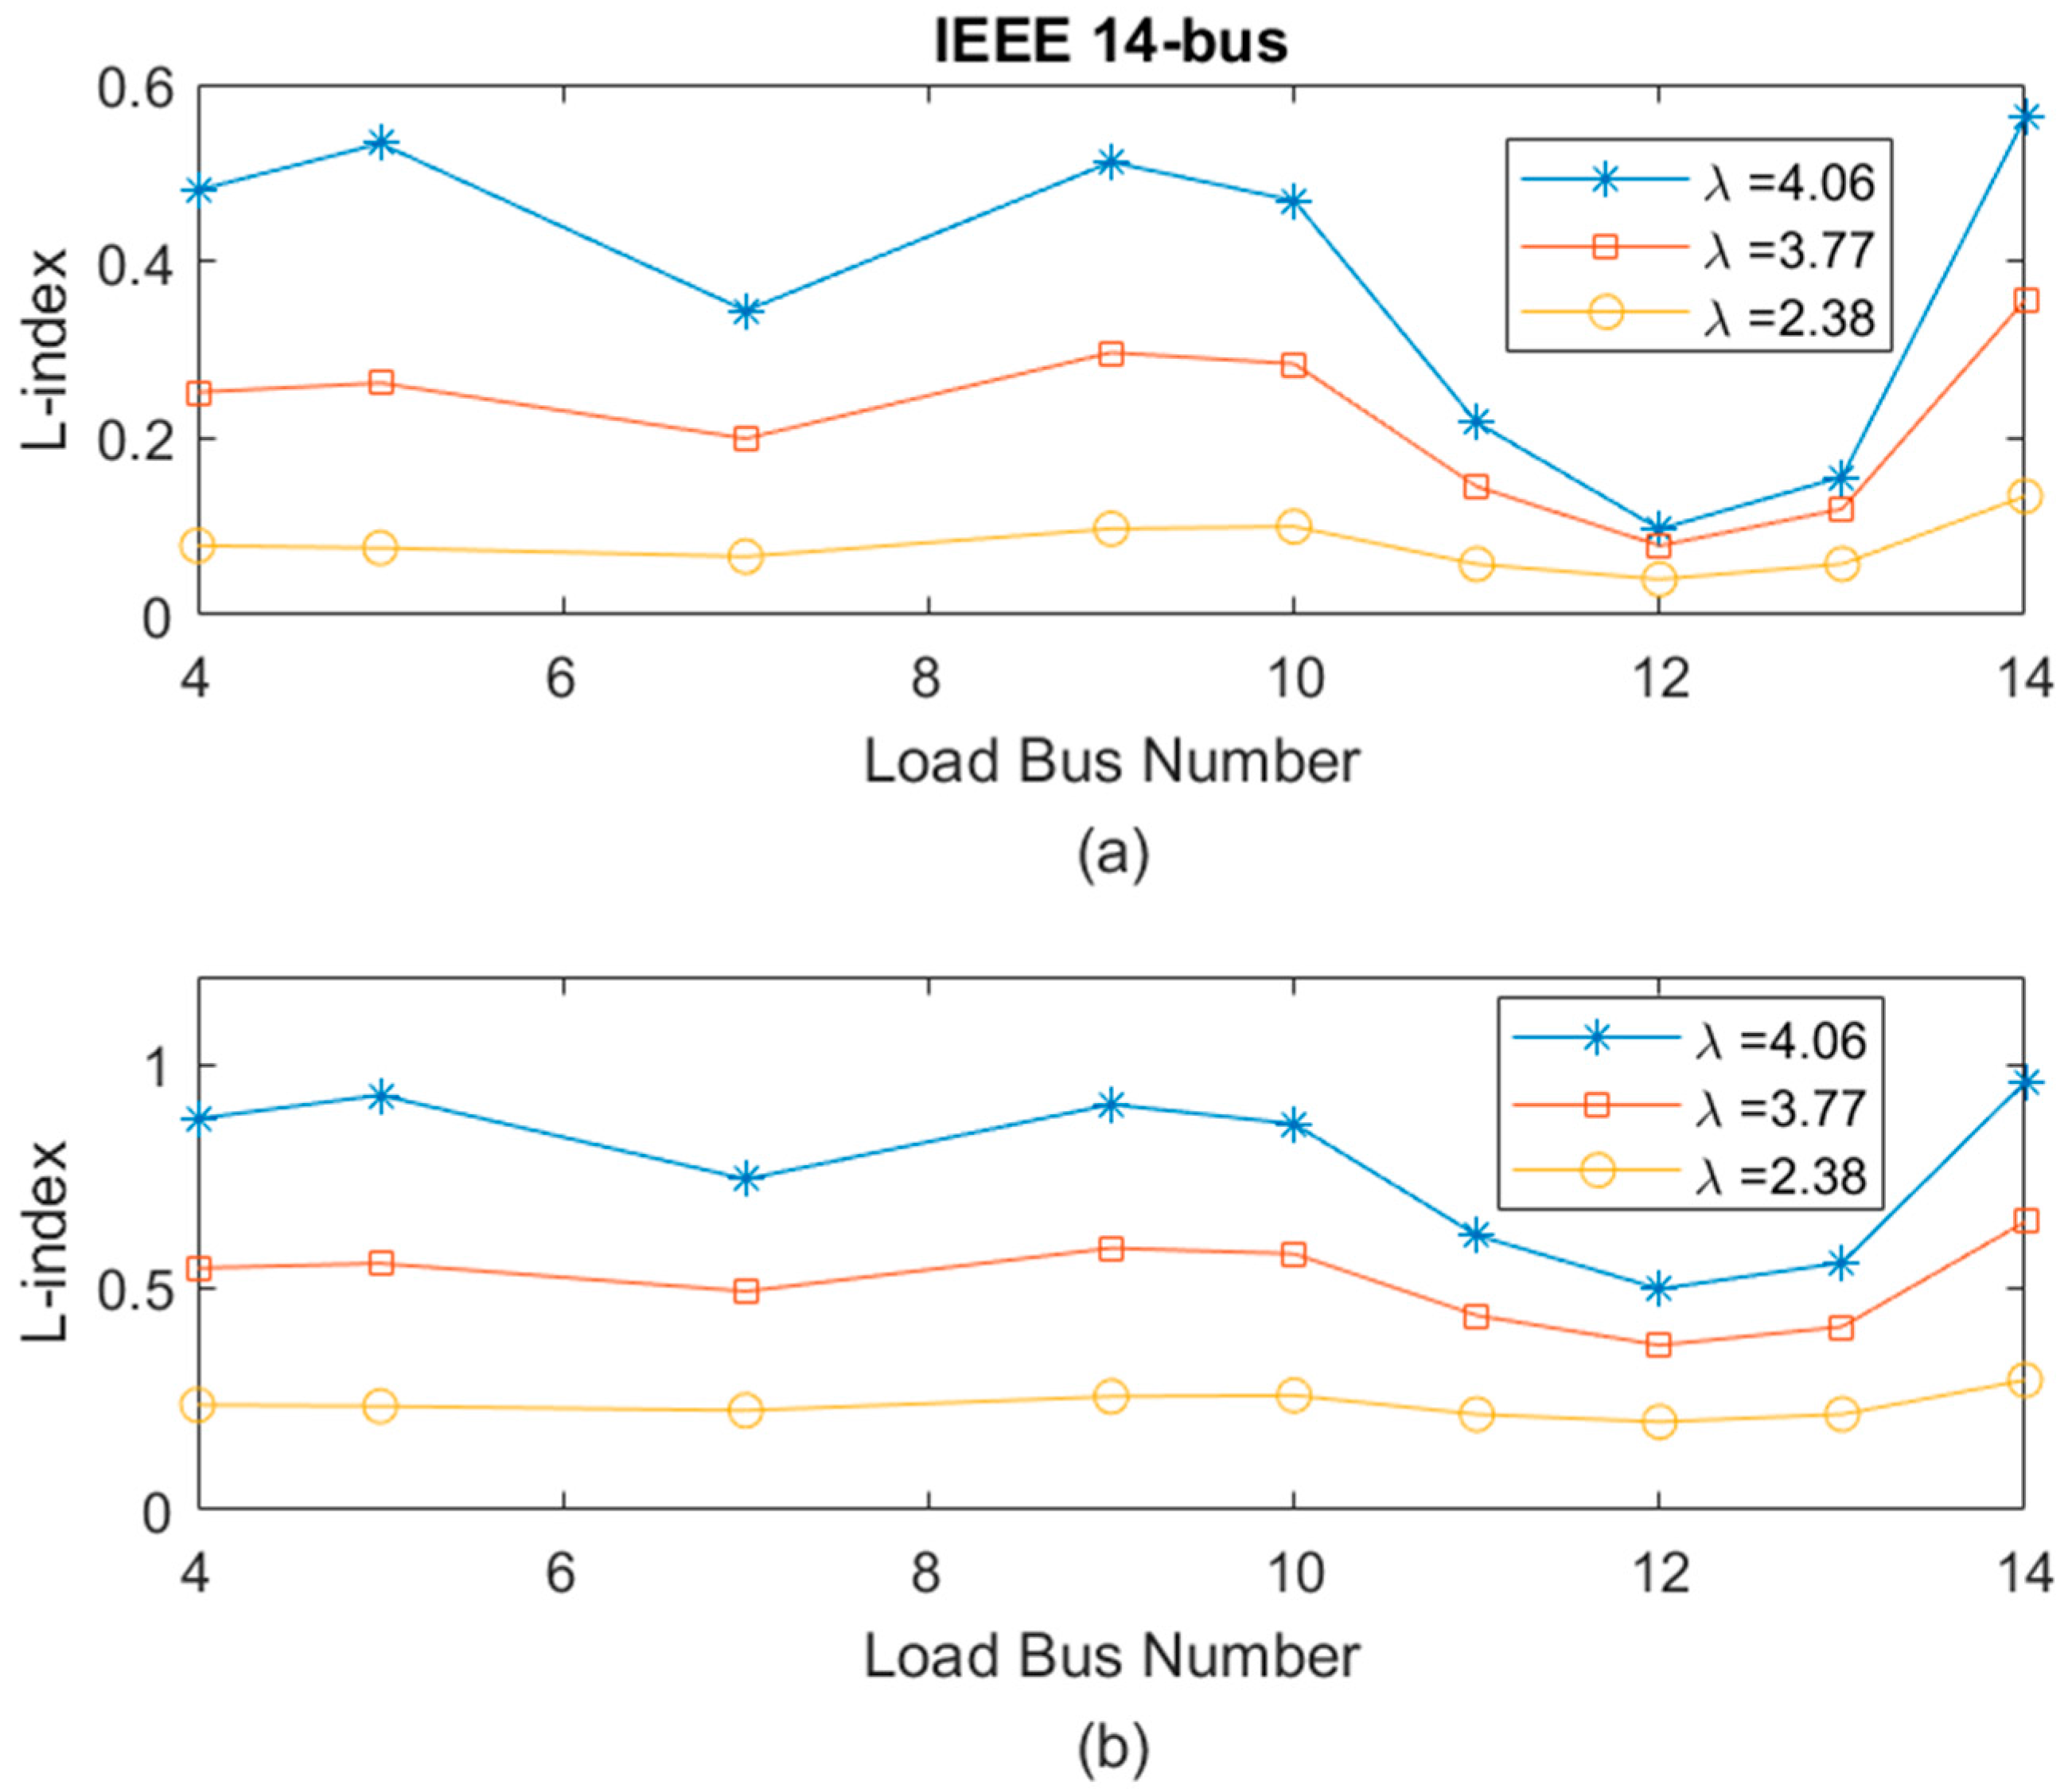
The first test system is the IEEE 14-bus network.
Figure 5 shows the L indices at some load levels for this test system, where the figure on the top shows the results obtained by the RM, while the figure on the bottom illustrates the results obtained by the proposed method. From the figure, one can see that bus 14 in this system has the highest index score for the selected load levels. In other words, bus 14 is the most vulnerable bus of the system; therefore, the L-index at bus 14 is selected to be the system L-index.
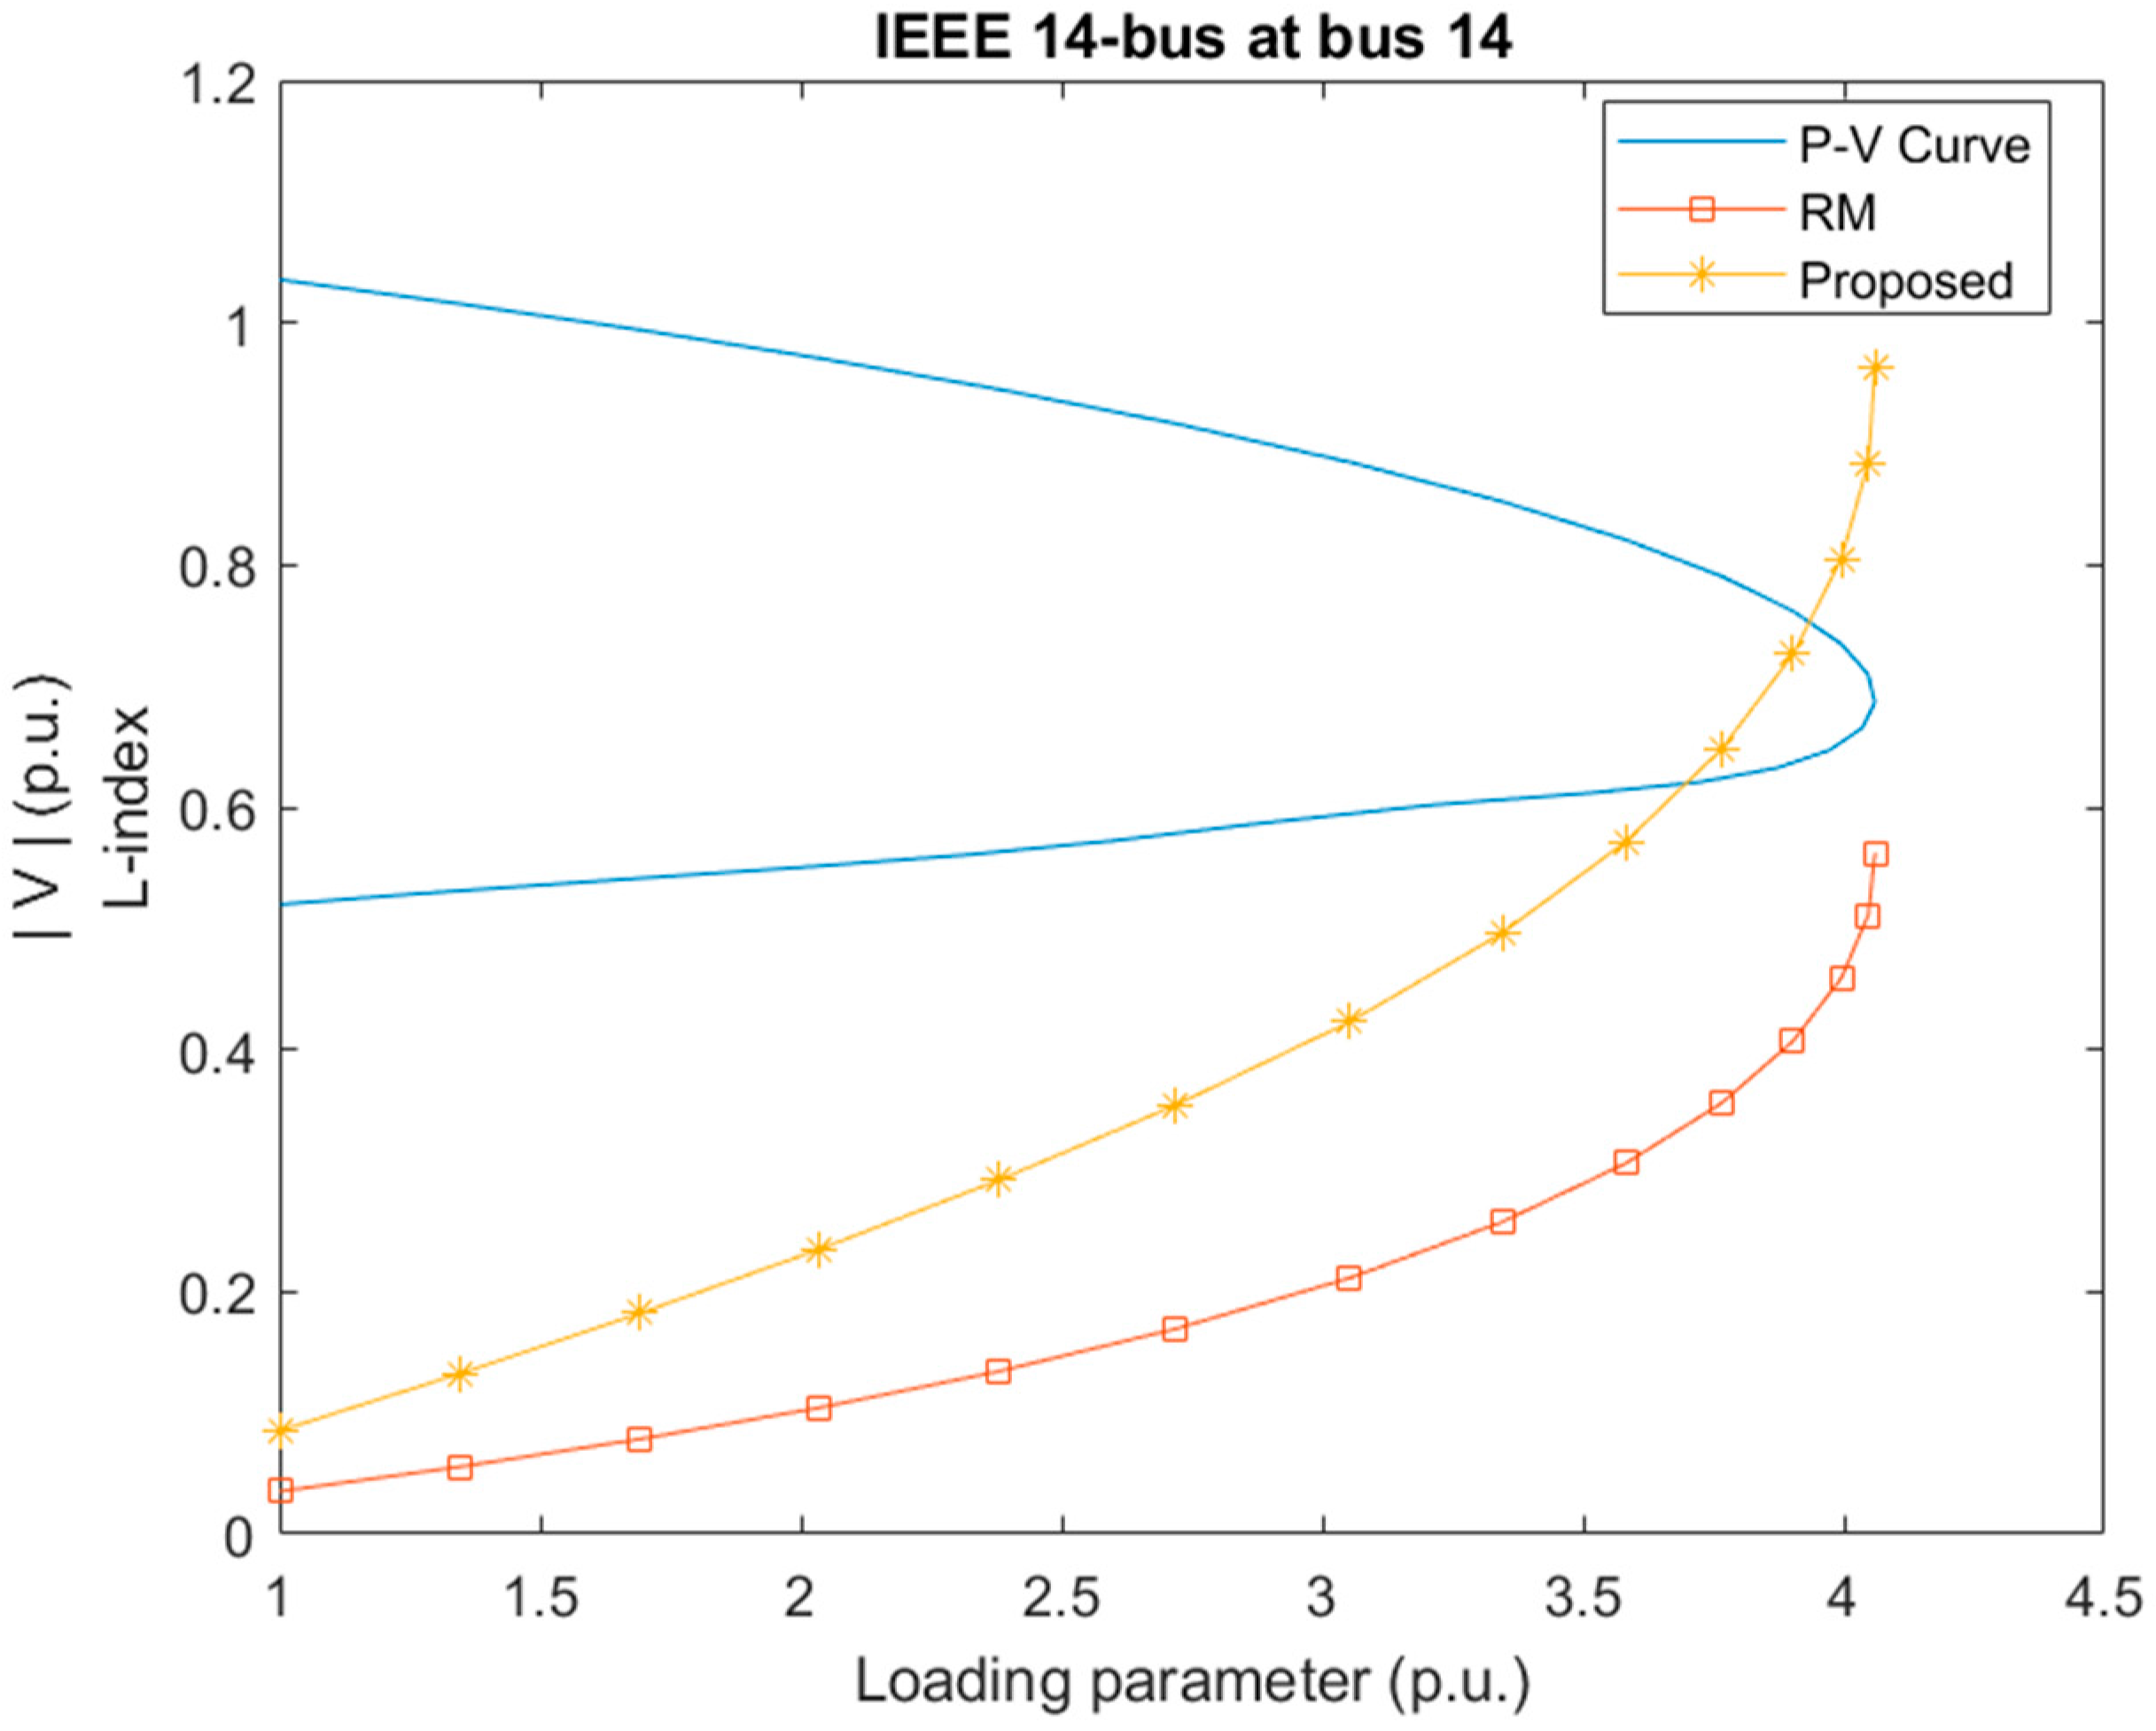
Figure 6 illustrates the system L-index curves, as well as the continuation curve of bus 14 during the load increase. In this figure, it apparently indicates that the enhanced L-index provided by the proposed method almost reaches the presumed limit of 1 at the voltage collapse point. However, the original L-index provided by the RM fails to do so.
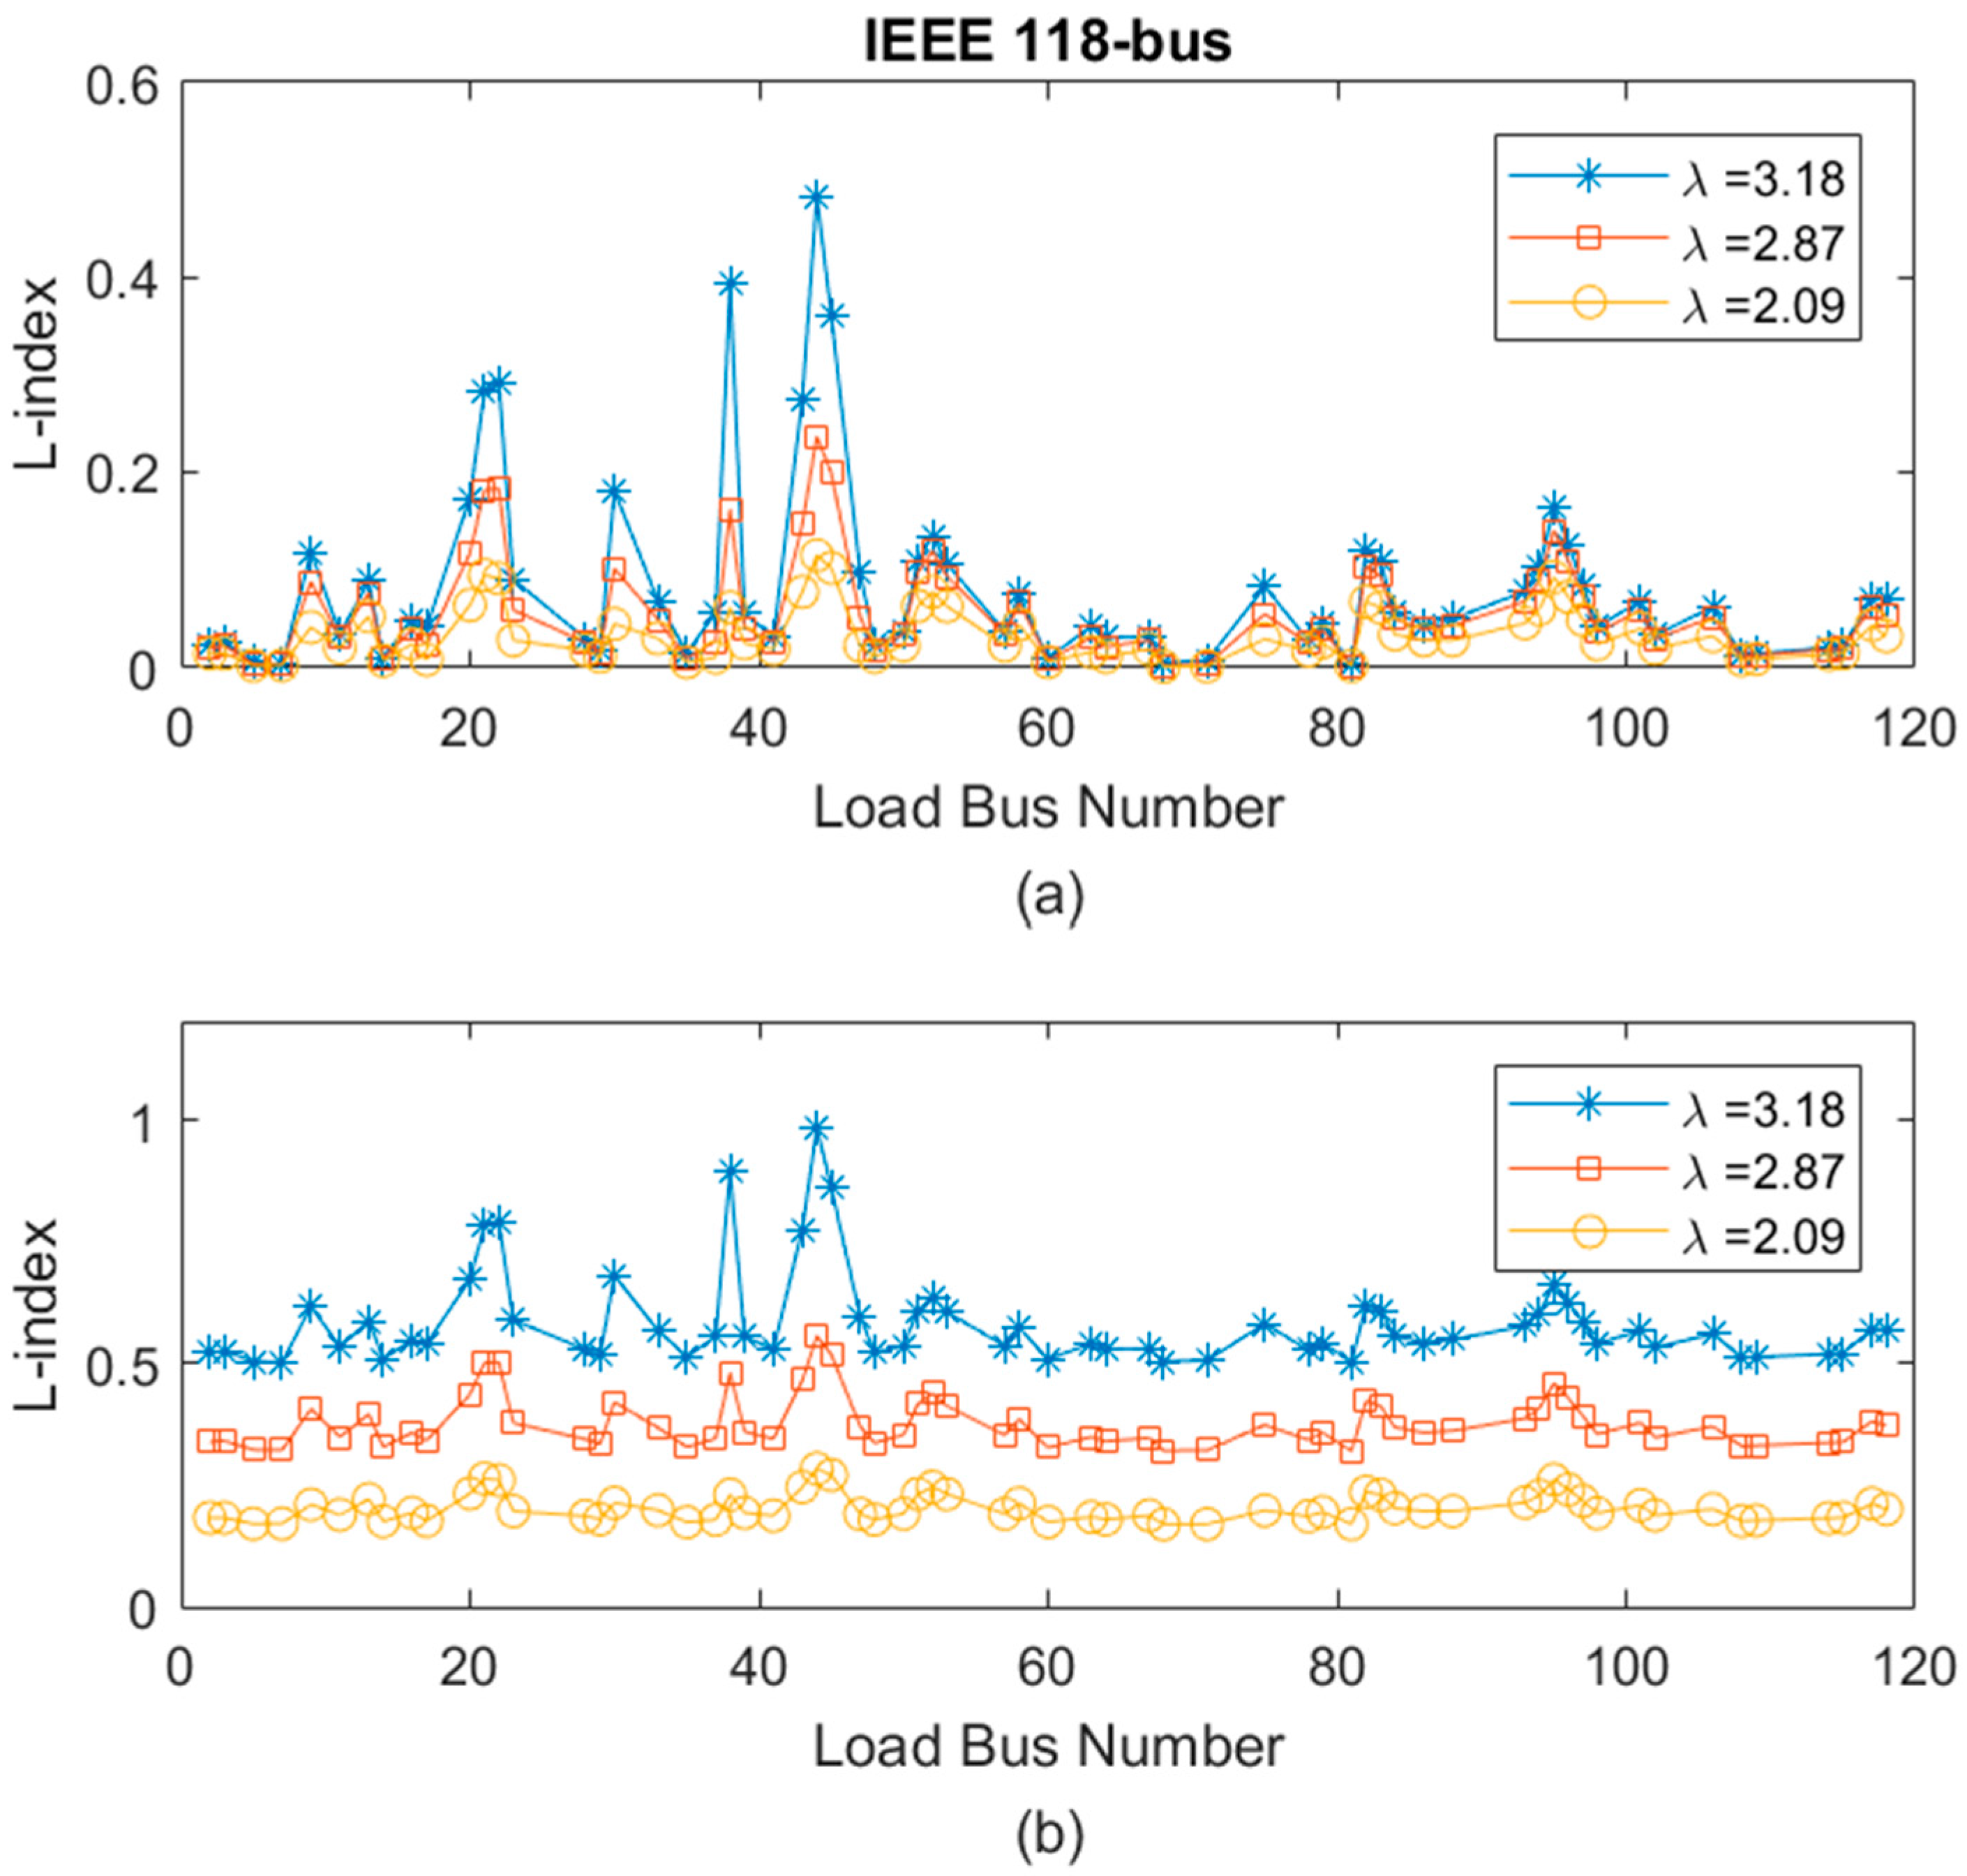
The second test system is the IEEE 118-bus network. The values of L indices of all the load buses at some selected load levels for the studied system are illustrated in
Figure 7, showing that bus 44, which has the maximum value for each load level, is identified as the weakest bus by the RM and the proposed method. Thus, the L-index of bus 44 is chosen as the overall system index.
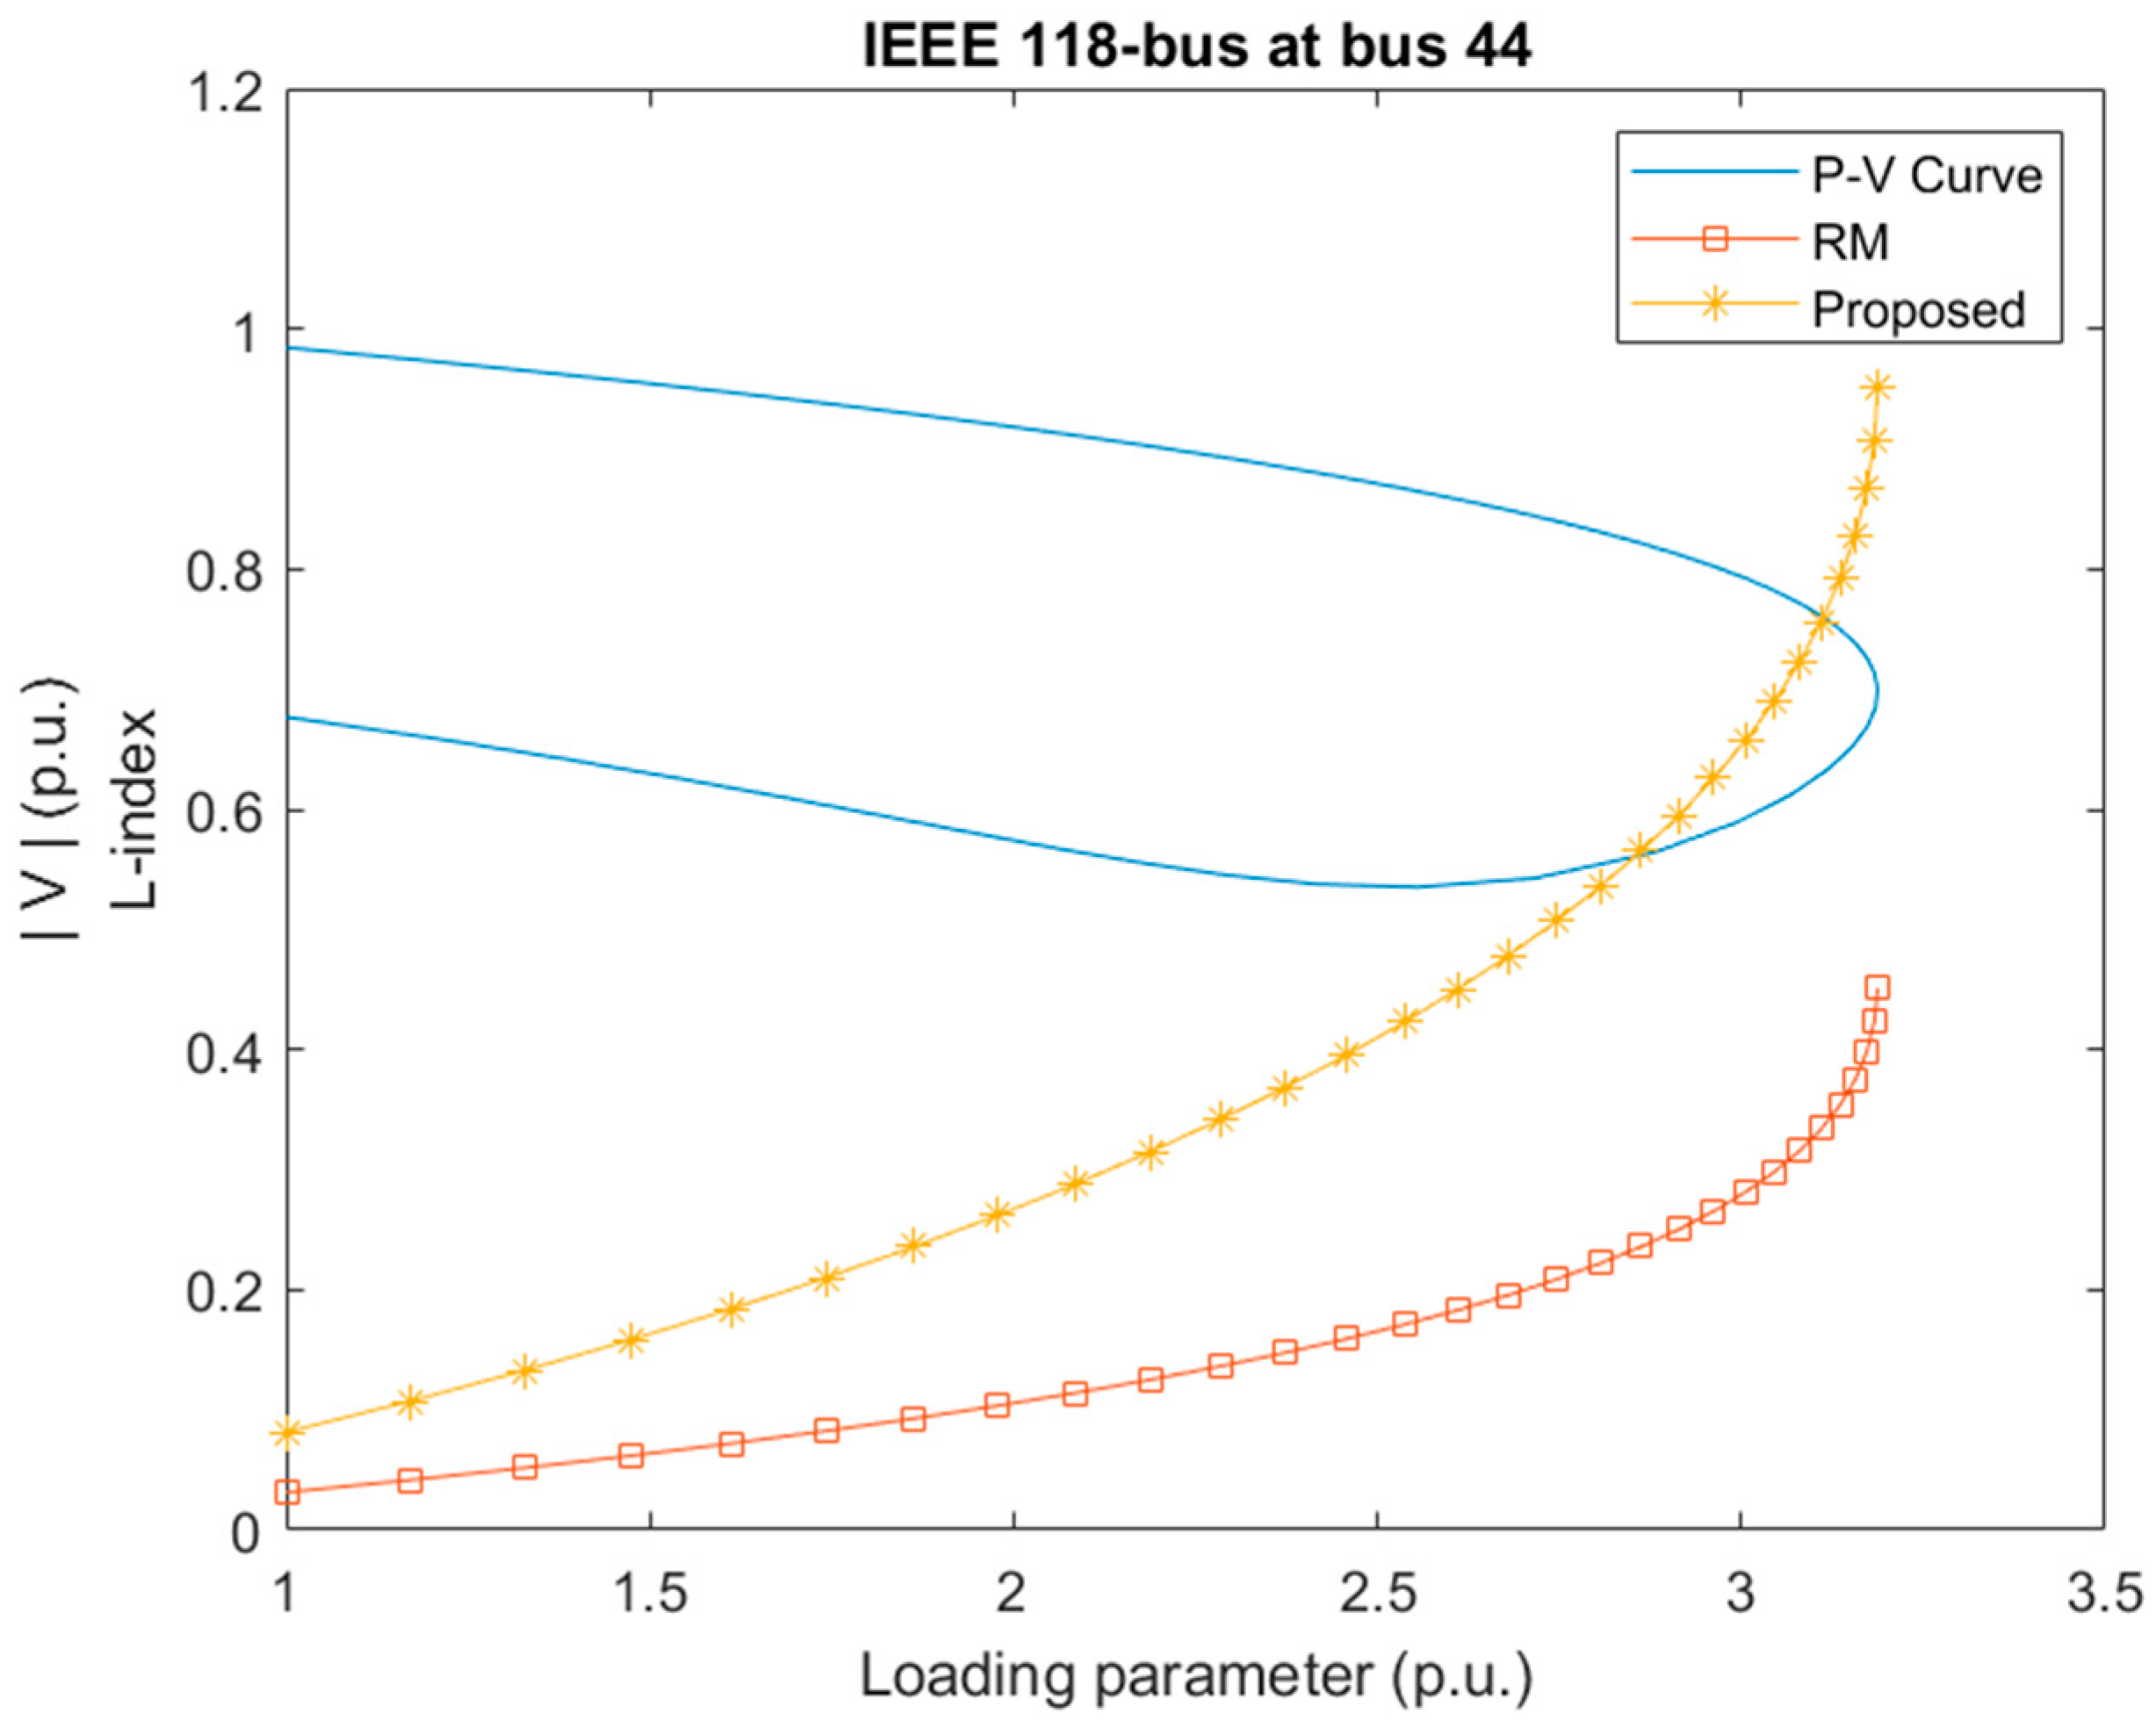
The results of the L-index at bus 44 for each load level is shown in
Figure 8. It indicates that the proposed method achieves the value of 1 at the voltage collapse point, whereas the RM method falls behind at 0.4835 for the same point. From
Figure 6 and
Figure 8, it is proven that proposed method can be successfully employed in voltage stability assessment.
4.2. Case Studies with Generator Q Limits Violation
To verify the effect of generator Q limits on voltage stability assessment, many cases have been studied, including different test systems, different initial load levels, different load increase directions, and different Q limit violations.
Table 1 lists some selected cases from those investigated cases.
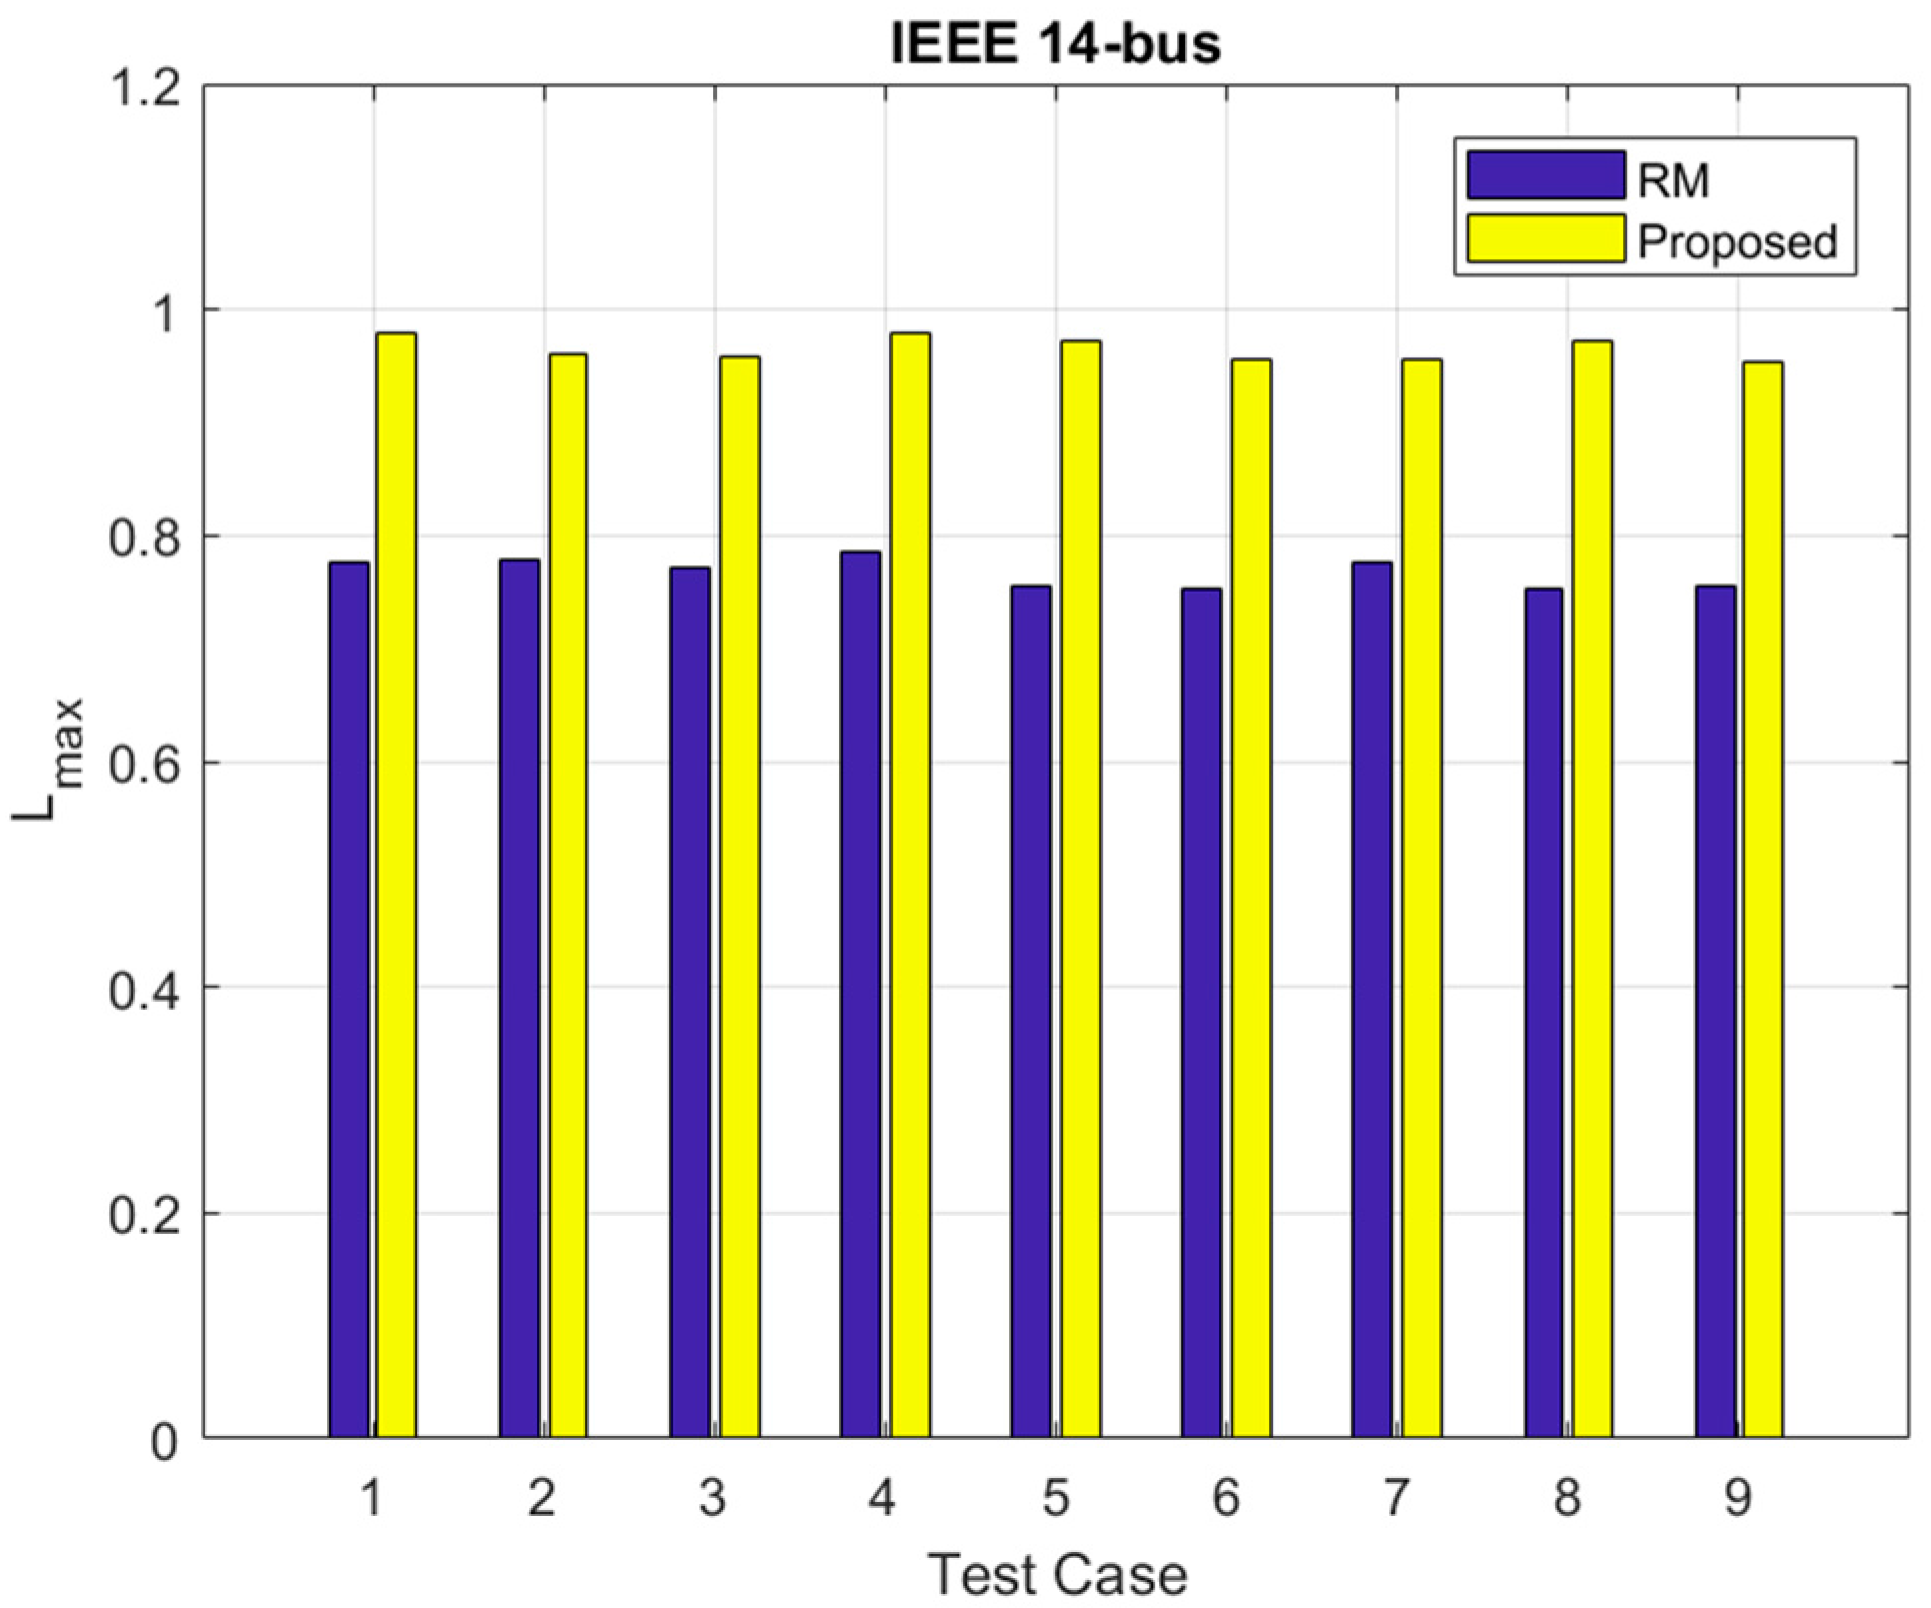
The comparisons with the selected test cases for IEEE 14-bus network are illustrated in
Figure 9, where the values of
corresponding to the test cases (on the
x-axis) are depicted on the y-axis of the figure. Due to the effects of generator Q limits violation, the values of
calculated by the RM are much lower than the critical value of 1. On the contrary, the results given by the proposed approach, which considers the GECMs, are very close to 1. That is, the proposed approach is able to determine the point of voltage collapse even under Q limits violation cases.
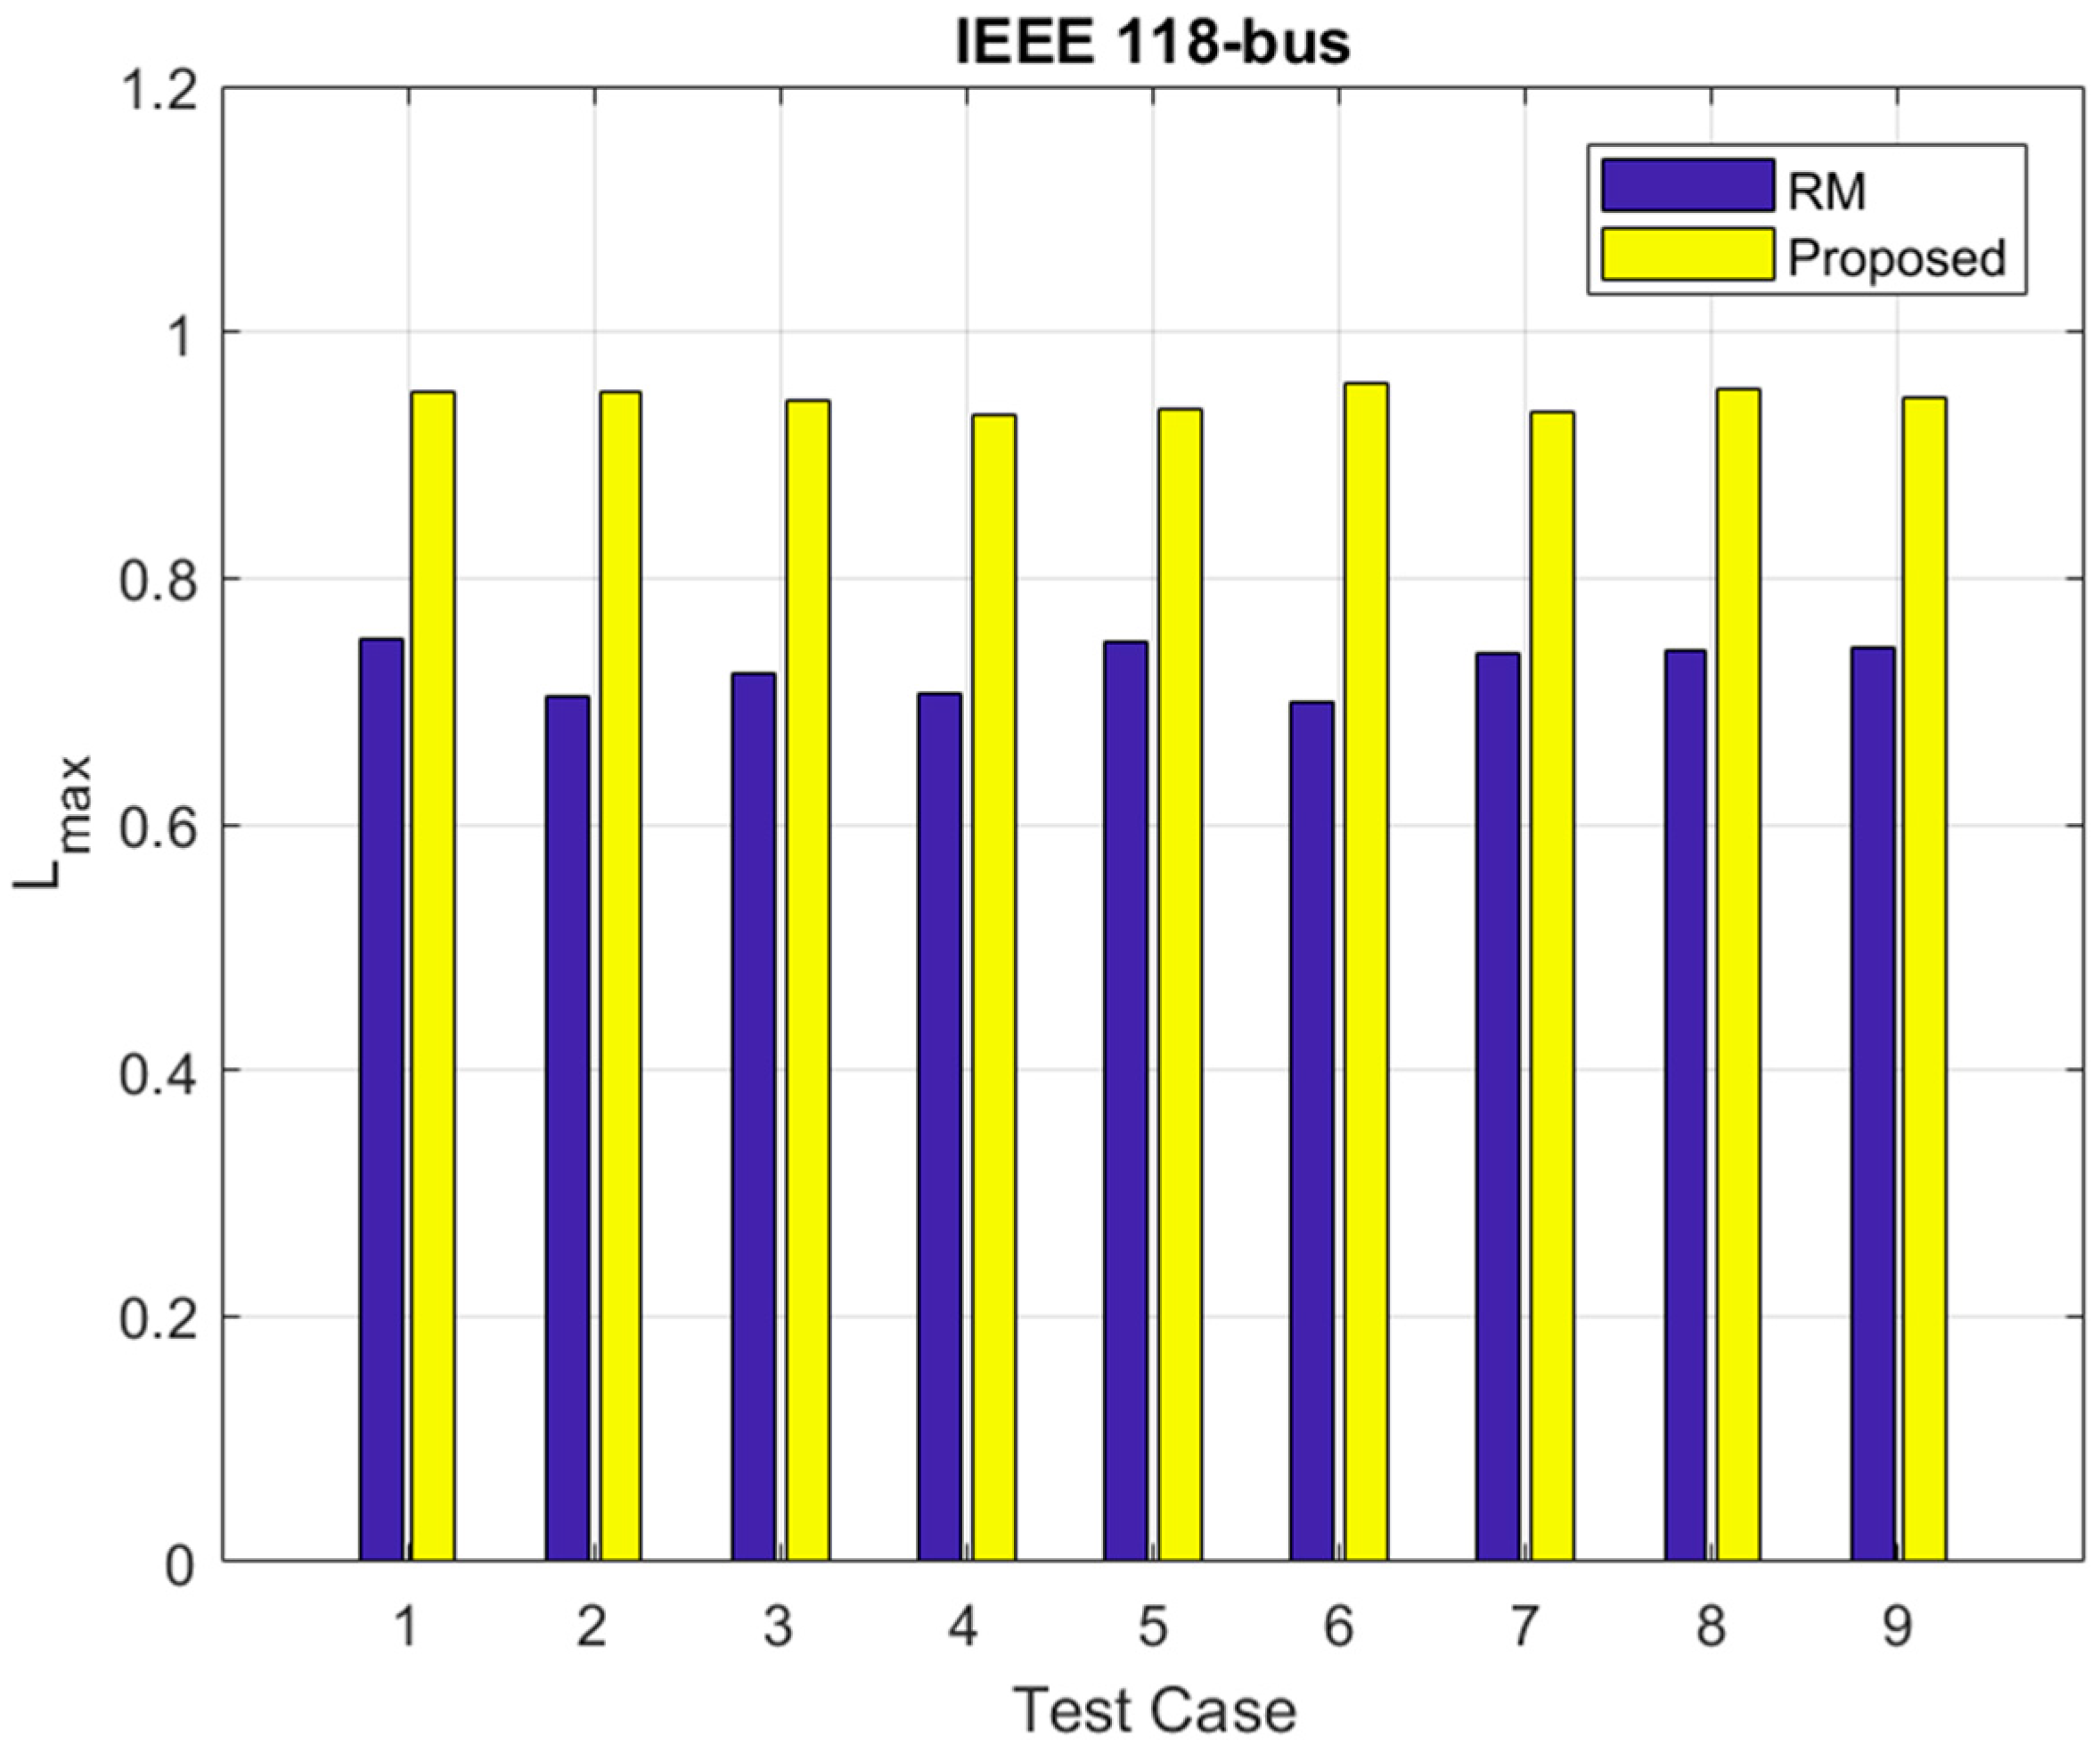
Figure 10 demonstrates the results for IEEE 118-bus network. When comparing the results in terms of
at voltage collapse point for each test case in
Figure 10, it indicates that the presented approach performs better than that of the RM, benefiting from the GECMs incorporated. In other words, the presented approach is more suitable to be applied to practical voltage stability assessment with consideration of generator Q limits.
4.3. Application to a Practical Power System
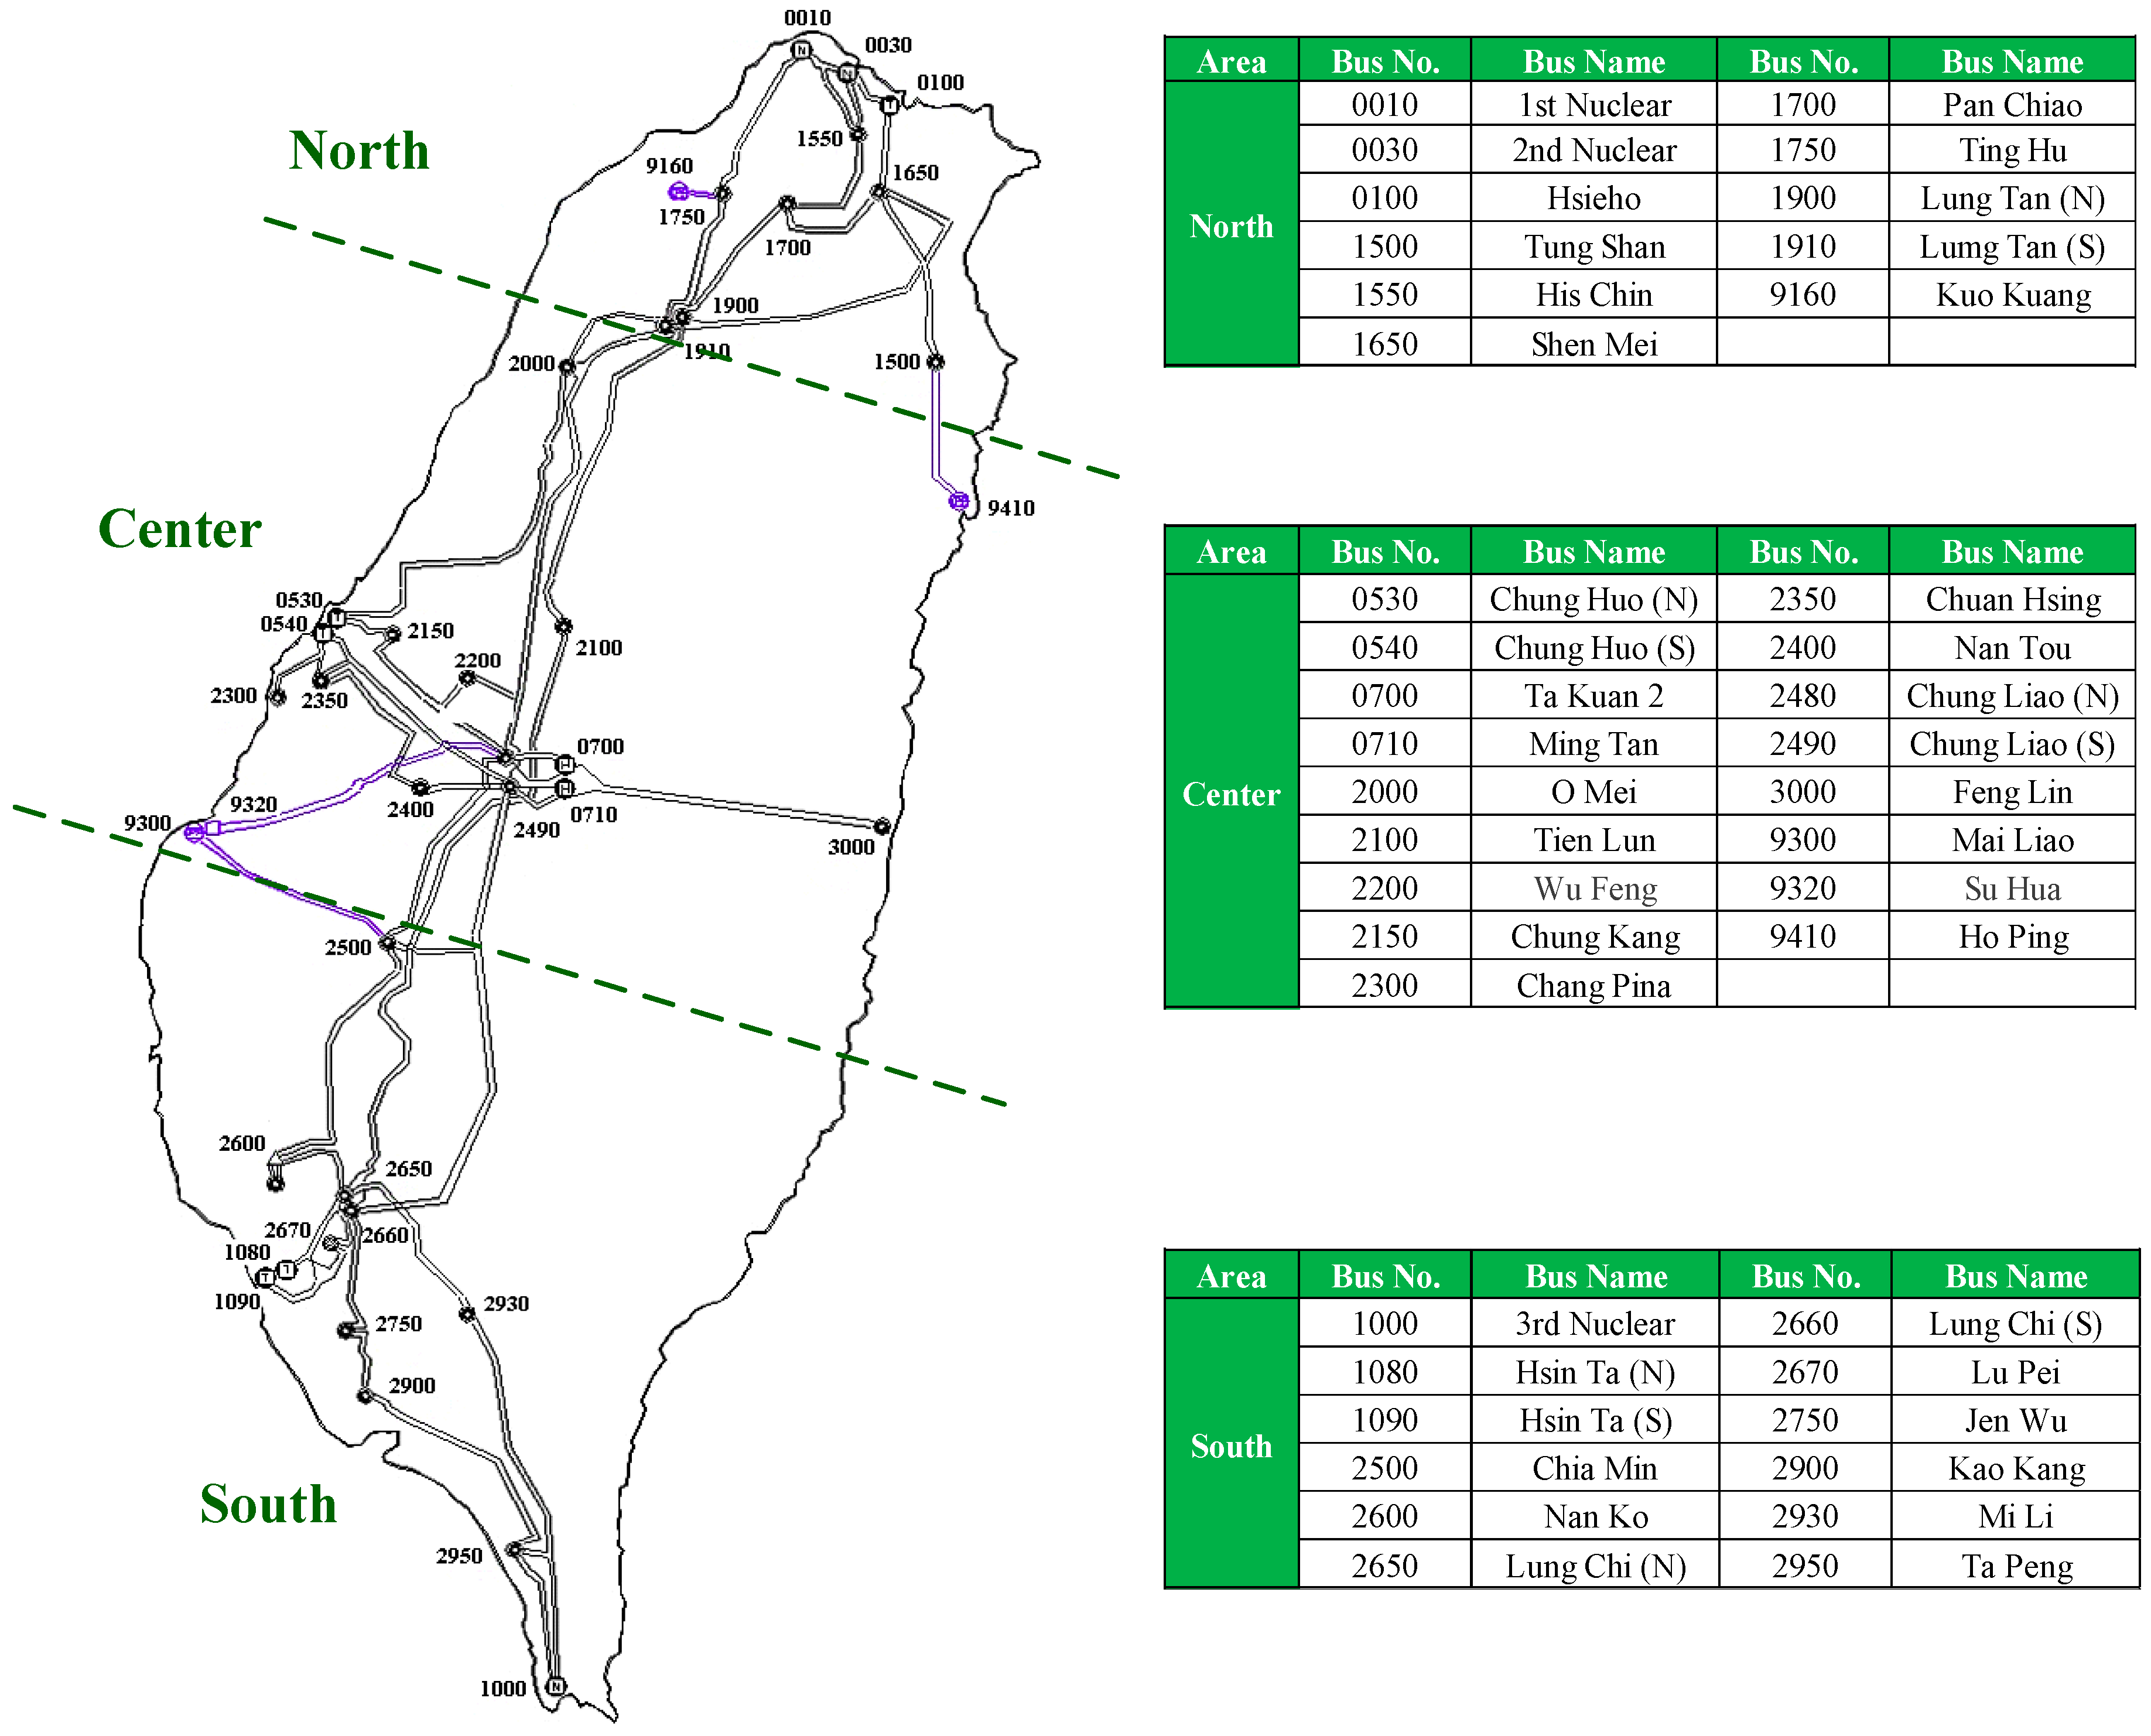
The proposed approach has been tested on an actual power system, the Taiwan Power (Taipower) system, composed of 1821 buses, 271 generators, 1538 loads, and 3319 branches.
The Taipower system is the only transmission system in Taiwan. Its transmission lines run from north to south, encompassing a distance of roughly 400 km. The Taipower system is divided into three regions: the northern, central, and southern regions. The regions are interconnected using several 345 kV transmission lines, as shown in
Figure 11. Indeed, the majority of the loads are distributed in northern Taiwan, whereas most of the power plants are located in central and southern Taiwan. In this manner, most of the power in Taiwan is sent from the central or southern region to the northern region. This may result in severe imbalances between supply and demand. Thus, voltage collapse has always been a concern in the Taipower system.
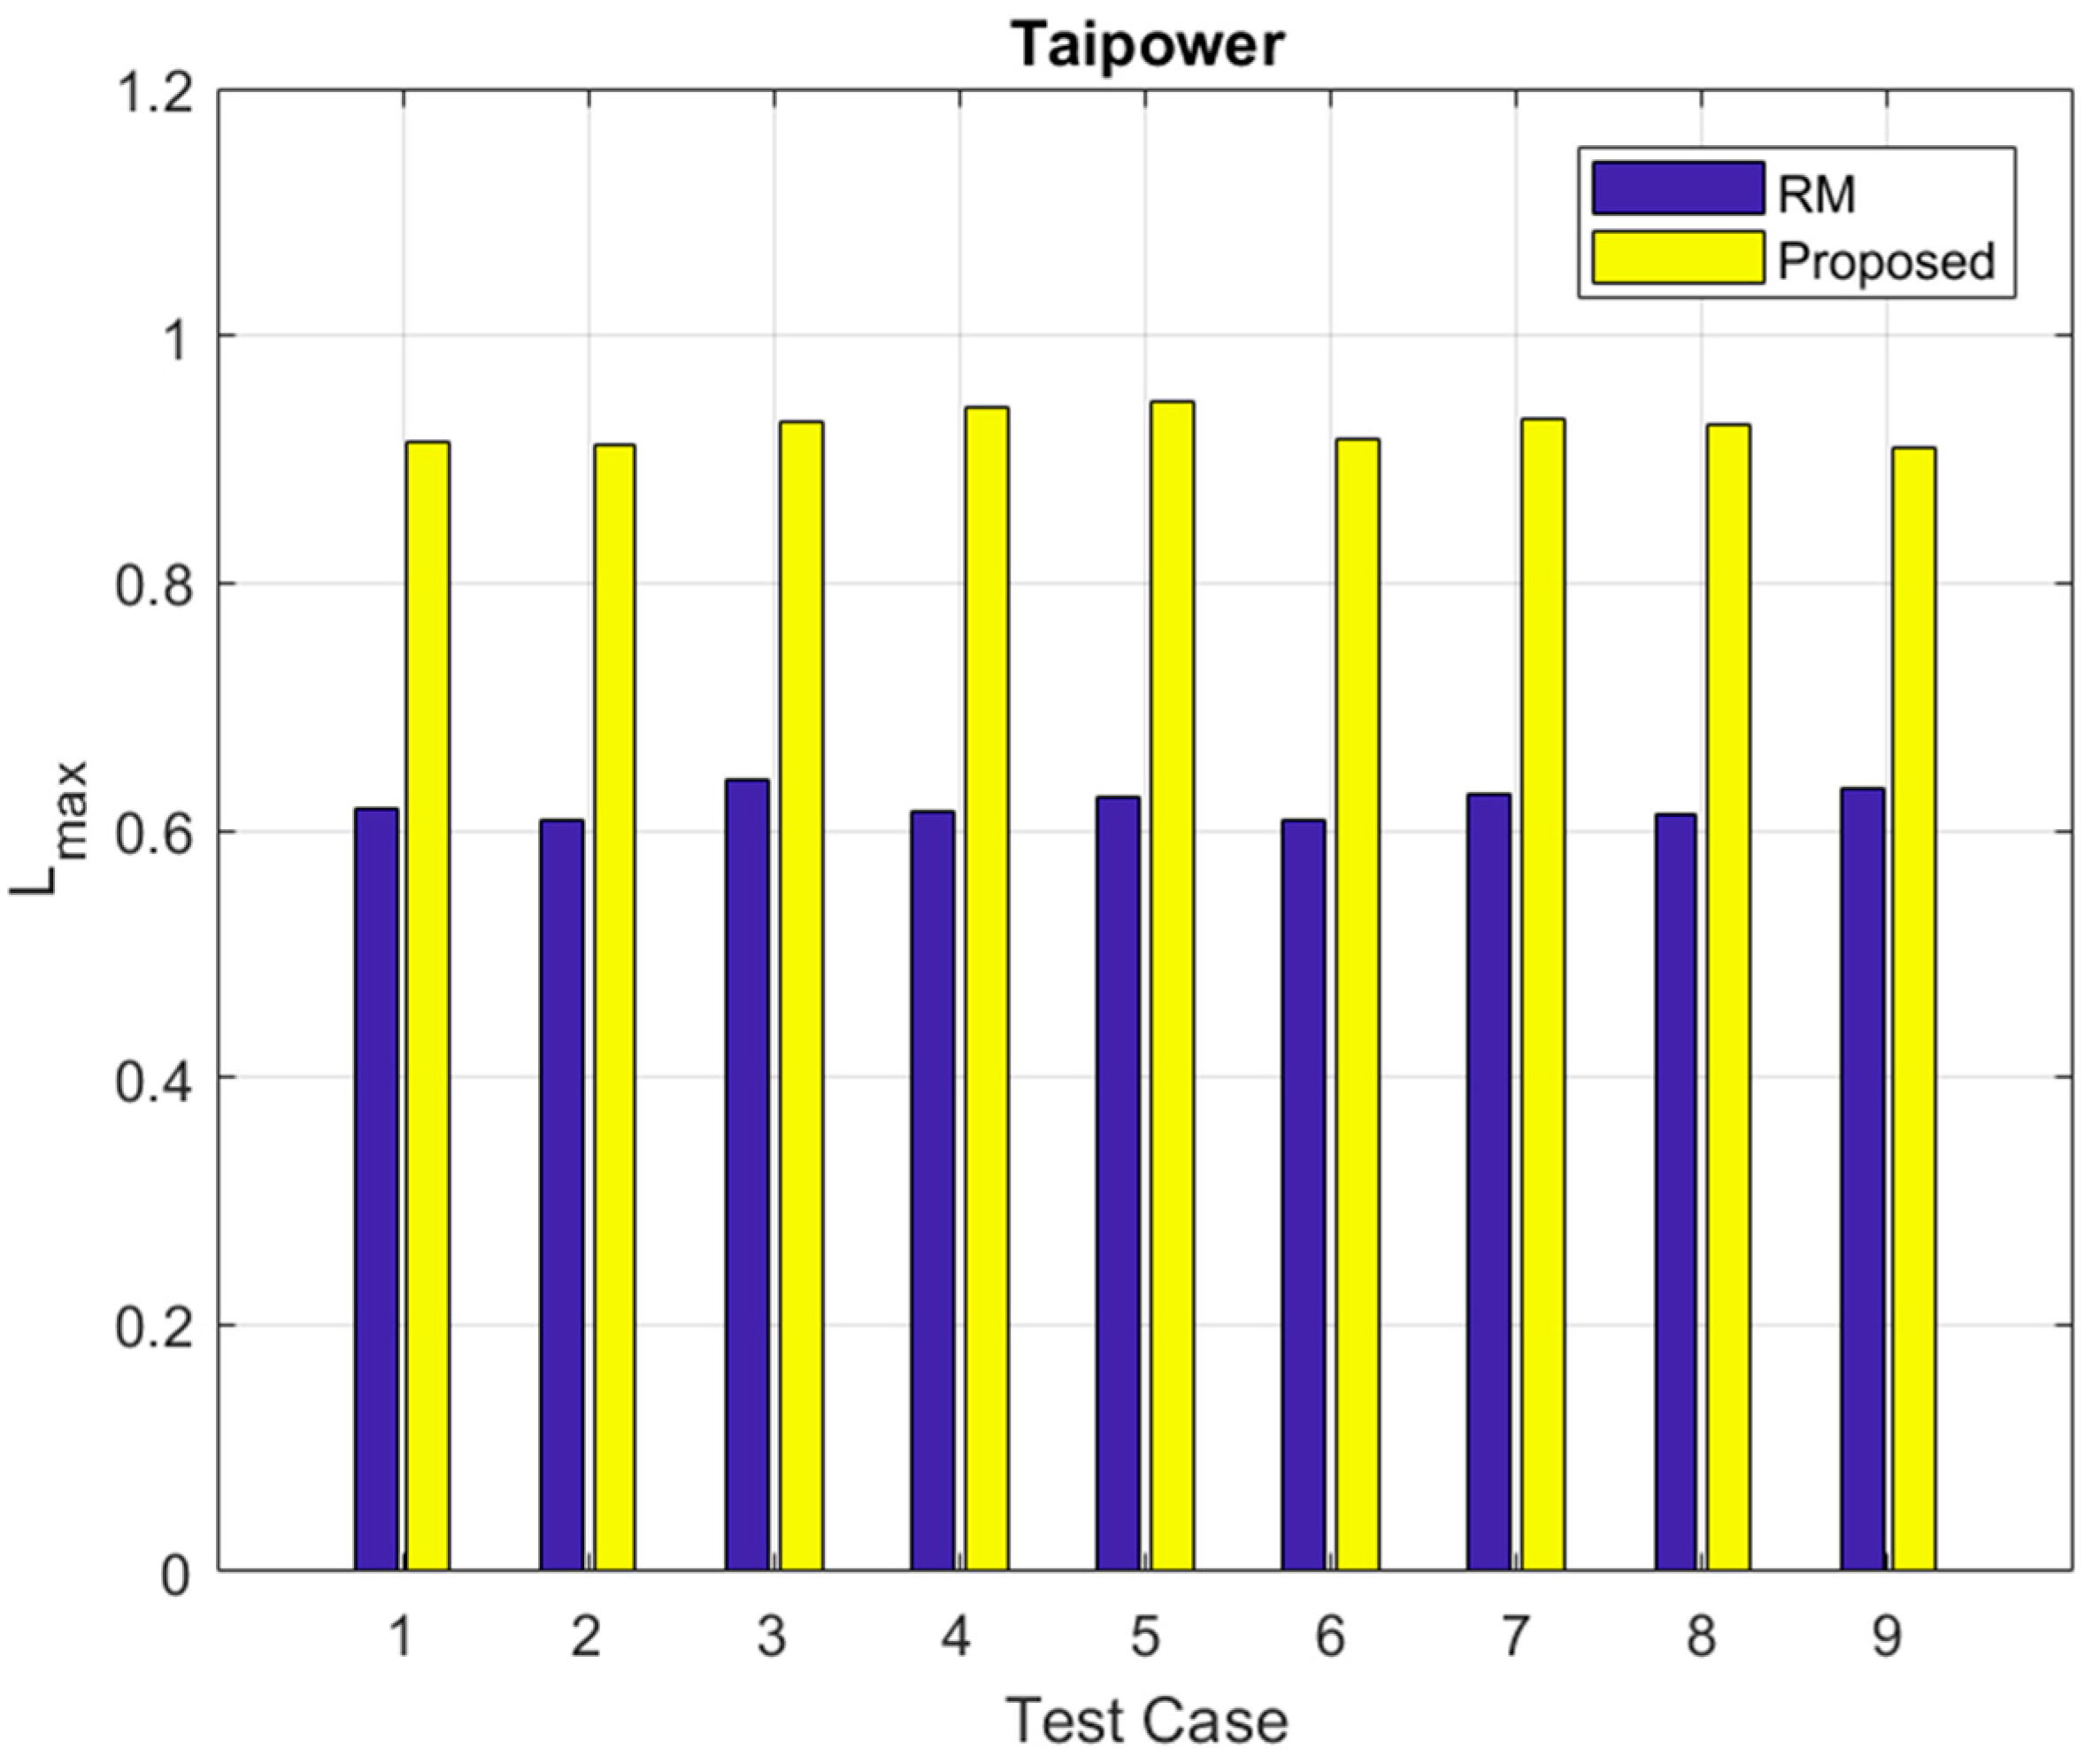
A series of simulations with respect to various loading conditions and Q limit violations has been conducted. The results in terms of
for the test cases listed in
Table 1 are shown in
Figure 12. From the shown figure, it reveals that the values of
given by the proposed method are very close to 1. However, the values of
given by the RM are much less than 1. This means that the presented method can be utilized as an absolute indicator in voltage stability analysis.
4.4. Consideration of ZIP Load Model
Since voltage stability is affected by load characteristics, the composite ZIP load model, which consists of constant impedance, constant current, and constant power, is considered in this paper as well. The ZIP model is given by
where
and
are the active and reactive power demand at nominal voltage
, respectively;
,
, and
are constants and
. In this work, the composite model with 20% constant impedance, 20% constant current, and 60% constant power are considered. Thus, those three constants are, respectively, set to be
,
, and
.
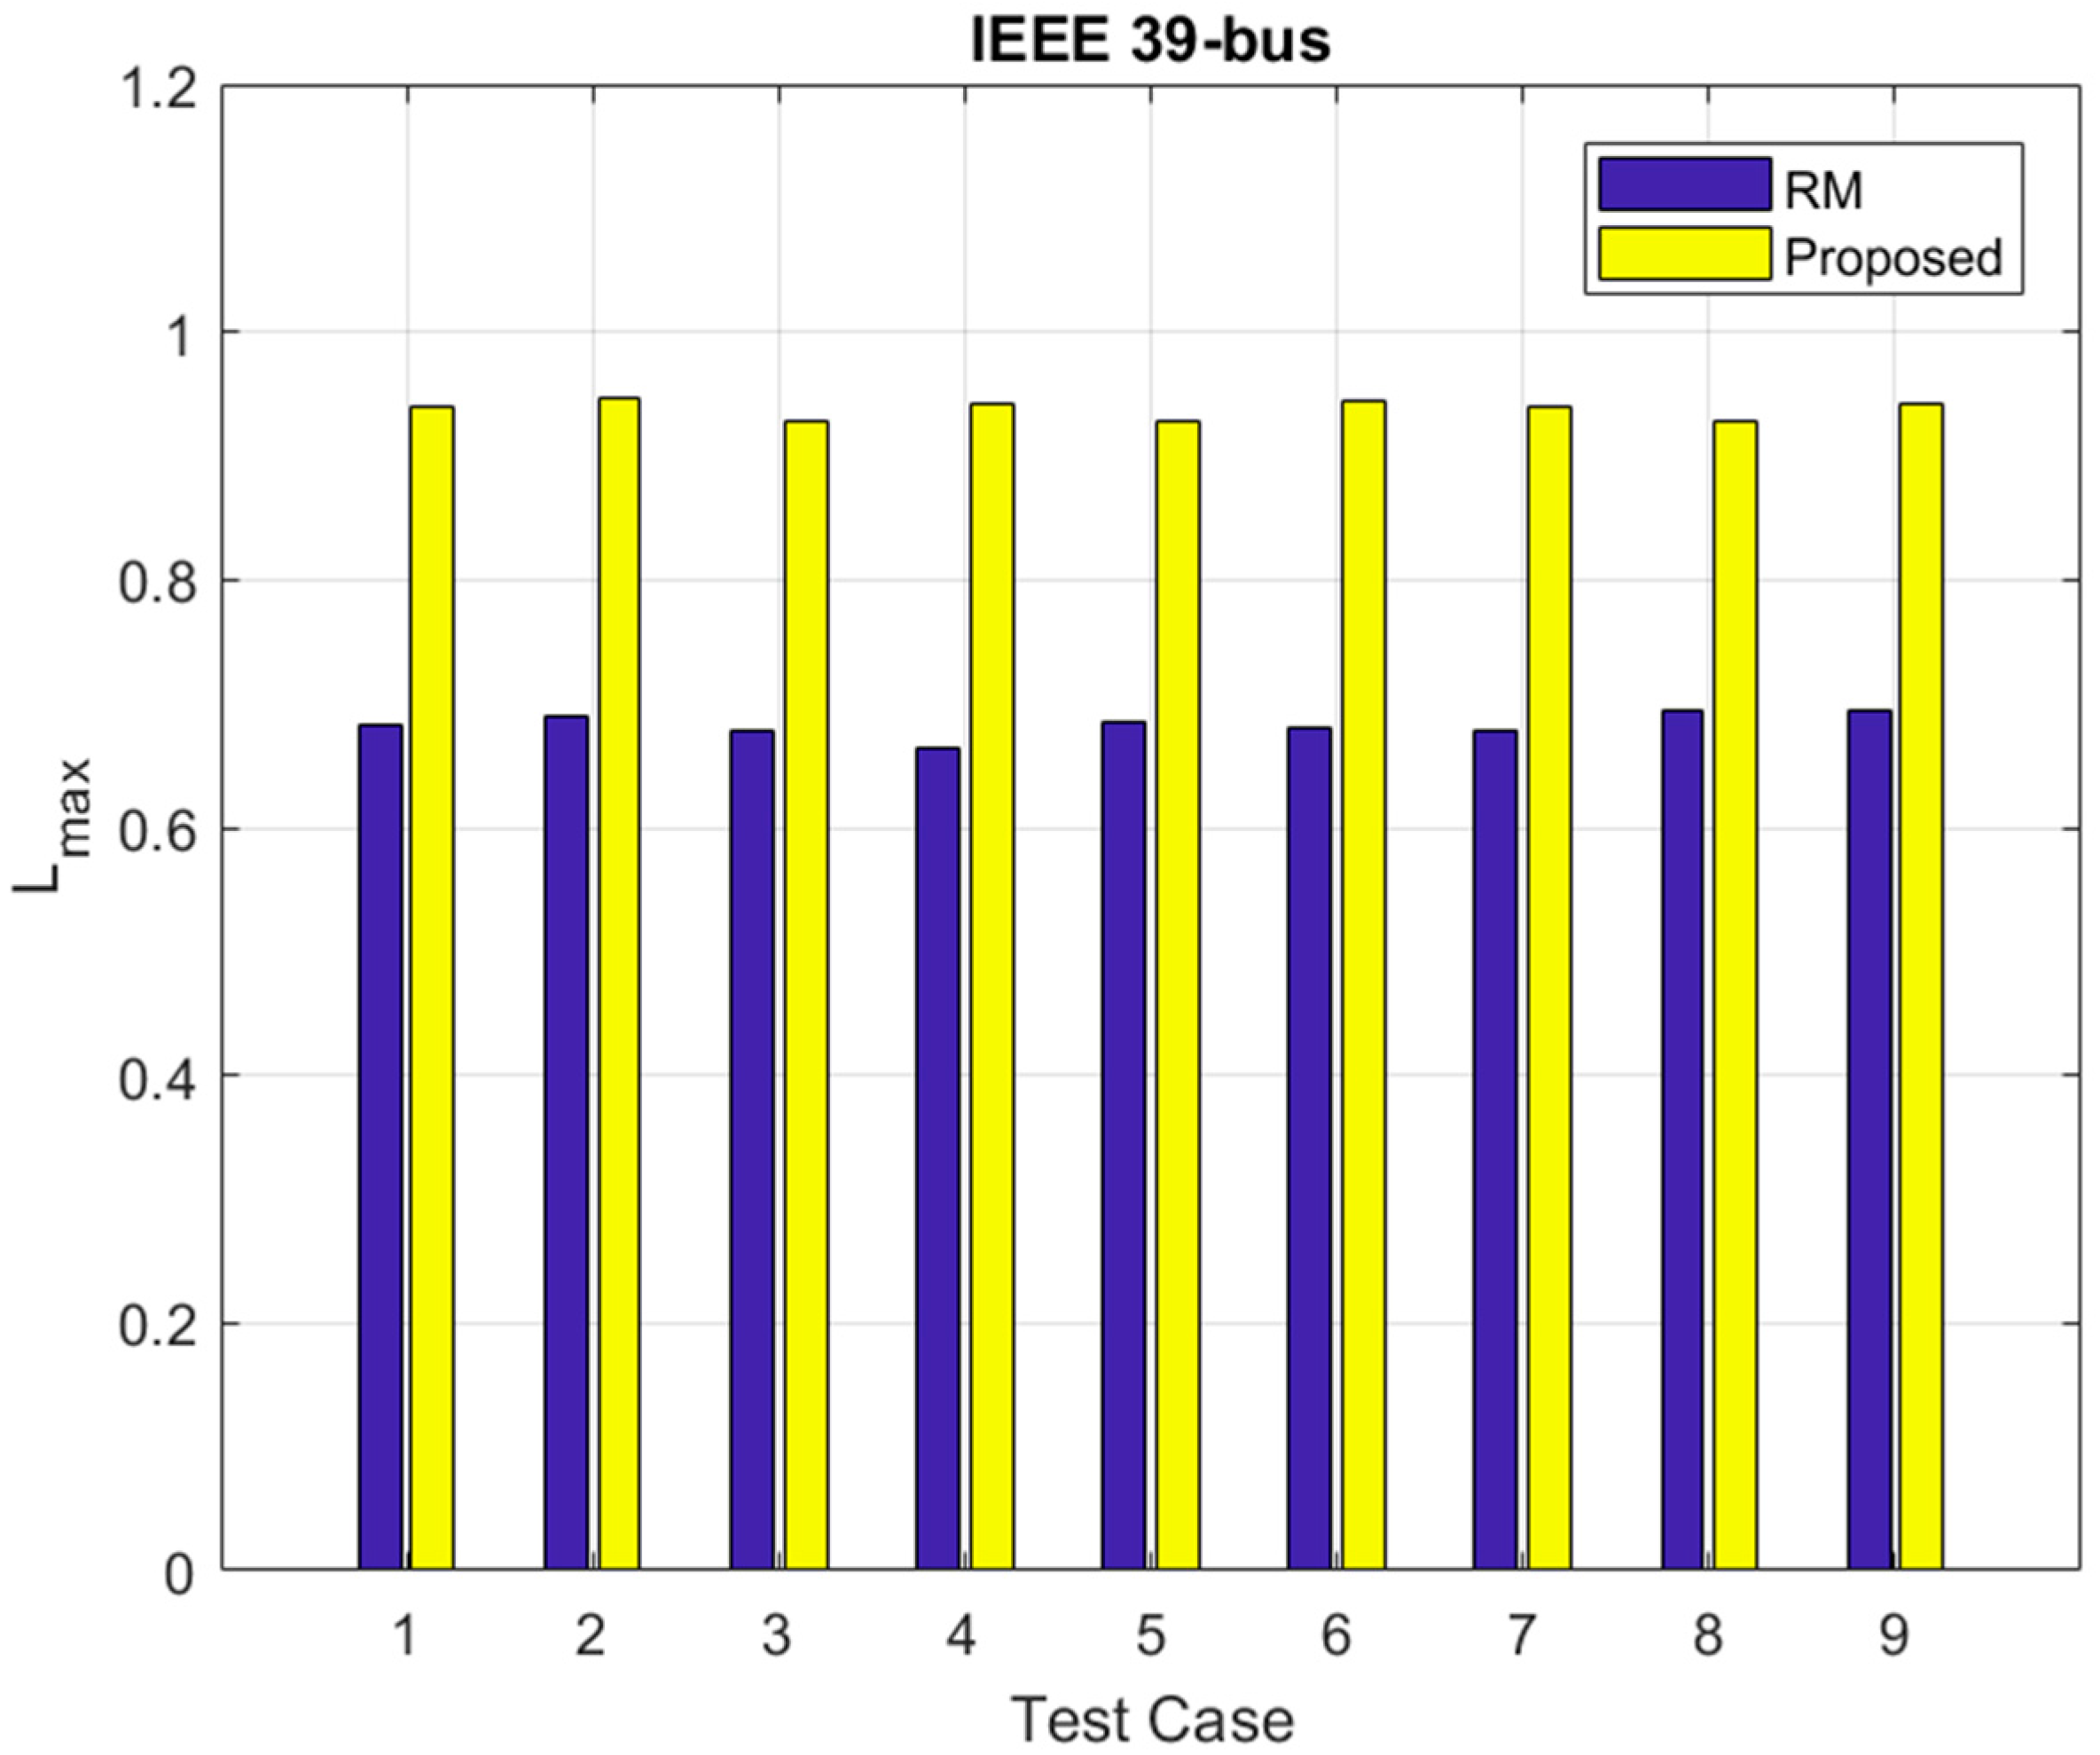
The IEEE 39-bus system with ZIP load model is utilized as a test example to demonstrate the effectiveness of the presented approach. The considered system comprises of 39 buses, 47 branches, 18 loads, and 10 generators. A lot of simulations have been conducted on this test system. The results based on the cases given in
Table 1 are illustrated in
Figure 13, showing that the proposed approach is superior over the RM even under the consideration of composite load model.


