1. Introduction
DC/DC converters have been widely used to provide constant voltage or current [
1,
2,
3,
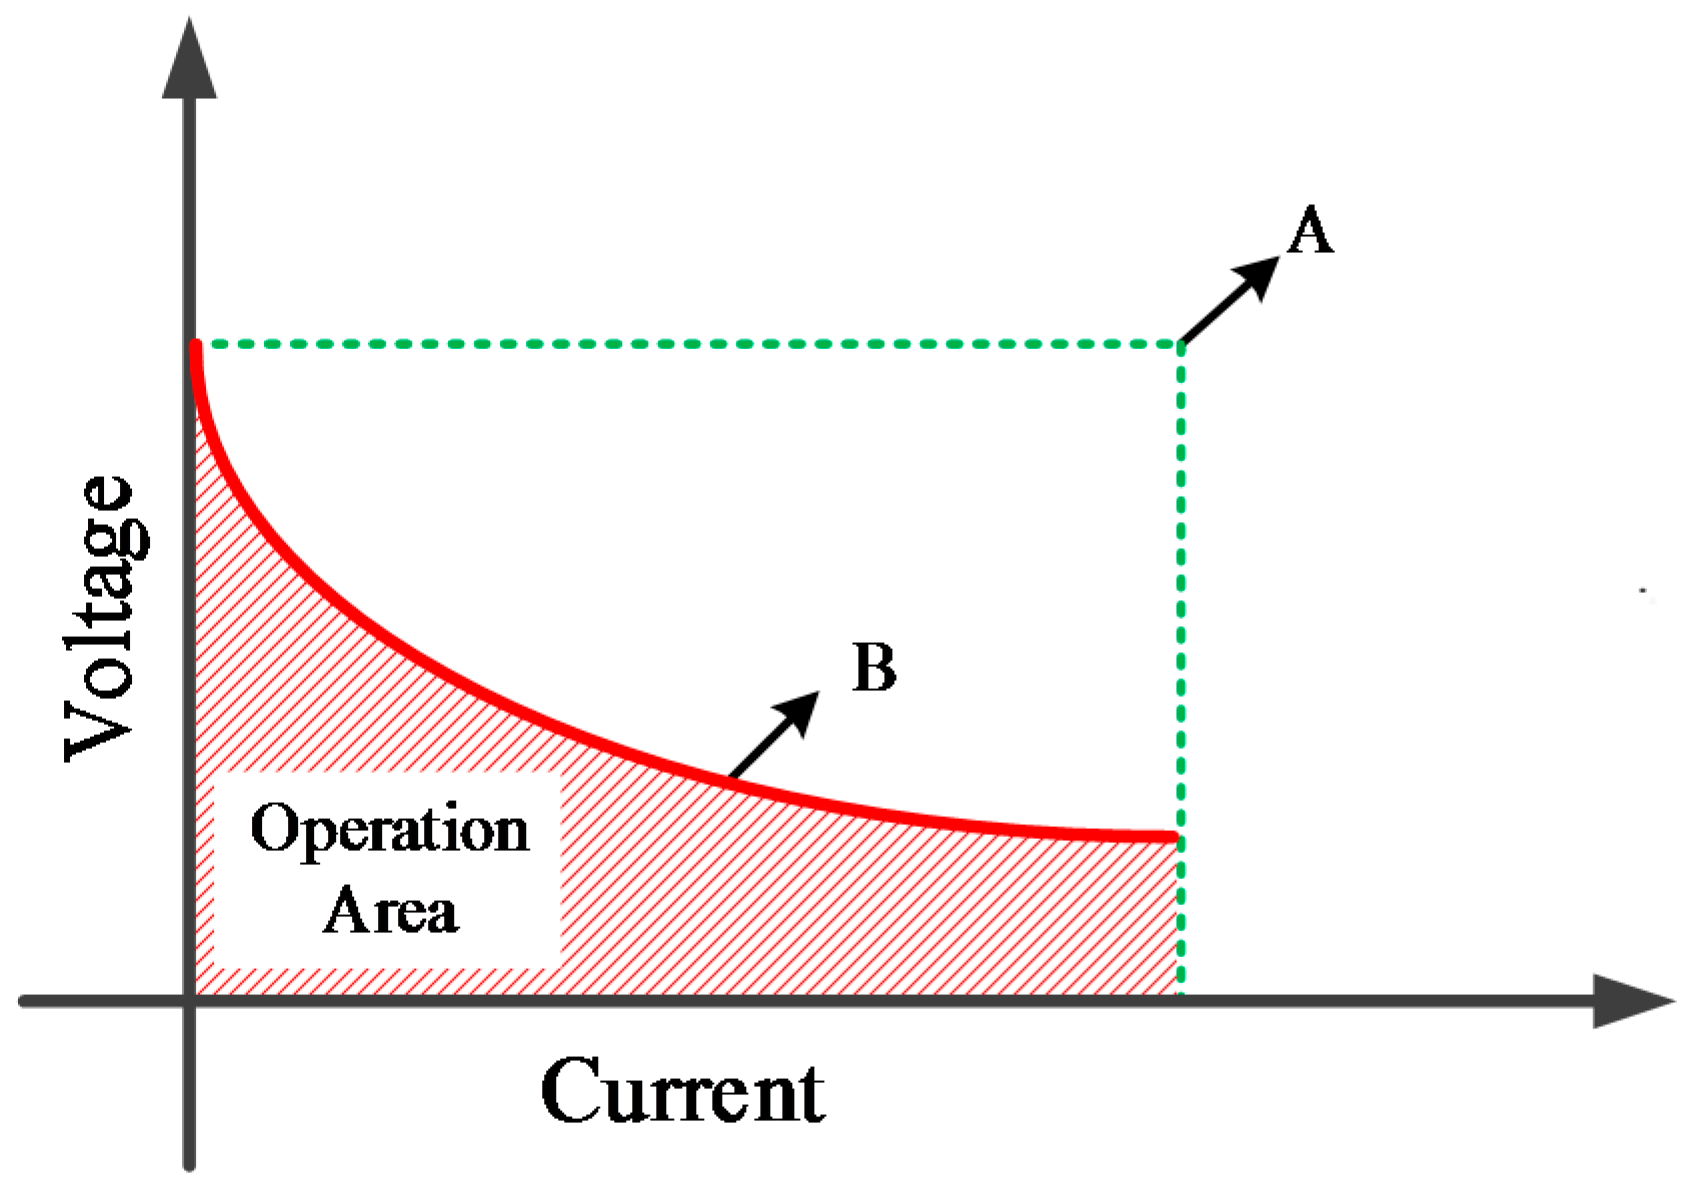
4]. When the DC/DC converter is controlled as a voltage source, the voltage is constant and the current varies from zero to maximum value. When the converter is used as a current source, the current is constant and voltage varies from zero to maximum value. Therefore, the operation area is the rectangle where most converters work, such as battery charger, DC power supply, UPS, etc.
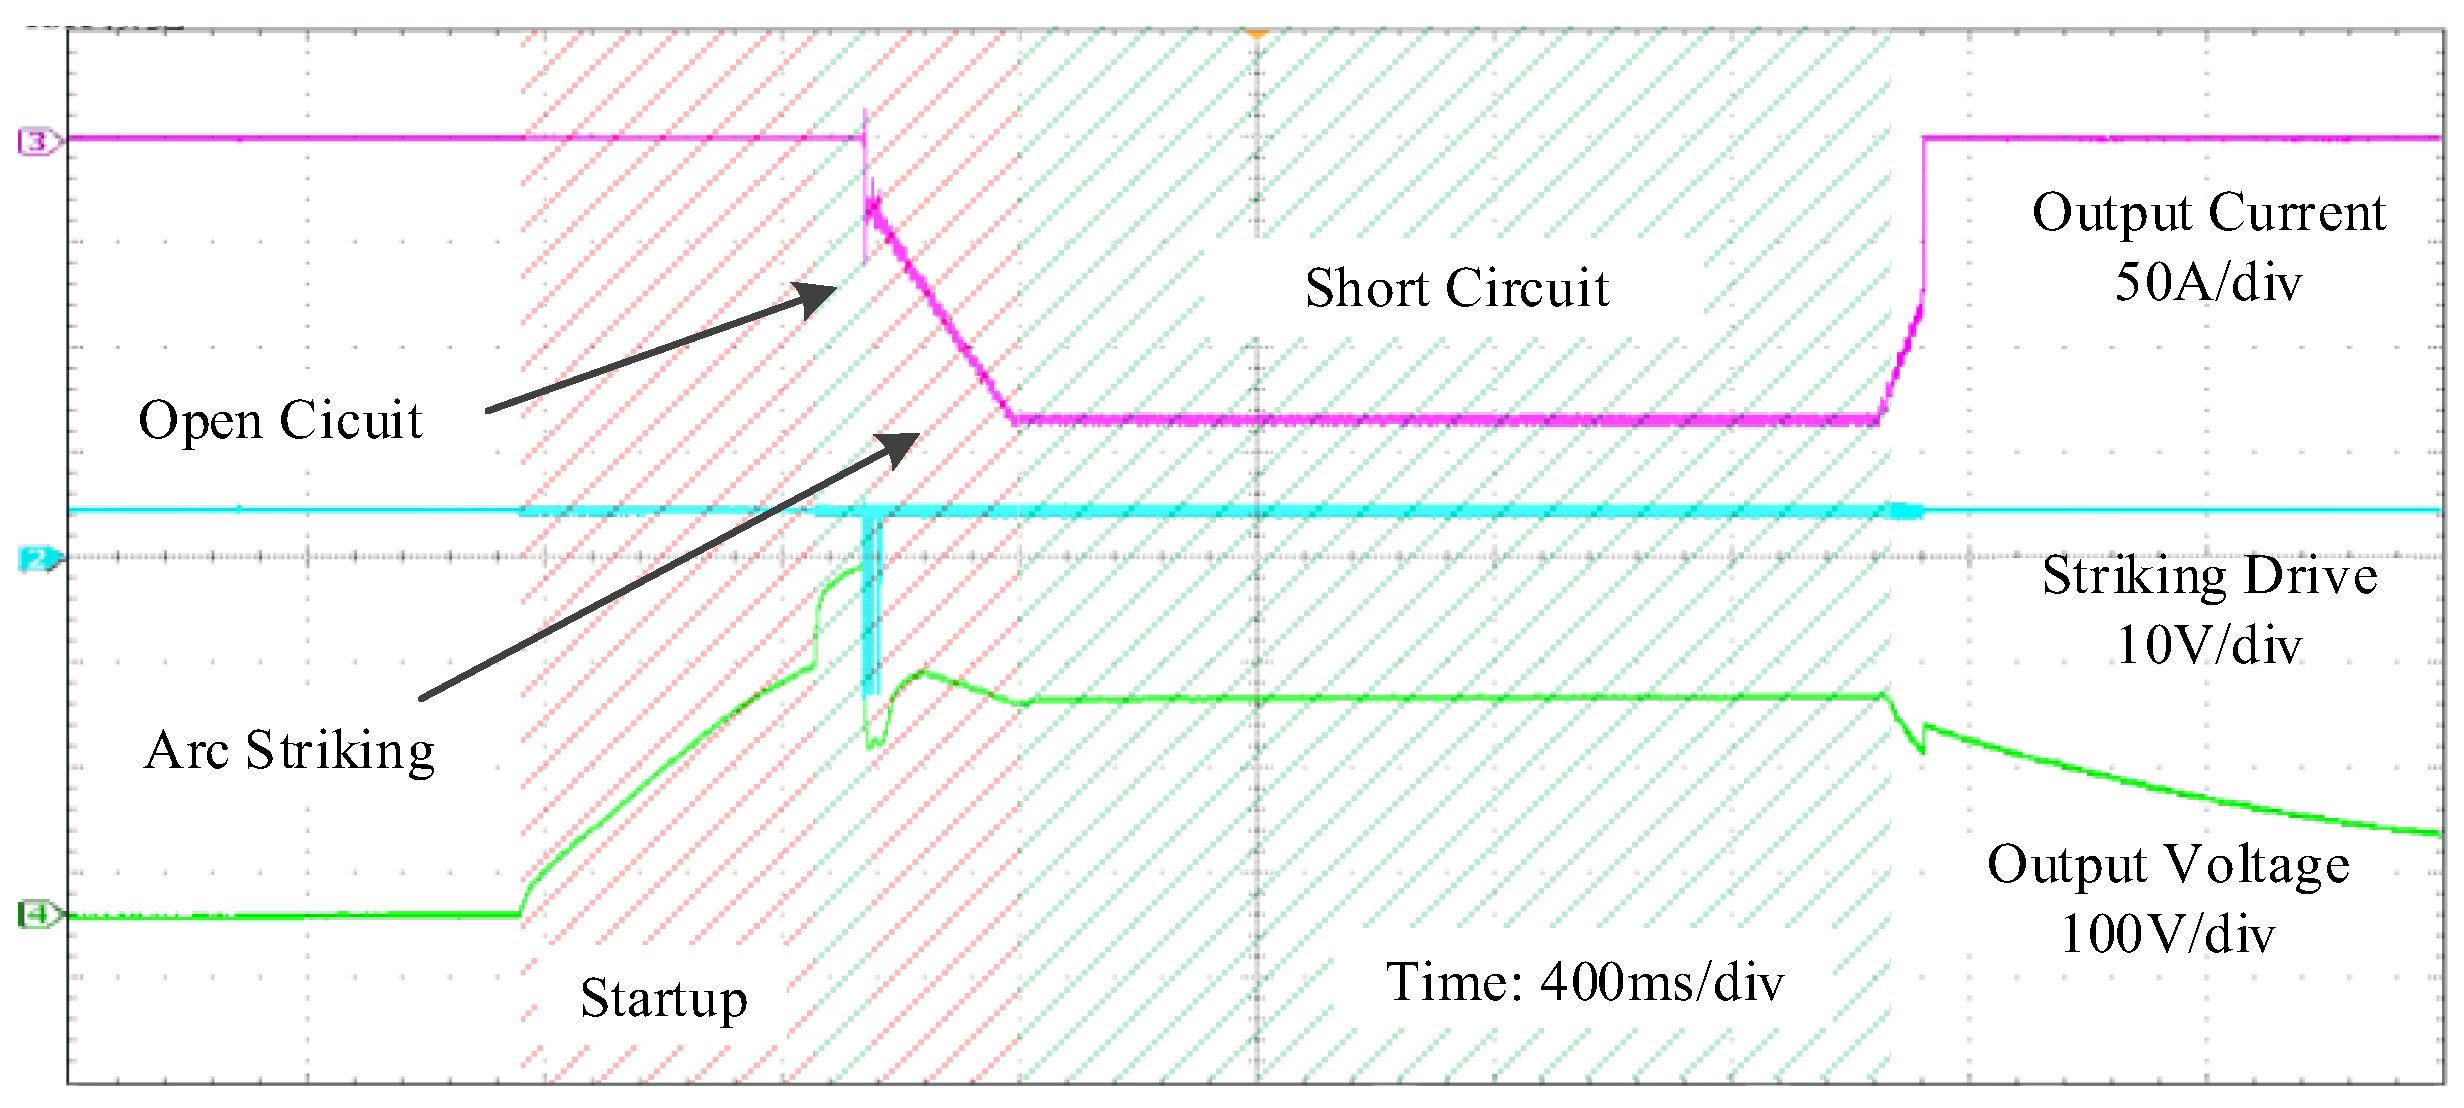
However, in some special applications, the voltage and current are not constant but vary with the loads. For example, the voltage–current curve of the plasma cutting is shown in
Figure 1. In startup, the output voltage rises to maximum value slowly without output current, providing a high output voltage to build a strong electrical field to produce air plasma. Then the arc striking circuit begins to work and the air is broken down with a low resistance, making the output current rise and output voltage fall quickly. Finally, the output current is regulated to the desired value [
5,
6]. In these applications, the power supply’s voltage falls as the current rises, leading to a concave operation area (shown in
Figure 2), which is smaller than the rectangular area.
Most DC/DC converters are a linear system in which the output voltage or current is decided by control signals like duty cycle or phase shift, and are not influenced by the loads [
7,
8,
9]. Therefore, the operation area of these converters is similar to a rectangle. When these converters are used to provide energy for some special applications, like plasma arc cutting, the operational area of the converters will be far larger than the requirements of the applications. In
Figure 2, the maximum power needed by the application is at point B, but the maximum power the converters can generate is at point A. The redundant design could increase the converters’ cost and volume. At the same time, the converter’s efficiency is reduced.
In a resonant DC/DC converter, the output voltage or current will vary with the loads, even using the same switching frequency [
10].
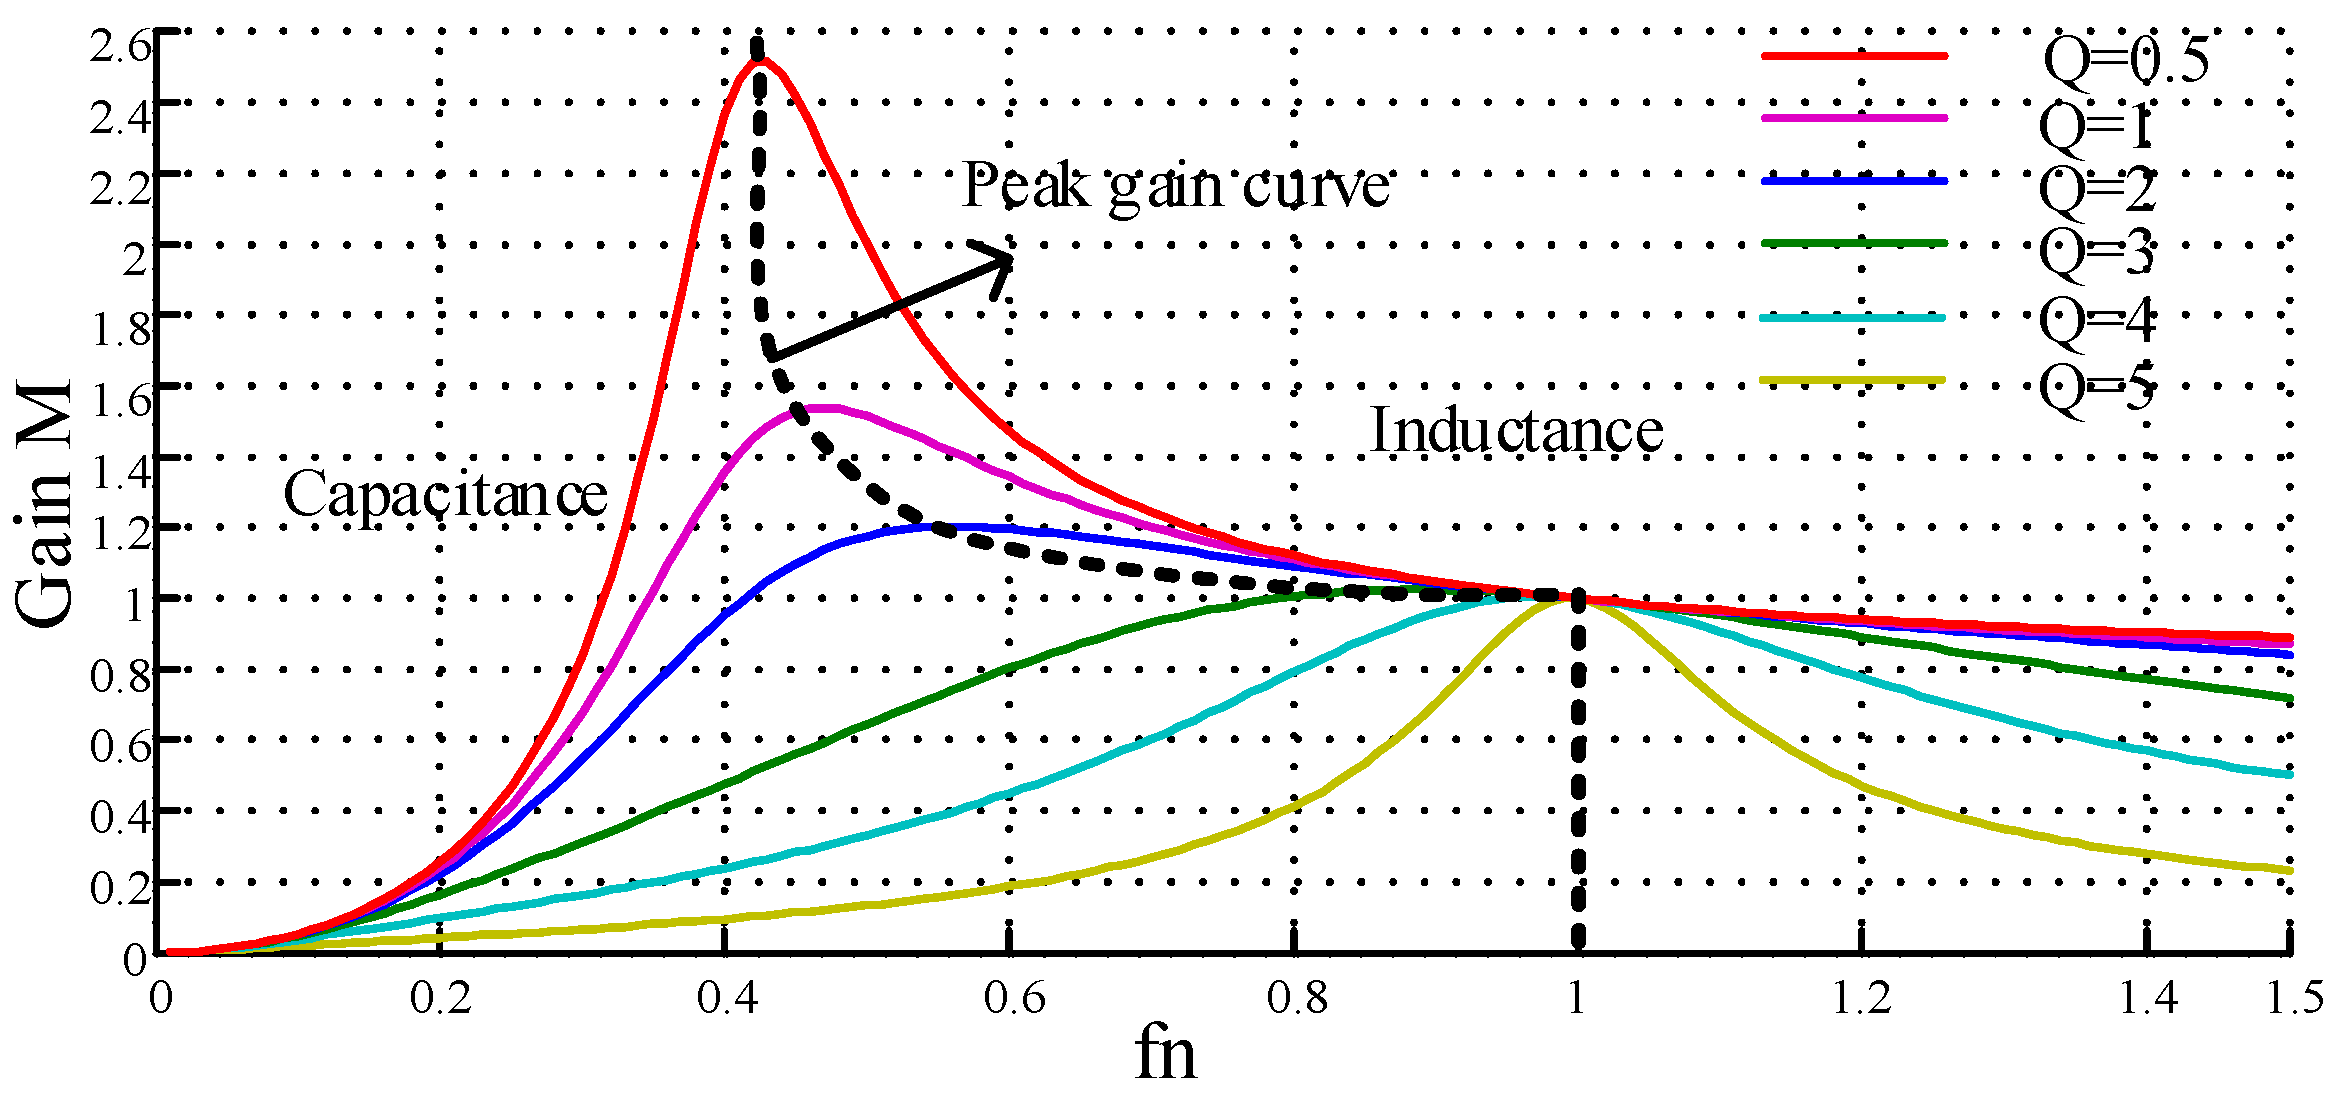
Figure 3 shows the gain curves of a LLC resonant converter under different load conditions [
11,
12,
13]. When the switching frequency is fixed, the gain of the converter could fall as the loads increase, which means the output voltage of the resonant converter could fall as the current rises, similar to the operational area in
Figure 2. If the resonant converter’s operation area is designed to fit the operation area of the special applications, higher power density and efficiency of the resonant converters can be achieved.
In [
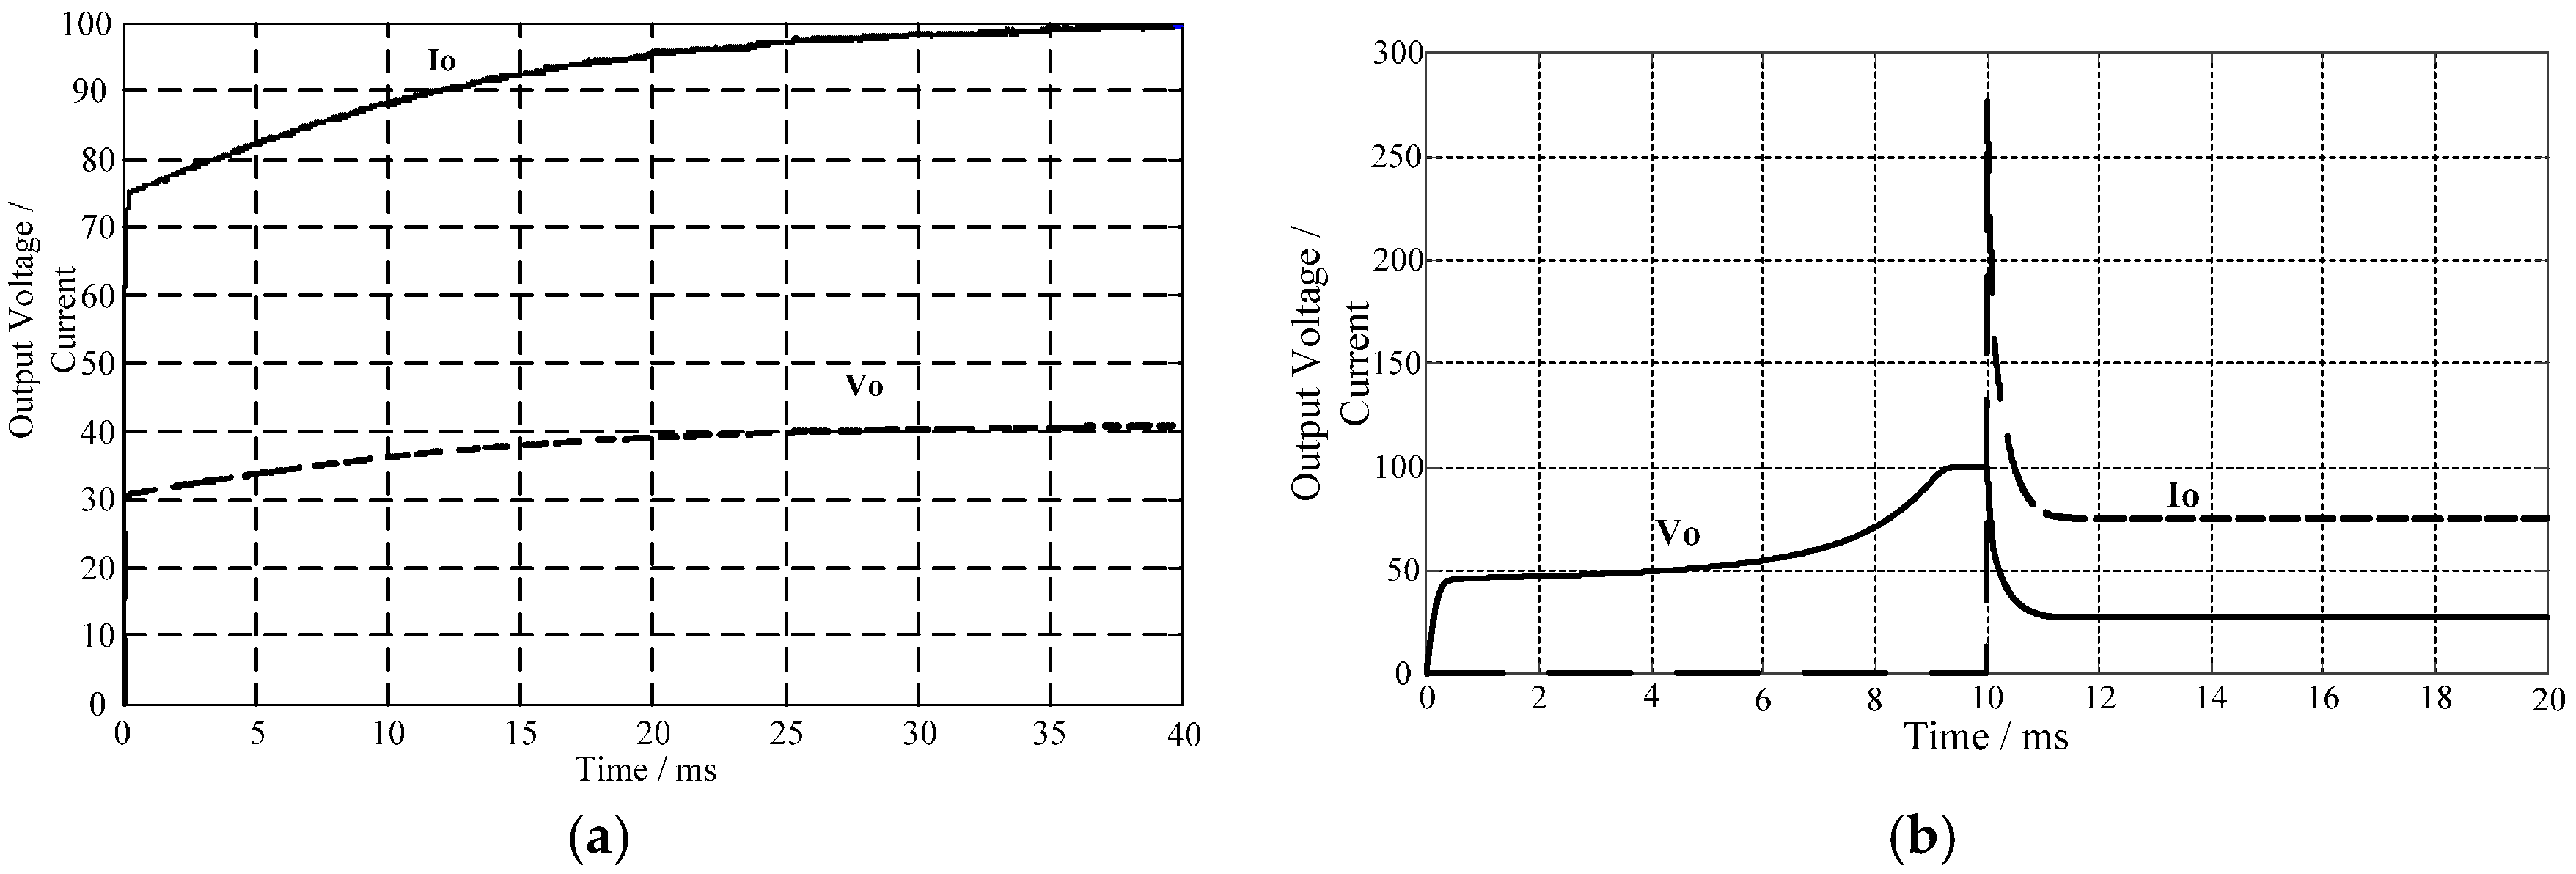
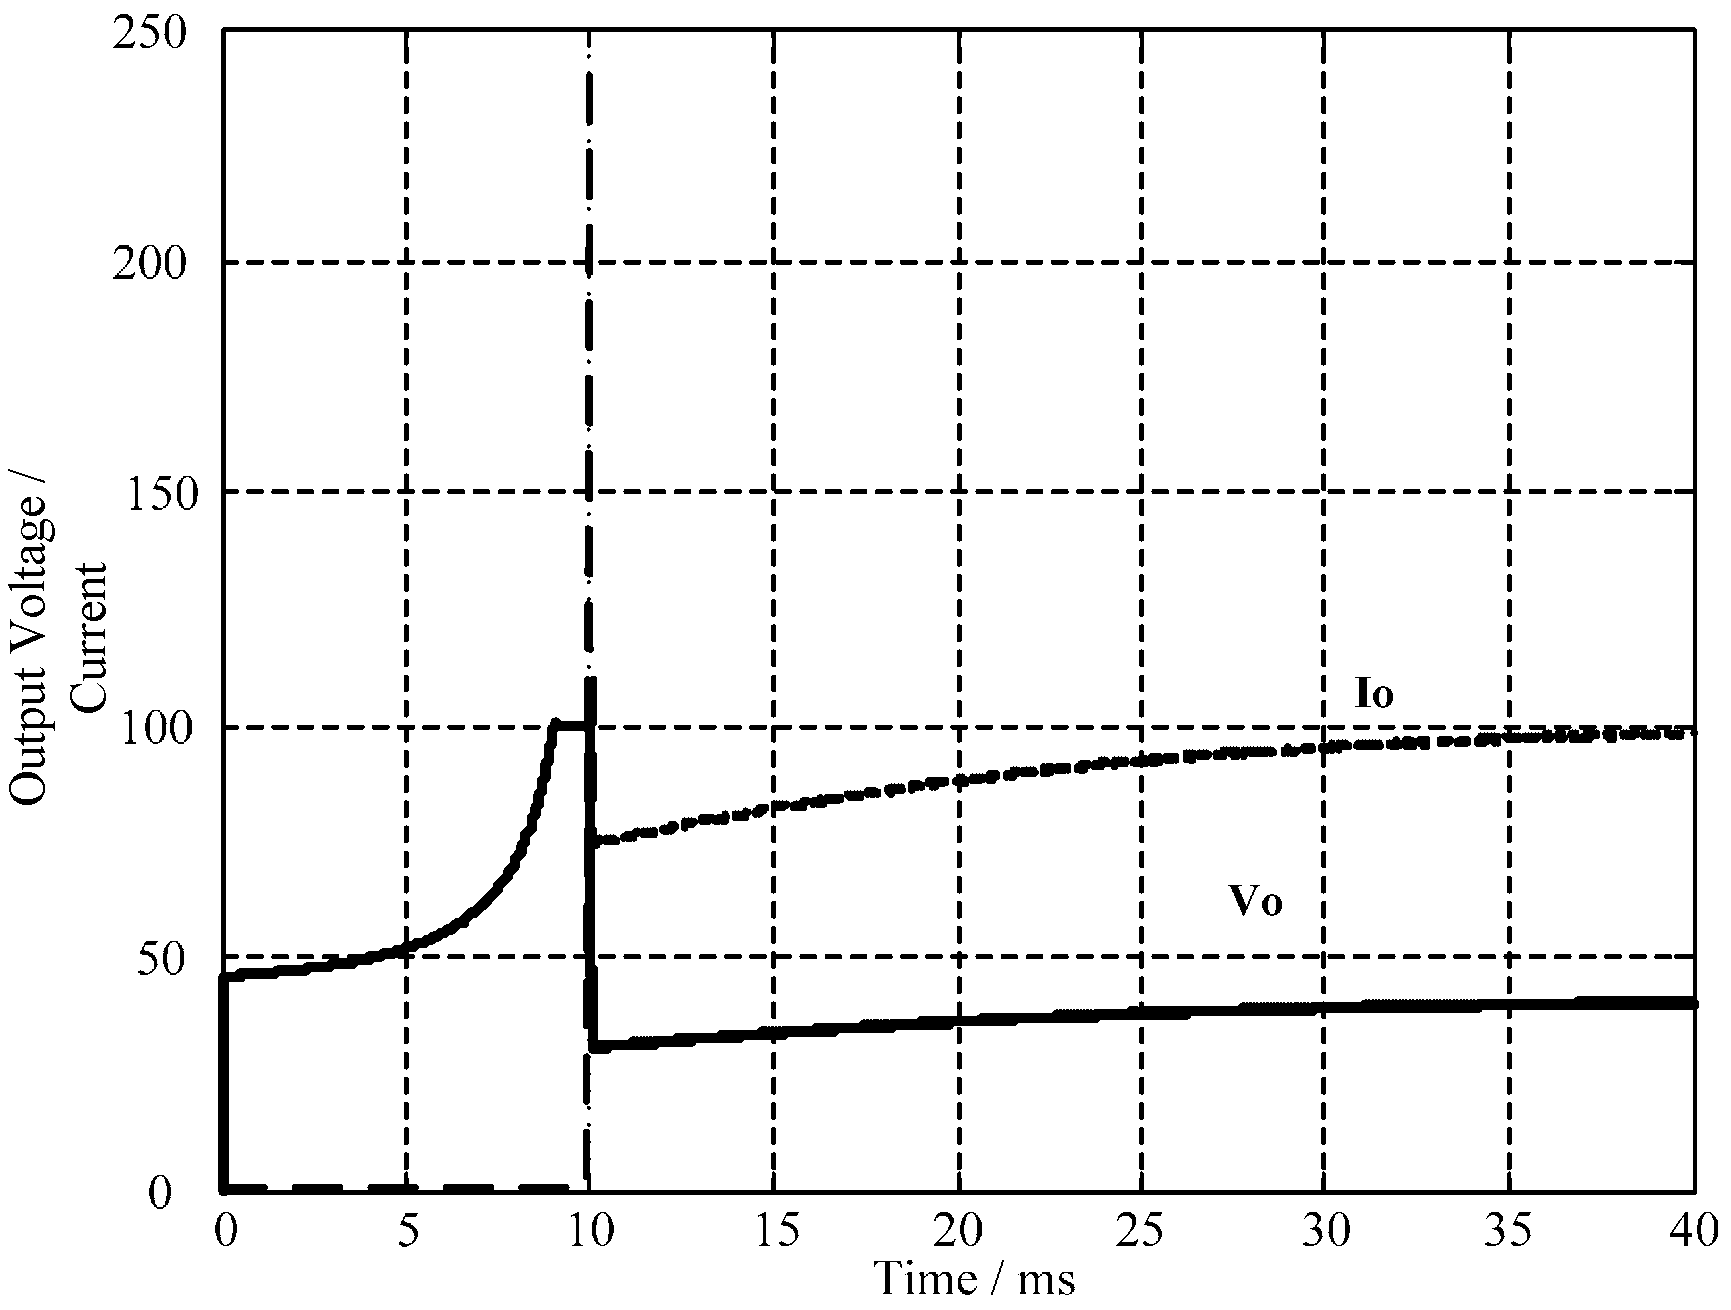
14], the series-parallel resonant converter (SPRC) is used for the plasma arc cutting, achieving high power density and efficiency. The switching frequency is fixed at 125 kHz, which can achieve a high output voltage at open circuit and a very low voltage at short circuit. However, in this application the output currents can only be regulated by sliding the phase among multiple modules. For a single resonant converter module, the switching frequency must be regulated to control the output voltage and current. A simulation module of the LLC resonant converter is applied for the plasma arc cutting. A high output voltage, as large as 100 V at open circuit, and high output current, as large as 100 A at short circuit, can be achieved. The PI controller is used to regulate the switching frequency to control the output voltage and current. When the converter starts up at heavy loads, the output current can be regulated to 100 A, as shown in
Figure 4a. When the converter starts up with no loads, the output voltage can be regulated to 100 V, as shown in
Figure 4b. The output voltage can be maintained at 100 V after 9 ms. At
t = 10 ms, a step load appears and the output current cannot be regulated to 100 A under the short circuit condition, making the converter unstable. In this special application, the converter can work stably despite a minor disturbance but becomes unstable when a major disturbance occurs.
In order to solve this problem, some studies have been published on the stability and control scheme of the LLC resonant converters [
15,
16]. The small-signal analysis method is the most popular and effective method [
17,
18,
19,
20]. An EDF-based nonlinear model is built, obtaining the linearized model at the equilibrium point by using the Lyapunov linearization method. Then the stability criterion is achieved based on the conventional stability analysis. The small-signal analysis method is quite effective and simple, and can be used when the system operates only near the equilibrium point. However, the occurrence of a major disturbance can render the small signal analysis method ineffective, such as the starting-up pulse or load transient, Therefore, the overall stability performance of the LLC resonant converter can only be guaranteed by small signal analysis and researchers need to propose improved methods to extend the application range. Jang et al. [
21,
22] calculated the stability criterion at the most serious condition to ensure the LLC resonant converter’s stability. Zong et al. [
23] linearized a nonlinear system through resonant current feedback and then used the small signal analysis method. There are also some nonlinear analysis methods, such as the phase plane, feedback linearization, and the Lyapunov direct method [
15,
24,
25,
26]. However, those methods cannot correctly achieve the attraction region and the stability criterion, limiting the applicability. These published papers pay little attention to the unstable phenomenon of the LLC resonant converter during a major disturbance, where the LLC resonant converter, which can maintain stability during a minor disturbance, may be unstable due to its nonlinear characteristics.
The main reason why conventional analysis and control methods do not work in these special applications is that the nonlinear characteristics used in these applications to improve the power density and efficiency make the conventional linear analysis and control methods fail. In this paper, the instability characteristics of the LLC resonant converter during major disturbance conditions are studied intensively. Through in-depth analysis of the gain curve of the LLC resonant converter, we find that the switching frequency range is one of the key factors determining the system stability performance of the LLC resonant converter. The regulated switching frequency should be higher than the critical frequency to ensure the stability of the system, or the converter will fall into instability. The same result is obtained from a mathematical point of view by the utilization of the mixed potential function method. After these analyses, a trigger control method is proposed to make the LLC resonant converter stable under major disturbance conditions, which can be used to support the resonant converter applied for the special applications.
The rest of this paper is organized as follows. In
Section 2, the instability phenomenon of the LLC resonant converter is analyzed from the view of the gain curve. Then the mathematically derived process is expressed in
Section 3, based on the mixed potential function method. In
Section 4, a trigger control scheme is given to extend the operational range of the LLC resonant converter. The experimental results are shown in
Section 5 to verify the proposed analysis and control methods, followed by conclusions in
Section 6.
2. Instability Phenomenon
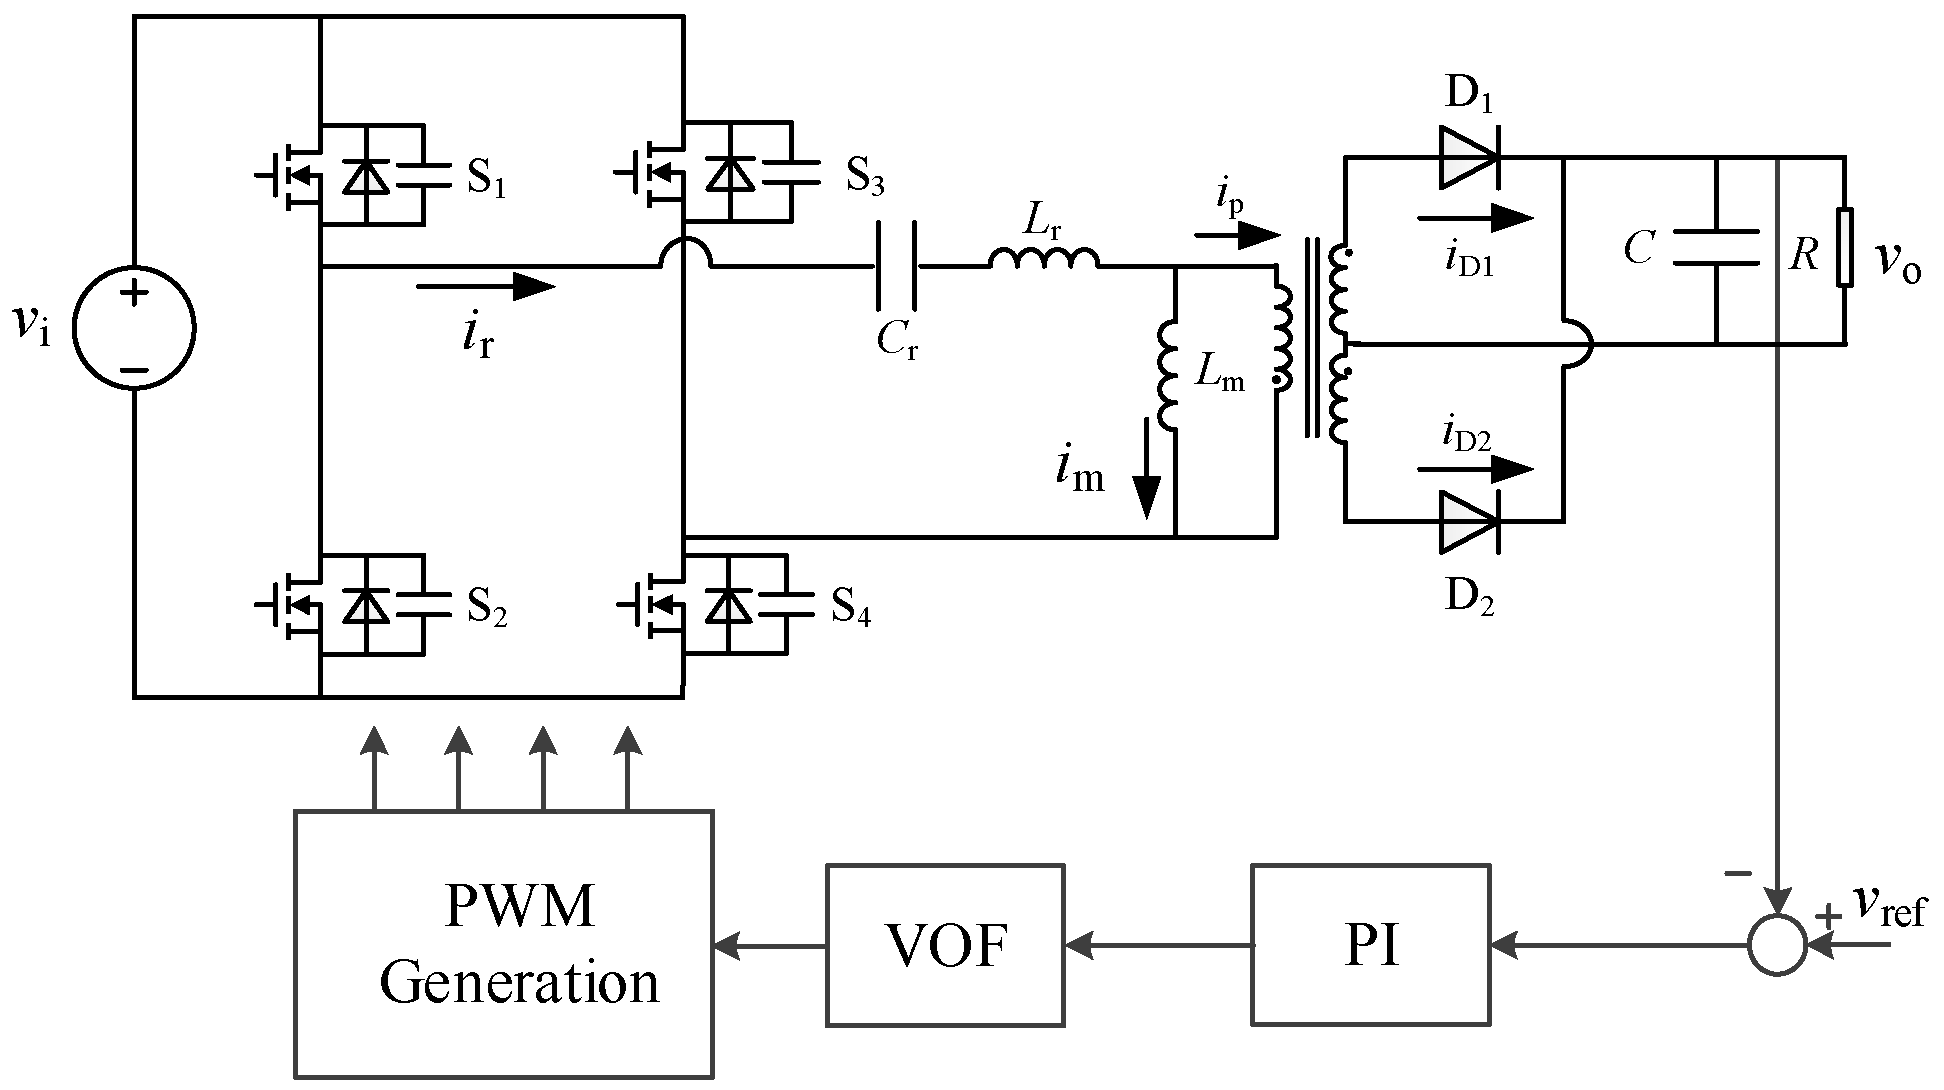
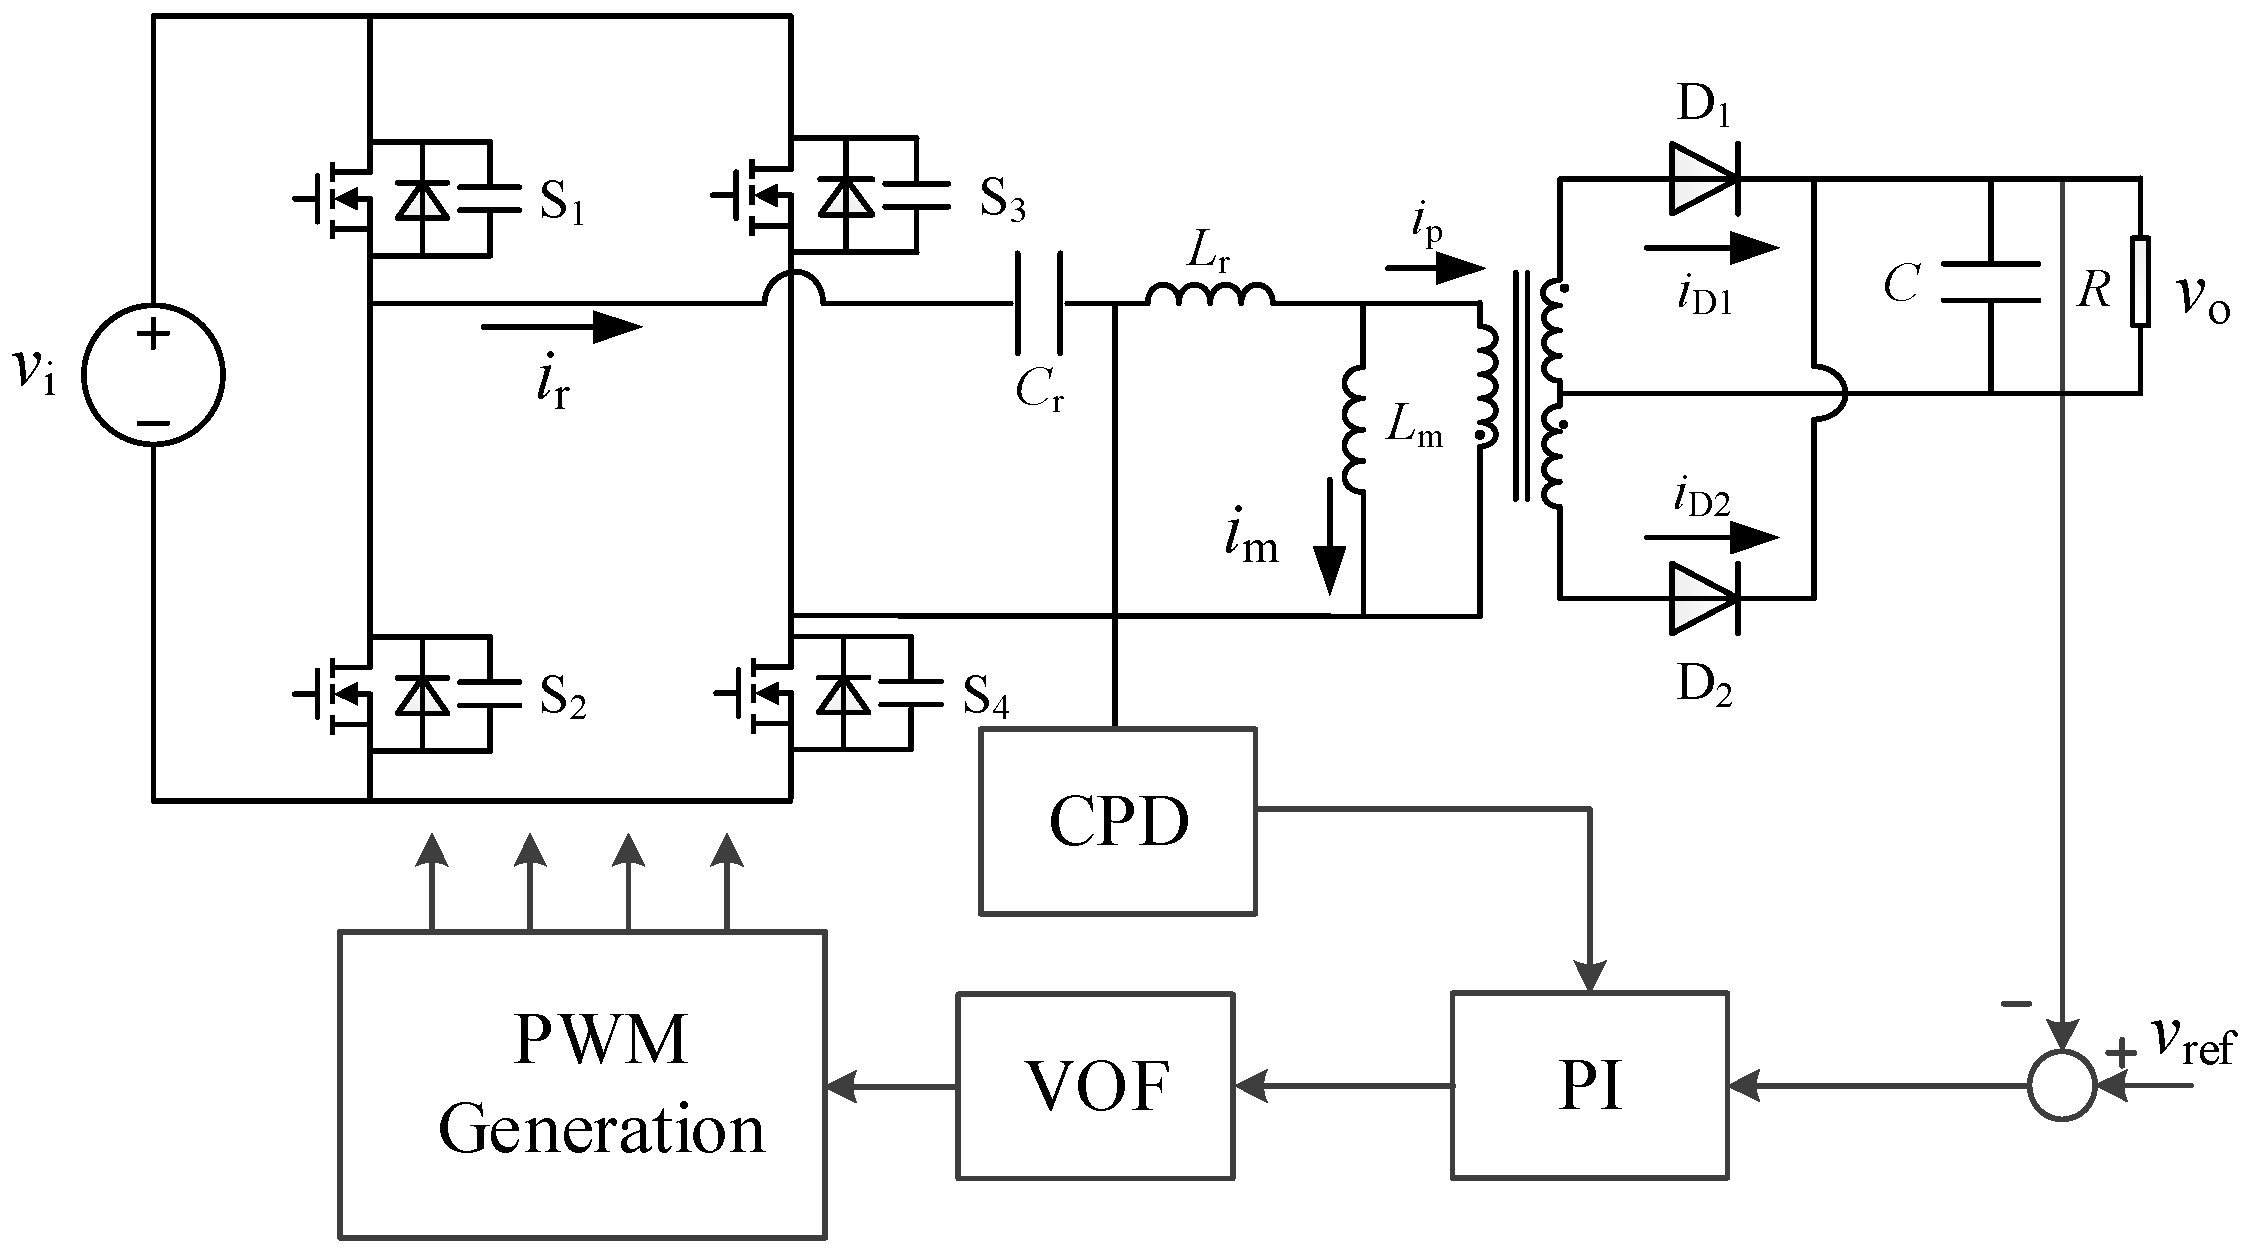
Figure 5 shows the circuit block diagram of the LLC resonant converter. The full bridge, consisting of four MOSFETs, produces a square wave voltage for the resonant tank, which is composed of a resonant inductor, capacitor, and magnetic inductor. The rectifier transfers the resonant AC voltage to DC voltage. Through varying the switching frequency, the resonant tank impedance can be adjusted and thus the output voltage can be controlled.
Generally, traditional PI controllers can be used in the LLC resonant converters for output voltage regulation, as shown in
Figure 5. When the output voltage is higher than the reference value, the modulation voltage generated by the PI controller will increase and the voltage-to-frequency conversion will generate a higher switching frequency. Thus the resonant tank impedance will increase and the output voltage will decrease accordingly. Similarly, when the output voltage is lower than the reference voltage, the switching frequency will decrease and output voltage will increase. The output voltage can be regulated to the reference value through the conventional linear controller.
According to the operation principle of the LLC resonant converter, it can be seen that the resonant tank impedance should be inductive to guarantee the stability of the LLC resonant converter. Otherwise, the resonant tank is capacitive. In this case, when the output voltage is higher than the reference value, the controller will regulate a higher switching frequency, which causes a higher output voltage. Then positive feedback occurs, regulating the output voltage to the maximum or minimum value and causing the LLC resonant converter to become unstable. Unfortunately, the LLC resonant converter is a nonlinear system, and the resonant impedance may be capacitive or inductive depending on the switching frequency value. The gain curve of the LLC resonant converter is shown in
Figure 3. When the converter operates in the inductive area, the output voltage will decrease as the frequency increases. When the converter operates in the capacitive area, the output voltage increases as the frequency increases.
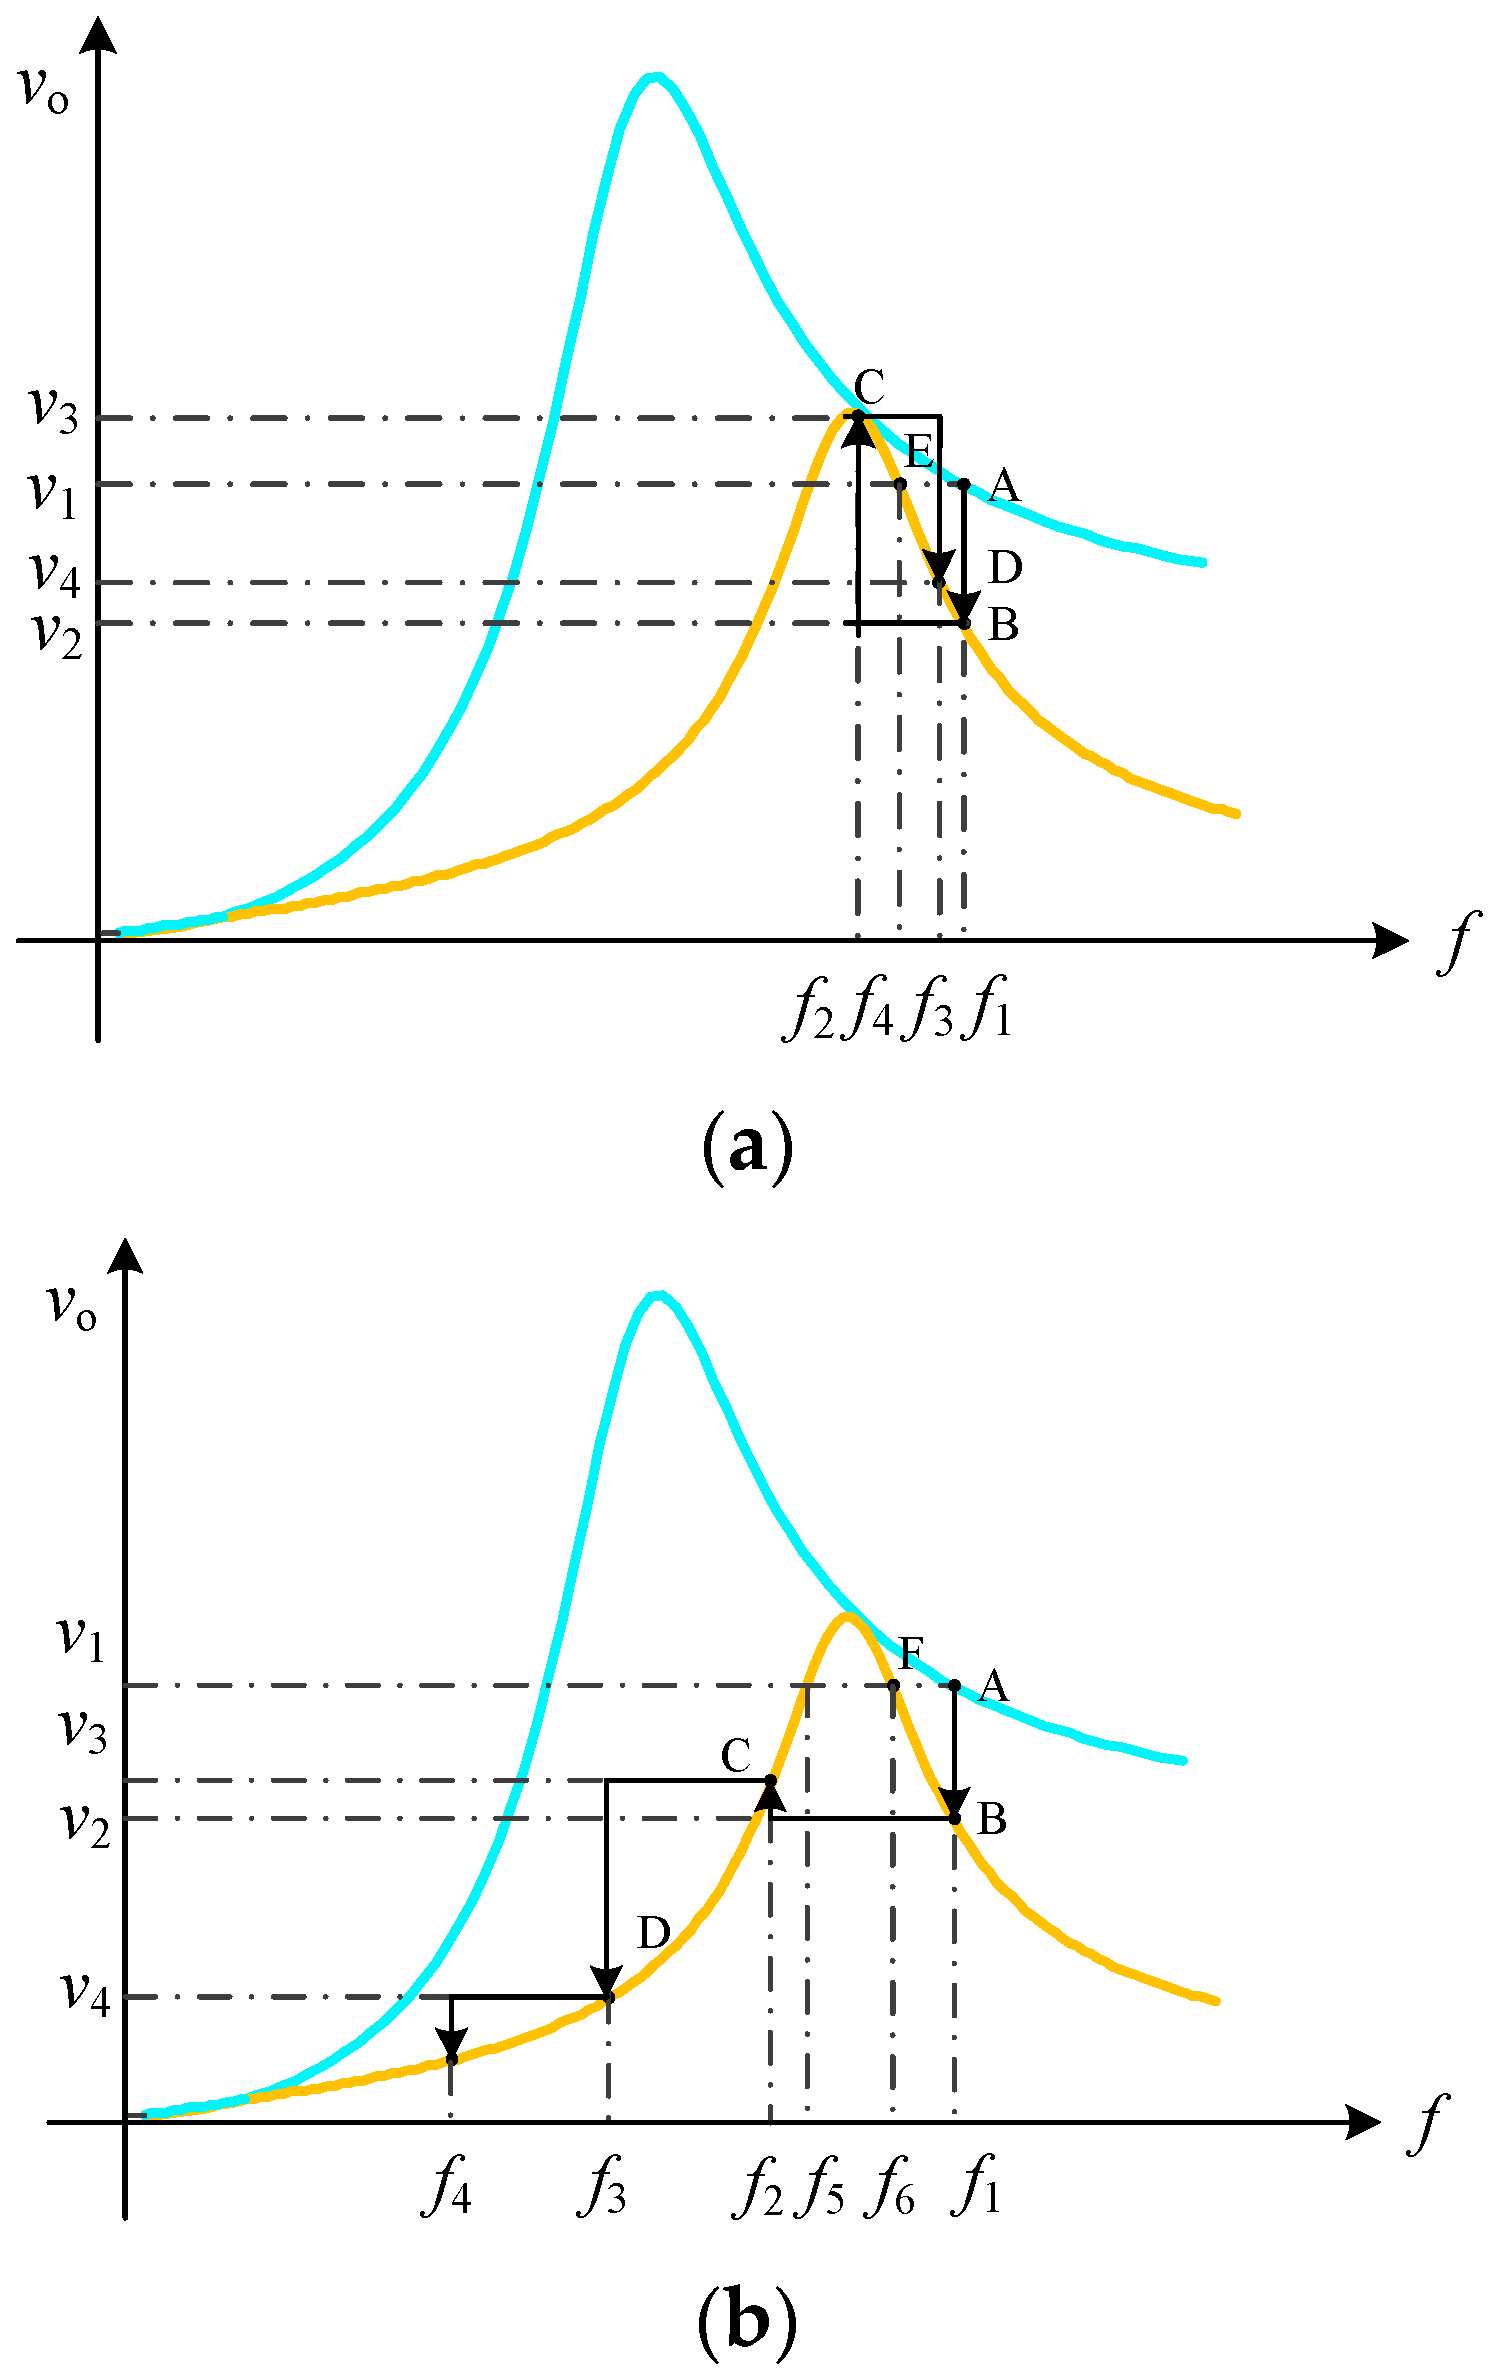
Assume that the LLC resonant converter operates at point A, as shown in
Figure 6a. The reference voltage is
v1 and the switching frequency is
f1. When a minor disturbance occurs, the loads increase correspondingly and the output curve changes from the blue line to the yellow one, leading to a slight decrease in output voltage from
v1 to
v2 at frequency
f1, making the operation point move to point B. Then the output voltage is lower than the reference value, making the controller producing a lower switching frequency
f2 and the operation point transfers to point C. The output voltage is
v3 at point C, which is higher than the reference value,
v1. The frequency will be increased by the controller regulation to reduce the output voltage. The converter is regulated to work at point D. Finally, the converter will stably operate at a new point E, and at a new frequency
f4. During the whole regulating process, the converter operates in the inductive area. The converter can operate stably under minor disturbances.
However, the converter may go into the capacitive area during the controlling process, especially in major disturbance conditions. When major disturbances occur, the loads increase, as shown in
Figure 6b. Due to the heavy step loads, the output voltage will be reduced to
v2 at operation point B. Since the output voltage
v2 is far smaller than the reference voltage,
v1, the large input error will produce a small switching frequency,
f2, making the converter operating at point C fall into the capacitive area. As the output voltage
v3 at point C is still lower than reference value
v1, the controller will continue to decrease the switching frequency to
f3, which causes a lower output voltage due to the capacitive characteristics of the resonant tank. Then positive feedback occurs, making the converter operate from point D to E and finally to the original point. The converter becomes unstable during a period of major disturbance. Therefore, the conventional linear stable analysis method cannot ensure the converter’s stability during a major disturbance. It is necessary to analyze the stability of the LLC resonant converter during a major disturbance.
From the above analysis, it can be shown that a minor disturbance and slower controller regulating speed will make the converter more stable. When the converter operates in the inductive area during the whole regulating process, the converter can operate stably as in the normal design. Otherwise, the converter enters into the capacitive area, as shown in
Figure 6b, and instability occurs. By observing
Figure 6b, it can be seen that if the switching frequency is lower than
f5, the output voltage will be lower than the reference value, and the controller will reduce the frequency to increase the output voltage until the frequency is regulated to zero. If the frequency is higher than
f5 and lower than
f6, the output voltage will be higher than the reference value and the controller will increase the frequency to reduce the output voltage. When the frequency is higher than
f6, the output voltage is lower than the reference voltage and the controller will reduce the frequency to increase the output voltage. Finally, the LLC resonant converter operates stably at point F. So
f5 is the stable criterion of the LLC resonant converter at which the LLC resonant converter can generate a new reference voltage in the capacitive area. The stability criterion will vary with the loads and the reference and the minimum value will be obtained when the new reference voltage is equal to the peak value of LLC resonant converter’s gain curve. We name the frequency achieving the peak gain the peak frequency. Thus, when the switching frequency is higher than the peak frequency during the whole controlling process, the converter can be guaranteed to operate stably during any disturbance. Otherwise, the converter may operate in the capacitive area and instability occurs. Thus the peak frequency is the critical condition for stable operation of the LLC resonant converter, which can be obtained as follows:
where
h is the inductor ratio (
),
Q is the quality factor (
,
), and
f is the normalized frequency
. Then the peak frequency can be calculated:
To ensure the stable operation of the LLC resonant converter, the frequency must be larger than the peak frequency during the whole regulation process. Otherwise, the converter will work in the capacitive area and be unstable.
5. Experiment Verification
In order to verify the correctness of the stability analysis, a full bridge LLC resonant converter prototype has been built. The parameters used for the model are given in
Table 1.
Based on the analysis in
Section 2 and
Section 3, the frequency range has an important influence on the converter’s stability. The peak frequency can be calculated as 66.41 kHz. In order to verify the stability criterion, two cases with different frequency ranges and controller parameters for LLC resonant converter are shown in
Table 2.
Case 1 (No. 1–4): The compensation parameters are shown in
Table 2. The frequency range of the LLC resonant converter is 70–300 kHz. The lower frequency is larger than the peak frequency of 66.41 kHz. The controller parameters are negative. They can satisfy Equation (33).
Figure 10,
Figure 11,
Figure 12 and
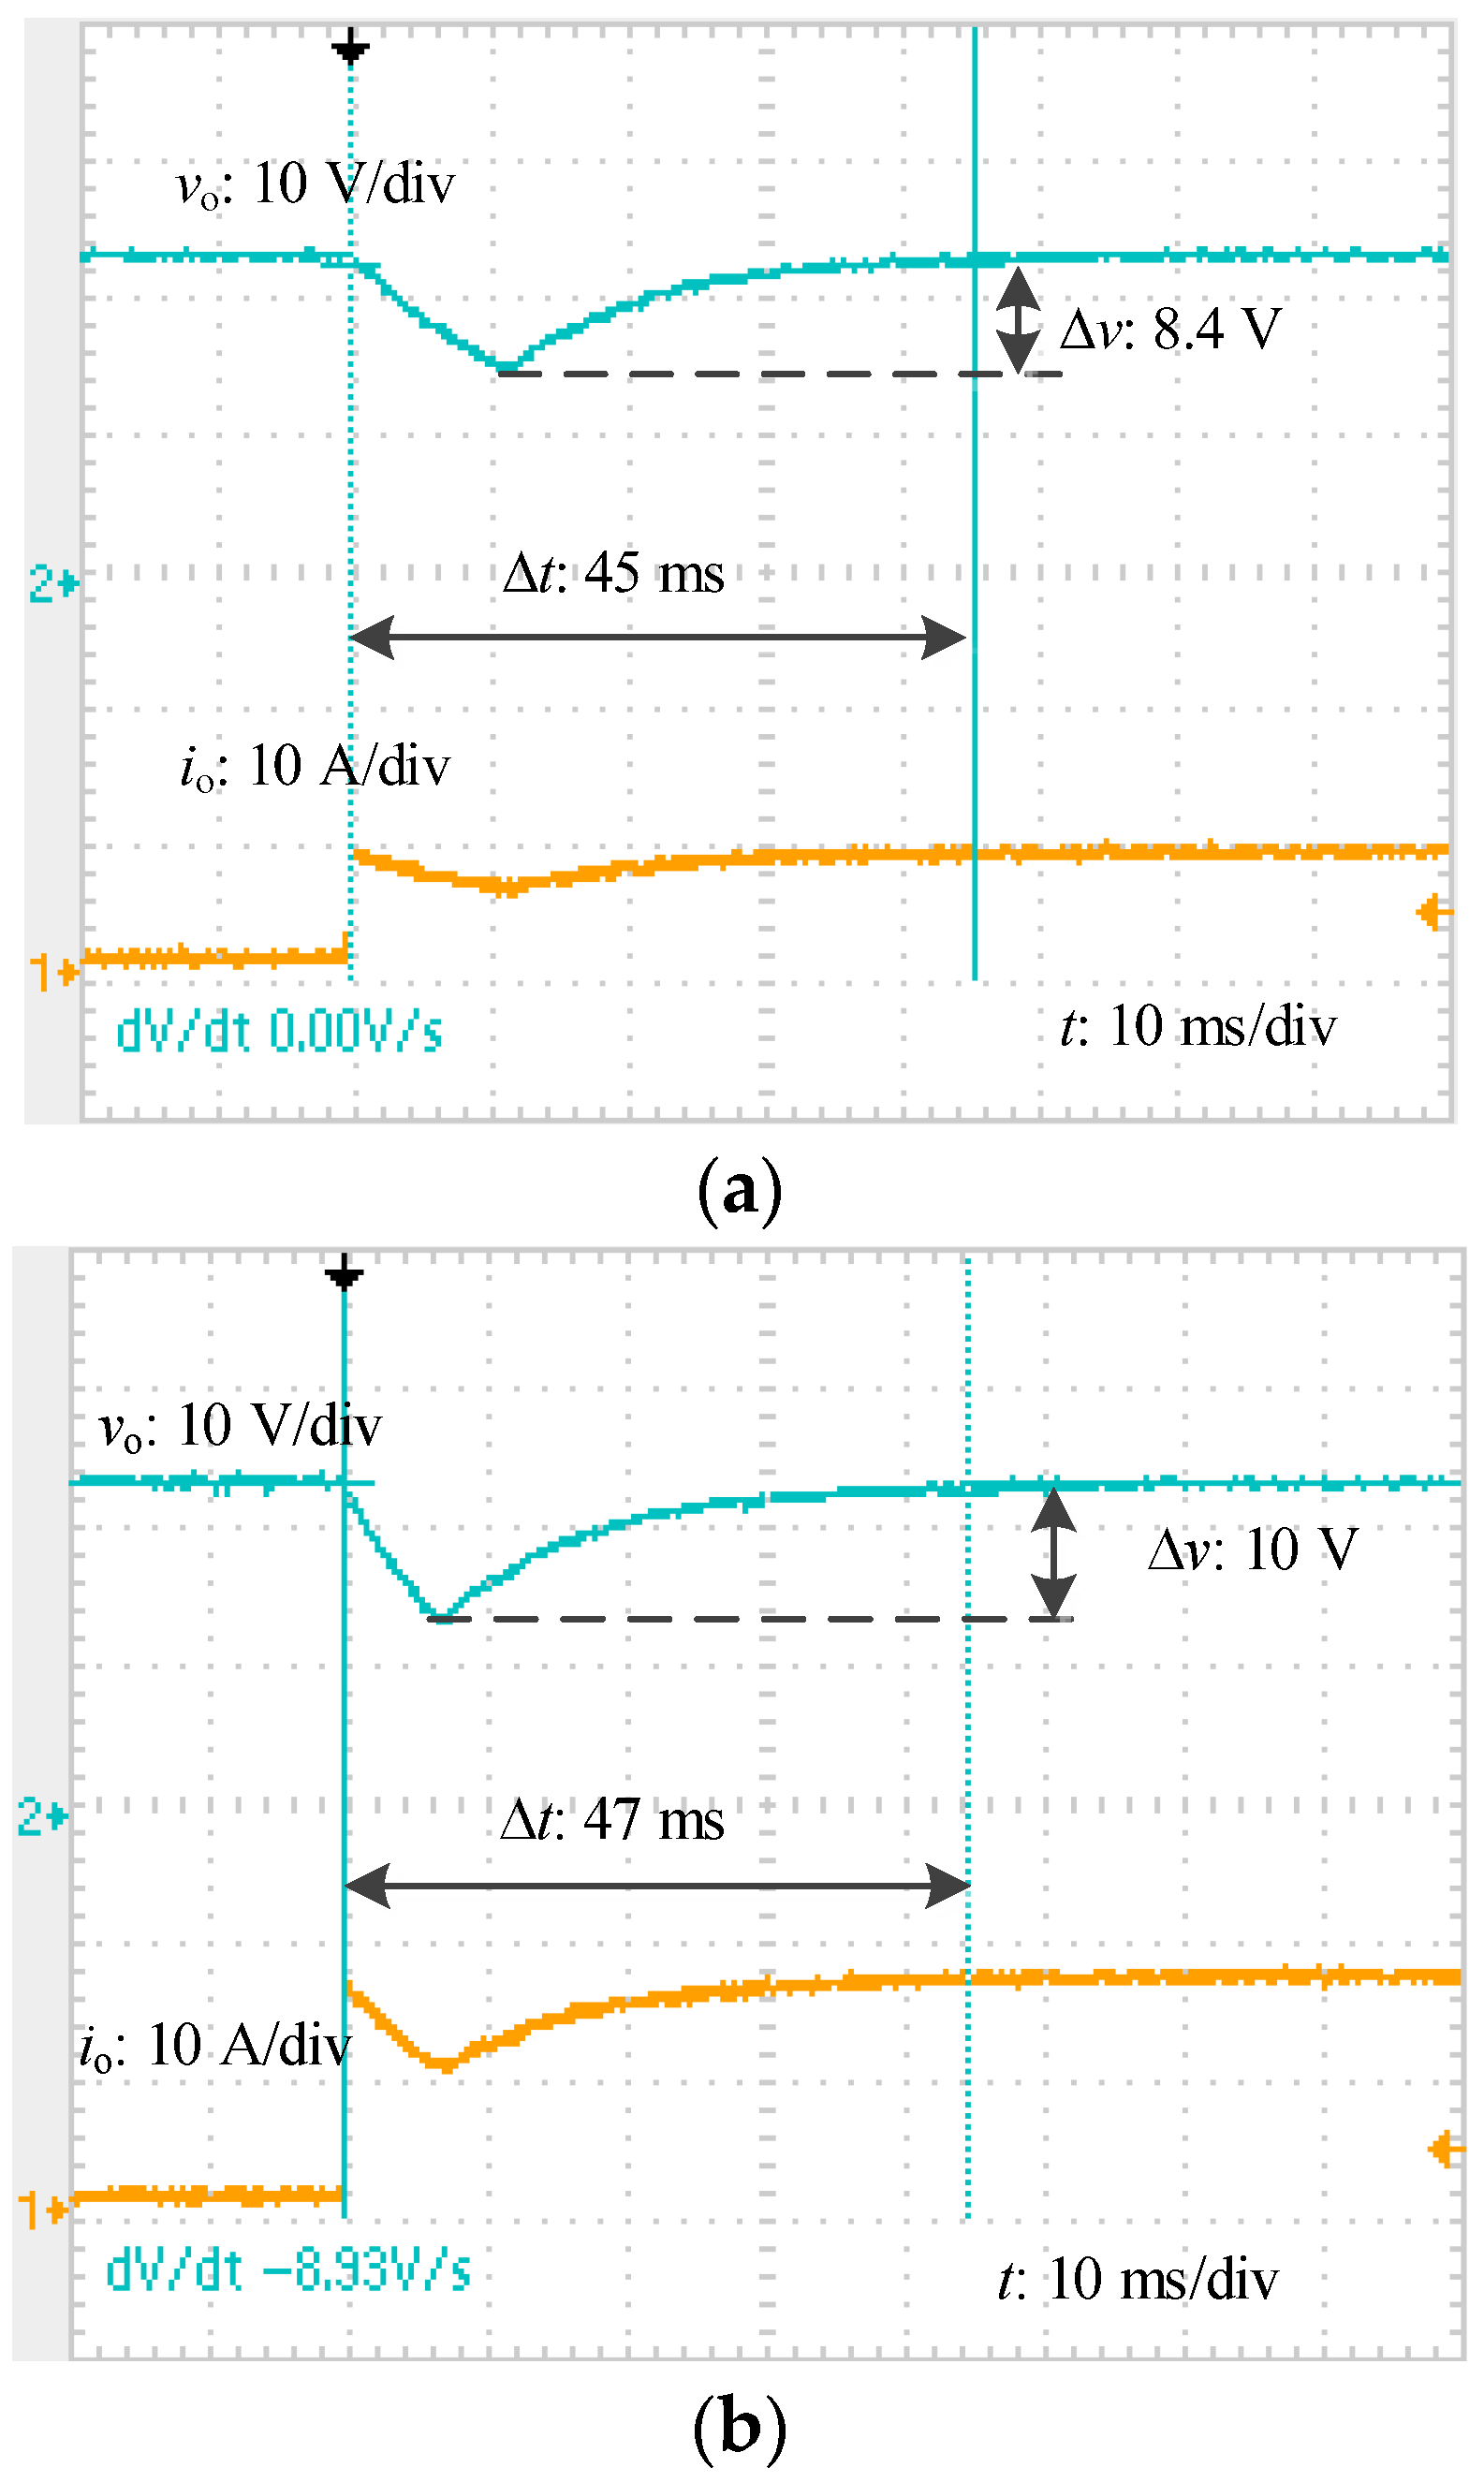
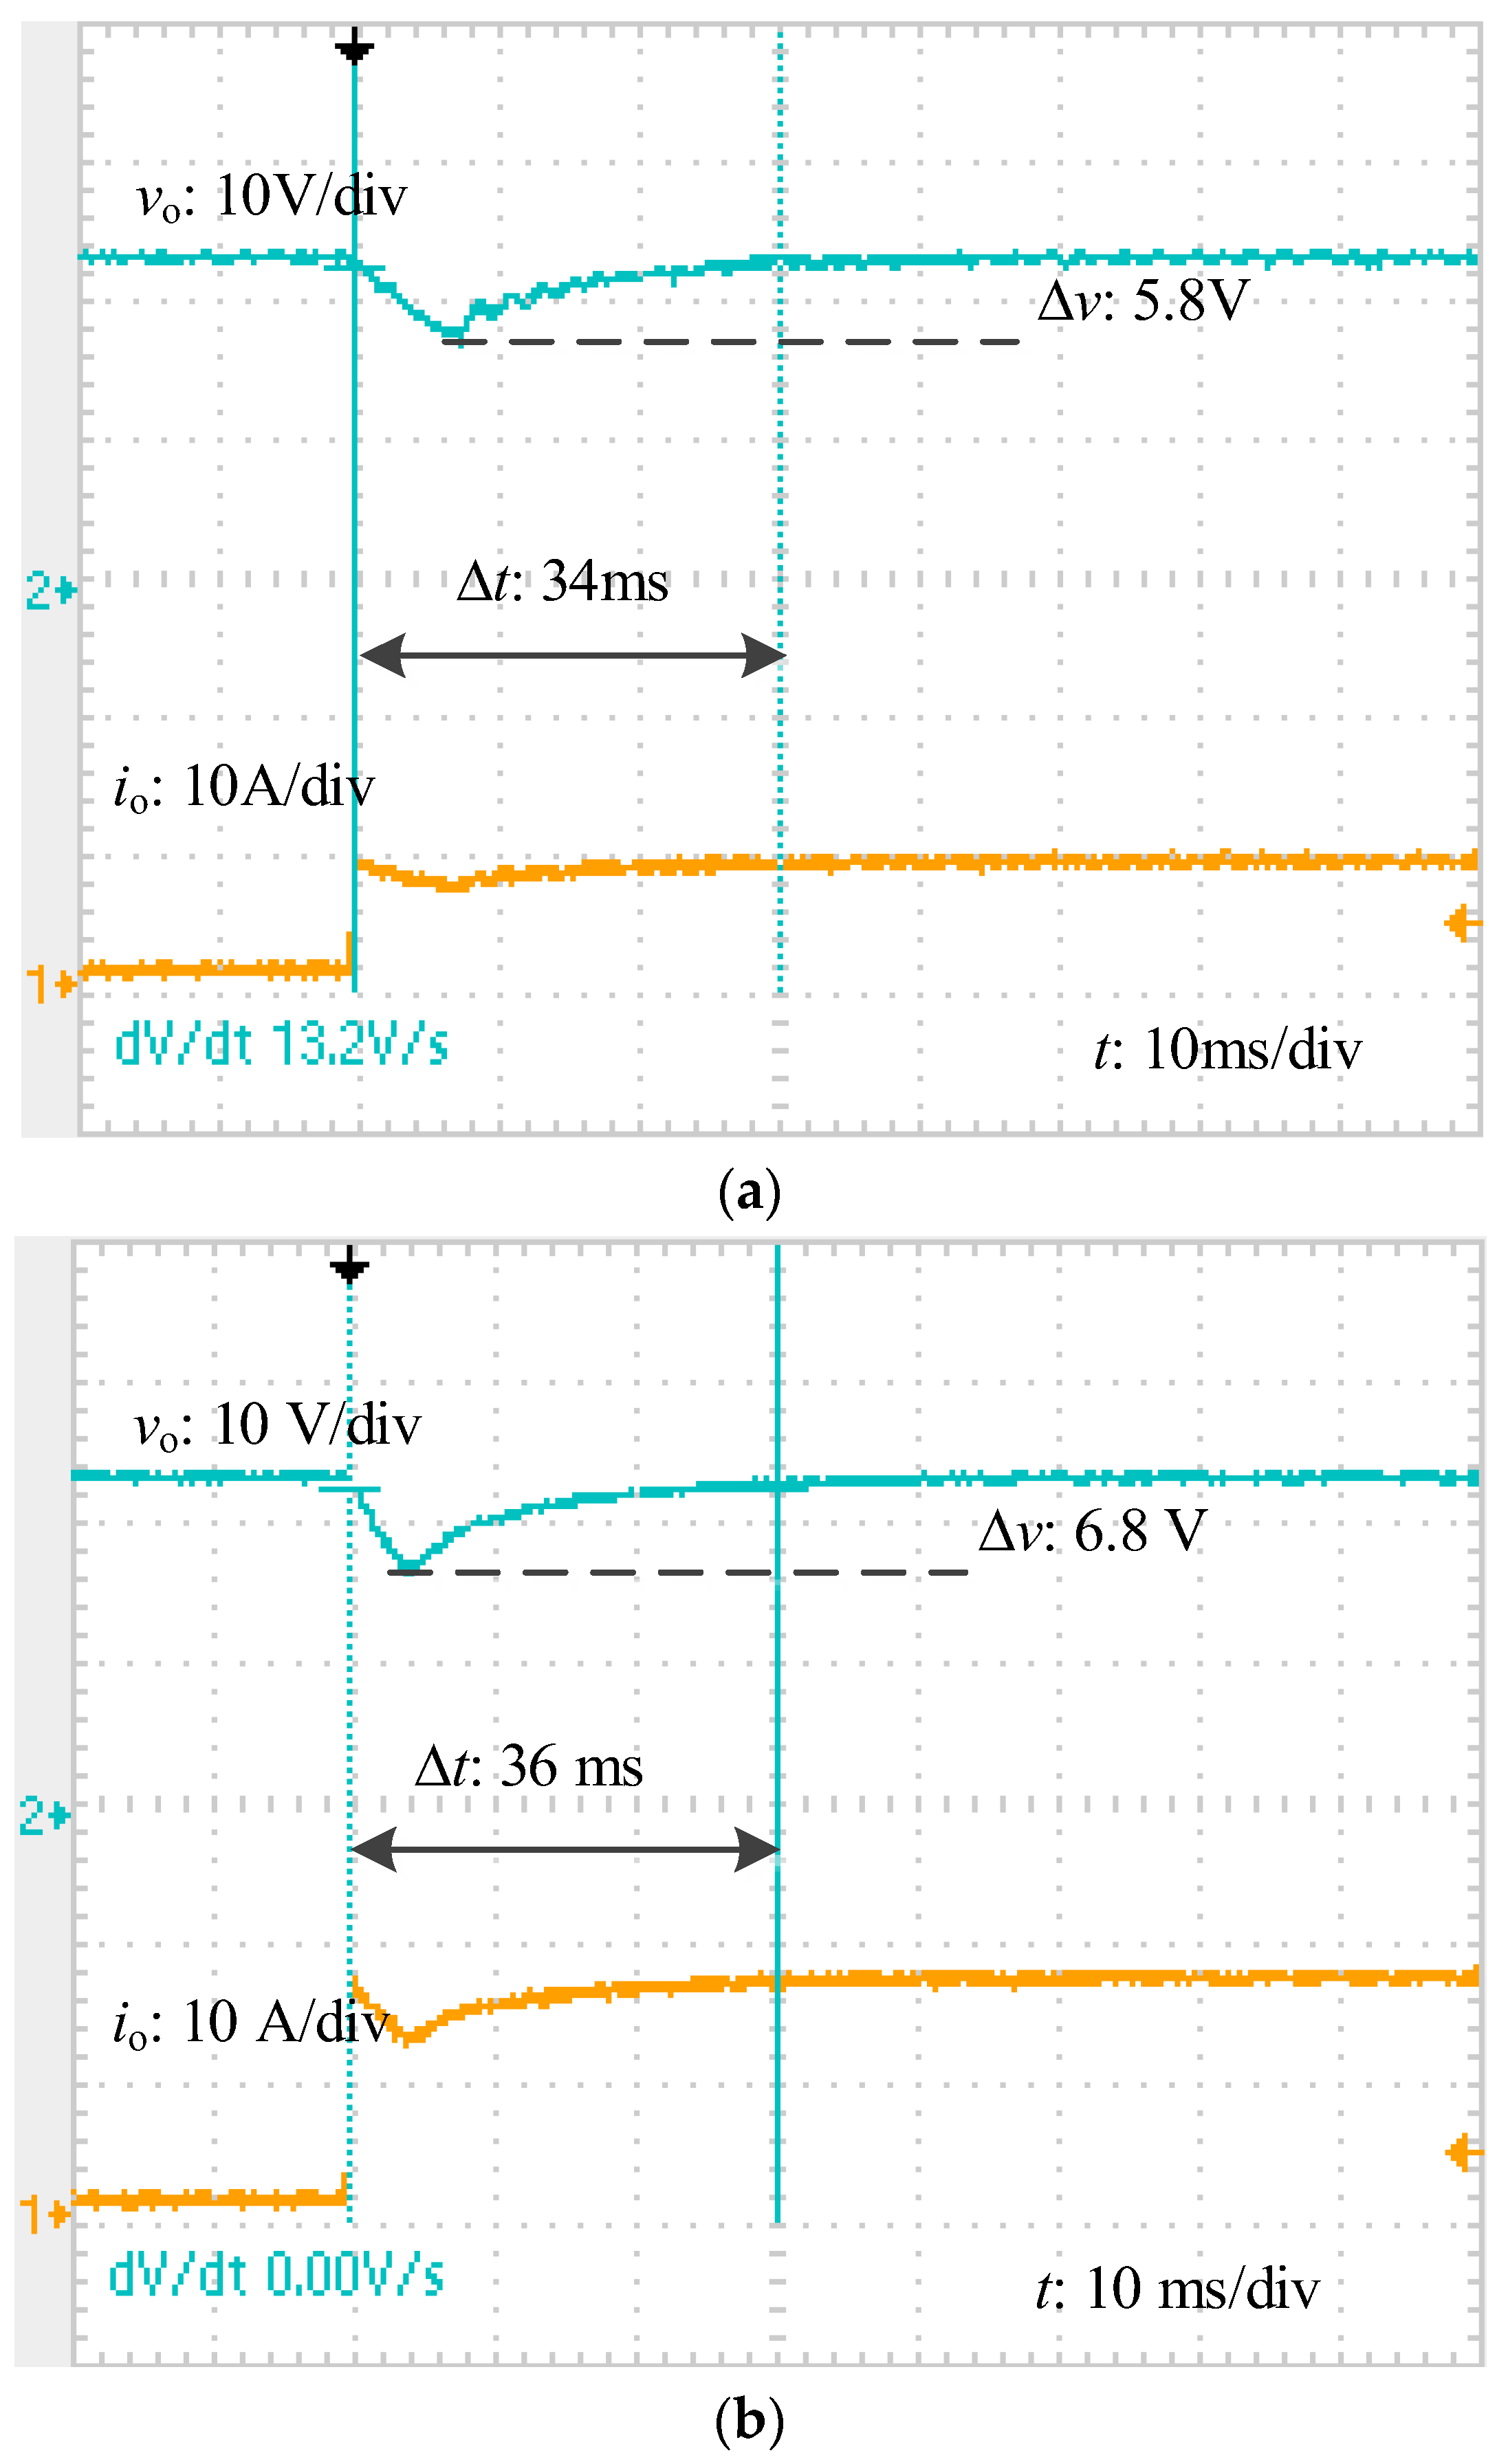
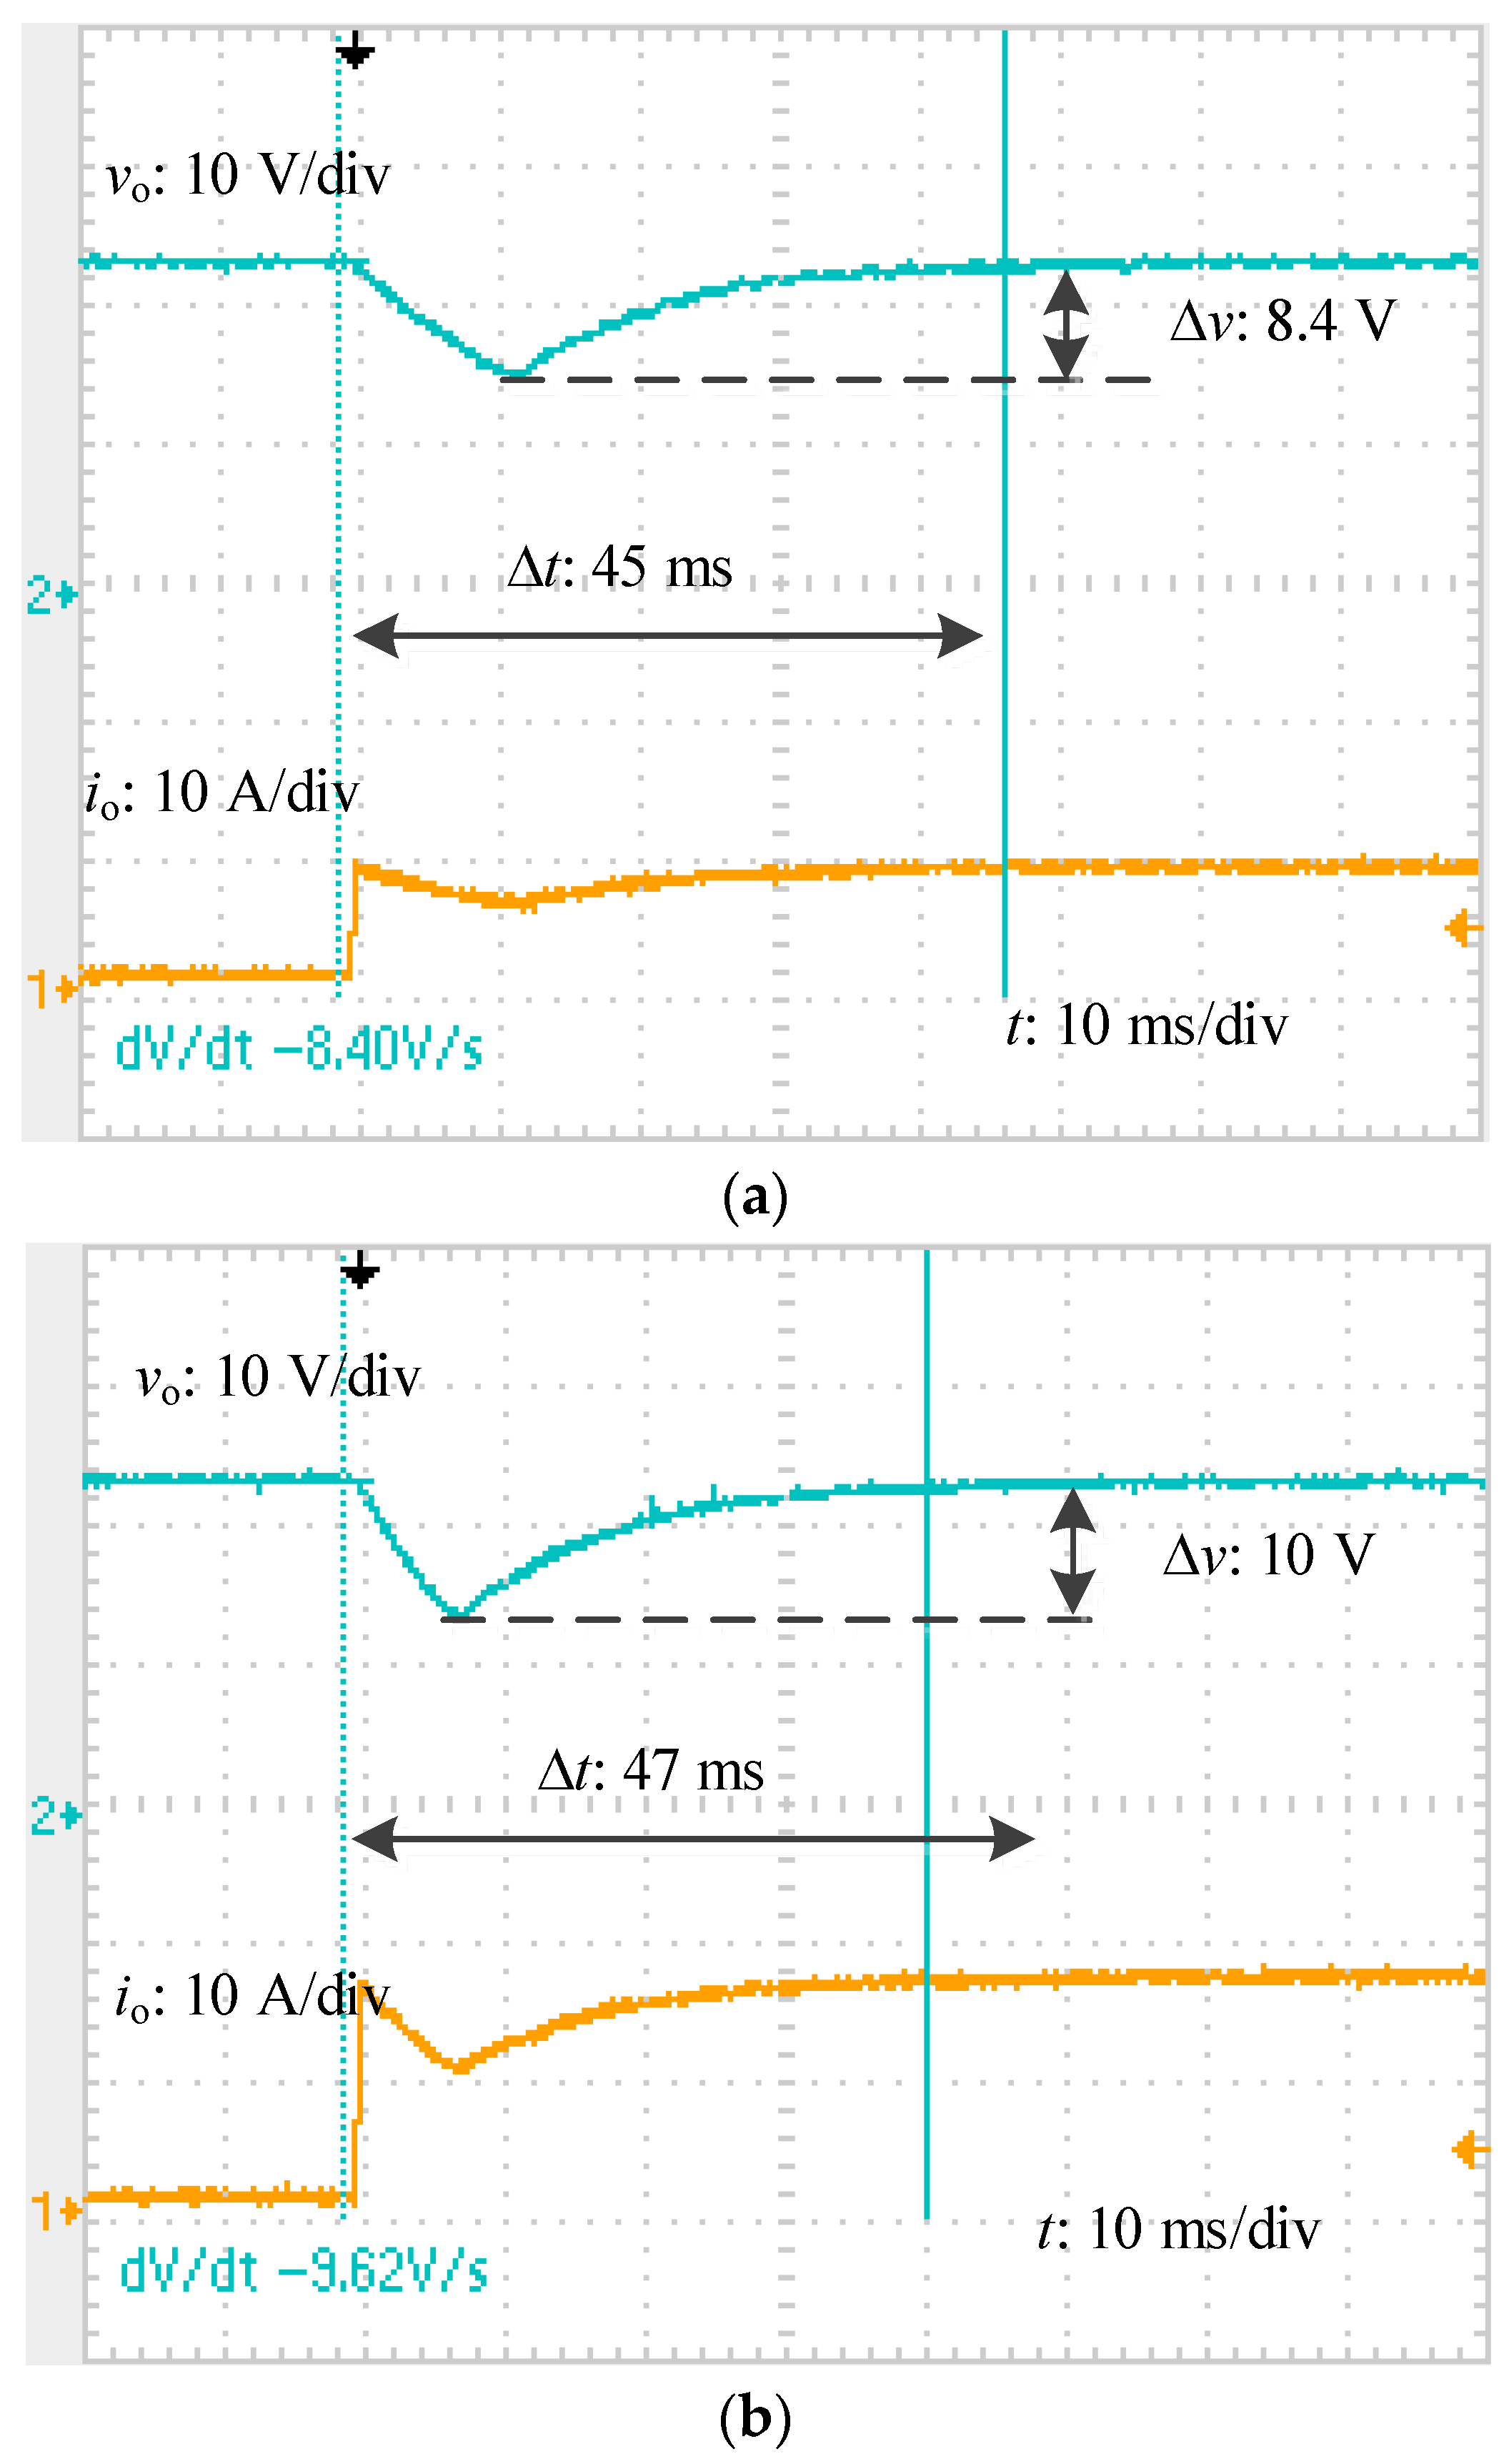
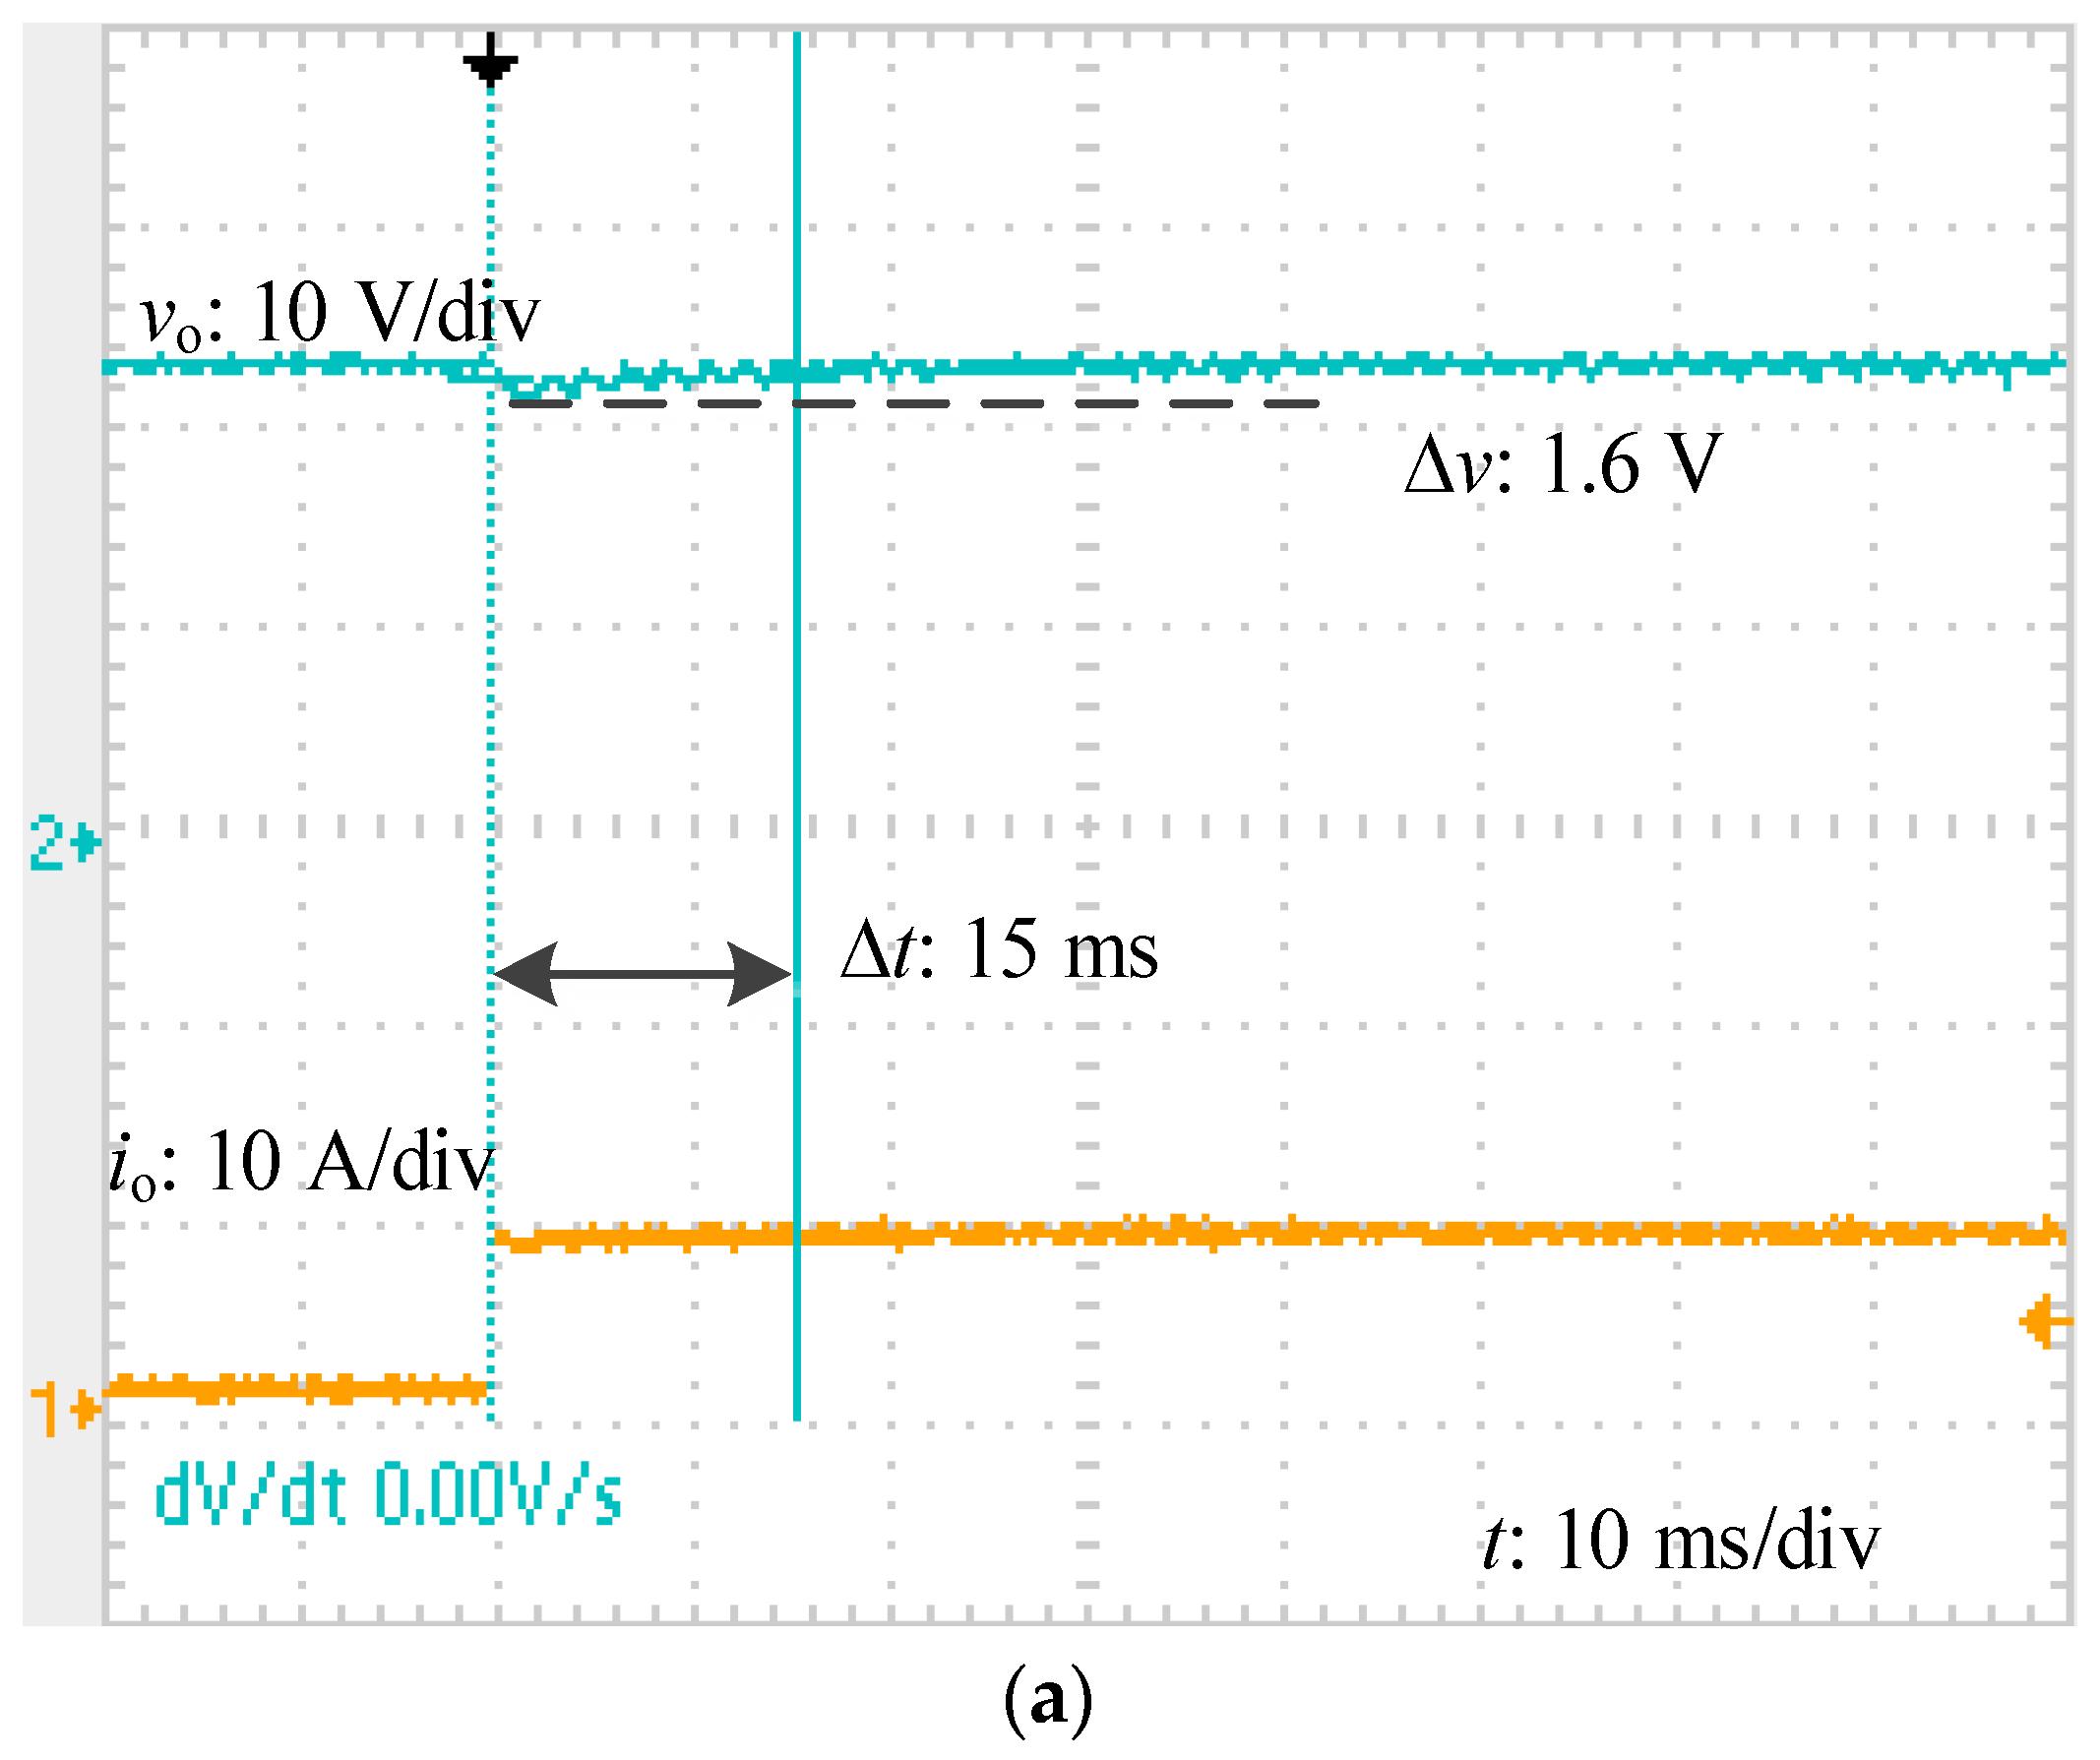
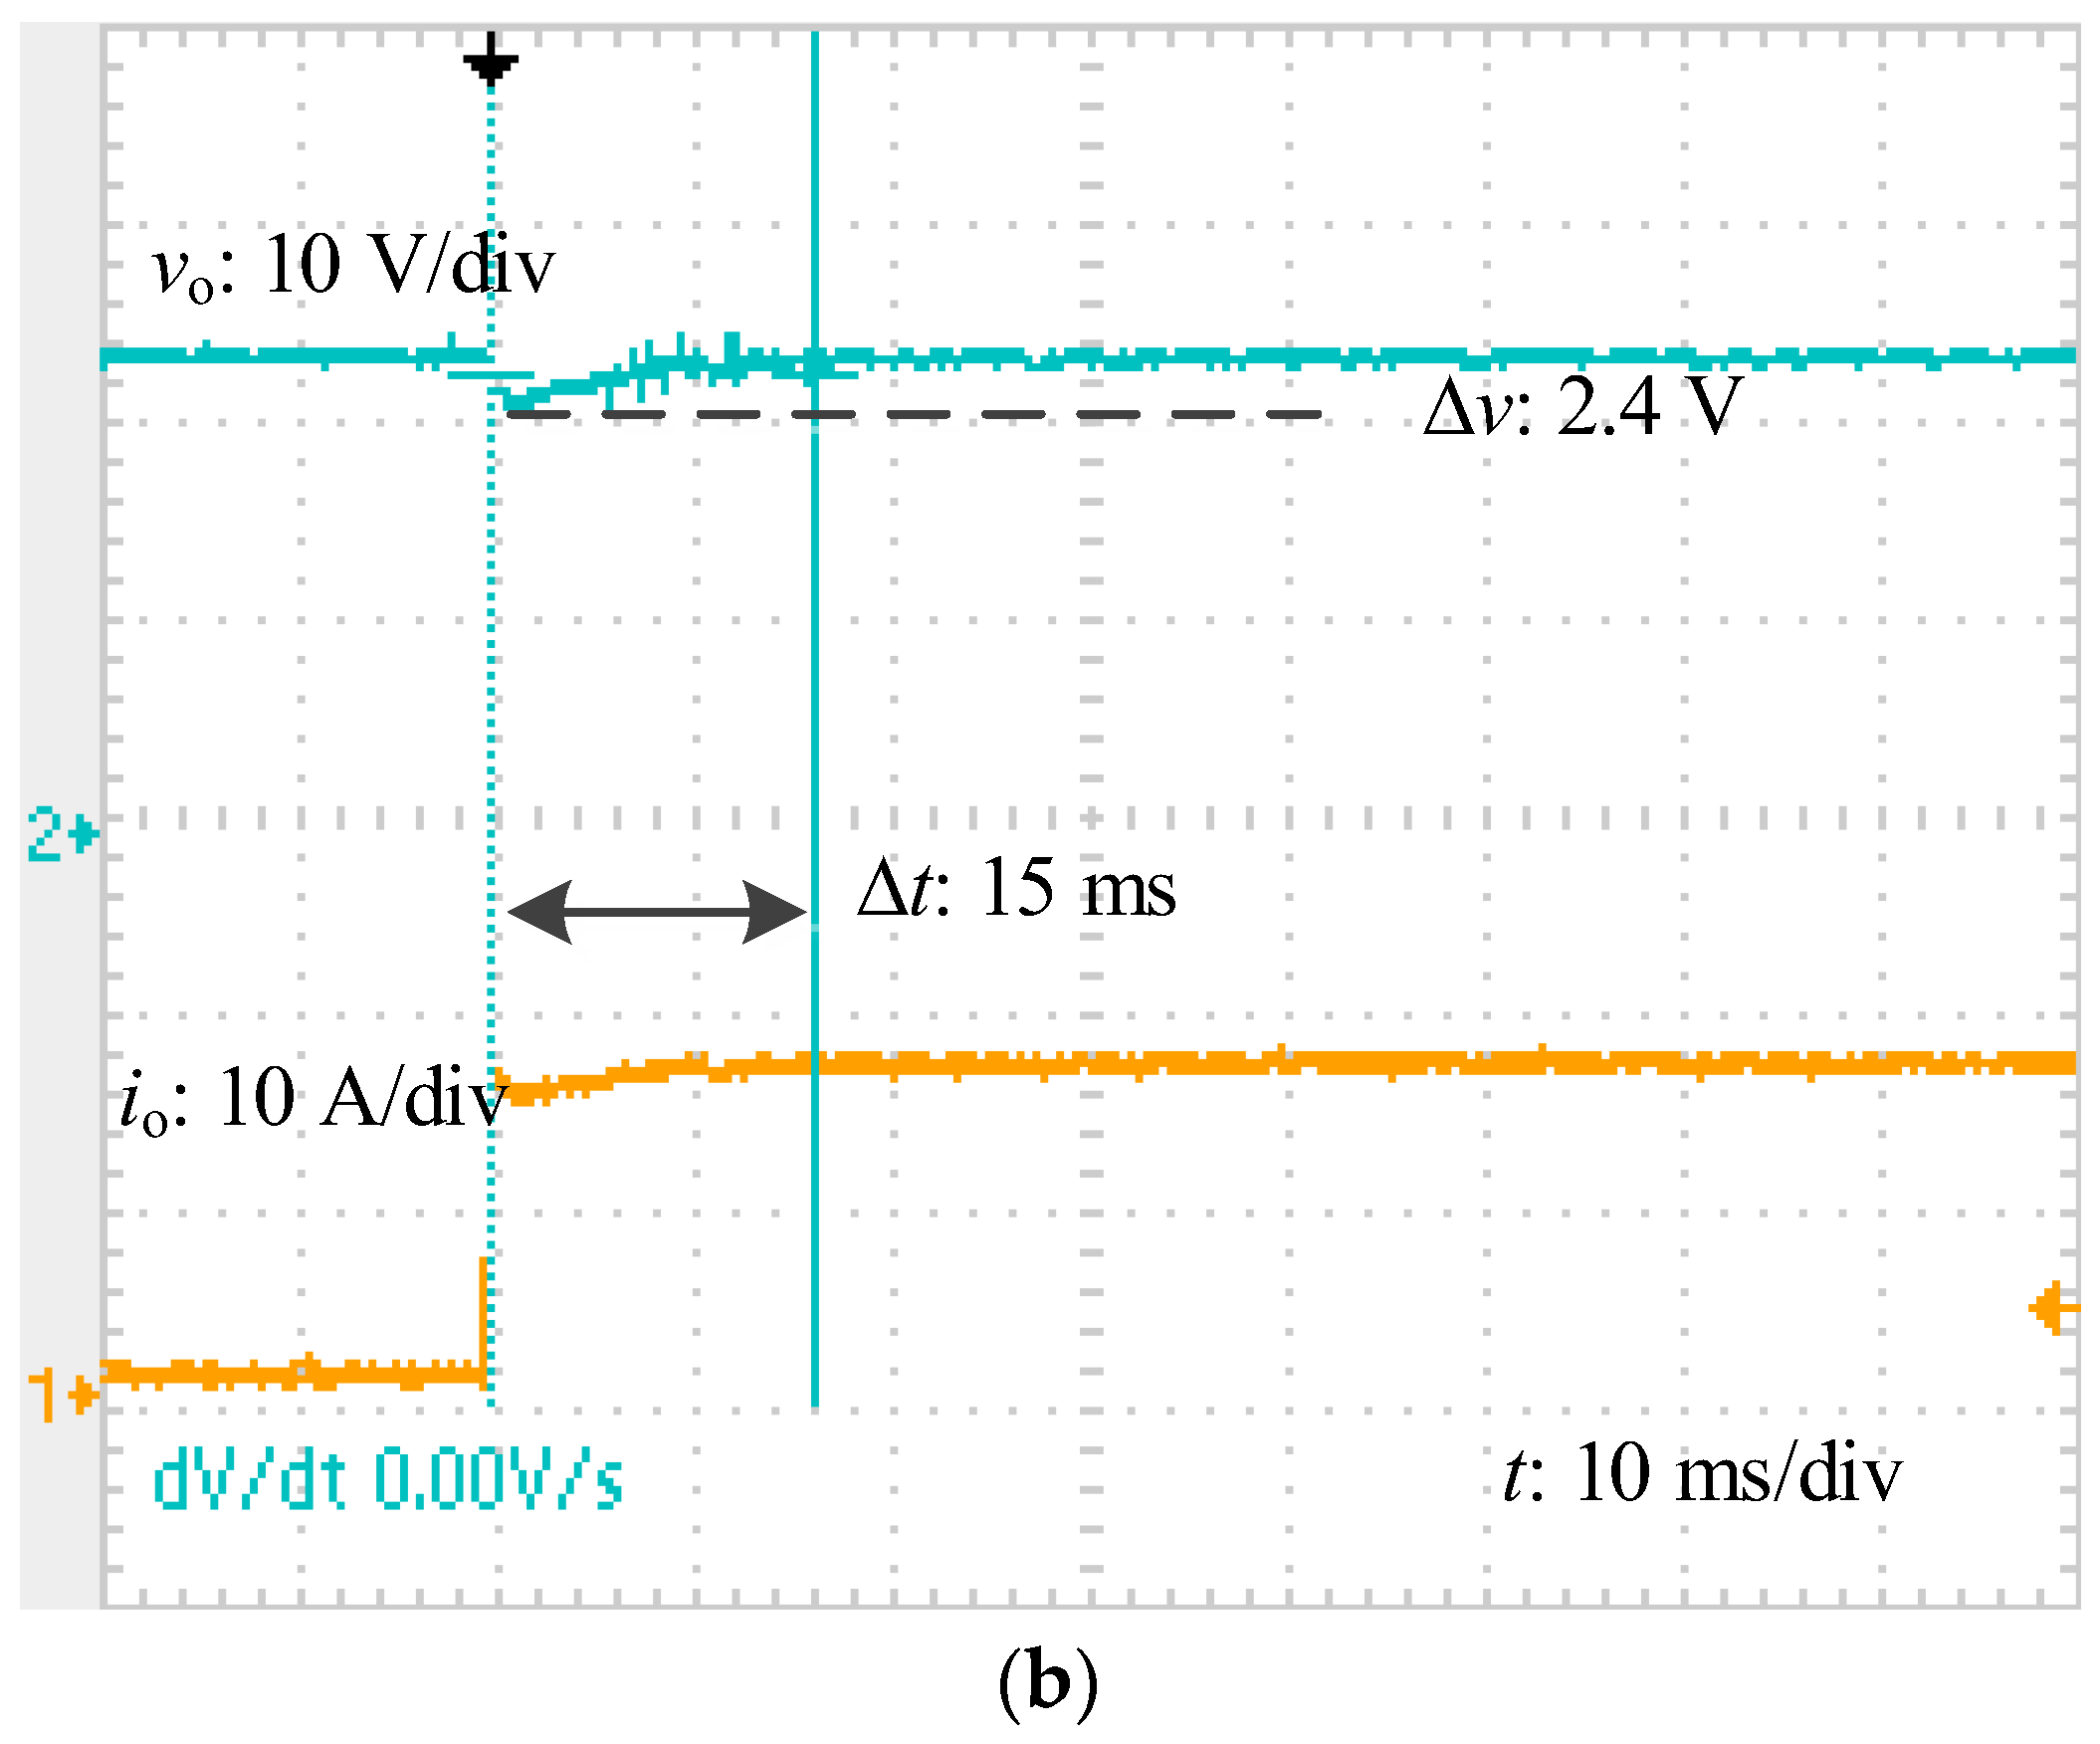
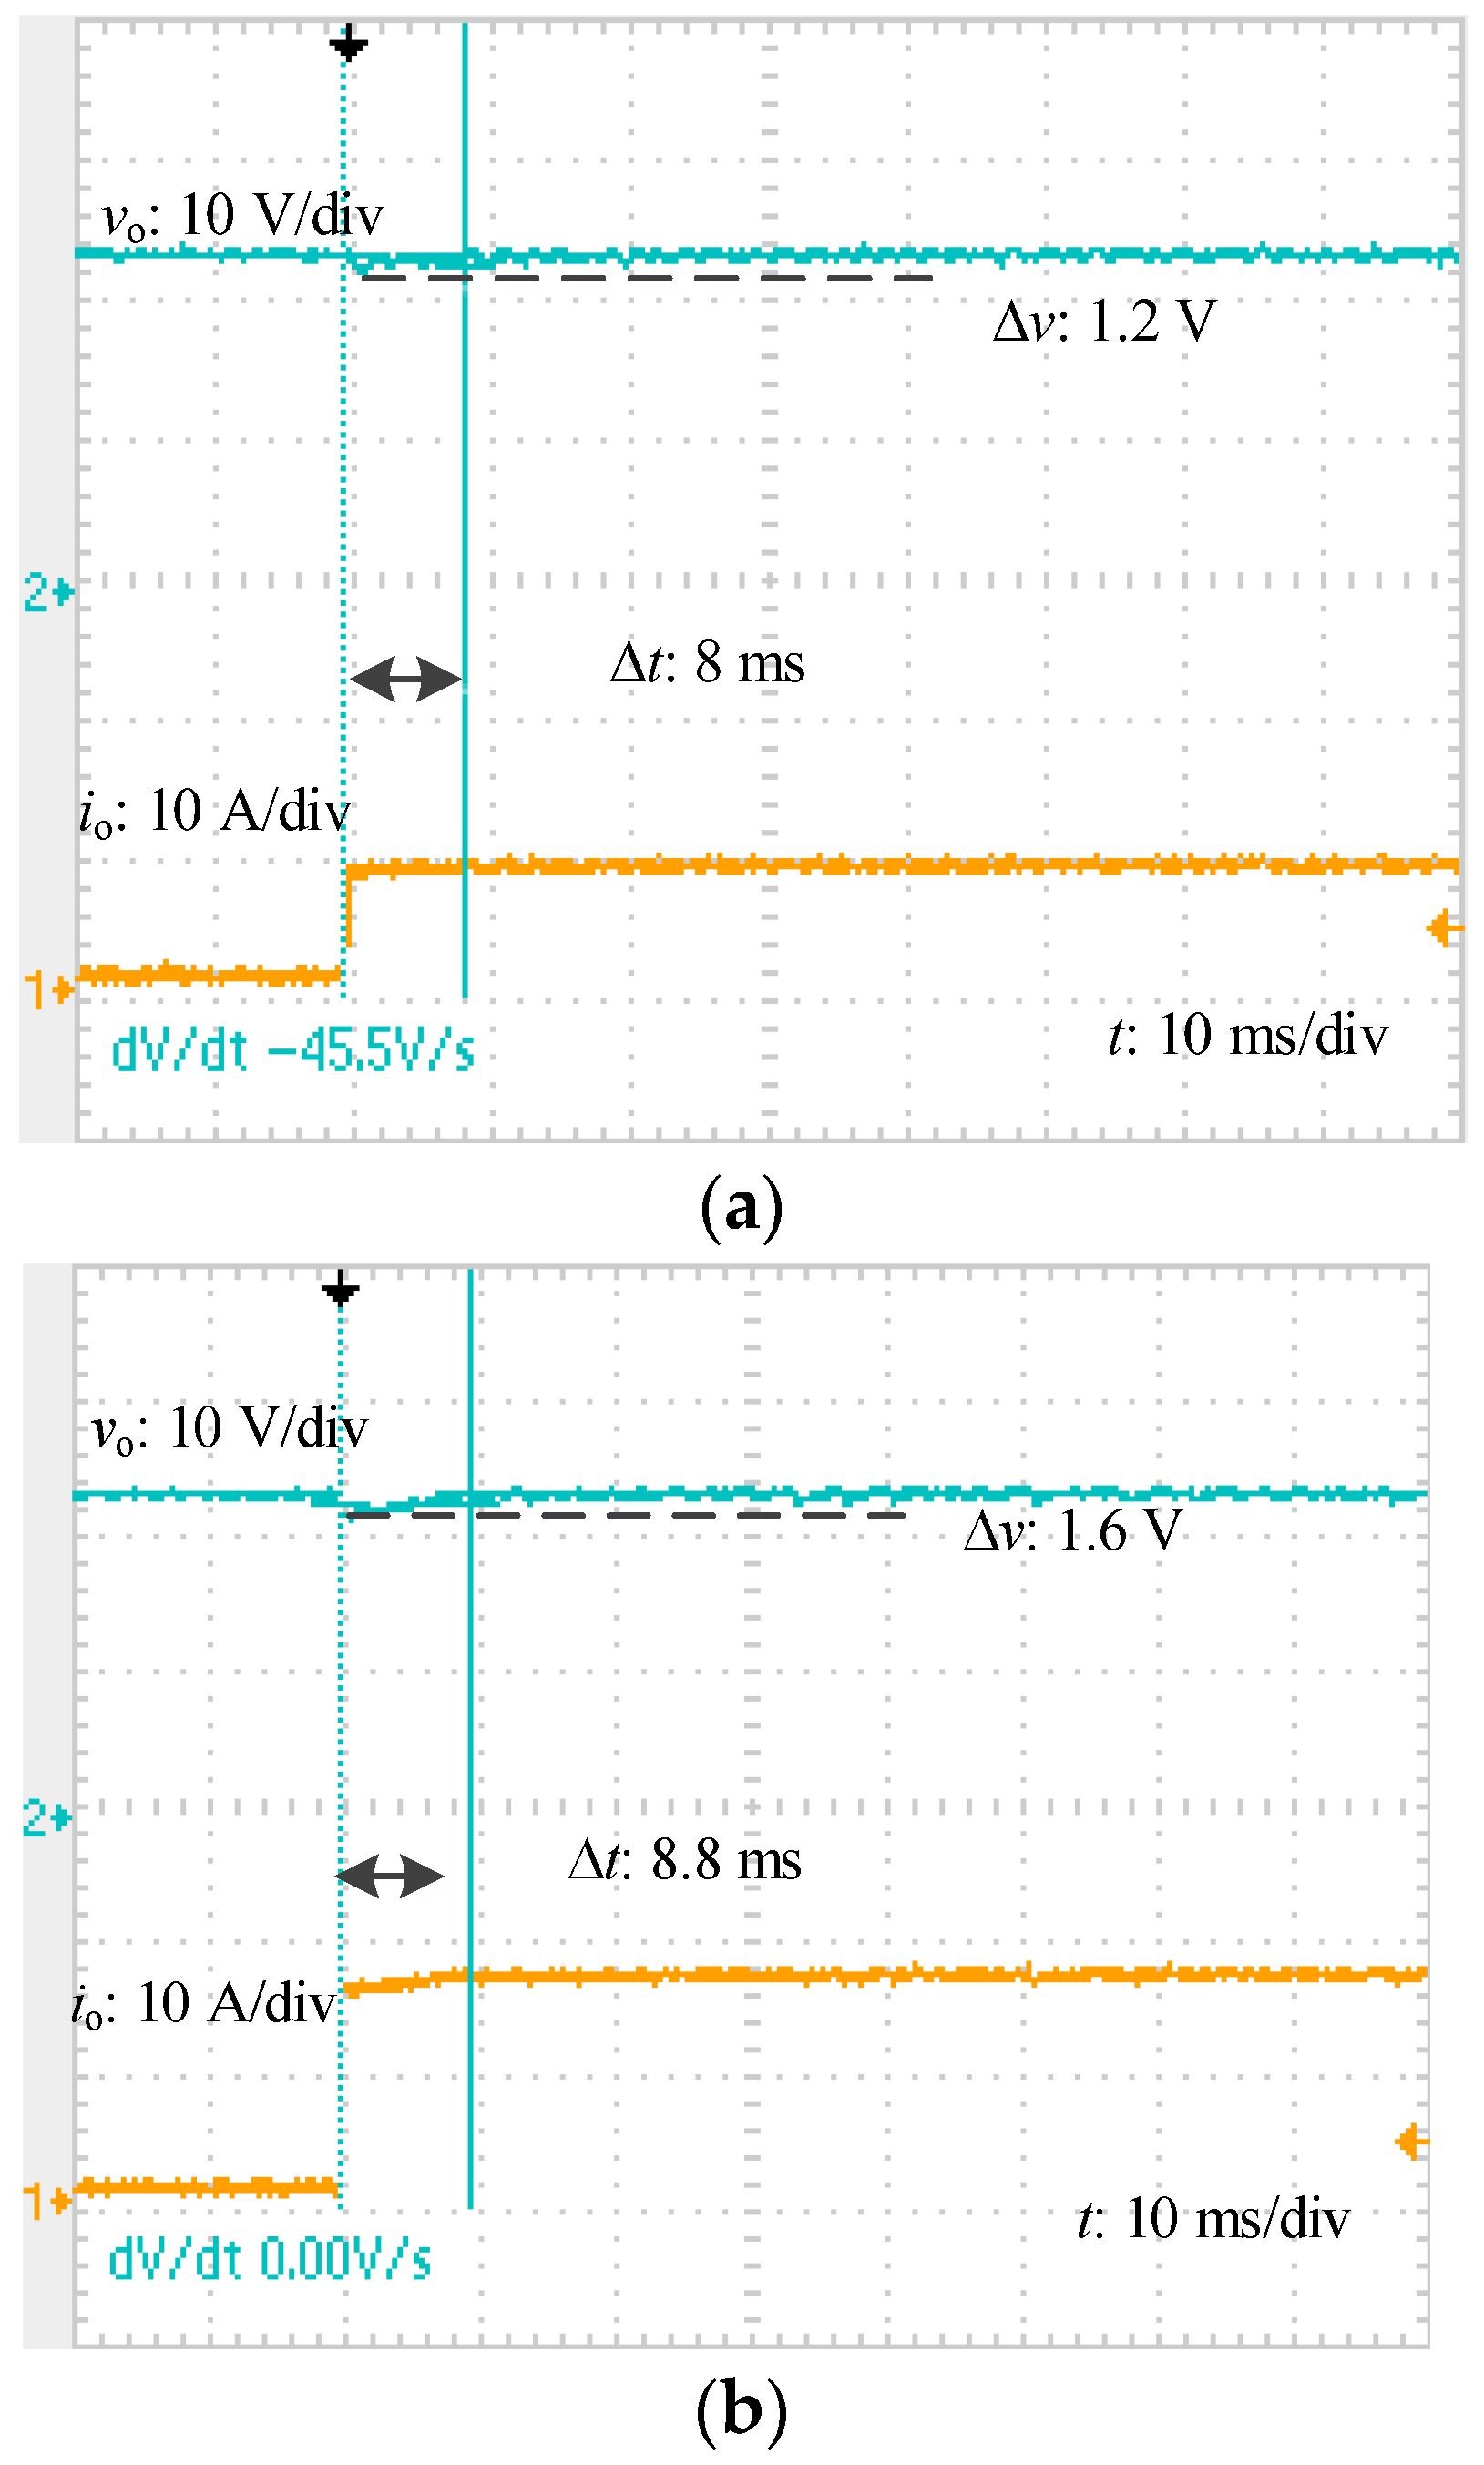
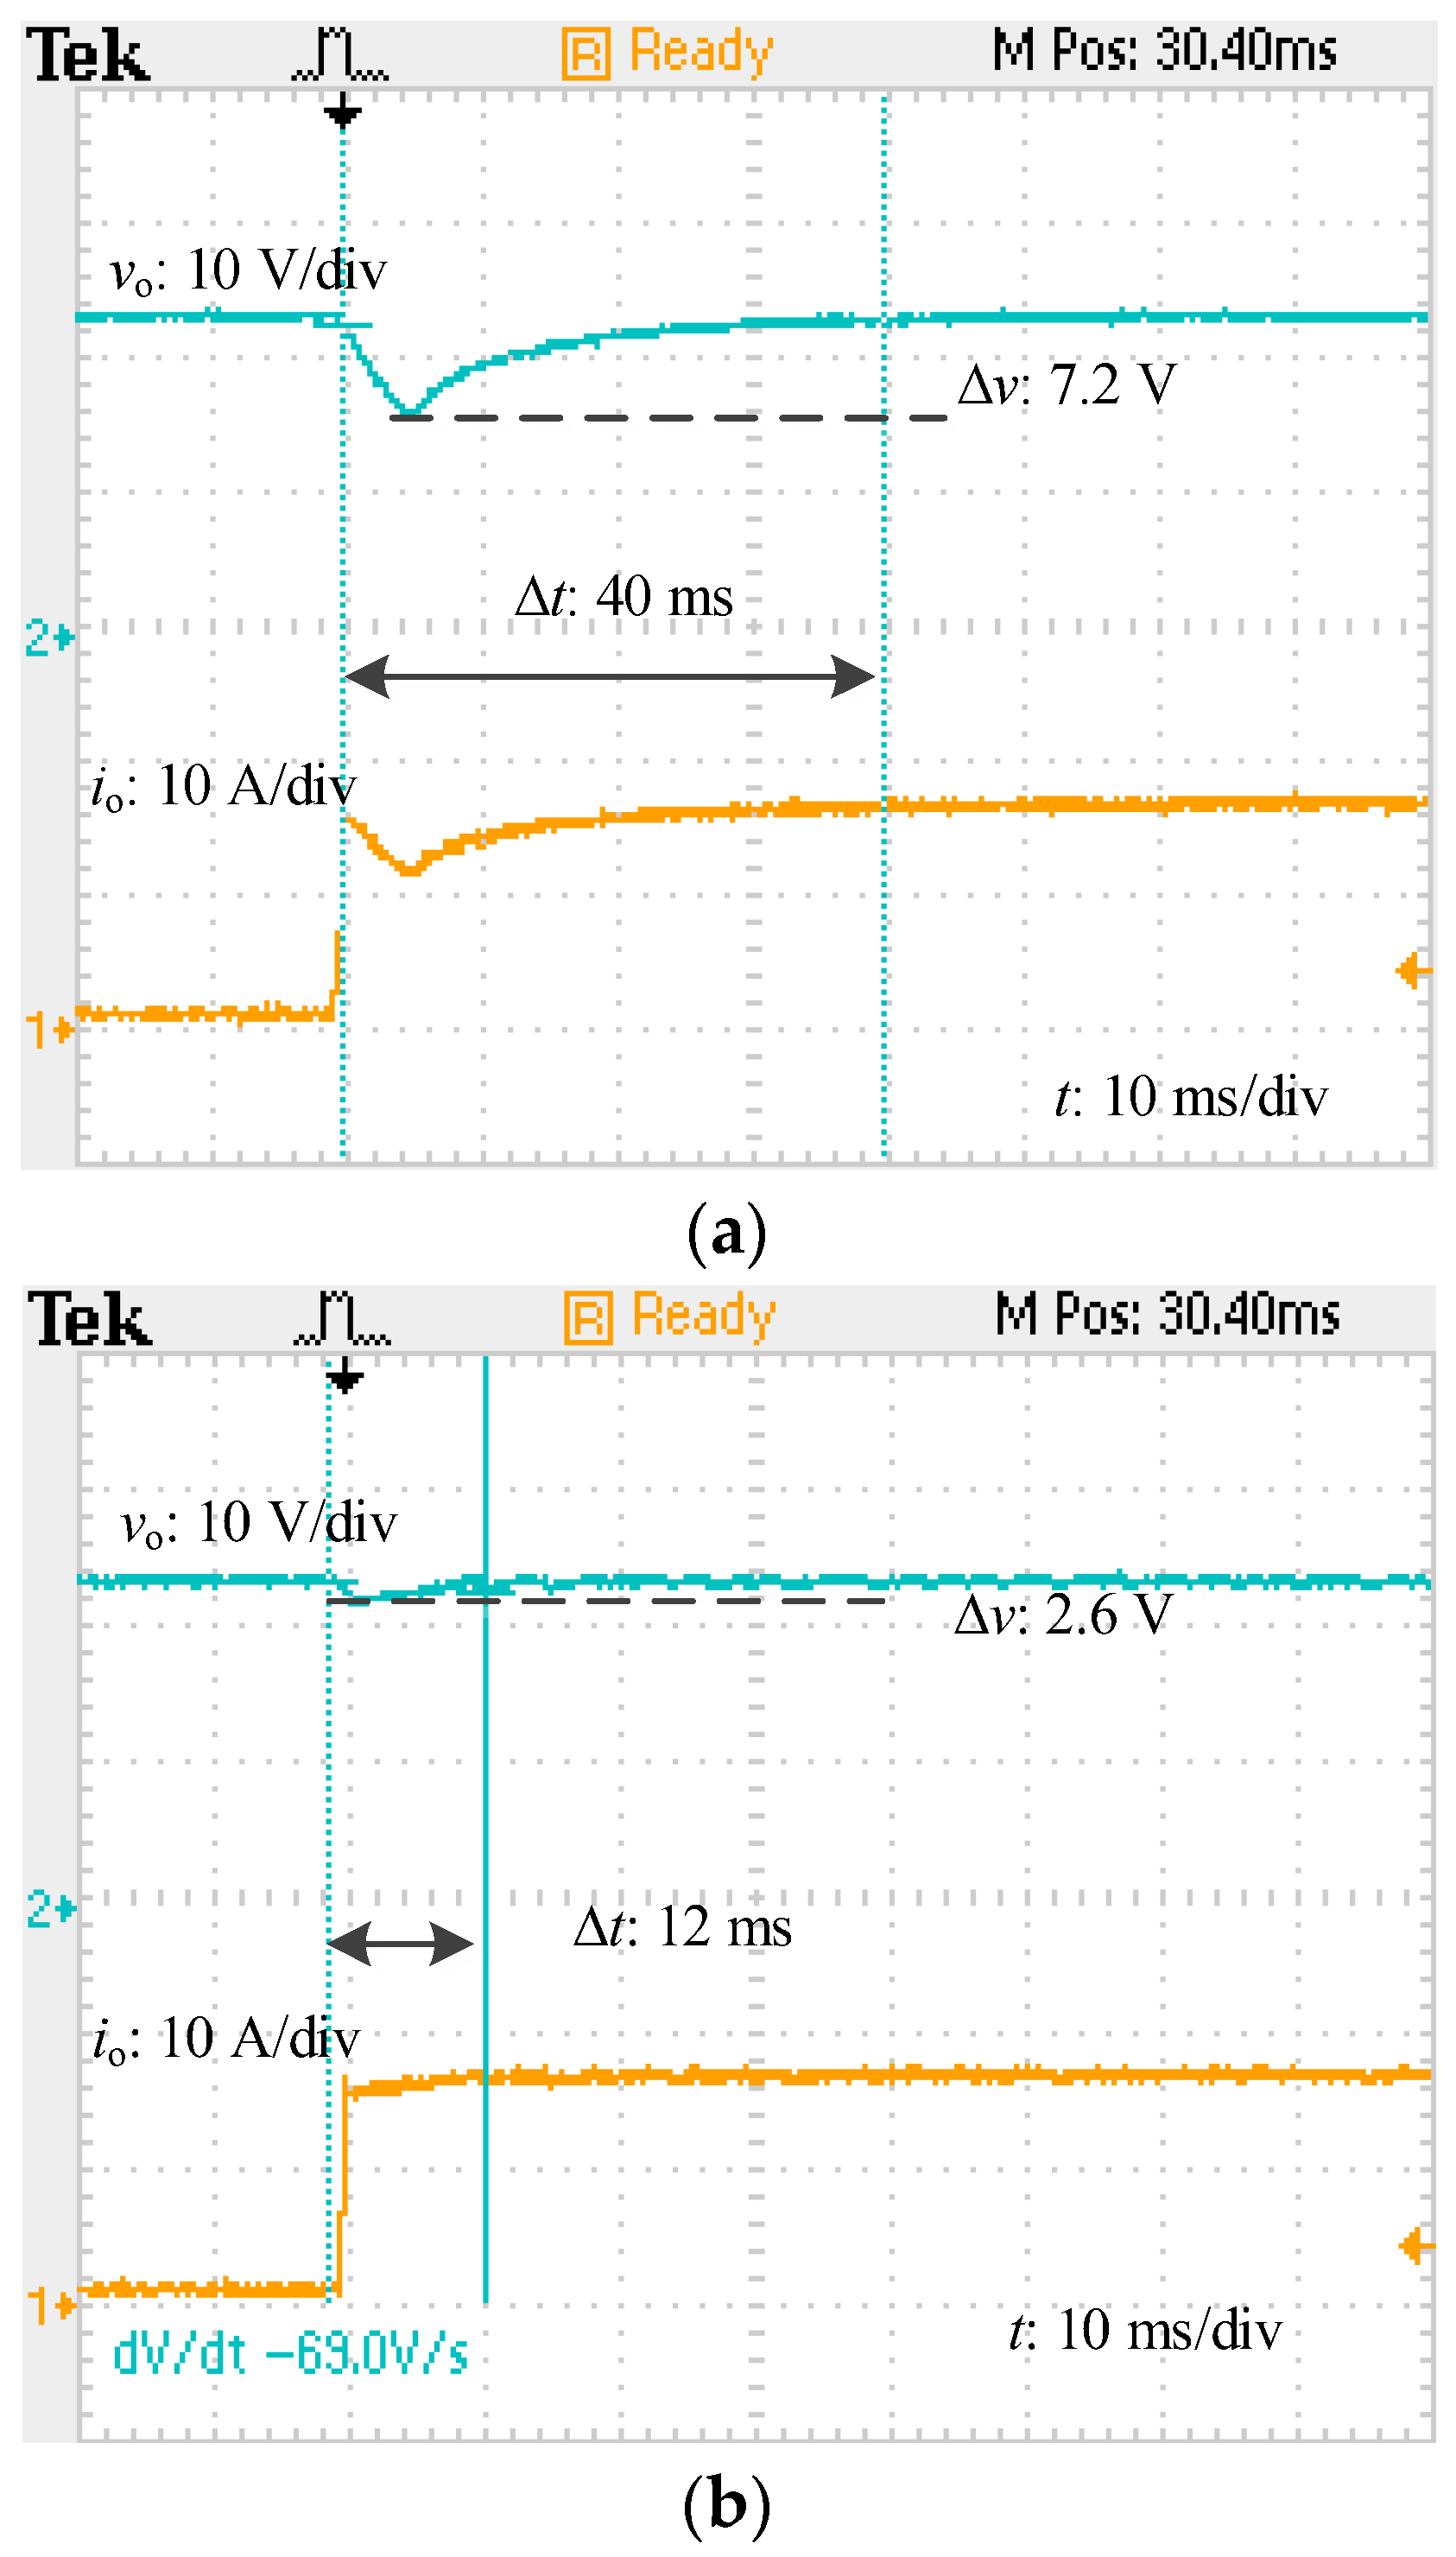
Figure 13 give the voltage and current responses with different compensation parameters under full and half step loads. As the compensation parameters become larger and larger, the dynamic response of the LLC resonant converter becomes faster and faster. Under half step loads, the settling time is reduced from 45 ms to 8 ms and the voltage is reduced from 8.4 V to 1.2 V, with
kp rising from −0.5 to −10. Similarly, under full step loads, the settling time is reduced from 47 ms to 8.8 ms and the voltage drop is reduced from 10 V to 1.6 V. Since the compensation parameters can satisfy the stability criterion, the converter can operate stably during a major disturbance, even with large compensation parameters of −10.
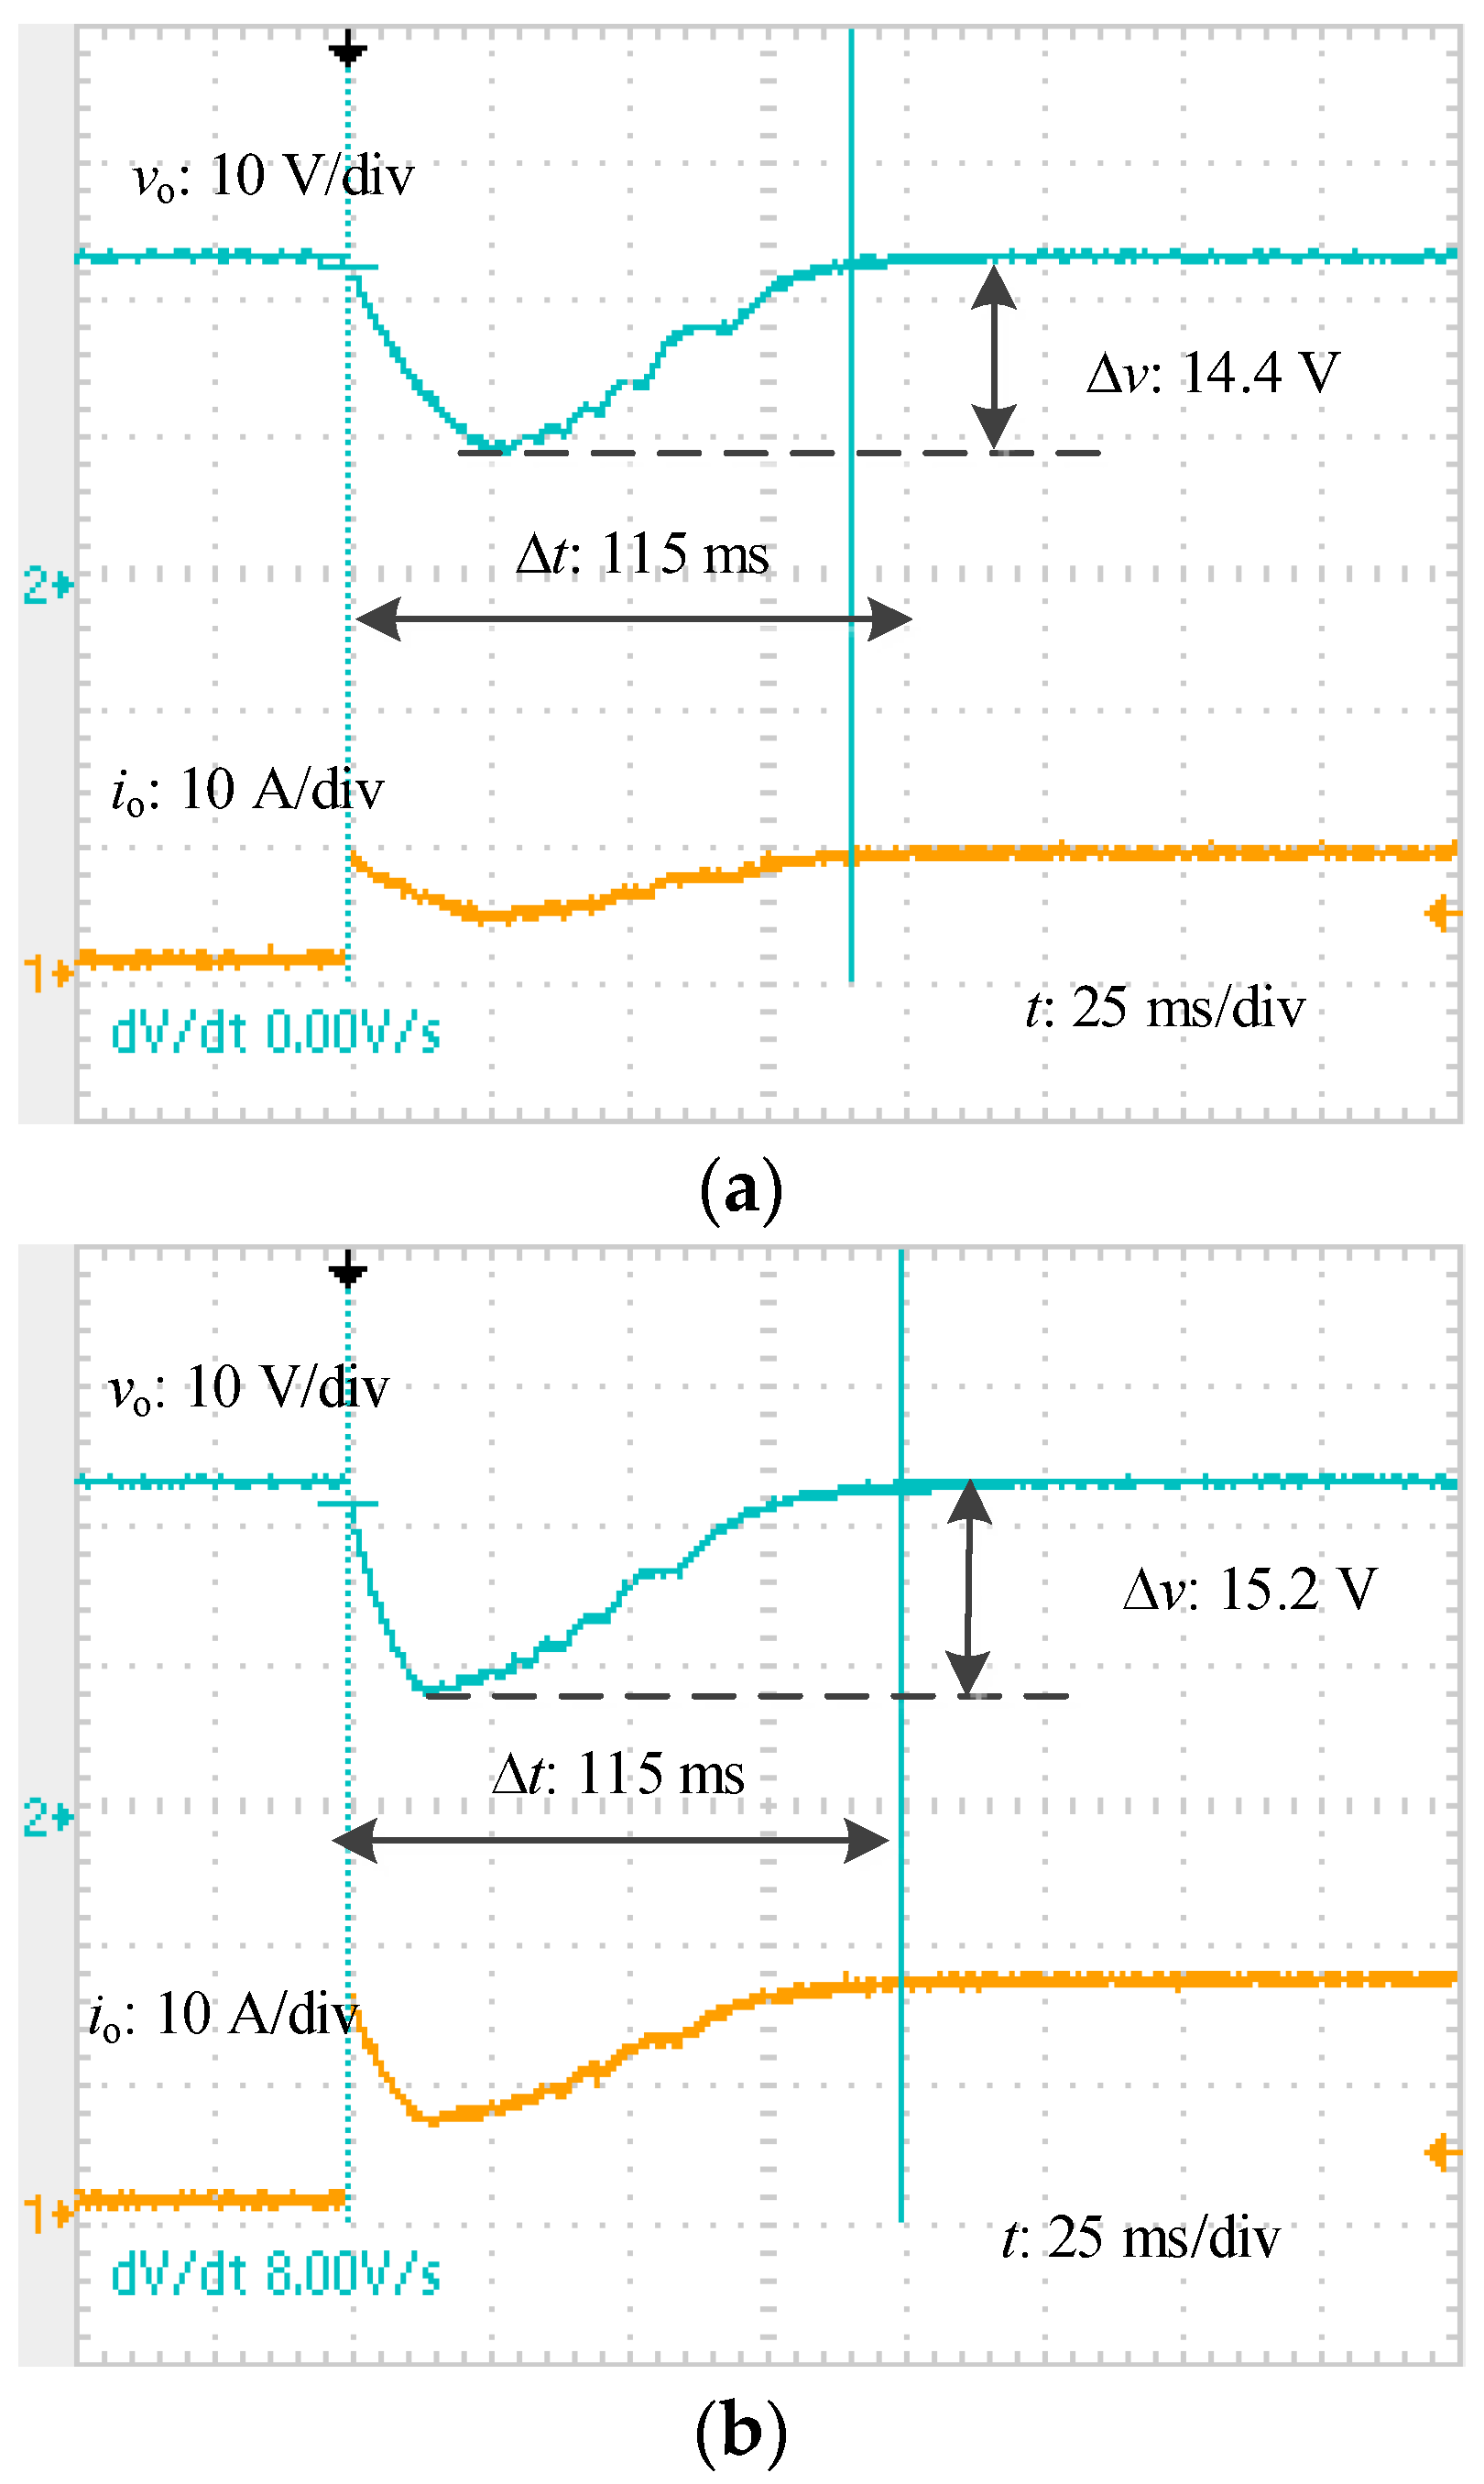
Case 2 (No. 5–8): The frequency range of LLC resonant converter is 50–300 kHz. The frequency is smaller than the peak frequency of 66.41 kHz. With large compensation parameters and disturbance, the frequency may be kept lower than 66.41 kHz during the controlling process. Then the converter cannot satisfy the stable criterion and may be unstable. However, with small compensation parameters and minor disturbance, the frequency should always be larger than 66.41 kHz during the regulating process. The system can satisfy Equation (33) and be stable during the regulation process.
Figure 14,
Figure 15,
Figure 16 and
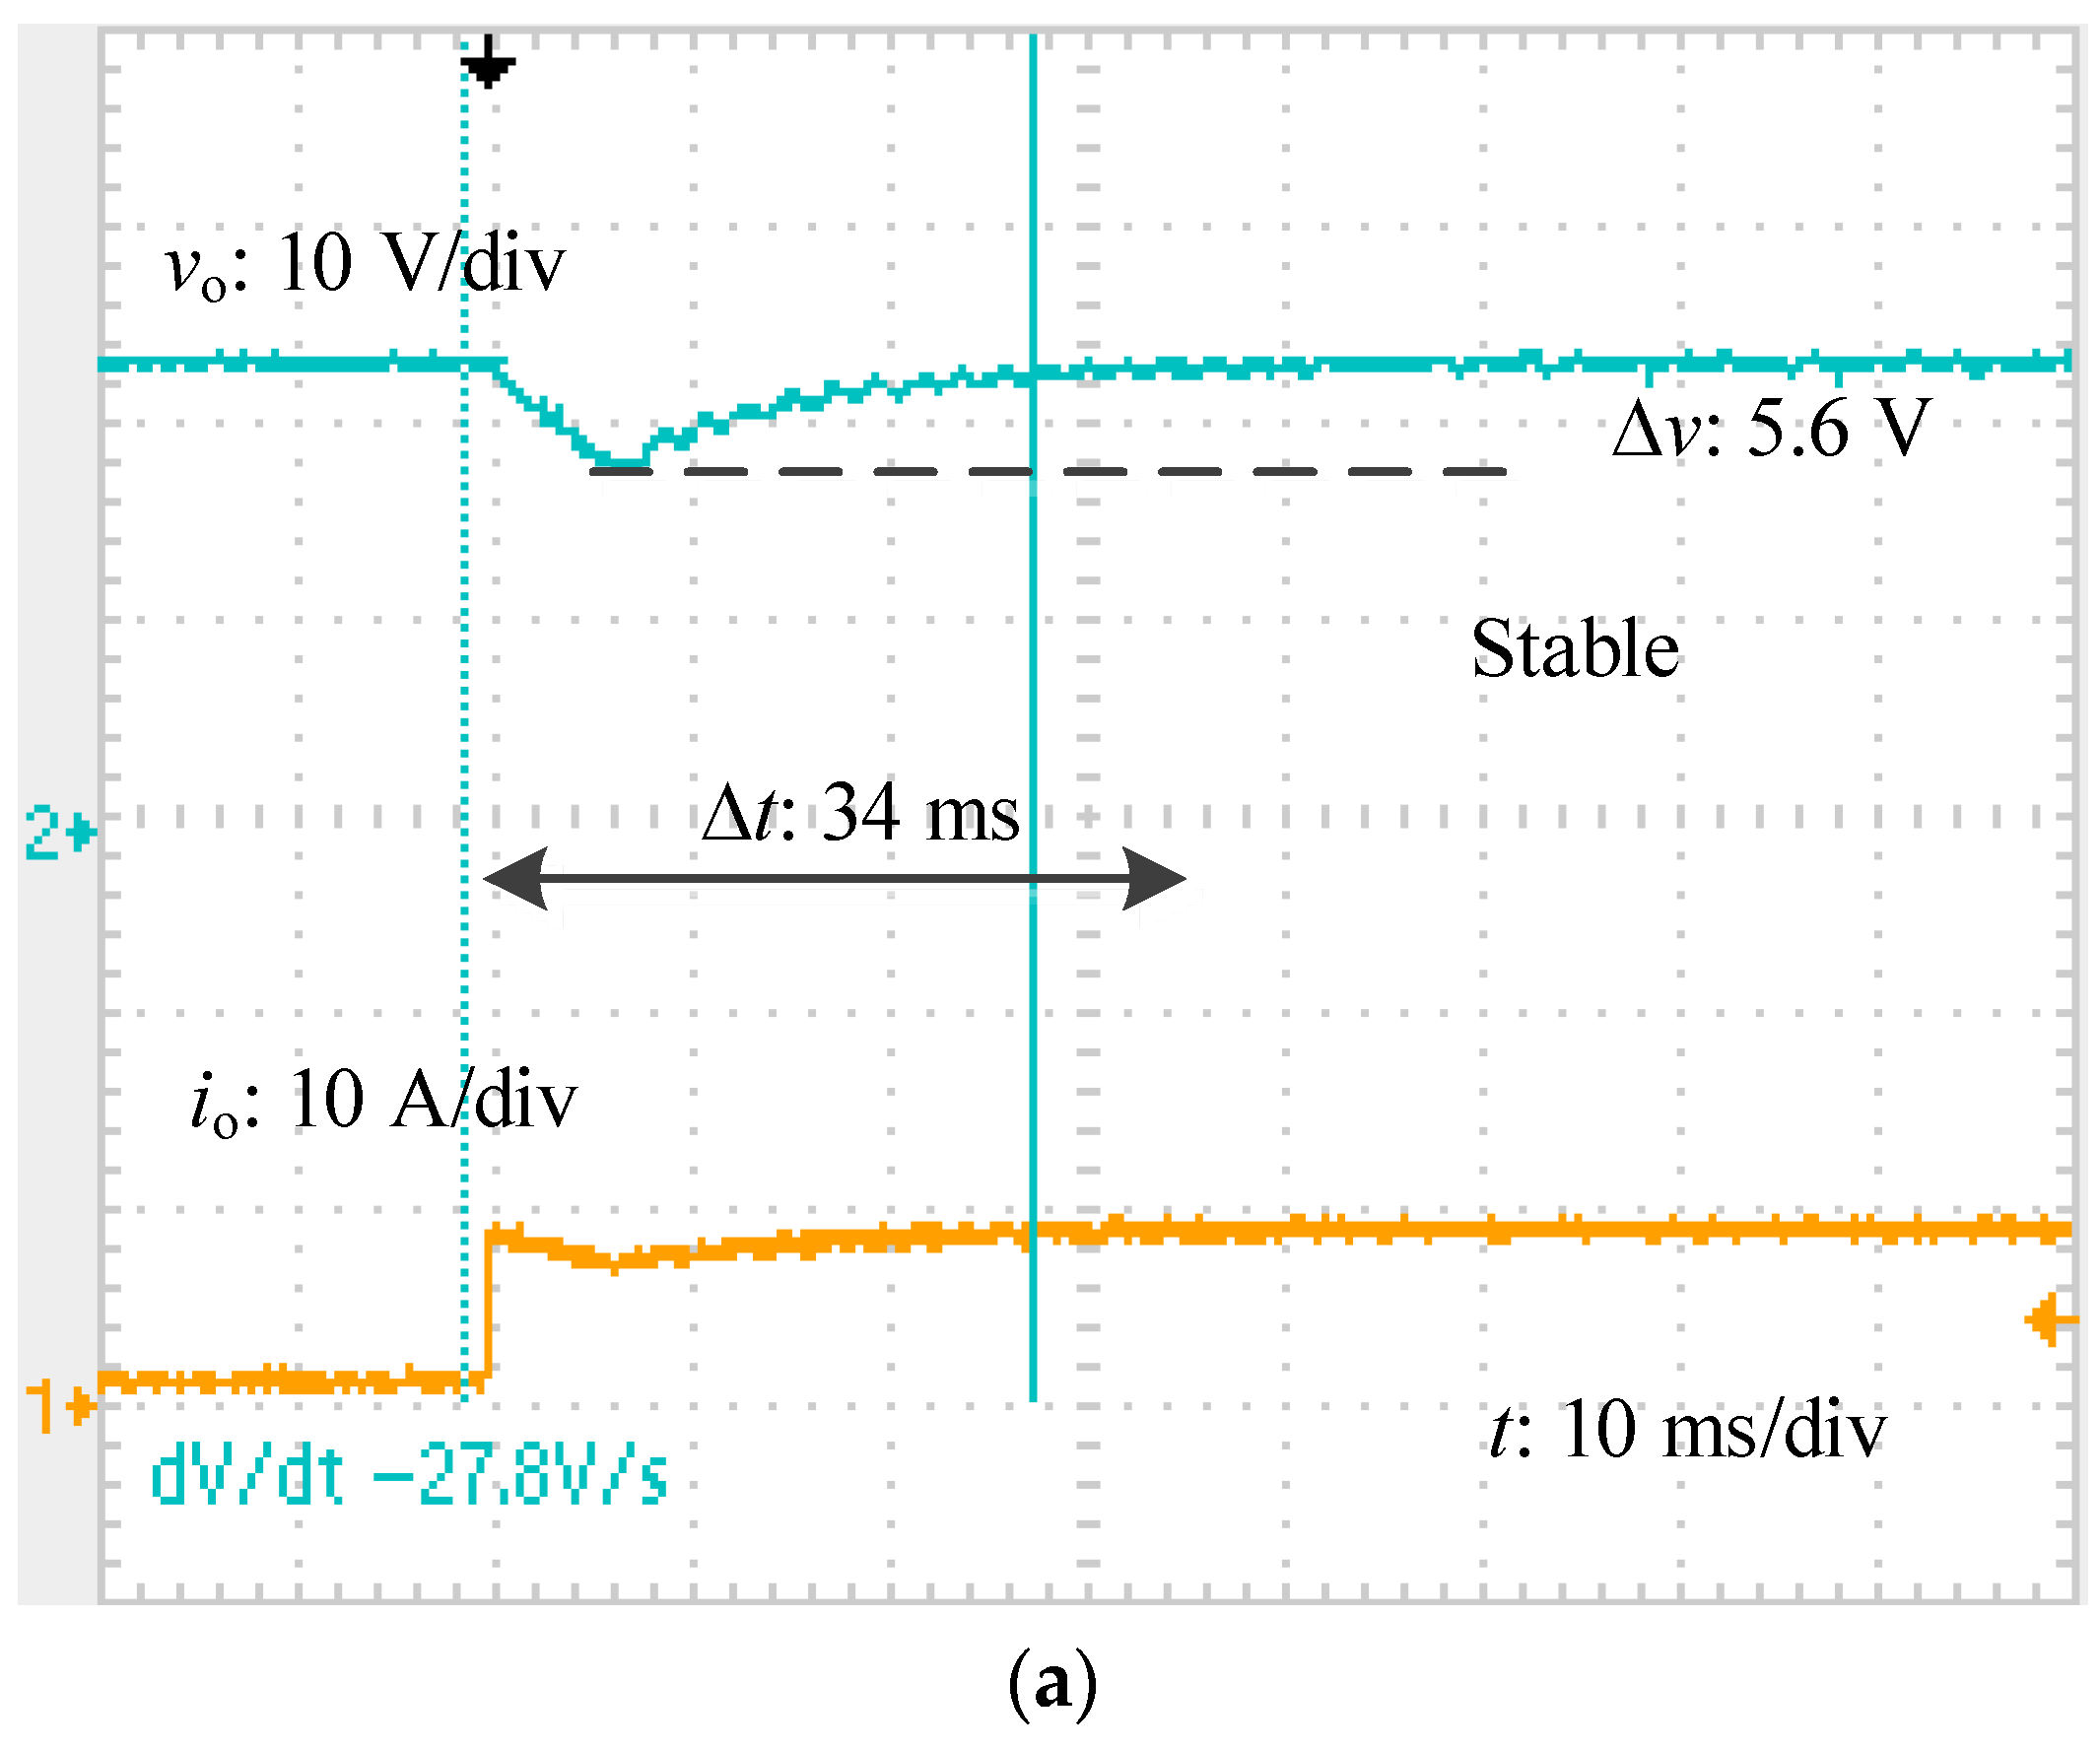
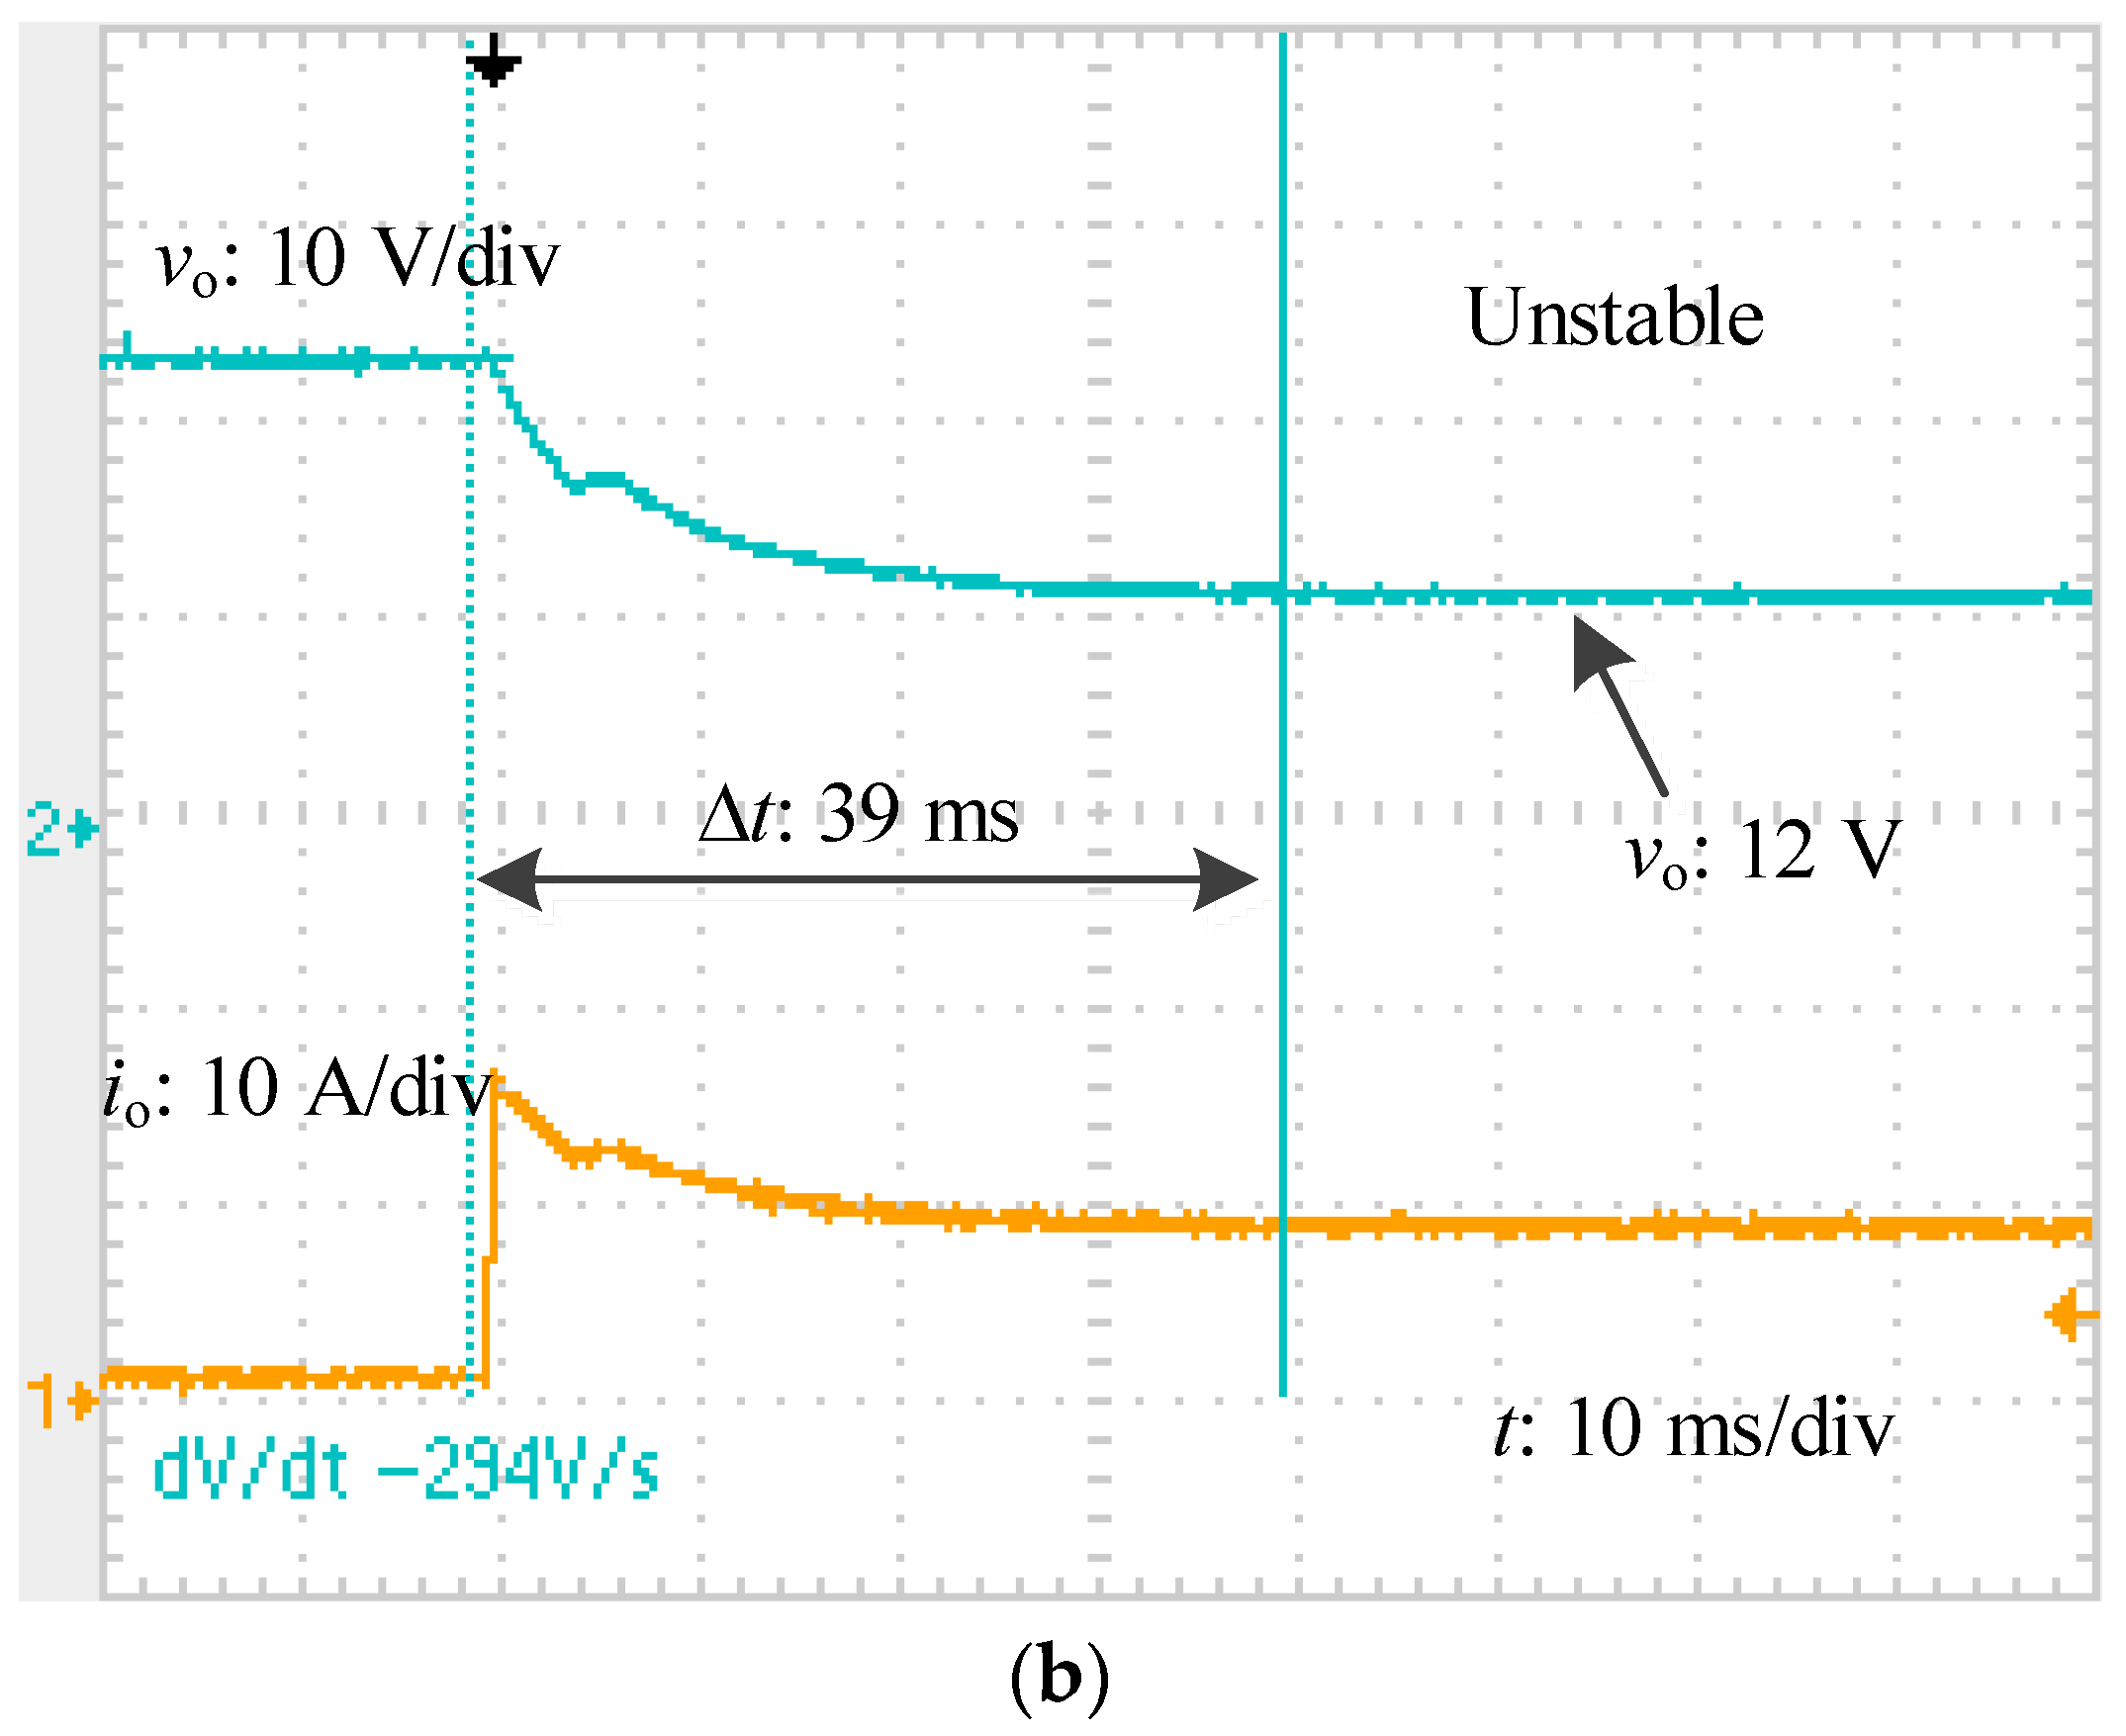
Figure 17 give the voltage and current response with different compensation parameters under full and half step loads. As the compensation parameters become larger and larger, the LLC resonant converter becomes more and more unstable. When the compensation parameters are small, the LLC resonant converter can be stable during a more major disturbance, as shown in
Figure 14 and
Figure 17. When the compensation parameter is increased to −5, the converter cannot operate stably during a disturbance, as shown in
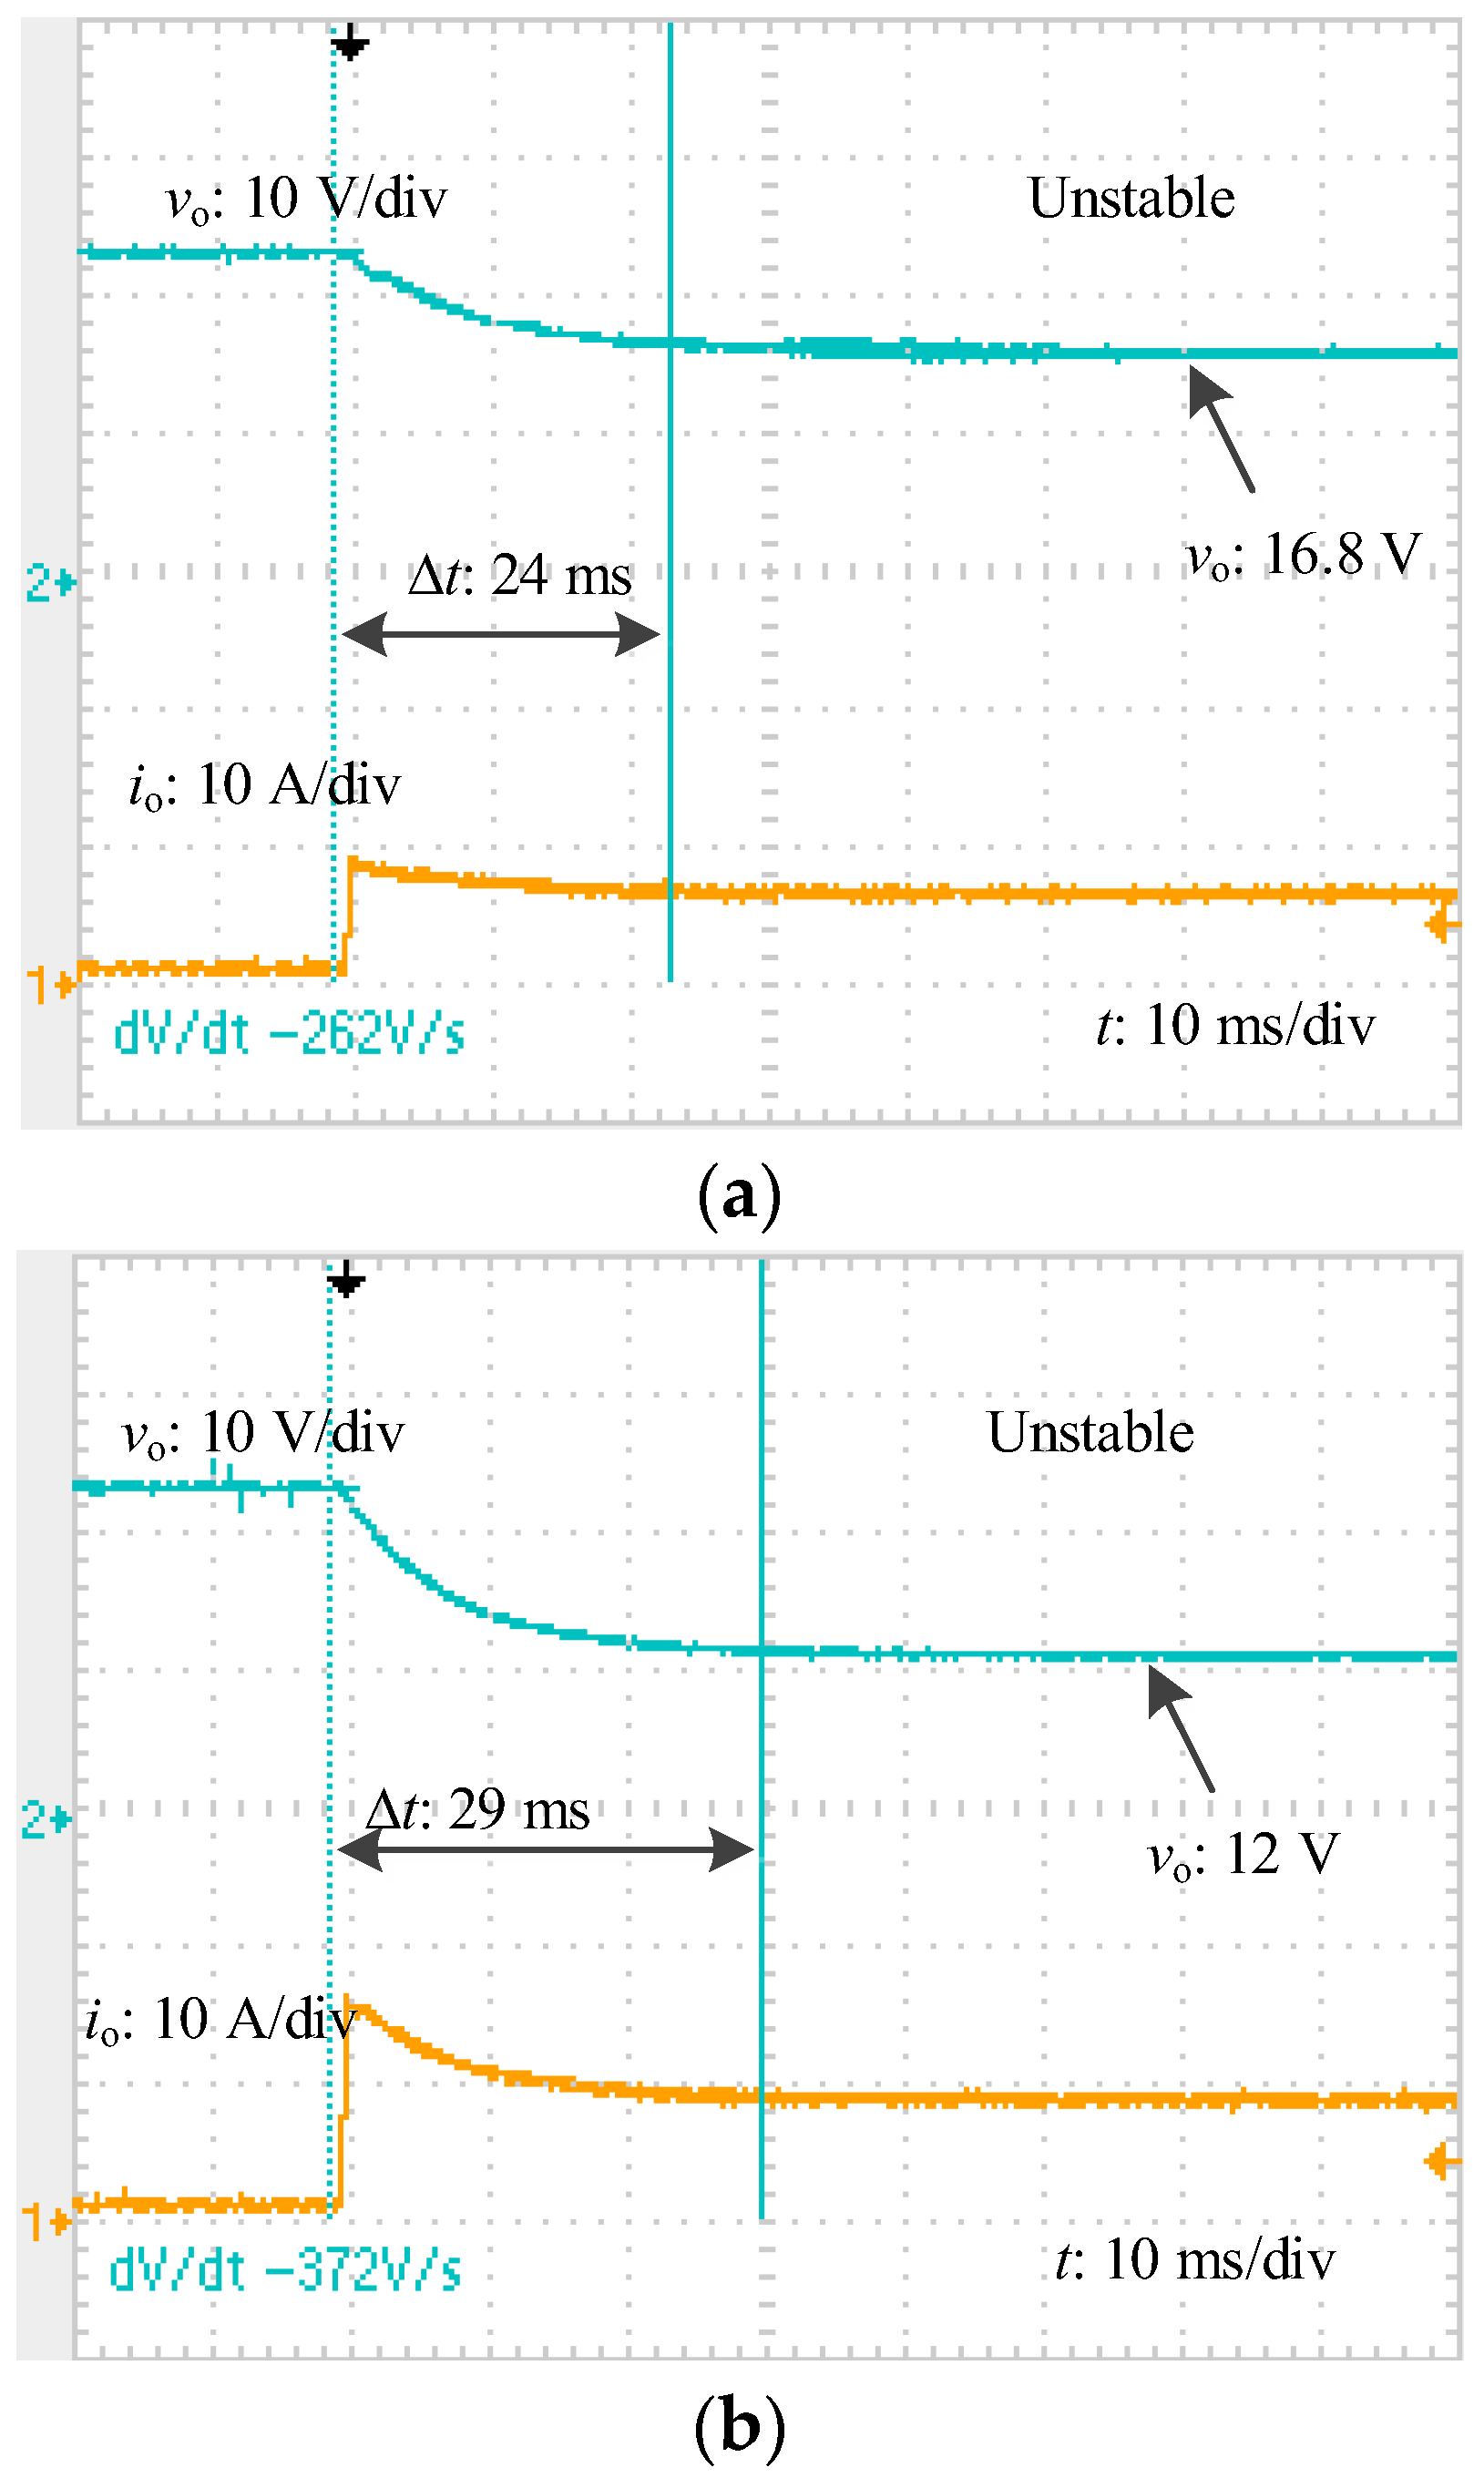
Figure 17. The voltage is maintained at 16.8 V at half loads and 12 V at full loads. The frequency is regulated to 50 kHz due to the saturation, and the converter is unstable. When the converter has the same compensation parameters, a more major disturbance makes the converter more unstable, as shown in
Figure 16. When the compensation parameter is −1, the LLC resonant converter is stable at half step loads and unstable at full step loads. Due to a major disturbance, the frequency remains smaller than 66.41 kHz during the controlling process at full step loads. Then the converter becomes unstable and the output voltage is maintained at 12 V. When the frequency in the saturation is kept smaller than the peak frequency, the converter may be unstable at large compensation parameters and disturbance.
When the frequency in the saturation is larger than the peak frequency, the converter can satisfy the stability criterion even at large compensation parameters. The converter can be stable at full step loads with a large compensation value (
kp = −10), as shown in
Figure 13. If the saturation does not limit the minimum frequency, the frequency cannot satisfy the stable criterion during the regulation process; on the contrary, the converter is unstable at full step loads even with a small compensation value of −1, as shown in
Figure 16b. When the compensation parameters are small enough, the converter can satisfy the stability criterion during the regulation process. The converter has the same dynamic response for both cases, as shown in
Figure 10 and
Figure 15. They are both stable. Therefore, if the converter satisfies the stability criterion in Equation (33), the converter can be stable under any disturbance conditions.
When the trigger control scheme is used, the LLC resonant converter becomes stable in both Cases 7 and 8, as shown in
Figure 18. When the loads change from light to full, the switching frequency is controlled to 50 kHz at the beginning, operating at the capacitive area. The CPD controller detects the positive current and sends a signal to the PI controller, which will force the switching frequency to the peak frequency of 70 kHz. Then the converter will be stable and the output voltage can be regulated to the desired value. The dynamic response with trigger controller in Cases 7 and 8 is similar to that in Cases 2 and 3 since they have the same controlling parameters. Therefore, the trigger controller can effectively extend the operational range of the LLC resonant converter.


