

What Accelerates the Choice of Mobile Banking for Digital Banks in Indonesia?


1
School of Business, IPB University, Bogor 16151, Indonesia
2
Department of International Business Management, Bina Nusantara University, Tangerang 15325, Indonesia
3
Department of Economics and International Center for Applied Finance and Economics, IPB University, Bogor 16680, Indonesia
4
Department of Mathematics, IPB University, Bogor 16680, Indonesia
*
Authors to whom correspondence should be addressed.
J. Risk Financial Manag. 2024, 17(1), 6; https://doi.org/10.3390/jrfm17010006
Submission received: 10 November 2023
/
Revised: 12 December 2023
/
Accepted: 15 December 2023
/
Published: 21 December 2023
(This article belongs to the Section Banking and Finance)
Abstract
:The recent COVID-19 pandemic has led to changes in business, technology, and social interactions, creating a new normal that has important implications for the role of technology, including mobile banking services that offer safer and more hygienic payment methods than cash. Innovations in mobile banking services have been considered to have the ability to provide unbanked customers with better access in growing markets such as Indonesia, which still has a huge unbanked population of 100 million people. This study evaluates the driving factors of mobile banking adoption by 1441 banking customers among major digital banks in Indonesia. Data collected between September 2022 and March 2023 were examined using PLS-SEM with Smart PLS 4.0.9.6. This study extends the Decomposed Theory of Planned Behavior (DTPB) framework by including Disease Risk, Trust, Firm Reputation, Perceived Risk, Performance Risk, Privacy Risk, Financial Risk, Psychological Risk, Time Risk, and Disease Risk. The findings show that Trust, Attitude, Perceived Behavior Control, Perceived Risk, Psychological Risk, and Disease Risk play a significant role in respondents’ intention to adopt mobile banking services. In contrast, Subjective Norm, Firm Reputation, Performance Risk, Privacy Risk, Financial Risk, and Time Risk had lower impacts. The findings suggest that users choose mobile banking over cash as a safety measure. As a result, banks must prioritize their mobile banking innovations tailored to personalized user experience to deepen engagement, with easy-to-use navigation that fits the lifestyles, values, and needs of banking customers.
1. Introduction
Digitalization in banking has changed the banking landscape due to advances in mobile technology, especially during the COVID-19 outbreak, which led to significant shifts in people’s daily lives. Social distancing constraints caused by COVID-19 played a part in speeding up the use of digital payments. Innovation in payments, such as mobile banking, has been considered to have the potential to provide unbanked customers with banking and electronic transaction services, especially in markets that continue to grow and develop (Ahlstrom et al. 2020). In Indonesia, the Financial Services Authority (OJK) issued 12/POJK.03/2018, which regulated the implementation of commercial banks’ digital banking services, including mobile banking services, and welcomed the digital banking age (Financial Services Authority 2018). Commercial banks have since introduced mobile banking technology, offering banking services such as receiving payments, transferring money, bill payments, top-up e-wallet services, providing mobile brokerage (trading financial instruments), bank balance inquiries, bank statement requests, ATM locations, foreign exchange rates, and investments (government bonds). With more than 60% of the population currently in their productive age and over 140 million people actively working (BPS Indonesia 2022), Indonesia is an attractive market for the growing digital banking market (Anderson 2009), where the digital economy continues to grow by double digits, regardless of the challenges faced during the coronavirus outbreak that started in 2020 (Google et al. 2020). The Central Bank of Indonesia (Bank Indonesia) also contributed to the rapid expansion of digital payments by issuing 21/18/PADG/2019 on implementing the Quick Response Code Indonesia Standard (QRIS), which enables QR Code payments using mobile banking devices (Bank Indonesia 2019b). These events aided in the growth of mobile banking transactions in Indonesia by 59.3 percent annually in 2021. Despite the rapid growth and technological advances, Indonesia still continues to have a large unbanked population of 100 million people (World Bank 2022).
Consumer behavior in Indonesia has also changed (Google et al. 2020) because of customers’ willingness to use non-physical money, as they are positively influenced by their perception of the risk of virus transmission. These economic, technological, and social changes have created a new normal business environment as part of the post-pandemic recovery after the COVID-19 outbreak (Ahlstrom et al. 2020). Organizations, including banks, have changed because of the new normal business environment, enabling unbanked customers to leapfrog directly into mobile banking, bypassing other traditional banking channels. This phenomenon offers commercial banks an intriguing opportunity to develop a competitive advantage to create sustainable growth in response to changes in consumer banking behavior. Therefore, this study aims to provide a better understanding regarding the changes in the new normal business environment by refining the Decomposed Theory on Planned Behavior (DTPB) framework, including Disease Risk, Trust, Firm Reputation, Perceived Risk, Performance Risk, Privacy Risk, Financial Risk, Psychological Risk, and Time Risk to explain mobile banking services acceptance.
2. Literature Review
2.1. Decomposed Theory on Planned Behavior (DTPB)
Several earlier studies have investigated the determinants of IT adoption and usage by individual users, such as mobile banking adoption using social psychology theories, namely the Technology Acceptance Model (TAM) (Davis 1989), Theory of Planned Behavior (TPB) (Ajzen 1991), Decomposed Theory of Planned Behavior (DTPB) (Taylor and Todd 1995), Innovation Diffusion Theory (IDT) (Rogers 1995), and Unified Theory of Acceptance and Use of Technology (UTAUT) (Venkatesh et al. 2003). These studies investigate social psychological factors to determine consumers’ intentions to adopt information technology systems. The TAM model proposes that the Attitude towards Usage is determined by the direct and indirect influences of Perceived Use and Perceived Usefulness. In contrast, the DTPB model was developed by Taylor and Todd (Taylor and Todd 1995) by extending the original TPB model and identifying the factors directly affecting Attitude (ATT), Subjective Norm (SN), and Perceived Behavior Control (PBC) through Behavioral Intention (BI). Previous studies by Giovanis et al. (2019) and Lin (2007) concluded that the DTPB model outperforms the TAM, TPB, and UTAUT models by better reflecting potential adopters’ intentions to adopt mobile banking services. Although earlier studies on accepting mobile banking have been conducted, it is still uncommon to conduct research employing the DTPB model (Giovanis et al. 2019). In this study, Health (Disease Risk) is considered an important predictor of consumer behavioral intention (Aji et al. 2020; Aldiabat et al. 2022; Saraswati et al. 2021). To the best of our knowledge, no study has examined technology adoption using the DTPB framework together with Health Risk (Disease Risk), Trust, Firm Reputation, and other risk variables. Therefore, this study aims to improve previous research and enhance the understanding of mobile banking adoption by refining the DTPB framework by adding Health Risk (Disease Risk), Trust, Firm Reputation, Perceived Risk, Performance Risk, Privacy Risk, Financial Risk, Psychological Risk, and Time Risk (Giovanis et al. 2019; Featherman and Pavlou 2003).
2.2. Hypothesis Development
The DTPB framework assumes that actions are influenced by BI, which, in turn, is affected by ATT and SN. ATT refers to an individual’s positive or negative feelings towards performing a target behavior (Taylor and Todd 1995) and is decomposed into three components: Perceived Usefulness (PU), Perceived Ease Of Use (PEOU), and Compatibility (COMP). PU is defined as the degree to which a person believes that using a specific system will improve his/her job performance (Venkatesh et al. 2003), whereas PEOU is defined as the degree to which the user expects the target system to be effortless (Davis 1989; Wessels and Drennan 2010). COMP is the degree to which technology fits an individual’s working style, lifestyle, values, and needs (Aldiabat et al. 2022). This study defines ATT as the sub-dimensions PU, PEOU, and COMP, where ATT promotes and influences the adoption of mobile banking. The TPB model classifies SN into two constructs: interpersonal and external. Interpersonal Influence (IPI) assesses the impact of friends, coworkers, and superiors as perceived through word of mouth, whereas External Influence (EXI) considers news reports, advice from opinion leaders, and other information expressed by mass media, including social media. The framework proposed in this study investigates SN variables that encourage the use of mobile banking services. The PBC component of the TPB model was developed into Self-efficacy (SEF) and Facilitating conditions (FC). In mobile banking, the first dimension, SEF, relates to a consumer’s self-assessment of his or her ability to use mobile banking services. The second dimension, FC, assesses the availability of resources required to carry out certain operations, such as mobile banking. Other studies, such as (Wessels and Drennan 2010; Dahlstrom et al. 2014), validated the relevance of the PBC structure (SEF and FC), reaffirming the confidence in including PBC factors in this study.
A bank’s role is to manage money based on Trust (TRU) (Zhou 2012). The banking sector was initially based on customer trust, including mobile banking. A study by (Hanafizadeh et al. 2014) concluded that TRU influences PU, and both factors influence the intention to use mobile banking. Consequently, customer trust must be acquired and maintained over time, and banks must understand the risks that customers perceive when identifying and removing adoption barriers (Featherman and Pavlou 2003). Another study (Kim et al. 2009) presented the initial trust model (ITM), which includes trust propensity, structural assurance, firm reputation, and relative benefits, to explain initial trust in mobile banking. However, in this study, structural assurance is considered similar to Perceived Risk (PR), whereas Firm Reputation (FIRM) is considered a separate variable.
PR is the probability of loss when attaining a desired outcome from using a technology-based service (Featherman and Pavlou 2003). Earlier studies on technology adoption adopted a second-order five-dimensional PR measure (Featherman and Pavlou 2003; Giovanis et al. 2019; Yang et al. 2015). Previous studies have also considered Performance Risk, Financial Risk, and Time Risk as factors directly affecting the ATT to BI (Lee 2009). Other studies have investigated the direct effect of Perceived Risk on the intention to adopt mobile banking services (Hanafizadeh et al. 2014). However, referring to (Ha et al. 2012), the impact of PR on the intention to use mobile banking varies by country. Thus, the PR variables may differ. In this study, Perceived Risk, Performance Risk, Privacy Risk, Financial Risk, Psychological Risk, and Time Risk are considered separate variables that directly have a significant negative impact on the intention to use mobile banking services. The greater the risk of implementing a new technology, the more negative the attitude and willingness to adopt it.
Disease Risk (DSR), introduced by (Maser and Weiermair 1998), is considered relevant to this study because of the change in consumer behavior caused by uncertainties such as the COVID-19 outbreak. Research on Health Risk (Disease Risk) in the context of mobile banking adoption remains limited. This study defined DSR as a condition in which customers are uncertain and fearful of contracting the disease caused by the COVID-19 outbreak. Consequently, customers prefer mobile banking to the exchange of physical money. Therefore, the DSR posed by COVID-19 is considered a positive factor that accelerates mobile banking adoption. Based on this explanation, the following research hypothesis was formulated:
H1.
Perceived Usefulness will be positively related to the attitude to adopt mobile banking.
H2.
Perceived Ease of Use will positively affect the attitude to mobile banking.
H3.
Compatibility will positively affect the attitude to adopt mobile banking.
H4.
Attitude will positively affect the intention to adopt mobile banking.
H5.
Interpersonal Influence will positively affect the subjective norm to adopt mobile banking.
H6.
External Influence will positively affect the subjective norm to adopt mobile banking.
H7.
Subjective Norms will positively affect the intention to adopt mobile banking.
H8.
Facilitating conditions will positively affect the perceived behavior control to adopt mobile banking.
H9.
Self-efficacy will positively affect perceived behavior control to adopt mobile banking.
H10.
Perceived Behavior Control will positively affect the intention to adopt mobile banking.
H11.
Firm Reputation positively affects the intention to adopt mobile banking.
H12.
Trust will positively affect the intention to adopt mobile banking.
H13.
Performance Risk will negatively affect the intention to adopt mobile banking.
H14.
Privacy Risk will negatively affect the intention to adopt mobile banking.
H15.
Psychological Risk will negatively affect the intention to adopt mobile banking.
H16.
Financial Risk will negatively affect the intention to adopt mobile banking.
H17.
Time Risk will negatively affect the intention to adopt mobile banking.
H18.
Perceived risk will negatively affect the intention to adopt mobile banking.
H19.
Disease risk will positively affect the intention to adopt mobile banking.
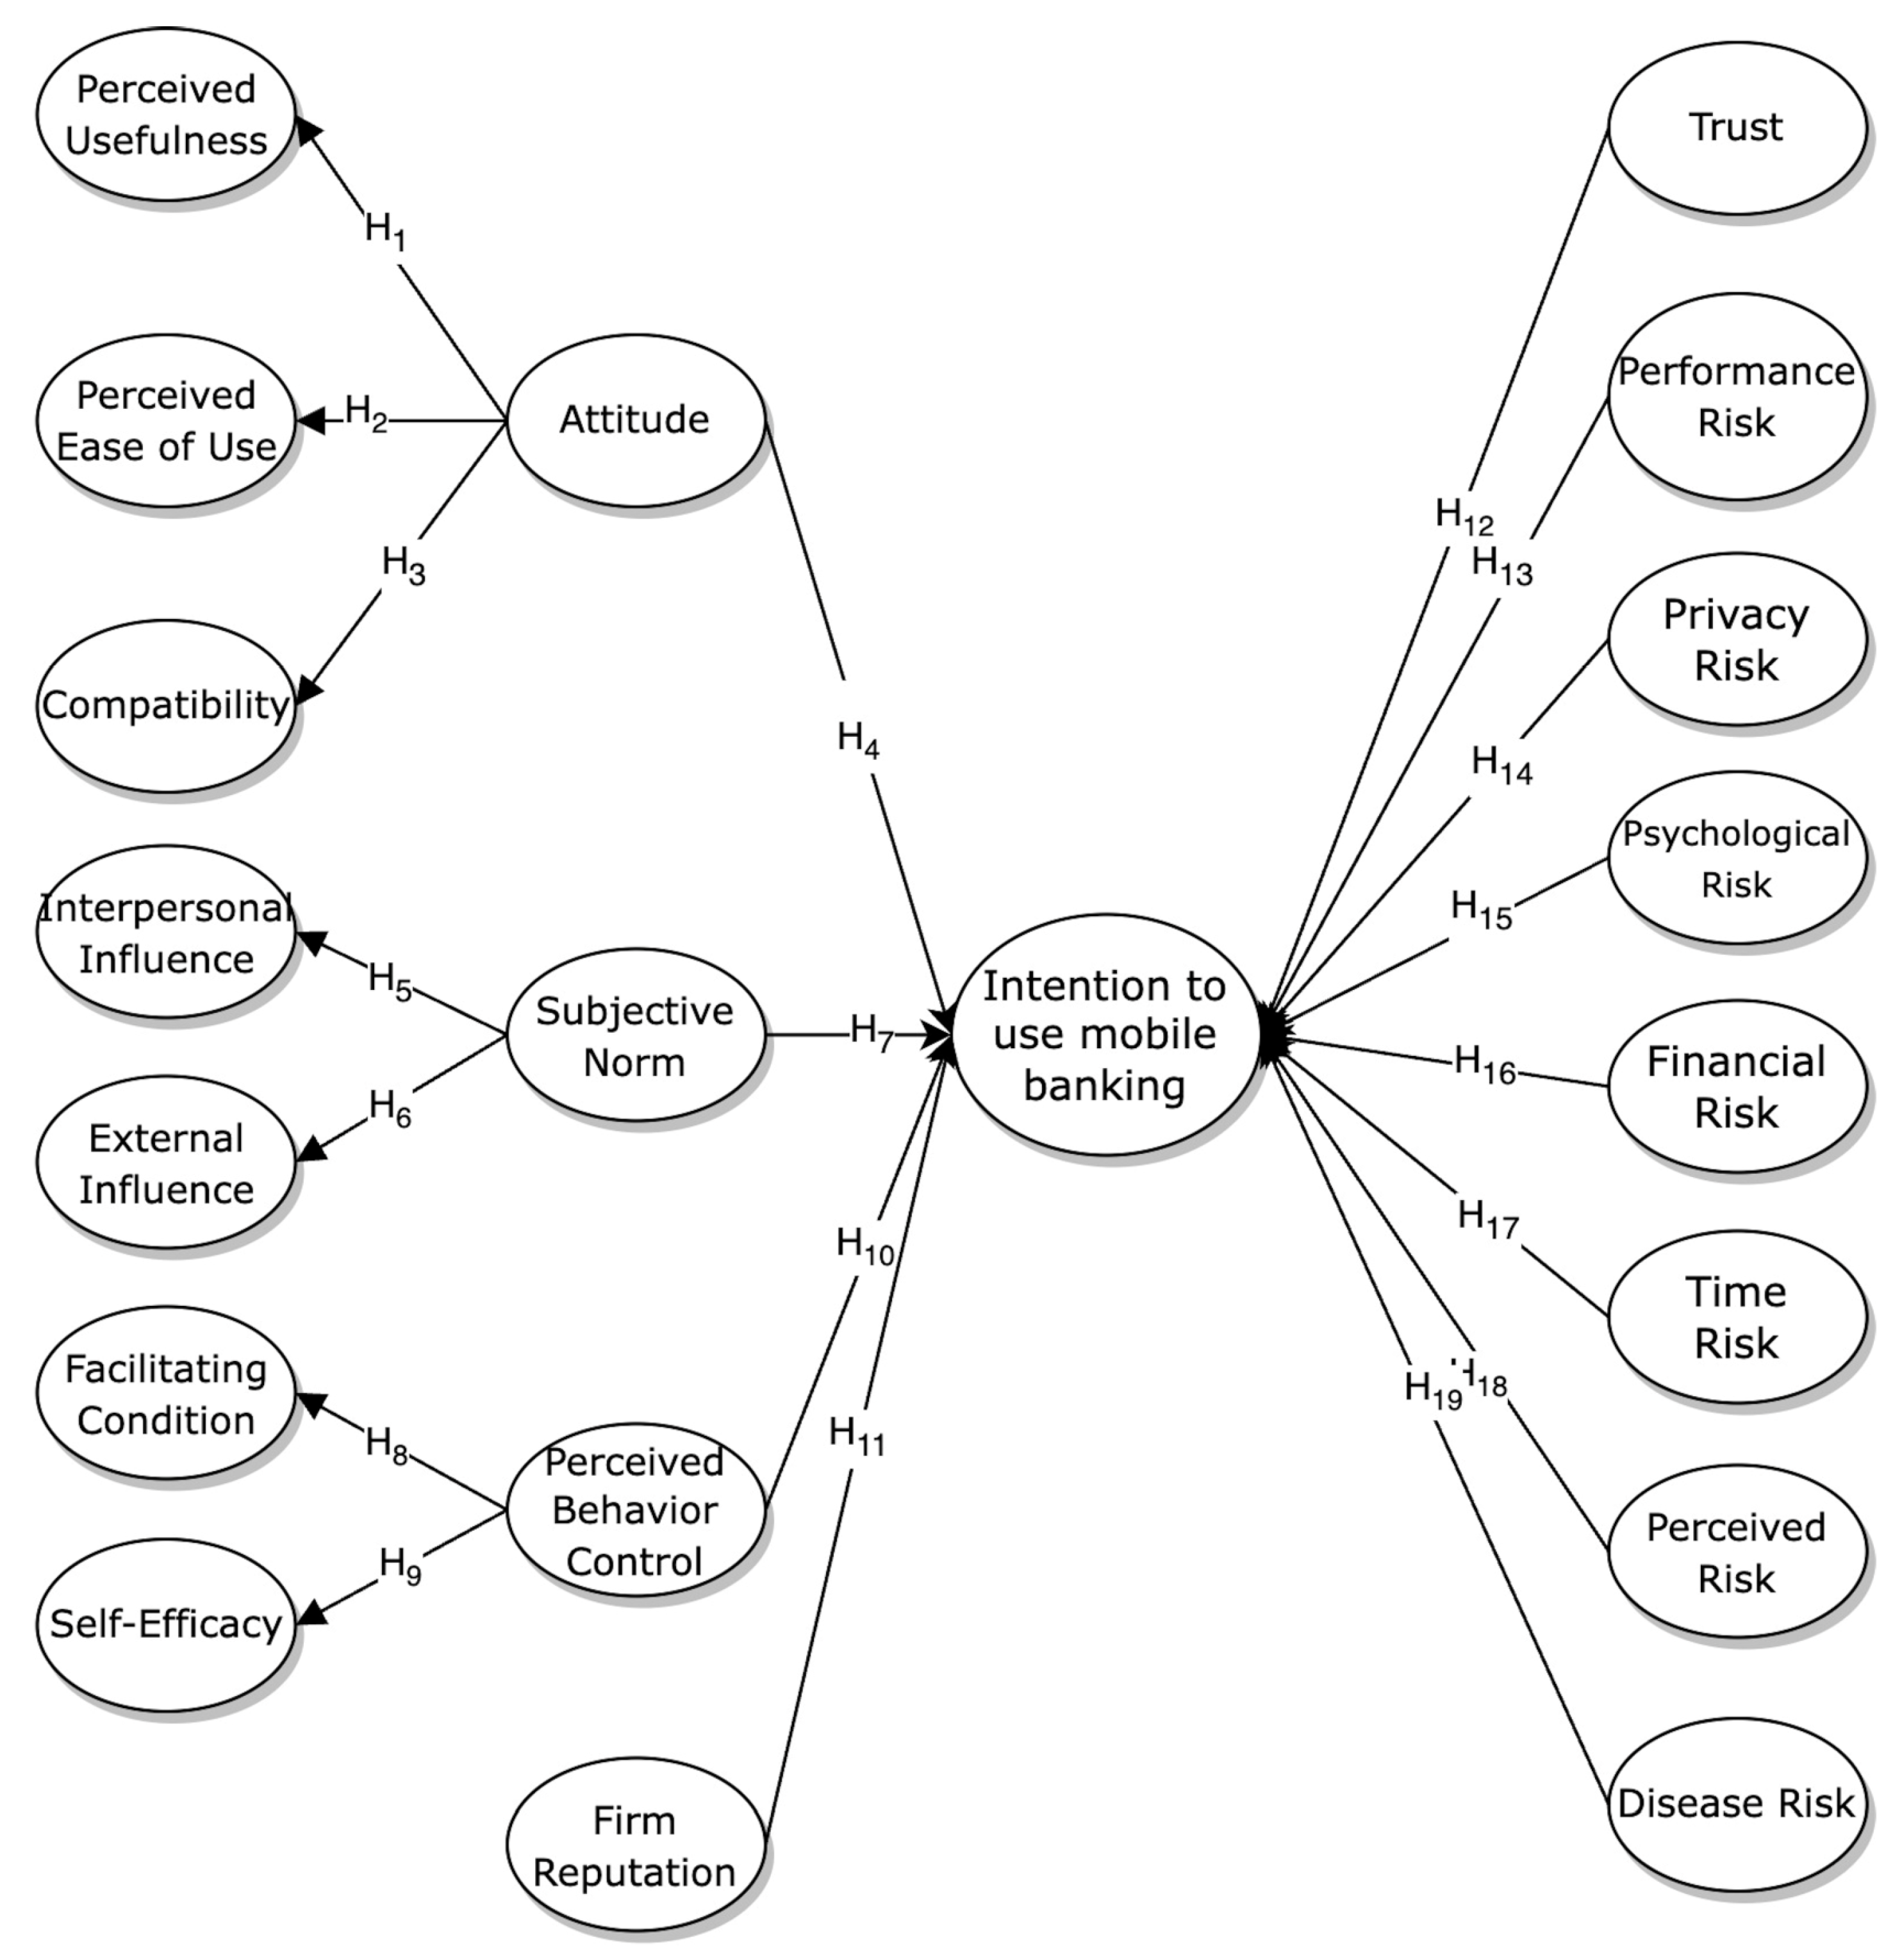
Based on the explanations, this study aims to refine the DTPB framework, as illustrated in Figure 1.
3. Methods
3.1. Data Collection and Sampling
In quantitative research, a sample size of 15 times or more is required for each observed variable (Rosenblad 2009). Given the number of variables and dimensions investigated, a minimum of 285 respondents were required. In addition, structural equation modeling (SEM) models with sample sizes greater than 300 are preferable because they yield more information and are more stable (Hair 2013). The sample was acquired by using convenience sampling with the following criteria: individuals with an active bank account from one of the digital banks in Indonesia, representing bank customers in big cities in Indonesia, namely the Greater Jakarta Area (Jakarta, Bogor, Depok, Tangerang, and Bekasi), including Bandung, Bali, and Surabaya; and active mobile banking users from the digital banks category as defined by the Central Bank of Indonesia (Bank Indonesia 2019a). The banks identified by the Central Bank of Indonesia were transformed from their original categorization, namely BUKU III and BUKU IV, to the more recent classification developed by the Indonesia Financial Services Authority (OJK) named KBMI 3 and KBMI 4 (Financial Services Authority 2021). As a result, banks from the KBMI 3 and KBMI 4 categories represent the 16 largest digital banks in Indonesia, as shown in Table 1.
3.2. Variable and Measure
This study developed a questionnaire using measures from relevant previous studies to operationalize the constructs included in the proposed framework, with wording adjustments to match the measure to the context of mobile banking, using a seven-point Likert-type scale (ranging from 1 = strongly disagree to 7 = strongly agree). The Behavioral Intention, Perceived Usefulness, and Disease Risk measures were adopted from Davis (1989) and Aji et al. (2020). In addition, measures of Attitude, Perceived Ease of Use, and Compatibility were adopted from Davis (1989). Meanwhile, the Perceived Behavior Control, Self-efficacy, and Facilitating Conditions measures were adopted from Taylor and Todd (Taylor and Todd 1995), while the measures of Performance Risk, Privacy Risk, Financial Risk, Psychological Risk, and Time Risk were adopted from Lee (2009) and Featherman and Pavlou (2003). The measures of Subjective Norm, Interpersonal Influence, and External Influence were adopted from Giovanis et al. (2019). Next, the measures of Trust were adopted from Hanafizadeh et al. (2014) and Malaquias and Silva (2020). Finally, Firm Reputation measures were adopted from Oliveira et al. (2014). The questionnaire was developed in English and translated into Bahasa Indonesia, the native language of the respondents. To ensure the accuracy of the translations, the questionnaire was translated back into English by a professional translator and compared with the original transcript. Next, the questionnaire was refined by pre-testing 10 experienced mobile banking users selected as subjects and asked to provide feedback on the instrument clarity, question wording, and validity of the questions. Feedback was then used to revise the construct measures, resulting in minor changes to the final questionnaire. The survey items are listed in Appendix A. The resulting scores for each observed variable were calculated independently.
3.3. Procedure and Data Analysis
Research that analyses structural equation models has relatively few barriers when using PLS (Urbach and Ahlemann 2010). Referring to Hair (2013), the appropriate SEM method depends on the research goal. The appropriate method to test and confirm theories is CB-SEM, while PLS-SEM is the right approach if the research goal is theory development and prediction, such as predicting key “driver” constructs. Therefore, the data were examined using the PLS-SEM technique, a well-established marketing and business research approach with the assistance of Smart PLS 4.0.9.6 software. Partial least squares (PLS) is a nonparametric approach that does not rely on a normality (distribution-free) assumption and is used for theory-building and predictive applications (Urbach and Ahlemann 2010). It is consistent with this study and includes novel constructs to explain mobile banking adoption. The SEM method requires a two-step approach to analyze the data. First, the measurement model was estimated using confirmatory factor analysis (CFA) to verify the measurement model’s reliability and validity. Second, the structural model was investigated to examine the model fit of the proposed research model (Hair 2013). The following steps were involved in the SEM analysis: (1) defining individual variables, (2) developing an overall measurement model, (3) designing a study to provide empirical results, (4) evaluating the measurement model validity, (5) defining the structural model, and (6) evaluating the structural model validity (Hair 2013). Typically, a model is considered acceptable and offers adequate evidence of model fit if three to four fit indices are met (Hair 2013). To approximate the proposed model fit, the standardized root mean residual (SRMR) metric was used (Latan and Noonan 2017).
3.4. Descriptive Statistics
Table 2 summarizes the descriptive statistics that were used to analyze the banking respondent’s responses and mean values results for each calculated mobile banking services attribute. The results show the responses have mean values ranging from 3.52 (lowest) to 6.40 (highest) indicating that the respondent’s answers were positive. Meanwhile, the standard deviations vary from 0.857 to 1.784. The skewness ranged from −1.867 to 0.942, and the kurtosis ranged from −0.954 to 4.299, both according to acceptable limits (skewness: ±2.0, kurtosis: ±7.0) (West et al. 1995).
4. Results
An online self-administered questionnaire using Microsoft Form was used to collect data from September 2022 to March 2023 involving 1441 active mobile banking customers from the largest digital banks in Indonesia, including 777 men (53.9%) and 664 women (46.1%) who completed the online survey, as shown in Table 3.
The sample comprised mobile banking respondents from various backgrounds, such as teachers, lecturers, university students (undergraduate and postgraduate), and groups of professional employees (government and private sectors) from different educational backgrounds.
Figure 2 provides a summary of the respondent’s age groups, showing that most respondents were under 30 years old (1233, or 85.6%), while the remaining 208 respondents (14.4%) were above 30 years old.
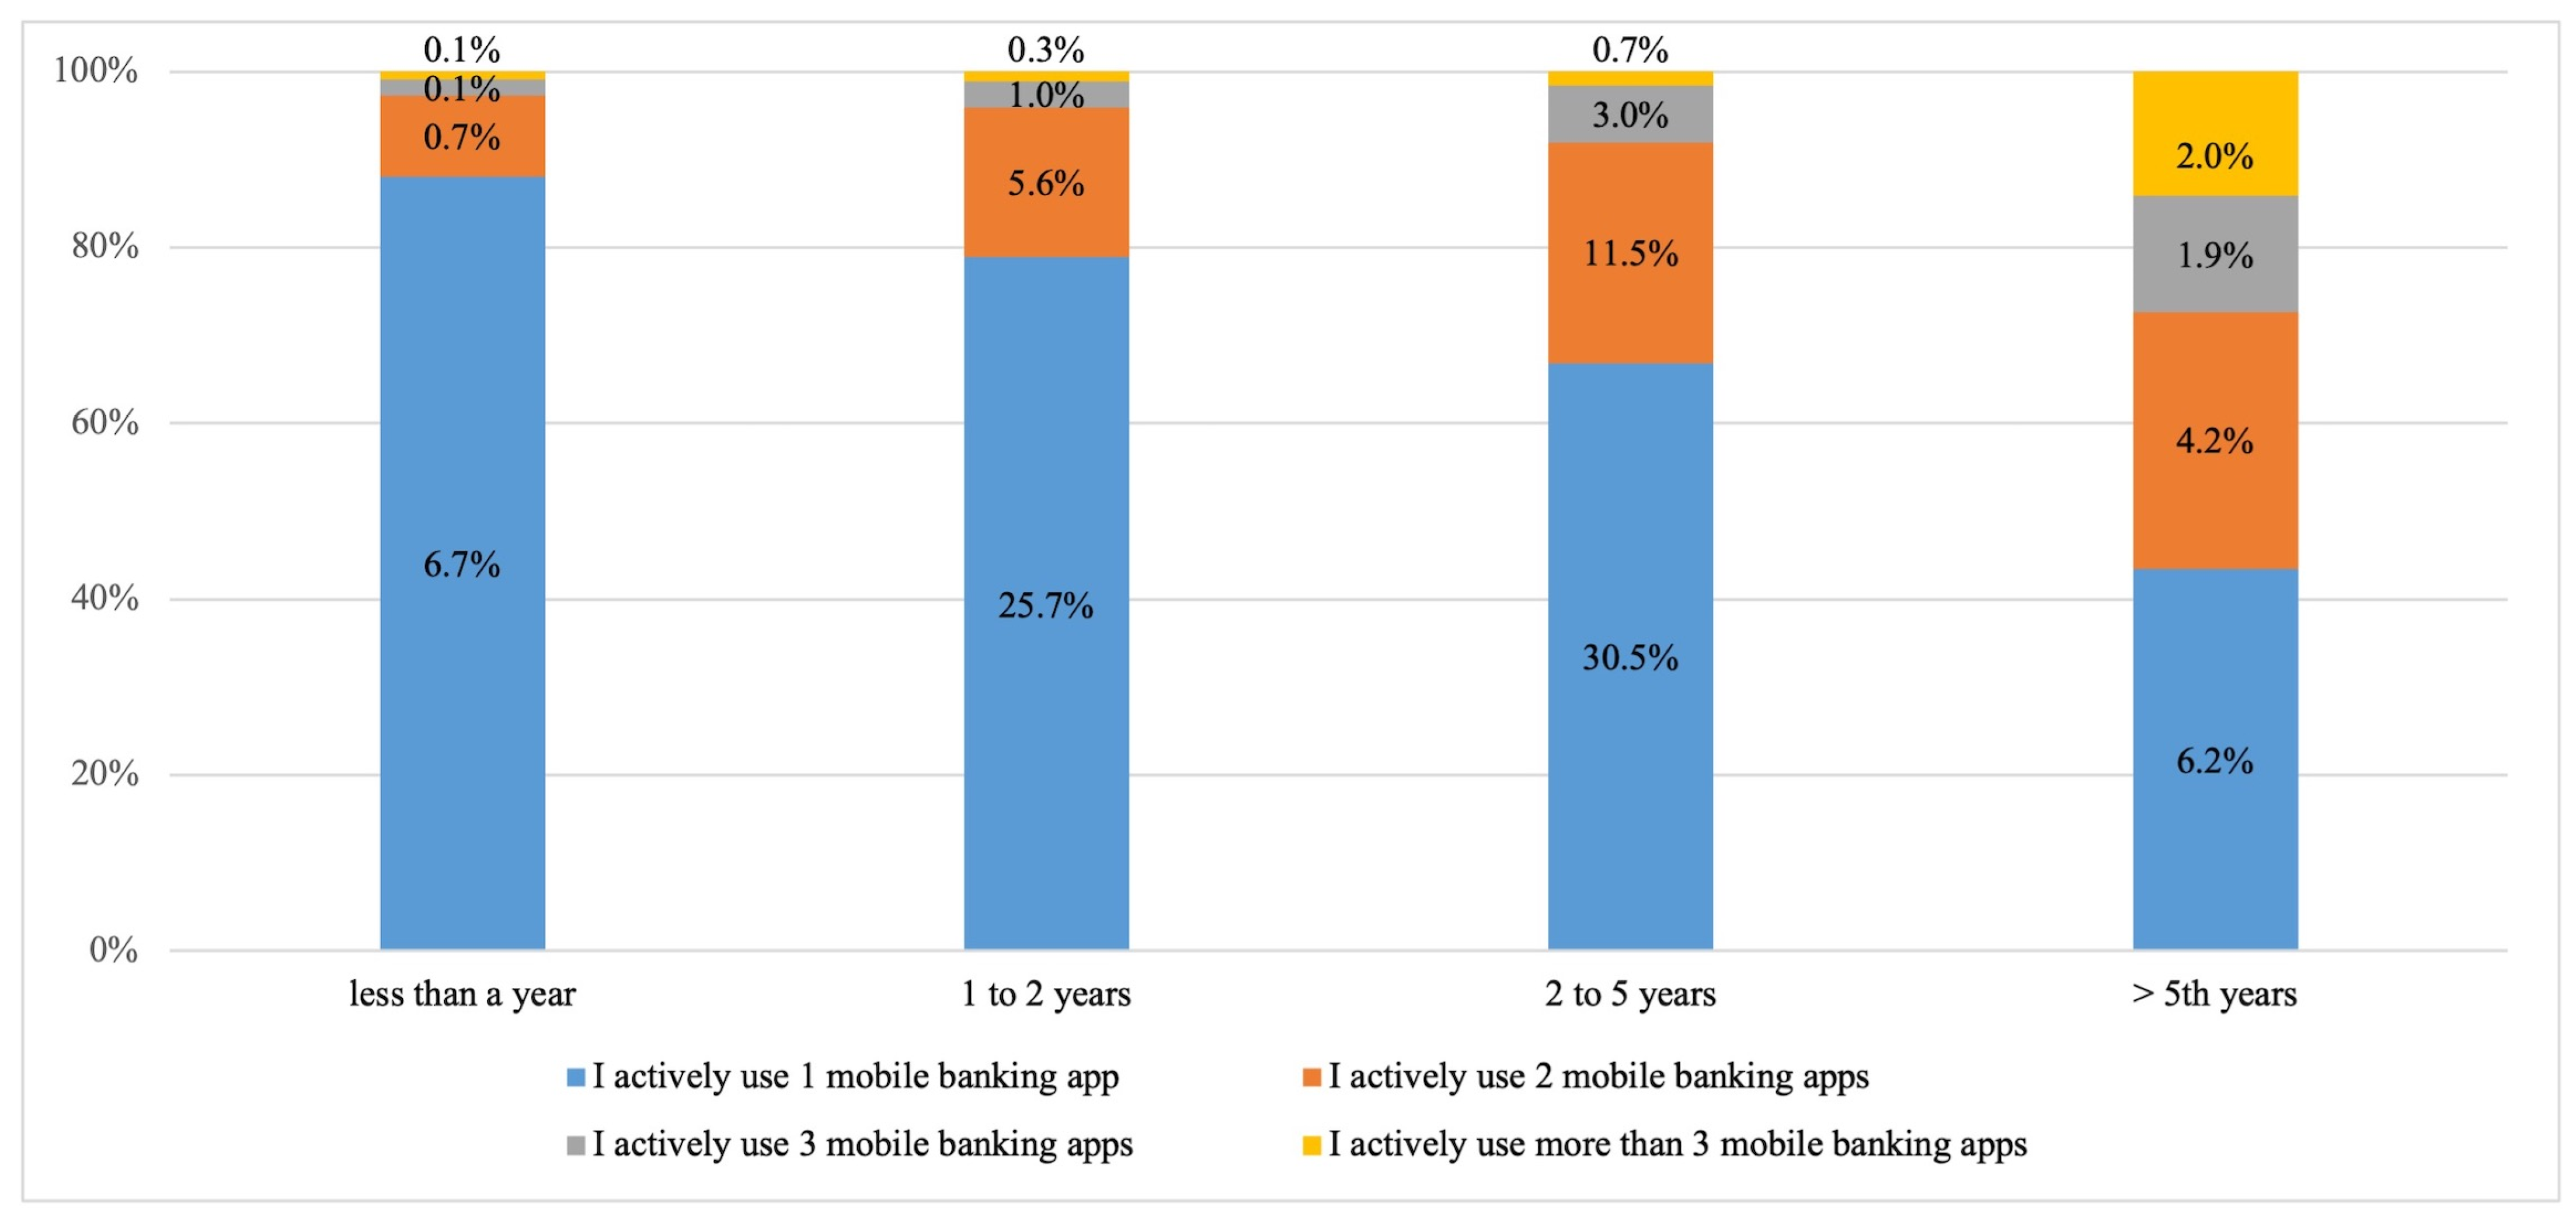
As shown in Figure 3a, the data reveal that the majority of respondents were high school graduates (805, or 55.9%), followed by those with a bachelor’s degree (528, 36.6%), master’s degree (42, or 2.9%), and doctoral degree (20, or 1.4%). The data in Figure 3b summarizes the different occupations of the 1441 respondents, with 71.3% of the respondents being university students, 16.8% employed in the private sector, 7.5% entrepreneurs or self-employed, 2.8% stay-at-home mothers or housewives, 1.3% government officials, and the other respondents were either unemployed or retired. Figure 4 shows that 45.7% of respondents had two–five years of experience, 30.5% used one mobile banking service, 11.5% used two mobile banking services, 3.0% used three mobile banking services, and 0.7% used more than three mobile banking services. Next, Figure 4 reveals that 32.6% of respondents have used mobile banking services for 1 to 2 years, 25.7% of which used one mobile banking service, 5.6% used two, 1.0% used three, and 0.3% used more than three. Respondents with more than five years of experience interacting with mobile banking services equaled 14.3%, with 6.2% using one mobile banking service, 4.2% using two mobile banking services, 1.9% using three, and 2.0% using more than three mobile banking services. Only 7.6% of the respondents were identified as new mobile banking users with less than a year of experience. It shows the capability and availability of the resources required to operate mobile banking services, which may correlate with improving job performance and lifestyle.
The results are consistent with the sample profile, showing that most respondents were university students (71.3%) between the ages of 15 and 24, as shown in Figure 5.
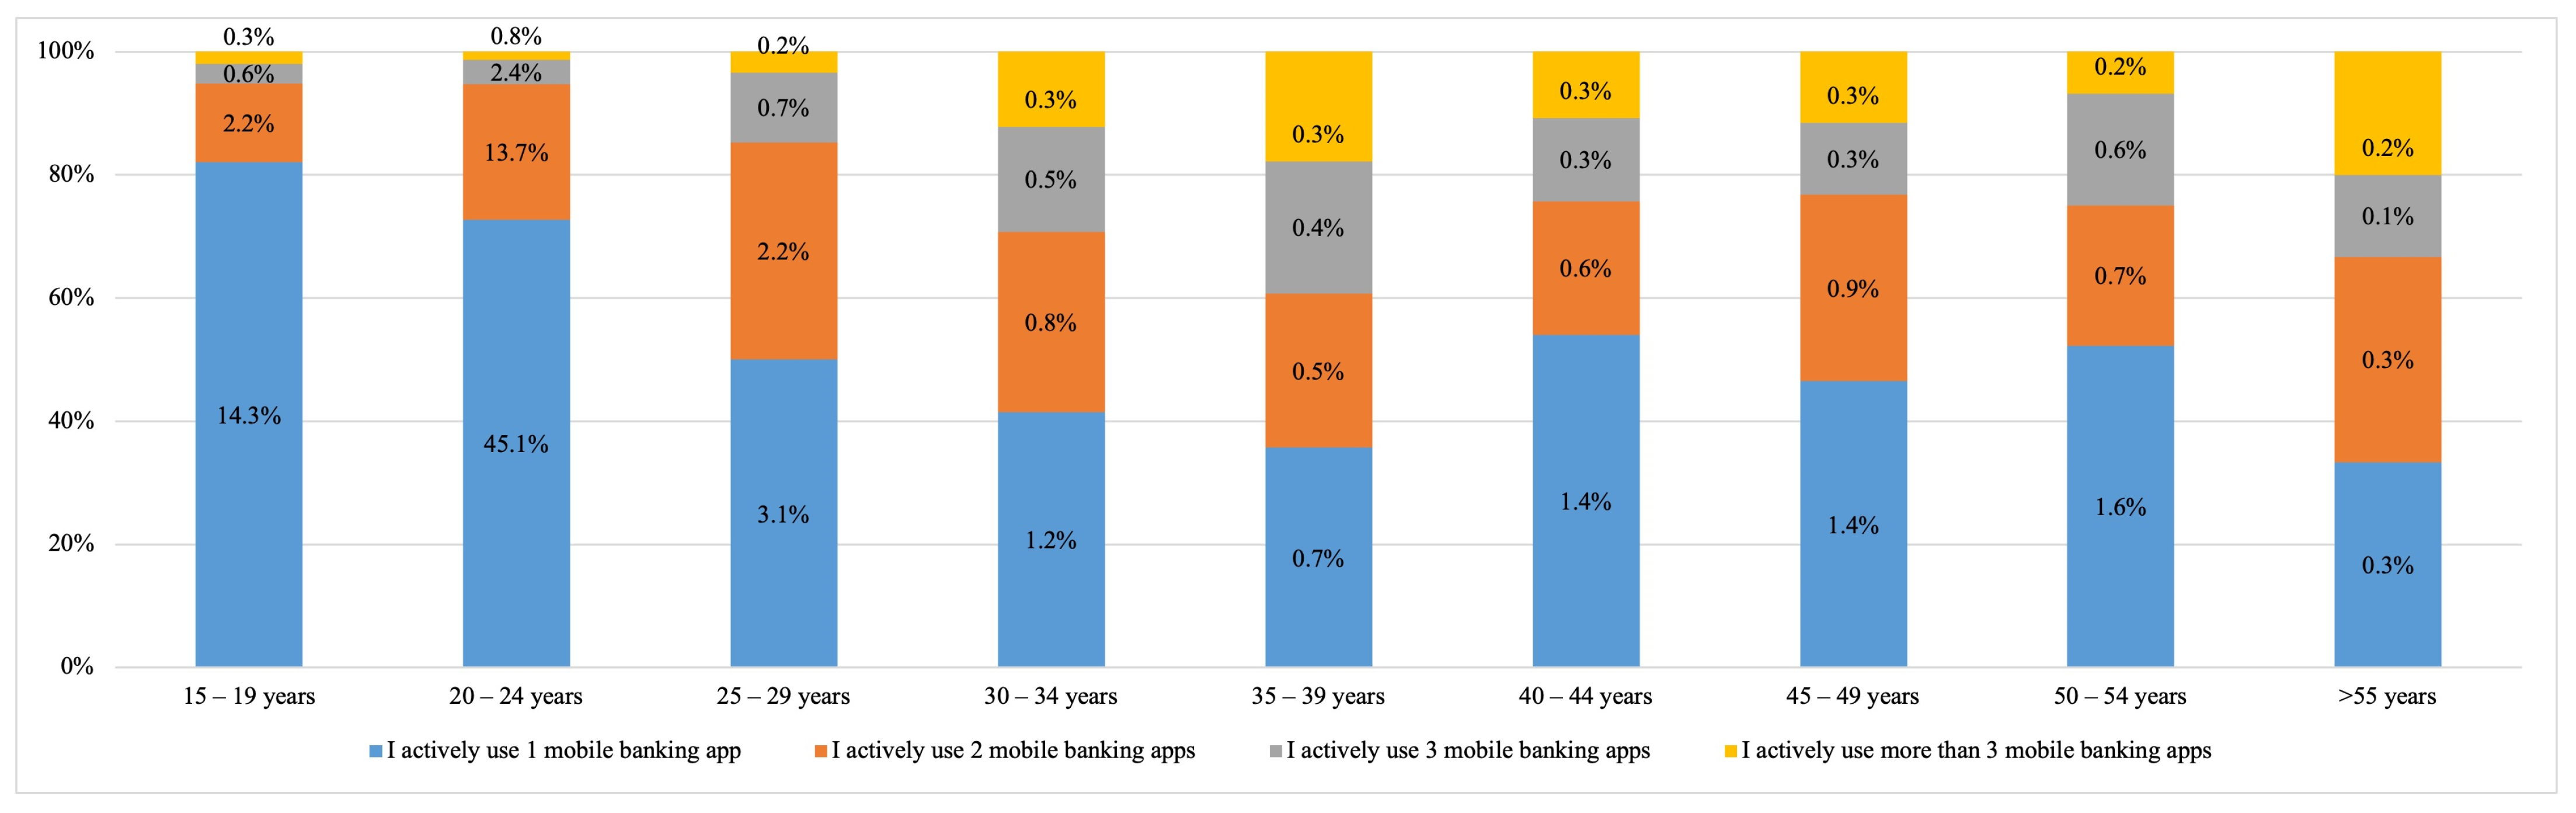
Figure 5 shows that younger respondents under 30 years old (1233, or 85.5%) actively use at least one mobile banking service (62.5%), 18.1% used two, 3.7% used three, and 1.3% used more than three.
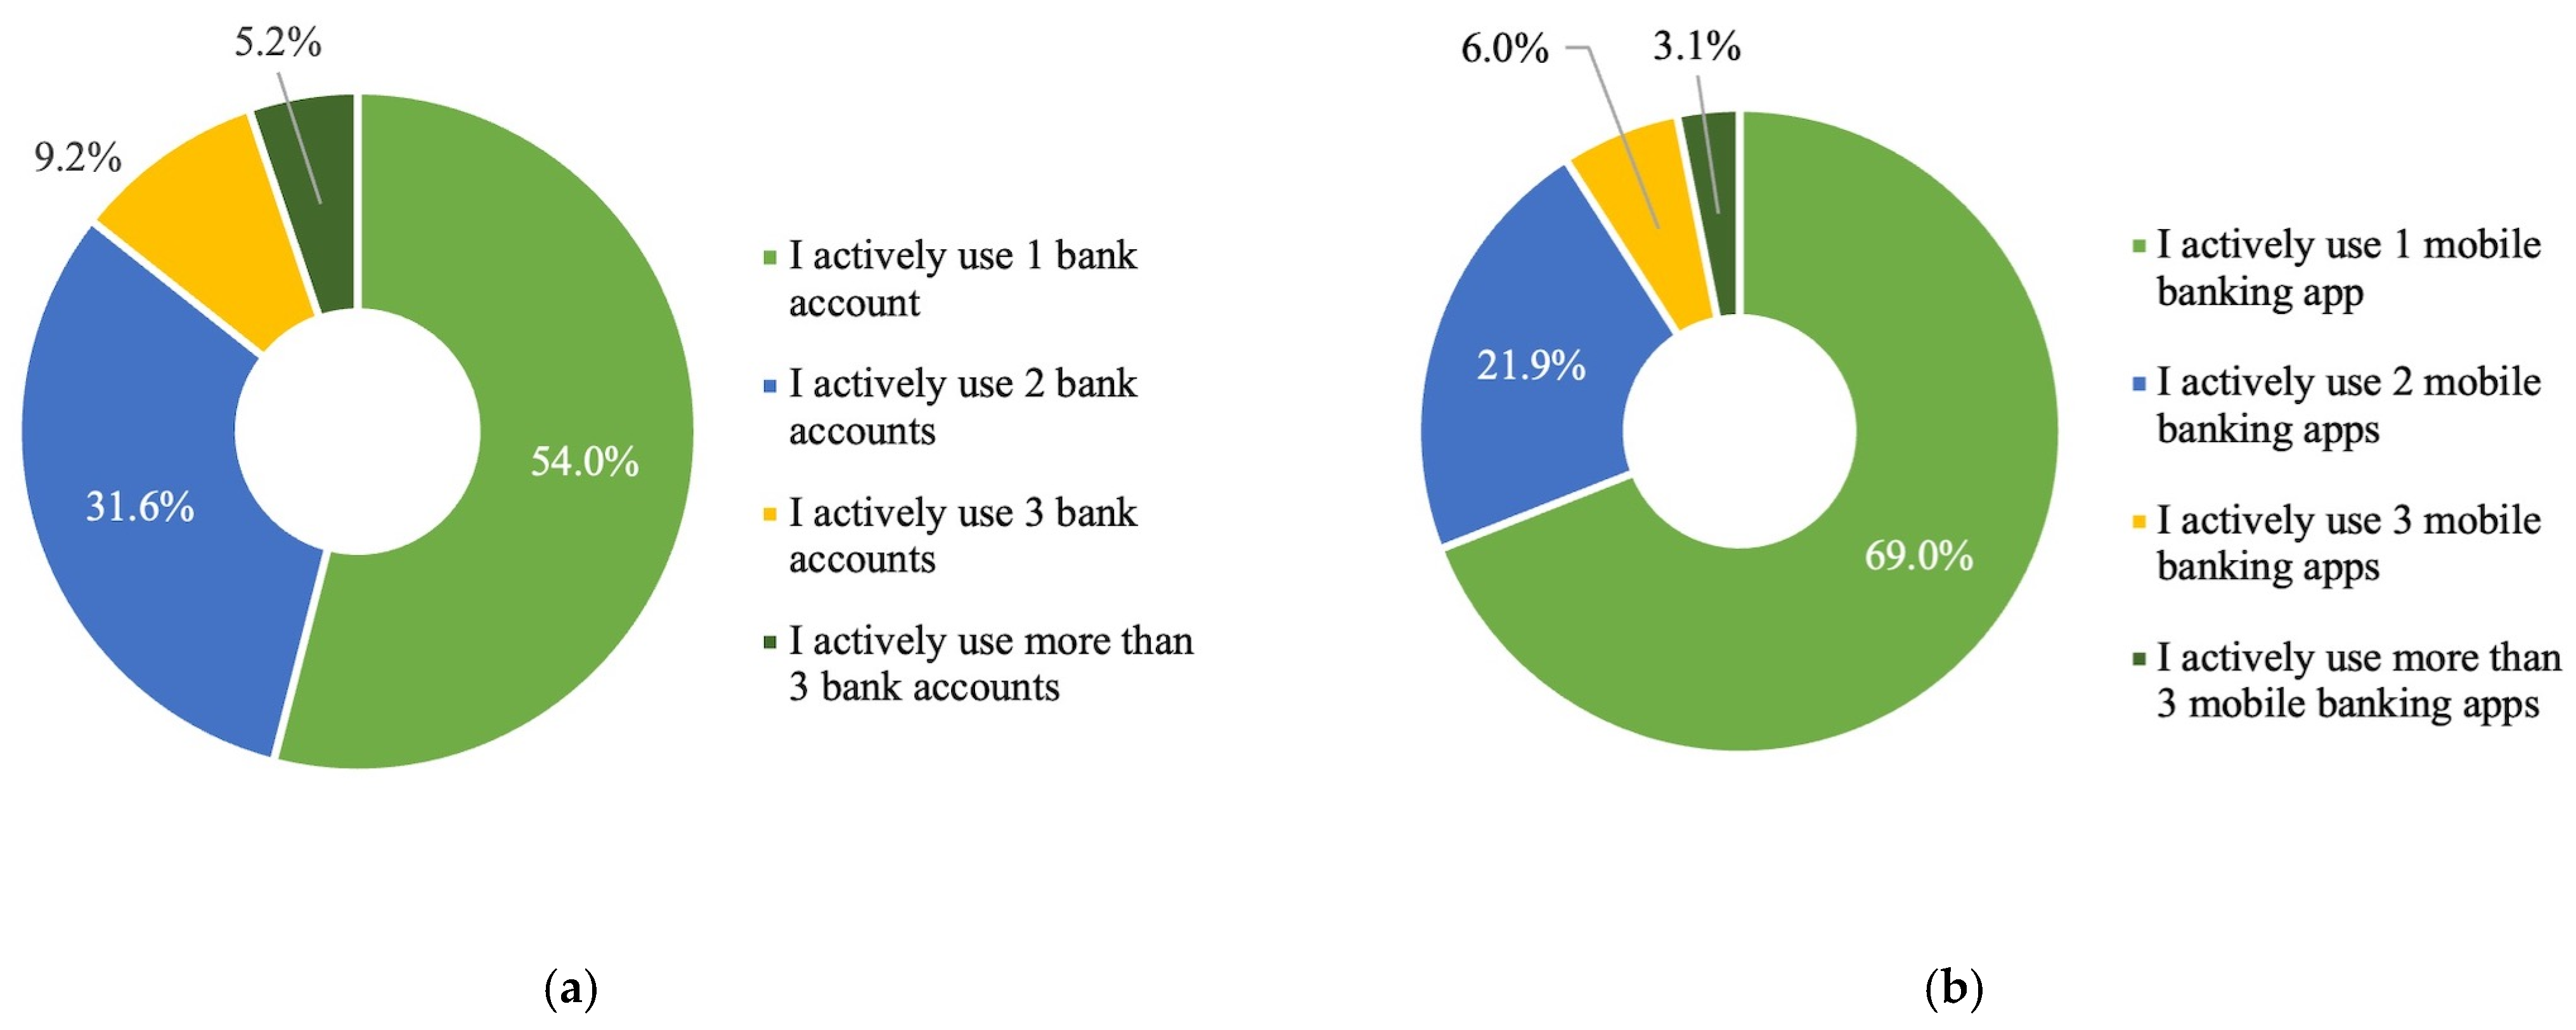
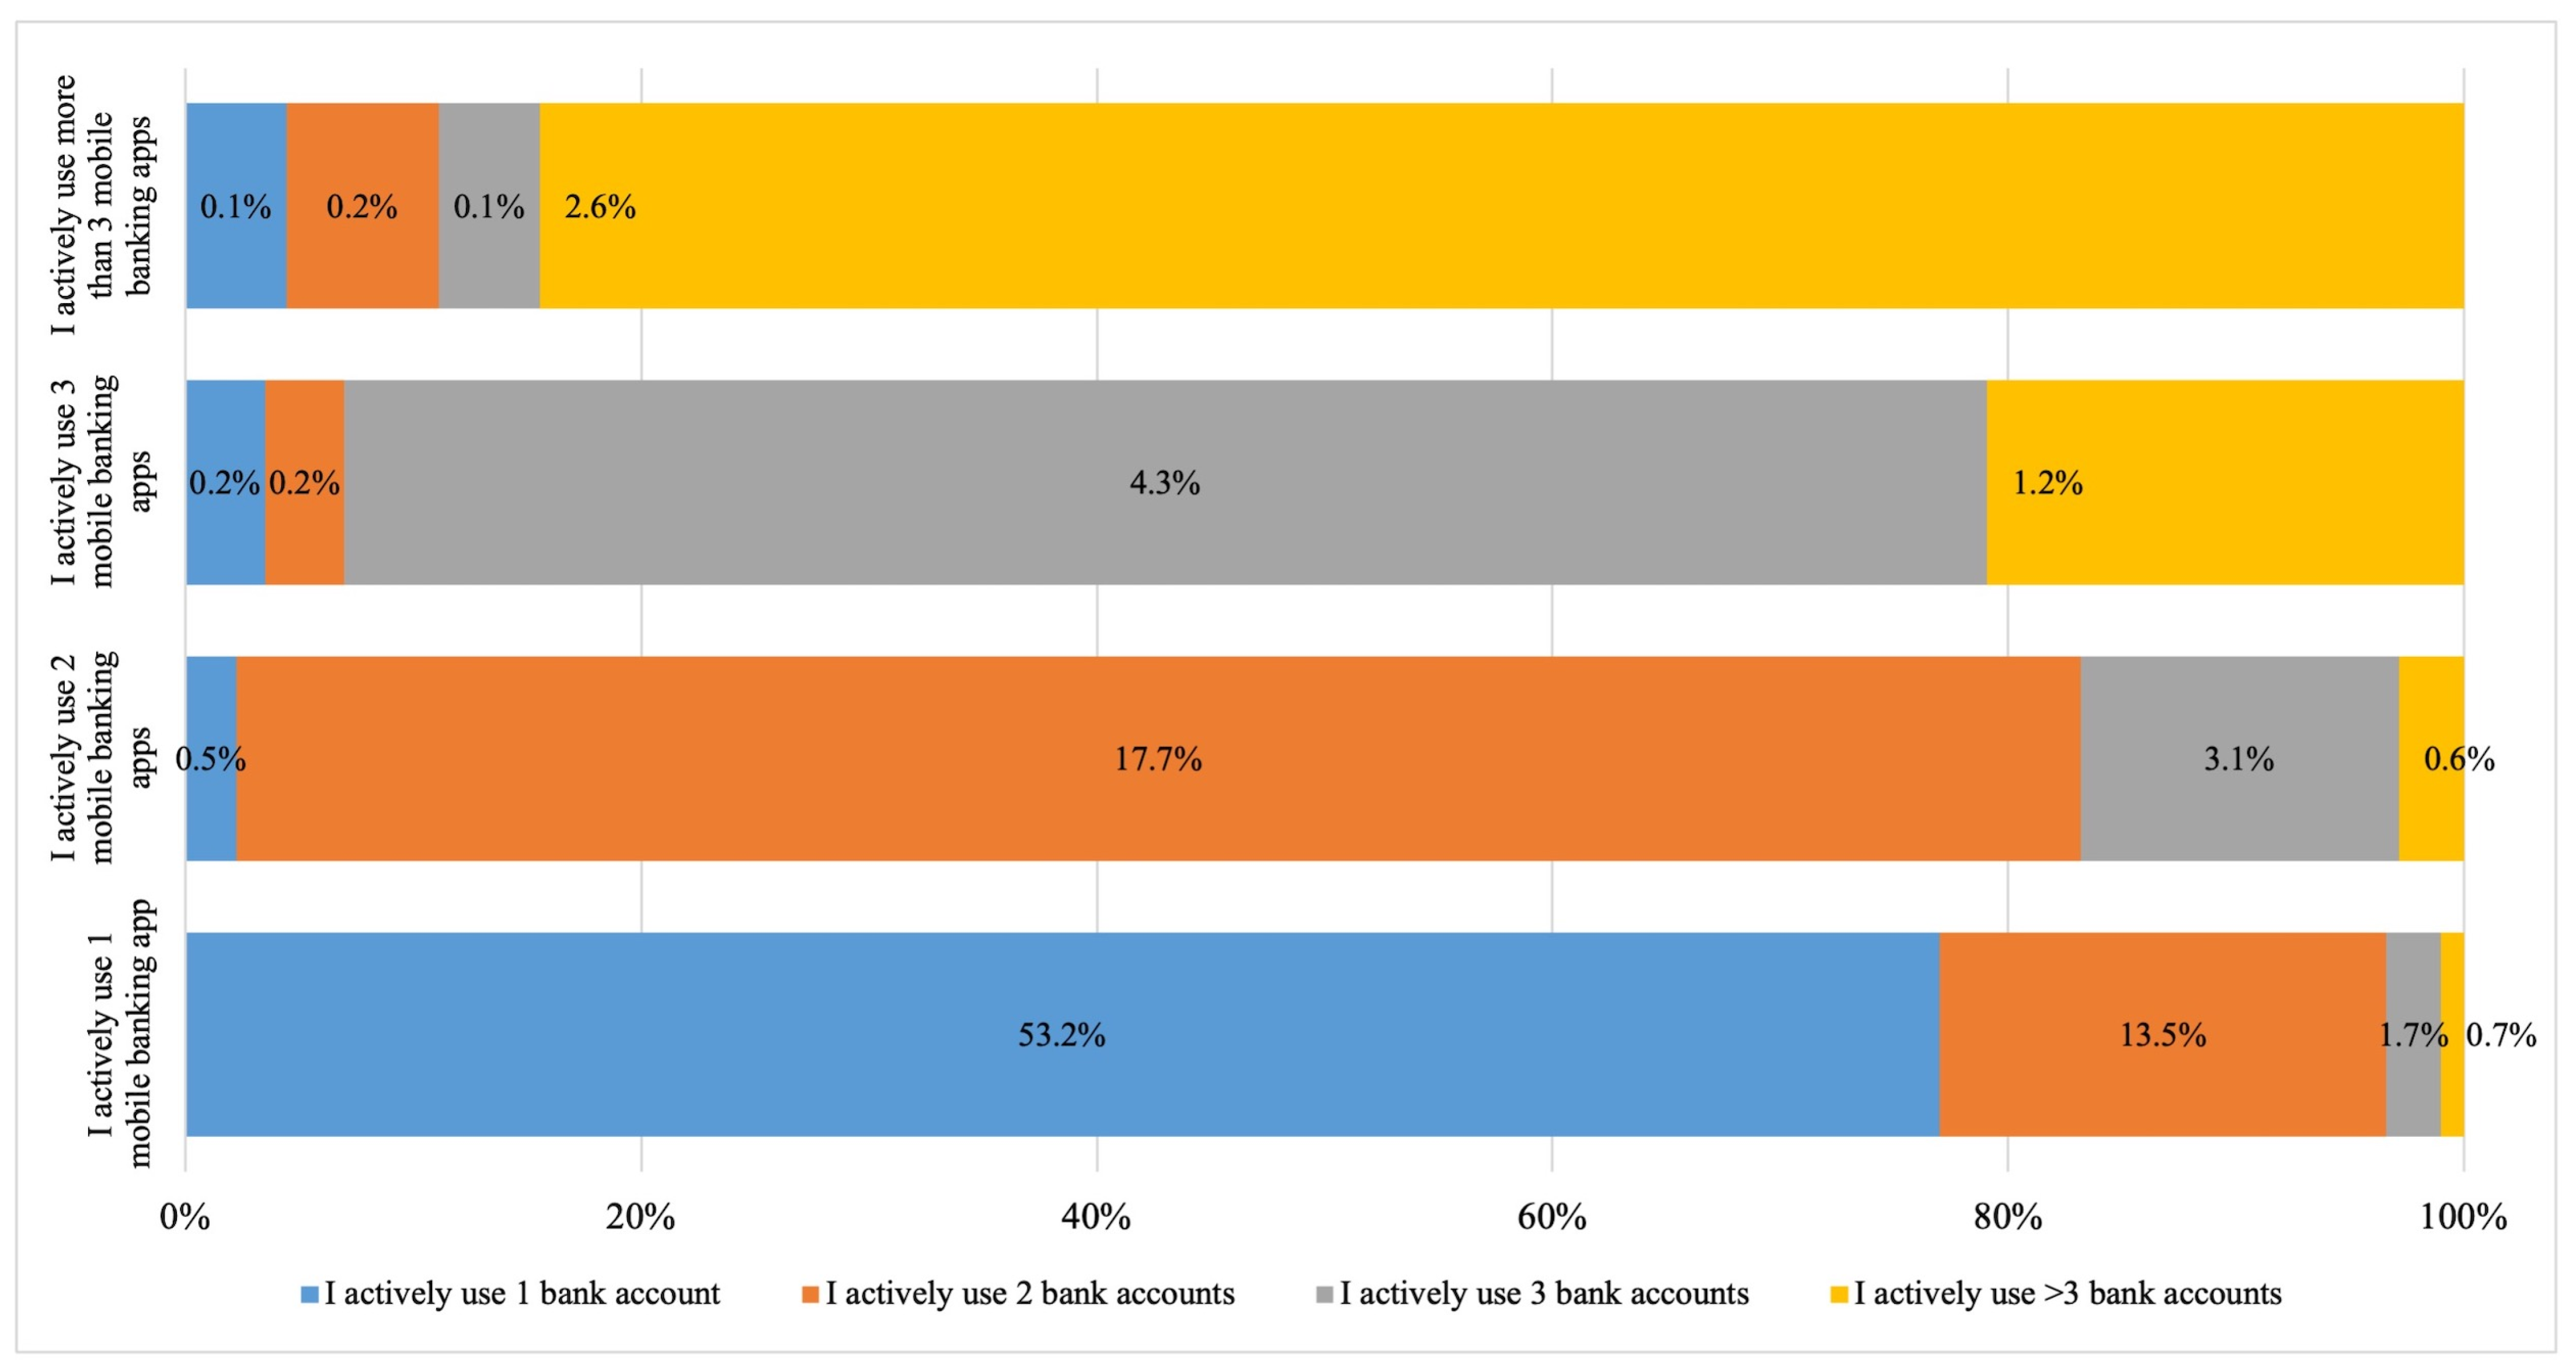
Figure 6a shows that the majority of respondents (54.0%) used one bank account, 31.6% used two bank accounts, 9.2% used three bank accounts, and 5.2% used more than three bank accounts. Figure 6b reveals that most respondents (69.0%) interacted with at least one mobile banking service, 21.9% interacted with two mobile banking services, 6.0% interacted with three mobile banking services, and 3.1% interacted with more than three mobile banking services. The data suggest that younger users were more likely to adopt mobile banking services and were less concerned about risk than other age groups. Figure 7 shows that 53.2% of the respondents with one bank account use one mobile bank service, 0.5% have two mobile bank services, 0.2% have three mobile bank services, and 0.1% have more than three services. The data indicate that there might be a correlation between the number of bank accounts a person has and the number of mobile banking services that the person utilizes.
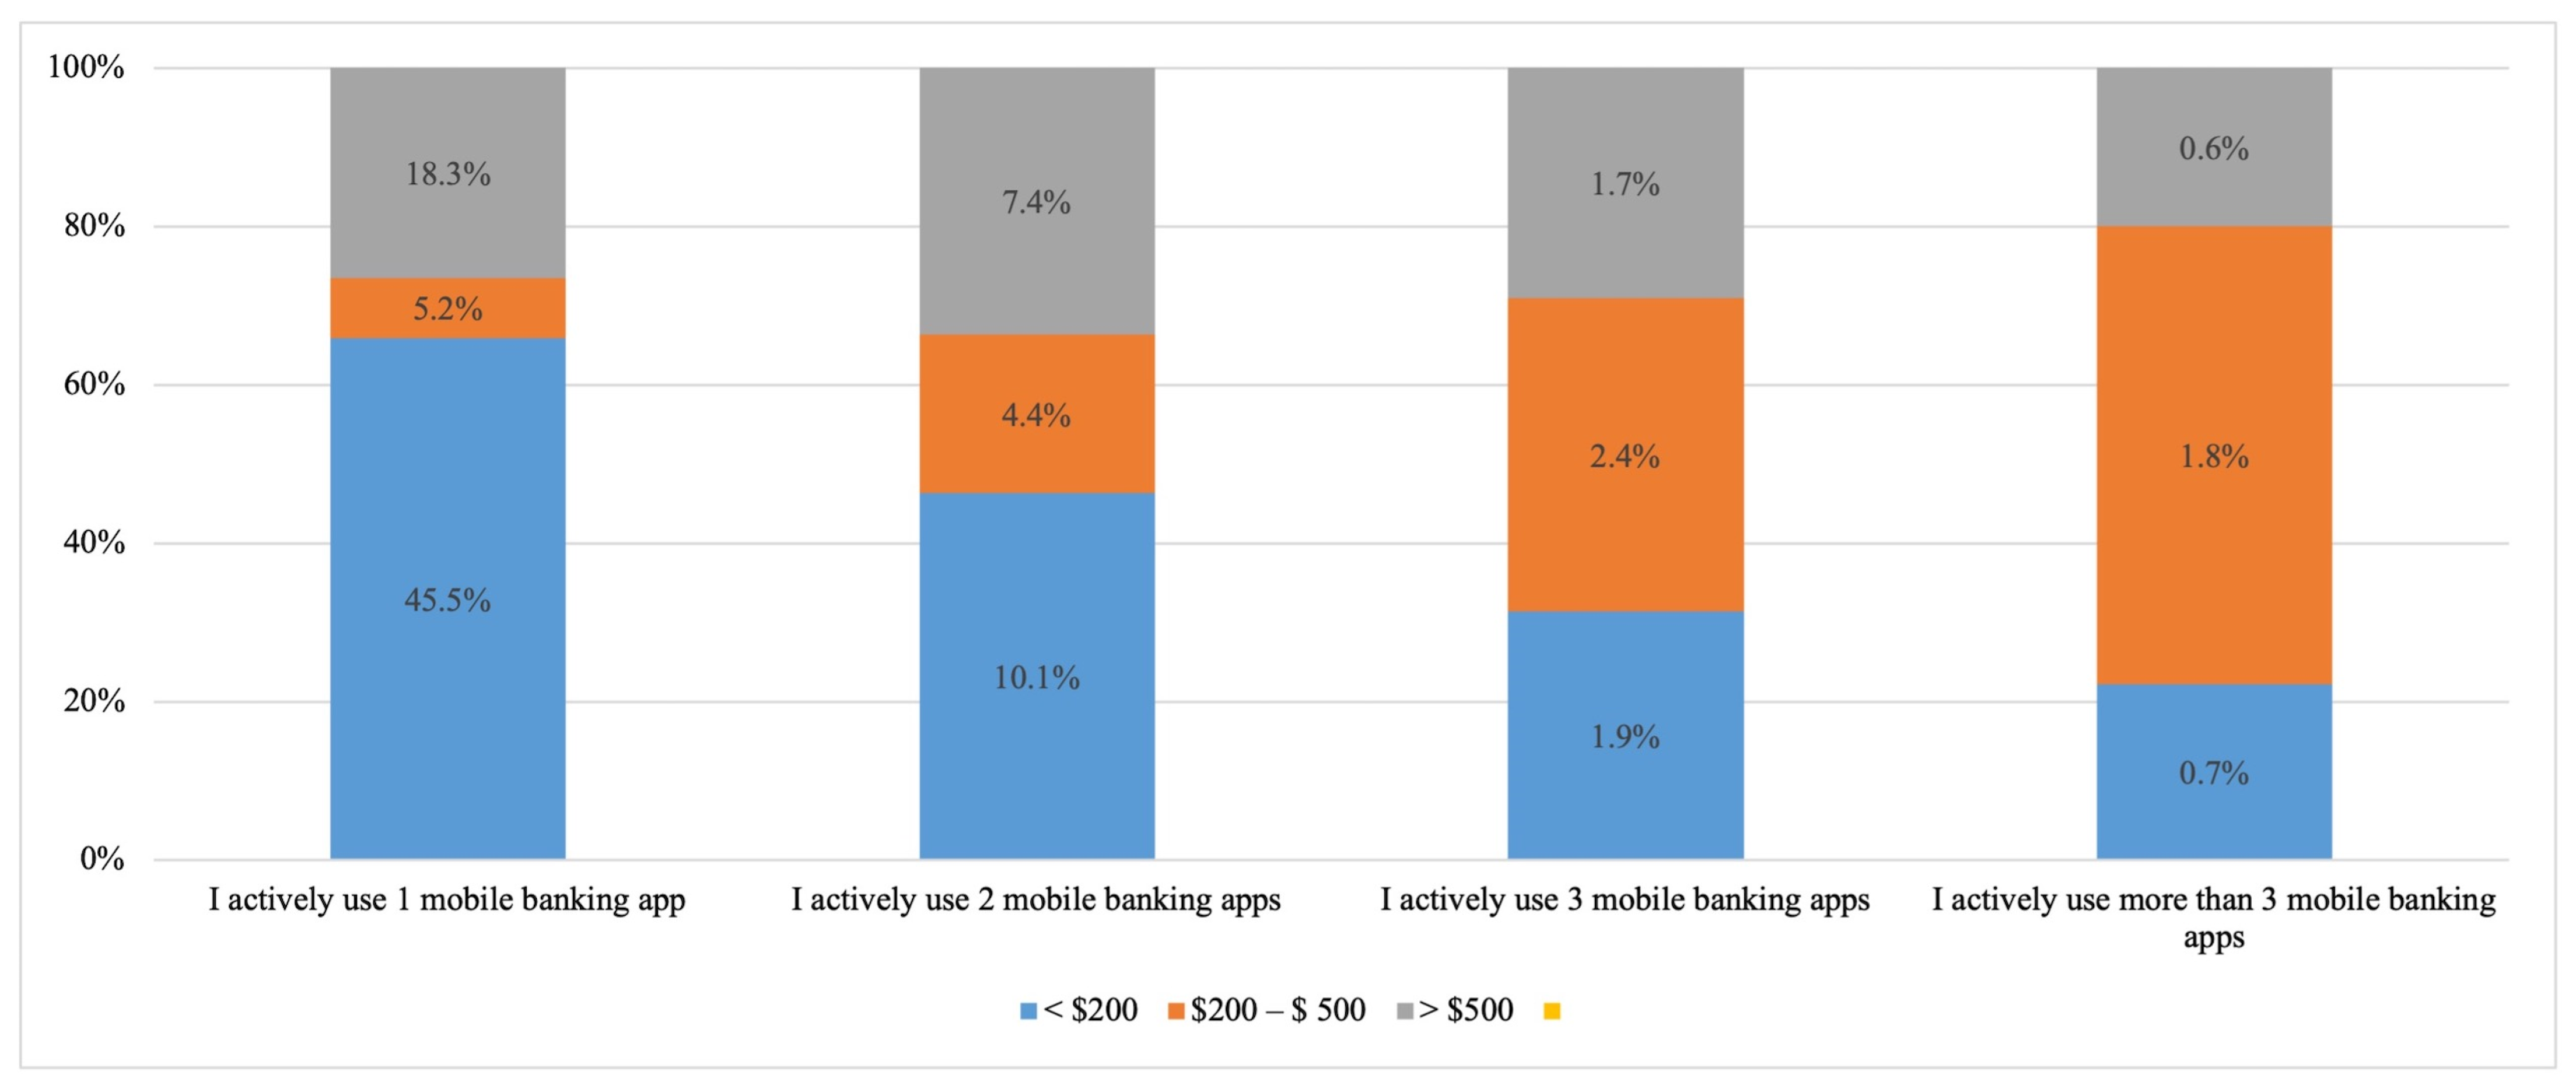
As shown in Figure 8, 45.5% of respondents utilizing one mobile banking service came from families with less than $200 monthly expenses, 5.2% from households with $200 to $500 monthly expenses, and 18.3% from households with over $500 monthly expenses. The majority of respondents used only one mobile banking service, indicating that higher household spending may not correlate directly with the number of mobile banking services used.
4.1. The Measurement and Structural Models
Data collection was examined using the PLS-SEM method with the assistance of SmartPLS software version 4.0.9.6 where the PLS algorithm and bootstrapping method were performed. The measurement model was tested by estimating the internal consistency and the convergent and discriminant validity of the instrument items. Convergent validity was performed by calculating the factor loadings, Cronbach’s α, Composite Reliability (CR), and Average Variance Extracted (AVE) (Hair 2013). The following two questions were deleted: Facilitating Condition #3 and Time Risk #2, considering that outer loading values were higher if the item was deleted, thus accomplishing outer loading thresholds of >0.50 required (Shepherd et al. 2006), as shown in Table 4.
The findings demonstrate that the constructs of Attitude, Subjective Norm, Perceived Behavior Control, Firm Reputation, Trust, Performance Risk, Privacy Risk, Psychological Risk, Financial Risk, Time Risk, Perceived Risk, and Disease Risk have outer factor loading values greater than 0.6, higher than the 0.5 threshold for acceptable results (Daskalakis and Mantas 2008). Meanwhile, the subdimensions and observed variables of the mobile banking adoption model displayed strong internal consistency, with Cronbach’s α values ranging from 0.846 to 0.933 and composite reliability ranging from 0.891 to 0.943, indicating that each value is acceptable and greater than 0.70 for Cronbach’s α and composite reliability (Hair et al. 2011; Hair 2013). Finally, the obtained average variance extracted (AVE) values ranged from 0.528 to 0.783, exceeding the minimum acceptable AVE criterion of 0.5 (Hair 2013; Fornell and Larcker 1981; Wixom and Watson 2001).
As shown in Table 5, the data present the discriminant validity requirement, which compares the square root of the AVE value with the latent variables’ correlations (Fornell and Larcker 1981). The square root values of each AVE were as follows: ATT (0.776), BI (0.876), DSR (0.885), FIR (0.858), FIRM (0.884), PBC (0.788), PR (0.901), PER (0.858), PIR (0.914), PSI (0.883), SN (0.765), TIR (0.872), and TRU (0.899). All values show a higher value than the greatest correlation with the other constructs, except for ATT (0.794), indicating that only ATT and PBC have a high correlation.
Referring to Table 6, the findings indicate that discriminant validity met the required criteria (Hair 2013). Discriminant validity was investigated using the Heterotrait–Monotrait Ratio (HTMT). The estimate of the factor correlation is the HTMT, which should be significantly lower than one (Latan and Noonan 2017). The HTMT values for each construct ranged from 0.021 to 0.889 and thus met the acceptable criteria of less than 0.90. The findings confirm that the research model constructs have discriminant validity.
As shown in Table 7, this study examined the Variance Inflation Factor (VIF) values to address common method bias, suggesting that a construct of Disease Risk (Disease Risk #3) had to be deleted to comply with the maximum VIF threshold below 5.00 (Hair et al. 2011). The findings confirm that the research model satisfies the reliability test requirements. As shown in Table 7, the VIF values ranged from 1.303 to 3.518, which was lower than the cut-off value of 5.00, thus confirming that the measurement model had no collinearity problems.
4.2. The Model Fit
Referring to the validity and reliability results, the data analysis was continued by testing the relevant hypotheses using the proposed research framework. The goodness of fit value is calculated using the Standardized Root Mean Squared Residual (SRMR), which equals 0.067 < 0.080, lower than the cutoff value of 0.08 for PLS path models (Latan and Noonan 2017), indicating that our model fits the empirical data. The R2 value was used as a direct summary measurement to evaluate the structural model, reflecting the estimated power of the hypothesized model (operational variance) (Fornell and Larcker 1981). The R2 value equals 0.471, indicating that 47.1% of the independent variables influence the dependent variable. As shown in Table 8, the effect size (f2) values for Disease Risk (f2 = 0.111), Attitude (f2 = 0.062, and Trust (f2 = 0.028) are large. Meanwhile, the other variables’ effect size (f2) values for Perceived Risk (f2 = 0.005), Perceived Behavior Control (f2 = 0.004), Time Risk (f2 = 0.003), Psychological Risk (f2 = 0.003), Financial Risk (f2 = 0.002), Subjective Norm (f2 = 0.001), Firm Reputation (f2 = 0.001), Performance Risk (f2 = 0.001), and Privacy Risk (f2 = 0.001) are small.
The findings in Table 8 verify that the data analysis results supported 13 of the 19 hypotheses. The hypothesis test results indicate that Attitude (ATT) has a significant and positive effect on bank respondents’ intention to adopt mobile banking (BI) (ß = 0.043, t-stat = 7.898, p < 0.000). Similarly, Perceived Behavior Control (PBC) has a significantly positive effect on BI (ß = 0.037, t-stat = 2.058, p < 0.012). Trust (TRU) had a significant and positive effect on BI (ß = 0.035, t-stat = 5.531, p < 0.002). Disease Risk (DSR) has a significant and positive effect on BI (ß = 0.026, t-stat = 10.712, p < 0.000). Meanwhile, the test results showed that Subjective Norm, Firm Reputation, Performance Risk, Privacy Risk, Financial Risk, and Time Risk did not significantly affect BI.
The R2 results verify that the proposed research model explains 47.1% of mobile banking service acceptance (R2 = 0.471) among bank respondents in Indonesia’s digital banks by integrating the DTPB framework with Health Risk (Disease Risk), Trust, Firm Reputation, Perceived Risk, Performance Risk, Privacy Risk, Psychological Risk, Financial Risk, and Time Risk.
5. Discussion
This study aims to refine the DTPB framework in order to understand mobile banking acceptance among digital banks in Indonesia. The results reveal that the most important factors in accelerating the choice of mobile banking services are Attitude, Perceived Behavior Control, Trust, Disease Risk, Psychological Risk, and Perceived Risk. Disease Risk has the largest impact on accelerating the choice of mobile banking services among bank respondents, followed by Attitude, Perceived Behavior Control, and Trust. The model explains that Disease Risk has a significant and favorable impact on bank respondents’ willingness to accept mobile banking. Considering that the majority of respondents were under 30 years old (85.5%), Disease Risk was identified as the most relevant factor in mobile banking adoption among the bank respondents. The results suggest that bank respondents are aware of the risks and dangers of the COVID-19 outbreak, and thus choose to use mobile banking as a safety measure over cash.
The findings show that Attitude is the second-largest factor in mobile banking adoption. The easy-to-use user navigation and benefits that fit an individual’s working style, lifestyle, values, and needs provided by mobile banking technology shape their Attitude with regard to their choice to use mobile banking services. This study supports previous research that found a positive relationship between Attitude and intention towards using mobile banking examined by (Davis 1989; Ajzen 1991; Taylor and Todd 1995; Lin 2007; Wessels and Drennan 2010; Hanafizadeh et al. 2014; Lee 2009; Kazemi et al. 2013; Al Khasawneh and Irshaidat 2017; Malaquias et al. 2018). The findings verify that bank respondents in Indonesia believe that mobile banking should not involve complicated features that are difficult to understand, and instead should be personalized to consumers’ needs, easy to use, and capable of improving their job performance and lifestyle.
Subjective Norms with Interpersonal and External influence dimensions proved to be insignificant, indicating that bank respondents who use mobile banking services are not affected by the opinions of others, including family members and the media. SN has little effect, confirming a study by (Al Khasawneh and Irshaidat 2017), which indicates that SN has little effect on customers’ willingness to use mobile banking. One potential explanation for this finding is that mobile banking has become essential in providing financial services and, therefore, does not rely on other individuals or media to accept this technology.
Next, Perceived Behavior Control with Self-efficacy and Facilitating conditions dimensions significantly and positively influenced the willingness of bank respondents to accept mobile banking. The findings confirm the capability and availability of the resources required by respondents to operate mobile banking services.
Meanwhile, the findings show that the following insignificant aspects are Performance Risk, Privacy Risk, Financial Risk, and Time Risk. Given that 85.5% of respondents were under 30 years old, this indicates that younger respondents were less concerned about risk when interacting with mobile banking services. The age distribution of the respondents may have contributed to the insignificant effect of the connection between Performance Risk, Privacy Risk, Financial Risk, Time Risk, and the desire to use mobile banking. Meanwhile, the findings suggest that bank respondents are more willing to benefit from mobile banking because it is safer and more hygienic than cash, more personalized to their needs, simpler to understand and use, and offered by a trusted organization.
Furthermore, the analysis shows that Firm Reputation proved insignificant, showing that banks in similar categories are considered to have equal reputations. In addition, the results also reveal that Trust has a large and favorable impact on bank respondents’ intention to use mobile banking. This finding reinforces previous studies by (Hanafizadeh et al. 2014) in Iran, Malaquias (R. F. Malaquias and Silva 2020) in Brazil, and Oliveira et al. (2014) which suggest that the level of consumer Trust reduces Perceived Risk and uncertainty, positively improving customer intentions once Trust is built. This finding contradicts the study conducted by (Koenig-Lewis et al. 2010; Koksal 2016), arguing that Trust had no direct effect on mobile banking adoption.
The results verify that Perceived Risk significantly affects respondents’ intentions to use mobile banking in Indonesia. First, studies conducted by (Koksal 2016; Lassar et al. 2005) concluded that consumers who adopt new technology are younger, have higher levels of income and education, are more tolerant of risk, and are more willing to adopt innovative technologies such as mobile banking. This is consistent with the characteristics of respondents who have much higher income levels, with 41.7% having monthly expenses ranging from US$ 200 to over US$ 500, despite the fact that the annual Indonesian GDP is just over US$ 3000 per capita (BPS Indonesia 2022). Second, another reason is that trust in the banks evaluated in this study has already been established, contributing to the reduced Perceived Risk in these institutions’ mobile banking applications. However, this finding contradicts a previous study (Ho et al. 2020) that revealed that Perceived Risk significantly influences the intention to embrace mobile banking in Taiwan and Vietnam.
Future research should include more subject demographics and condition variations to investigate the differences between respondents in the early and late stages of mobile banking. In addition, the use of non-probability sampling (convenience sampling via online) and data samples gathered in Indonesia is skewed towards young people. As a result, the study demonstrates an indication rather than a population generalization. Generalizability to other nations may also be limited due to cultural differences in consumer behavior. Additional studies are recommended to validate the research model using different types of respondents and nations, including new and experienced mobile banking users. Consequently, the research model should be evaluated further using samples from different nations, and additional testing would provide a more rigorous evaluation of the research framework. Finally, the research model is intended to put all assumptions to the test. It is recommended to use Principal Component Analysis (PCA) to reduce the number of hypotheses in future research to improve readability.
6. Conclusions
This study provides insights into consumer preferences for mobile banking service adoption. The findings demonstrate that the danger posed by the COVID-19 outbreak accelerates the choice of mobile banking adoption and that attitudes are shaped by its usefulness, easy-to-use navigation, and technology that fits the respondents’ lifestyles, values, and needs. The overall effect of Disease Risk, Trust, Perceived Risk, and Psychological Risk on mobile banking adoption by integrating the DTPB framework proves the importance of the research model. For practitioners, the research findings offer valuable insights for banks in creating sustainable competitive advantage by prioritizing mobile banking innovations to provide personalized user experiences by using Big Data to deepen engagement with customer needs, making it easier and effortless to navigate and provide better benefits. For policymakers, regulations and efforts should be made to provide secure mobile banking infrastructure to ensure banks’ consumer data protection from cybersecurity attacks.
This study has various limitations that need additional investigation and research. First, the findings of this study may differ for countries with different levels of economic development, particularly for advanced and developing economies. The different levels of Trust and Perceived Risk among countries are dependent on the quality of technological development, particularly in countries with more secure and reliable mobile banking infrastructure that may influence Trust in these systems and affect mobile banking adoption rates. When these characteristics differ, Trust and Risk may influence customers’ adoption intentions. Another issue to emphasize is that consumers’ intentions to adopt information technology systems depend on their level and degree of experience. While the findings show that Trust and Disease Risk factors are significant, we examined samples in the developing stages of using mobile banking services, implying that the respondents had been using mobile banking for at least some time and were thus deemed proficient in mobile banking services.
Author Contributions
Conceptualization, T.E.S. and D.I.; methodology, T.E.S.; software, T.E.S.; validation, D.B.H., T.B. and D.I.; formal analysis, T.E.S.; investigation, T.E.S.; resources, T.E.S.; data curation, T.E.S.; writing—original draft preparation, T.E.S.; writing—review and editing, D.I.; visualization, T.E.S.; supervision, D.B.H., T.B. and D.I.; project administration, T.E.S.; funding acquisition, T.E.S. All authors have read and agreed to the published version of the manuscript.
Funding
The APC is partially funded by IPB University and Bina Nusantara University.
Institutional Review Board Statement
Not applicable.
Informed Consent Statement
Informed consent was obtained from all subjects involved in the study.
Data Availability Statement
The data that support the findings of this study are available on request from the corresponding author.
Conflicts of Interest
The authors declare no conflicts of interest.
Appendix A. Questionnaire Items
This questionnaire was accessed by respondents in Bahasa Indonesia, which is their native language. Respondents were asked to consider the following range for constructs that use a 7-point Likert scale (from 1 to 7):
| (1) | (2) | (3) | (4) | (5) | (6) | (7) |
| Strongly Disagree | Disagree | Slightly Disagree | Neither Agree nor Disagree | Slightly Agree | Agree | Strongly Agree |
| Variables | Item | |
| Firm Reputation | 1 | I trust my bank |
| 2 | I recommend the services my bank provides | |
| 3 | I recommend my bank as a secure institution | |
| Facilitating conditions | 4 | I have the resources necessary to use mobile banking |
| 5 | I have the knowledge necessary to use mobile banking | |
| Self-efficacy | 6 | If I felt that I wanted to, I could easily use mobile banking by myself |
| 7 | I feel that I am able to use mobile banking even if I currently do not | |
| 8 | I feel comfortable using mobile banking by myself | |
| Interpersonal influence | 9 | I think that my family thinks that I should use mobile banking |
| 10 | I think that my friends think that I should use mobile banking | |
| 11 | I think that people I know think that I should use mobile banking | |
| External influence | 12 | I have read/seen news reports that promote cashless payments using mobile banking |
| 13 | I have read/seen that the press adopts a positive view toward cashless payments using mobile banking | |
| 14 | I have read/seen social media reports that have influenced me to try mobile banking | |
| Perceived usefulness | 15 | During the COVID-19 pandemic, I feel using mobile banking is effective |
| 16 | During the COVID-19 pandemic, I feel using mobile banking makes payment easier | |
| 17 | During the COVID-19 pandemic, I feel using mobile banking increases productivity | |
| 18 | During the COVID-19 pandemic, I feel using mobile banking may improve performance | |
| Perceived Ease of Use | 19 | I think that it would be easy to become skillful in using mobile banking |
| 20 | I think that interactions with mobile banking are clear and understandable | |
| 21 | I think it is easy to follow all the steps to use mobile banking | |
| 22 | I think it is easy to interact with mobile banking | |
| Compatibility | 23 | I feel that using mobile banking is compatible with my lifestyle |
| 24 | I feel that using mobile banking fits well with the way I do my finances | |
| 25 | I feel that using mobile banking fits into my working style | |
| Performance Risk | 26 | I feel mobile banking may be unstable or blocked |
| 27 | I feel mobile banking might not work as expected | |
| 28 | I feel mobile banking may not match its communicated level | |
| Financial Risk | 29 | I feel the use of mobile banking would cause the exposure of capital accounts and passwords |
| 30 | I feel the use of mobile banking would cause malicious and unreasonable charges | |
| 31 | I feel the use of mobile banking can cause financial risk | |
| Privacy Risk | 32 | I feel that if I use mobile banking, privacy information could be misused, inappropriately shared, or sold |
| 33 | I feel that if I use mobile banking, my personal information could be intercepted or accessed | |
| 34 | I feel that if I use mobile banking, transaction information could be collected, tracked, and analyzed | |
| Psychological Risk | 35 | I feel that mobile banking would cause unnecessary tension, e.g., concerns about errors in operation |
| 36 | I feel that a breakdown in mobile banking systems could cause unwanted anxiety and confusion | |
| 37 | I feel that the usage of mobile banking could cause discomfort | |
| Time Risk | 38 | I have experienced time loss due to the instability and low speed of mobile banking |
| 39 | I feel that more time is required to fix mobile banking errors offline | |
| Trust | 40 | I trust my bank to offer secure mobile banking. |
| 41 | I find mobile banking is secure for conducting transactions | |
| 42 | I find mobile banking is safe for receiving bank statements | |
| Perceived Behavioral Control | 43 | If I wanted to, I could use mobile banking |
| 44 | I have the resources, knowledge, and ability to make use of mobile banking | |
| 45 | I would be able to use mobile banking | |
| Subjective Norms | 46 | I think that people whose opinions I value would approve that I use mobile banking |
| 47 | I think that people who influence my behavior would think that I should use mobile banking | |
| 48 | I think that people who are important to me would agree if I used mobile banking | |
| Attitude | 49 | I think that using mobile banking is a good idea |
| 50 | I think that using mobile banking is wise | |
| 51 | I think that using mobile banking is beneficial | |
| 52 | I think that using mobile banking is interesting | |
| Perceived Risk | 53 | Using mobile banking to pay my bills would be risky |
| 54 | Mobile banking is dangerous to use | |
| 55 | Using mobile banking would add great uncertainty to my bill-paying | |
| 56 | Using mobile banking exposes you to overall risk | |
| Disease Risk | 57 | I am worried about being infected by the coronavirus when using physical cash |
| 58 | I am not comfortable making payments using physical cash | |
| 59 | I am afraid there are coronavirus droplets on physical cash | |
| Behavioral Intention | 60 | I will use mobile banking for payment transactions during the COVID-19 pandemic |
| 61 | I prefer using mobile banking for payment transactions during the COVID-19 pandemic | |
| 62 | I will continue to use mobile banking for payment transactions after the COVID-19 pandemic has ended |
References
- Ahlstrom, David, Jean-Luc Arregle, Michael A. Hitt, Gongming Qian, Xufei Ma, and Dries Faems. 2020. Managing Technological, Sociopolitical, and Institutional Change in the New Normal. Journal of Management Studies 57: 411–37. [Google Scholar] [CrossRef]
- Aji, Hendy Mustiko, Izra Berakon, and Maizaitulaidawati Md Husin. 2020. COVID-19 and e-wallet usage intention: A multigroup analysis between Indonesia and Malaysia. Cogent Business and Management 7. [Google Scholar] [CrossRef]
- Ajzen, Icek. 1991. The Theory of Planned Behavior. Organization Behavior and Human Decision Process 50: 179–211. [Google Scholar] [CrossRef]
- Al Khasawneh, Mohammad Hamdi, and Rand Irshaidat. 2017. Empirical validation of the decomposed theory of planned behaviour model within the mobile banking adoption context. International Journal of Electronic Marketing and Retailing 8: 58–76. [Google Scholar] [CrossRef]
- Aldiabat, Khaled, Anwar Al-Gasaymeh, Mohannad M. Alebbini, Aktham A. Alsarayreh, Ali A. Alzoubi, and Eng. Abdulrahman A. Alhowas. 2022. The COVID-19 pandemic and its impact on consumer’s interaction on mobile banking application: Evidence from Jordan. International Journal of Data and Network Science 6: 953–60. [Google Scholar] [CrossRef]
- Anderson, Jamie. 2009. M-banking in developing markets: Competitive and regulatory implications. Info 12: 18–25. [Google Scholar] [CrossRef]
- Bank Indonesia. 2019a. Bank Indonesia: Menavigasi Sistem Pembayaran Nasional di Era Digital, p. 91. Available online: https://www.bi.go.id/id/publikasi/kajian/Documents/Blueprint-Sistem-Pembayaran-Indonesia-2025.pdf (accessed on 14 May 2023).
- Bank Indonesia. 2019b. Peraturan Anggota Dewan Gubernur Nomor 21/18/PADG/2019 Tentang Implementasi Standar Nasional Quick Response Code Untuk Pembayaran. Available online: https://www.bi.go.id/id/publikasi/peraturan/Documents/padg_211819.pdf (accessed on 10 November 2023).
- BPS Indonesia. 2022. Statistik Indonesia 2022. Statistik Indonesia 1101001: 790. Available online: https://www.bps.go.id/publication/2020/04/29/e9011b3155d45d70823c141f/statistik-indonesia-2020.html (accessed on 4 October 2023).
- Dahlstrom, Robert, Arne Nygaard, Maria Kimasheva, and Arne M. Ulvnes. 2014. How to recover trust in the banking industry? A game theory approach to empirical analyses of bank and corporate customer relationships. International Journal of Bank Marketing 32: 268–78. [Google Scholar] [CrossRef]
- Daskalakis, Stylianos, and John Mantas. 2008. Evaluating the impact of a service-oriented framework for healthcare interoperability. Studies in Health Technology and Informatics 136: 285. [Google Scholar]
- Davis, Fred D. 1989. Perceived Usefulness, Perceived Ease of Use, and User Acceptance of Information Technology. MIS Quarterly 13: 319–40. [Google Scholar] [CrossRef]
- Featherman, Mauricio S., and Paul A. Pavlou. 2003. Predicting e-services adoption: A perceived risk facets perspective. International Journal of Human Computer Studies 59: 451–74. [Google Scholar] [CrossRef]
- Financial Services Authority. 2018. Peraturan Otoritas Jasa Keuangan Republik Indonesia Nomor 12/POJK.03/2018 Tentang Penyelenggaraan Layanan Perbankan Digital oleh Bank Umum. Available online: https://www.ojk.go.id/id/regulasi/Documents/Pages/Penyelenggaraan-Layanan-Perbankan-Digital-oleh-Bank-Umum/POJK%2012-2018.pdf (accessed on 10 November 2023).
- Financial Services Authority. 2021. Peraturan Otoritas Jasa Keuangan Republik Indonesia Nomor 12/POJK.03/2021 Tentang Bank Umum. Available online: https://peraturan.go.id/files/ojk12-2021bt.pdf (accessed on 4 October 2023).
- Fornell, Claes, and David F. Larcker. 1981. Evaluating Structural Equation Models with Unobservable Variables and Measurement Error. Journal of Marketing Research 18: 39–50. [Google Scholar] [CrossRef]
- Giovanis, Apostolos, Pinelopi Athanasopoulou, Costas Assimakopoulos, and Christos Sarmaniotis. 2019. Adoption of mobile banking services. International Journal of Bank Marketing 37: 1165–89. [Google Scholar] [CrossRef]
- Google, Temasek, and Bain. 2020. 5th Edition of e-Conomy SEA, 5th ed. vol. 148, pp. 148–62. Available online: https://storage.googleapis.com/gweb-economy-sea.appspot.com/assets/pdf/e-Conomy_SEA_2020_Report.pdf (accessed on 14 May 2023).
- Ha, Kyung-Hun, Andrea Canedoli, Aaron W. Baur, and Markus Bick. 2012. Mobile banking—Insights on its increasing relevance and most common drivers of adoption. Electronic Markets 22: 217–27. [Google Scholar] [CrossRef]
- Hair, Joe F., Christian M. Ringle, and Marko Sarstedt. 2011. PLS-SEM: Indeed a silver bullet. Journal of Marketing Theory and Practice 19: 139–52. [Google Scholar] [CrossRef]
- Hair, Joseph F. 2013. Multivariate Data Analysis. London: Pearson Education Limited. [Google Scholar]
- Hanafizadeh, Payam, Mehdi Behboudi, Amir Abedini Koshksaray, and Marziyeh Jalilvand Shirkhani Tabar. 2014. Jalilvand Shirkhani Tabar, Mobile-banking adoption by Iranian bank clients. Telematics and Informatics 31: 62–78. [Google Scholar] [CrossRef]
- Ho, Jonathan C., Chorng-Guang Wu, Chung-Shing Lee, and Thanh-Thao T. Pham. 2020. Factors affecting the behavioral intention to adopt mobile banking: An international comparison. Technology in Society 63: 101360. [Google Scholar] [CrossRef]
- Kazemi, Ali, Akbar Nilipour, Nastaran Kabiry, and Mahnaz Mohammad Hoseini. 2013. Factors Affecting Isfahanian Mobile Banking Adoption Based on the Decomposed Theory of Planned Behavior. International Journal of Academic Research in Business and Social Sciences 3: 230–45. [Google Scholar] [CrossRef]
- Kim, Gimun, BongSik Shin, and Ho Geun Lee. 2009. Understanding dynamics between initial trust and usage intentions of mobile banking. Information Systems Journal 19: 283–311. [Google Scholar] [CrossRef]
- Koenig-Lewis, Nicole, Adrian Palmer, and Alexander Moll. 2010. Predicting young consumers’ take up of mobile banking services. International Journal of Bank Marketing 28: 410–32. [Google Scholar] [CrossRef]
- Koksal, Mehmet Haluk. 2016. The intentions of Lebanese consumers to adopt mobile banking. International Journal of Bank Marketing 34: 327–46. [Google Scholar] [CrossRef]
- Lassar, Walfried M., Chris Manolis, and Sharon S. Lassar. 2005. The relationship between consumer innovativeness, personal characteristics, and online banking adoption. International Journal of Bank Marketing 23: 176–99. [Google Scholar] [CrossRef]
- Latan, Hengky, and Richard Noonan. 2017. Partial Least Squares Path Modeling: Basic Concepts, Methodological Issues and Applications. Cham: Springer International Publishing. [Google Scholar] [CrossRef]
- Lee, Ming-Chi. 2009. Factors influencing the adoption of internet banking: An integration of TAM and TPB with perceived risk and perceived benefit. Electronic Commerce Research and Applications 8: 130–41. [Google Scholar] [CrossRef]
- Lin, Hsiu-Fen. 2007. Predicting consumer intentions to shop online: An empirical test of competing theories. Electronic Commerce Research and Applications 6: 433–42. [Google Scholar] [CrossRef]
- Malaquias, Fernanda, Rodrigo Malaquias, and Yujong Hwang. 2018. Understanding the determinants of mobile banking adoption: A longitudinal study in Brazil. Electronic Commerce Research and Applications 30: 1–7. [Google Scholar] [CrossRef]
- Malaquias, Rodrigo Fernandes, and Altieres Frances Silva. 2020. Understanding the use of mobile banking in rural areas of Brazil. Technology in Society 62: 101260. [Google Scholar] [CrossRef]
- Maser, Birgit, and Klaus Weiermair. 1998. Travel Decision-Making: From the Vantage Point of Perceived Risk and Information Preferences. Journal of Travel & Tourism Marketing 7: 107–21. [Google Scholar]
- Oliveira, Tiago, Miguel Faria, Manoj Abraham Thomas, and Aleš Popovič. 2014. Extending the understanding of mobile banking adoption: When UTAUT meets TTF and ITM. International Journal of Information Management 34: 689–703. [Google Scholar] [CrossRef]
- Rogers, Everett M. 1995. Diffusion of Innovations, 4th ed. Hong Kong: The Free Press. [Google Scholar]
- Rosenblad, Andreas. 2009. Applied Multivariate Statistics for the Social Sciences, Fifth Edition by James P. Stevens. International Statistical Review 77: 476. [Google Scholar] [CrossRef]
- Saraswati, Dyah Annisa, Nita Suhanda Putra Praditta Syifa Desvi, and Evelyn Hendriana. 2021. Examination of the Extended UTAUT Model in Mobile Wallet Continuous Usage Intention during the COVID-19 Outbreak. Turkish Online Journal of Qualitative Inquiry 12: 1320–35. [Google Scholar] [CrossRef]
- Shepherd, Morgan M., Debbie B. Tesch, and Jack S. C. Hsu. 2006. Environmental Traits That Support a Learning Organization The Impact on Information System Development Projects. Comparative Technology Transfer and Society 4: 196–218. [Google Scholar] [CrossRef]
- Taylor, Shirley, and Peter A. Todd. 1995. Understanding information technology usage: A test of competing models. Information Systems Research 6: 144–76. [Google Scholar] [CrossRef]
- Urbach, Nils, and Frederik Ahlemann. 2010. Structural Equation Modeling in Information Systems Research Using Partial Least Squares. Journal of Information Technology Theory and Application (JITTA) 11: 2. [Google Scholar]
- Venkatesh, Viswanath, Gordon B. Davis Michael G. Morris, and Fred D. Davis. 2003. User Acceptance of Information Technology: Toward a Unified View. MIS Quarterly 27: 425–478. [Google Scholar] [CrossRef]
- Wessels, Lisa, and Judy Drennan. 2010. An investigation of consumer acceptance of M-banking. International Journal of Bank Marketing 28: 547–68. [Google Scholar] [CrossRef]
- West, Stephen G., John F. Finch, and Patrick J. Curran. 1995. Structural Equation Models with Nonnormal Variables: Problems and Remedies. Thousand Oaks: Sage Publications. [Google Scholar]
- Wixom, Barbara H., and Hugh J. Watson. 2001. An Empirical Investigation of the Factors Affecting Data Warehousing Success. MIS Quarterly 25: 17. Available online: http://www.jstor.org/stable/3250957 (accessed on 13 May 2008). [CrossRef]
- World Bank. 2022. The Global Findex Database 2021. Available online: https://www.worldbank.org/en/publication/globalfindex/Report (accessed on 14 May 2023).
- Yang, Qing, Chuan Pang, Liu Liu, David C. Yen, and J. Michael Tarn. 2015. Exploring consumer perceived risk and trust for online payments: An empirical study in China’s younger generation. Computers in Human Behavior 50: 9–24. [Google Scholar] [CrossRef]
- Zhou, Tao. 2012. Understanding users’ initial trust in mobile banking: An elaboration likelihood perspective. Computers in Human Behavior 28: 1518–25. [Google Scholar] [CrossRef]
Figure 1.
Proposed Research Model.

Figure 2.
Mobile Banking Respondent Characteristics According to Age Group.
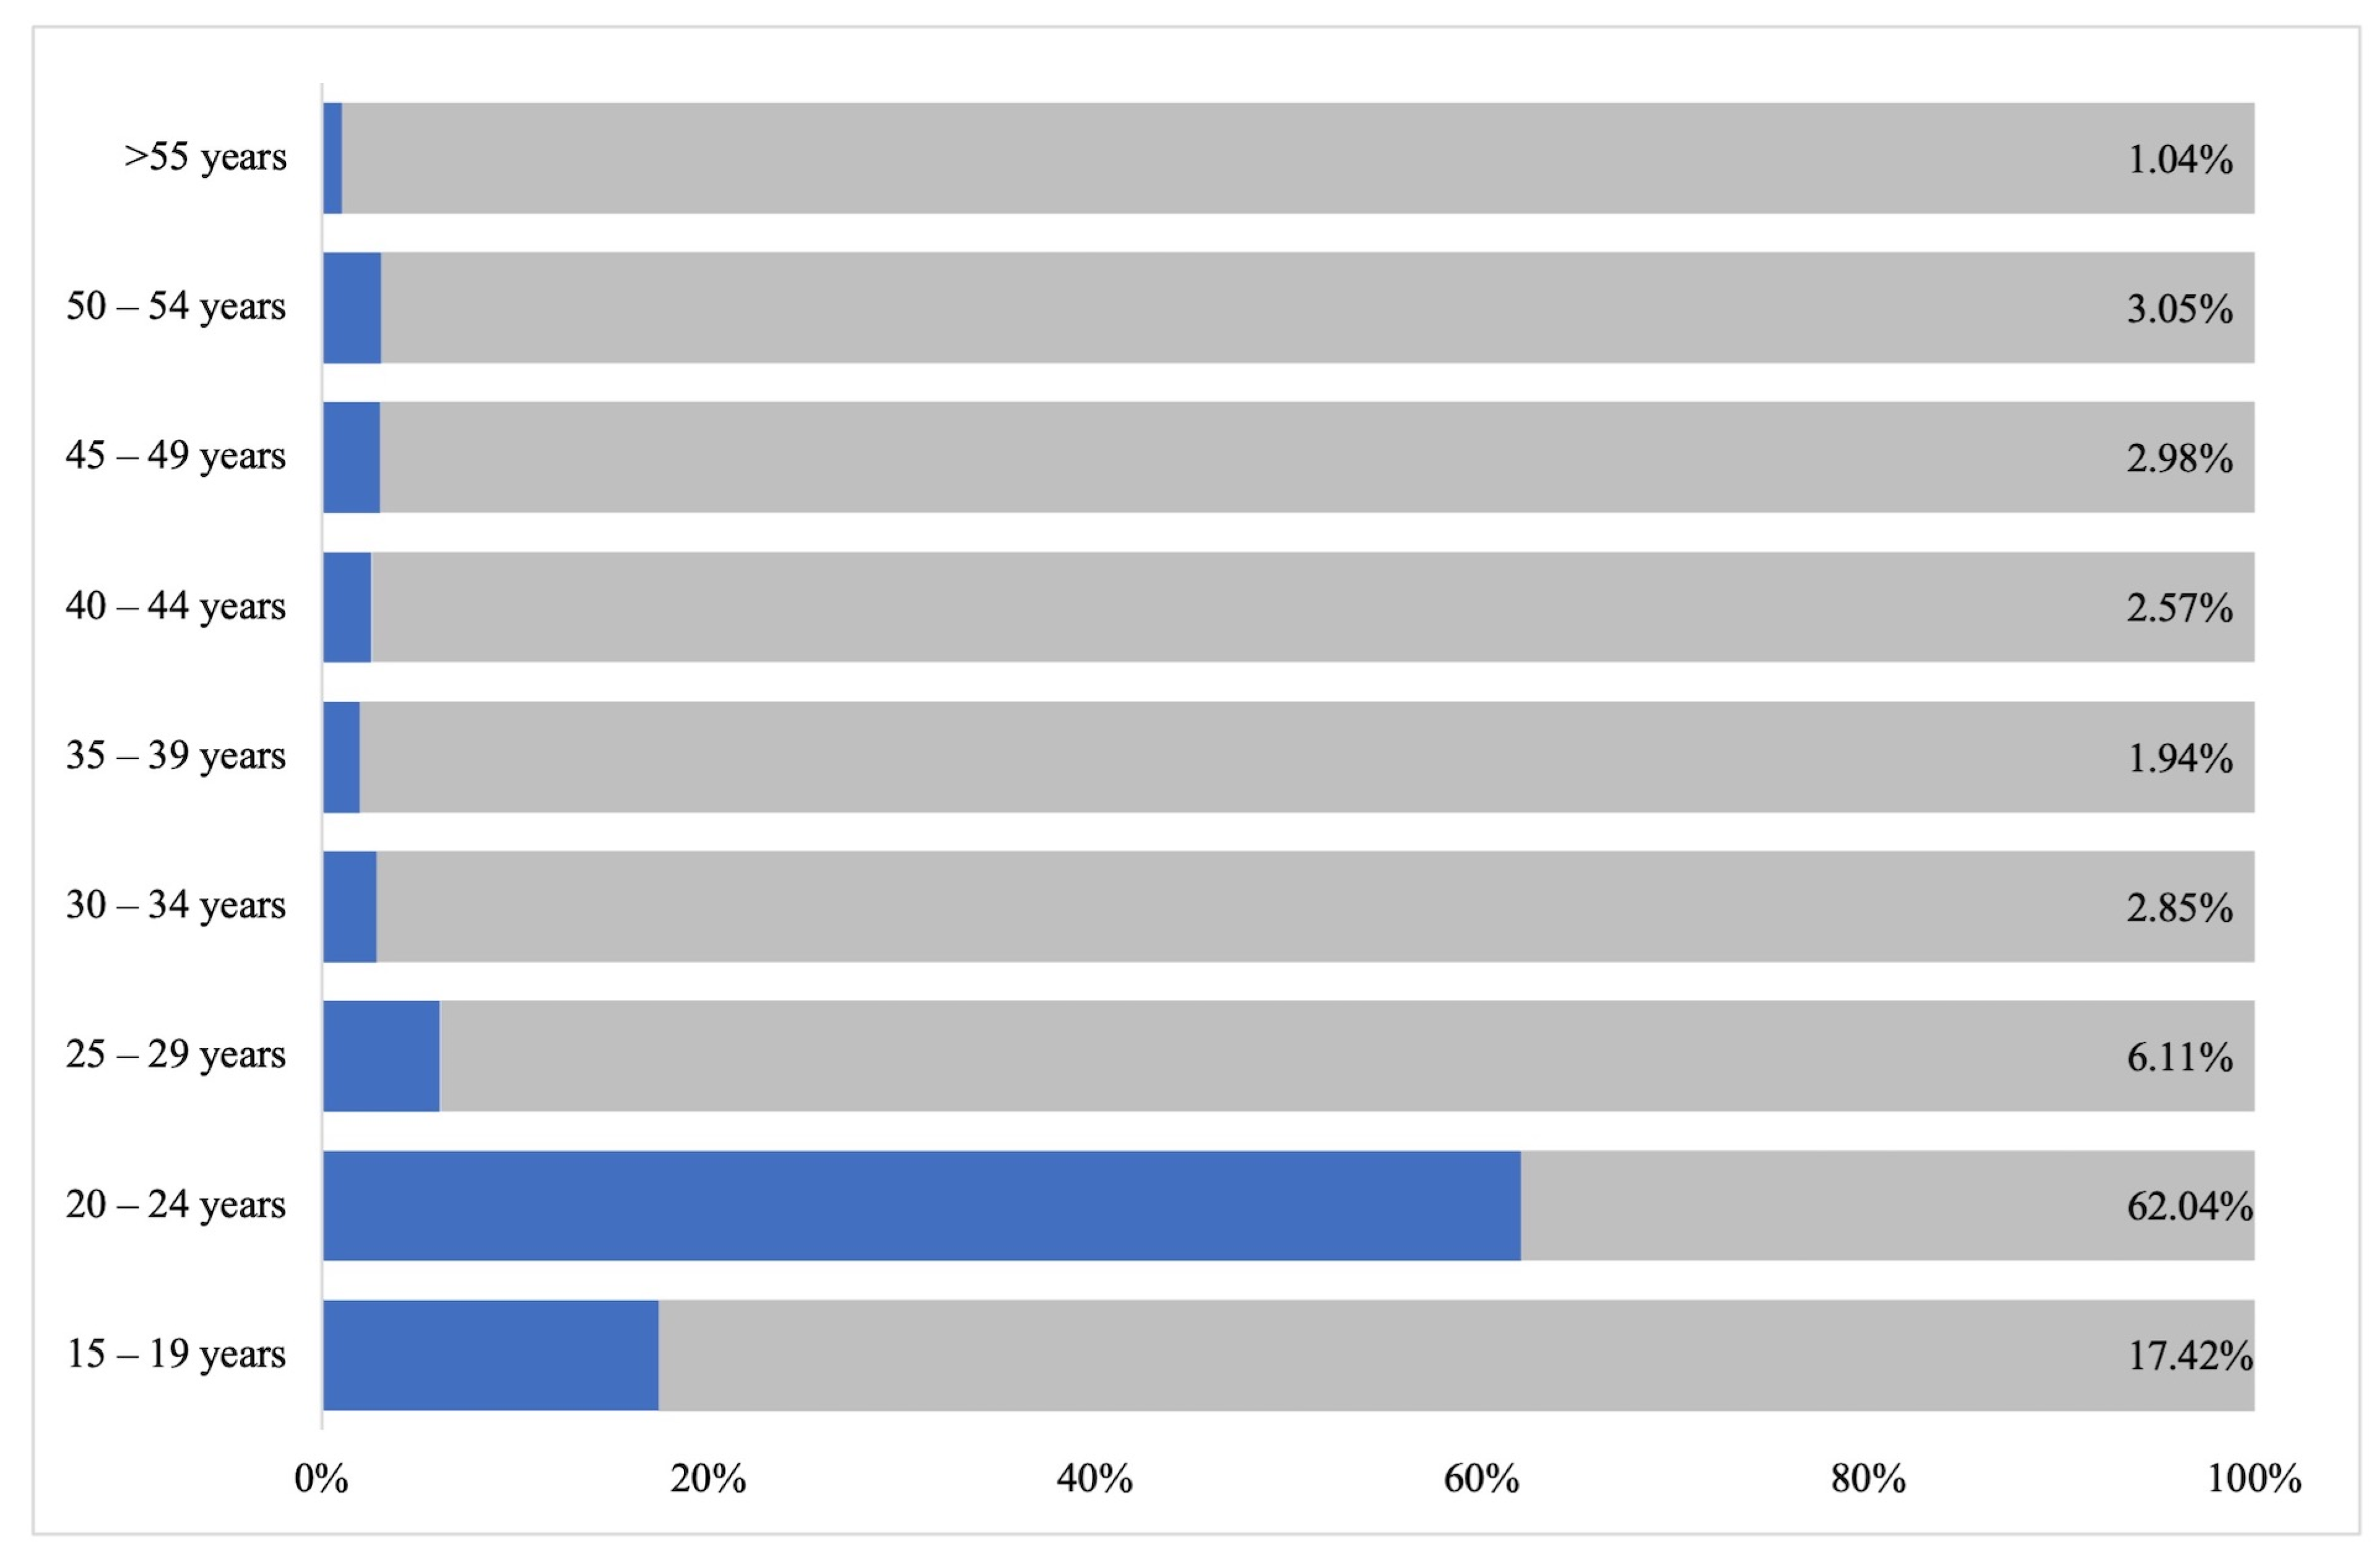
Figure 3.
(a) Respondents Education Level (b) Respondents Occupation.
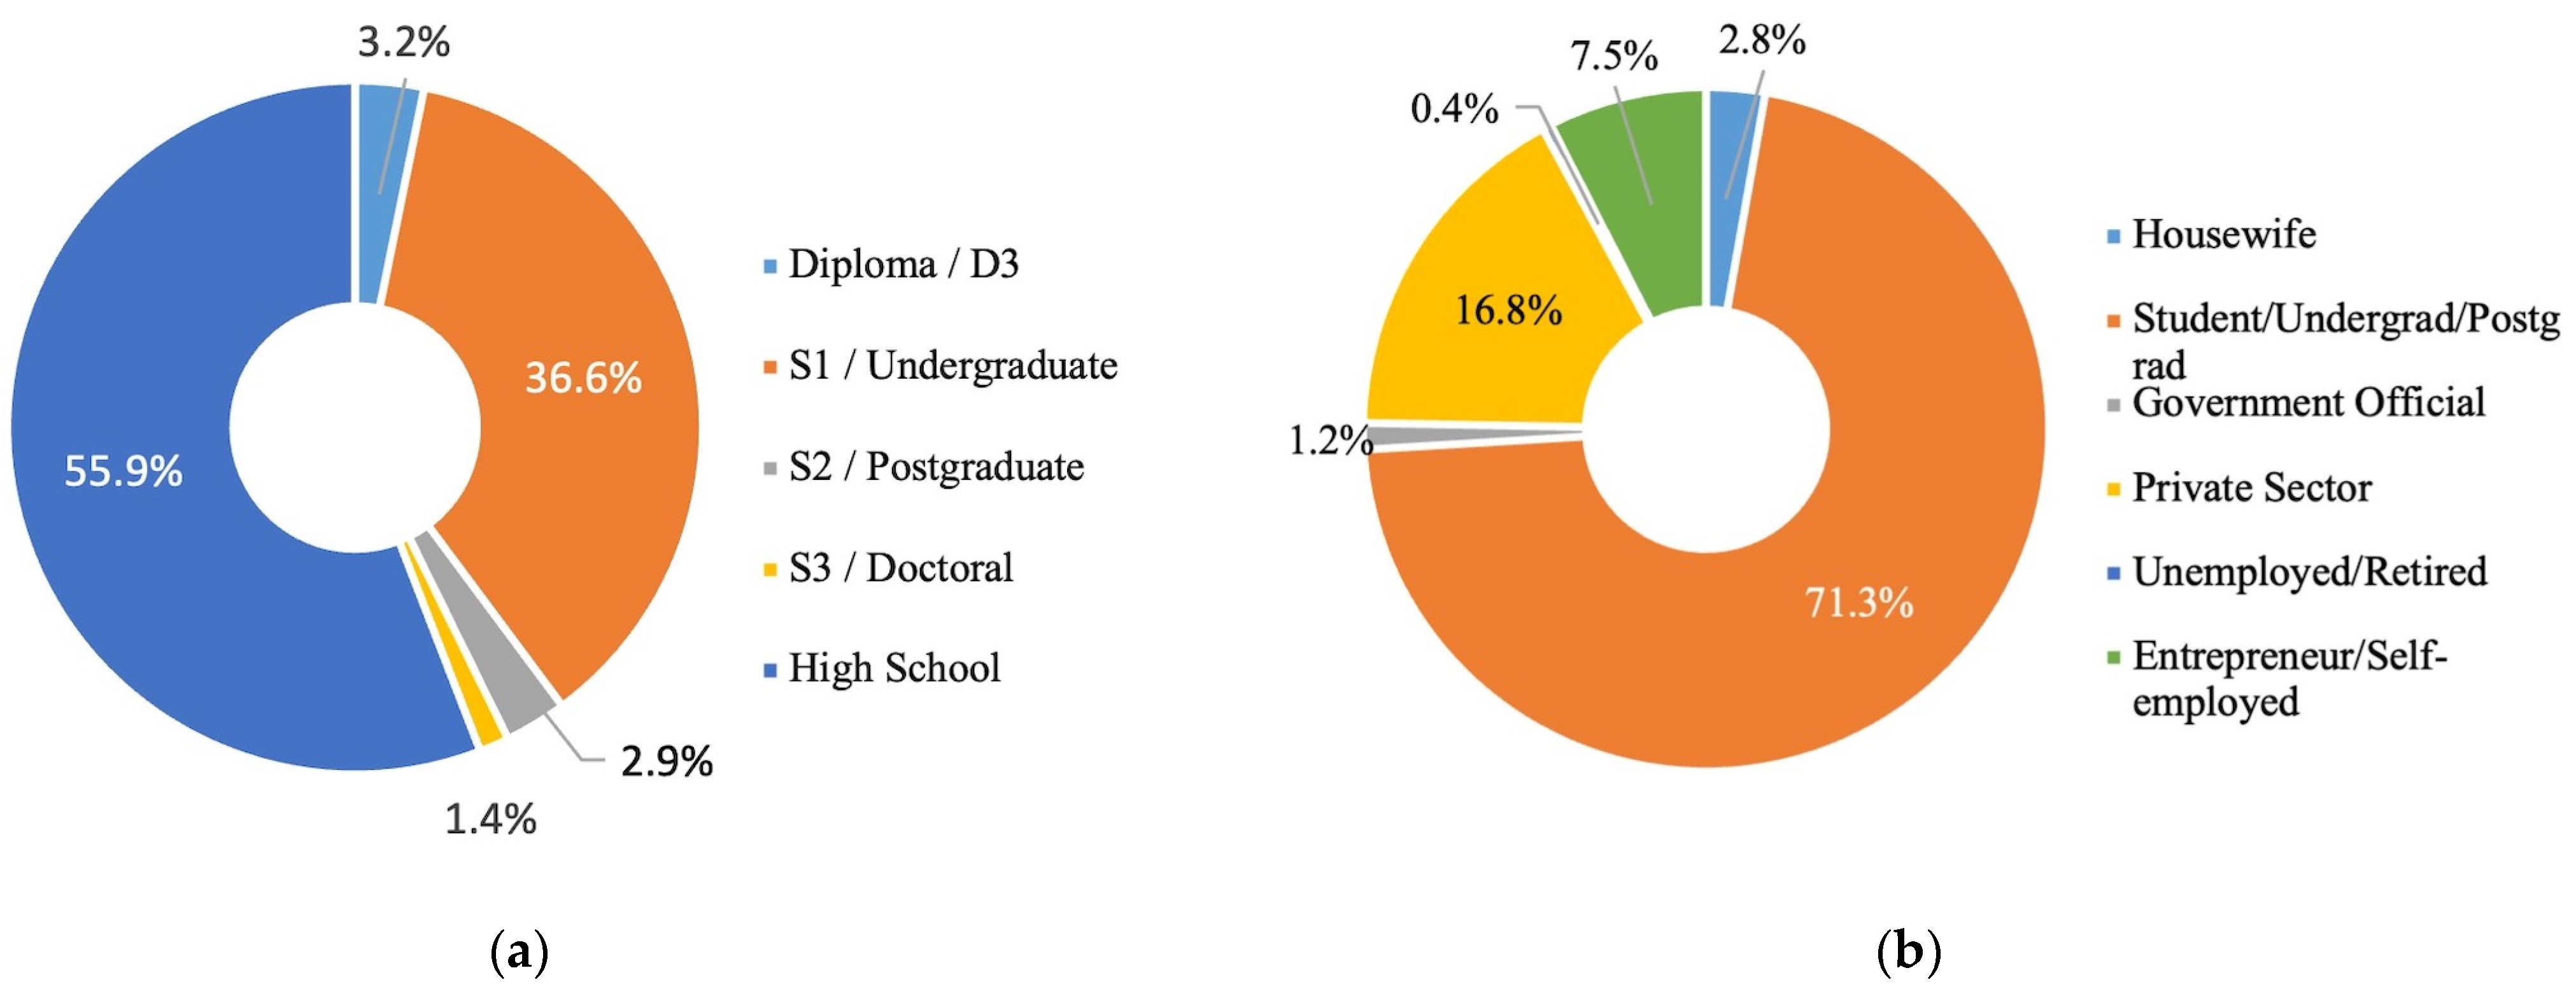
Figure 4.
Mobile Banking Services Used Based On Mobile Banking Experience (Years).

Figure 5.
Mobile Banking Services Used By Respondents Based On Age Group.

Figure 6.
(a) Bank Account Users (b) Mobile Banking Services Users.

Figure 7.
Number of Bank Accounts Used To Access Mobile Banking Services.

Figure 8.
Mobile Banking Services Used Based On Monthly Household Expenditure.


Table 1.
Digital Banks with Mobile Banking Services in Indonesia.
| No. | Bank Name | Mobile Banking Services | Equity (in Trillion) | Bank Category | Source |
|---|---|---|---|---|---|
| 1 | Bank BRI | BRI Mo | IDR 291.79 | KBMI 4 | Annual Report 2021 |
| 2 | Bank BCA | BCA Mobile | IDR 202.85 | KBMI 4 | Annual Report 2021 |
| 3 | Bank Mandiri | Livin’ by Mandiri | IDR 222.11 | KBMI 4 | Annual Report 2021 |
| 4 | Bank BNI | BNI Mobile | IDR 126.52 | KBMI 4 | Annual Report 2021 |
| 5 | Bank Panin | Mobile Panin | IDR 47.46 | KBMI 3 | Annual Report 2020 |
| 6 | Bank Danamon | D-Bank PRO | IDR 45 | KBMI 3 | Annual Report 2021 |
| 7 | Bank CIMB Niaga | OCTO Mobile | IDR 43.39 | KBMI 3 | Annual Report 2021 |
| 8 | Bank Permata | PermataMobileX | IDR 36.61 | KBMI 3 | Annual Report 2021 |
| 9 | Bank BTPN | BTPN Wow! Jenius | IDR 36.08 | KBMI 3 | Annual Report 2021 |
| 10 | Bank OCBC NISP | One Mobile by OCBC NISP | IDR 32.33 | KBMI 3 | Annual Report 2021 |
| 11 | Bank Maybank Indonesia | M2U ID App | IDR 28.70 | KBMI 3 | Annual Report 2021 |
| 12 | Bank Syariah Indonesia | BSI Mobile | IDR 25 | KBMI 3 | Annual Report 2021 |
| 13 | Bank Tabungan Negara | BTN Mobile Banking | IDR 21.41 | KBMI 3 | Annual Report 2021 |
| 14 | Bank HSBC | HSBCnet Mobile | IDR 19.29 | KBMI 3 | Annual Report 2020 |
| 15 | Bank Mega | M-SMILE | IDR 19.14 | KBMI 3 | Annual Report 2021 |
| 16 | Citibank | Citi Mobile | IDR 15.17 | KBMI 3 | Annual Report 2021 |
Table 2.
Descriptive Statistics of Mobile Banking Services Attributes.
| Attributes of Mobile Banking Services | Mean | Standard Deviation | Skewness | Kurtosis |
|---|---|---|---|---|
| Attitude #1 | 6.03 | 0.982 | −1.289 | 2.581 |
| Attitude #2 | 5.81 | 0.997 | −0.705 | 0.007 |
| Attitude #3 | 6.03 | 0.934 | −1.041 | 1.216 |
| Attitude #4 | 5.90 | 1.001 | −0.883 | 0.499 |
| Perceived Usefulness #1 | 6.37 | 0.917 | −1.867 | 4.299 |
| Perceived Usefulness #2 | 6.40 | 0.848 | −1.574 | 2.273 |
| Perceived Usefulness #3 | 6.10 | 1.039 | −1.176 | 1.017 |
| Perceived Usefulness #4 | 6.10 | 1.017 | −1.058 | 0.480 |
| Perceived Ease of Use #1 | 6.08 | 0.941 | −1.226 | 1.981 |
| Perceived Ease of Use #2 | 6.09 | 0.888 | −1.022 | 0.947 |
| Perceived Ease of Use #3 | 6.07 | 0.907 | −1.026 | 0.987 |
| Perceived Ease of Use #4 | 6.18 | 0.857 | −1.137 | 1.410 |
| Compatibility #1 | 5.97 | 1.030 | −1.105 | 1.337 |
| Compatibility #2 | 5.65 | 1.162 | −0.825 | 0.348 |
| Compatibility #3 | 5.89 | 1.023 | −0.895 | 0.608 |
| Perceived Behavior Control #1 | 5.99 | 0.993 | −1.237 | 2.141 |
| Perceived Behavior Control #2 | 6.00 | 0.934 | 0.942 | 0.716 |
| Perceived Behavior Control #3 | 6.15 | 0.923 | −1.352 | 2.473 |
| Facilitating conditions #1 | 5.98 | 0.970 | −1.346 | 2.990 |
| Facilitating conditions #2 | 5.93 | 0.954 | −0.992 | 1.208 |
| Facilitating conditions #3 | 5.71 | 1.191 | −1.184 | 1.564 |
| Self-efficacy #1 | 6.24 | 0.894 | −1.463 | 3.083 |
| Self-efficacy #2 | 5.93 | 1.163 | −1.322 | 1.632 |
| Self-efficacy #3 | 6.25 | 0.856 | −1.363 | 2.641 |
| Subjective Norm #1 | 5.68 | 1.111 | −0.900 | 0.703 |
| Subjective Norm #2 | 5.55 | 1.124 | −0.639 | −0.088 |
| Subjective Norm #3 | 5.75 | 1.061 | −0.805 | 0.175 |
| Interpersonal Influence #1 | 5.76 | 1.157 | −0.940 | 0.685 |
| Interpersonal Influence #2 | 5.87 | 1.110 | −1.045 | 0.835 |
| Interpersonal Influence #3 | 5.84 | 1.078 | −0.901 | 0.434 |
| External Influence #1 | 5.60 | 1.219 | −0.955 | 0.698 |
| External Influence #2 | 5.45 | 1.236 | −0.884 | 0.723 |
| External Influence #3 | 5.46 | 1.256 | −0.901 | 0.668 |
| Trust #1 | 5.80 | 1.008 | −0.852 | 0.748 |
| Trust #2 | 5.88 | 0.920 | −0.781 | 0.499 |
| Trust #3 | 5.78 | 1.003 | −0.764 | 0.333 |
| Firm Reputation #1 | 6.11 | 0.955 | −1.478 | 3.449 |
| Firm Reputation #2 | 5.91 | 1.001 | −0.959 | 0.675 |
| Firm Reputation #3 | 6.01 | 0.936 | −0.930 | 0.650 |
| Performance Risk #1 | 5.15 | 1.321 | −0.671 | 0.256 |
| Performance Risk #2 | 5.26 | 1.327 | −0.744 | 0.259 |
| Performance Risk #3 | 4.90 | 1.383 | −0.486 | −0.190 |
| Privacy Risk #1 | 4.62 | 1.574 | −0.367 | −0.536 |
| Privacy Risk #2 | 4.75 | 1.516 | −0.449 | −0.350 |
| Privacy Risk #3 | 4.96 | 1.462 | −0.587 | −0.095 |
| Financial Risk #1 | 4.68 | 1.566 | −0.394 | −0.513 |
| Financial Risk #2 | 4.67 | 1.547 | −0.340 | −0.625 |
| Financial Risk #3 | 4.73 | 1.487 | −0.350 | −0.446 |
| Psychological Risk #1 | 4.41 | 1.613 | −0.302 | −0.706 |
| Psychological Risk #2 | 4.92 | 1.458 | −0.630 | −0.157 |
| Psychological Risk #3 | 4.27 | 1.659 | −0.122 | −0.850 |
| Time Risk #1 | 3.93 | 1.675 | 0.089 | −0.954 |
| Time Risk #2 | 3.52 | 1.784 | 0.399 | −0.919 |
| Time Risk #3 | 4.57 | 1.489 | −0.315 | −0.396 |
| Perceived Risk#1 | 4.05 | 1.587 | 0.168 | −0.828 |
| Perceived Risk#2 | 3.65 | 1.737 | 0.383 | −0.871 |
| Perceived Risk#3 | 3.66 | 1.677 | 0.373 | −0.787 |
| Perceived Risk#4 | 3.94 | 1.629 | 0.133 | −0.820 |
| Disease Risk #1 | 4.61 | 1.498 | −0.522 | −0.169 |
| Disease Risk #2 | 4.70 | 1.568 | −0.246 | −0.616 |
| Disease Risk #3 | 4.83 | 1.545 | −0.370 | −0.479 |
| Disease Risk #4 | 5.73 | 1.523 | −0.482 | −0.307 |
Table 3.
Respondents’ demographic characteristics (n = 1441).
| Demographic Characteristic | Frequency | % | |
|---|---|---|---|
| Cities | Greater Jakarta (Jakarta, Bogor, Depok, Tangerang, Bekasi) | 1171 | 81.3 |
| Bandung, Surabaya, Bali | 270 | 18.7 | |
| Gender | Male | 777 | 53.9 |
| Female | 664 | 46.1 | |
| Experience using Mobile Banking | <1 year/less than a year | 109 | 7.6 |
| 1–2 year/1 to 2 years | 469 | 32.5 | |
| 2–5 years/2 to 5 years | 658 | 45.7 | |
| >5 years/more than 5 years | 205 | 14.2 | |
| Age | 15–19 years | 251 | 17.4 |
| 20–24 years | 894 | 62.0 | |
| 25–29 years | 88 | 6.1 | |
| 30–34 years | 41 | 2.8 | |
| 35–39 years | 28 | 1.9 | |
| 40–44 years | 37 | 2.6 | |
| 45–49 years | 43 | 3.0 | |
| 50–54 years | 44 | 3.1 | |
| >55 years | 15 | 1.0 | |
| Education Level | High School/Equivalent | 805 | 55.9 |
| Diploma/D3 | 46 | 3.2 | |
| S1/Undergraduate | 528 | 36.6 | |
| S2/Postgraduate | 42 | 2.9 | |
| S3/Doctoral | 20 | 1.4 | |
| Occupation/Work | Housewife | 41 | 2.8 |
| Student/Undergrad/Postgrad | 1031 | 71.3 | |
| Government Official | 18 | 1.2 | |
| Private Sector | 242 | 16.7 | |
| Entrepreneur/Self-employed | 108 | 7.5 | |
| Unemployed/Retired | 6 | 0.4 | |
| Number of Bank Account(s) | Using 1 Bank account | 778 | 54.0 |
| Using 2 Bank accounts | 456 | 31.6 | |
| Using 3 Bank accounts | 132 | 9.2 | |
| Using >3 Bank accounts | 75 | 5.2 | |
| Number of Mobile Banking(s) | Using 1 Mobile Banking | 995 | 69.0 |
| Using 2 Mobile Banking | 315 | 21.9 | |
| Using 3 Mobile Banking | 86 | 6.0 | |
| Using >3 Mobile Banking | 45 | 3.1 | |
| Household Expenditure | < $ 200 | 839 | 58.2 |
| $ 200–$ 500 | 404 | 28.0 | |
| > $ 500 | 198 | 13.7 | |
| Mobile Banking(s) Evaluated | MobilePanin—Bank Panin | 1 | 0.1 |
| D-Bank PRO—Bank Danamon | 1 | 0.1 | |
| BTPN WOW!—Bank BTPN | 2 | 0.1 | |
| Citi Mobile Indonesia—Bank Citibank | 2 | 0.1 | |
| BTN Mobile Banking—Bank BTN | 3 | 0.2 | |
| ONE Mobile—Bank OCBC NISP | 7 | 0.5 | |
| PermataMobileX—Bank Permata | 8 | 0.6 | |
| Maybank2U—Bank Maybank | 8 | 0.6 | |
| BSI Mobile—Bank BSI | 24 | 1.7 | |
| BriMo—Bank BRI | 40 | 2.8 | |
| OCTO Mobile—Bank CIMB Niaga | 41 | 2.8 | |
| BNI Mobile Banking—Bank BNI | 61 | 4.2 | |
| Livin’ by Mandiri—Bank Mandiri | 111 | 7.7 | |
| BCA Mobile—Bank BCA | 1132 | 78.6 | |
| USD = IDR 15,000 | |||
Table 4.
Reliability and Convergent Validity.
| Construct | Dimension | Item | Load | CA | Rho_A | CR | AVE |
|---|---|---|---|---|---|---|---|
| Attitude | PU | PU1 | 0.761 | 0.933 | 0.935 | 0.943 | 0.603 |
| PU2 | 0.777 | ||||||
| PU3 | 0.773 | ||||||
| PU4 | 0.765 | ||||||
| PEOU | PEOU1 | 0.810 | |||||
| PEOU2 | 0.804 | ||||||
| PEOU3 | 0.830 | ||||||
| PEOU4 | 0.848 | ||||||
| COMP | COMP1 | 0.785 | |||||
| COMP2 | 0.635 | ||||||
| COMP3 | 0.730 | ||||||
| Subjective Norm | IPI | IPI1 | 0.701 | 0.858 | 0.860 | 0.894 | 0.585 |
| IPI2 | 0.811 | ||||||
| IPI3 | 0.800 | ||||||
| EXI | EXI1 | 0.762 | |||||
| EXI2 | 0.761 | ||||||
| EXI3 | 0.750 | ||||||
| Behavioral Intention | BI1 | 0.866 | 0.849 | 0.850 | 0.908 | 0.768 | |
| BI2 | 0.896 | ||||||
| BI3 | 0.866 | ||||||
| Perceived Behavior Control | FC | FC1 | 0.756 | 0.846 | 0.851 | 0.891 | 0.621 |
| FC2 | 0.792 | ||||||
| SEF | SEF1 | 0.843 | |||||
| SEF2 | 0.705 | ||||||
| SEF3 | 0.837 | ||||||
| Firm Reputation | FIRM1 | 0.852 | 0.861 | 0.864 | 0.915 | 0.782 | |
| FIRM2 | 0.897 | ||||||
| FIRM3 | 0.903 | ||||||
| Trust | TRU1 | 0.890 | 0.882 | 0.884 | 0.927 | 0.809 | |
| TRU2 | 0.925 | ||||||
| TRU3 | 0.883 | ||||||
| Performance Risk | PERF1 | 0.851 | 0.930 | 0.933 | 0.940 | 0.528 | |
| PERF2 | 0.936 | ||||||
| PERF3 | 0.781 | ||||||
| Privacy Risk | PRI1 | 0.872 | 0.910 | 1.140 | 0.939 | 0.836 | |
| PRI2 | 0.914 | ||||||
| PRI3 | 0.955 | ||||||
| Psychological Risk | PSI1 | 0.767 | 0.785 | 1.974 | 0.874 | 0.780 | |
| PSI2 | 0.985 | ||||||
| Financial Risk | FR1 | 0.919 | 0.849 | 0.912 | 0.893 | 0.737 | |
| FR2 | 0.753 | ||||||
| FR3 | 0.984 | ||||||
| Time Risk | TR1 | 0.726 | 0.803 | 5.288 | 0.861 | 0.761 | |
| TR3 | 0.997 | ||||||
| Perceived Risk | PR1 | 0.800 | 0.930 | 1.143 | 0.945 | 0.813 | |
| PR2 | 0.968 | ||||||
| PR3 PR4 | 0.952 0.877 | ||||||
| Disease Risk | DSR1 | 0.892 | 0.862 | 0.864 | 0.916 | 0.783 | |
| DSR2 | 0.860 | ||||||
| DSR4 | 0.903 |
Table 5.
Discriminant validity: Fornell–Larcker criterion.
| Construct | ATT | BI | DSR | FIR | FIRM | PBC | PR | PER | PRI | PSR | SN | TR | TRU |
|---|---|---|---|---|---|---|---|---|---|---|---|---|---|
| ATT | 0.776 | ||||||||||||
| BI | 0.609 | 0.876 | |||||||||||
| DSR | 0.204 | 0.363 | 0.885 | ||||||||||
| FIR | 0.042 | 0.044 | 0.217 | 0.858 | |||||||||
| FIRM | 0.686 | 0.490 | 0.145 | −0.021 | 0.884 | ||||||||
| PBC | 0.794 | 0.539 | 0.153 | 0.034 | 0.692 | 0.788 | |||||||
| PR | −0.139 | −0.066 | 0.364 | 0.449 | −0.133 | −0.156 | 0.901 | ||||||
| PER | 0.164 | 0.158 | 0.170 | 0.590 | 0.115 | 0.169 | 0.257 | 0.858 | |||||
| PRI | 0.043 | 0.074 | 0.221 | 0.749 | −0.015 | 0.050 | 0.417 | 0.534 | 0.914 | ||||
| PSR | 0.069 | 0.114 | 0.224 | 0.561 | 0.050 | 0.051 | 0.374 | 0.493 | 0.562 | 0.883 | |||
| SN | 0.620 | 0.416 | 0.244 | 0.114 | 0.558 | 0.552 | 0.034 | 0.187 | 0.096 | 0.158 | 0.765 | ||
| TR | −0.161 | −0.067 | 0.320 | 0.397 | −0.098 | −0.168 | 0.604 | 0.274 | 0.363 | 0.387 | 0.061 | 0.872 | |
| TRU | 0.646 | 0.529 | 0.202 | 0.006 | 0.643 | 0.614 | −0.094 | 0.155 | 0.018 | 0.077 | 0.546 | −0.055 | 0.899 |
Note: p < 0.001.
Table 6.
Discriminant validity: Heterotrait–Monotrait Ratio (HTMT).
| Construct | ATT | BI | DSR | FIR | FIRM | PBC | PR | PER | PRI | PSR | SN | TR | TRU |
|---|---|---|---|---|---|---|---|---|---|---|---|---|---|
| ATT | 0.000 | ||||||||||||
| BI | 0.682 | 0.000 | |||||||||||
| DSR | 0.230 | 0.425 | 0.000 | ||||||||||
| FIR | 0.042 | 0.047 | 0.254 | 0.000 | |||||||||
| FIRM | 0.765 | 0.572 | 0.167 | 0.034 | 0.000 | ||||||||
| PBC | 0.889 | 0.633 | 0.182 | 0.044 | 0.809 | 0.000 | |||||||
| PR | 0.140 | 0.065 | 0.407 | 0.550 | 0.134 | 0.154 | 0.000 | ||||||
| PER | 0.159 | 0.168 | 0.219 | 0.719 | 0.115 | 0.176 | 0.341 | 0.000 | |||||
| PRI | 0.044 | 0.079 | 0.251 | 0.860 | 0.038 | 0.052 | 0.492 | 0.632 | 0.000 | ||||
| PSR | 0.079 | 0.113 | 0.301 | 0.740 | 0.052 | 0.053 | 0.525 | 0.628 | 0.698 | 0.000 | |||
| SN | 0.694 | 0.487 | 0.287 | 0.131 | 0.648 | 0.646 | 0.106 | 0.208 | 0.110 | 0.193 | 0.000 | ||
| TR | 0.148 | 0.066 | 0.379 | 0.585 | 0.098 | 0.157 | 0.706 | 0.439 | 0.517 | 0.666 | 0.105 | 0.000 | |
| TRU | 0.721 | 0.611 | 0.232 | 0.021 | 0.738 | 0.708 | 0.089 | 0.163 | 0.031 | 0.071 | 0.629 | 0.053 | 0.000 |
Table 7.
Multicollinearity assessment using VIF values.
| BI | ATT | DSR | FIR | FIRM | PBC | PR | PER | PRI | PSR | SN | TR | TRU | |
|---|---|---|---|---|---|---|---|---|---|---|---|---|---|
| BI | 3.518 | 1.303 | 2.799 | 2.433 | 3.159 | 1.873 | 1.725 | 2.519 | 1.721 | 1.876 | 1.783 | 2.090 |
Table 8.
Hypothesis testing.
| Hypo- thesis | Relation | f2 | β | T-Stat | p- Values | Result |
|---|---|---|---|---|---|---|
| H1 | PU positively related to the ATT to adopt mobile banking | 3.94 | 0.01 | 124.23 | 0.00 | Do Not Reject |
| H2 | PEOU will positively affect the ATT to mobile banking. | 4.58 | 0.01 | 136.81 | 0.00 | Not Rejected |
| H3 | COMP will positively affect the ATT to adopt mobile banking | 2.30 | 0.01 | 73.39 | 0.00 | Not Rejected |
| H4 | ATT will positively affect the intention to adopt mobile banking | 0.06 | 0.04 | 7.90 | 0.00 | Not Rejected |
| H5 | IPI will positively affect the SN to adopt mobile banking | 3.39 | 0.01 | 121.54 | 0.00 | Not Rejected |
| H6 | EXI will positively affect the SN to adopt mobile banking | 3.08 | 0.01 | 106.36 | 0.00 | Not Rejected |
| H7 | SN will positively affect the intention to adopt mobile banking | 0.00 | 0.04 | 1.55 | 0.24 | Rejected |
| H8 | FC will positively affect the PBC to adopt mobile banking | 3.35 | 0.01 | 101.82 | 0.00 | Not Rejected |
| H9 | SEF will positively affect PBC to adopt mobile banking | 7.59 | 0.00 | 225.36 | 0.00 | Not Rejected |
| H10 | PBC will positively affect the intention to adopt mobile banking | 0.00 | 0.04 | 2.06 | 0.01 | Not Rejected |
| H11 | FIRM will positively affect the intention to adopt mobile banking | 0.00 | 0.04 | 1.39 | 0.16 | Rejected |
| H12 | TRU will positively affect the intention to adopt mobile banking. | 0.03 | 0.04 | 5.53 | 0.00 | Not Rejected |
| H13 | PER will negatively affect the intention to adopt mobile banking | 0.00 | 0.03 | 1.28 | 0.20 | Rejected |
| H14 | PRI will negatively affect the intention to adopt mobile banking | 0.00 | 0.03 | 1.12 | 0.26 | Rejected |
| H15 | PSR will negatively affect the intention to adopt mobile banking | 0.00 | 0.03 | 2.12 | 0.03 | Not Rejected |
| H16 | FIR will negatively affect the intention to adopt mobile banking | 0.00 | 0.03 | 1.62 | 0.11 | Rejected |
| H17 | TIR will negatively affect the intention to adopt mobile banking. | 0.00 | 0.03 | 1.60 | 0.11 | Rejected |
| H18 | PR will negatively affect the intention to adopt mobile banking. | 0.01 | 0.03 | 2.34 | 0.02 | Not Rejected |
| H19 | DSR will positively affect the intention to adopt mobile banking. | 0.11 | 0.03 | 10.71 | 0.000 | Not Rejected |
Disclaimer/Publisher’s Note: The statements, opinions and data contained in all publications are solely those of the individual author(s) and contributor(s) and not of MDPI and/or the editor(s). MDPI and/or the editor(s) disclaim responsibility for any injury to people or property resulting from any ideas, methods, instructions or products referred to in the content. |
© 2023 by the authors. Licensee MDPI, Basel, Switzerland. This article is an open access article distributed under the terms and conditions of the Creative Commons Attribution (CC BY) license (https://creativecommons.org/licenses/by/4.0/).
Share and Cite
MDPI and ACS Style
Sebayang, T.E.; Hakim, D.B.; Bakhtiar, T.; Indrawan, D. What Accelerates the Choice of Mobile Banking for Digital Banks in Indonesia? J. Risk Financial Manag. 2024, 17, 6. https://doi.org/10.3390/jrfm17010006
AMA Style
Sebayang TE, Hakim DB, Bakhtiar T, Indrawan D. What Accelerates the Choice of Mobile Banking for Digital Banks in Indonesia? Journal of Risk and Financial Management. 2024; 17(1):6. https://doi.org/10.3390/jrfm17010006
Chicago/Turabian StyleSebayang, Toto Edrinal, Dedi Budiman Hakim, Toni Bakhtiar, and Dikky Indrawan. 2024. "What Accelerates the Choice of Mobile Banking for Digital Banks in Indonesia?" Journal of Risk and Financial Management 17, no. 1: 6. https://doi.org/10.3390/jrfm17010006