
Predicting Financial Inclusion in Peru: Application of Machine Learning Algorithms
by
 , , , and
Rocío Maehara
1,*,†,
Luis Benites
2,†,
Alvaro Talavera
1,†,
Alejandro Aybar-Flores
1,† and
Miguel Muñoz
1,† 1
Departamento de Ingeniería, Universidad del Pacífico, Lima 15072, Peru
2
Departamento de Administración, Universidad del Pacífico, Lima 15072, Peru
*
Author to whom correspondence should be addressed.
†
These authors contributed equally to this work.
J. Risk Financial Manag. 2024, 17(1), 34; https://doi.org/10.3390/jrfm17010034
Submission received: 20 December 2023
/
Revised: 10 January 2024
/
Accepted: 12 January 2024
/
Published: 15 January 2024
(This article belongs to the Special Issue Applied Statistics and Big Data Analysis in Finance: Exploring Emerging Trends and Opportunities)
Abstract
:Financial inclusion is a fundamental and multidimensional matter that has acquired importance on the global agenda in recent years. In addition, it is still a source of great interest and concern for lawmakers, international organizations, scholars, and financial institutions worldwide. In that regard, this research focuses on Peru to assess the country’s financial inclusion condition, which continues to face significant hurdles in providing financial services to its whole population despite economic improvement. The aim of this article is twofold, based on recent data on demand for financial services and financial culture in the country: (1) to empirically test how machine learning methods, such as decision trees, random forests, artificial neural networks, XGBoost, and support vector machines, can be a valuable complement to standard models (i.e., generalized linear models like logistic regression) for assessing financial inclusion in Peru, and (2) to identify the most influential sociodemographic factors on financial inclusion assessment in the country. The results may catalyze the integration of machine learning techniques into the Peruvian financial system, garnering the interest of finance researchers and policymakers committed to augmenting financial access and utilization among Peruvian consumers.
1. Introduction
Financial inclusion is a fundamental and multidimensional matter that has acquired importance on the global agenda in recent years. Financial inclusion refers to the accessibility and availability of formal financial services to all individuals and businesses irrespective of their socioeconomic status (Garg and Agarwal 2014). These services include savings accounts, credit facilities, insurance, and digital payment platforms. These are pivotal in facilitating economic growth, poverty reduction, and overall societal development (Demirgüç-Kunt et al. 2017).
The significance of financial inclusion stems from its potential to bridge the gap between financially under-served and formal financial systems (Moretto and Scola Gahwiler 2017). By ensuring that marginalized and low-income populations have access to these services, financial inclusion empowers them to participate in economic activities actively, make informed financial decisions, and safeguard themselves against unexpected shocks. Consequently, it fosters a more equitable and inclusive society, paving the way for sustainable economic progress.
Across the world, financial inclusion is still a source of great interest and concern for lawmakers, international organizations, scholars, and financial institutions. Numerous initiatives have been undertaken to promote global financial inclusion with varying degrees of success and impact. The factors influencing financial inclusion are complex and multifaceted, shaped by economic conditions, technological advancements, regulatory environments, and cultural attitudes towards financial services (Ozili 2021).
This study focuses on Peru to examine financial inclusion, selected for its notable economic development over recent decades, which is typical of emerging economies. Despite its progress, Peru faces key challenges in extending financial services to its entire population, making it an ideal case study to address these issues (Boitano and Abanto 2020).
A substantial portion of the population is excluded from reaping the advantages of active participation in the financial market (Boitano and Abanto 2020). Likewise, this exclusion exerts a multifaceted impact on affected individuals: they become reliant on informal financial sources, they face disadvantages in effectively managing their daily finances, their capacity to accrue savings or channel investments remains severely constrained, and these economic actors remain trapped within the inescapable vortex of poverty (Boitano and Abanto 2020). Similarly, other factors should be considered in solving the problem: macro-level factors, factors on the side of demand, and factors on the side of supply (Boitano and Abanto 2020). Hence, for a comprehensive examination of the obstacles that Peru must address in its efforts to mitigate financial exclusion, it becomes imperative to gain a profound understanding of the factors that impact financial inclusion and the mechanisms through which they exert their influence (Boitano and Abanto 2020).
Therefore, this study contributes to the literature in the following ways. It seeks to analyze the current state of financial inclusion in Peru by examining the factors influencing access to and the usage of formal financial services among different demographic groups. In that sense, this study assists decision makers in formulating actions or public policies to improve financial accessibility in Peru. Specifically, through a machine learning approach, drawing on data from the National Survey of Demand for Financial Services and Financial Literacy 2019 (NSDFS), the outputs of this research are (1) describing the characteristics of individuals in Peru according to their level of financial inclusion, which is based on the analysis of access and usage of bank accounts, (2) proposing relatively reliable parametric and non-parametric models to predict the access and usage of bank accounts among Peruvian individuals based on sociodemographic factors, and (3) identifying the predictive capability, influence level and direction of the association of each sociodemographic attribute considered over the performance of the best proposed algorithms in the study.
The rest of the paper is organized as follows. Section 2 presents the theoretical background and literature review. Section 3 presents the data used and proposed methodology in the study. Section 4 describes the results of developing and optimizing machine learning models to predict financial inclusion. Section 5 provides a detailed and contextual analysis of the findings obtained in the study. Section 6 presents the conclusion.
2. Theoretical Background and Literature Review
2.1. Theoretical Implications of Financial Inclusion
Financial inclusion has gained significant attention among researchers, policymakers, and financial sector stakeholders (Allen et al. 2016). It is generally defined as using formal financial services such as bank accounts by individuals and businesses (Pesqué-Cela et al. 2021). Financial inclusion aims to ensure that all members of an economy have easy access to and can effectively use the formal financial system (Allen et al. 2016). However, the definition of financial inclusion can vary depending on the context and region. Different meanings may emphasize other aspects such as access, usage, affordability, and the specific needs of vulnerable groups (Folwarski 2021; Pesqué-Cela et al. 2021; Wokabi and Fatoki 2019). Despite these variations, the overarching goal of financial inclusion remains the same: to ensure that individuals and businesses have equal access to and can effectively use formal financial services (Muchandigona and Kalema 2023).
Several factors are associated with financial inclusion. Allen et al. (2016) found that greater financial inclusion is linked to lower account costs, proximity to financial intermediaries, more substantial legal rights, and politically stable environments. In addition, the effectiveness of policies to promote financial inclusion varies depending on the characteristics of the individuals considered, such as income level, gender, and location.
Financial inclusion has numerous benefits. Due to the availability and usage of bank accounts, savings have been increased, women have been empowered, and consumption and productive investments for entrepreneurs have been promoted. It also facilitates liquidity management and payments, thus reducing the need for costly alternative financial services (Allen et al. 2016). Furthermore, financial inclusion has positively affected economic growth, poverty reduction, and income inequality (Ouechtati 2020).
Efforts to promote financial inclusion have been made at the national and international levels. For example, G20 leaders are committed to promoting financial inclusion worldwide (Allen et al. 2016). Various policies and initiatives have been implemented to expand access to financial services, such as mobile banking and financial technology (FinTech) (Muchandigona and Kalema 2023). These innovations have significantly improved financial inclusion, particularly in developing countries (Velazquez et al. 2022).
2.2. Related Works on Determinants of Financial Inclusion
Considering the main determinants of financial inclusion, the variables used in the literature are heterogeneous, depending on the countries analyzed and the different perspectives of researchers. Highlighting some common trends in the determinants and main results, we can summarize the extensive literature on financial inclusion by explaining the variables that correlate to financial topics as the survey shows. These variables are as follows:
- Education: This factor is critical in influencing people’s decision to use or not use financial services (Mzobe 2015). Evidence shows that higher-educated individuals were more likely to own and use financial services (Demirgüç-Kunt et al. 2018). Additionally, different authors, such as Mitton (2008), Kempson et al. (2013), Djankov et al. (2008) and Kuri and Laha (2011), stated that financial inclusion increases with the level of education.
- Employment status: This attribute plays a vital role in determining an individual’s level of financial inclusion. For example, Gasmi and Aurazo (2022) report that workers who move into labor formality are more likely to enter the financial system and have access to formal financial services, such as bank accounts, credit facilities, and insurance. In contrast, those without steady employment might need help accessing these services due to a perceived higher risk of default.
- Income: Individual characteristics and economic circumstances play a significant role in determining the financial inclusion of adult individuals (Yangdol and Sarma 2019). Moreover, a study in Tanzania by Lotto (2018) found that income is a pertinent factor that affects financial inclusion. A higher income typically signifies a more remarkable ability to save, repay debts, and engage in financial transactions.
- Gender: Historically, women have faced systemic barriers that hinder their access to formal financial services and economic opportunities. It is stated that in India, lower employment status and education among females are the main reasons for the gender gap in financial inclusion (Ghosh and Chaudhury 2019). In addition, that pattern is the same as that of Botric and Broz (2017), who find that males are more financially included than females, with evidence from countries in Central and Southeastern Europe.
- Geography zone: In addition to personal aspects, recent literature demonstrates how the location can impact financial inclusion. Sun and Tu (2023) expose that when the level of financial inclusion is low, the urban–rural income gap expands. This is also true, as financial institutions tend to prefer operating in urban areas due to the commerciality and profit orientation of these areas (Liu et al. 2021). As a result, rural residents may resort to informal financial methods or remain excluded from the financial system.
- Age: It constitutes a notable determinant impacting financial inclusion. Often, financial service providers neglect the imperative of crafting financial offerings tailored to the requirements of elderly clients. Their emphasis centers on the economically productive demographic, potentially resulting in the marginalization of older individuals regarding their access to financial services (Jha et al. 2022). Additionally, according to Sanderson et al. (2018), financial inclusion increases with age until it reaches a certain age, beyond which it starts to decrease.
- Socioeconomic level: The household level, which encompasses factors such as income, education, occupation, and social status, is a valuable variable for measuring financial inclusion. It is a significant factor, as financial inclusion has a robust positive effect on household income (Zhang and Posso 2019). And there is a considerable influence on the amount of credit and savings/investments on household consumption expenditures (Addury 2018). For that, enhancing financial inclusion is linked to a 27% decrease in the probability of a household experiencing poverty and a 28% reduction in a household’s susceptibility to falling into poverty (Koomson et al. 2020).
- Use of electronic devices: The adoption of electronic devices has become a central determinant in assessing an individual’s extent of financial inclusion. In the present era, characterized by growing digitalization, the availability of smartphones, computers, and internet connectivity significantly shapes an individual’s capacity to engage with established financial frameworks (Lenka and Barik 2018).
2.3. Related Works on Machine Learning Methods as an Alternative to Standard Models
The parametric models, also referred to as standard models, are commonly used for variable prediction because of their interpretability and simplicity (Bonilla et al. 2003). These models begin with a known distribution or classification function, such as logistic regression, and focus on estimating the parameters that best fit the sample observations (Bonilla et al. 2003). In that sense, as highlighted by Hosmer et al. (2013), logistic regression, a traditional parametric model, works especially well when predictor variables and outcomes on the log-odds scale are assumed to have a linear relationship. However, the precision of parametric models mainly depends on accurately defining the underlying data distribution.
In that regard, machine learning (ML) approaches, also called non-parametric models, have become increasingly prominent in various research fields because they often surpass parametric models in predictive tasks (Bonilla et al. 2003). Non-parametric models, such as artificial neural networks, decision tree, random forest, XGBoost, and support vector machine, seek to approximate the classification function using flexible functional forms. Consequently, these models enable the reconstruction of the classification function with minimal constraints across a wide array of scenarios (Bonilla et al. 2003). These techniques yield superior estimates for a wide range of inputs without assuming anything about the data distribution, especially when dealing with high-dimensional feature space data (Kumar and Sowmya 2021). Breiman (2001) highlights the advantages of using decision trees to capture complex, non-linear relationships in the data. Siroky (2009) and Fox et al. (2017) state the merits of the random forest model, which generates an unbiased estimation of data errors, mitigates over-fitting through reduced inter-tree dependence, and ensures stability in predictive performance by averting drastic changes. Likewise, artificial neural networks exhibit commendable predictive performance due to their ability to adapt to changes in the input data, their effective filtering, and their ability to work with incomplete data or produce outputs under the corruption of one or more cells Izotova (2023), Mijwel (2018). Furthermore, support vector machines, as described by Karamizadeh et al. (2014) and Jun (2021), adeptly handle non-linear relationships by utilizing kernel functions that enable a good-out-of-sample generalization ability, global optimization, and a unique solution. Finally, because of their regularization strategies, capacity to handle missing data, and capacity to integrate the strengths of several weak learners, XGBoost models are acknowledged for their efficacy in predicting tasks (Chen and Guestrin 2016).
2.4. Related Works on Machine Learning for Financial Inclusion
Machine learning models are becoming a growing trend in finance due to the confluence of two aspects. First, large datasets are available, requiring scalable technologies for effective processing, storage, and analysis. Second is the developments in cloud computing and cutting-edge statistical modeling methods (Alonso-Robisco and Carbo 2023).
Given the complex computational nature of finance, where several factors impact decision making, applying machine learning in financial inclusion highlights its advantages. Machine learning techniques have become more popular in prediction and recommendation (Sankar and Nayak 2020) compared to conventional approaches. In that sense, applications of ML techniques are increasingly being found in the financial domain, including credit underwriting, asset management, algorithmic trading, and blockchain-based finance. The abundance of readily available data and affordable processing power enables this growth (OECD 2021).
By using large amounts of data, machine learning models may improve performance and prediction through experience learning, minimizing the need for human programming. This shift in paradigm presents opportunities and risks in its implementation within a financial environment. Numerous scholarly works, precised by Alonso-Robisco and Carbo (2023), attest to the technology’s capacity to tackle various challenges related to credit risk management, including fraud prevention, default prediction, anomaly detection, and the configuration of early warning systems. Financial institutions are particularly interested in using ML in loan origination, according to recent studies (Alonso-Robisco and Carbo 2023). Indeed, the ability to incorporate customer behavioral records renders this activity an ideal environment for the robust performance of ML models: a large dimensionality of data and nonlinear correlations between variables characterizing individual behavior (Alonso-Robisco and Carbo 2023). Similarly, research shows that applying machine learning (ML) models—like random forests, gradient boosting, or deep neural networks—improves statistical prediction compared to more conventional models, like logistic regression. These gains can reach up to 20% (Alonso-Robisco and Carbo 2023).
On the other hand, given the range of financial applications that machine learning (ML) might have, several advancements have been achieved in this area over the years. In the field of quantitative finance, Gu et al. (2021) present an estimator that utilizes neural networks to extract latent components and the associated risk exposures. Following this line of reasoning, Chen et al. (2023) present a model based on the Generative Adversarial Network with the aim of producing stochastic discount factors that may be used with traditional asset pricing models. The estimation of recovery rates for defaulted corporate bonds (Guo et al. 2022), cross-sectional bond return prediction (Nazemi et al. 2022), and bond risk premium forecasting (Bianchi et al. 2021) are just a number of asset pricing domains where machine learning-based models have also been observed. Furthermore, as demonstrated by the works of Jagtiani and Lemieux (2019) and Croux et al. (2020), the use of machine learning-based credit evaluation models has expanded into new domains in recent years, including SME loans and mortgages.
In this regard, financial authorities and regulators have recognized that the application of machine learning (ML) has significant promise for financial innovation, and they have included it under their purview for oversight. However, the reviewed research shows several shared methodological and analytical shortcomings. First, there are challenges with discrimination in some research, the interpretability of findings, and the need for transparency and human judgment in automated financial decision making (Alonso-Robisco and Carbo 2023). Furthermore, a persistent constraint pertains to the dependence on limited sample sizes, the particular context and datasets employed, and the possibility of bias in the variables and model selection (Alonso-Robisco and Carbo 2023; Chen et al. 2023; Croux et al. 2020; Gu et al. 2021; Jagtiani and Lemieux 2019; Nazemi et al. 2022). A further drawback of the dynamic nature of machine learning (ML) and its uses in finance is that emerging advancements may eventually affect how relevant and accurate former study findings are (Alonso-Robisco and Carbo 2023; Chen et al. 2023). In addition, a handful of studies indicate that the assessment criteria used have limits and that using alternate metrics might provide different outcomes (Chen et al. 2023). Meanwhile, possible drawbacks in some studies include the assumption that the relationships between state variables and asset returns are linear (Chen et al. 2023) or that the recovery rates of bonds that have defaulted from the same issuer are independent (Nazemi et al. 2022). Finally, some studies (Croux et al. 2020; Jagtiani and Lemieux 2019) have acknowledged the need for more research to examine additional dimensions of risk, potential biases in alternative data, and potential excessive consumer leveraging in fintech lending. These constraints highlight how difficult it is to analyze various factors and their consequences in the field of machine learning in finance.
3. Data and Methods
3.1. Data Source
The data source used in this study is the National Survey of Demand for Financial Services and Financial Literacy (NSDFS) carried out in Peru between July and August 2019 (Super Superintendencia de Banca Seguros y AFP (SBS) 2022). This period serves as an essential benchmark, offering insights into Peru’s financial inclusion landscape immediately preceding the global pandemic. This survey was instrumental in shedding light on the populace’s understanding, attitudes, and practices regarding financial matters. It also provided valuable insights into the degrees of financial inclusion, the financial behaviors, and the economic resilience of the participants, offering a comprehensive picture of the financial landscape in Peru (Super Superintendencia de Banca Seguros y AFP (SBS) 2022). Additionally, the data from 2019 represent the most up-to-date information currently accessible. However, it is not the most recent dataset, as the most recent data pertain to the year 2022, which was not of public access at the moment of performing the study.
The study sample selected consists of 1205 Peruvian citizens over 18 years old from various socioeconomic levels residing in urban and rural areas. The surveys were conducted through face-to-face interviews in 25 Peru regions, covering 50 provinces and 52 localities (Super Superintendencia de Banca Seguros y AFP (SBS) 2022).
3.2. Machine Learning Models
3.2.1. Logistic Regression (LR)
Logistic regression is a statistical model employed for binary or categorical classification tasks. It hinges on the logistic function, or sigmoid function, which transforms the linear combination of independent variables into a probability value between 0 and 1 (Hosmer et al. 2013). The logistic function is given by:
In this equation, represents the probability of the binary event occurring, , denote the independent variables, and are the coefficients to be estimated. The estimation of the model is achieved through Maximum Likelihood Estimation (MLE). This method seeks to identify the parameter values that maximize the likelihood of the binary event (Hastie et al. 2001).
3.2.2. Decision Trees (DTs)
Decision tree models operate through the iterative partitioning of data into smaller subgroups or nodes, striving to maximize the homogeneity of outcomes within each resultant subgroup. These subgroups are constructed recursively through binary splits, accomplished by posing elementary yes-or-no inquiries about each feature (Duda et al. 2012). This process persists until the predefined termination criteria are satisfied. Upon completing all partitioning, in the context of a classification problem, the model delivers predictions based on the class that boasts the majority representation.
3.2.3. Random Forest (RF)
The random forest model is an ensemble of binary decision trees constructed recursively and depends on a set of random variables (Cutler et al. 2012). This approach is applied to a random vector of dimension p, denoted as , representing the input variables or real-valued predictors, along with a variable Y that represents the response or the actual value we want to predict. We assume an unknown joint distribution that describes these variables.
The primary objective is to find a prediction function that can accurately estimate Y. This prediction function is determined through a loss function designed to minimize the expected value of this loss. In other words, we aim to find an function that reduces the difference between predictions and actual values of Y, taking into account the joint distribution of X and Y (Cutler et al. 2012).
3.2.4. Artificial Neural Networks (ANNs)
Neural networks are a subset of machine learning techniques that allow machines to learn and improve from their experiences independently. The perceptron is the most basic artificial neural network type, utilizing photo-cell detectors to process electrical signals corresponding to geometric designs. The computational depiction of a single perceptron is described as:
The combined weighted inputs, augmented by a bias , denote the cumulative effect of the input features, where every input feature is paired and multiplied by its respective weight . Following this, the bias term b is added, adjusting the perceptron’s activation benchmark. This aggregated value is subsequently passed through the activation function f to produce the ultimate output of the perceptron (Anderson 1995).
3.2.5. XGBoost
XGBoost, short for Extreme Gradient Boosting, is a celebrated ensemble learning method recognized for its exceptional predictive prowess. Functioning within the gradient-boosting paradigm, it systematically amalgamates numerous decision tree predictors to amplify the cumulative outcome. At the heart of the XGBoost mathematical structure lies the endeavor to optimize an objective function composed of a loss component and a regularization component:
In this equation, n denotes the count of training instances, and quantifies the disparity between the real value and its estimated counterpart . At the same time, serves as a regularization element to deter the development of overly intricate models, thus curtailing the risk of overfitting (Chen and Guestrin 2016).
3.2.6. Support Vector Machine with Radial Basis Function Kernel (SVC RBF)
Support vector machines (SVMs) present a sophisticated computational methodology predominantly adopted within machine learning for binary classification tasks. Fundamental to the SVM technique is its strategy to determine a hyperplane that efficaciously amplifies the separation margin between two distinct data class clusters (Bishop 2006). Though intrinsically adept for linearly separable datasets, SVMs are versatile enough to manage non-linear datasets by incorporating specialized kernel techniques. The Radial Basis Function (RBF) kernel is particularly eminent. This kernel method evaluates the proximity between data instances in an expanded dimensional space, thereby enabling the extraction of a hyperplane capable of segregating classes that are not linearly distinct (Bishop 2006). The mathematical formulation of the RBF kernel is expressed as:
In this representation, is a pivotal hyperparameter, dictating the degree of influence exerted by discrete data entities over the decision frontier. An escalated value of heightens the boundary’s responsiveness to specific data points, which could usher in overfitting scenarios. In contrast, a subdued engenders a more generalized delineation boundary, potentially veering towards underfitting.
3.3. Study Methodology
The proposed methodology is depicted in Figure 1 as follows:
3.3.1. Data Preprocessing
Steps were taken to refine both the independent and dependent variables in anticipation of computational analysis. The respondent’s holding of many accounts, indicating their incorporation into the Peruvian financial system, was characterized as “access to accounts”. Meanwhile, actions like transfers, bill payments, deposits, purchases, and remittances defined the “account usage” dimension. The variable “education level” combined several categories into a single higher-education category. The “occupation” variable combined groups like “not employed” and “uncompensated worker” into a single class, whereas the “other” category included jobs in the military and other incapacitated circumstances. About the “income” variable, several ranges were combined into a single group that represented higher income levels. Notably, imputation was performed solely by applying the Multiple Correspondence Analysis (MCA) method for the “occupation” and “income” variables.
3.3.2. Study Variables Selection
In this study, the outcome variables, considering Table 1, are access to bank accounts and the usage of these accounts by Peruvian consumers. Both variables were measured as binary outcomes. Hence, access to bank accounts was measured as having a savings account, checking account, time deposit account, or savings in cooperatives (coded as 1), or not possessing any account (coded as 0); alternatively, the usage of bank accounts was measured as carrying out operations involving the inflow of funds into the account (deposits) or outflow of funds (transfers, credit or debit card expenses, and payment of services) either once a week or once a month during the past year (coded as 1) or not conducting any financial operations (coded as 0).
This study’s characteristics include a range of sociodemographic factors. These factors consist of education level (ranging from “No education/Preschool/Elementary Incomplete/Complete/Incomplete Secondary Education” to “Complete Higher Education to Postgraduate studies”), income level (<300, 300–600, 601–1200, 1201–2400, 2401–4800, and >4801), gender of the respondent (male/female), zone (urban/rural), age of the interviewee (18–19, 20–29, 30–39, 40–49, 50–59, 60–69, and 70–79), socioeconomic level (categorized as “SEL E—the lowest”, “SEL D”, “SEL C”, “SEL B”, and “SEL A—the highest”), usage of electronic devices (yes/no) and work (corresponding to the occupation status of the individual ranging from “no occupation” to “other labor not considered”). These predictor variables were selected based on information from the existing literature on the subject (Sotomayor et al. 2018).
3.3.3. Statistical Analysis of Study Variables
A univariate analysis will be conducted to gain insight and understand the data. After exploring the variables individually through univariate analysis, insights into the statistical distribution of the factors and existing patterns (once defined and synthesized) can be obtained (Koslowsky 1979). For this univariate analysis, frequency distribution tables will identify the quantity and percentages of individuals within a sample that fall into specific categories of the studied regressors, considering the results for each dependent variable under examination.
3.3.4. Data Preparation for Machine Learning Analysis
To provide a good generalization and adjustment of the proposed algorithms for the prediction of the dependent variables (i.e., access to bank accounts and, on the other hand, their usage by Peruvian consumers), the original data set, composed of 1205 observations, was divided into two new sub-samples according to the splitting rule of 80–20%, considering the following structure depicted in Table 2.
We are conscious that the size of the sample considered is relatively small. Still, due to cross validation, machine learning can be used to validate the predictive accuracy without problems for small datasets.
Nonetheless, considering that both generated training sets suffer from an imbalance problem in the response variable (since the classes of interest “access to bank accounts” and “usage of bank accounts” only represent 36% and 44% of the total observations, correspondingly), the sampling method chosen to balance the classes of the dependent variables is the SMOTE (Synthetic Minority Oversampling Technique) (Chawla et al. 2002). Under the sampling treatment, the minority classes would be oversampled from 350 to 614 individuals for the access-to-bank-account variable and 423 to 541 interviewees for using bank accounts; the new training sets would be composed of 1228 and 1082 individuals, respectively.
3.3.5. Construction and Comparison of Machine Learning Models
The classification models selected from the existing set of traditional machine learning techniques are logistic regression (LR), artificial neural networks (ANNs), decision trees (DTs), random forest (RF), XGBoost, and Support Vector Machine with Radial Basis Function kernel (SVC RBF). For all six models, we pose the research objectives as two-class problems such that each value in the label is binarized.
Training and validation were carried out based on a grid search procedure employing a 10-fold cross-validation technique to assess each model’s performance in several fitting iterations for sets of randomly selected hyperparameters to ascertain the optimal structure and composition for the stated algorithms.
For each evaluated algorithm, the parameters considered and their definitions are listed in Table 3. Nevertheless, in the case of the logistic regression, no hyperparameter was included since it only assumes a link function between the response variable and the covariates, lacking parameters that modify the predictive capacity of the technique and affect its performance.
On the other hand, each model’s performance is measured according to a set of indicators that the confusion matrix can quickly determine, reporting the number of observations correctly or incorrectly classified as shown in Table 4.
The selection of metrics affects how the effectiveness of classification algorithms is assessed and contrasted since different metrics capture distinct features of a classifier based on the qualities of the data (Zhang et al. 2017). In this case, the traditional metrics to be used to compare techniques are accuracy, sensitivity (also called recall or true positive rate—TPR), specificity (or actual negative rate—TNR), false negative rate (FNR), false positive rate (FPR), positive predicted value (PPV), negative predicted value (NPV), F1 score and AUC (area under the curve). The formulas for calculating the performance metrics are as follows, expressed according to the elements of the confusion matrix:
3.3.6. Variable Importance and Direction of Associations
The interpretability of models is a common issue in machine learning, making it difficult to identify the critical factors affecting the model’s results (Sahakyan et al. 2021). Considering this situation, we opted to use a framework known as SHAP (Shapley Additive exPlanations), a holistic process for elucidating predictions. By SHAP, each feature is bequeathed as an essential metric for a specific prediction. Based on cooperative game theory (as defined by Shapley (1953)), this approach aims to improve machine learning systems’ clarity and comprehension. The magnitude of the absolute SHAP value offers insights into the extent to which a solitary feature sways the prediction. As expounded by Sahakyan et al. (2021), SHAP values can elucidate the localized significance of features and their modulation with varying magnitudes.
From a theoretical vantage point, the Shapley methodology endeavors to allocate the contribution of an individual player i to the collective value of a coalition S, where S constitutes a subset of the entire player set N. The value, or the coalition value function, is represented as . Subsequently, the Shapley value—about any subset—of player i in juxtaposition with the complete player set N is articulated as
This Shapley value can be construed as the averaged contribution of player i across all conceivable coalitions S. Ingeniously, these game-theoretic Shapley values can be transmuted into feature attributions of a model. Envision a model’s prediction as a game where features are the players and the resultant is the predicted output. For a given instance with model f and prediction , the coalition encompassing all features possesses a value equivalent to the model’s prediction, i.e.,
Conversely, in scenarios where no features form part of the coalition or the coalition is devoid of features, the value is set to zero:
4. Results
4.1. Descriptive Results of the Background Characteristics
A detailed representation of bank account usage and access depending on various socioeconomic and demographic characteristics can be found in Table 5. Subdivisions within each category provide a more in-depth examination of the dominant patterns.
The table demonstrates that, in terms of educational achievement, 36.6% of individuals with formal education and 63.4% of those with incomplete elementary and secondary education have bank accounts. In the subset of those with either full or partial secondary or technical higher education, 43.7% do not have a bank account, whereas 28.3% do. Those who have completed their technical higher education are notably more likely to possess a bank account (25.6%) than people who have not (14.1%). Similarly, individuals with incomplete university higher education showcase greater bank account ownership (12.9%) than those without (9.3%). This pattern continues upward for individuals from complete university higher education to postgraduate degrees.
When examining income levels, the data show that having/utilizing bank accounts and having a greater income are related. It can be seen that, as the income levels increase, the proportion of individuals who have access and use bank accounts increases as well. In particular, it can be noted that among those in the income category “Less than S/.300”, only 1.8% utilize bank accounts and a significant 12.17% do not have access to the financial system.
Based on gender, there is a little variation seen in the percentage of bank account holders: 42.4% of women and 57.6% of males. Additionally, the percentage of bank accounts owned in urban areas is significantly greater (91.6%) compared to that in rural areas (8.4%). The information also reveals different trends for different age groups: 3.2% of those 18 to 19 have bank accounts, whereas 39.7% of people 20 to 29 have bank accounts. A significant influence is exerted by socioeconomic status; persons classified as “SEL C” own the greatest percentage of bank account ownership (38.1%), while those classified as “SEL E” exhibit the lowest percentage of requests (2.7%).
Finally, the table offers information about how electronic devices are used. Unexpectedly, 63.5% of people who do not use electronics have no bank account, compared to 36.5% of those who use electronics and yet require bank accounts. Furthermore, individuals are grouped in the table according to their employment status. With 47.38%, “self-employed/self-employed” individuals have the highest account usage percentage, while “peasant/farmer or rancher” consumers have the lowest percentage—2.69%.
4.2. Development and Optimization of Machine Learning Models
Table 6 presents the test alternatives for each model’s hyperparameters and the chosen value that optimizes each for the study’s established dependent variables after parameter tuning and cross validation.
To ascertain which method is most appropriate for categorizing Peruvian people’s access to and use of bank accounts, these models with such specifications can be applied to the corresponding test sets.
4.3. Performance Evaluation of Dependent Variables
The following section presents the outcomes of the generalization process for the machine learning models. These models were constructed during the training phase, following the tuning process and the identification of the most suitable hyperparameters. The objective is to classify access to bank accounts and their utilization (as dependent variables) among Peruvian citizens. The results are tabulated in Table 7 and Table 8, respectively.
Taking into account Table 7, the accuracy levels among the set of models considered to identify the individuals who utilize bank accounts on the test data were found to be between 75% and 81%, with the RF and SVC RBF models having the highest overall accuracies. The RF and SVC RBF models had the highest specificity, meaning they were more accurate in identifying cases of non-usage bank accounts among individuals. Still, they had lower sensitivity than other models (i.e., ANN and XGBoost models), meaning that they performed less effectively at identifying the usage of bank account cases. However, the models correctly identified 79.82% of the actual usage cases and 82.68% of real non-usage issues, which means that the RF and SVC RBF models are the best models for predicting actual usage (positive) points and quite effective for non-usage (negative) cases, only surpassed by the ANN model for this metric. Similarly, the findings suggest that among all the models developed for this research, the RF and SVC RBF models perform the best in the positive class, exhibiting the closest approximation to the optimal trade-off between precision and recall (F1-score = 80.18% for both cases) in the study.
On the other hand, taking into account Table 8, the accuracy levels among the set of models considered to identify the individuals who have access to bank accounts on the test data were found to be between 63% and 77%, with the ANN having the highest overall accuracy. The ANN model had the highest specificity, meaning they were more accurate in identifying cases of non-access bank accounts among individuals. Still, they had lower sensitivity than other models (i.e., LR, DT, RF, XGBoost, and SVC RBF models), meaning that they performed less effectively at identifying the access of bank account cases. Nonetheless, the model correctly identified 87.23% of the actual access cases and 74.23% of real non-access issues, which means that the ANN model is the best model for predicting real access (positive) cases and capably performs for non-access (negative) cases, surpassed by the other models considered for this metric. Furthermore, the findings indicate that the ANN model ranks fourth in terms of performance within the positive class for the research (F1-Score = 59.42%); it is surpassed by models such as LR, RF, and XGBoost (F1-Score = 66.34%, 64.42%, and 60.29%, respectively), which are the ones approaching the optimal balance between precision and recall in the study.
On the other hand, in order to assess the accuracy of the precision, Figure 2 displays the corresponding receiver operating characteristic (ROC) curves for each model created to categorize access to bank accounts and their use by Peruvian consumers.
According to Figure 2a, for the analysis of access to bank accounts, among the five machine learning models employed in this study, the curve of the LR model shows the highest AUC value, indicating that it is the best at classifying positive and negative cases, among the models.
In the same respect, according to Figure 2b, for the analysis of the usage of bank accounts, among the five machine learning models employed in this study, the curve of the RF and SVC RBF models shows the highest AUC values, indicating they are the best at classifying positive and negative cases, among the models.
4.4. Variable Importance and Direction of Associations
The significance of sociodemographic characteristics in the study must be verified as well in terms of their predictive power and impact on the effectiveness of the suggested algorithms, which were determined to be the best predictors for each response variable using the methodology described in Section 3.3.
Figure 3a,b show the relative importance measures of the predictors for the proposed ML techniques for predicting access to bank accounts and their usage (i.e., ANN and RF/SVC RBF, respectively) as calculated during the k-fold cross-validation process. This effectively measures how important a variable is for each dependent variable across all the cross-validation estimates. The most important variables are at the top of each plot, and the less important ones are at the bottom.
The two figures show similar results, with variables like socioeconomic level, education level, and age being among the top five essential variables for both proposed dependent variables. On the other hand, among the five most predictive variables, two were specific to either access to bank accounts or their usage by Peruvian consumers: variables such as gender and work are for the first dependent variable, and factors like usage of electronic devices and income are for the second dependent variable. In terms of significance, for the ANN model, we observe the predominance of the socioeconomic level as the most important factor for prediction, followed by education level, age, gender, and work; for the RF/SVC RBF models, we highlight the importance of the usage of electronic devices as the top predictor, followed by socioeconomic level, income, age, and education level. It is also interesting to note that zones are not among the most relevant dimensions to explain Peruvian consumers’ access to bank accounts or usage of these in either of the two models, and individual sociodemographic characteristics are more appropriate.
In another perspective, Figure 4a,b highlight the direction of the association between each variable and the probabilities of access to bank accounts and usage of these, correspondingly, by evaluating the importance of our explanatory features for predicting values of the dependent factors. Both figures show the distribution of Shapley values (influence on the value of parameter exerted by the studied explanatory features).
For Figure 4a, among the most critical five predictive variables, higher socioeconomic levels and higher education levels were mainly positively associated with access to bank accounts; nonetheless, factors such as older age, being female, and the latest work categories were mainly negatively associated with access to bank accounts. Regarding Figure 4b, among the most critical five predictive variables, the usage of electronic devices, higher socioeconomic level, higher levels of income, and higher education levels were mainly positively associated with the usage of bank accounts; however, factors such as older age were mainly negatively related to the use of bank accounts.
5. Discussion
Utilizing a national dataset comprising 1205 individuals from Peru that measures the demand for financial services and financial culture, this research was able to assess Peruvian consumers’ financial inclusion condition (based on bank account access and usage as study variables) accurately.
Employing the sample’s sociodemographic features, the artificial neural network (ANN) model outperformed other algorithms in predicting bank account usage, achieving a 77% accuracy on the test sample. Similarly, the random forest (RF) and Support Vector Classifier with Radial Basis Function (SVC RBF) models excelled in predicting bank account access, boasting an 81% accuracy rate in both cases. Moreover, our approach allowed us to discern the top five influential predictors for each of the best-performing classifiers regarding the financial inclusion’s study variables. We gauged variable importance and scrutinized the direction of these associations: socioeconomic level, education, and age emerged among the top five variables influencing both study variables. Moreover, income and electronic devices were important factors in bank account usage, whereas gender and employment status were significant variables of bank account access.
5.1. Predictive Performance of Machine Learning Models
An increasing number of developing countries have embarked on initiatives to provide marginalized communities with greater access to financial services (Asuming et al. 2019). Machine learning techniques offer the appropriate capability and adaptability in such scenarios to identify complex patterns in high-dimensional datasets. In that sense, our results demonstrate that models like the random forest, artificial neural networks, and SVC RBF outperform other conventional methods.
Considering the first-mentioned model, the results align with the existing literature. The merits of this model stem from its ability to generate an unbiased estimation of data errors by constructing various samples and mitigating overfitting through reduced inter-tree dependence (Siroky 2009). It adeptly captures non-linear effects and interaction terms adaptively across diverse variable types, ensuring stability in predictive performance by averting drastic changes in the forest structure if an individual tree undergoes alteration (Fox et al. 2017).
Similarly, artificial neural networks exhibit commendable predictive performance, capitalizing on their inherent advantages as delineated in the current state of the art: their continuous self-learning and the possibility to improve the results, their ability to adapt to changes in the input data, and their effective noise filtering in the data, describing their ability to extract from a huge heterogeneous stream of data only necessary information (Izotova 2023). The disappearance of a few pieces of information in one place does not prevent the network from functioning, and the corruption of one or more cells of ANN does not prevent it from generating output, as it has the ability to work with incomplete data (Mijwel 2018).
Moreover, considering the support vector machine model, the advantages of the model consist of their flexibility in the choice of the form of the threshold, which does not have to be necessarily linear or even possess the same functional form for all data since the kernel implicitly contains a non-linear transformation and no assumptions about the active state of the change are necessary; SVMs provide a good out-of-sample generalization if the parameters are appropriately chosen; and SVMs deliver a unique solution since the optimality problem is convex and selecting a suitable kernel would end up stressing on the similarity between similar observations (Karamizadeh et al. 2014). Furthermore, the algorithm has the advantages of complete theory, global optimization, strong adaptability, and good generalization ability because it is based on Statistical Learning Theory (Jun 2021).
5.2. Sociodemographic Factors and Financial Inclusion
On the other hand, the ML analyses produced information consistent with the literature regarding the association of specific sociodemographic characteristics and financial inclusion in the study sample.
Considering the socioeconomic level factor, an analysis of factors affecting the ownership of financial products in Colombia established that a high socioeconomic stratum increases the probability of being aware of and possessing financial products in the country (Fernández de Lis et al. 2014). Likewise, Sarmiento (2018) states that households with high socioeconomic levels are more likely to use formal products, progressing from the use of informal products by the lower stratum, to the use of a combination of traditional and casual products by households with a middle socioeconomic level, and to the use of fully legal products by high socioeconomic groups (Zhang and Posso 2019).
Similarly, an examination of the Peruvian financial situation revealed that individuals’ higher educational attainment significantly influences their likelihood of accessing credit within the national financial system (Sotomayor et al. 2018). This observation underscores the notion that lower education levels might be a hindrance, given their constraints in accessing and comprehending financial information Sotomayor et al. (2018), Demirgüç-Kunt et al. (2018). From another perspective, bank account usage is driven by factors such as education level and income (Lotto 2018). Fungáčová and Weill (2015) identified that higher income and better education are associated with greater use of formal accounts and formal credit in China. Additionally, income and education were identified as the main factors influencing banking usage in the Mexican population, where a higher education level and higher income were associated with more banking usage (Peña et al. 2014).
Regarding individuals’ age as an influential factor, Collins and Urban (2021) highlight that, to the extent that younger individuals have a positive first experience with the formal banking sectors, these consumers of financial services may have more vital trust in financial institutions. This enhanced trust in financial services providers at a young age may create a pattern of behavior maintained with the expanded use of formal financial products, providing improved access and use. In the same perspective, Johnson et al. (2016) states that youth who are of majority age may be more self-sufficient, require funds for daily needs, and therefore need greater flexibility and frequency to deposit and withdraw funds. Younger youth are less likely to start and more likely to increase their average monthly net savings steadily. In addition, as youth get older, their expenses rise, as do expectations for them to make money and pay for their costs, whether for education or daily needs (Jha et al. 2022).
When examining gender as a predictor for bank account access, women form a disproportionately large share of the world’s unbanked population Rao (2018), Ghosh and Chaudhury (2019). Gender inequalities in employment and earnings mean that women have lower incomes, making them less able to open accounts in formal financial institutions (Rao 2018). Due to legal and cultural restrictions on their access to property, women often do not have the collateral necessary to seek out loans from the formal financial sector. These factors, combined with discrimination against them in financial markets, mean that women are far less likely than men to have checking or savings accounts in their names (Rao 2018).
Regarding the influence of the usage of electronic devices on financial inclusion, banking through electronic channels has gained increasing popularity in recent years (Islam et al. 2018; Lenka and Barik 2018). This system provides alternatives for the faster delivery of banking services to a wide range of customers (Islam et al. 2018). The usage of electronic devices in the banking sector has a positive significant impact on improving service quality, client commitment, and bank profitability that will eventually strengthen and enhance relationships between banks and their clients (Islam et al. 2018). That is why people’s dependency on banking is increasing quickly. It helps to improve the service quality of banking offerings. It is a more advanced, secure, and popular way of banking (Islam et al. 2018).
Lastly, considering the work (occupation) factor, the employment status of individuals would have a similar impact to that of income, as it affects its generation (Gasmi and Aurazo 2022). In the case of formal jobs, the holding of accounts would be favored as long as the employers decide to pay the remunerations through the financial system. Likewise, the sudden loss of employment and other adverse situations that economically affect individuals (accidents or natural catastrophes), in the absence of insurance, would cause a demand for credits to cover the contingencies (Sotomayor et al. 2018).
5.3. Study Implications for Future Policy Formulation
The research findings have important ramifications for developing future financial inclusion initiatives in Peru. A more detailed knowledge of the challenges and facilitators surrounding Peruvian financial inclusion has been rendered feasible by the found influential characteristics, which include income, age, gender, employment status, socioeconomic level, education, and electronic device usage.
Our study emphasizes how important income and education are in determining one’s financial patterns. Promoting financial literacy initiatives and skill development is a key component of the recommended strategy, particularly for individuals with lower educational attainment. Furthermore, it is critical to promote fair economic possibilities by understanding how income affects financial inclusion. The disproportionate number of women who lack bank accounts is indicative of gender-based disadvantages, which demand policies that prioritize women’s economic empowerment, the outlawing of discriminatory practices, and the provision of inclusive financial services that are suited to their requirements. The significance of using electronic devices as a determinant highlights how technology may revolutionize financial inclusion and suggests that policy should include accessibility, affordability, and bridging the digital divide. Understanding how occupational characteristics affect financial inclusion points to the need for specific policies, such as promoting official wage distributions through employers and putting social safety nets in place to lessen the effects of unexpected job loss.
Notwithstanding the limitations noted in our research, tackling policy formation necessitates a comprehensive approach. Policies that take into consideration various settings and possible variances in the broader population are necessary due to issues with generalizability, selection biases, and dependence on self-reported data.
6. Conclusions
Our study conducted several experiments based on machine learning models for assessing bank account accessibility and utilization among Peruvian consumers. Furthermore, it found significant indicators for both dependent variables according to the sociodemographic characteristics of the employed research sample. The principal outcome derived from the prediction of account access highlights the neural network as the most effective predictive model, with relevant key factors such as socioeconomic level, educational attainment, and age. Conversely, within the account usage prediction, optimal predictors consist of the random forest and support vector machines employing the RBF kernel. In both models, the identified pivotal variables encompass the utilization of electronic devices, socioeconomic status, and income.
Our research emphasizes important facets of financial inclusion in Peru and provides recommendations for aid in situations with limited resources. Our algorithms worked properly even with limited variables, which decreased the requirement for in-depth interviews. This approach might be used through additional modalities to identify marginalized individuals concerning financial access, or it could be operationalized by financial experts and community activists for financial inclusion. Through computational analysis, the growing amount of individual-level data on sociodemographics and financial inclusivity may greatly improve the availability and utilization of bank accounts and other financial services within Peru’s financial system.
This study uses survey data and machine learning to predict bank account accessibility and utilization among Peruvian customers; nevertheless, the sample’s specificity limits the generalizability of the findings. To address this issue, the study recommends enlarging the sample to encompass a wider range of demographics, geographic locations, and socioeconomic backgrounds, thereby capturing a broader spectrum of behaviors and enhancing the overall generalizability of the findings.
From an alternative viewpoint, further prospective studies will be required to examine more thoroughly the effectiveness and implications of the implemented parametric and non-parametric algorithms, with an emphasis on improving their performance. This entails experimenting with different machine learning configurations and techniques, such as adjusting the dimensionality and complexity of the model, tailoring the model to the problem’s structure, redefining or adding new predictors, and looking into potentially exploitable latent interactions in the existing models. Additionally, given the acknowledgment of the importance of increased interpretability and comprehensibility that are intrinsic to particular machine learning techniques that are applied, an imperative yet relatively underexplored avenue pertains to enhancing interpretability mechanisms in result generation.
The results may stimulate machine learning in Peru’s financial system and attract the interest of regulators and specialists in finance who are working to increase Peruvian customers’ access to banking services. Traditional models are enhanced by machine learning, which also offers potential for expansion in other domains.
Author Contributions
Contributions: Conceptualization, R.M., L.B. and A.T.; methodology, R.M., L.B., A.T. and A.A.-F.; software, A.A.-F., R.M. and L.B.; validation, L.B., M.M., A.A.-F. and R.M.; formal analysis, R.M., L.B. and A.T.; data selection and processing, A.A.-F., R.M. and L.B.; writing—original draft preparation, R.M., L.B., A.T., A.A.-F. and M.M.; writing—review and editing, L.B., R.M., A.T. and M.M.; visualization, A.A.-F.; supervision, R.M., L.B. and A.T. All authors have read and agreed to the published version of the manuscript.
Funding
This research was funded by a 2020 annual internal grant with funding project number 3010100520 promoted by the vice-presidency for research at Universidad del Pacífico (Lima, Perú).
Data Availability Statement
The datasets used and analyzed during the current study are available from the corresponding author upon reasonable request.
Conflicts of Interest
The authors declare no conflicts of interest.
References
- Addury, Multazam Mansyur. 2018. Impact of financial inclusion for welfare: Analyze to household level. Journal of Finance and Islamic Banking 1: 90–104. [Google Scholar] [CrossRef]
- Allen, Franklin, Asli Demirguc-Kunt, Leora Klapper, and Maria Soledad Martinez Peria. 2016. The foundations of financial inclusion: Understanding ownership and use of formal accounts. Journal of Financial Intermediation 27: 1–30. [Google Scholar] [CrossRef]
- Alonso-Robisco, Andres, and Jose Carbo. 2023. Aprendizaje automático en modelos de concesión de crédito: Oportunidades y riesgos, Chapter III. Madrid: Funcas, pp. 79–104. Available online: https://www.funcas.es/wp-content/uploads/2023/05/Analisis-financiero-y-big-data_Capitulo-III.pdf (accessed on 20 August 2023).
- Anderson, James A. 1995. An Introduction to Neural Networks. Cambridge, MA: The MIT Press. [Google Scholar]
- Asuming, Patrick Opoku, Lotus Gyamfuah Osei-Agyei, and Jabir Ibrahim Mohammed. 2019. Financial inclusion in sub-saharan africa: Recent trends and determinants. Journal of African Business 20: 112–34. [Google Scholar] [CrossRef]
- Bianchi, Daniele, Matthias Büchner, and Andrea Tamoni. 2021. Bond risk premiums with machine learning. The Review of Financial Studies 34: 1046–89. [Google Scholar] [CrossRef]
- Bishop, Christopher M. 2006. Pattern Recognition and Machine Learning. New York: Springer. [Google Scholar]
- Boitano, Guillermo, and Deyvi Franco Abanto. 2020. Challenges of financial inclusion policies in peru. Revista Finanzas y Política Económica 12: 89–117. [Google Scholar] [CrossRef]
- Bonilla, María, Ignacio Olmeda, and Rosa Puertas. 2003. Modelos paramétricos y no paramétricos en problemas de credit scoring. Revista Española de Financiación y Contabilidad 32: 833–69. [Google Scholar] [CrossRef]
- Botric, Valerija, and Tanja Broz. 2017. Gender differences in financial inclusion: Central and south eastern europe. South-Eastern Europe Journal of Economics 15: 209–27. Available online: http://www.asecu.gr/Seeje/issue29/issue29-botric-broz.pdf (accessed on 29 July 2023).
- Breiman, Leo. 2001. Random forests. Machine Learning 45: 5–32. [Google Scholar] [CrossRef]
- Chawla, Nitesh V., Kevin W. Bowyer, Lawrence O. Hall, and Philip Kegelmeyer. 2002. Smote: Synthetic minority over-sampling technique. Journal of Artificial Intelligence Research 16: 321–57. [Google Scholar] [CrossRef]
- Chen, Luyang, Markus Pelger, and Jason Zhu. 2023. Deep learning in asset pricing. Management Science 1904: 00745v6. [Google Scholar] [CrossRef]
- Chen, Tianqi, and Carlos Guestrin. 2016. Xgboost: A scalable tree boosting system. Paper presented at the 22nd ACM SIGKDD International Conference on Knowledge Discovery and Data Mining, KDD ’16, San Francisco, CA, USA, August 13–17; New York: Association for Computing Machinery, pp. 785–94. [Google Scholar] [CrossRef]
- Collins, J. Michael, and Carly Urban. 2021. Minor Bank Account Laws, Account Ownership, and Downstream Outcomes. Technical Report. Stanford: Global Financial Literacy Excellence Center (GFLEC). [Google Scholar]
- Croux, Christophe, Julapa Jagtiani, Tarunsai Korivi, and Milos Vulanovic. 2020. Important factors determining fintech loan default: Evidence from a lending club consumer platform. Journal of Economic Behavior & Organization 173: 270–96. [Google Scholar] [CrossRef]
- Cutler, Adele, Richard Cutler, and John R. Stevens. 2012. Random Forests, Chapter 5. New York: Springer, pp. 157–75. [Google Scholar] [CrossRef]
- Demirgüç-Kunt, Asli, Leora Klapper, and Dorothe Singer. 2017. Financial Inclusion and Inclusive Growth: A Review of Recent Empirical Evidence. Policy Research Working Paper No. 8040. Washington, DC: World Bank. [Google Scholar]
- Demirgüç-Kunt, Asli, Leora Klapper, Dorothe Singer, Saniya Ansar, and Jake Hess. 2018. La base de datos global findex 2017: Medición de la inclusión financiera y la revolución de la tecnología financiera. Technical Report. Washington, DC: World Bank. [Google Scholar]
- Djankov, Simeon, Pedro Miranda, Enrique Seira, and Siddharth Sharma. 2008. Who Are the Unbanked? Policy Research Working Paper No. 4647. Washington, DC: The World Bank. Available online: http://hdl.handle.net/10986/6666 (accessed on 29 July 2023).
- Duda, Richard O., Peter E. Hart, and David G. Stork. 2012. Pattern Classification, 2nd ed. Hoboken: John Wiley & Sons. [Google Scholar]
- Fernández de Lis, Santiago, María Llanes, Carlos López-Moctezuma, Juan Rojas, and David Tuesta. 2014. Financial Inclusion and the Role of Mobile Banking in Colombia: Developments and Potential. BBVA Research N° 14/04 Working Paper. Madrid: BBVA Research. Available online: https://www.findevgateway.org/sites/default/files/publications/files/financial_inclusion_and_the_role_of_mobile_banking_in_colombia_developments_and_potential.pdf (accessed on 25 August 2023).
- Folwarski, Mateusz. 2021. The fintech sector and aspects on the financial inclusion of the society in eu countries. European Research Studies Journal XXIV: 459–67. [Google Scholar] [CrossRef]
- Fox, Eric W., Ryan A. Hill, Scott G. Leibowitz, Anthony R. Olsen, Darren J. Thornbrugh, and Marc H. Weber. 2017. Assessing the accuracy and stability of variable selection methods for random forest modeling in ecology. Environmental Monitoring and Assessment 189: 316. [Google Scholar] [CrossRef] [PubMed]
- Fungáčová, Zuzana, and Laurent Weill. 2015. Understanding financial inclusion in china. China Economic Review 34: 196–206. [Google Scholar] [CrossRef]
- Garg, Sonu, and Parul Agarwal. 2014. Financial inclusion in india–a review of initiatives and achievements. IOSR journal of business and Management 16: 52–61. [Google Scholar] [CrossRef]
- Gasmi, Farid, and Jose Aurazo. 2022. Labor Informality and Financial Inclusion Transitions: Evidence from Peru. TSE Working Papers 22-1349. Toulouse: Toulouse School of Economics (TSE). [Google Scholar]
- Ghosh, Chandralekha, and Rimita Hom Chaudhury. 2019. Gender gap in case of financial inclusion: An empirical analysis in indian context. Economics Bulletin 39: 2615–30. Available online: http://www.accessecon.com/Pubs/EB/2019/Volume39/EB-19-V39-I4-P244.pdf (accessed on 29 July 2023).
- Guo, Xu, Hai Lin, Chunchi Wu, and Guofu Zhou. 2022. Predictive information in corporate bond yields. Journal of Financial Markets 59: 100687. [Google Scholar] [CrossRef]
- Gu, Shihao, Bryan Kelly, and Dacheng Xiu. 2021. Autoencoder asset pricing models. Journal of Econometrics 222: 429–50. [Google Scholar] [CrossRef]
- Hastie, Trevor, Robert Tibshirani, and Jerome Friedman. 2001. The Elements of Statistical Learning. New York: Springer. Available online: https://hastie.su.domains/Papers/ESLII.pdf (accessed on 15 July 2022).
- Hosmer, David W., Jr., Stanley Lemeshow, and Rodney X. Sturdivant. 2013. Applied Logistic Regression. Hoboken: John Wiley & Sons, vol. 398. [Google Scholar]
- Islam, Saiful, Nazrul Islam, and Mohammad Saifuddin. 2018. Usage of e-devices in banking sector for promoting relationships between bankers and customers: A case study. Paper presented at 8th SIMS International Conference on Innovation, Entrepreneurship and Economy for Sustainable Development, Chennai, India, October 10–11; Sirukalathur: Sri Sairam Institute of Management Studies (SIMS). [Google Scholar]
- Izotova, A. 2023. Artificial Neural Networks: Advantages, Challenges, Applications. Available online: https://libeldoc.bsuir.by/bitstream/123456789/51568/1/Izotova_Artificial.pdf (accessed on 15 September 2023).
- Jagtiani, Julapa, and Catharine Lemieux. 2019. The roles of alternative data and machine learning in fintech lending: Evidence from the lendingclub consumer platform. Financial Management 48: 1009–29. [Google Scholar] [CrossRef]
- Jha, Babita, Lokesh Vijayvargy, and Srikant Gupta. 2022. The impact of socio-economic and psychographic factors on financial inclusion. International Journal of Applied Behavioral Economics (IJABE) 11: 1–17. [Google Scholar] [CrossRef]
- Johnson, Lissa, YungSoo Lee, David Ansong, Margaret Sherraden, Gina Chowa, Fred Ssewamala, Li Zou, Michael Sherraden, Moses Njenga, Joseph Kieyah, and et al. 2016. Youth Savings Patterns and Performance in Colombia, Ghana, Kenya, and Nepal. CSD Fact Sheet No. 16-10. St. Louis: Center for Social Development, Washington University. Available online: https://csd.wustl.edu/16-10/ (accessed on 29 July 2023).
- Jun, Zhao. 2021. The development and application of support vector machine. Journal of Physics: Conference Series 1748: 052006. [Google Scholar] [CrossRef]
- Karamizadeh, Sasan, Shahidan M. Abdullah, Mehran Halimi, Jafar Shayan, and Mohammad Javad Rajabi. 2014. Advantage and drawback of support vector machine functionality. Paper presented at 2014 International Conference on Computer, Communications, and Control Technology (I4CT), Langkawi, Malaysia, September 2–4; Piscataway: IEEE, pp. 63–65. [Google Scholar] [CrossRef]
- Kempson, Elaine, Valeria Perotti, and Kinnon Scott. 2013. Measuring Financial Capability: A New Instrument and Results from Low-and Middle-Income Countries. Technical Report. Washington, DC: The World Bank. Available online: http://hdl.handle.net/10986/16296 (accessed on 29 July 2023).
- Koomson, Isaac, Renato A. Villano, and David Hadley. 2020. Effect of financial inclusion on poverty and vulnerability to poverty: Evidence using a multidimensional measure of financial inclusion. Social Indicators Research 149: 613–39. [Google Scholar] [CrossRef]
- Koslowsky, Meni. 1979. Univariate and multivariate analysis of categorial variables. Educational and Psychological Measurement 39: 747–59. [Google Scholar] [CrossRef]
- Kumar, V. Praveen, and I. Sowmya. 2021. A review on pros and cons of machine learning algorithms. Journal of Engineering Sciences 12: 272–76. [Google Scholar]
- Kuri, Pravat Kumar, and Arindam Laha. 2011. Financial inclusion and human development in india: An inter-state analysis. Indian Journal of Human Development 5: 61–77. [Google Scholar] [CrossRef]
- Lenka, Sanjaya Kumar, and Rajesh Barik. 2018. Has expansion of mobile phone and internet use spurred financial inclusion in the saarc countries? Financial Innovation 4: 1–19. [Google Scholar] [CrossRef]
- Liu, Guang, Yunying Huang, and Zhehao Huang. 2021. Determinants and mechanisms of digital financial inclusion development: Based on urban-rural differences. Agronomy 11: 1833. [Google Scholar] [CrossRef]
- Lotto, Josephat. 2018. Examination of the status of financial inclusion and its determinants in tanzania. Sustainability 10: 2873. [Google Scholar] [CrossRef]
- Mijwel, Maad. 2018. Artificial neural networks advantages and disadvantages. Mesopotamian Journal of Big Data 2021: 29–31. [Google Scholar] [CrossRef]
- Mitton, Lavinia. 2008. Financial Inclusion in the UK: Review of Policy and Practice. London: Joseph Rowntree Foundation. [Google Scholar]
- Moretto, Louise Marie, and Barbara Bernadette Maria Scola Gahwiler. 2017. Development Finance Institutions and Financial Inclusion: From Institution-Building to Market Development. CGAP Focus Note no. 105. Washington, DC: World Bank Group. [Google Scholar]
- Muchandigona, Ana Kundai, and Billy Mathias Kalema. 2023. The catalytic role of mobile banking to improve financial inclusion in developing countries. International Journal of E-Services and Mobile Applications (IJESMA) 15: 1–21. [Google Scholar] [CrossRef]
- Mzobe, Nomfundo. 2015. The Role of Education and Financial Inclusion in Africa: The Case of Selected African Countries. Ph.D. thesis, Stellenbosch University, Stellenbosch, South Africa. Available online: http://hdl.handle.net/10019.1/99394 (accessed on 29 July 2023).
- Nazemi, Abdolreza, Friedrich Baumann, and Frank J. Fabozzi. 2022. Intertemporal defaulted bond recoveries prediction via machine learning. European Journal of Operational Research 297: 1162–77. [Google Scholar] [CrossRef]
- OECD. 2021. Artificial Intelligence, Machine Learning and Big Data in Finance: Opportunities, Challenges, and Implications for Policy Makers. Technical Report. Available online: https://www.oecd.org/finance/financial-markets/Artificial-intelligence-machine-learning-big-data-in-finance.pdf (accessed on 20 August 2023).
- Ouechtati, Ichraf. 2020. The contribution of financial inclusion in reducing poverty and income inequality in developing countries. Asian Economic and Financial Review 10: 1051. [Google Scholar] [CrossRef]
- Ozili, Peterson K. 2021. Financial inclusion research around the world: A review. Forum for Social Economics 50: 457–79. [Google Scholar] [CrossRef]
- Peña, Ximena, Carmen Hoyo, and David Tuesta. 2014. Determinants of Financial Inclusion in Mexico Based on the 2012 National Financial Inclusion Survey (Enif). Working Paper 14/15. Madrid: BBVA Research. [Google Scholar]
- Pesqué-Cela, Vanesa, Lihui Tian, Deming Luo, Damian Tobin, and Gerhard Kling. 2021. Defining and measuring financial inclusion: A systematic review and confirmatory factor analysis. Journal of International Development 33: 316–41. [Google Scholar] [CrossRef]
- Rao, Smriti. 2018. Gender and Financial Inclusion through the Post. Technical Report. Bern: Universal Postal Union. New York: United Nations Women. [Google Scholar]
- Sahakyan, Maria, Zeyar Aung, and Talal Rahwan. 2021. Explainable artificial intelligence for tabular data: A survey. IEEE Access 9: 135392–422. [Google Scholar] [CrossRef]
- Sanderson, Abel, Learnmore Mutandwa, and Pierre Le Roux. 2018. A review of determinants of financial inclusion. International Journal of Economics and Financial Issues 8: 1–8. Available online: https://www.econjournals.com/index.php/ijefi/article/view/5458 (accessed on 29 July 2023).
- Sankar, Girija, and Bhagirathi Nayak. 2020. Financial inclusion: An application of machine learning in collaborative filtering recommender systems. International Journal of Recent Technology and Engineering (IJRTE) 8: 4243–47. [Google Scholar] [CrossRef]
- Sarmiento, Angélica del Carmen Calle. 2018. Analysis of the ownership of financial products: Evidence to contribute to financial inclusion in bolivia. In Financial Decisions of Households and Financial Inclusion: Evidence for Latin America and the Caribbean, 1st ed. Edited by María José Roa García and Diana Mejía. Mexico City: Centro de Estudios Monetarios Latinoamericanos, CEMLA, Chapter 2. pp. 15–50. [Google Scholar]
- Shapley, Lloyd S. 1953. A Value for n-Person Games, Chapter 17. Princeton: Princeton University Press, pp. 307–18. [Google Scholar]
- Siroky, David S. 2009. Navigating random forests and related advances in algorithmic modeling. Statistics Surveys 3: 147–63. [Google Scholar] [CrossRef]
- Sotomayor, Narda, Jacqueline Talledo, and Sara Wong. 2018. Determinants of Financial Inclusion in Peru: Recent Evidence from the Demand Side. Working Paper. Lima: Superintendencia de Banca, Seguros y Administradoras Privadas de Fondo de Pensiones. [Google Scholar]
- Sun, Shiquan, and Yongqian Tu. 2023. Impact of financial inclusion on the urban-rural income gap—Based on the spatial panel data model. Finance Research Letters 53: 103659. [Google Scholar] [CrossRef]
- Super Superintendencia de Banca Seguros y AFP (SBS). 2022. Encuesta Nacional de Demanda de Servicios Financieros y Nivel de Cultura Financiera 2019. Available online: https://www.sbs.gob.pe/inclusion-financiera/cifras/encuestas (accessed on 18 December 2022).
- Velazquez, Patricia Vilcanqui, Vito Bobek, Romana Korez Vide, and Tatjana Horvat. 2022. Lessons from remarkable fintech companies for the financial inclusion in peru. Journal of Risk and Financial Management 15: 62. [Google Scholar] [CrossRef]
- Wokabi, Victoria Wanjiku, and Olanrewaju Isola Fatoki. 2019. Determinants of financial inclusion in east africa. International Journal of Business & Management 7: 125–43. [Google Scholar] [CrossRef]
- Yangdol, Rigzin, and Mandira Sarma. 2019. Demand-side factors for financial inclusion: A cross-country empirical analysis. International Studies 56: 163–85. [Google Scholar] [CrossRef]
- Zhang, Chongsheng, Changchang Liu, Xiangliang Zhang, and George Almpanidis. 2017. An up-to-date comparison of state-of-the-art classification algorithms. Expert Systems with Applications 82: 128–50. [Google Scholar] [CrossRef]
- Zhang, Quanda, and Alberto Posso. 2019. Thinking inside the box: A closer look at financial inclusion and household income. The Journal of Development Studies 55: 1616–31. [Google Scholar] [CrossRef]
Figure 1.
Proposed methodology diagram for the study of financial inclusion in Peru.

Figure 2.
Receiver operating characteristics (ROC). Access to accounts (a) and use of accounts (b).

Figure 3.
Variable importance plots. Access to accounts (a) and use of accounts (b).

Figure 4.
Distribution of the impact of features on model output. Access to accounts (a) and use of accounts (b). In the figures, the color represents the value of the feature from low (blue) to high (red).
Figure 4.
Distribution of the impact of features on model output. Access to accounts (a) and use of accounts (b). In the figures, the color represents the value of the feature from low (blue) to high (red).


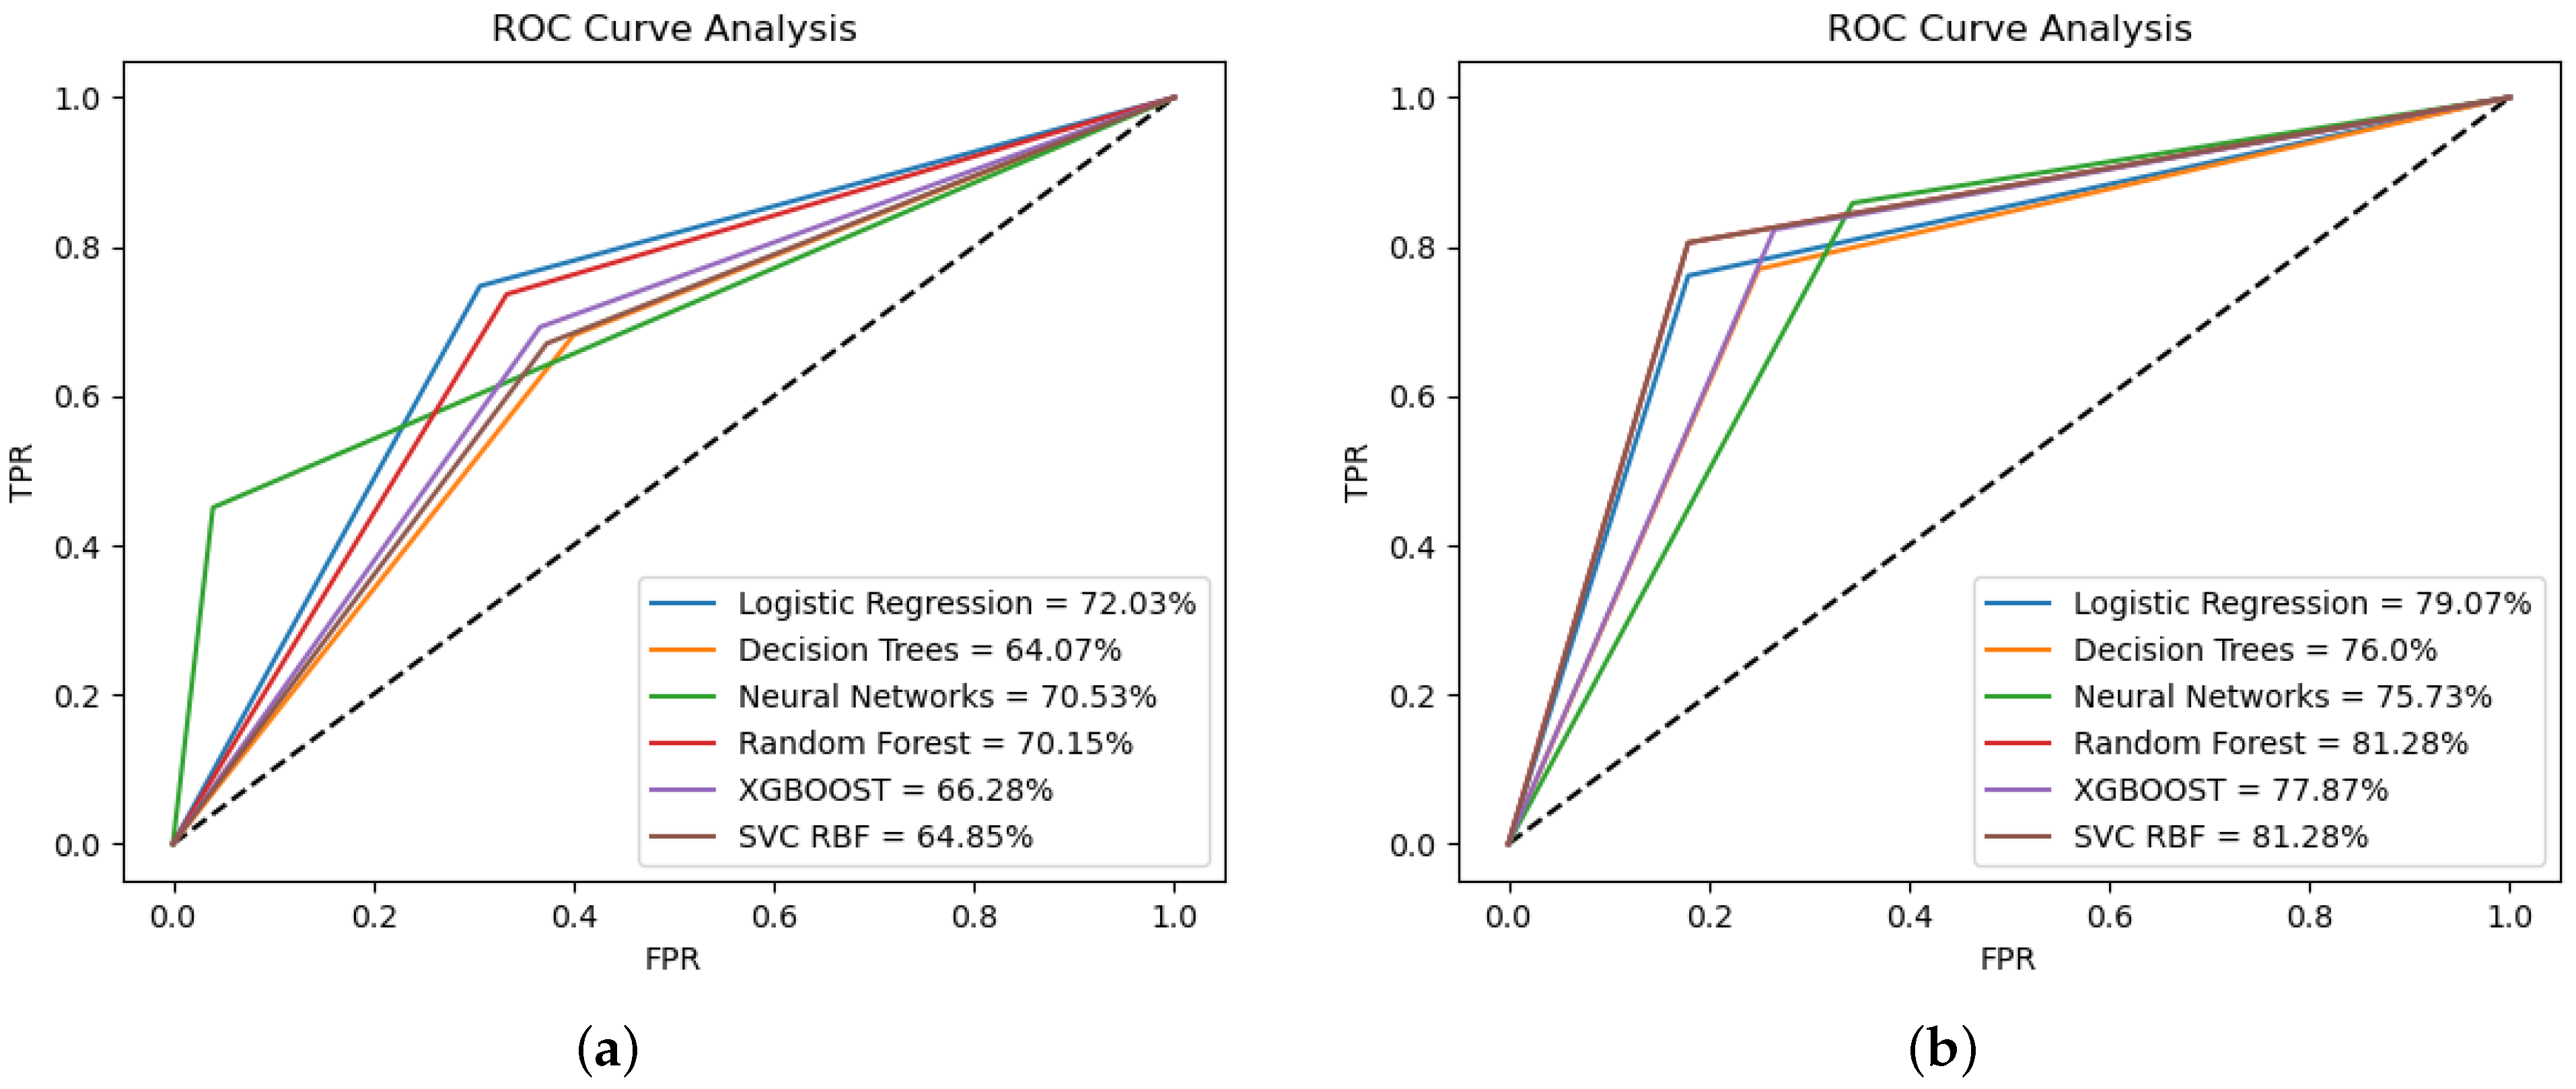
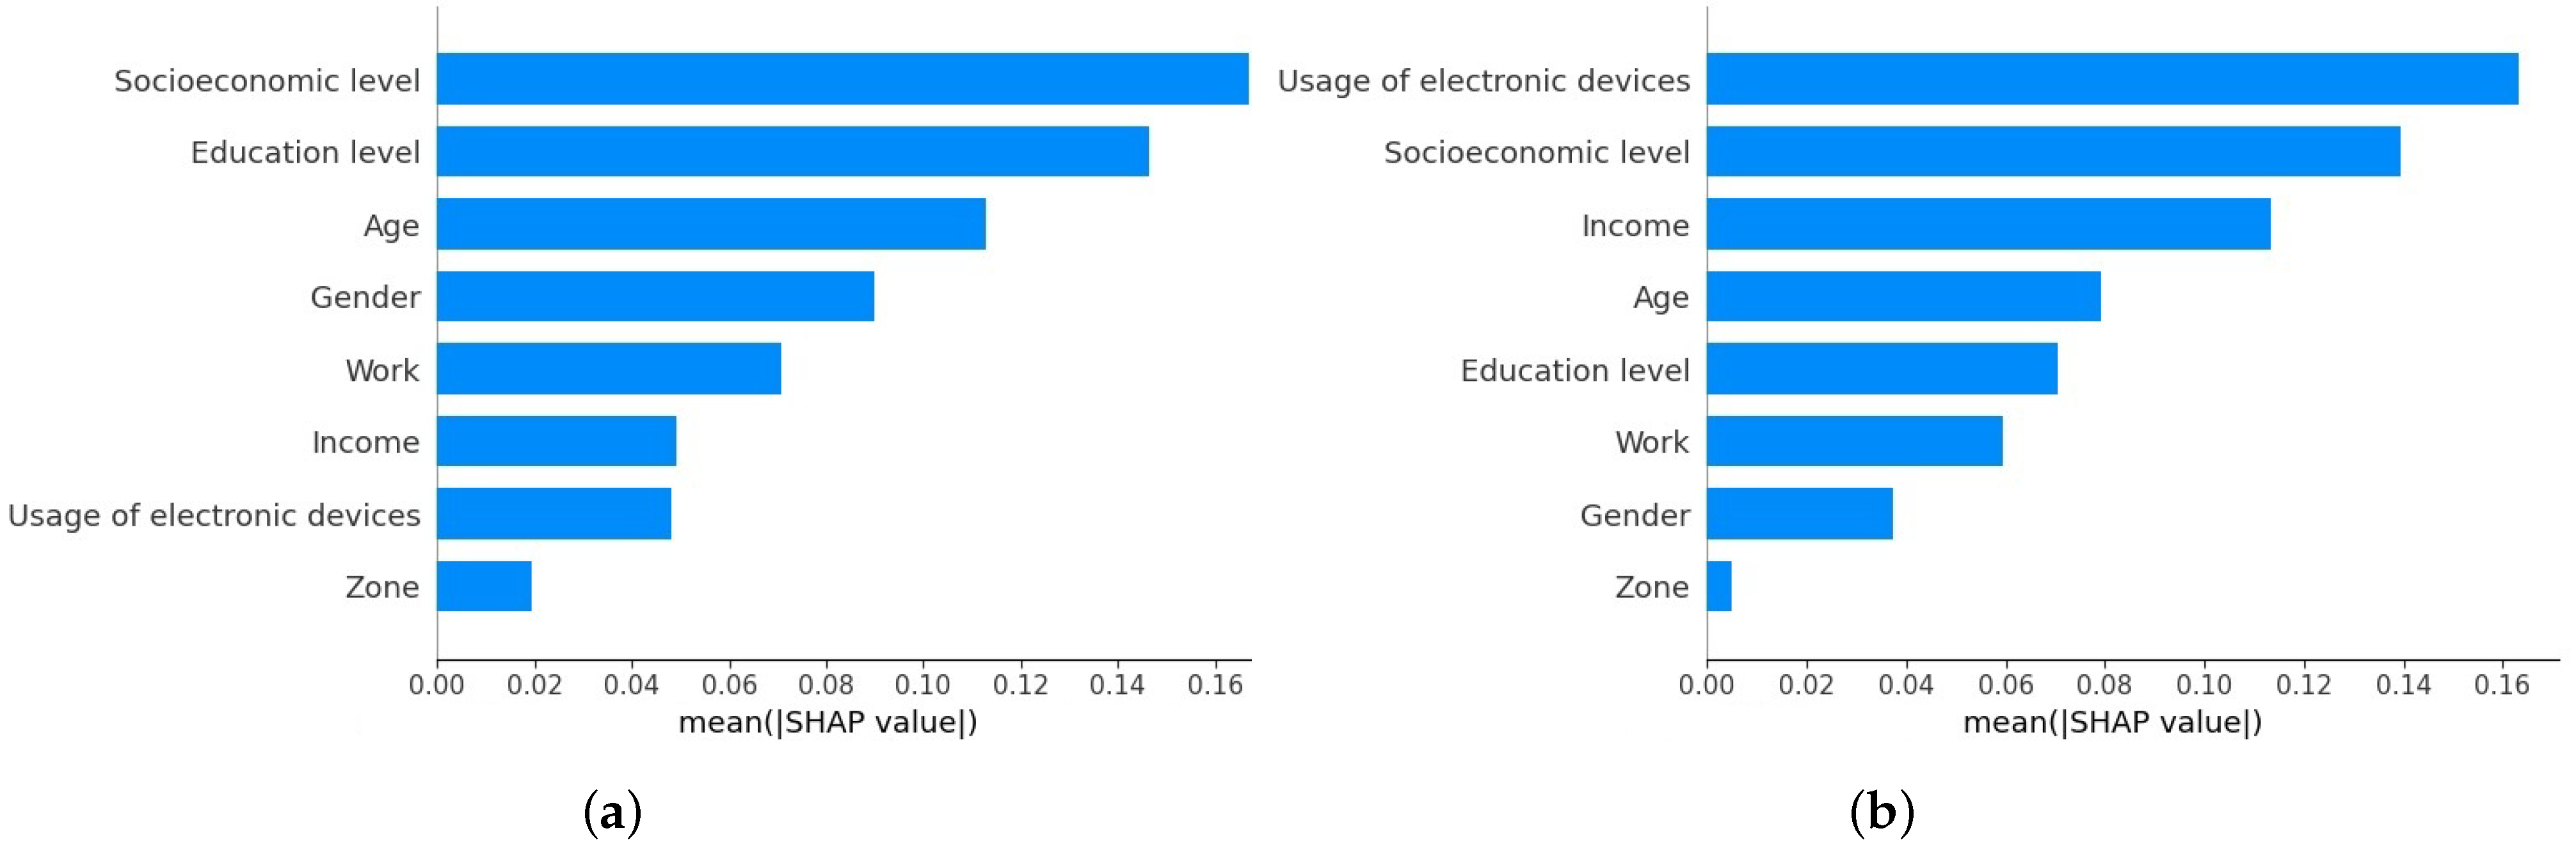
Table 1.
Operational definition of the sociodemographic factors used in the study.
| Variable | Definition | Scale | Categories |
|---|---|---|---|
| Accounts access | Individual has a savings account or a checking account or a time deposit account or savings in cooperatives. | Nominal | 1 = Yes 0 = No |
| Use of accounts in operations | Conducted operations involving funds entering the account or funds exiting the account once a week or once a month over the past year. | Nominal | 1 = Yes 0 = No |
| Education level | The highest level of education that the respondent has. | Ordinal | 1 = No education/Preschool/Elementary |
| school/Incomplete high school | |||
| 2 = Complete high school/Incomplete technical | |||
| education | |||
| 3 = Complete technical education | |||
| 4 = Incomplete higher education | |||
| 5 = Higher education/Postgraduate studies | |||
| Work/Occupation | Occupation of the respondent | Nominal | 1 = Unemployed 2 = Employer 3 = Self-employed 4 = Technical/professional employee 5 = Laborer 6 = Domestic worker 7 = Farmer/Countryman 8 = Dedicated to household |
| Income | Household’s monthly income of the respondent | Nominal | 1 = <300 2 = 300–600 3 = 601–1200 4 = 1201–2400 5 = 2401–4800 6 = >4801 |
| Gender | Gender of the respondent | Nominal | 1 = Male 2 = Female |
| Zone | Area of residence of the respondent | Nominal | 1 = Rural 2 = Urban |
| Socioeconomic level | Socioeconomic status of the respondent | Ordinal | 1 = SEL E 2 = SEL D 3 = SEL C 4 = SEL B 5 = SEL A |
| Usage of electronic devices | The individual made payments for services once a week or once a month during the last year using smartphones or computers. | Nominal | 1 = Yes 0 = No |
| Age | Age of the respondent | Ordinal | 1 = 18–19 2 = 20–29 3 = 30–39 4 = 40–49 5 = 50–59 6 = 60–69 7 = 70–79 |
Table 2.
Distribution of data size in the training and test sets for the study.
| Target Variable | Subset | Sample Size | Class 0 | Class 1 |
|---|---|---|---|---|
| Access to bank accounts | Training set | 964 | 614 | 350 |
| Test set | 241 | 150 | 91 | |
| Usage of bank accounts | Training set | 964 | 541 | 423 |
| Test set | 241 | 128 | 113 |
Table 3.
Definition of hyperparameters for parametric and non-parametric models.
| Algorithm | Hyperparameter | Definition |
|---|---|---|
| LR | - | - |
| DT | criterion | The function to measure the quality of a split |
| max_depth | The maximum depth of the tree | |
| min_samples_leaf | The minimum number of samples required to split an internal node | |
| ANN | activation | Activation function for the hidden layer |
| solver | The solver for weight optimization | |
| max_iter | Maximum number of iterations | |
| hidden_layer_sizes | Number of neurons in the hidden layer | |
| momentum | Momentum for gradient descent update | |
| learning rate | Learning rate | |
| RF | n_estimators | The number of trees in the forest |
| max_features | The number of features to consider when looking for the best split | |
| max_depth | The maximum depth of the tree | |
| criterion | The function to measure the quality of a split | |
| XGBoost | max_depth | Maximum depth of the individual estimators |
| n_estimators | The number of boosting stages to perform | |
| learning_rate | Learning rate shrinks the contribution of each tree | |
| min_split_loss | Regularization term that controls the minimum loss reduction required | |
| SVC | C | Controls the trade-off between a low training error and a low testing error |
| gamma | Defines how far the influence of a single training example reaches | |
| kernel | Specifies the type of function used to transform the input data |
Table 4.
Confusion matrix for models’ evaluation.
| Predicted Values | |||
|---|---|---|---|
| Predicted Negative | Predicted Positive | ||
| Actual values | Actual Negative | True negatives (TNs) | False positives (FPs) |
| Actual Positive | False negatives (FNs) | True positives (TPs) | |
Table 5.
Descriptive statistics of the study variables.
| Usage of Bank Accounts | Access to Bank Accounts | ||||
|---|---|---|---|---|---|
| Yes (n = 536) | No (n = 669) | Yes (n = 441) | No (n = 764) | ||
| Characteristics | n/% | n/% | n/% | n/% | |
| Education level | |||||
| No education/Preschool/Elementary school/Incomplete high school | 31 (5.78%) | 187 (27.95%) | 27 (6.12%) | 191 (25.00%) | |
| Complete high school/Incomplete technical education | 171 (31.90%) | 288 (43.05%) | 125 (28.34%) | 334 (43.72%) | |
| Complete technical education | 126 (23.51%) | 95 (14.20%) | 113 (25.62%) | 108 (14.14%) | |
| Incomplete higher education | 77 (14.37%) | 51 (7.62%) | 57 (12.93%) | 71 (9.29%) | |
| Higher education/Postgraduate studies | 131 (24.44%) | 48 (7.17%) | 119 (26.98%) | 60 (7.85%) | |
| Income | |||||
| <300 | 10 (1.87%) | 91 (13.60%) | 8 (1.81%) | 93 (12.17%) | |
| 300–600 | 49 (9.14%) | 130 (19.43%) | 39 (8.84%) | 140 (18.32%) | |
| 601–1200 | 167 (31.16%) | 281 (42.00%) | 137 (31.07%) | 311 (40.71%) | |
| 1201–2400 | 176 (32.84%) | 123 (18.39%) | 151 (34.24%) | 148 (19.37%) | |
| 2401–4800 | 101 (18.84%) | 38 (5.68%) | 80 (18.14%) | 59 (7.72%) | |
| >4801 | 33 (6.16%) | 6 (0.90%) | 26 (5.90%) | 13 (1.70%) | |
| Gender | |||||
| Women | 227 (42.35%) | 375 (56.05%) | 187 (42.4%) | 415 (54.32%) | |
| Men | 309 (57.65%) | 294 (43.95%) | 254 (57.6%) | 349 (45.68%) | |
| Zone | |||||
| Rural | 57 (10.63%) | 145 (21.67%) | 37 (8.39%) | 165 (21.6%) | |
| Urban | 479 (89.37%) | 524 (78.33%) | 404 (91.61%) | 599 (78.4%) | |
| Age | |||||
| 18–19 | 29 (5.41%) | 38 (5.68%) | 14 (3.17%) | 53 (6.94%) | |
| 20–29 | 200 (37.31%) | 164 (24.51%) | 175 (39.68%) | 189 (24.74%) | |
| 30–39 | 133 (24.81%) | 159 (23.77%) | 118 (26.76%) | 174 (22.77%) | |
| 40–49 | 99 (18.47%) | 142 (21.23%) | 71 (16.1%) | 170 (22.25%) | |
| 50–59 | 52 (9.70%) | 94 (14.05%) | 40 (9.07%) | 106 (13.87%) | |
| 60–69 | 21 (3.92%) | 63 (9.42%) | 22 (4.99%) | 62 (8.12%) | |
| 70–79 | 2 (0.37%) | 9 (1.35%) | 1 (0.23%) | 10 (1.31%) | |
| Socioeconomic Level | |||||
| SEL E | 26 (4.85%) | 149 (22.27%) | 12 (2.72%) | 163 (21.34%) | |
| SEL D | 70 (13.06%) | 217 (32.44%) | 66 (14.97%) | 221 (28.93%) | |
| SEL C | 211 (39.37%) | 220 (32.88%) | 168 (38.1%) | 263 (34.42%) | |
| SEL B | 194 (36.19%) | 75 (11.21%) | 166 (37.64%) | 103 (13.48%) | |
| SEL A | 35 (6.53%) | 8 (1.20%) | 29 (6.58%) | 14 (1.83%) | |
| Usage of electronic devices | |||||
| No | 306 (57.09%) | 669 (100.00%) | 280 (63.49%) | 695 (90.97%) | |
| Yes | 230 (42.91%) | 0 (0.00%) | 161 (36.51%) | 69 (9.03%) | |
| Work/Occupation | |||||
| Unemployed | 27 (5.04%) | 52 (7.77%) | 18 (4.08%) | 61 (7.98%) | |
| Employer | 38 (7.09%) | 15 (2.24%) | 33 (7.48%) | 20 (2.62%) | |
| Self-employed | 230 (42.91%) | 317 (47.38%) | 196 (44.44%) | 351 (45.94%) | |
| Technical/professional employee | 128 (23.88%) | 57 (8.52%) | 108 (24.49%) | 77 (10.08%) | |
| Laborer | 32 (5.97%) | 34 (5.08%) | 23 (5.22%) | 43 (5.63%) | |
| Domestic worker | 5 (0.93%) | 20 (2.99%) | 7 (1.59%) | 18 (2.36%) | |
| Farmer/Countryman | 1 (0.19%) | 18 (2.69%) | 3 (0.68%) | 16 (2.09%) | |
| Household chores | 24 (4.48%) | 94 (14.05%) | 19 (4.31%) | 99 (12.96%) | |
| Student | 28 (5.22%) | 45 (6.73%) | 18 (4.08%) | 55 (7.2%) | |
| Unspecified occupation | 23 (4.29%) | 17 (2.54%) | 16 (3.63%) | 24 (3.14%) | |
Table 6.
Hyperparameter selection of optimal values for parametric and non-parametric models.
| Access to Bank Accounts | Usage of Bank Accounts | ||
|---|---|---|---|
| Algorithm | Hyperparameter | Optimal Values | Optimal Values |
| LR | - | - | - |
| DT | criterion | Gini | Entropy |
| max_depth | 14 | 11 | |
| min_samples_leaf | 1 | 4 | |
| ANN | activation | Relu | Relu |
| solver | Sgd | Sgd | |
| max_iter | 500 | 500 | |
| hidden_layer_sizes | 12 | 13 | |
| momentun | 0.6 | 0.9 | |
| learning rate | 0.1 | 0.01 | |
| RF | n_estimators | Entropy | Entropy |
| max_features | Log2 | Sqrt | |
| max_depth | 11 | 9 | |
| criterion | 170 | 170 | |
| XGBoost | max_depth | 9 | 9 |
| n_estimators | 160 | 60 | |
| learning_rate | 0.075 | 0.1 | |
| min_split_loss | 0 | 0.2 | |
| SVC | C | 3 | 3 |
| gamma | 0.5 | 0.1 | |
| kernel | RBF | RBF |
Table 7.
Comparison of performance of models for the prediction of usage of bank accounts.
| Logistic Regression | Decision Trees | Artificial Neural Networks | Random Forest | XGBOOST | SVC RBF | |||||||
|---|---|---|---|---|---|---|---|---|---|---|---|---|
| Predicted | Predicted | Predicted | Predicted | Predicted | Predicted | |||||||
| Observed | No | Yes | No | Yes | No | Yes | No | Yes | No | Yes | No | Yes |
| No | 105 | 23 | 96 | 32 | 84 | 44 | 105 | 23 | 94 | 34 | 105 | 23 |
| Yes | 27 | 86 | 26 | 87 | 16 | 97 | 22 | 91 | 20 | 93 | 22 | 91 |
| Accuracy | 79.00% | 76.00% | 75.00% | 81.00% | 78.00% | 81.00% | ||||||
| Sensitivity | 76.11% | 76.99% | 85.84% | 80.53% | 82.30% | 80.53% | ||||||
| Specificity | 82.03% | 75.00% | 65.63% | 82.03% | 73.44% | 82.03% | ||||||
| F1 Score | 77.47% | 75.00% | 76.38% | 80.18% | 77.50% | 80.18% | ||||||
| PPV | 78.90% | 73.11% | 68.79% | 79.82% | 73.23% | 79.82% | ||||||
| NPV | 79.55% | 78.69% | 84.00% | 82.68% | 82.46% | 82.68% | ||||||
| AUC | 79.07% | 76.00% | 75.73% | 81.28% | 77.87% | 81.28% | ||||||
Note.- Bold values indicate the best results or more favorable outcomes from the machine learning models according to performance metrics.
Table 8.
Comparison of performance of models for the prediction of access to bank accounts.
| Logistic Regression | Decision Trees | Artificial Neural Networks | Random Forest | XGBOOST | SVC RBF | |||||||
|---|---|---|---|---|---|---|---|---|---|---|---|---|
| Predicted | Predicted | Predicted | Predicted | Predicted | Predicted | |||||||
| Observed | No | Yes | No | Yes | No | Yes | No | Yes | No | Yes | No | Yes |
| No | 104 | 46 | 90 | 60 | 144 | 6 | 100 | 50 | 95 | 55 | 94 | 56 |
| Yes | 23 | 68 | 29 | 62 | 50 | 41 | 24 | 67 | 28 | 63 | 30 | 61 |
| Accuracy | 71.00% | 63.00% | 77.00% | 69.00% | 66.00% | 64.00% | ||||||
| Sensitivity | 74.73% | 68.13% | 45.05% | 73.63% | 69.23% | 67.03% | ||||||
| Specificity | 69.33% | 60.00% | 96.00% | 66.67% | 63.33% | 62.67% | ||||||
| F1 Score | 66.34% | 58.22% | 59.42% | 64.42% | 60.29% | 58.65% | ||||||
| PPV | 59.65% | 50.82% | 87.23% | 57.26% | 53.39% | 52.14% | ||||||
| NPV | 81.89% | 75.63% | 74.23% | 80.65% | 77.24% | 75.81% | ||||||
| AUC | 72.03% | 64.07% | 70.53% | 70.15% | 66.28% | 64.85% | ||||||
Note.- Bold values indicate the best results or more favorable outcomes from the machine learning models according to performance metrics.
Disclaimer/Publisher’s Note: The statements, opinions and data contained in all publications are solely those of the individual author(s) and contributor(s) and not of MDPI and/or the editor(s). MDPI and/or the editor(s) disclaim responsibility for any injury to people or property resulting from any ideas, methods, instructions or products referred to in the content. |
© 2024 by the authors. Licensee MDPI, Basel, Switzerland. This article is an open access article distributed under the terms and conditions of the Creative Commons Attribution (CC BY) license (https://creativecommons.org/licenses/by/4.0/).
Share and Cite
MDPI and ACS Style
Maehara, R.; Benites, L.; Talavera, A.; Aybar-Flores, A.; Muñoz, M. Predicting Financial Inclusion in Peru: Application of Machine Learning Algorithms. J. Risk Financial Manag. 2024, 17, 34. https://doi.org/10.3390/jrfm17010034
AMA Style
Maehara R, Benites L, Talavera A, Aybar-Flores A, Muñoz M. Predicting Financial Inclusion in Peru: Application of Machine Learning Algorithms. Journal of Risk and Financial Management. 2024; 17(1):34. https://doi.org/10.3390/jrfm17010034
Chicago/Turabian StyleMaehara, Rocío, Luis Benites, Alvaro Talavera, Alejandro Aybar-Flores, and Miguel Muñoz. 2024. "Predicting Financial Inclusion in Peru: Application of Machine Learning Algorithms" Journal of Risk and Financial Management 17, no. 1: 34. https://doi.org/10.3390/jrfm17010034