
Unveiling the Influencing Factors of Cryptocurrency Return Volatility

1
Faculty of Business and Economics, Department of Economics and Finance, Main Building, University of New York Tirana, Tirana 1001, Albania
2
Grant Thornton, Tirana 1001, Albania
*
Author to whom correspondence should be addressed.
J. Risk Financial Manag. 2024, 17(1), 12; https://doi.org/10.3390/jrfm17010012
Submission received: 17 November 2023
/
Revised: 21 December 2023
/
Accepted: 22 December 2023
/
Published: 25 December 2023
(This article belongs to the Special Issue Emerging Issues in Economics, Finance and Business)
Abstract
:The blossoming of cryptocurrencies during the last decade has largely influenced both the financial and the technological world. Bitcoin emerged on the edge of the financial crisis in 2008, signaling the very beginning of a financial and technological innovation, which in continuance would eventually create a lot of questions and debate previously unforeseeable. This paper aims to explore the impact of factors such as trading volume, information demand, stock returns, and exchange rates on the volatility of returns for decentralized and unbacked cryptocurrencies from 2016 to 2022 by employing the GARCH model. Based on each coin’s innate functional characteristics and market performance quantified by their respective market capitalization, the selection included Bitcoin, Ether, and XRP as representative crypto coins for the category of decentralized and unbacked cryptocurrencies. The implementation of correlation analysis and the use of the GARCH model on influencing factors for each coin revealed that decentralized and unbacked cryptocurrencies are positively related to trading volume, information demand, and exchange rates while being indifferent to a certain extent to the stock market returns of the world stock index MSCI ACWI. The results of this study provide further insight into the behavior of cryptocurrency return volatility in the new, ever-changing, and highly unpredictable crypto market as well as aid investors in their decision-making process concerning portfolio optimization.
Keywords:
cryptocurrency; blockchain technology; return volatility; Bitcoin; Ether; XRP; GARCH model1. Introduction
Since their genesis and for more than a decade up to the present day, cryptocurrency has evolved into a revolutionary financial and technological innovation. It has expanded the fintech world beyond any foreseeable limits. Operating through individual blockchain technology, cryptocurrency provides an optimal alternative financial asset to benefit investors in their portfolio construction.
Nevertheless, the market of cryptocurrencies is highly volatile, which is supported by previously conducted research by analysts all over the world. This volatility is both what makes crypto assets desirable to investors for their high returns and also what prompts them to display risk-averse behavior due to the innate unpredictability.
Our study was conducted in order to explore the volatility of returns for a group of cryptocurrencies that are similar in nature to the first created cryptocurrency, Bitcoin. This group is that of decentralized crypto coins, whose transactions do not need approval from a central authority, and of coins that are not backed by a fiat currency or commodity like stablecoins. It is possible to effectively create a study by acknowledging many variables when studying a relatively unexplored market, such as the one of cryptocurrencies. The variables have been chosen based on theories and financial research and have then been analyzed through extensively researched statistical models, such as GARCH (1,1). Such an approach has ensured that the market for decentralized coins not backed by any fiat currency or commodity has been thoroughly described. In this manner, general knowledge of this market has broadened and contributed to the identification of the specific explanatory factors influencing returns of BTC, ETH, and XRP. This leads to the following research question:
“How do trading volume, information demand, stock market returns, and USD/EUR exchange rates influence the volatility of returns of decentralized unbacked crypto coins”? The attempt to establish a relationship among variables for a sample of the most representative coins relies on previously conducted research and empirical studies and employs a series of statistical techniques, including descriptive statistics, correlation analysis, and the statistical GARCH (1,1) model. The independent variables used as explanatory factors are the trading volume and information demand for each coin as well as the world stock market index return and USD/EUR exchange rate.
To address this issue, our research spans from 1 January 2016 to 25 December 2022, marking the final trading day of the year. We have data collected on a weekly basis every Friday, given the absence of stock return records for weekends in financial databases. This encompasses a seven-year duration period.
Our evidence shows that the trading volume has a strong positive effect on the volatility of returns for each crypto coin. Furthermore, the strongest impact appeared for BTC, where the variable coefficient in the GARCH (1,1) model equation was the largest, followed by ETH and XRP. Our empirical evidence is consistent with the findings of Balcilar et al. (2017) and El Alaoui et al. (2019).
The rest of the paper is organized as follows. The next part represents the theoretical framework of existing studies of cryptocurrencies and hypothesis development. In Section 3, we describe the data, variables used, and methodological approach. Section 4 presents and discusses the empirical results. Section 5 concludes the paper.
2. Literature Review
2.1. Theoretical Framework of Cryptocurrencies
By definition, cryptocurrencies are digital or virtual assets that serve as a financial medium of exchange (Frankenfield 2022a). They are secured through cryptography, which is the study of techniques that provide secure communication by allowing the contents of a message to only be viewed by its sender and the receiver (Kaskersky 2022). In terms of cryptocurrencies, this means that only the payer and the receiver of payment can access the coin’s monetary value. This security measure makes it virtually impossible for the currencies to be counterfeited or duplicated. These digital currencies are based on a network that extends over a large number of computers, composing so-called decentralized blockchain technology (Frankenfield 2022a).
Blockchain technology was introduced to the world in 2008 by Satoshi Nakamoto as a peer-to-peer network for Bitcoin, where transactions were verified by cryptographic network nodes and recorded in an open, distributed, public ledger known as blockchain (Nakamoto 2008). In its most basic form, blockchain is a permanent and verifiable distributed ledger that allows two parties to document transactions efficiently and permanently. To simplify the concept, blockchain can be viewed as a growing list of records (blocks) linked with one another using cryptography. Every single block contains an algorithm (hash) of the previous one, a certain time stamp, and transaction data. As a result of the way blockchain has been designed, it is resistant to any retroactive data alteration that does not lead to a modification of all subsequent blocks. The reason behind this is that once a block of data is documented in the ledger, none of the subsequent ones can be altered without affecting the specific data of the block itself (The Economist 2015).
When analyzing cryptocurrencies, the way they operate, and the technology behind them, it is important to mention the process of “mining”. Mining is the process through which new cryptocurrencies are introduced into the market circulation (Hong 2022). As well as being a way for the network to confirm new transactions, it is also crucial to the maintenance and development of the blockchain ledger. The process of mining involves solving complex computational mathematical problems using sophisticated hardware with very large processing power. In a repeating cycle, as soon as a computer discovers a solution to the problem, it receives the next block of cryptocurrency in the blockchain system, and then the process starts once more from the beginning.
According to Hong (2022), the word “mining” serves as a metaphor. It describes the computational work that is put in by each node of the blockchain network in an effort to earn new coins. What miners do is mint coins, in the same way a country’s central bank mints money. Apart from the coins created from the genesis block of a cryptocurrency, every other crypto coin of that currency came into existence because of the work of miners. Nonetheless, even if there were no miners, the cryptocurrency network would still exist. It would operate only using the coins generated by the founding block. No additional coins of the currency would be in circulation.
Miners can also be viewed as auditors since they work towards verifying the legitimacy of cryptocurrency transactions. This is done in order to avoid double-spending, which is spending the same crypto coin twice (Hong 2022). The spender of a coin makes a copy of the same coin and sends it out to multiple purchasers. This process of transaction verification was conceived by Satoshi Nakamoto when he founded Bitcoin so that cryptocurrency transactions remained honest.
Of the consensus mechanisms used to create crypto coins and that serve to verify transactions and create new coins to add to the existing blockchain, the most common are Proof-of-work and Proof-of-stake (Coinbase 2022). Even though we analyze these two, there could be other mechanisms like delegated Proof-of-stake, Proof-of-elapsed time, etc.
Conceptually very closely related to the process of mining previously discussed, Proof-of-work is the original mechanism used by Bitcoin and founded by Nakamoto. The reason behind its name is that the network requires a lot of computational and processing power to operate. Cryptocurrencies based on Proof-of-work are secured and verified by miners on an international level. Miners race to be the first to solve the math puzzles in order to update the blockchain and earn new coins. Coins that adopt this mechanism are Bitcoin, Ether 1.0 (the first version of Ether), Litecoin, Dogecoin, etc.
Proof-of-stake represents another type of mechanism for validating new entries into a distributed database and verifying all transactions within it. In contrast to Proof-of-work, which requires miners to solve cryptographic puzzles, Proof-of-stake utilizes validators who hold coins in order to earn transaction fees. The owners of coins “stake” a specific amount of them as collateral to get the chance to validate blocks and then turn themselves into validators. For example, Ether requires 32 ETH as a stake in order for the owner to become a validator. Then, when a predetermined number of validators is reached for a specific block, the verification process is finalized. The block is deemed accurate and put into existence. In Ether’s case, there need to be 128 validators for the block to be finalized (Frankenfield 2022b). Noteworthy examples of Proof-of-stake cryptocurrencies include Ether (ETH), Cardano (ADA), Binance Coin (BNB), Polkadot (DOT), Avalanche (AVAX) and many more.
The validity of transactions and block information is confirmed by randomly selected validators. Instead of using a competitive rewards-based mechanism like Proof-of-work, this system randomly assigns the users who can collect fees. According to Frankenfield (2022b), this randomness in selecting validators makes Proof-of-stake less risky in the aspect of cyber-attacks on its network.
Using Proof-of-work mining mechanisms requires costly equipment and energy resources. This limits access to mining and securing the blockchain network. Proof-of-stake blockchains significantly decrease the amount of required computational power for validating transactions. This way transactions are validated more quickly and economically.
2.2. The Cryptocurrencies Market Overview
Since its creation in 2008, Bitcoin still remains the first and the largest cryptocurrency in terms of market capitalization (Figure 1a) and has been the starting point for the creation of other alter coins such as Ether and XRP, which are part of this research. The total market capitalization of all cryptocurrencies reached USD 805.9 billion in December 2022 (Figure 1b), with a daily trading volume of USD 20.2 billion (CoinMarketCap 2023c). That represented a decrease of 62.7% from the respective number of December 2021, which referred to a USD 2.16 trillion market capitalization and USD 1.36 trillion daily trading volume (CoinMarketCap 2023c) (see Table 1).
The reasons behind this so-called “crypto-winter” involved, primarily, the bankruptcy of the largest global crypto exchange, called Futures Exchange (FTX), the crashing of other cryptos TerraUSD and Luna in May 2022, but also other macroeconomic factors such as the increase in interest rates, inflation, austere monetary policy from the U.S. Federal Reserve and increased investor uncertainty (Forbes Advisor 2023; Kerner 2023).
According to the historical data analysis provided by Statista (2022), in the last two years, over USD 300 billion in trades on average were executed by investors each day as of 2020, a significant increase over the last decade. For example, in the last two years, trading volume peaked at USD 516.21 billion on 20 May 2021. Figure 2 above gives an overall view of the trading volume behavior over the last two years, and we observe that the higher fluctuations appear to remain pervasive.
Unlike traditional fiat currencies, cryptocurrencies are created to be self-contained in terms of their value, thus leaving no role for banks or financial institutions to play in storing or moving the monetary instrument. The value of a cryptocurrency is not determined by any macroeconomic metric, such as the GDP, interest rates, or inflation; neither is it rooted in any material goods. On the contrary, it is fully based on supply and demand (Kristoufek 2013).
As a result of current financial circumstances, investors are seeking out alternative, innovative investment opportunities, where cryptocurrencies’ lack of correlation with other assets makes them an attractive choice for investors (Chowdhury 2016).
In addition, Kaplanov (2012) explains that Bitcoin’s rapid popularity is largely due to the demand for non-regulated alternative currencies. For crypto users, there are various benefits associated with the absence of regulation. To begin with, it provides user autonomy. A digital currency allows its users to control their money without the interference of intermediaries such as banks or governments. Secondly, according to the same author, transactions were thought to be discrete and untraceable, even though, later on, this was proven to be an incorrect perception. As we also reference later in this paper, transactions are recorded in a ledger that can be traced and, once identified, the user can be associated with the transactions. Thirdly, crypto and blockchain are peer-to-peer, which implies that crypto users do not need to seek permission from external parties (banks, financial institutions, or governments) to send or receive payments around the world. In addition, cryptocurrencies offer an escape from the payment of traditional banking fees, for example, minimum balance, overdraft, or return deposit charges. Further, transaction costs, especially in international scenarios, are significantly lower because these transactions do not involve intermediary governmental or private institutions. Another benefit is related to the speed at which transactions are carried out using cryptocurrencies. This gets rid of the waiting periods in traditional institutions. Moreover, among numerous other benefits, transactions in the crypto market take place online. It only takes internet access to be able to trade in cryptocurrencies, making it very convenient for people who wish to avoid cash-on-hand transactions or who have no other payment methods (Reiff 2022).
A noteworthy phenomenon concerning cryptocurrencies is also that of countries creating their own national digital currencies. The Marshall Islands, an independent nation located in the Pacific Ocean, issued a “Sovereign Currency Act” on 26 February 2018 (Republic of the Marshall Islands 2018). Through this act, they have introduced a new currency based on the blockchain system. This currency goes by the name of Sovereign or its trading name SOV. According to the law, SOV is a legal tender for all debts, public charges, and dues in the Marshall Islands. However, there are many complications to putting this project into action; therefore, there have been delays in implementing it (Usbek & Rica 2020).
This study refers to Bitcoin, the first and original cryptocurrency, and two other altcoins, namely Ether and XRP Ripple. The altcoins are chosen based on their similarity in nature to Bitcoin. The reasons behind choosing these three for the study are that (a) they are decentralized, meaning the transactions in which they are used are not approved by a single authority, since they are directly confirmed between users on a shared public ledger, (b) they are not backed by a commodity or currency, as opposed to stablecoins, (c) they had the highest market capitalization at the end of 2022, and (d) they are coins and not tokens. In contrast to tokens, coins have their own platform and are designed to be used as currencies. On the other hand, tokens are designed to represent an interest in a digital asset and carry out transactions on the blockchain (Frankenfield 2023c). Ether’s platform is Ethereum, whereas XRP’s is the XRP Ledger. Platforms are not to be confused with marketplaces or exchanges.
2.3. The Volatility of Returns Factors for Cryptocurrencies
To understand the factors that affect the volatility of returns in cryptocurrencies, we need to relate the latter with the characteristics of traditional securities that produce returns and those factors that research has proven to affect the returns. In this context, understanding the features of cryptocurrencies can lead us to define our hypotheses of how their volatility of returns is affected.
Several articles have attempted to analyze cryptocurrencies in terms of their being considered money. As such, the literature shows that they cover three functions: medium of exchange (Gillis 2021), unit of account (Garner 2022), and store of value (Corva 2022). The study by Gervais et al. (2014) examines whether Bitcoin is a decentralized currency, meaning whether there is a government or bank managing the currency. They find that Bitcoin appears to be decentralized in a different way than “normal” currencies. Yermack (2015) performs an economic appraisal to analyze if Bitcoin is a real currency and he concludes that Bitcoin performs more like a speculative investment than a currency and fails to meet the criteria of fiat currencies. Traditionally, the value of any investment is typically determined by various factors, such as demand, earnings generated, growth potential, business performance, and other financial metrics. The value of a cryptocurrency, however, is affected by demand, production cost, and market competition (DeJesus 2022).
In this regard, a lot of studies have been conducted trying to understand the market forces in the cryptocurrency market as well as to define the drivers of price changes during different economic conditions or market bubbles. The article by Cheah and Fry (2015) examines the bubbles in the Bitcoin market by using the currency’s price in U.S. dollars during the period of 2010 to 2014. The authors find that Bitcoin is susceptible to speculative bubbles. Another finding presented in their research is that the fundamental value of Bitcoin is zero, that is, the value set through fundamental analysis without taking into consideration its market value. This makes the bubble property substantial in Bitcoin prices, meaning that there is a great difference between Bitcoin’s fundamental value and its actual market value. Corbet et al. (2018) conducted another study in which they analyzed bubbles in the Bitcoin and Ether markets during the period of 2009 to 2017 by employing the BADFS unit root Philips methodology. The study resulted in them successfully detecting periods wherein bubble properties were very much apparent. They also claim that Bitcoin was in a bubble during that time.
In the same vein, there exists a possibility for volatility and returns to be altered by one-time-only events, such as the pandemic, natural disasters, or even market crashes. For instance, Bouri et al. (2017) describe in their article that prior to the big crash in 2013, the volatility of Bitcoin was asymmetric to that of traditional assets, while after the crash of 2013, this did not hold true anymore.
Such findings pique the interest in research in this area by raising the concern that the pandemic could have had such effects on the volatility of returns of cryptocurrencies. In their research, Corbet et al. (2020) report findings of significant growth in cryptocurrency returns and trading volume resulting directly from the pandemic. A similar finding is also presented by Goodell and Goutte (2021), who analyzed the co-movement of COVID-19 and Bitcoin specifically using wavelet coherence analysis. They found that an increase in Bitcoin prices was caused because of the COVID-19 pandemic.
Drozdz et al. (2020) present a more comprehensive study on the crypto market by studying the impact of the pandemic on the topology of the crypto network. Under normal market dynamic conditions, the crypto market displays a distributed network topology, meaning that none of the nodes dominates the network and decentralization exists. However, during a volatile period, the network becomes highly centralized in one of the network nodes. For example, the authors found that the dominating node is usually Tether (USDT). When uncertainty arises in the market, investors rush to convert their assets, traditional or digital, into Tether coins. The reason behind this is that USDT is a stablecoin pegged to the U.S. dollar and, therefore, is considered more stable than other cryptocurrencies. Other than its value being tied to the U.S. dollar, its popularity in terms of market capitalization, trading volume, and returns is also a contributing factor to its dominating power in the market. In their study, the authors also found that the impact of COVID-19 on cryptocurrencies started to become apparent in March 2020, when the disease was officially declared a pandemic.
Nonetheless, the effects of the pandemic described in the literature above (Bouri et al. 2017; Corbet et al. 2020; Goodell and Goutte 2021; Drozdz et al. 2020) are both short- and medium-term ones. In the longer term, the market’s behavior regarding the volatility of returns remains in its original nature. This is further elaborated in the study of Arouxet et al. (2022) in which the authors investigate if there is any COVID-19 impact on the long-term memory of the crypto market. They study the long-term memory profiles of return and volatility of the seven currencies with the largest market capitalization using wavelet coherence analysis during periods before and after the pandemic. The pandemic’s effect is represented by the number of COVID-19 cases and deaths. Their findings state that the effect on the long-term memory of the market is mild and transitory in nature.
There have also been studies on whether cryptocurrencies could serve as hedging tools during the COVID-19 pandemic. Maitra et al. (2022) conducted a study on whether cryptocurrencies provide a better hedging alternative in major equity markets during the pandemic. The study analyses the two biggest cryptocurrencies in terms of market capitalization and popularity among investors, which are Bitcoin and Ether. The cryptocurrencies are assessed in a comparative manner by taking pre-COVID-19 and COVID-19 sample periods using copula models. The study concludes that investment in cryptocurrencies does provide hedging benefits; however, these benefits were reduced during the pandemic, while the cost of hedging increased. Additionally, incremental gains from cryptocurrencies hedging the equity market were minimal during the COVID-19 pandemic.
Other studies have been conducted on whether cryptocurrencies can serve as hedging instruments. Feng et al. (2018) use a tail risk perspective analysis to answer whether cryptocurrencies can be safe havens. By utilizing an extreme-value-theory-based method, the authors assess data from seven currencies from 2015–2017. Their results consist of establishing that cryptocurrencies do have safe-haven properties and can serve as diversifiers in stock portfolios. This diversifying role can be played similarly to gold, but not to the same extent, since cryptocurrencies are poorer diversifiers in comparison to gold.
In their article, Balcilar et al. (2017) investigate the existence of safe-haven properties of Bitcoin from 2011–2015. They analyze Bitcoin’s price data against other financial assets through Engle’s model of Dynamic Conditional Correlation. Their conclusion is that Bitcoin is not suitable as a sole hedging instrument, but it is advantageous for portfolio diversification purposes. They also discovered that the safe-haven properties of Bitcoin were different in different markets and time horizons. For instance, they found out that Bitcoin was a good hedging instrument when there were high weekly downward fluctuations in the Asian stock market.
In another empirical investigation, Demir et al. (2018) answer the question of whether uncertainty around economic policy predicts Bitcoin returns. By employing analytical tools such as the Bayesian Graphical Structural Vector Autoregressive model and the Ordinary Least Squares and Quantile-on-Quantile Regression estimations, the authors found out that uncertainty on economic policy is indeed powerful enough to predict Bitcoin returns. Demir et al. (2018) discovered that there exists a negative correlation between Bitcoin returns and economic policy uncertainty. They conclude that Bitcoin can be used by investors as a hedging instrument against financial uncertainty in the market.
Some other studies focus on certain markets and not on global ones. For instance, Susilo et al. (2020) studied hedging opportunities in cryptocurrencies against equity instruments in the Southeast Asia emerging markets using the GARCH model. The authors concluded that there are indeed hedging opportunities in cryptocurrencies. Their analysis showed that only one cryptocurrency could not properly hedge stocks; however, five equally weighted cryptocurrencies could hedge equity instruments on a marginal level. The authors also recommend that investors include cryptocurrencies in their portfolio when their aim is to maximize the Sharpe ratio, instead of using them for hedging purposes only. Nonetheless, although cryptocurrencies were proven to have safe-haven properties, the authors concluded that, in the case of the Southeast Asian market, commodities were a better hedging tool.
Overall, the literature shows that the value and the returns of cryptocurrencies are not dependent on macroeconomic metrics like inflation, GDP, interest rates, or material goods (Kristoufek 2013). They can comprise an alternative investment to that of traditional portfolio management (Putzhammer 2022) and can be used for optimizing investment portfolios (Tse 2021), as well as hedging tools in different times. Their returns, though, tend to be much more affected by supply and demand and factors related to their functionality.
In 2001, Kaniel et al. (2001) applied the efficient market hypothesis to test the predictive power of trading volume. Their test showed that there is a positive correlation between very high trading volume and return premiums in security prices. They were also able to establish that the higher the volume, the larger the effect on the return premium. This led to their conclusion that trading volume does indeed have predictive power over returns to some extent. Balcilar et al. (2017) discovered that there is no causal relationship between volume and returns; thus, volume is not an appropriate predictive tool that would help build profitability strategies for cryptocurrency investments. However, they do find that volume has an impact on the volatility of returns. Additionally, El Alaoui et al. (2019) studied the cross-correlation between Bitcoin price and trading volume during a specified timeframe. According to their findings, Bitcoin price and volume interact non-linearly, which is beneficial to the decision making of investors. The evidence on this correlation means that inferences about Bitcoin prices cannot be derived without being accompanied by inferences about Bitcoin trading volume.
Regarding information demand being a fit measure for determining a relationship with cryptocurrency returns, Kristoufek (2013) conducted an analysis of the relationship between Bitcoin and its searches in Google and Wikipedia. He concludes that there is a relationship between Bitcoin prices and search queries for the keyword “Bitcoin” and the relationship is asymmetric. The increased interest was correlated with lower prices of the coin. Urquhart (2018) examines the relationship between Bitcoin return volatility and investor attention. The value of the latter variable was captured by Google Trend search results of the keyword “Bitcoin”. He concludes that there is a positive effect on return volatility, meaning that increased attention brought increased volatility.
The third factor in determining the volatility of returns is stock market returns. In 2005, a study on market integration and contagion showed there are considerable links between markets since returns and volatility both move across different markets and countries (Bekaert et al. 2005). In other words, if there is volatility in one market, there is a potential simultaneous effect in other markets. This happens because all countries and their respective markets are linked to one another through international trade and investments. Sharma (2022) states in his article that from 2009 to the late 2010s, there was an evident lack of correlation between the stock market and the crypto one, which made the crypto market a safe haven for investors. However, from 2017, a correlation seems to have appeared between the prices of each market. This has come since more and more brokerages and investors have been treating cryptocurrencies like another investment asset class in their portfolio-building strategies. In other words, the correlation is based on the financial behavior of investors toward crypto assets more than on the inherent characteristics of cryptocurrencies. Sajeev and Afjal (2022) conducted a study on the contagion effect of cryptocurrencies on the security market by studying Bitcoin volatility and that of four large stock markets. From their empirical analysis of volatility spillover performed by implementing the diagonal BEKK and DCC (M)GARCH models, the authors conclude that there is an overall time-varying low correlation between BTC and the stock markets. It was found that stock markets respond more to negative shocks than positive ones in the BTC market in terms of their volatility.
Finally, a study on the impact of exchange rates on BTC returns utilizing the ARMA econometric model examined how the USD/EUR, USD/GBP, USD/AUD, and USD/JPY exchange rates affected BTC returns (Almansour et al. 2020). The study resulted in an indication of a nonsignificant effect for all exchange rates. Specifically for the USD/EUR rate, the study results showed a positive relationship, meaning that when the Euro appreciated, BTC returns would also appreciate. Nonetheless, the relationship was insignificant.
2.4. Research Hypotheses
In continuance of the above literature review and the factors that research has been testing regarding the volatility and factors affecting it, we were led to the following hypotheses to be tested:
H1:
Trading volume has a positive effect on the volatility of returns of decentralized crypto coins (BTC, ETH, XRP).
H2:
Information demand has a positive effect on the volatility of returns of decentralized crypto coins (BTC, ETH, XRP).
H3:
Stock market returns have no effect on the volatility of returns of decentralized crypto coins (BTC, ETH, XRP).
H4:
USD/EUR exchange rates have a positive effect on the volatility of returns of decentralized crypto coins (BTC, ETH, XRP).
3. Data and Methodology
3.1. Sample and Data
As theory and previous research indicate that cryptocurrencies’ value is not dependent on macroeconomic factors, we concentrated on factors that are related to their functionality and specific characteristics, namely: trading volume, information demand, stock market returns, and USD/EUR exchange rates. Being that the crypto market is highly volatile, with steep fluctuations, a weekly basis was chosen for data collection. The timeframe for data collection was affected by the launch date of the cryptocurrencies used. As stated in the sections above, Bitcoin was created in 2008 and launched for the first time in January 2009, Ether was launched in July 2015, and XRP was launched in June 2012.
In order to have the same data for all currencies, the time period of this research covers from 1 January 2016 until 25 December 2022, which was the last open day of financial markets for the year (CoinMarketCap 2023a, Historical data). This involves a period of 7 years with data taken on a weekly basis every Friday for the period of 2016–2022 since stock return databases did not have records for the weekend days. In total, there were 365 observations taken into consideration.
3.2. Model and Variables
Several authors utilized time series analyses, with a focus on regression analyses, to define the factors of volatility returns. For instance, Demir et al. (2018), when aiming to answer the question of whether uncertainty around economic policy predicts Bitcoin returns, used the Ordinary Least Squares and the Quantile-on-Quantile Regression estimations and concluded that uncertainty on economic policy is indeed powerful enough to predict Bitcoin returns.
However, in using regression analysis as a statistical analytical tool for time series data, there are certain limitations to be taken into account. First, regression assumes an unchanged cause–effect relationship over the specified period between the independent and dependent variables. This is not always true for all cases of time series data. Second, if the independent and dependent variables are not linear, regression is not a fit tool to explain the relationship between them. Third, two or more independent variables can be highly correlated with one another, resulting in the phenomenon of multicollinearity. In this case, the two or more variables measure the same aspect. This leads to one of these independent variables interpreting the majority of the variance within the dependent variable and the other one interpreting very little of it.
Studies on factors impacting the volatility of cryptocurrencies, namely BTC, such as Ciaian et al. (2016, 2017), first start by testing for stationarity in order to avoid spurious regressions.
To test our hypothesis, we use the General Autoregressive Conditional Heteroscedasticity (GARCH) model, which consists of three main steps. The first step is estimating the best fit regarding an autoregressive model. Second, GARCH calculates the autocorrelation of error terms. The third and last step of the model is the test of statistical significance (Francq and Zakoian 2019).
Although there have been numerous alterations to the model since its inception in 1986, Engle (2001) states that the basic GARCH (1,1) model is the most powerful one in terms of its predictive extent, especially when it comes to auto-related returns. The GARCH (1,1) model says that variance can be calculated using the latest observation of the squared residual combined with the latest estimate of variance. There have also been further studies, such as the one by Hansen and Lunde (2005) on a comparison of volatility models against GARCH (1,1), which found no evidence of outperformance by other analyzed models, and the one by Pilbeam and Langeland (2014) on forecasting exchange rate volatility that found that GARCH (1,1) provides the most appropriate forecast.
Additionally, there has been research directly involving the cryptocurrency market. Dyhrberg (2016) conducted a volatility prediction analysis on Bitcoin, gold, and the US dollar using different GARCH models in order to explore the hedging capabilities of BTC. The GARCH (1,1) model provided the most comprehensive results. Naimy and Hayek (2018) also aimed to model and predict the volatility of BTC by employing GARCH models, finding that the GARCH (1,1) model gives the smallest prediction error.
To summarize, we have selected this model, following previously conducted research on the adequacy of the GARCH (1,1) model in testing the volatility of cryptocurrency returns, as well as based on its relatively less complex nature in implementation.
There are two main equations for implementing the GARCH (1,1) model (Cermak 2017). First, the conditional mean equation is used to describe the behavior of sampled returns and the error term εt, which shows the unexpected returns. The equation is as follows:
where:
- rt = return for period t
- β0 = constant
- β1 = parameter
- rt−1 = return for previous period t − 1
- εt = error term
The estimated error term from the first equation is then input into the second conditional variance equation, which is as follows:
where:
- = conditional variance
Given that:
α1 + β1 < 1 is the stationary condition and α1 > 0 and β1 > 0 must hold true
Following the examples of previous studies, such as Cermak (2017) and Dyhrberg (2016), in analyzing the volatility of cryptocurrency returns, the GARCH (1,1) model is adjusted by incorporating the explanatory variables of both equations.
This results in the modified mean equation, as follows:
And the modified variance equation, as follows:
where:
- θ = GARCH model parameter
- TQTY = Weekly trading volume/traded quantity of coins
- INFO = Information demand: weekly number of keyword searches in Google Trends
- ACWI = Weekly MSCWI ASCWI/weekly world stock market index returns
- USD/EUR = Exchange rate/weekly USD to EUR exchange rate
Since the modified mean equation in the GARCH (1,1) model aims to explain the effect on the returns of a specific variable, while the study focuses on the effect of the volatility of a specific variable, the modified variance will be the main equation used. The first equation will be used to measure terms necessary for the performance of the second one. All variables are logged using natural logarithms so that outliers and skewness of the financial time series data are eliminated.
Trading volume is the total amount of all buys and sells on a market during a specified period for a cryptocurrency expressed in terms of units of that cryptocurrency). The specified period is usually 24 h in the financial markets. The circulating amount of a coin in financial market exchanges, otherwise stated as the combined number of coin units sold and bought, does not change with fluctuations in information demand, stock returns, or exchange rates. The data for trading volume were obtained from CoinMarketCap (2023a, Historical data), a globally renowned and highly referenced platform for tracking cryptocurrency prices, using their weekly cryptocurrency historical data snapshot.
Information demand represents how much the market requires or searches for information regarding the cryptocurrencies under study. This is expressed in terms of Google searches for keywords on each coin.
Specifically:
- -
- Keyword for Bitcoin (BTC)—“Bitcoin”
- -
- Keyword for Ether/Ether (ETH)—“Ether”
- -
- Keyword for XRP Ripple (XRP)—“XRP”
The data are obtained from Google Trends, a website by Google for tracking the popularity of search queries in Google’s search engine (Google Trends 2023). Within the sample period (starting on 1 January 2016, up to 25 December 2022), Google Trends assigns a value from 0 to 100 each week based on the number of times the keyword has been searched for in Google’s search engine (Google Search) compared to the total number of searches during the whole observation period. This value is the observation for the independent variable. This means that the value 100 is allocated to the week with the highest number of searches for the keyword, whereas the value 0 is allocated to the week with the lowest number of searches.
MSCI (Morgan Stanley Capital International) and ACWI (All Country World Index) is a stock index that aims to track the performance of the global financial market of equity-based instruments (Mitchell 2022). Investors use it as an asset allocation guide to build their investment portfolios. The official website of MSCI Inc, a NYC-based finance company that provides various indices and financial analysis tools, states that the index includes over 2.9 thousand large- and mid-cap equity instruments from 11 economic sectors across 23 developed and 24 emerging markets across the globe (MSCI 2023). The weekly data for MSCI ACWI were taken from “Investing.com” for the research period of this study, from 1 January 2016 up to 25 December 2022 (Investing 2023).
Finally, USD/EUR exchange rates are included in this study to analyze the relationship between cryptocurrencies and exchange rate fluctuations on a nominal basis for the period from 1 January 2016 up to 25 December 2022, on a weekly basis.
4. Results
Descriptive Statistics
The descriptive statistics presented in Table 2 show the following regarding each of the cryptocurrencies. Bitcoin (BTC) had a mean return equal to 0.15% during the 7-year research period 2016–2022, indicating a positive gain for investors. The minimum value that BTC returns dropped is −15.32% in one week. The maximum value that BTC returns increased between two consecutive weeks is 15.62%. The trading volume averaged at a mean of around 1.4 million BTC units traded per week. The minimum value for the trading volume indicates that around 83k BTC units were traded in the slowest week, whereas the maximum value indicates that trading volume surged up to around 13.3 million BTC for one week. The maximum value corresponds to the second week of March 2020, ending on 13th March. On 11th March 2020, the World Health Organization declared COVID-19 a global pandemic (World Health Organization 2020). Such news caused turmoil in financial markets and caused investors to act irrationally, as discussed in previous sections. The information demand for BTC shows that the weekly number of searches for the respective keyword averages at about 38 in the range of 0 to 100, with a minimum of 4 and a maximum of 100. The maximum value for the variable reflects the maximum limit of values it can take based on the functioning of Google Trends.
Ether has an average of equal to 0.37%, meaning that investors generally faced gains from trading ETH coins during the research period. The minimum return amount ETH dropped in a week is −25.52%, whereas the maximum return ETH provided for investors in a week was 33.47%. The trading volume for ETH averaged around 18.6 million ETH units traded weekly. The minimum amount of ETH coins traded in a week was 217k, whereas the maximum amount was 209 million coins. The maximum value, which surpassed even the total circulating supply of the coin, corresponds to the second week of March 2020, ending on 13th March. Like with BTC, the COVID-19 turmoil in financial markets is also evident in the trading volume trends of Ether. The information demand for ETH shows the weekly number of searches for the respective keyword averages at about 34 out of 100. This average is very close to the one of BTC, indicating the similar nature of both coins to investors. The minimum value for information demand is 2, whereas the maximum value is 100. The maximum value for the variable reflects the maximum limit of values it can take based on the functioning of Google Trends.
For Ripple’s XRP, returns average at a mean equal to 0.73%, meaning that investors generally faced gains from trading XRP coins during the research period. The minimum return amount XRP dropped in a week is −14.75%, whereas the maximum return XRP provided for investors in a week was 60.08%. The trading volume for Ripple’s XRP averages at a mean of around 4.3 billion XRP coins traded weekly. The minimum amount of XRP coins traded in a week is 24.3 million, whereas the maximum amount is 51.3 billion million coins. The information demand for XRP averaged at 34 out of 100 weekly searches for the respective keyword. This average is close to both BTC and ETH, although slightly lower, indicating the similarity in nature of the three coins to investors. The minimum value for information demand is 1, whereas the maximum value is 100. The maximum value for the variable reflects the maximum limit of values it can take based on the functioning of Google Trends.
World stock returns, or MSCI ACWI returns, average at a mean of 0.01%. This indicates that investor gains from stock investments were generally lower compared to the average weekly returns of BTC, ETH, and XRP during the research period. In the period from 2016 to 2022, the minimum value of stock returns was −4.76%, whereas the maximum value was 5.27%. The maximum value is lower than that of the crypto coins above. This is an indication of the higher profitability of cryptocurrencies but also of their higher risk. The latter can be illustrated through the high variation between minimum and maximum values of the crypto coins and the relatively lower variation for stock returns. The risk is also apparent in the fact that the minimum value of the crypto coins was much lower than that of stock returns.
Regarding exchange rates, the average amount of Euros the US dollar was converted to during the research period is 1.13 EUR per USD. The minimum amount is 0.97 EUR per USD, whereas the maximum amount stands at 1.25 EUR per USD.
A correlation matrix has been prepared for all three currencies, and from the results in Appendix A, we observe that the returns have a significant and positive correlation with the stock returns index. Data for all three currencies have been tested for multicollinearity (VIF test), stationarity (Dickey–Fuller test), clustering volatility, and heteroscedasticity (Breusch–Godfrey Serial Correlation LM test) (see Appendix A).
Differenced natural logarithms of variables are implemented in the mean and variance equations of the GARCH (1,1) model with the underlying conditions that the constants are positive numbers, and their sum is less than 1.
Results for all three coins regarding the modified mean and variance equations are presented in Table 3, Table 4 and Table 5 below.
The underlying conditions of the GARCH (1,1) model, that its constants should be positive numbers and their sum should be less than one, are satisfied.
From the mean equation model data, it can be observed that independent variables are statistically insignificant in predicting returns, except the trading volume.
The variance equation for Bitcoin is as follows:
From the table, the coefficients of each variable align with the hypotheses as well as other referenced literature throughout the theoretical framework, and the residuals’ significance, at the level 0.05, proves the GARCH(1,1) is sufficient to predict the volatility of returns for BTC.
The underlying conditions of the GARCH (1,1) model, that its constants should be positive numbers and their sum should be less than one, are satisfied.
From the mean equation model data, it can be observed that independent variables are statistically insignificant in predicting returns, except the trading volume.
The variance equation for Ether is as follows:
From the table, the coefficients of each variable align with the hypotheses as well as other referenced literature throughout the theoretical framework, and the residuals’ significance, at the level 0.055, does not prove the GARCH (1,1) to be sufficient to predict the volatility of returns for ETH.
The underlying conditions of the GARCH (1,1) model, that its constants should be positive numbers and their sum should be less than one, are satisfied.
From the mean equation model data, it can be observed that independent variables are statistically insignificant in predicting returns, except the trading volume.
From the table, the coefficients of the variables of stock returns, exchange rates, and information demand do not align with the hypotheses, except for the trading volume, which is in alignment and also statistically significant. The residuals’ significance, at the level 0.05, proves that the GARCH (1,1) model is sufficient to predict the volatility of returns for XRP.
5. Discussion and Conclusions
Compared to the market of traditional financial instruments, the cryptocurrency market remains relatively less explored, although considerable financial research has been carried out by specialists. Centralized and decentralized forms, coins and tokens, stablecoins and those not backed by any currency or commodity, were all thrown together in the mix, as the studies focused on their returns and profitability. Whereas other studies focus on the coins individually while studying their behavior, our study was concentrated on cryptocurrencies that are of the same nature as the original one, thus differentiating them from the rest of the pool. This may be of special interest to investors that consider a mix and match of their existing portfolios with one specific traditional coin. Our empirical analysis shows that trading volume has a strong positive effect on the volatility of returns for each crypto coin, BTC, ETH, and XRP. The strongest effect appeared for BTC, where the variable coefficient in the GARCH (1,1) model equation was the largest, followed by ETH and XRP. Additionally, due to the fact that the three coins also represent around 40% of the total capitalization of the crypto market, this provides to financial analysts a better overview for their research reports on the specific coins and to fund managers an indication of what could be expected from the general conditions of the crypto market. Individual or institutional investors can reshape and reshuffle their positions according to the signals they receive from the trading volumes of the specific coins.
Information demand was measured through searches of an individual keyword for each crypto coin in Google Trends. The empirical analysis showed a positive effect on the volatility of returns for BTC and ETH, which matches the hypothesis. In periods when investor interest increases and there are more Google searches of the keyword, the volatility of returns for a certain coin also increases. The inclusion of this indicator to measure the simple market sentiment on coins is rather different from the traditional indices of market or investors’ confidence. But overall, an increase in information demand for these coins signals also an increased demand for them, and, consequently, increased prices and returns.
Stock returns are measured by the returns of the world market index, namely MSCI ACWI. The empirical analysis shows no significant effect on returns of BTC, ETH, and XRP. Investors existing and new, analysts, and fund managers may consider this inexistent correlation between stock returns and crypto coin returns, which may help them diversify their portfolios and beat the market. The model coefficients of the variable for each coin are very close to zero and the relationship is insignificant, as per the p-value. This finding confirms those of other previous studies, such as Sajeev and Afjal (2022) and Sharma (2022), who found a very low time-varying correlation between the stock market and the cryptocurrency one.
USD/EUR exchange rates showed a positive effect on crypto returns for BTC and ETH, but not for XRP. This finding aligns with findings of previous studies on this matter such as Almansour et al. (2020). The authors found a positive relationship between the USD/EUR exchange rate and Bitcoin returns, meaning that when the Euro appreciated, BTC returns did too. Nonetheless, the relationship was insignificant. The insignificance of the relationship was also evident in the respective model application results of this study, where the p-value exceeded the significance level. This trend may be an indicator of coherence between the coins and exchange rates, yet it indicates no cause and effect in their relationship.
This study’s original results indicate that investors and speculators in the investment industry may consider that traditional cryptocurrencies be included in their portfolios for diversification purposes or to beat the market. Whether investors have built their portfolios in the stock market or in the foreign exchange market, crypto coins do not show any interaction with those markets, indicating a possibility of diversification. Moreover, increased trading volume and increased information demand seem to affect the volatility of returns for these coins. This may be very closely linked with news, information on technological advancement, or building expectations on increased returns. As a consequence, a signaling of profit opportunities arises for investors and they may need to reshuffle their positions.
For those investors that aim to lower risk or increase returns, this study provides an additional understanding of decentralized crypto coins that do not classify as stablecoins.
For researchers who aim to extend their knowledge, this study presents relatively considerable research into the crypto market. Understanding the behavior of the coins and that they do not follow the conventional rules that economics is based on creates fields for research and development.
Still, there are some limitations, which mainly concern variable data sources. Although sources have been chosen after analyzing their credibility and popularity among end users, as discussed in their respective sections above, there still exists the possibility that data from other sources could provide different results when modeled using GARCH (1,1). This limitation pertains to returns, trading volume, MSCI ACWI stock returns, and exchange rates.
Another instance is the weekly frequency of information demand data of search entries in Google Trends. The frequency and manner in which Google Trends provides data might make it difficult when seeking to analyze information demand about specific dates or other intervals.
Additionally, the use of the GARCH (1,1) statistical model, due to its less complex nature and practicality in application, could also be deemed as a limitation. This model functions under the assumption that both positive and negative error terms impact volatility in the same manner. Particularly speaking, good and bad news are assumed to have the same size of effect on returns volatility. In reality, however, this is not always the case, as investors are more prone to risk-averse market behavior.
Nevertheless, despite all the research and academic literature provided globally, the crypto market remains full of uncertainty concerning the behavior of crypto returns and their volatility. Therefore, this study has provided a modest contribution to reducing such uncertainty and mitigating crypto risk.
One could extend this same research topic by taking into account more than three cryptocurrencies and conducting a broader study involving more explanatory factors that explain the volatile behavior of crypto returns.
Moreover, the research period of this study is a 7-year period from the beginning of 2016 up to the end of 2022, providing 365 observations in total. It would be interesting to see the impact of the same factors on return volatility throughout a longer period, providing a larger size of sample observations.
Another area where insight can be provided from further research concerns the statistical model used to determine relationships and their significance. Consulted literature presented the use of models such as VAR, VEC, ARCH, ARMA, etc., on topics similar to that of this study. It would be interesting to see the results of these models for the variables and data included in this study.
Author Contributions
Conceptualization, A.K. and A.P.; methodology, A.K., A.G. and A.P.; software, A.G. and A.P.; validation, A.K. and A.G.; formal analysis, A.P.; investigation, A.P.; resources, A.K.; data curation, A.G.; writing—original draft preparation, A.P.; writing—review and editing, A.K.; visualization, A.K.; supervision, A.K.; project administration, A.K. All authors have read and agreed to the published version of the manuscript.
Funding
This research received no external funding.
Data Availability Statement
Data were collected from public sources, namely: CoinMarketCap (2023a), Google Trends, the Google Search Engine, Investing.com (Investing 2023), and the Wall Street Journal (2023). Data are available from authors, upon request.
Acknowledgments
The authors would like to express their gratitude for the support provided by the University of New York Tirana and the participants at the 33d International Conference organized by RSEP at the University of Washington Centre Rome, on 23–24 November 2023. All views expressed in this publication are entirely those of the authors. All errors remain our own.
Conflicts of Interest
Author Artemisa Pilkati was employed by the company Grant Thornton. The remaining authors declare that the research was conducted in the absence of any commercial or financial relationships that could be construed as a potential conflict of interest.
Appendix A
| Correlations BTC | ||||||
| BTC CCY Return | BTC Trading Volume CCC Qty | BTC Info Demand | EUR-USD Close | MSCI ACWI Stock Return | ||
| BTC CCY Return | Pearson Correlation | 1 | 0.052 | 0.124 * | 0.098 | 0.212 * |
| Sig. (2-tailed) | 0.318 | 0.018 | 0.062 | 0.000 | ||
| BTC Trading Volume CCC Qty | Pearson Correlation | 0.052 | 1 | 0.005 | −0.086 | 0.057 |
| Sig. (2-tailed) | 0.138 | 0.923 | 0.101 | 0.274 | ||
| BTC Info Demand | Pearson Correlation | 0.124 * | 0.005 | 1 | 0.110 * | −0.003 |
| Sig. (2-tailed) | 0.018 | 0.923 | 0.035 | 0.947 | ||
| EUR-USD Close | Pearson Correlation | 0.098 | −0.086 | 0.0110* | 1 | 0.042 |
| Sig. (2-tailed) | 0.062 | 0.101 | 0.035 | 0.425 | ||
| MSCI ACWI Stock Return | Pearson Correlation | 0.212 ** | 0.057 | −0.003 | 0.042 | 1 |
| Sig. (2-tailed) | 0.000 | 0.274 | 0.947 | 0.425 | ||
| * Correlations is significant at the 0.05 level (2-tailed) | ||||||
| ** Correlations is significant at the 0.01 level (2-tailed) | ||||||
| Correlations ETH | ||||||
| ETH CCY Return | ETH Trading Volume CCC Qty | ETH Info Demand | EUR-USD Close | MSCI ACWI Stock Return | ||
| ETH CCY Return | Pearson Correlation | 1 | 0.08 | 0.00054 | 0.021 | 0.230 ** |
| Sig. (2-tailed) | 0.125 | 0.992 | 0.688 | 0.000 | ||
| ETH Trading Volume CCC Qty | Pearson Correlation | 0.08 | 1 | −0.180** | −0.088 | 0.063 |
| Sig. (2-tailed) | 0.125 | 0.001 | 0.095 | 0.227 | ||
| ETH Info Demand | Pearson Correlation | 0.00054 | −0.180 ** | 1 | 0.09912 | 0.0144 |
| Sig. (2-tailed) | 0.992 | 0.001 | 0.059 | 0.794 | ||
| EUR-USD Close | Pearson Correlation | 0.021 | −0.088 | 0.09912 | 1 | 0.042 |
| Sig. (2-tailed) | 0.688 | 0.095 | 0.059 | 0.425 | ||
| MSCI ACWI Stock Return | Pearson Correlation | 0.230 ** | 0.063 | 0.014 | 0.042 | 1 |
| Sig. (2-tailed) | 0.000 | 0.227 | 0.794 | 0.425 | ||
| * Correlations is significant at the 0.05 level (2-tailed) | ||||||
| ** Correlations is significant at the 0.01 level (2-tailed) | ||||||
| Correlations XRP | ||||||
| XRP CCY Return | XRP Trading Volume CCC Qty | XRP Info Demand | EUR-USD Close | MSCI ACWI Stock Return | ||
| XRP CCY Return | Pearson Correlation | 1 | 0.035 | 0.04492 | −0.039 | 0.143 ** |
| Sig. (2-tailed) | 0.507 | 0.392 | 0.46 | 0.006 | ||
| XRP Trading Volume CCC Qty | Pearson Correlation | 0.035 | 1 | 0.081 | 0.193 ** | 0.028 |
| Sig. (2-tailed) | 0.507 | 0.121 | 0 | 0.597 | ||
| XRP Info Demand | Pearson Correlation | 0.04492 | 0.0801 | 1 | −0.188 ** | −0.037 |
| Sig. (2-tailed) | 0.392 | 0.121 | 0 | 0.485 | ||
| EUR-USD Close | Pearson Correlation | −0.039 | 0.193 ** | −0.188 ** | 1 | 0.042 |
| Sig. (2-tailed) | 0.460 | 0.000 | 0.000 | 0.425 | ||
| MSCI ACWI Stock Return | Pearson Correlation | 0.143 ** | 0.028 | −0.037 | 0.042 | 1 |
| Sig. (2-tailed) | 0.006 | 0.597 | 0.485 | 0.425 | ||
| * Correlations is significant at the 0.05 level (2-tailed) | ||||||
| ** Correlations is significant at the 0.01 level (2-tailed) | ||||||
| Variable | Dicker Fuller |
| Diff_LN of BTC CCY Return | <0.0001 |
| Diff_LN of BTC Trading Volume CCC Qty | <0.0001 |
| Diff_LN of BTC Info Demand | <0.0001 |
| Diff_LN of ETH CCY Return | <0.0001 |
| Diff_LN of ETH Trading Volume CCC Qty | <0.0001 |
| Diff_LN of ETH Info Demand | <0.0001 |
| Diff_LN of XRP CCY Return | <0.0001 |
| Diff_LN of XRP Trading Volume CCC Qty | <0.0001 |
| Diff_LN of XRP Info Demand | <0.0001 |
| Diff_LN of MSCI ACWI Stock Return | <0.0001 |
| Diff_LN of EUR-USD Close | <0.0001 |
Breusch–Godfrey LM test performed for Bitcoin.

Breusch–Godfrey LM test performed for Ethereum.

Breusch–Godfrey LM test performed for XRP.

References
- Almansour, Bashar Yaser, Yaser Ammar Almansour, and Mohammad In’airat. 2020. The Impact of Exchange Rates on Bitcoin Returns: Further Evidence From a Time Series Framework. International Journal of Scientific & Technology Research 9: 4577–81. [Google Scholar]
- Arouxet, M. Belen, Aurelio F. Bariviera, Veronica E. Pastor, and Victoria Vampa. 2022. COVID-19 impact on cryptocurrencies: Evidence from a wavelet-based Hurst exponent. Physica A: Statistical Mechanics and Its Applications 596: 127170. [Google Scholar] [CrossRef]
- Balcilar, Mehmet, Elie Bouri, Rangan Gupta, and David Roubaud. 2017. Can volume predict Bitcoin returns and volatility? A quantiles-based approach. Economic Modelling 64: 74–81. [Google Scholar] [CrossRef]
- Bekaert, Geert, Campbell R. Harvey, and Angela Ng. 2005. Market Integration and Contagion. The Journal of Business 78: 39–69. [Google Scholar] [CrossRef]
- Bouri, Elie, Georges Azzi, and Anne Haubo Dyhrberg. 2017. On the Return-Volatility Relationship in the Bitcoin Market around the Price Crash of 2013. Economics e-Journal 11: 1–16. [Google Scholar] [CrossRef]
- Cermak, Vavrinec. 2017. Can Bitcoin Become a Viable Alternative to Fiat Currencies? An Empirical Analysis of Bitcoin’s Volatility Based on a GARCH Model. Available online: https://papers.ssrn.com/sol3/papers.cfm?abstract_id=2961405#:~:text=The%20volatility%20of%20Bitcoin%20has,functioning%20alternative%20to%20fiat%20currencies (accessed on 1 December 2023).
- Cheah, J. Eng-Tuck, and John Fry. 2015. Speculative bubbles in Bitcoin markets? An empirical investigation into the fundamental value of Bitcoin. Economics Letters 130: 32–36. [Google Scholar] [CrossRef]
- Chowdhury, Abdur. 2016. Is Bitcoin the “Paris Hilton” of the Currency World? Or Are the Early Investors onto Something That Will Make Them Rich? The Journal of Investing 25: 64–72. [Google Scholar] [CrossRef]
- Ciaian, Pavel, Miroslava Rajcaniova, and D’ Artis Kancs. 2016. The Economics of BitCoin Price Formation. Applied Economics 48: 1799–815. [Google Scholar] [CrossRef]
- Ciaian, Pavel, Miroslava Rajcaniova, and D’ Artis Kancs. 2017. Virtual Relationships: Short- and Long-run Evidence from BitCoin and Altcoin Markets. Journal of International Financial Markets Institutions and Money 52: 173–95. [Google Scholar] [CrossRef]
- Coinbase. 2022. What Is “Proof of Work” or “Proof of Stake”? Coinbase. Available online: https://www.coinbase.com/learn/crypto-basics/what-is-proof-of-work-or-proof-of-stake (accessed on 1 December 2023).
- CoinMarketCap. 2022. Historical Snapshot—25 December 2022. Available online: https://coinmarketcap.com/historical/20221225/ (accessed on 1 December 2023).
- CoinMarketCap. 2023a. Bitcoin. Available online: https://coinmarketcap.com/currencies/bitcoin/ (accessed on 1 December 2023).
- CoinMarketCap. 2023b. Cryptocurrency Historical Data Snapshot. Available online: https://coinmarketcap.com/historical (accessed on 1 December 2023).
- CoinMarketCap. 2023c. Global Cryptocurrency Charts. Available online: https://coinmarketcap.com/charts/ (accessed on 1 December 2023).
- Corbet, Shaen, Brian Lucey, and Larisa Yarovaya. 2018. Datestamping the Bitcoin and Ether Bubbles. Finance Research Letters 26: 81–88. [Google Scholar] [CrossRef]
- Corbet, Shaen, Yang Greg Hou, Yang Hu, Charles Larkin, and Les Oxley. 2020. Any port in a storm: Cryptocurrency safe-havens during the COVID-19 pandemic. Economics Letters 194: 109377. [Google Scholar] [CrossRef] [PubMed]
- Corva, Frank. 2022. Bitcoin Is a Store of Values. NASDAQ. Available online: https://www.nasdaq.com/articles/bitcoin-is-a-store-of-values (accessed on 1 December 2023).
- DeJesus, Taylor. 2022. Are We In a Crypto Bubble? NASDAQ. Available online: https://www.nasdaq.com/articles/are-we-in-a-crypto-bubble (accessed on 1 December 2023).
- Demir, Ender, Giray Gozgor, Chi Keung Marco Lau, and Samuel A. Vigne. 2018. Does economic policy uncertainty predict the Bitcoin returns? An empirical investigation. Finance Research Letters 26: 145–49. [Google Scholar] [CrossRef]
- Drozdz, Stanislaw, Jaroslaw Kwapien, Pawel Oswiecimka, Tomas Stanisz, and Marcin Watorek. 2020. Complexity in Economic and Social Systems: Cryptocurrency Market at around COVID-19. Entropy 22: 1043. [Google Scholar] [CrossRef] [PubMed]
- Dyhrberg, Anne Haubo. 2016. Bitcoin, gold and the dollar—A GARCH volatility analysis. Finance Research Letters 16: 85–92. [Google Scholar] [CrossRef]
- El Alaoui, Marwane, Elie Bouri, and David Roubaud. 2019. Bitcoin price-volume: A multifractal cross-correlation approach. Finance Research Letters 103: 374–81. [Google Scholar] [CrossRef]
- Engle, Robert. 2001. GARCH 101: The Use of ARCH/GARCH Models in Applied Econometrics. Journal of Economic Perspectives 15: 157–68. [Google Scholar] [CrossRef]
- Feng, Wenjun, Yiming Wang, and Zhengjun Zhang. 2018. Can cryptocurrencies be a safe haven: A tail risk perspective analysis. Applied Economics 50: 4745–62. [Google Scholar] [CrossRef]
- Forbes Advisor. 2023. Why Crypto Market Is Down in May 2023. Forbes. Available online: https://www.forbes.com/advisor/in/investing/cryptocurrency/why-crypto-market-is-down/#:~:text=Reasons%20Behind%20Crypto%20Collapse%20In%202022&text=The%20prime%20reason%20for%20the,liquidity%20from%20the%20crypto%20market (accessed on 1 December 2023).
- Francq, Christian, and Jean-Michel Zakoian. 2019. GARCH Models: Structure, Statistical Inference and Financial Applications, 2nd ed. Hoboken: John Wiley & Sons. [Google Scholar] [CrossRef]
- Frankenfield, Jake. 2022a. Cryptocurrency Explained with Pros and Cons for Investment. Investopedia. Available online: https://www.investopedia.com/terms/c/cryptocurrency.asp (accessed on 1 December 2023).
- Frankenfield, Jake. 2022b. What Does Proof-of-Stake (PoS) Mean in Crypto? Investopedia. Available online: https://www.investopedia.com/terms/p/proof-stake-pos.asp#:~:text=What%20Is%20Proof%2Dof%2DStake%20vs.,new%20blocks%20to%20the%20blockchain (accessed on 1 December 2023).
- Frankenfield, Jake. 2023c. What Are Crypto Tokens, and How Do They Work? Investopedia. Available online: https://www.investopedia.com/terms/c/crypto-token.asp#:~:text=Is%20Bitcoin%20a%20Token%20or,make%20purchases%2C%20or%20store%20value (accessed on 1 December 2023).
- Garner, Jonathan. 2022. When Will Bitcoin Become a Unit of Account? Medium. Available online: https://medium.com/the-capital/when-will-bitcoin-become-a-unit-of-account-2fe9f79dbb7a#:~:text=A%20unit%20of%20account%20is,would%20be%20priced%20in%20Bitcoin (accessed on 1 December 2023).
- Gervais, Arthur, Ghassan Karame, Vedran Capkun, and Srdjan Capkun. 2014. Is Bitcoin a Decentralized Currency? IEEE Security and Privacy Magazine. Available online: https://ieeexplore.ieee.org/document/6824541 (accessed on 1 December 2023).
- Gillis, Alexander S. 2021. How Is Bitcoin Used? TechTarget. Available online: https://www.techtarget.com/whatis/definition/Bitcoin (accessed on 1 December 2023).
- Goodell, John W., and Stephane Goutte. 2021. Co-movement of COVID-19 and Bitcoin: Evidence from wavelet coherence analysis. Finance Research Letters 38: 101625. [Google Scholar] [CrossRef]
- Google Trends. 2023. Available online: https://trends.google.com/trends/ (accessed on 1 December 2023).
- Hansen, Peter Reinhard, and Asger Lunde. 2005. A Forecast Comparison of Volatility Models: Does Anything Beat a Garch(1,1)? Journal of Applied Econometrics 20: 873–89. [Google Scholar] [CrossRef]
- Hong, Euny. 2022. How Does Bitcoin Mining Work? Investopedia. Available online: https://www.investopedia.com/tech/how-does-bitcoin-mining-work/ (accessed on 1 December 2023).
- Investing. 2023. MSCI All-Country World Equity Index Historical Data. Investing. Available online: https://www.investing.com/indices/msci-world-stock-historical-data (accessed on 1 December 2023).
- Kaniel, Ron, Arzu Ozoguz, and Laura Starks. 2001. The High Volume Return Premium: Cross Country Evidence. Journal of Financial Economics 103: 255–79. [Google Scholar] [CrossRef]
- Kaplanov, Nikolei M. 2012. Nerdy Money: Bitcoin, the Private Digital Currency, and the Case Against its Regulation. Loyola Consumer Law Review 25. Available online: https://lawecommons.luc.edu/cgi/viewcontent.cgi?article=1920&context=lclr (accessed on 1 December 2023).
- Kaskersky. 2022. Cryptography Definition. Available online: https://www.kaspersky.com/resource-center/definitions/what-is-cryptography (accessed on 1 December 2023).
- Kerner, Sean M. 2023. Crypto Winter Explained: Everything You Need to Know. TechTarget. Available online: https://www.techtarget.com/whatis/feature/Crypto-winter-explained-Everything-you-need-to-know#:~:text=As%20of%20Dec.,year%2Dover%2Dyear%20decline (accessed on 1 December 2023).
- Kristoufek, Ladislav. 2013. BitCoin Meets Google Trends and Wikipedia: Quantifying the Relationship between Phenomena of the Internet Era. Scientific Reports 3: 3415. [Google Scholar] [CrossRef] [PubMed]
- Maitra, Debasish, Mobeen U. Rehman, Saumya Ranjan Dash, and Sang Hoon Kang. 2022. Do cryptocurrencies provide better hedging? Evidence from major equity markets during COVID-19 pandemic. The North American Journal of Economics and Finance 62: 101776. [Google Scholar] [CrossRef]
- Mitchell, Cory. 2022. MSCI All Country World Index (ACWI): Definition and Countries. Edited by Michael J. Boyle and Kirsten Rohrs Schmitt. Investopedia. Available online: https://www.investopedia.com/terms/m/msci-acwi.asp (accessed on 1 December 2023).
- MSCI. 2023. MSCI ACWI Index. Available online: https://www.msci.com/our-solutions/indexes/acwi (accessed on 1 December 2023).
- Naimy, Viviane, and Marianne R. Hayek. 2018. Modelling and predicting the Bitcoin volatility using GARCH models. International Journal of Mathematical Modelling and Numerical Optimisation 8: 197. [Google Scholar] [CrossRef]
- Nakamoto, Satoshi. 2008. Bitcoin: A Peer-to-Peer Electronic Cash System. Available online: https://bitcoin.org/bitcoin.pdf (accessed on 1 December 2023).
- Pilbeam, Keith, and Kjell Noralf Langeland. 2014. Forecasting exchange rate volatility: GARCH models versus implied volatility forecasts. International Economics and Economic Policy 12: 127–42. [Google Scholar] [CrossRef]
- Putzhammer, Moritz. 2022. How to Allocate and Diversify Your Crypto Portfolio to Limit Risks. Trailty. Available online: https://www.trality.com/blog/diversify-your-crypto-portfolio (accessed on 1 December 2023).
- Reiff, Nathan. 2022. How to Pay with Cryptocurrency. Investopedia. Available online: https://www.investopedia.com/ask/answers/100314/what-are-advantages-paying-bitcoin.asp#:~:text=Fewer%20Fees%3A%20Many%20financial%20services,parties%20involved%20in%20a%20transaction (accessed on 1 December 2023).
- Republic of the Marshall Islands. 2018. Declaration and Issuance of Soveregn Currency Act 2018. 125ND2 P.L. 2018-53. Majuro: Republic of the Marshall Islands. Available online: https://sov.foundation/ (accessed on 1 December 2023).
- Sajeev, Kavya Clanganthuruthil, and Mohd Afjal. 2022. Contagion effect of cryptocurrency on the securities market: A study of Bitcoin volatility using diagonal BEKK and DCC GARCH models. SN Business & Economics 2: 1–21. [Google Scholar] [CrossRef]
- Sharma, Rakesh. 2022. Is There a Cryptocurrency Price Correlation to the Stock Market? Investopedia. Available online: https://www.investopedia.com/news/are-bitcoin-price-and-equity-markets-returns-correlated/#:~:text=Key%20Takeaways,tend%20to%20trend%20the%20same (accessed on 1 December 2023).
- Statista. 2022. Overall Cryptocurrency 24 Hour Trade Volume 2020–2022. Available online: https://www.statista.com/statistics/1272903/cryptocurrency-trade-volume/ (accessed on 1 December 2023).
- Susilo, Didik, Sugeng Wahyudi, and Robiyanto Robiyanto. 2020. Cryptocurrencies: Hedging Opportunities From Domestic Perspectives in Southeast Asia Emerging Markets. Sage Open 10: 2158244020971609. [Google Scholar] [CrossRef]
- The Economist. 2015. The Great Chain of Being Sure about Things. Available online: https://www.economist.com/briefing/2015/10/31/the-great-chain-of-being-sure-about-things (accessed on 1 December 2023).
- Tse, Wai Man. 2021. Crypto-Asset Pricing Models and Their Efficiency-Dependent Trading Strategies. SSRN Electronic Journal. Available online: https://papers.ssrn.com/sol3/papers.cfm?abstract_id=3898534 (accessed on 1 December 2023).
- Urquhart, Andrew. 2018. What causes the attention of Bitcoin? Economics Letters 166: 40–44. [Google Scholar] [CrossRef]
- Usbek & Rica. 2020. How Will Cryptocurrencies Impact National Currencies?—A USD 120 Billion Question. Available online: https://usbeketrica.com/en/article/how-will-cryptocurrencies-impact-national-currencies-a-120-billion-question (accessed on 1 December 2023).
- Wall Street Journal. 2023. EUR to USD. Available online: https://www.wsj.com/market-data/quotes/fx/EURUSD/historical-prices (accessed on 1 December 2023).
- World Health Organization. 2020. WHO Director-General’s Opening Remarks at the Media Briefing on COVID-19—11 March 2020. Available online: https://www.who.int/director-general/speeches/detail/who-director-general-s-opening-remarks-at-the-media-briefing-on-covid-19---11-march-2020 (accessed on 1 December 2023).
- Yermack, David. 2015. Is Bitcoin a Real Currency? An Economic Appraisal. In Handbook of Digital Currency. Cambridge: Academic Press. [Google Scholar] [CrossRef]
Figure 1.
(a) Global cryptocurrency charts: major crypto assets by percentage of total market capitalization 2022 (Source: CoinMarketCap 2023b). (b) Global cryptocurrency charts: total cryptocurrency market cap 2022 (Source: CoinMarketCap 2023b).
Figure 1.
(a) Global cryptocurrency charts: major crypto assets by percentage of total market capitalization 2022 (Source: CoinMarketCap 2023b). (b) Global cryptocurrency charts: total cryptocurrency market cap 2022 (Source: CoinMarketCap 2023b).
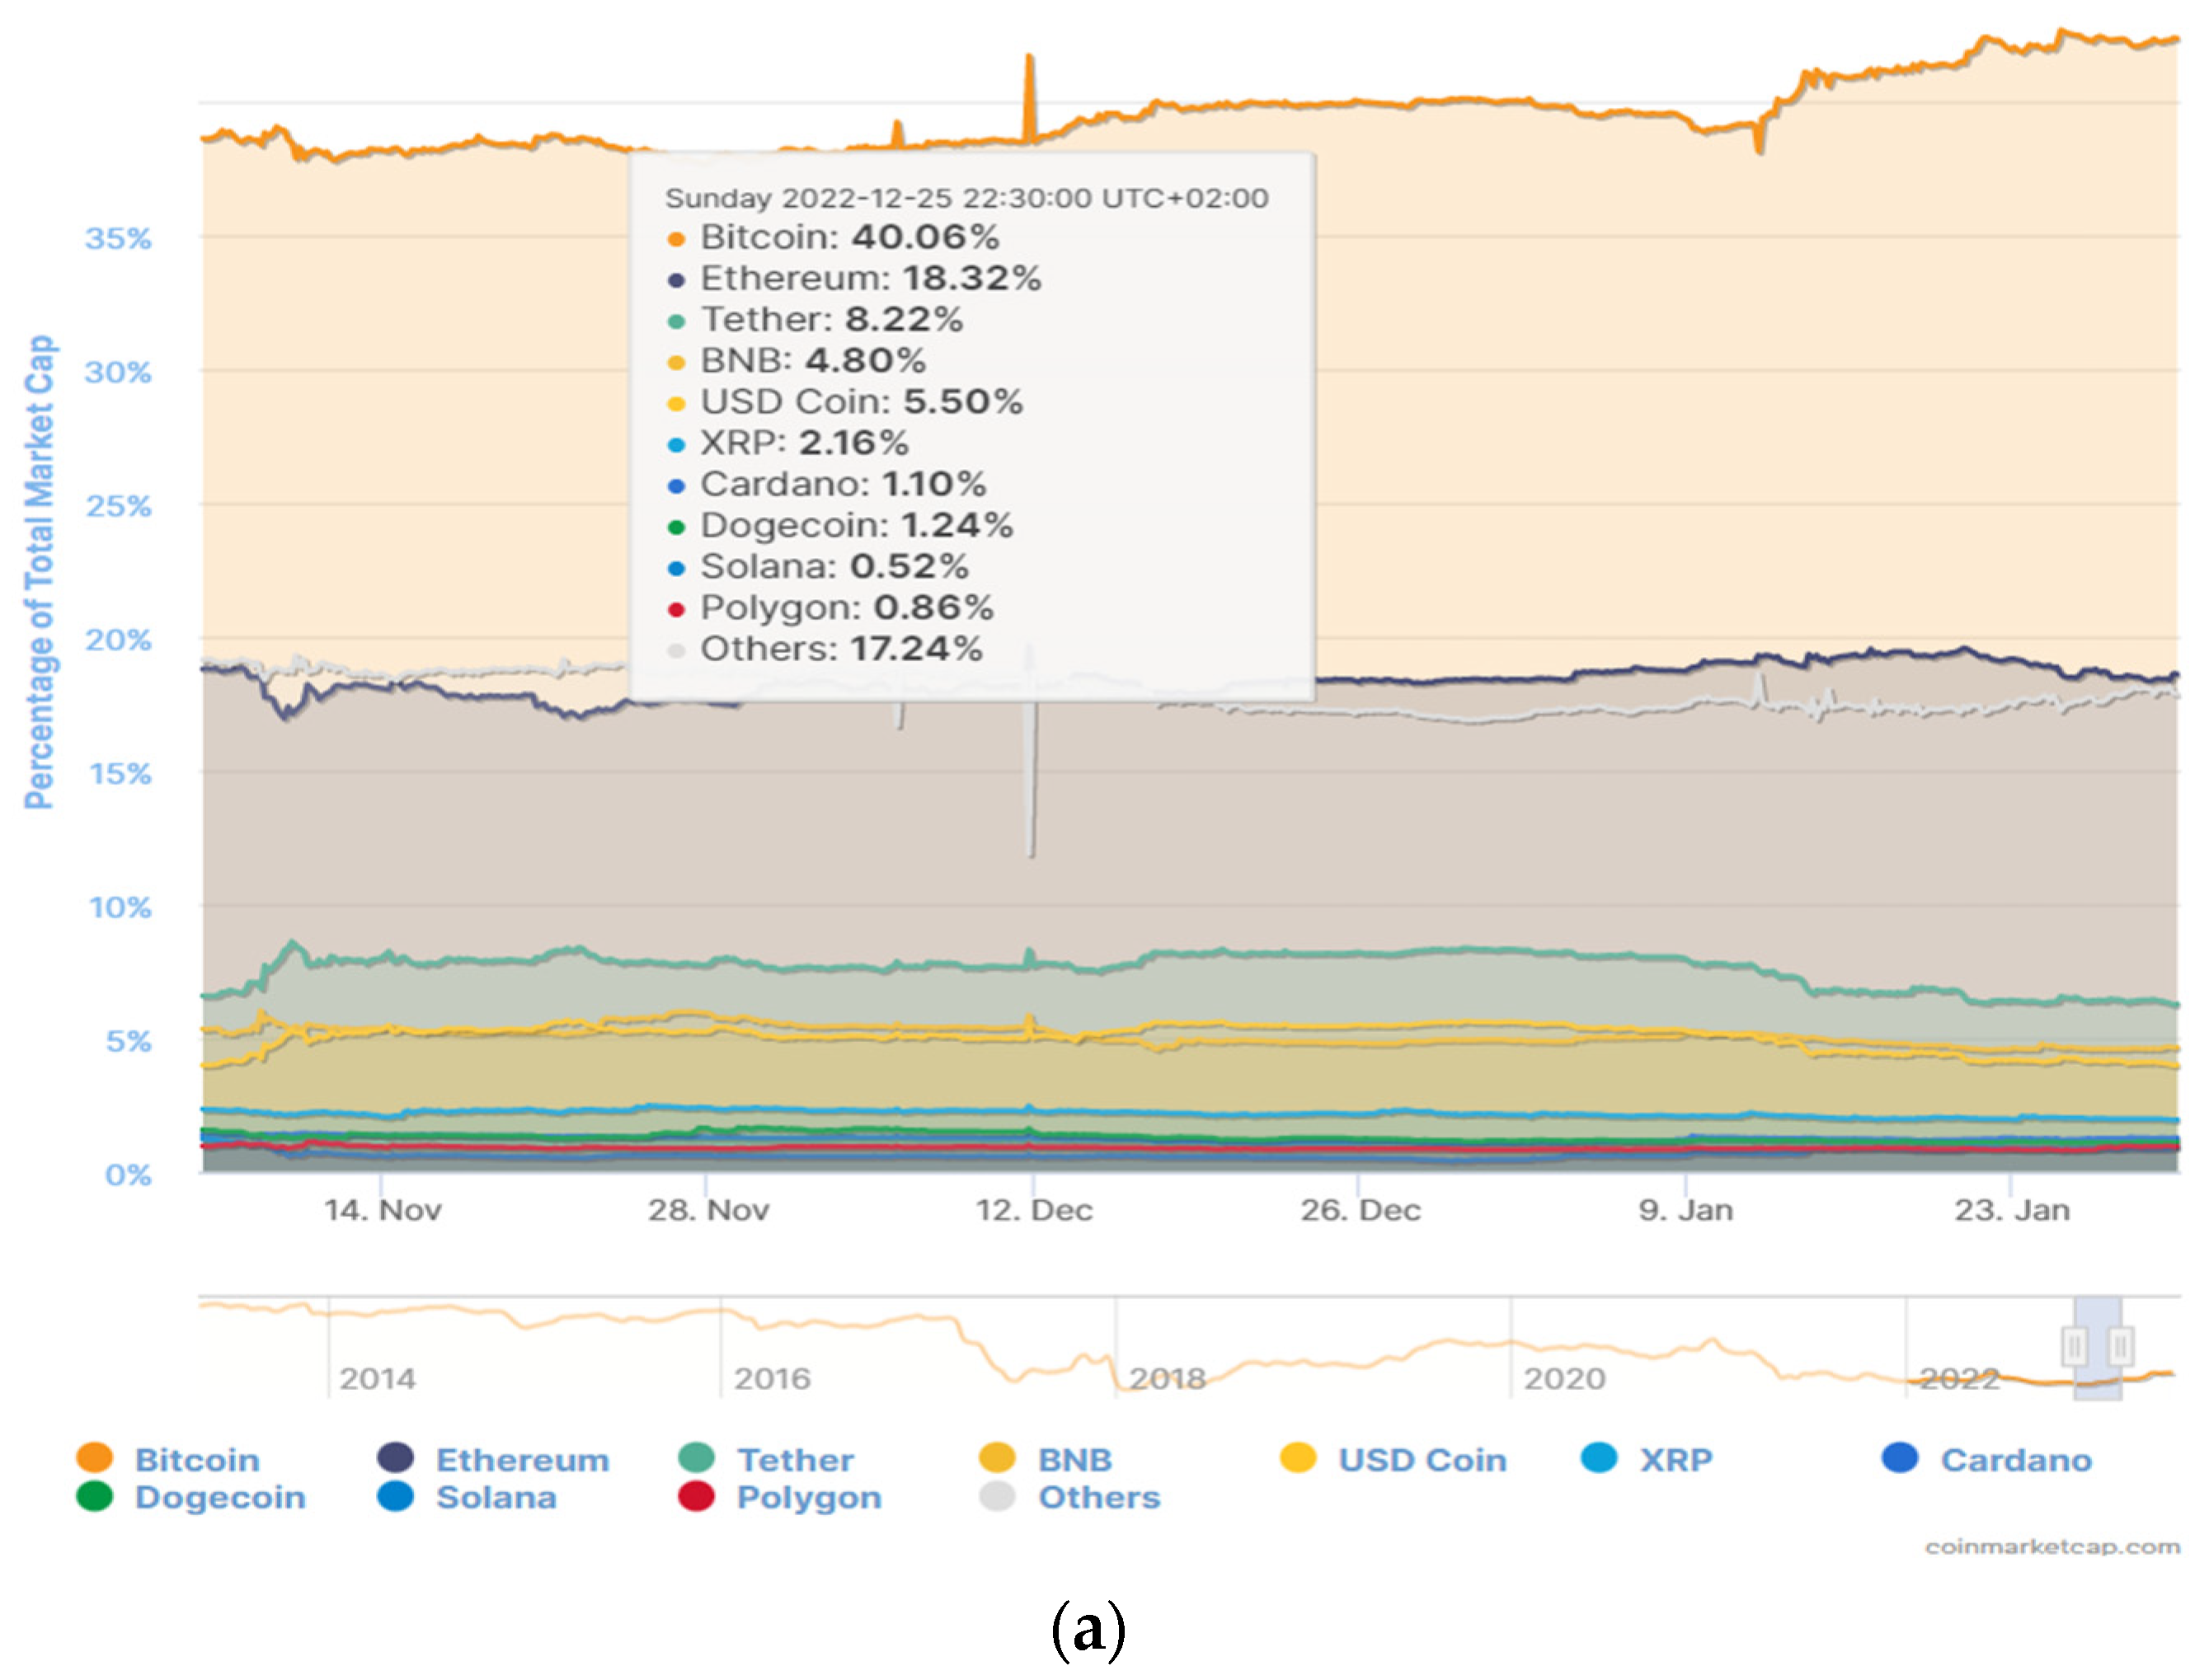

Figure 2.
Overall cryptocurrency daily trade volume 2020–2022 in USD billions (Source: Statista 2022).
Figure 2.
Overall cryptocurrency daily trade volume 2020–2022 in USD billions (Source: Statista 2022).


Table 1.
Top ten cryptocurrencies with the largest market capitalization in December 2022.
| Currency (Trading Code) | Market Cap (in USD Billions) | Price on 25 December 2022 | Circulating Supply |
|---|---|---|---|
| Bitcoin (BTC) | USD 324.09 | USD 16,841.99 | 19,243,168 BTC |
| Ether/Ethereum (ETH) | USD 149.17 | USD 1218.96 | 122,373,866 ETH |
| Tether (USDT) | USD 66.24 | USD 0.9999 | 66,247,647,090 USDT |
| USD Coin (USDC) | USD 44.35 | USD 1.0001 | 44,345,240,440 USDC |
| Binance Coin (BNB) | USD 38.89 | USD 243,14 | 159,965,769 BNB |
| XRP/Ripple (XRP) | USD 17.44 | USD 0.3464 | 50,343,500,506 XRP |
| Binance USD (BUSD) | USD 17.39 | USD 1.0003 | 17,388,891,975 BUSD |
| Dogecoin (DOGE) | USD 10.08 | USD 0.07595 | 132,670,764,300 DOGE |
| Cardano (ADA) | USD 8.95 | USD 0.2593 | 34,503,744,627 ADA |
| Polygon (MATIC) | USD 6.94 | USD 0.7951 | 8,734,317,475 MATIC |
Source: CoinMarketCap (2022).
Table 2.
Descriptive statistics.
| Variable | N Statistic | Min | Max | Mean | St. Dev. |
|---|---|---|---|---|---|
| BTC CCY Return | 365 | 0.1532 | 0.1562 | 0.0015 | 0.0389 |
| BTC Trad. Vol. | 365 | 83,528 | 13,328,655 | 1,389,562 | 1,418,026 |
| BTC Inf. Demand | 365 | 4 | 100 | 38.2400 | 20.339 |
| ETH CCY Return | 365 | 0.2552 | 0.3347 | 0.0037 | 0.056 |
| ETH Trad. Vol. | 365 | 217,365 | 209,193,867 | 18,558,848 | 24,790,920 |
| ETH Inf. Demand | 365 | 2 | 100 | 34.08 | 20.856 |
| XRP CCY Return | 365 | 0.1475 | 0.6008 | 0.0073 | 0.0684 |
| XRP Trad. Vol. | 365 | 24,294,676 | 51,308,361,534 | 4,309,759,544 | 5,765,491,690 |
| XRP Inf. Demand | 365 | 1 | 100 | 33.58 | 24.605 |
| MSCI ACWI Index | 365 | 0.0476 | 0.0527 | 0.0001 | 0.0094 |
| EUR–USD Close | 365 | 0.9689 | 1.2458 | 1.1309 | 0.0561 |
Table 3.
GARCH (1,1) model: mean and variance equations for BTC.
| Variable | Coeff. | Std. Error | z-Statistic | Prob |
|---|---|---|---|---|
| Diff_Ln_InfoDemand | 0.233828 | 0.384563 | 0.609036 | 0.5432 |
| Diff_Ln_Trading Vol. | 1.741995 | 0.200644 | 8.682016 | 0.0000 |
| Diff_Ln_Eur-USD | 4.778128 | 7.838159 | 0.609598 | 0.5421 |
| Diff_Ln_MSCI-ACWI | 0.069719 | 0.048631 | 1.433638 | 0.1517 |
| Variance Equation | ||||
| C | 1.695585 | 0.239675 | 7.074521 | 0.0000 |
| RESID(-1)^2 | 0.276874 | 0.086478 | 3.201664 | 0.0014 |
| GARCH(-1) | 0.069649 | 0.103444 | 0.673298 | 0.5008 |
| Model Information | ||||
| R-Squared | 0.110254 | Mean Dependent Var | −0.004006 | |
| Adjusted R-Squared | 0.102860 | S.D. Dependent Var | 1.740754 | |
| S.E. of Regression | 1.648798 | Akaike Info Criterion | 3.753477 | |
| Sum of Squared Resid. | 981.3910 | Schwarz Criterion | 3.828270 | |
| Log Likelihood | −678.0096 | Hannan–Quinn Crit. | 3.783201 | |
| Durbin–Watson Stat. | 3.022854 | |||
Table 4.
GARCH (1,1) model: mean and variance equations for ETH.
| Variable | Coeff. | Std. Error | z-Statistic | Prob |
|---|---|---|---|---|
| Diff_Ln_InfoDemand | 0.547060 | 0.313684 | 1.743984 | 0.0812 |
| Diff_Ln_Trading Vol. | 1.238336 | 0.178083 | 6.953707 | 0.0000 |
| Diff_Ln_Eur-USD | 1.643485 | 7.930122 | 0.207246 | 0.8358 |
| Diff_Ln_MSCI-ACWI | 0.036809 | 0.042276 | 0.870689 | 0.3839 |
| Variance Equation | ||||
| C | 1.823165 | 0.279923 | 6.513089 | 0.0000 |
| RESID(-1)^2 | 0.228080 | 0.082184 | 2.775226 | 0.0055 |
| GARCH (-1) | 0.139083 | 0.099900 | 1.392216 | 0.1639 |
| Model Information | ||||
| R-Squared | 0.126009 | Mean Dependent Var | −0.006010 | |
| Adjusted R-Squared | 0.118746 | S.D. Dependent Var | 1.824365 | |
| S.E. of Regression | 1.712625 | Akaike Info Criterion | 3.873793 | |
| Sum of Squared Resid. | 1058.843 | Schwarz Criterion | 3.948585 | |
| Log Likelihood | −699.9672 | Hannan–Quinn Crit. | 3.903516 | |
| Durbin–Watson Stat. | 2.906306 | |||
Table 5.
GARCH (1,1) model: Mean and Variance Equations for XRP.
| Variable | Coeff. | Std. Error | z-Statistic | Prob |
|---|---|---|---|---|
| Diff_Ln_InfoDemand | −0.077299 | 0.245145 | −0.315321 | 0.7525 |
| Diff_Ln_Trading Vol. | 0.933109 | 0.120121 | 7.768086 | 0.0000 |
| Diff_Ln_Eur-USD | −9.846853 | 7.045207 | −1.397667 | 0.1622 |
| Diff_Ln_MSCI-ACWI | −0.001481 | 0.047430 | −0.031235 | 0.9751 |
| Variance Equation | ||||
| C | 1.490260 | 0.210390 | 7.083314 | 0.0000 |
| RESID(-1)^2 | 0.352556 | 0.086333 | 4.083663 | 0.0000 |
| GARCH(-1) | 0.075063 | 0.087293 | 0.859898 | 0.3898 |
| Model Information | ||||
| R-Squared | 0.106824 | Mean Dependent Var | −0.000125 | |
| Adjusted R-Squared | 0.099401 | S.D. Dependent Var | 1.709963 | |
| S.E. of Regression | 1.622753 | Akaike Info Criterion | 3.721613 | |
| Sum of Squared Resid. | 950.6306 | Schwarz Criterion | 3.796405 | |
| Log Likelihood | −672.1943 | Hannan–Quinn Crit. | 3.751336 | |
| Durbin–Watson Stat. | 2.965242 | |||
Disclaimer/Publisher’s Note: The statements, opinions and data contained in all publications are solely those of the individual author(s) and contributor(s) and not of MDPI and/or the editor(s). MDPI and/or the editor(s) disclaim responsibility for any injury to people or property resulting from any ideas, methods, instructions or products referred to in the content. |
© 2023 by the authors. Licensee MDPI, Basel, Switzerland. This article is an open access article distributed under the terms and conditions of the Creative Commons Attribution (CC BY) license (https://creativecommons.org/licenses/by/4.0/).
Share and Cite
MDPI and ACS Style
Kufo, A.; Gjeci, A.; Pilkati, A. Unveiling the Influencing Factors of Cryptocurrency Return Volatility. J. Risk Financial Manag. 2024, 17, 12. https://doi.org/10.3390/jrfm17010012
AMA Style
Kufo A, Gjeci A, Pilkati A. Unveiling the Influencing Factors of Cryptocurrency Return Volatility. Journal of Risk and Financial Management. 2024; 17(1):12. https://doi.org/10.3390/jrfm17010012
Chicago/Turabian StyleKufo, Andromahi, Ardit Gjeci, and Artemisa Pilkati. 2024. "Unveiling the Influencing Factors of Cryptocurrency Return Volatility" Journal of Risk and Financial Management 17, no. 1: 12. https://doi.org/10.3390/jrfm17010012