Abstract
This paper examines the dynamic relationship between foreign direct investment (FDI), economic growth, and trade openness in BRICS countries. Our research aims to address a significant gap in the literature by focusing on this crucial group of emerging nations, given their substantial contribution to the global economy. Annual data for these economies from 1991 to 2020 were collected from various secondary sources. This study employed the Bayesian VAR framework to investigate the panel data. The Pedroni residual cointegration test was used to check the existence of a long-run relationship between FDI and economic growth. The results provided evidence that foreign direct investment (FDI) does exhibit a substantial correlation with economic growth in the short run. However, no long-run relationship was found in the case of BRICS economies. This research contributes to methodological innovation by introducing the Bayesian VAR framework, offering a deeper understanding of the dynamic interactions among these key variables. The incorporation of this framework yields estimates that are both stable and reliable, which is certainly a novelty of this paper. The findings of this study have implications suggesting that policymakers from these emerging economies should establish mechanisms that will monitor the short-term impacts of FDI and adjust policies accordingly to maximize economic gains. The government should tailor policies to the specific circumstances of each country for sustainable economic development.
1. Introduction
Foreign direct investment (FDI) and economic growth have increased substantially in recent decades, especially in emerging nations (Khan and Mehboob 2014; Irshad and Qayed 2022). Developing nations are competing for foreign direct investment (FDI) in an era of rising global inequality (Banday et al. 2021). This is because foreign direct investment (FDI) is perceived as a significant driver of economic growth since it improves technology, brings employment opportunities, expands trade, boosts commerce, and facilitates global market integration (Atique et al. 2004; Tiwari and Mutascu 2011). When a person or corporation from one nation invests money in the economy of another country, they are undertaking a foreign direct investment, or FDI (Hansen and Rand 2006; Herzer 2012). This involves the infusion of foreign-based funds into a commercial venture that operates in a different country of origin from the investor (Johnson 2006). The ‘source’ country is the nation from which the funds are invested, while the ‘host’ or ‘receiver’ country is the nation that ultimately receives the investment inflows. Foreign direct investment (FDI) is defined by the World Bank as investments made outside of an investor’s home economy with the intention of acquiring a long-term stake in or effective control of a business enterprise. FDI has proven to be the most preferred choice over the other modes of investment due to its stable nature (Nistor 2014). The governments of developing countries have now realized the significance of increased FDI inflows. They try to attract foreign investments through numerous government policies and the adoption of bilateral investment treaties (Herzer 2012). Host nations open up their economies and provide various incentives to attract more and more foreign direct investment into their countries (Hansen and Rand 2006; Bhandari et al. 2007). This is mainly carried out to reap the benefits of incoming investment by the recipient country. Therefore, it can be argued that FDI serves as one of the essential components for the process of economic integration as it strengthens ties and the long-term advantages of cooperation between multiple countries (Mehic et al. 2013). It is regarded as the main source of economic sustainability for developing nations (Omri 2014).
Incoming foreign direct investment (FDI) is seen as a vital source of capital by developing nations since it boosts a wide range of macroeconomic parameters, including domestic investment, exports, and the incorporation of new technology into the private sector, which ultimately contributes to economic expansion and increased productivity (Akinmulegun 2012; Mahmoodi and Mahmoodi 2016). The investment inflows generate employment opportunities and stimulate the economy by either the opening up of a local manufacturing unit or the acquiring of an existing one. The extent of these benefits, however, is still being determined since they are greatly dependent on the quality of the technology supplied by foreign companies and the adaptability of the recipient nation (Rakhmatullayeva et al. 2020).
The present research study aims to understand the inter-relationship between FDI inflows, economic growth, and trade openness in the BRICS economies, as these nations have the potential to overtake established economies largely owing to their size, high population, and geographic regions (O’Neill 2001). The emerging economies came into existence in the year 2001, when American economist Jim O’Neill created the acronym BRIC, formed by four countries: Brazil, Russia, India, and China. Later, South Africa was added to the BRIC group. The official process for South Africa’s inclusion into the organization started in August 2010. On 24 December 2010, South Africa formally joined the BRIC nations after receiving a formal invitation from the group. To reflect South Africa’s inclusion in the expanded group, the name of the organization was changed to BRICS—with an “S” at the end. At the 15th BRICS summit held in Johannesburg, South Africa, from 23–24 August (2023), the member nations decided to expand their economic collaboration by admitting six new members, namely Argentina, Egypt, Ethiopia, Iran, Saudi Arabia, and the UAE. The new membership will be effective from 1 January 2024. With this expansion, the BRICS economies will constitute nearly 30% of the world’s GDP and a 46% share of the global population. Their combined share in per-day oil production will increase from 20.4% to 43.1%. By the end of year 2022, the original BRICS members accounted for 18.28% of the global export of goods and services. With the inclusion of the six new economies, the BRICS alliance will contribute a 20.58% share of global exports. Among the 11 members, China is the leading contributor with 12% of global exports, followed by India at 2.5%. Clearly, the BRICS countries have taken on a significant role as the producers of products and services in the global economy for a variety of reasons.
According to the latest World Economic Outlook (2023) report released by the International Monetary Fund (IMF), China and India will dominate global GDP growth in the next five years. Based on the projections made by the WEO report in Table 1 below, China will account for 22.6% of global GDP growth, India for 12.9%, and the United States for 11.3%. It is worth noting that China’s contribution to global growth is still likely to be enormous compared to that of the United States and India. Of all countries, the BRICS (Brazil, Russia, China, India, and South Africa) nations together are expected to contribute almost 40% of the world’s growth through the year 2028. The share of global GDP contributed by BRICS countries has increased from 18% in 2010 to 26% in 2021. Interestingly, the population growths of BRICS countries have slowed relative to the global average, while their share of global GDP has been growing, resulting in BRICS countries’ per capita GDP growing faster than the global per capita GDP.

Table 1.
World economy growth contribution in 2023–2028.
Further, Figure 1 depicts the share of global GDP using purchase-power parity from 1992 to 2028. The data show a continuous decline in the share of G7 nations, consisting of Canada, France, Germany, Italy, Japan, the United Kingdom, and the United States. The BRICS nations have shown a consistent rise in their share of the global GDP since 1992 and have outpaced the G7 nations since 2020.
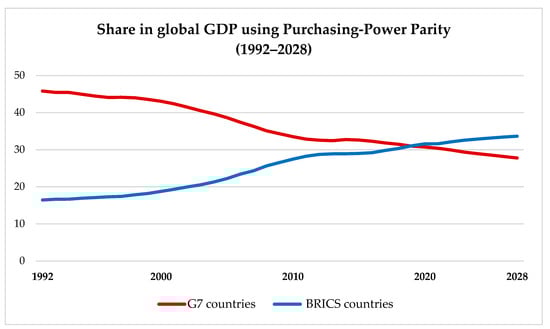
Figure 1.
Growth contribution comparison between G7 and BRICS nations.
The future predictions for 2023–2028 will see an increase in BRICS nations’ GDP growth share while seeing a declining trend for the G7 nations. This is why investors from around the globe are currently drawn to the BRICS nations. These nations are characterized by massive populations, promising consumer markets, rapid economic expansion, vast land masses, etc., which make them the investors’ first choice of destination. By the middle of this century, the combined economies of the BRICS countries are projected to have grown to be the biggest in the world. Together, the BRICS nations have shown continuous growth and formed a strong economic power (Nistor 2015).
Additionally, the trends in FDI flows in BRICS nations show that these countries have remained a major attraction for investors in recent times. Table 2 below presents the total flow of foreign direct investment in BRICS countries, namely Brazil, Russia, India, China, and South Africa. The latest data for these nations were procured for 2022 from the World Bank Database.
Table 2.
FDI Inflows in BRICS countries (2022).
China has received the highest investment among all the five BRICS countries, with a total inflow of funds amounting to USD 180,167 million. China is followed by Brazil and India with FDI inflows equal to USD 91,502 and 49,916 million, respectively. The investment received by South Africa is considerably low as compared to the other BRICS nations, amounting to only USD 8803 million. Russia remains an exception with negative incoming inflows in 2022 due to the prolonged Ukraine-Russia war, which caused the FDI flows in this region to follow a downward trajectory. Subsequently, Figure 2 below shows the cumulative FDI inflows in BRICS countries from 1991 to 2020. Over the past thirty years, China has received more FDI than the other four nations combined, while South Africa has attracted the least.
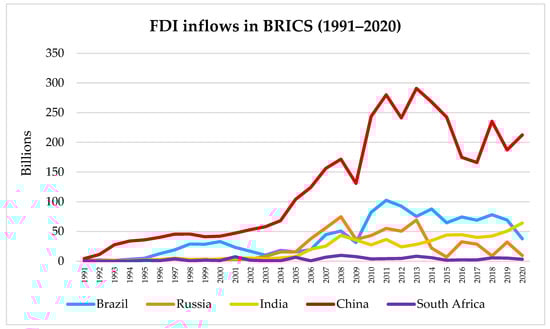
Figure 2.
FDI inflows in BRICS countries.
Thus, studying the nexus between FDI, economic growth, and trade openness in BRICS nations is critically important. These nations collectively represent a significant portion of the global economy, and understanding the dynamics of FDI, economic growth, and trade openness within them will provide valuable insights into broader economic trends.
2. Literature Review
Investment of any kind, including FDI, is believed to boost the host country’s economic growth (Samad 2009; Pegkas 2015). Foreign direct investment (FDI) is widely regarded as the most viable option for boosting economies in emerging markets because it provides access to a pool of trained managers, boosts the competitiveness of local firms, and broadens the scope of their exports (Borensztein et al. 1998; Zhang 2001; Strat et al. 2015; Iqbal et al. 2018). The effect of FDI on economic development from 1970–2001 is examined by Atique et al. (2004). The findings traced that the impact of FDI was higher on the growth rate under the export-promotion trade regime in contrast to the import-substitution trade regime. Likewise, Makki and Somwaru (2004) analyzed the impact of foreign direct investment (FDI) on economic growth in 66 developing nations. The results indicated a positive correlation between FDI and GDP growth rates. Similar results were reported by Lee (2007) for 11 OECD countries for the period 1971–1999. The study finds a significant and robust long-term relationship between inbound foreign direct investment and the growth productivity of the host nations. Several other studies have also examined the long-term relationship between FDI and economic growth (De Mello 1999; Hansen and Rand 2006; Narayanamoorthy et al. 2008; Tiwari and Mutascu 2011; Saidi et al. 2023). Naveed and Shabbir (2006) studied the impact of foreign direct investment (FDI) and trade openness on gross domestic product (GDP). This study found that trade openness positively affects GDP, while FDI negatively affects GDP. The study by Alam et al. (2022) pointed out that FDI can impact economic growth, affecting both demand and supply in the case of India.
Another major study conducted by Mehic et al. (2013), using the Prais–Winsten regression technique for seven southeast European countries for the period 1998–2009, revealed that FDI is a crucial factor that enhances economic growth. In contrast, the impact of domestic capital formation on economic growth is relatively weaker. Other factors that were also helpful in determining economic growth included trade openness and macroeconomic stability, denoted by the inflation rate. Likewise, Khan and Mehboob (2014) evaluated the impact of FDI on gross domestic product (GDP) using balanced panel data from 1992–2010 in 59 countries. The study emphasized the importance of liberal policies for the free flow of capital across nations. Using a growth model structural theory, Omri (2014) tried to evaluate the effect of both foreign and domestic investment on economic growth in the MENA countries. An indirect relationship was observed between the countries’ financial development and economic growth via foreign investment. The exchange rate and degree of openness also contributed significantly to the development of MENA countries. Sunde (2017) recognized the correlation between FDI, exports, and economic growth in the South African economy and concluded that a strong macroeconomic environment will help to attract more investment from other countries. Other variables, like trade openness and foreign exchange, also favorably impacted economic growth (Fadhil and Almsafir 2015; Alam et al. 2022). Similarly, Yimer (2023) examined the growth effects of FDI on Africa from 1990 to 2016 using the error correction model, keeping in mind the heterogeneity of each country. The study revealed that the impact of FDI on growth differs for each country. Shell and Zheng (2015) used the globalization and institutional quality indexes to study their impact on international capital inflows from 1970–2010. The results showed that both variables have a significant positive relationship with capital inflows. The research conducted by Kim et al. (2018) pointed out the role of regional vs. global savings in financing domestic investment, leading to increased international capital flows from 1980 to 2014 in 141 nations worldwide. Likewise, Athari and Adaoglu (2019) explored the various determinants of capital inflows for a sample of 135 countries across the globe at different stages of economic development, emphasizing the role of institutional quality, accountability, and corporate ethics. In another study, Athari et al. (2020) investigated the role of a country’s competitiveness on the cross-border flow of capital by using the global competitiveness index at different stages of economic development from 2006–2014 for 133 countries. The findings revealed a strong positive relationship between competitiveness and capital flows, although, the degree of its impact varies across different development stages and country risk levels.
The study by Asafo-Agyei and Kodongo (2022) highlighted the impact of FDI on the economic growth of sub-Saharan African countries. The research suggested that for foreign direct investment (FDI) to contribute to economic growth significantly, countries must possess a minimum capacity to absorb the growth-enhancing benefits of FDI. Further, the study by Nupehewa et al. (2022) also investigated the causal relationship between foreign direct investment (FDI) and the economic growth of seven regions, covering 117 countries, from 2010 to 2020 using the Granger causality approach and panel VAR/block exogeneity test. The empirical findings revealed a bidirectional causality between FDI and economic growth globally and in the Asian region. In contrast, the causality is unidirectional in the American region. Similar results were reported by Kumari et al. (2023) for time series data from 1985–2018 in the case of India. The study revealed a bidirectional causality from FDI to economic growth, whereas there is no bidirectional causality between trade openness and economic growth. For countries in southeast Asia (SEA) and south Asia (SA), the study by Rao et al. (2023) investigated the interrelationship among foreign aid, foreign direct investment (FDI), and economic growth from 1980–2016. The results indicated a negative association between foreign aid and both FDI and economic growth. Conversely, FDI was found to have a positive influence on economic growth.
On the other hand, some research studies show a negative impact of FDI on economic growth, while others find no meaningful association between the two variables. While looking at developing economies in the 1970s and 1980s, Saltz (1992) discovered that foreign direct investment (FDI) has a negative impact on GDP growth. Similarly, incoming investment from overseas has a detrimental impact on the economy, according to a study by Mencinger (2003) that investigated the eight EU member states during 1994–2001. Herzer (2012) contributed to the existing literature by examining the impact of foreign direct investment on the growth of 44 developing economies with the help of heterogeneous panel co-integration techniques. The findings showed a negative relationship between the two variables, largely owing to country-specific differences in the growth effects of foreign direct investment. Using GMM and OLS methodology, Anyanwu and Yameogo (2015) examined the correlation between FDI and economic growth in west African countries from 1970 to 2010. They discovered a negative correlation between the two variables. The results were consistent with the previous studies by Mencinger (2003) and Herzer (2012). In recent times, the study by Alvarado et al. (2017) for Latin American countries concluded that incoming investment from overseas is not an appropriate vehicle of growth and development except in the high-income group nations. Additionally, the results of the study by Saidi et al. (2023) suggested that the quality of governance in developing countries does not significantly affect foreign direct investment (FDI) and economic growth.
Furthermore, using data from 72 countries between 1960 and 1995, Carkovic and Levine (2005) showed a weak association between FDI and GDP growth. Likewise, Herzer and Klasen (2008) for 28 developing countries from 1970–2003; Nath (2009) for 13 transition economies of central and eastern Europe and the Baltic region during the period 1991–2005; Louzi and Abadi (2011) for Jordan for the period 1997–2006; Tekin (2012) for the case of the least-developed countries during the period 1970–2009; Belloumi (2014) for the case of Tunisia during the period 1970–2008; and more recently, Mahembe and Odhiambo (2016) for the case of low-income SADC countries during the period 1980–2012 reported a weak or no significant impact of FDI on economic growth.
The findings of the study by Choi and Baek (2017) implicated that the gradual increase in foreign direct investments (FDI) had little impact on productivity over the decades. The economic growth increased over the years, but not as much as the increase in incoming FDI. Similarly, Bermejo Carbonell and Werner (2018) for India and Golitsis et al. (2018) for Albania highlighted that only a small role is played by inbound investment from the MNCs of advanced nations in the growth of the economy, despite the vast literature suggesting otherwise. It is important to note that the positive impact of FDI is not a fact; it may vary widely depending on factors like the political and macroeconomic stability of the host country, as well as its institutional capability, infrastructure, and educational system (Rakhmatullayeva et al. 2020).
Evidently, a considerable amount of the literature has empirically examined the association between foreign direct investment (FDI), economic growth, and trade openness individually for advanced nations. However, only a few researchers have studied the causality between these variables for the BRICS economies, given their increasing role in the world’s economic development in the coming years. The paper analyzes explicitly how the relationship between FDI, economic growth, and trade openness has evolved in the backdrop of changes in global economic conditions, particularly regarding the 1997 Asian financial crisis, the 2008 US sub-prime crisis, and the era of quantitative easing by the Federal Reserve Bank of USA. This is certainly a contribution to the existing literature in terms of a larger data set.
Keeping this in mind, the current research study investigates the interrelationship among the given three variables, namely FDI, economic growth, and trade openness, using the Bayesian VAR framework and the Pedroni residual cointegration test.
Therefore, based on an extensive review of the literature, the present study formulated the following hypotheses:
H1.
There is no co-movement between FDI, economic growth, and trade openness in BRICS nations.
H2.
There is no long-term dynamic relationship between FDI, economic growth, and trade openness in BRICS nations.
3. Data and Methodology
The current study aims to analyze the dynamic relationship between FDI, economic growth, and trade openness in BRICS economies, namely Brazil, Russia, China, India, and South Africa. For this purpose, annual data were used from 1990–1991 to 2020–2021, i.e., three decades from various secondary sources such as World Bank indicators, OECD statistics, and Penn Table (Version 10.0). Panel data estimation was employed in the study to capture the dynamic behavior of the parameters and provide a more efficient estimation and more information about the parameters. Based on the available literature in our study, a set of potential variables were identified as the determinants of both foreign direct investment and economic growth in the BRICS countries. Table 3 below discusses the details about the selected variables, measurements, and data sources. The annual data for all the variables were converted into their natural log form to obtain a more normalized data set. The data obtained are an estimated balanced panel data.
Table 3.
Description of the variables.
For the given panel dataset, this study employed the Bayesian vector autoregression (VAR) model for the estimation. The BVAR is a statistical approach that extends the standard VAR model by incorporating Bayesian inference principles. It employs prior beliefs about the relationships between variables, allowing for more effective parameter estimation and model selection, especially in cases with limited data. The Bayesian VAR model holds advantages over the standard VAR model, particularly in terms of robustness and avoiding overparameterization. The issue of overparameterization in the traditional VAR model results in parameter instability and imprecise estimates. Also, cutting back on variables in the VAR model to reduce the parameters may lead to an omitted variable bias, adversely impacting the structural analysis and forecasting. For this reason, Bayesian VAR modeling was used for the statistical analysis in this paper, as this technique has the ability to handle overparameterization issues. In standard VAR, determining the lag order becomes challenging as the number of variables grows, often leading to excessive parameters and unreliable estimates. Bayesian VAR addresses this by incorporating prior information, enabling more efficient parameter estimation and model selection. Moreover, Bayesian VAR enhances robustness by explicitly modeling uncertainty through posterior distributions. This robustness is valuable in small-sample situations or when data exhibit non-standard characteristics. Thus, Bayesian VAR mitigates overparameterization challenges and provides a robust framework for more reliable and accurate economic and financial analyses. Also, instead of using the factor method and high-frequency data, our paper adopted the Bayesian approach to address the issue of loss of precision, which is certainly a novelty aspect of this research paper.
The Bayesian vector autoregression (VAR) model can be expressed in matrix form as follows. Let yt be a p × 1 vector of the observed variables at time t, where p is the number of variables in the system. The VAR model with lag order k can be written as:
where,
yt = A0 + A1yt−1 + A2yt−2 + … + Akyt−k + εt,
- A0 is a p × 1 intercept vector,
- A1, A2, …, Ak are p × p coefficient matrices for lags 1 through k,
- yt−1, yt−2, … yt−k are lagged values of the vector yt,
- εt is a p × 1 vector of error terms at time t.
In the Bayesian VAR, priors are assigned to the coefficients A0, A1, …, Ak and the covariance matrix of εt, incorporating prior beliefs or information about the parameters. The posterior distribution of these parameters is then estimated using Bayesian methods, such as Markov Chain Monte Carlo (MCMC) techniques, allowing for a probabilistic assessment of parameter uncertainty. This approach offers greater flexibility and robustness than traditional VAR models by accounting for uncertainty and incorporating prior knowledge into the modeling process, leading to more stable and reliable parameter estimates. Thus, obtaining stable and reliable parameter estimates using the Bayesian VAR is another novelty of this paper.
The values of four parameters (often termed hyperparameters) must be chosen before a Bayesian VAR can be estimated using the Minnesota prior: μ1, λ1, λ2, and λ3. The persistence of the variables is represented by μ1. This value is zero when the variables are stable and near to one when the variables have a unit root. If the variables are considered stationary, their number is zero; otherwise, it is often close to one. All variables are considered to be persistent at the same rate. The degree of certainty in the given priors is denoted by λ1. The certainty ensures that the prior accurately identifies the nature of the data. While a value closer to zero indicates certainty, values of ten or higher indicate uncertainty about the nature of the data. The magnitude of the cross-variable effect is given by λ2. Simply put, it establishes the strength of the relationship between the present value of variable j and the previous values of variable i in the model. It accepts values ranging from 0 to 1. The strength of the cross-variable impact increases as the value approaches 1. The decay rate of a variable’s own lags is denoted as λ3. As the value of this parameter approaches 1, the impact of a variable’s previous values on its current state diminishes. The closer this parameter is to 1, the less it is impacted by its previous values.
4. Empirical Results
This section deals with all the research techniques and tools employed in this study and the results obtained. This paper used panel data analysis techniques to estimate the dynamic behavior of the determinants of FDI in the BRICS countries. The research began with a series of preliminary analyses, including descriptive statistics, a correlation analysis, and a panel unit root test, before carrying out the Bayesian VAR analysis. The descriptive statistics are displayed in Table A1 in Appendix A. Table 4 below presents the results of the correlation matrix for the variables considered.
Table 4.
Correlation Matrix.
The results of the correlation matrix in Table 4 show that the independent variables had a low correlation amongst them, apart from FDI and GDP. However, the variance inflation factor (VIF) for GDP was 1.244267. Thus, in conclusion, the multicollinearity between the given independent variables was very low since the VIF values were within the (less than 10) range.
4.1. Panel Unit Root Test
The panel unit root test results are shown in Table 5 below. To examine the stationarity and establish the integration level of the chosen variables, this study used the Levin, Liu, and Chu (LLC) test (Levin et al. 2002). The null hypothesis of this test assumes the presence of a common unit root in the panel, whereas the alternative hypothesis indicates the stationarity of the data. According to the LLC test, cross-sectional units are assumed to be unrelated to one another. The results indicate that all the variables, namely, lnFDI, lnGDP, lnTO, lnEXR, lnIF, and lnHC, were I(0) variables, i.e., stationary in their levels as per the Levin, Liu, and Chu test statistic.
Table 5.
Panel unit root test results.
4.2. Pedroni Residual Cointegration Test
The cointegration test is most commonly used to examine the spurious regression problem, which arises only when the underlying data are non-stationary. As a result, if the unit root tests show that each variable is stable, the question of whether or not they are in long-run equilibrium emerges. To address this question, the panel cointegration test by Pedroni (2001) was used in the analysis. Pedroni (1999, 2004) suggests two cointegration tests. The four statistics used in the panel tests, panel v, panel rho, panel PP, and panel ADF, are based on the within-dimension approach. These statistics combine the autoregressive coefficients across nations for the unit root tests on the estimated residuals. These statistics account for country- and time-specific variations. The group tests are based on the between-dimension approach, which includes three statistics, group rho, group PP, and group ADF statistics. These statistics are based on averages of the individual autoregressive coefficients associated with unit root tests of the residual of each country in the panel data set.
Table 6 presents the results of the Pedroni residual cointegration test below. The results reveal that the null hypothesis, which states that there is no long-term dynamic relationship between FDI, economic growth, and trade openness in the BRICS nations, cannot be rejected at the 5% significance level. The findings indicate no correlation between foreign direct investment (FDI), economic growth proxied by GDP, and trade openness in the BRICS nations over the long-term period. Similar results have been reported previously by Carkovic and Levine (2005), Sarkar (2007), Tekin (2012), and more recently by Golitsis et al. (2018). This illustrates that long-term fluctuations in GDP are unrelated to long-term fluctuations in FDI in BRICS.
Table 6.
Pedroni residual cointegration test results.
4.3. VAR Lag Order Selection Criteria
The determination of the appropriate lag length in a VAR model is crucial. This is because of the potential for errors when using a low number of lags and the risk of over-parametrization when employing an excessive number of lags. This study used five lag length criteria to select the optimal lag length for the estimation of the Bayesian VAR model. The results for VAR lag length selection criteria given in Table A2 in Appendix A indicate that lag order 2 was the optimal lag for the model, implying that 2 lags were adequate to capture the dynamics and relationship among the given variables.
4.4. Bayesian VAR Model
The Bayesian VAR estimates are provided in Table 7 below. Due to space constraints, only the outcomes of FDI and GDP are displayed here. For the analysis, the values were as follows: μ1 = 0, λ1 = 0.01, λ2 = 0.99, λ3 = 1, and λ4 = infinite. The prior used for the estimation of BVAR was the Minnesota–Litterman prior with a univariate AR initial variance–covariance error matrix. The given results show that the coefficients of both the first and second lags of foreign direct investment (FDI) were significant and positively correlated with their current level of investment. The estimated coefficients associated with the first and second lags of GDP were equal to 1.070 and 0.236. However, only the second lagged value of this variable was significant at the 10% level, whereas the first lagged value was deemed to be insignificant. This suggests that the current FDI level in the BRICS countries is influenced by the GDP value from two years ago rather than fluctuations from the previous year. Furthermore, both the first and second lags of TO positively determined the current level of foreign direct investment (FDI) at the 10% level of significance, which indicates that an increase of 1% in trade openness (TO) will induce an increase in the level of FDI of 1.50% for the first lag (t–1) and 0.03% for the second lag (t–2). Similarly, IF exhibited a significant and positive relationship with the current level of FDI at a 5% significance level for both lags.
Table 7.
Bayesian VAR results.
The relationship between the first and second lags of EXR with the current level of FDI was significant at the 5% level, but the relationship was negative between the two variables. With a one percent increase in the exchange rate (EXR), the foreign direct investment (FDI) will decrease by 2.3% for the first lag (t − 1) and 1.2% for the second lag (t − 2). Further, the human capital (HC) variable had a negligible impact on FDI in the case of the BRICS countries. In conclusion, the lagged values of FDI, TO, and IF positively impact the current level of FDI, whereas the lagged values of EXR have a significant but inverse relationship with the current level of FDI. The previous empirical studies conducted by Kiyota and Urata (2004) and Kechagia and Metaxas (2022) also reported a negative association between FDI inflows and exchange rate. The lagged values of HC do not affect the incoming FDI in BRICS countries (Mohanty and Sethi 2019). In the case of the current level of GDP, all variables for both lags, including FDI, GDP, TO, EXR, IF, and HC, were significant at the 5% significance level. This means that the current GDP level in BRICS countries is influenced by the first and second lags of GDP itself, as well as FDI, trade openness (TO), exchange rate (EXR), investment (IF), and human capital (HC). However, the relationship between trade openness and economic growth reported a negative association. Similar results have been reported in previous research conducted by Hye and Lau (2015), Huchet-Bourdon et al. (2018) and Amna Intisar et al. (2020). Thus, the null hypothesis stating that there is no co-movement between FDI, economic growth, and trade openness in BRICS nations is rejected at a 5% significance level.
4.5. Impulse Response Function
The impulse response function helps to understand how a variable responds to a sudden, one-time change (impulse) in another variable while keeping all other factors constant. The impulse response function of FDI to GDP in Figure 3 below indicates that when one standard deviation (S.D.) shock was given to GDP in the first period, the FDI immediately shots up and thereafter became stable from the second period.
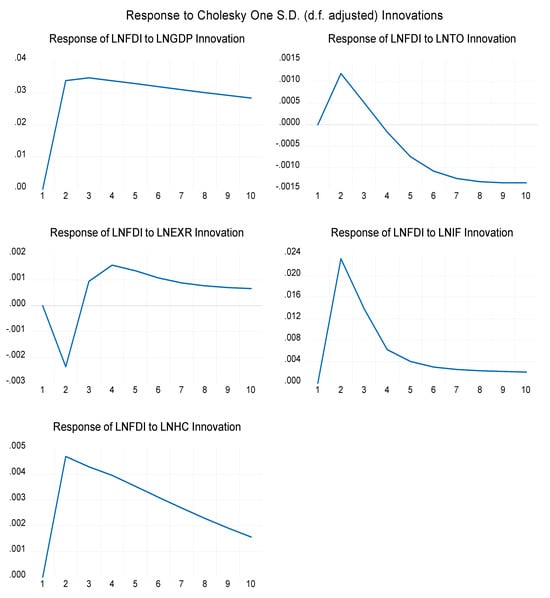
Figure 3.
Impulse response function of FDI.
In the case of trade openness (TO), FDI sharply increased in the first period before starting to decline from the second period onwards. A similar response was observed in the case of FDI when one standard deviation (S.D.) shock was given to the inflation rate (IF).
Next, the impulse response function of FDI to exchange rate (EXR) exhibited a sudden fall in FDI in the first period when a shock equal to one standard deviation (S.D.) was given to EXR. Following the brief decline, FDI rose again in the second period until the fourth period and showed a gradual decrease in the succeeding periods. Lastly, the impulse response function of FDI to human capital (HC) showed a sharp rise in the first period, followed by a steady decrease over time. Further, the impulse response function of GDP to FDI in Figure 4 below reveals that when one standard deviation (S.D.) shock was applied to foreign direct investment (FDI) in the initial period, it led to an instantaneous increase in gross domestic product (GDP), followed by a period of stability starting from the next period.
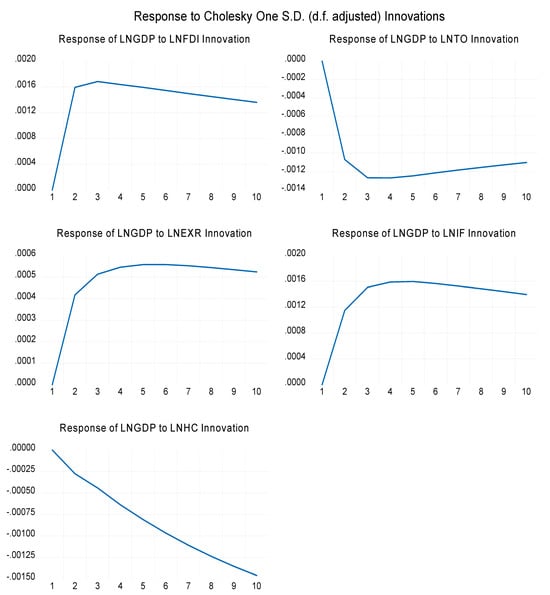
Figure 4.
Impulse response function of GDP.
Analogous patterns can be observed in the exchange rate (EXR) and the inflation rate (IR). Conversely, when trade openness (TO) experienced a shock, GDP experienced a sharp decline in the first period but gradually began to recover from the third period onwards. Additionally, the impulse response of GDP to human capital (HC) showed a consistent decline across all periods.
4.6. Variance Decomposition
Variance decomposition provides insights into the dynamic interactions among the variables in the model. It helps to identify the key drivers of variability. It is a valuable tool for understanding the relative contributions and significance of different factors in explaining the fluctuations in a panel data series. It simply indicates how important a shock is in determining the variations in the variables.
The stacked graphs in Figure 5 depict the outcomes of the variance decomposition of FDI. The results indicate that in the first year, the FDI explains a 100% variance in the forecast error variance decomposition of FDI.
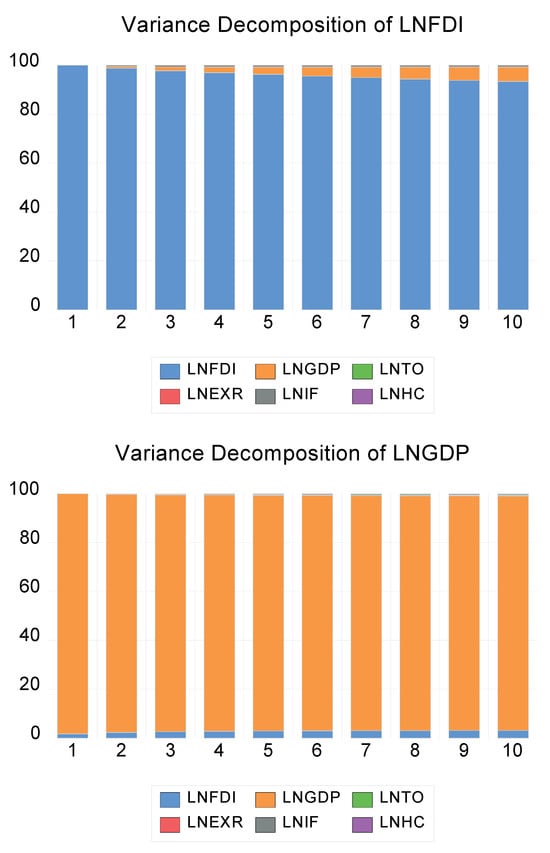
Figure 5.
Variance decomposition graph.
In the second year, the forecast error variance explained by FDI, GDP, and IF is 98.77%, 0.74%, and 0.45%, respectively, as shown in Table A3 in Appendix A. In the short run, FDI is explained by its own lagged values. The role of other variables in the short run is limited. Likewise, 93% of FDI alone explains itself in the long run, suggesting that FDI plays a substantial role, followed by GDP, in influencing fluctuations more than the other variables. Further, the variance decomposition results of GDP, as shown in Table A4 in Appendix A, indicate that in the first year, 98% of the variances in the forecast error are explained by GDP itself and only 1.76% by FDI. The remaining variables have no explaining power in both short-term and long-term periods.
5. Conclusions and Policy Implications
This research paper aims to understand the intricate relationship between foreign direct investment (FDI), economic growth, and trade openness within the BRICS nations, namely, Brazil, Russia, India, China, and South Africa, across three decades. The research aims to fill a significant gap in the literature by focusing on this crucial group of emerging economies, given their economic importance in the world economy in the coming decades. The panel data were collected from 1991 to 2020 from various sources, including World Bank indicators, OECD statistics, and Penn Table (Version 10.0). This extended time frame allowed for a thorough examination of the trends and variations in the BRICS countries. This paper used the Bayesian VAR framework to examine the dynamic interactions between FDI, economic growth, and trade openness variables. The Pedroni residual cointegration test was employed to check the existence of a long-run relationship between the given variables in the BRICS nations. The research findings provided evidence that foreign direct investment (FDI) exhibits a substantial interaction with economic growth in the short term within the BRICS countries. This research contributes to methodological innovation by introducing the Bayesian VAR framework, offering a deeper understanding of dynamic interactions among these key variables. The BVAR model holds various advantages over the traditional VAR model, specifically in terms of robustness and avoiding overparameterization of the model. The inclusion of this framework produces stable and reliable estimates, marking a novelty feature of this paper. The findings of the Bayesian VAR model highlight the significant role of FDI as a catalyst for immediate economic gains in these emerging economies. However, an intriguing dimension of this investigation emerges when considering the long-term relationship. The empirical evidence suggests that while FDI showcases a substantial link with economic growth in the short run, the relationship remains weak in the long run. Trade openness exhibits a positive correlation with foreign direct investment (FDI) but demonstrates a negative association with gross domestic product (GDP) in the short run. In practical terms, this suggests that while increased openness to international trade attracts more foreign direct investment (FDI), it may also be linked to a decrease in overall economic output or growth measured by GDP in BRICS countries. The intricate relationship between these variables emphasizes the need for a thorough assessment of the impact of trade policies on both FDI and GDP. This research study included competitiveness in the form of trade openness (TO). However, future research studies can explicitly include global competitiveness measures such as the global competitive index (GCI) or the easing of doing business index as a variable to study capital flows, both inflow and outflow.
Following the findings, several policy implications emerge from this study to exploit the full potential of short-term FDI impacts on economic growth in the BRICS nations. Governments should encourage and promote FDI through targeted investment promotion organizations and take sector-specific initiatives that highlight the immediate benefits of inward investment. Policymakers should ensure that infrastructure development aligns with sectors likely to receive short-term FDI inflows. This includes investments in transportation, energy, and communication systems. Moreover, flexible labor market policies can expedite job creation in response to short-term FDI inflows. Also, policies that facilitate skill development and workforce readiness are essential. Therefore, governments in these emerging economies should establish mechanisms to monitor the short-term impacts of FDI and adjust policies accordingly to maximize economic gains. However, the BRICS nations exhibit diverse economic structures and governance frameworks. Thus, the policy implications should be tailored to the specific circumstances of each country. Moreover, short-term FDI impacts can be influenced by global economic conditions, geopolitical events, and international market fluctuations, which are beyond the control of individual nations.
In summary, while this study recognizes the considerable short-term positive effects of FDI on economic growth in the BRICS countries, it also stresses the importance of strategic policy measures to optimize these impacts. Therefore, policymakers should adopt a dynamic and adaptable approach to leverage the immediate benefits of FDI while considering the broader context of sustainable economic development.
Author Contributions
Conceptualization, A.M. and A.N.S.; methodology, A.M. and A.N.S.; software, A.N.S.; validation, A.M. and A.N.S.; formal analysis, A.M. and A.N.S.; investigation, A.M. and A.N.S.; resources, A.M.; data curation, A.M.; writing—original draft preparation, A.M.; writing—review and editing, A.N.S.; visualization, A.M.; supervision, A.N.S.; project administration, A.M. and A.N.S. All authors have read and agreed to the published version of the manuscript.
Funding
This research received no external funding.
Data Availability Statement
The data used in the study are available on World Bank Database, OECD statistics, and Penn Table (Version 10.0). Data are, however, available from the authors upon request.
Conflicts of Interest
The authors declare no conflicts of interest.
Appendix A
Table A1.
Descriptive statistics.
Table A1.
Descriptive statistics.
| lnFDI | lnGDP | lnEXR | lnHC | lnIF | lnTO | |
|---|---|---|---|---|---|---|
| Mean | 23.20068 | 27.77184 | 2.150484 | 0.863235 | 4.023594 | 3.478765 |
| Median | 23.64495 | 27.82848 | 2.112515 | 0.856165 | 4.396755 | 3.589802 |
| Maximum | 26.39634 | 30.31422 | 4.305410 | 1.233845 | 5.230374 | 4.084114 |
| Minimum | 15.02686 | 25.91265 | −8.645027 | 0.411515 | −5.348304 | 2.050899 |
| Std. Dev. | 1.984469 | 1.027467 | 1.707677 | 0.210143 | 1.609364 | 0.484192 |
| Count | 150 | 150 | 150 | 150 | 150 | 150 |
| Skewness | −0.883579 | 0.324771 | −2.580344 | 0.038413 | −3.999166 | −0.780065 |
| Kurtosis | 4.466093 | 3.071128 | 15.92975 | 2.108752 | 20.80459 | 2.785701 |
| Jarque-Bera | 32.95173 | 28.68527 | 1211.320 | 5.001403 | 238.1106 | 15.49956 |
Note. The above table shows the descriptive statistics of the variables used in this study. All variables are normally distributed, supported by significant p-values, rejecting the normality hypothesis of Jarque–Bera test.
Table A2.
VAR lag order selection criteria.
Table A2.
VAR lag order selection criteria.
| Lag | LogL | LR | FPE | AIC | SC | HQ |
|---|---|---|---|---|---|---|
| 0 | −664.4858 | NA | 0.000830 | 9.933123 | 10.06225 | 9.985595 |
| 1 | 949.9620 | 3061.471 | 5.80 × 10⁻¹⁴ | −13.45129 | −12.54743 | −13.08398 |
| 2 | 1077.678 | 230.8342 * | 1.50 × 10⁻¹⁴ * | −14.81004 * | −13.13144 * | −14.12790 * |
| 3 | 1104.565 | 46.20596 | 1.72 × 10⁻¹⁴ | −14.67503 | −12.22169 | −13.67806 |
* Indicates lag order selected by the criterion. LR: sequential modified LR test statistic (each test at 5% level). FPE: Final prediction error. AIC: Akaike information criterion. SC: Schwarz information criterion. HQ: Hannan–Quinn information criterion. Source: author’s own calculation.
Table A3.
Variance decomposition results of FDI.
Table A3.
Variance decomposition results of FDI.
| Variance Decompositon of lnFDI | |||||||
|---|---|---|---|---|---|---|---|
| Period | S.E. | lnFDI | lnGDP | lnTO | lnEXR | lnIF | lnHC |
| 1 | 0.793470 | 100.0000 | 0.000000 | 0.000000 | 0.000000 | 0.000000 | 0.000000 |
| 2 | 0.799882 | 98.77906 | 0.743390 | 0.006221 | 0.001575 | 0.456189 | 0.013563 |
| 3 | 0.804408 | 97.80568 | 1.545449 | 0.008184 | 0.005019 | 0.611036 | 0.024636 |
| 4 | 0.807942 | 97.00761 | 2.304312 | 0.008112 | 0.008752 | 0.637328 | 0.033882 |
| 5 | 0.811151 | 96.28173 | 3.012193 | 0.008848 | 0.011010 | 0.645112 | 0.041106 |
| 6 | 0.814123 | 95.61341 | 3.669741 | 0.010676 | 0.012248 | 0.647352 | 0.046568 |
| 7 | 0.816901 | 94.99379 | 4.281606 | 0.013095 | 0.013031 | 0.647935 | 0.050541 |
| 8 | 0.819507 | 94.41754 | 4.851927 | 0.015691 | 0.013622 | 0.647910 | 0.053312 |
| 9 | 0.821955 | 93.88054 | 5.384294 | 0.018225 | 0.014142 | 0.647661 | 0.055142 |
| 10 | 0.824258 | 93.37940 | 5.881770 | 0.020588 | 0.014646 | 0.647336 | 0.056258 |
Source: author’s own calculation.
Table A4.
Variance decomposition results of GDP.
Table A4.
Variance decomposition results of GDP.
| Variance Decompositon of lnGDP | |||||||
|---|---|---|---|---|---|---|---|
| Period | S.E. | lnFDI | lnGDP | lnTO | lnEXR | lnIF | lnHC |
| 1 | 0.068016 | 1.768626 | 98.23137 | 0.000000 | 0.000000 | 0.000000 | 0.000000 |
| 2 | 0.086262 | 2.334837 | 97.42796 | 0.097602 | 0.036496 | 0.098998 | 0.004109 |
| 3 | 0.101864 | 2.648237 | 96.91751 | 0.162025 | 0.067883 | 0.193919 | 0.010425 |
| 4 | 0.114465 | 2.819908 | 96.60847 | 0.195504 | 0.092967 | 0.262586 | 0.020560 |
| 5 | 0.125256 | 2.924029 | 96.40376 | 0.213500 | 0.113225 | 0.311832 | 0.033656 |
| 6 | 0.134654 | 2.989469 | 96.26036 | 0.223191 | 0.129985 | 0.347528 | 0.049466 |
| 7 | 0.142969 | 3.031721 | 96.15380 | 0.228369 | 0.144233 | 0.374262 | 0.067616 |
| 8 | 0.150401 | 3.059156 | 96.07062 | 0.230917 | 0.156636 | 0.394866 | 0.087805 |
| 9 | 0.157101 | 3.076718 | 96.00286 | 0.231853 | 0.167653 | 0.411166 | 0.109754 |
| 10 | 0.163177 | 3.087469 | 95.94561 | 0.231758 | 0.177600 | 0.424347 | 0.133211 |
Source: author’s own calculation.
References
- Akinmulegun, Sunday Ojo. 2012. Foreign direct investment (FDI) trends in developing nations: Nigeria experience in a globalization era. International Business and Management 4: 146–56. [Google Scholar]
- Alam, Waseem, Firdos Ikram, Pushp Kumar, Mohammad Haseeb, and Nazim Ali. 2022. Asymmetric Effects of Foreign Direct Investment on Economic Growth: Fresh Evidence from India Using NARDL Simulation. Millennial Asia. [Google Scholar] [CrossRef]
- Alvarado, Rafael, Maria Iñiguez, and Pablo Ponce. 2017. Foreign direct investment and economic growth in Latin America. Economic Analysis and Policy 56: 176–87. [Google Scholar] [CrossRef]
- Amna Intisar, Rabail, Muhammad Rizwan Yaseen, Rakhshanda Kousar, Muhammad Usman, and Muhammad Sohail Amjad Makhdum. 2020. Impact of trade openness and human capital on economic growth: A comparative investigation of Asian countries. Sustainability 12: 2930. [Google Scholar] [CrossRef]
- Anyanwu, John C., and Nadege D. Yameogo. 2015. What drives foreign direct investments into West Africa? An empirical investigation. African Development Review 27: 199–215. [Google Scholar] [CrossRef]
- Asafo-Agyei, George, and Odongo Kodongo. 2022. Foreign direct investment and economic growth in Sub-Saharan Africa: A nonlinear analysis. Economic Systems 46: 101003. [Google Scholar] [CrossRef]
- Athari, Seyed Alireza, and Cahit Adaoglu. 2019. Nexus between institutional quality and capital inflows at different stages of economic development. International Review of Finance 19: 435–45. [Google Scholar] [CrossRef]
- Athari, Seyed Alireza, Komeil Shaeri, Dervis Kirikkaleli, Hasan Murat Ertugrul, and Alper Ozun. 2020. Global competitiveness and capital flows: Does stage of economic development and risk rating matter? Asia-Pacific Journal of Accounting & Economics 27: 426–50. [Google Scholar]
- Atique, Zeshan, Mohsin Hasnain Ahmad, Usman Azhar, and Aliya H. Khan. 2004. The impact of FDI on economic growth under foreign trade regimes: A case study of Pakistan [with comments]. The Pakistan Development Review 43: 707–18. [Google Scholar] [CrossRef]
- Banday, Umer Jeelanie, Saravanan Murugan, and Javeria Maryam. 2021. Foreign direct investment, trade openness and economic growth in BRICS countries: Evidences from panel data. Transnational Corporations Review 13: 211–21. [Google Scholar] [CrossRef]
- Belloumi, Mounir. 2014. The relationship between trade, FDI and economic growth in Tunisia: An application of the autoregressive distributed lag model. Economic Systems 38: 269–87. [Google Scholar] [CrossRef]
- Bermejo Carbonell, Jorge, and Richard A. Werner. 2018. Does foreign direct investment generate economic growth? A new empirical approach applied to Spain. Economic Geography 94: 425–56. [Google Scholar] [CrossRef]
- Bhandari, Rabindra, Dharmendra Dhakal, Gyan Pradhan, and Kamal Upadhyaya. 2007. Foreign Aid, FDI and Economic Growth in East European Countries. Economics Bulletin 6: 1–9. [Google Scholar]
- Borensztein, Eduardo, Jose De Gregorio, and Jong-Wha Lee. 1998. How does foreign direct investment affect economic growth? Journal of International Economics 45: 115–35. [Google Scholar] [CrossRef]
- Carkovic, Maria, and Ross Levine. 2005. Does foreign direct investment accelerate economic growth. Does Foreign Direct Investment Promote Development 195: 220. [Google Scholar] [CrossRef]
- Choi, Yoon J., and Jungho Baek. 2017. Does FDI really matter to economic growth in India? Economies 5: 20. [Google Scholar] [CrossRef]
- De Mello, Luiz R., Jr. 1999. Foreign direct investment-led growth: Evidence from time series and panel data. Oxford Economic Papers 51: 133–51. [Google Scholar] [CrossRef]
- Fadhil, Mohammed Ameen, and Mahmoud Khalid Almsafir. 2015. The role of FDI inflows in economic growth in Malaysia (time series: 1975–2010). Procedia Economics and Finance 23: 1558–66. [Google Scholar] [CrossRef]
- Golitsis, Petros, Kushtrim Avdiu, and Leslie T. Szamosi. 2018. Remittances and FDI effects on economic growth: A VECM and GIRFs for the case of Albania. Journal of East-West Business 24: 188–211. [Google Scholar] [CrossRef]
- Hansen, Henrik, and John Rand. 2006. On the causal links between FDI and growth in developing countries. World Economy 29: 21–41. [Google Scholar] [CrossRef]
- Herzer, Dierk. 2012. How does foreign direct investment really affect developing countries’ growth? Review of International Economics 20: 396–414. [Google Scholar] [CrossRef]
- Herzer, Dierk, and Stephan Klasen. 2008. In search of FDI-led growth in developing countries: The way forward. Economic Modelling 25: 793–810. [Google Scholar] [CrossRef]
- Huchet-Bourdon, Marilyne, Chantal Le Mouël, and Mariana Vijil. 2018. The relationship between trade openness and economic growth: Some new insights on the openness measurement issue. The World Economy 41: 59–76. [Google Scholar] [CrossRef]
- Hye, Qazi Muhammad Adnan, and Wee-Yeap Lau. 2015. Trade openness and economic growth: Empirical evidence from India. Journal of Business Economics and Management 16: 188–205. [Google Scholar] [CrossRef]
- Iqbal, Badar Alam, Abdul Turay, Munir Hasan, and Nadia Yusuf. 2018. India’s outward foreign direct investment: Emerging trends and issues. Transnational Corporations Review 10: 98–107. [Google Scholar] [CrossRef]
- Irshad, Mohd, and Syed Hasan Qayed. 2022. Casual nexus between economic growth, FDI and employment: An inquiry into BRICS and ASEAN. Theoretical & Applied Economics 29: 107–24. [Google Scholar]
- Johnson, Andreas. 2006. The Effects of FDI Inflows on Host Country Economic Growth. Electronic Working Paper Series. Paper No. 58. Stockholm: The Royal Institute of Technology, Centre of Excellence for Studies in Science and Innovation. [Google Scholar]
- Kechagia, Polyxeni, and Theodore Metaxas. 2022. FDI and institutions in BRIC and CIVETS countries: An empirical investigation. Economies 10: 77. [Google Scholar] [CrossRef]
- Khan, Shiraz, and Farhan Mehboob. 2014. Impact of FDI on GDP: An Analysis of Global Economy on Production Function (No. 55352). Germany: University Library of Munich. [Google Scholar]
- Kim, Soyoung, Sunghyun Kim, and Yoonseok Choi. 2018. International capital mobility: Regional versus global perspective. Review of World Economics 154: 157–76. [Google Scholar] [CrossRef]
- Kiyota, Kozo, and Shujiro Urata. 2004. Exchange rate, exchange rate volatility and foreign direct investment. World Economy 27: 1501–36. [Google Scholar] [CrossRef]
- Kumari, Reenu, Malik Shahzad Shabbir, Sharjeel Saleem, Ghulam Yahya Khan, Bilal Ahmed Abbasi, and Lydia Bares Lopez. 2023. An empirical analysis among foreign direct investment, trade openness and economic growth: Evidence from the Indian economy. South Asian Journal of Business Studies 12: 127–49. [Google Scholar] [CrossRef]
- Lee, Gwanghoon. 2007. Long run equilibrium relationship between inward FDI and productivity. Journal of Economic Development 32: 183. [Google Scholar]
- Levin, Andrew, Chien-Fu Lin, and Chia-Shang James Chu. 2002. Unit root tests in panel data: Asymptotic and finite-sample properties. Journal of Econometrics 108: 1–24. [Google Scholar] [CrossRef]
- Louzi, Basem Mohammed, and Abeer Abadi. 2011. The Impact of Foreign Direct Investment on Economic Growth in Jordan. IJRRAS-International Journal of Research and Reviews in Applied Sciences 8: 253–58. [Google Scholar]
- Mahembe, Edmore E., and Nicholas M. Odhiambo. 2016. Does foreign direct investment cause economic growth? A dynamic panel data analysis for SADC countries. International Journal of Emerging Markets 11: 316–32. [Google Scholar] [CrossRef]
- Mahmoodi, Majid, and Elahe Mahmoodi. 2016. Foreign direct investment, exports and economic growth: Evidence from two panels of developing countries. Economic Research-Ekonomska Istraživanja 29: 938–49. [Google Scholar] [CrossRef]
- Makki, Shiva S., and Agapi Somwaru. 2004. Impact of foreign direct investment and trade on economic growth: Evidence from developing countries. American Journal of Agricultural Economics 86: 795–801. [Google Scholar] [CrossRef]
- Mehic, Eldin, Sabina Silajdzic, and Vesna Babic-Hodovic. 2013. The impact of FDI on economic growth: Some evidence from Southeast Europe. Emerging Markets Finance and Trade 49 S1: 5–20. [Google Scholar] [CrossRef]
- Mencinger, Jože. 2003. Does foreign direct investment always enhance economic growth? Kyklos 56: 491–508. [Google Scholar] [CrossRef]
- Mohanty, Saileja, and Narayan Sethi. 2019. Outward FDI, human capital and economic growth in BRICS countries: An empirical insight. Transnational Corporations Review 11: 235–49. [Google Scholar] [CrossRef]
- Narayanamoorthy, Vijayakumar, Sridharan Perumal, and K. Rao. 2008. Causal relationship between foreign direct investment and growth: Evidence from BRICS countries. International Business Research 2: 198–203. [Google Scholar]
- Nath, Hiranya K. 2009. Trade, foreign direct investment, and growth: Evidence from transition economies. Comparative Economic Studies 51: 20–50. [Google Scholar] [CrossRef]
- Naveed, Amjad, and Ghulam Shabbir. 2006. Trade openness, FDI and economic growth: A panel study. Pakistan Economic and Social Review 44: 137–54. [Google Scholar]
- Nistor, Paula. 2014. FDI and economic growth, the case of Romania. Procedia Economics and Finance 15: 577–82. [Google Scholar] [CrossRef]
- Nistor, Paula. 2015. FDI implications on BRICS economy growth. Procedia Economics and Finance 32: 981–85. [Google Scholar] [CrossRef]
- Nupehewa, Shenali, Sachintha Liyanage, Deshan Polkotuwa, Madhurshi Thiyagarajah, Ruwan Jayathilaka, and Anuja Lokeshwara. 2022. More than just investment: Causality analysis between foreign direct investment and economic growth. PLoS ONE 17: e0276621. [Google Scholar] [CrossRef] [PubMed]
- Omri, Anis. 2014. The nexus among foreign investment, domestic capital and economic growth: Empirical evidence from the MENA region. Research in Economics 68: 257–63. [Google Scholar] [CrossRef]
- O’Neill, Jim. 2001. Building Better Global Economic BRICs. New York: Goldman Sachs, vol. 66, pp. 1–16. [Google Scholar]
- Pedroni, Peter. 1999. Critical values for cointegration tests in heterogeneous panels with multiple regressors. Oxford Bulletin of Economics and Statistics 61 S1: 653–70. [Google Scholar] [CrossRef]
- Pedroni, Peter. 2001. Purchasing power parity tests in cointegrated panels. Review of Economics and Statistics 83: 727–31. [Google Scholar] [CrossRef]
- Pedroni, Peter. 2004. Panel cointegration: Asymptotic and finite sample properties of pooled time series tests with an application to the PPP hypothesis. Econometric Theory 20: 597–625. [Google Scholar] [CrossRef]
- Pegkas, Panagiotis. 2015. The impact of FDI on economic growth in Eurozone countries. The Journal of Economic Asymmetries 12: 124–32. [Google Scholar] [CrossRef]
- Rakhmatullayeva, Dinara, Iliyas Kuliyev, Zhaksylyk Beisenbaiyev, and Talgat Tabeyev. 2020. Assessment of the influence of FDI on the economic growth of the host country: Evidence from Kazakhstan. In E3S Web of Conferences. Les Ulis: EDP Sciences, vol. 159, p. 06007. [Google Scholar]
- Rao, D. Tripati, Narayan Sethi, Devi Prasad Dash, and Padmaja Bhujabal. 2023. Foreign aid, FDI and economic growth in South-East Asia and South Asia. Global Business Review 24: 31–47. [Google Scholar] [CrossRef]
- Saidi, Yosra, Anis Ochi, and Samir Maktouf. 2023. FDI inflows, economic growth, and governance quality trilogy in developing countries: A panel VAR analysis. Bulletin of Economic Research 75: 426–49. [Google Scholar] [CrossRef]
- Saltz, Ira. 1992. The negative correlation between foreign direct investment and economic growth in the Third World: Theory and evidence. Rivista Internazionale di Scienze Economiche e Commerciali: RiSEC; Pubblicazione Trimestrale 39: 617–33. [Google Scholar]
- Samad, Abdus. 2009. Does FDI Cause Economic Growth? Evidence from South-East Asia and Latin America. Woodbury School of Business Working Paper, 1-09. Orem: Woodbury School of Business, Utah Valley University. [Google Scholar]
- Sarkar, Prabirjit. 2007. Does Foreign Direct Investment Promote Growth? Panel Data and Time Series Evidence from Less Developed Countries, 1970–2002 (No. 5176). Germany: University Library of Munich. [Google Scholar]
- Shell, Hannah G., and Liping Zheng. 2015. The interaction effects of globalization and Institutions on international capital flows. International Journal of Economics and Finance 7: 12–22. [Google Scholar] [CrossRef]
- Strat, Vasile Alecsandru, Adriana Davidescu, and Andreea Maria Paul. 2015. FDI and the unemployment-a causality analysis for the latest EU members. Procedia Economics and Finance 23: 635–43. [Google Scholar] [CrossRef]
- Sunde, Tafirenyika. 2017. Foreign direct investment, exports and economic growth: ADRL and causality analysis for South Africa. Research in International Business and Finance 41: 434–44. [Google Scholar] [CrossRef]
- Tekin, Rıfat Barış. 2012. Economic growth, exports and foreign direct investment in Least Developed Countries: A panel Granger causality analysis. Economic Modelling 29: 868–78. [Google Scholar] [CrossRef]
- Tiwari, Aviral Kumar, and Mihai Mutascu. 2011. Economic growth and FDI in Asia: A panel-data approach. Economic Analysis and Policy 41: 173–87. [Google Scholar] [CrossRef]
- World Economic Outlook. 2023. Navigating Global Divergences. Washington, DC: International Monetary Fund. ISBN 9798400235801. [Google Scholar]
- Yimer, Addis. 2023. The effects of FDI on economic growth in Africa. The Journal of International Trade & Economic Development 32: 2–36. [Google Scholar]
- Zhang, Kevin Honglin. 2001. Does foreign direct investment promote economic growth? Evidence from East Asia and Latin America. Contemporary Economic Policy 19: 175–85. [Google Scholar] [CrossRef]
Disclaimer/Publisher’s Note: The statements, opinions and data contained in all publications are solely those of the individual author(s) and contributor(s) and not of MDPI and/or the editor(s). MDPI and/or the editor(s) disclaim responsibility for any injury to people or property resulting from any ideas, methods, instructions or products referred to in the content. |
© 2023 by the authors. Licensee MDPI, Basel, Switzerland. This article is an open access article distributed under the terms and conditions of the Creative Commons Attribution (CC BY) license (https://creativecommons.org/licenses/by/4.0/).