
How Does Market Cap Play Its Role in Returns during COVID-19? The Case of Norway

Department of Business Administration, Inland School of Business and Social Sciences, Inland Norway University of Applied Sciences, 400 Vestad, 2418 Elverum, Norway
J. Risk Financial Manag. 2023, 16(9), 414; https://doi.org/10.3390/jrfm16090414
Submission received: 21 August 2023
/
Revised: 12 September 2023
/
Accepted: 13 September 2023
/
Published: 19 September 2023
(This article belongs to the Special Issue Emerging Issues in Economics, Finance and Business)
Abstract
:This research investigates the role of the large, medium, and small market cap portfolios in returns during the COVID-19 pandemic, around the ‘lockdown’ policy in March 2020 based on the Norwegian market. The main results suggest that during the event window, the medium and small portfolios are impacted more negatively than the large. During the before-event days, the large portfolio is slightly negatively affected, but it tends to be better after the event. The medium and small portfolios are not adversely affected during before the event, but they are considerably negatively affected after the event. The small portfolio is affected more severely negatively than the medium. The small portfolio is the most volatile of the three during the event window. In addition, there are opportunities to earn extremely positive abnormal returns (from 2.5%) after the event by holding the small and medium portfolios, but not for the large. It seems that more opportunities to earn extremely positive abnormal returns for the small portfolio than the medium.
JEL Classification:
G01; G10; G11; G141. Introduction
During the COVID-19 crisis, stock markets around the world crashed. In March 2020, the New York Stock Exchange Dow Index went down by ; and the S&P500 and NASDAQ indexes also fell by and , respectively. European stock markets had the same problem, as the German DAX index, the French CAC40 index, and the British FTSE100 index dropped by between % and , and the Norway stock-market index (the Oslo Bors) declined by %. Figure 1 presents the performance of the Olso Bors against the other major indices, showing that the Oslo Bors’ performance was close to them during this period.
Although stock markets severely crashed during the COVID-19 crisis, there were still many stocks gaining high returns, because stocks perform differently between and within different industries, as illustrated in previous research. The study by the authors in Mazur et al. (2021), based on the US stock market, illustrated that not all stocks experienced detrimental effects. They indicated that stocks in some industries (natural gas, food, healthcare, and software) made positive returns, but other industries (petroleum, real estate, entertainment, and hospitality) fell dramatically. The authors in Dharani et al. (2023) found that, in India, the chemical, technology, and food and beverage industries earned higher returns, but the banking and finance, automotive, services, and cement and construction industries earned lower returns. All industry groupings in their study yielded a positive return during the lockdown period. However, research by the authors in Al-Awadhi et al. (2020) suggested that, during the COVID-19 crisis, stock returns on the Chinese stock market were significantly negatively affected across all companies. The authors in Narayan et al. (2020) showed that Japanese stock returns had a positive effect because of the depreciation of the Yen against the US dollar during COVID-19. The authors in Lee et al. (2023) found that in China, COVID-19 shocks affected macroeconomic fluctuations and hospitality stock returns, and the authors in Umar et al. (2023) stated no evidence of the effect of COVID-19 on the liquidity of the Chinese stock market. The authors in Størdal et al. (2021) investigated stock-market returns based on the Norwegian and Swedish markets during 2020. They found that non-pharmaceutical interventions had a positive effect on Sweden’s stock market, but little or no effect on the stock market in Norway.
In addition, other studies at the global level suggested different results; studies by the authors in Liu et al. (2020), Uddin et al. (2021), and Zhang et al. (2020) suggested stock returns were negatively impacted; the authors in Uddin et al. (2021) also suggested that resilience scores could significantly reduce the volatility of developed and emerging equity markets. Nonetheless, a study by the authors in Chang et al. (2021) found that stock returns had a positive effect on the government responses to COVID-19 (the “lockdown” policy). Beer et al. (2023), indicating that the responses of governments mitigate the negative stock-market effect, while the authors in Scherf et al. (2022) found that lockdown restrictions led to different reactions; there was a negative impact resulting from the increase in lockdown restrictions, but under-reaction during the lockdown announcement and then followed by overreaction. The authors in Cervantes et al. (2022) suggested that changes in panic indexes because of the COVID-19 crisis had no significant relationship with raw stock-market returns. The authors in Zhang et al. (2023) stated that RCEP economies showed better risk resistance to COVID-19 shocks.1
Stock-market capitalization (or market cap) of a company refers to how highly the market values a company; the higher the market value, the larger the company. Market cap also has an important relationship with risk and return. Historical analysis reveals that large-market-cap stocks have low risk, but usually grow slowly; small-market-cap stocks have high risk but also have high potential growth, i.e., small-market-cap stocks expect to generate higher returns than large-market-cap stocks, but they are riskier than large-market-cap stocks. Research by the authors in Banz (1981) indicated that smaller firms had higher risk-adjusted returns than larger firms, on average.
Market cap therefore plays a vital role in risk and return. The question is how market cap plays its role in risk and return during crisis time. Research by the authors in Harjoto et al. (2021) found that in the US, large firms had positive abnormal returns during the COVID-19 crisis, but not small firms. Following that research, we will investigate the role of market cap during the COVID-19 crisis based on Norwegian circumstances, which have not yet been investigated in the Norwegian market. We construct three market-cap portfolios—a large market cap, a medium market cap, and a small market cap—from the most liquid stocks listed on the Euronext stock exchange, particularly on the Oslo market, and conduct an event study around the “lockdown” policy during the crash of March 2020 in Norway.
The results of this research suggest that during the event window, medium and small-market-cap portfolios were impacted more negatively than large-market-cap portfolio. During the before-event days, the large-market-cap portfolio was slightly negatively affected, but it tended to do better after the event. The medium and small-market-cap portfolios were not adversely affected before the event but were considerably negatively affected after the event. The small-market-cap portfolio was affected more severely negatively than the medium one. The small-market-cap portfolio was the most volatile of the three during the event window.
Interestingly, the research also found that there were opportunities to earn extremely positive abnormal returns (from 2.5%) from the small and medium-market-cap portfolios after the event, but not for the large-market-cap portfolio. There are more opportunities to earn extremely positive abnormal returns from the small-market-cap portfolio than from the medium-market-cap portfolio.
The remainder of this paper is structured as follows: Section 2 describes the methodology, data and variables, and samples. Section 3 discusses the empirical results of the event study, conducts a robustness check, and examines the extremely positive and negative abnormal returns. The last section presents conclusions on the research.
2. Methodology, Data and Variables, and Samples
2.1. Methodology
The “event study” method is widely used in economics and finance to examine security price behavior around an event (see Binder 1998; Brown and Warner 1985; MacKinlay 1997). Additionally, this method has been widely applied to crises, such as the bankruptcy of Lehman Brothers that caused the financial crisis of 2007–2008, an announcement that affected security performance during the U.S. subprime crisis, and others (see Aizenman et al. 2016; Becchetti and Ciciretti 2011; Cimini 2015; Dimovski 2009; Dooley and Hutchison 2009; Fiordelisi et al. 2014; Miyajima and Yafeh 2007; Miyanoya 1999; Ranjeeni 2014; Ricci 2015; Wilson et al. 2000). In addition, the event study is used to examine the reaction of the stock market to the COVID-19 pandemic by Harjoto et al. (2021), Størdal et al. (2020), and Liu et al. (2020).
Following previous research, this research employs the “event study” method to examine the changes in returns of large, medium, and small-market-cap portfolios during COVID-19, around the “lockdown” policy. The “event study” method uses abnormal returns and cumulative abnormal returns to appraise the event’s impact, as mentioned in MacKinlay (1997). We therefore calculate abnormal returns and cumulative abnormal returns for each portfolio for the event window, the before-event days, and the after-event days, using the following steps:
- Step 1: calculating abnormal returns.
To estimate abnormal returns for the three portfolios, we employ the market model below:
where is the return of the portfolios: large, medium, and small-market-cap portfolios. is the return on the market index.
We first use the estimation samples (or the samples for the estimation window) and the market model to predict and called normal and normal for each portfolio. Then, we estimate abnormal returns for each portfolio for the event window, the before-event days, and the after-event days, as per Equation (2), below:
where is the abnormal return (or ) of each portfolio calculated for the event window, the before-event days, and the after-event days. and are the actual portfolio returns and the actual market-index returns, respectively. and are normal and normal estimated from Equation (1).
- Step 2: calculating cumulative abnormal returns.
The abnormal returns are aggregated to infer the cumulative effect of the event. We therefore calculate the cumulative abnormal returns for each portfolio for the event window, the before-event days, and the after-event days, as below.
where is the abnormal return of portfolio i (or ) during period to presenting the period of the event window (T1 <<< T2), the before-event days (T1 <<< Event day), and the after-event days (Event day <<< T2) (see the event timeline below).
- Event timeline
We define a timeline for the event study: “the event of lockdown policy during the crash of March 2020”, as shown in Figure 2.
In Figure 2, the event day is 12 March 2020 (i.e., “lockdown” policy is published); after 16 April 2020, lockdown restrictions were eased. There are three windows: the estimation window, the event window, and the post-event window. The estimation window—the period before COVID-19 started in Norway—considered to be a normal period, is used to predict normal returns. The event window from 26 February 2020 to 16 April 2020 (34 days) is chosen because it covers three events: the first day of COVID-19 being recorded in Norway, the day of the “lockdown” policy being published, and the days before the “lockdown” policy being eased. The event window has two periods: before-event days and after-event days. We investigate the changes in returns of the three market-cap portfolios during the event period, before-event days, and after-event days.
- Testing cumulative abnormal returns
We conducted a Student’s t-test to test for cumulative abnormal returns for the three portfolios.
Null hypothesis H0:
Test statistic:
where
2.2. Data and Variables
We selected daily data from the most liquid stocks2 and Oslo Bors benchmark (index_GI) listed on the Euronext stock exchange, particularly on the Oslo market, as our samples.
We first calculated equal-weighted returns for three portfolios sorted by market capitalization: large-market-cap portfolio, medium-market-cap portfolio, and small-market-cap portfolio.
This article defines market sizes as follows: Large-cap companies have a market value of USD 9 billion or greater; medium-cap companies have a market value between USD 2 billion and USD 9 billion; and small-cap companies have a market value between USD 76 million and USD 2 billion. The classification of the market value was based on the capitalization classification shown on the Euronext stock exchange.
Information on each market-cap portfolio is summarized in Table 1.
Portfolios’ equal-weighted returns are computed as follows:
is log return of stock i at date t; is daily stock price; is equal-weighted portfolio return for three portfolios: large, medium, and small-market-cap portfolios. Please note that is sorted by market cap and divided into three groups: large market cap, medium market cap, and small market cap before calculating .
Returns of the Oslo Bors benchmark (index_GI) as the market index in this research are then calculated.
2.3. Samples
We divided the samples according to the event timeline. The samples are therefore divided into four subsamples: estimation samples for the estimation window, before-event samples for the before-event days, after-event samples for the after-event days, and event samples for the event window.
The summary statistics of the three portfolios’ daily returns and market index daily return are presented in Table 2.
In Table 2, the volatilities (or standard deviations) of the three portfolios and the market index in the estimation window are much lower than those in the event window, the before-event days, and the after-event days, i.e., returns on the three portfolios and returns on the market index in the event window, the before-event days, and the after-event days are more volatile than those in the estimation window. As the study by the authors in Li et al. (2022) suggests, the fear of COVID-19 causes stock-market volatility.
Returns versus volatility of the three portfolios and market index during the even window are presented in Figure 3.
In Figure 3, during the event window, the three portfolios and the market index have negative returns. The small-market-cap portfolio earns the lowest negative returns, but has the highest volatility. Therefore, the small-market-cap portfolio is considerably negatively affected during this window.
3. Results
3.1. Results of the Event Study
This research investigates the changes in returns of the large, medium, and small-market-cap portfolios during the three investigated periods: the event window, the before-event days, and the after-event days.
The empirical results of the event study are presented in Table 3.
Table 3 shows the results of the t-test for cumulative abnormal returns for the three portfolios for three periods: the event window, the before-event days, and the after-event days. The results suggest that most means of the cumulative abnormal returns for the three periods are significantly different from zero at the significance level of 1%. However, the mean of the cumulative abnormal return of the small-market-cap portfolio (CAR_small) for the before-event days is not significant, meaning that it is not affected before the event.
During the event window, the returns of the three portfolios are significantly affected at the significance level . Although the mean of the CAR of the large-market-cap portfolio takes a positive value of , the means of the CAR of the medium-market-cap portfolio and the CAR of the small-market-cap portfolio are negative ( and , respectively), i.e., the medium and small-market-cap portfolios are adversely impacted, but the large-market-cap portfolio is not. The result implies that the medium and small-market-cap portfolios are more negatively affected than the large-market-cap portfolio. Moreover, the CAR for the small-market-cap portfolio () is considerably negatively lower than the CAR for the medium-market-cap portfolio () meaning that the small-market-cap portfolio is more severely adversely affected than the medium one.
During the before-event days, the mean of the CAR of the large-market-cap portfolio is slightly negatively affected at the significance level (the mean value of ). However, the mean of the CAR of the small-market-cap portfolio is insignificant, but it has a negative effect during the event window; this is because the small-market-cap portfolio is highly negatively affected during the after-event days. The mean of the CAR of the medium-market-cap portfolio is significantly different from zero and takes a value of , meaning that the portfolio is not adversely impacted during this period. We find that the large-market-cap portfolio is more sensitive to COVID-19 than the other portfolios, because it is slightly negatively affected in this window, but the others are not.
During the after-event days, the means of the CARs of the three portfolios are significantly different from zero at the significance level . The means of the CAR of the medium and small-market-cap portfolios are and , respectively, implying that the two portfolios are negatively affected; the small-market-cap portfolio is considerably adversely affected. The mean of the CAR of the large-market-cap portfolio is , suggesting that the portfolio is not negatively affected. It might be that the large-market-cap portfolio (or large firms within it) manages its response to the event quicker than the other portfolios (the medium and small-cap), leading investors to be more confident in large firms.
In short, the results indicate that the returns of the three portfolios are affected more significantly after the event than before the event. Before the event, only the large-market-cap portfolio was slightly negatively affected, but not the others. After the event (i.e., after the “lockdown” policy coming into force on 12 March 2020), all three portfolios were differently impacted; the medium and small-market-cap portfolios were extremely negatively affected, but the large-market-cap portfolio was not.
Figure 4 presents the returns of the three portfolios against the market-index return during the event window; the vertical red line (on 12 March 2020) divides the graph into two parts: before the event and after the event. The figure shows that the large portfolio moves close to the market index. Therefore, the slightly negative effect of the large portfolio during the before-event days is probably caused by the dramatic fall in the major indices (see Figure 1) as well.
The market cap illustrates its important role in relation to risk and returns during the crisis; the small and medium ones are severely negatively affected, but not the large; the small is also found to be more severely negatively affected than the medium. The larger the market cap, the more stable the stocks.
The results imply that the large-market-cap portfolio might be more sensitive to COVID-19 than other portfolios at the beginning. However, the large rapidly manages its reaction to the event to prevent extreme negative effects, while the medium and small are found to slowly manage their response, leading to extreme negative effects after the event. The results reveal that investors might trust large firms more than the medium and the small ones after the event.
These results support the findings by the authors in Harjoto et al. (2021) that positive abnormal returns can be found for large firms instead of small firms in the US market. However, they are partly inconsistent with the findings by the authors in Al-Awadhi et al. (2020), Liu et al. (2020), Zhang et al. (2020), and Uddin et al. (2021), who suggest that stock returns were negatively impacted, and the authors in Chang et al. (2021) and Narayan et al. (2020), who showed stock returns had a positive effect.
Cumulative abnormal returns of the three portfolios during the three periods—the before-event days, the after-event days, and the event window—are also presented in Figure 5. The blue line on 12 March 2020 divides the event window into two parts: the before-event days and the after-event days.
Figure 5 presents the trends of CARs of the three portfolios during the event window (from 26 February to 16 April). During the event window, the small-market-cap portfolio is extremely negatively affected, and is the most volatile of the three; the medium-market-cap portfolio is more negatively affected after the event than before the event; and the large-market-cap portfolio is more stable than the others, although it is slightly negatively impacted before the event.
The left-hand side of the blue line (the before-event days) shows the trends of the CARs of the three portfolios during the before-event days (from 26 February to 11 March). The CAR of the large-market-cap portfolio () is slightly lower than zero, while the CAR of the medium-market-cap portfolio () is slightly higher than zero. The trend of CAR of the small-market-cap portfolio () shows that the portfolio is considerably volatile.
The right-hand side of the blue line (the after-event days) shows the trends of CARs of the three portfolios during the after-event days (from 13 March to 16 April). The CAR of the large-market-cap portfolio () is positive and better than the other CARs ( and ). The trend of the CAR of the medium-market-cap portfolio () is slightly negative; the trend of CAR of the small-market-cap portfolio () shows that the portfolio is considerably adversely impacted.
In short, during the event window, the medium and small-market-cap portfolios are impacted more negatively than the large-market-cap portfolio. During the before-event days, the large-market-cap portfolio is slightly negatively affected, but it tends to be better after the event. The medium and small-market-cap portfolios seem not to be adversely affected before the event, but they are considerably negatively affected after the event.
3.2. Robustness Check
In this part, this research compares the cumulative abnormal returns for each pair of portfolios: large–medium, large–small, and medium–small, to test if the CARs of each pair are different. We use the Welch t-test to test this hypothesis. The results support the empirical results that the CARs of each pair of portfolios are different, meaning that each portfolio is differently affected.
The results in Table 4 confirm that the CARs of each pair of portfolios are different for the event window, before-event days, and after-event days because all the tests accept the alternative hypothesis at the significance level of 1%.
3.3. Extremely Positive and Negative Abnormal Returns?
In this section, the research investigates if there are any extremely positive and negative abnormal returns of the three portfolios during the event window. According to MacKinlay (1997), abnormal returns for good news and bad news are defined as actual returns exceeding expected returns by more than and dropping lower than , respectively. In this research, therefore, we define extremely positive abnormal returns as actual returns exceeding expected returns by more than , and extremely negative abnormal returns as actual returns exceeding expected returns by lower than during the event window, i.e., abnormal returns are considered to be extremely positive abnormal returns if they are higher than , and as extremely negative abnormal returns if they are lower than .
Interestingly, the research finds that during the after-event days, extremely positive abnormal returns were obtained by holding the small-market-cap portfolio. The results are presented in Table 5.
During the before-event days, the small-market-cap portfolio is found to obtain extremely positive abnormal returns fewer times (only one time) than extremely negative abnormal returns (three times). However, the large and medium-market-cap portfolios seem not to earn any extremely positive or negative abnormal returns.
During the after-event days, the large-market-cap portfolio seems not to earn any extremely positive or negative abnormal returns, but the medium and small-market-cap portfolios do. The medium-market-cap portfolio earned an extremely positive abnormal return of . The small-market-cap portfolio earned an extremely positive abnormal return several times, varying from to ; however, the portfolio earned extremely negative abnormal returns several times, varying from to .
In short, the results suggest that there are opportunities to earn extremely positive abnormal returns by holding the medium and small-market-cap portfolios during the after-event period. The small-market-cap portfolio seems to provide more opportunities to earn extremely positive abnormal returns than the medium. However, the large-market-cap portfolio seems not to earn any extremely positive abnormal return.
Furthermore, the small-market-cap portfolio earns both extremely positive and negative abnormal returns after the event more frequently than the other portfolios; this implies that the small-market-cap portfolio is the most volatile of the three. Volatile stocks might therefore provide more opportunities for extremely positive abnormal returns. Investors might use the quick-return strategy—quickly reacting to sell or buy stocks—for small-market-cap stocks to earn a higher return.
4. Conclusions
This research investigates the role of market cap in returns during the COVID-19 pandemic, especially around the “lockdown” policy in Norway. The research conducts the “event study” method for three periods: the event window, the before-event days, and the after-event days for the large, medium, and small-market-cap portfolios.
The main results suggest that during the event window, the medium and small-market-cap portfolios are impacted more negatively than the large-market-cap portfolio. During the before-event days, the large-market-cap portfolio is slightly negatively affected, but it tends to be better after the event. The medium and small-market-cap portfolios are not adversely affected before the event, but they are considerably negatively affected after the event. The small-market-cap portfolio is affected more severely negatively than the medium one. The small-market-cap portfolio is the most volatile of the three during the event window.
This research also finds that the market cap illustrates its important role in relation to risk and returns during the crisis. The larger the market cap, the more stable the stocks.
In addition, this research indicates that there are opportunities to earn extremely positive abnormal returns (from 2.5%) after the event by holding the small and medium-market-cap portfolios, but not for the large-market-cap portfolio. It seems that there are more opportunities to earn extremely positive abnormal returns for the small-market-cap portfolio than the medium one.
Funding
This research received no external funding.
Data Availability Statement
Information on data is shown in Note 2.
Acknowledgments
I would like to thank anonymous reviewers for insightful comments and helpful suggestions towards improving this article.
Conflicts of Interest
The author declares no conflict of interest.
| 1 | RCEP stands for the Regional Comprehensive Economic Partnership, which is a free-trade agreement (FTA) between the 10 member states of the Association of Southeast Asian Nations and five other FTA partners; more information can be found here: https://asean.org/our-communities/economic-community/integration-with-global-economy/the-regional-comprehensive-economic-partnership-rcep/ (accessed on 10 September 2023). |
| 2 | The stocks were found at https://live.euronext.com/en/product/indices/NO0000000021-XOSL (accessed on 30 April 2020). |
References
- Aizenman, Joshua, Yothin Jinjarak, Minsoo Lee, and Donghyun Park. 2016. Developing countries’ financial vulnerability to the eurozone crisis: An event study of equity and bond markets. Journal of Economic Policy Reform 19: 1–19. [Google Scholar] [CrossRef]
- Al-Awadhi, Abdullah M., Khaled Alsaifi, Ahmad Al-Awadhi, and Salah Alhammadi. 2020. Death and contagious infectious diseases: Impact of the COVID-19 virus on stock market returns. Journal of Behavioral and Experimental Finance 27: 100326. [Google Scholar] [CrossRef] [PubMed]
- Banz, Rolf W. 1981. The relationship between return and market value of common stocks. Journal of Financial Economics 9: 3–18. [Google Scholar] [CrossRef]
- Becchetti, Leonardo, and Rocco Ciciretti. 2011. Stock market reaction to th global financial crisis: Testing for the lehman brothers’ event. Giornale degli Economisti e Annali di Economia 70: 3–58. [Google Scholar]
- Beer, Christian, Janine Maniora, and Christiane Pott. 2023. COVID-19 pandemic and capital markets: The role of government responses. Journal of Business Economics 93: 11–57. [Google Scholar] [CrossRef]
- Binder, John. 1998. The event study methodology since 1969. Review of Quantitative Finance and Accounting 11: 111–37. [Google Scholar] [CrossRef]
- Brown, Stephen J., and Jerold B. Warner. 1985. Using daily stock returns: The case of event studies. Journal of Financial Economics 14: 3–31. [Google Scholar] [CrossRef]
- Cervantes, Paula, Antonio Díaz, Carlos Esparcia, and Diego Huélamo. 2022. The impact of COVID-19 induced panic on stock market returns: A two-year experience. Economic Analysis and Policy 76: 1075–97. [Google Scholar] [CrossRef]
- Chang, Chun-Ping, Gen-Fu Feng, and Mingbo Zheng. 2021. Government fighting pandemic, stock market return, and COVID-19 virus outbreak. Emerging Markets Finance and Trade 57: 2389–406. [Google Scholar] [CrossRef]
- Cimini, Riccardo. 2015. How has the financial crisis affected earnings management? A european study. Applied Economics 47: 302–17. [Google Scholar] [CrossRef]
- Dharani, Munusamy, M. Kabir Hassan, Makeen Huda, and Mohammad Zoynul Abedin. 2023. COVID-19 pandemic and stock returns in india. Journal of Economics and Finance 47: 251–66. [Google Scholar] [CrossRef]
- Dimovski, William. 2009. The global financial crisis and the centro properties group earnings revision and refinancing announcements: An event study. Pacific Rim Property Research Journal 15: 417–29. [Google Scholar] [CrossRef]
- Dooley, Michael, and Michael Hutchison. 2009. Transmission of the us subprime crisis to emerging markets: Evidence on the decoupling–recoupling hypothesis. Journal of International Money and Finance 28: 1331–49. [Google Scholar] [CrossRef]
- Fiordelisi, Franco, Giuseppe Galloppo, and Ornella Ricci. 2014. The effect of monetary policy interventions on interbank markets, equity indices and g-sifis during financial crisis. Journal of Financial Stability 11: 49–61. [Google Scholar] [CrossRef]
- Harjoto, Maretno Agus, Fabrizio Rossi, and John K. Paglia. 2021. COVID-19: Stock market reactions to the shock and the stimulus. Applied Economics Letters 28: 795–801. [Google Scholar] [CrossRef]
- Lee, Chi-Chuan, Chien-Chiang Lee, and Yizhong Wu. 2023. The impact of COVID-19 pandemic on hospitality stock returns in China. International Journal of Finance & Economics 28: 1787–800. [Google Scholar]
- Li, Weiqing, Fengsheng Chien, Hafiz Waqas Kamran, Talla M. Aldeehani, Muhammad Sadiq, Van Chien Nguyen, and Farhad Taghizadeh-Hesary. 2022. The nexus between COVID-19 fear and stock market volatility. Economic Research-Ekonomska Istraživanja 35: 1765–85. [Google Scholar] [CrossRef]
- Liu, Min, Wei-Chong Choo, and Chien-Chiang Lee. 2020. The response of the stock market to the announcement of global pandemic. Emerging Markets Finance and Trade 56: 3562–77. [Google Scholar] [CrossRef]
- MacKinlay, A. Craig. 1997. Event studies in economics and finance. Journal of Economic Literature 35: 13–39. [Google Scholar]
- Mazur, Mieszko, Man Dang, and Miguel Vega. 2021. COVID-19 and the march 2020 stock market crash. Evidence from s&p1500. Finance Research Letters 38: 101690. [Google Scholar]
- Miyajima, Hideaki, and Yishay Yafeh. 2007. Japan’s banking crisis: An event-study perspective. Journal of Banking & Finance 31: 2866–85. [Google Scholar] [CrossRef]
- Miyanoya, Atsushi. 1999. Price discovery functions in japan’s corporate bond market: An event study of the recent fall 1997 financial crisis. CGFS Papers 11: 1–29. [Google Scholar]
- Narayan, Paresh Kumar, Neluka Devpura, and Hua Wang. 2020. Japanese currency and stock market—what happened during the COVID-19 pandemic? Economic Analysis and Policy 68: 191–98. [Google Scholar] [CrossRef] [PubMed]
- Ranjeeni, Kumari. 2014. Sectoral and industrial performance during a stock market crisis. Economic Systems 38: 178–93. [Google Scholar] [CrossRef]
- Ricci, Ornella. 2015. The impact of monetary policy announcements on the stock price of large european banks during the financial crisis. Journal of Banking & Finance 52: 245–55. [Google Scholar] [CrossRef]
- Scherf, Matthias, Xenia Matschke, and Marc Oliver Rieger. 2022. Stock market reactions to COVID-19 lockdown: A global analysis. Finance Research Letters 45: 102245. [Google Scholar] [CrossRef]
- Størdal, Ståle, Gudbrand Lien, Ørjan Mydland, and Erik Haugom. 2021. Effects of strong and weak non-pharmaceutical interventions on stock market returns: A comparative analysis of norway and sweden during the initial phase of the COVID-19 pandemic. Economic Analysis and Policy 70: 341–50. [Google Scholar] [CrossRef]
- Størdal, Ståle, Minh Thi Hong Dinh, Erik Haugom, and Gudbrand Lien. 2020. Norwegian stock market behaviour during the initial phase of the COVID-19 pandemic. Beta 34: 207–21. [Google Scholar] [CrossRef]
- Uddin, Moshfique, Anup Chowdhury, Keith Anderson, and Kausik Chaudhuri. 2021. The effect of COVID-19 pandemic on global stock market volatility: Can economic strength help to manage the uncertainty? Journal of Business Research 128: 31–44. [Google Scholar] [CrossRef]
- Umar, Muhammad, Ghulame Rubbaniy, Amjad Iqbal, Syed Kumail Abbas Rizvi, and Yan Xu. 2023. COVID-19 and stock market liquidity: International evidence. Economic Research-Ekonomska Istraživanja 36: 2142257. [Google Scholar] [CrossRef]
- Wilson, Berry, Anthony Saunders, and Gerard Caprio Jr. 2000. Financial fragility and mexico’s 1994 peso crisis: An event-window analysis of market-valuation effects. Journal of Money, Credit and Banking 32: 450–68. [Google Scholar] [CrossRef]
- Zhang, Dayong, Min Hu, and Qiang Ji. 2020. Financial markets under the global pandemic of COVID-19. Finance Research Letters 36: 101528. [Google Scholar] [CrossRef] [PubMed]
- Zhang, Wenwen, Shuo Cao, Xuan Zhang, and Xuefeng Qu. 2023. COVID-19 and stock market performance: Evidence from the rcep countries. International Review of Economics & Finance 83: 717–35. [Google Scholar]
Figure 1.
Performance of the Oslo Bors (OSEAX) against major indices. Adapted from Størdal et al. (2020).
Figure 1.
Performance of the Oslo Bors (OSEAX) against major indices. Adapted from Størdal et al. (2020).
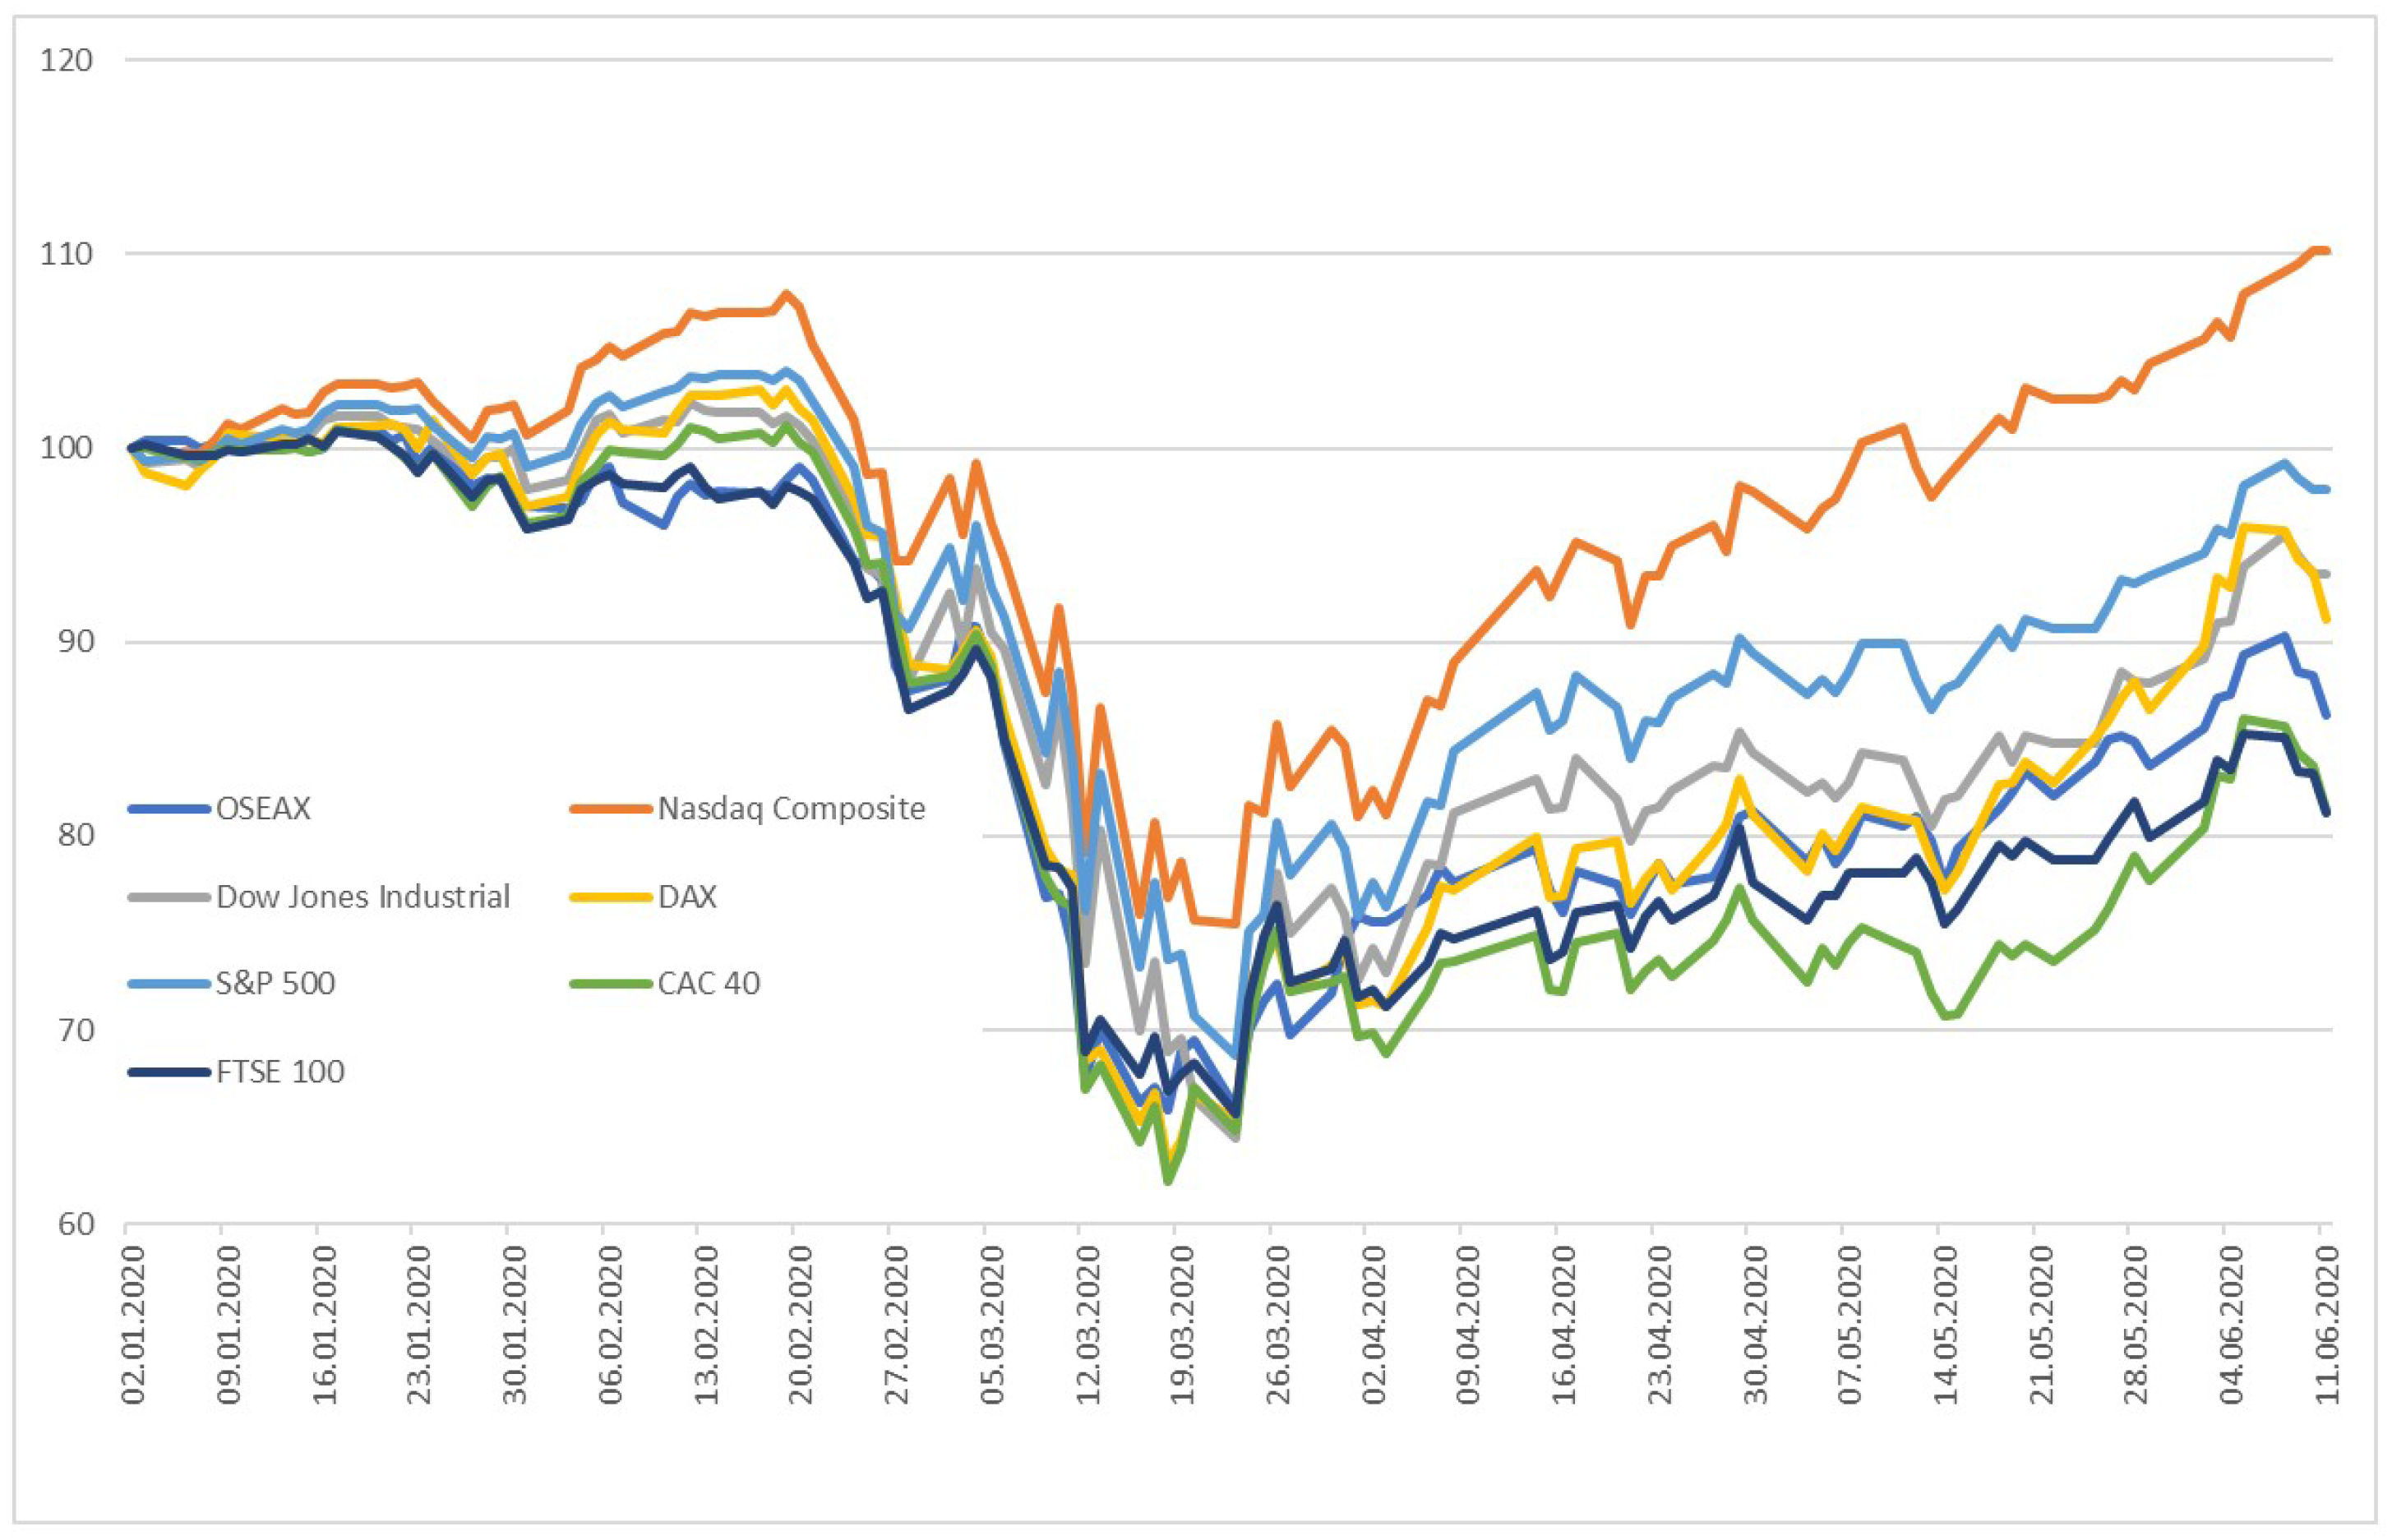
Figure 2.
Timeline for event study.

Figure 3.
Returns vs. volatility during the event period. Notes: SmallPort, MediumPort, and LargePort are small, medium, and large portfolios, respectively.
Figure 3.
Returns vs. volatility during the event period. Notes: SmallPort, MediumPort, and LargePort are small, medium, and large portfolios, respectively.

Figure 4.
Portfolio returns against market-index return.

Figure 5.
Cumulative Abnormal returns during the event period. Notes: , , and are the CAR of the large-market-cap portfolio, CAR of the medium-market-cap portfolio, and CAR of the small-market-cap portfolio, respectively. The event day is 12 March.
Figure 5.
Cumulative Abnormal returns during the event period. Notes: , , and are the CAR of the large-market-cap portfolio, CAR of the medium-market-cap portfolio, and CAR of the small-market-cap portfolio, respectively. The event day is 12 March.


Table 1.
Market-cap portfolios (millions USD).
| N | Mean | St.dev | Median | Min | Max | |
|---|---|---|---|---|---|---|
| Large portfolio | 7 | 19,590.61 | 14,297.70 | 10,563.30 | 9705.55 | 52,047.88 |
| Medium portfolio | 9 | 4280.42 | 1570.01 | 3727.08 | 2434.10 | 7053.25 |
| Small portfolio | 9 | 1073.16 | 719.11 | 598.38 | 76.16 | 1980.37 |
Notes: the market values are converted from Norwegian currency (NOK) to USD (Exchange rate = 0.1138).
Table 2.
Summary statistics.
| Statistic | N | Mean | St. Dev. | Min | Max |
|---|---|---|---|---|---|
| Estimation window | |||||
| Market index | 249 | 0.000614 | 0.008 | −0.024 | 0.026 |
| Ri_largeport | 249 | 0.000548 | 0.007 | −0.022 | 0.024 |
| Ri_mediumport | 249 | 0.000577 | 0.011 | −0.030 | 0.031 |
| Ri_smallport | 249 | 0.001156 | 0.018 | −0.058 | 0.054 |
| Event window | |||||
| Market index | 34 | −0.006086 | 0.035 | −0.092 | 0.055 |
| Ri_largeport | 34 | −0.003709 | 0.032 | −0.082 | 0.057 |
| Ri_mediumport | 34 | −0.008516 | 0.041 | −0.121 | 0.076 |
| Ri_smallport | 34 | −0.013623 | 0.057 | −0.173 | 0.087 |
| Before-event days | |||||
| Market index | 11 | −0.020650 | 0.032 | −0.085 | 0.030 |
| Ri_largeport | 11 | −0.016071 | 0.027 | −0.061 | 0.030 |
| Ri_mediumport | 11 | −0.024003 | 0.036 | −0.098 | 0.031 |
| Ri_smallport | 11 | −0.039975 | 0.064 | −0.173 | 0.043 |
| After-event days | |||||
| Market index | 22 | 0.005089 | 0.029 | −0.055 | 0.055 |
| Ri_largeport | 22 | 0.006023 | 0.029 | −0.048 | 0.057 |
| Ri_mediumport | 22 | 0.004352 | 0.033 | −0.054 | 0.076 |
| Ri_smallport | 22 | 0.003651 | 0.046 | −0.104 | 0.087 |
Notes: Ri_largeport: daily returns on the large-market-cap portfolio, Ri_mediumport: daily returns on the medium-market-cap portfolio, Ri_smallport: daily returns on the small-market-cap portfolio, and market index: daily returns on the market index. The returns are calculated based on Norwegian currency (NOK).
Table 3.
Results of the event study.
| Portfolios | Mean (%) | t Value | p Value |
|---|---|---|---|
| Event window | |||
| CAR_large | 1.6 *** | 4.9092 | 0.0000 |
| CAR_medium | −2.5 *** | −5.3155 | 0.0000 |
| CAR_small | −5.9 *** | −6.5735 | 0.0000 |
| Before-event days | |||
| CAR_large | −0.5 ** | −2.7494 | 0.0205 |
| CAR_medium | 0.8 *** | 3.2524 | 0.0087 |
| CAR_small | −1.3 | −0.99795 | 0.3418 |
| After-event days | |||
| CAR_large | 3.7 *** | 13.933 | 0.0000 |
| CAR_medium | −1.9 *** | −5.3717 | 0.0000 |
| CAR_small | −7.1 *** | −8.4419 | 0.0000 |
Notes: CAR_large, CAR_medium, and CAR_small are cumulative abnormal returns for the large, medium, and small-market-cap portfolios, respectively. *** 0.01; ** 0.05; This tableshows the two-tail t-test for cumulative abnormal returns of the three portfolios: large, medium, and small-market-cap portfolios for the event window, the before-event days, and the after-event days. The null hypothesis: the true mean of cumulative abnormal returns is equal to zero (i.e., no event effect); alternative hypothesis: the true mean of cumulative abnormal returns is not equal to 0 (i.e., event effect).
Table 4.
Comparing CARs between the three portfolios. The Welch t-test is used for testing the difference in the two CAR means of two portfolios: large–medium, large–small, and medium–small.
Table 4.
Comparing CARs between the three portfolios. The Welch t-test is used for testing the difference in the two CAR means of two portfolios: large–medium, large–small, and medium–small.
| Portfolios | Large Port | Medium Port | Small Port | Alternative Hypothesis | p-Values |
|---|---|---|---|---|---|
| Event window | |||||
| CAR mean (%) | 1.6 | −2.5 | True difference in means is not equal to 0 | *** | |
| CAR mean (%) | 1.6 | −5.9 | True difference in means is not equal to 0 | *** | |
| CAR mean (%) | −2.5 | −5.9 | True difference in means is not equal to 0 | *** | |
| Before-event days | |||||
| CAR mean (%) | −0.5 | 0.8 | True difference in means is not equal to 0 | *** | |
| After-event days | |||||
| CAR mean (%) | 3.7 | −1.9 | True difference in means is not equal to 0 | *** | |
| CAR mean (%) | 3.7 | −7.1 | True difference in means is not equal to 0 | *** | |
| CAR mean (%) | −1.9 | −7.1 | True difference in means is not equal to 0 | *** | |
Notes: *** p < 0.01. For before-event days, because the CAR of the small portfolio is not significant (see Table 3), we only compare the CAR mean of the large with that of the medium.
Table 5.
Extremely positive and negative abnormal returns.
| Portfolios | Dates | EP AbR (%) | EN AbR (%) |
|---|---|---|---|
| Before-event days | |||
| AbR_large | 0 | 0 | |
| AbR_medium | 0 | 0 | |
| AbR_small | 28 February 2020 | 6.27 | |
| 4 March 2020 | −3.29 | ||
| 5 March 2020 | −4.77 | ||
| 9 March 2020 | −3.14 | ||
| After-event days | |||
| AbR_large | 0 | 0 | |
| AbR_medium | 23 March 2020 | 2.53 | 0 |
| AbR_small | 18 March 2020 | −3.69 | |
| 19 March 2020 | −4.41 | ||
| 20 March 2020 | 5.13 | ||
| 26 March 2020 | −3.51 | ||
| 27 March 2020 | 3.60 | ||
| 2 April 2020 | 5.31 | ||
| 6 April 2020 | −3.55 | ||
| 14 April 2020 | −7.38 | ||
| 16 April 2020 | 2.73 | ||
Disclaimer/Publisher’s Note: The statements, opinions and data contained in all publications are solely those of the individual author(s) and contributor(s) and not of MDPI and/or the editor(s). MDPI and/or the editor(s) disclaim responsibility for any injury to people or property resulting from any ideas, methods, instructions or products referred to in the content. |
© 2023 by the author. Licensee MDPI, Basel, Switzerland. This article is an open access article distributed under the terms and conditions of the Creative Commons Attribution (CC BY) license (https://creativecommons.org/licenses/by/4.0/).
Share and Cite
MDPI and ACS Style
Dinh, M.T.H. How Does Market Cap Play Its Role in Returns during COVID-19? The Case of Norway. J. Risk Financial Manag. 2023, 16, 414. https://doi.org/10.3390/jrfm16090414
AMA Style
Dinh MTH. How Does Market Cap Play Its Role in Returns during COVID-19? The Case of Norway. Journal of Risk and Financial Management. 2023; 16(9):414. https://doi.org/10.3390/jrfm16090414
Chicago/Turabian StyleDinh, Minh Thi Hong. 2023. "How Does Market Cap Play Its Role in Returns during COVID-19? The Case of Norway" Journal of Risk and Financial Management 16, no. 9: 414. https://doi.org/10.3390/jrfm16090414