
Moored Minds: An Experimental Insight into the Impact of the Anchoring and Disposition Effect on Portfolio Performance


Department of Management Studies, Indian Institute of Technology Madras, Chennai 600036, India
*
Author to whom correspondence should be addressed.
J. Risk Financial Manag. 2023, 16(8), 349; https://doi.org/10.3390/jrfm16080349
Submission received: 20 June 2023
/
Revised: 18 July 2023
/
Accepted: 19 July 2023
/
Published: 25 July 2023
(This article belongs to the Special Issue Emerging Issues in Economics, Finance and Business)
Abstract
:This study investigates the anchoring bias and disposition effect in investor trading decisions under different market volatility conditions (stable and volatile markets) and examines their impact on portfolio performance. Employing a quasi-experimental design, participants engage in interactive trading with four securities—two with potential negative returns and two with positive returns—within a simulated asset market. The findings reveal the presence of both the disposition effect and the anchoring bias among individual investors in India. Notably, market volatility influences these behavioral biases, with the disposition effect more pronounced in volatile markets, while the anchoring bias is significant in stable markets. Furthermore, investors exhibiting the disposition effect tend to have lower portfolio performance, while those influenced by the anchoring bias achieve relatively better results. These insights can aid individual investors in recognizing their behavioral biases and making informed trading decisions to enhance portfolio performance. Additionally, this study presents valuable suggestions to financial institutions and regulatory government agencies engaged in similar experiments, with the goal of improving financial decision-making and investment behavior.
1. Introduction
Humans use mental shortcuts (cognitive biases) to facilitate the decision-making process (Gilovich et al. 2002), and they are also susceptible to emotional biases (Shefrin and Statman 1985). Biases are an inclination towards errors as they result in a deviation between an individual’s subjective intentions and objective reality. The errors resulting from these deviations based on traditional theories have garnered significant attention in behavioral finance research, particularly in the context of investment decisions (Bhattacharya et al. 2012). Numerous studies, such as those of Odean (1998), Garvey and Murphy (2004), Aspara and Hoffmann (2015), and Koestner et al. (2017), have demonstrated that these errors stemming from biases can lead to substantial reductions in investment returns. However, many individuals are unaware of the influence biases have on their decision-making and find it challenging to control or avoid them consciously. In this study, we specifically focus on two biases—the disposition effect (an emotional bias) and the anchoring bias (a cognitive bias)—and examine their impact on trading decisions in the presence of market volatility, subsequently affecting portfolio performance. The disposition effect and the anchoring bias are widely recognized as two highly influential and robust biases that significantly impact investors’ decision-making. The disposition effect, initially described by Shefrin and Statman (1985), refers to the tendency of investors to hold on to losing securities for longer periods while selling winning securities too early. On the other hand, the anchoring bias, as proposed by (Kahneman and Tversky 1979), refers to the tendency of individuals to rely on initial information, such as reference points, when assessing the value of gains and losses for decision-making purposes.
Investment decisions are primarily driven by the trade-offs between risk and return. Extensive research has explored various factors that influence investors’ return expectations, risk perceptions, and trading decisions, consequently shaping their investment performance. Factors such as past prices, price paths, and market cycles have been heavily relied upon by investors as reference points that foment their investment decisions. However, the impact of market volatility on investors’ expectations and trading decisions is an overlooked aspect in the existing literature. Market volatility refers to the degree of price fluctuations observed in financial markets, and it varies over time and across different types of securities. Multiple factors, including macroeconomic conditions, financial leverage, unexpected events like the COVID-19 pandemic, and behavioral and psychological factors, influence the volatility of financial assets over time. Different asset types also exhibit varying levels of volatility, with gold being less volatile, stocks having moderate volatility, and crypto assets being known for higher volatility. While a limited amount of the literature directly measures the impact of market volatility on investors’ behavior. Studies, such as Hatch et al. (2018) found that volatile and decreasing trend markets tend to lower risk tolerance and lead to more-conservative investment choices. Furthermore, Kostopoulos et al. (2021) observed that market volatility increases investors’ sense of ambiguity, causing them to feel less certain about their investments and require more frequent portfolio updates.
Market volatility is a crucial risk indicator in financial markets. Understanding how price fluctuations can generate feelings of uncertainty and anxiety among investors, subsequently influencing their trading decisions, is an important area of investigation. Therefore, this study aims to investigate the relationship between market volatility and investors’ trading decisions, specifically focusing on the influence of market volatility on behavioral biases (disposition effect and anchoring bias) that may lead to irrational trading choices. In addition, the study seeks to assess how these biases affect individual investors’ investment performance, which is an important aspect that has been understudied in the behavioral finance literature. This study specifically focuses on individual Indian investors, as there is a lack of experimental studies in this context. The current study has three main objectives: identifying and analyzing behavioral biases in Indian investors’ trading decisions; exploring the influence of market volatility on these biases; and examining how these biases affect investment performance. By addressing these objectives, the study aims to enhance our understanding of the interplay between market volatility, behavioral biases, and investment outcomes among individual Indian investors.
This study employs a quasi-experimental approach with a within-subject design to establish a causal interpretation by ruling out reverse causality (Antonakis et al. 2014). It also offers a controlled environment that can help us better understand the emergence of biases in decision-making. Our research design is inspired by Braga and Fávero (2017), to develop investment games that simulate profit and loss situations across different market scenarios (volatile and stable markets). Subjects are tasked with deciding whether to sell or hold securities from stable and volatile asset markets and contrast the impact of these decisions within a simulated asset market. The main results of the study are threefold. Firstly, we observed that the disposition effect and the anchoring bias influence Indian individual investors. Second, market volatility can affect the investors’ behavioral biases such that the disposition effect is more prominent in the volatile market, while the anchoring bias was significant in the stable market, which indicates that market volatility can shape and amplify behavioral biases. Lastly, investors prone to the disposition effect tended to have lower portfolio performance, while those exhibiting the anchoring bias demonstrated relatively better performance.
Our research contributes to the nascent experimental literature on behavioral biases and investment decisions in several significant ways. Firstly, it provides valuable insights into how market volatility influences individual-level behavioral biases in trading decisions. Secondly, our study extends the current literature by examining the impact of behavioral biases on investors’ portfolio performance. Furthermore, it introduces a novel methodology for measuring the anchoring bias in investors’ trading decisions. Our research findings will help individual investors to identify and understand their behavioral biases. This awareness can empower them to make more-informed trading decisions and enhance their portfolio performance. In addition, this study provides some suggestions to financial institutions and regulatory government agencies involved in conducting similar experiments to improve financial decision-making and investment behavior.
The remainder of the paper is structured as follows. The second section provides a review of the literature and related hypotheses. The experiment design is described in Section 3. Section 4 reports the results, Section 5 presents the study’s reliability and validity, Section 6 discusses the findings, and the final section concludes with research implications.
2. Literature Review
Our paper relates to investigations on the disposition effect, the anchoring bias, and portfolio performance studies. Therefore, we examine the pertinent literature in these fields. We begin with studies on the disposition effect, then proceed to the anchoring bias, and conclude with the literature on investment performance. The literature review has been presented in a tabular format in Appendix A for ease of comprehension.
2.1. Disposition Effect
The term “disposition effect” was coined by Shefrin and Statman (1985). Investors in the stock market often make the mistake of selling a winning stock too soon and holding on to a losing stock for too long. Since its discovery by Shefrin and Statman (1985), the disposition effect has been confirmed in a wide range of experimental and real-world economic contexts. It has also been replicated for numerous countries and categories of investors, including professional and novice investors. We restrict our discussion to experimental studies on the disposition effect to conserve space.
There is substantial experimental evidence for the emergence of the disposition effect. Weber and Camerer (1998) conducted the first study through an experimental method to test the disposition effect using the purchase price and the last price as reference points. Subjects were asked if they could buy and sell six risky assets. The results revealed a disposition impact, with 40% of selling orders for losing stocks and 60% for winning stocks. Chui (2001) applied the setting of Weber and Camerer’s (1998) design with some modifications, such as the penalty for investors with low trading performance, testing belief in the mean reversion hypothesis, and checking psychological factors and the locus of control to explain the disposition effect. Chui found that belief in mean reversion does not affect the disposition effect and observed that internal locus of control has more-pronounced disposition effects. Subsequently, studies established the relationship between the disposition effect and investors’ characteristics such as gender (Da Costa et al. 2008; Rau 2015; Braga and Fávero 2017; Cueva et al. 2019), experience (Dhar and Zhu 2006; Da Costa et al. 2013), and various activities and interventions (Bulipopova et al. 2014; Rau 2015; Cao et al. 2022). The investigations above into the disposition effect have primarily focused on countries like the United States, Europe, and parts of Asia—particularly China. These countries and regions have well-developed financial markets and a higher level of financial literacy among investors. Emerging nations, such as India, have experienced rapid economic growth despite having less-sophisticated financial markets and lower levels of financial literacy (Agarwalla et al. 2015). Furthermore, previous research has shown that disposition impacts younger, naive, and inexperienced investors more (Da Costa et al. 2013; Dhar and Zhu 2006). India has a large young population, with 65% of Indians under 35 years old. According to a Sequoia capital survey, 70% of new demat account holders are youthful, first-time investors. Therefore, it is crucial to research the disposition effect in emerging markets like India. Thus, the following is our initial hypothesis:
H1.
The disposition effect impacts the trading decisions of Indian individual investors.
On average, most experimental studies on the disposition effect are focused on fictitious assets whose price movements and magnitude are determined by stochastic processes with fixed probabilities. Most of the experimental studies have applied Weber and Camerer’s design. Simulated investment games based on historical prices seem more realistic than the prior. The latter design resembles a real-world investment decision-making process, enabling researchers to capture the complexities and dynamics of actual market movements, including volatility, trends, and correlations between different assets. However, a few studies (Da Costa et al. 2013; Braga and Fávero 2017; Guenther and Lordan 2023) have devised an experiment based on simulated investment games, but the effect of market volatility on disposition effect has not been investigated. Previous evidence showed that investors’ risk preferences and beliefs change in response to market conditions (e.g., Cheng et al. 2013; Grinblatt and Keloharju 2001; Bernard et al. 2021) and price paths (e.g., Raghubir and Das 2010; Grosshans and Zeisberger 2018; Borsboom and Zeisberger 2020). Investors are more risk-averse during bust periods, leading to a greater inclination to realize gains (Cheng et al. 2013; Bernard et al. 2021). Investors exhibit a substantial disposition effect in response to extreme losses than moderate losses (Grinblatt and Keloharju 2001). Raghubir and Das (2010) explored how investors’ risk preferences are influenced by the local peaks (maxima) and valleys (minima) observed in a graph representing the variation around a trend line of security prices. Grosshans and Zeisberger (2018) investigated how extreme past prices, as visualized in charts, affect investment decisions. They found that extreme prices in historical charts can shape investors’ perceptions and impact their decision-making process when predicting future price movements. Other researchers have also examined how price path characteristics significantly influence investors’ risk perception, return beliefs, and investment propensity. Their findings revealed that investors are more inclined to invest when presented with price paths that exhibit positive trends and infrequent negative returns or vice-versa. Similarly, Bansal and Jacob (2022) empirically validated the findings of previous experimental studies by demonstrating that price paths with convex patterns substantially impact investors’ trading decisions with market-level data. Furthermore, studies have examined how market cycles influence investors’ expectations and trading decisions. J. S. Lee et al. (2013) examined how different market states, namely bull, neutral, and bear markets, impact investor investment behavior. Their findings indicated that investors tend to sell off more shares during bear markets than bull markets. Similarly, Bernard et al. (2021) demonstrated that investors’ preferences and beliefs exhibit countercyclical behavior. They observed that investors are more likely to realize gains in market downturns, suggesting a tendency to capitalize on opportunities during periods of market decline.
In addition, emerging markets such as India are more vulnerable to market volatility, mispricing, and potential market risks (Zahera and Bansal 2018). Hence, there is a need to examine the disposition effect in different market scenarios (volatile and stable markets). Our study tries to fill this gap by checking whether market volatility impacts the disposition effect.
H2.
Indian individual investors exhibit a stronger disposition effect in volatile markets than in stable markets.
2.2. Anchoring
The anchoring bias was first identified by Tversky and Kahneman (1974) in their laboratory experiment as an anchoring and adjustment bias, which is the tendency of people to rely heavily on the first piece of information (anchor) they receive and adjust insufficiently to make final decisions. Anchoring bias has been extensively studied in every domain. In finance, there are two strands of the literature related to the anchoring bias. The first strand empirically examines the existence of anchoring bias in different financial asset markets. Some studies (George and Hwang 2004; Li and Yu 2009, 2012; Hao et al. 2016) have found substantial evidence of the anchoring bias in the stock market, with the 52-week high as a significant anchor. Proximity to the 52-week high has been shown to enhance the predictive power of past returns in forecasting future returns. The anchoring bias has also been observed in other markets, such as the foreign exchange market (Westerhoff 2003), money market (Campbell and Sharpe 2009), and real estate market (Bucchianeri and Minson 2013; Chang et al. 2016). While substantial evidence exists in these markets, the focus of our discussion will be limited to the literature on the anchoring bias in the context of investment decision-making, as it aligns with the objective of our study.
The second strand of the literature discusses how the anchoring bias influences investment decisions. However, there is a scarcity of experimental studies addressing this phenomenon. Goetzmann and Peles (1997) found that mutual fund investors prefer high-performing funds. Professionals estimate long-term stock returns with less anchoring than undergraduates (Kaustia et al. 2008). Studies have also examined the effects of investors’ gender and experience on anchoring bias. Laryea and Owusu (2022) observed that female investors are more likely to be influenced by anchors than male investors. Most experimental studies on anchoring bias in investment decisions are poorly designed. Studies have been confined to questions like “What do you believe is the current return on the 91-day Treasury bill? (Clue: less than 5%) and “Can you estimate the expected 20-year stock return?” (Clue: 10% correct historical return). When investing in financial markets, investors face complex decisions, such as choosing between mutual funds, equities, or bonds and deciding which specific investments to make and when to buy and sell them. These decisions require significant time and intelligence. Research has shown that humans use mental shortcuts when making complex decisions. In this study, we explore the impact of anchoring bias on minor yet significant investment decisions, specifically the decision to sell a security.
People always make decisions based on a comparison of alternatives across various dimensions. Consequently, all decisions are comparative in nature. Investors often rely on reference points to make trading decisions. The most commonly used reference points are the purchase price (Odean 1998; Weber and Camerer 1998; Grinblatt and Keloharju 2001; Li and Yu 2012) and non-purchase prices like the last traded price and previous high/low prices (Heath et al. 1999; Core and Guay 2001). The existing studies primarily concentrate on how reference points impact investors’ decisions regarding winning and losing securities. However, there is a lack of research directly investigating the influence of anchoring bias on trading decisions within simulated asset markets. Additionally, the experimental literature is scarce exploring anchoring bias among Indian individual investors. As a result, Hypothesis 3 is formulated to determine if anchoring bias affects investors’ selling decisions.
H3.
Anchoring bias impacts the trading decisions of Indian individual investors.
Furthermore, as stated previously, there is substantial evidence of anchoring bias across various financial asset markets. Existing research, however, overlooks the influence of anchoring bias on investors’ decisions to trade securities in a distinct asset market characterized by varying market volatility. Consequently, the following two hypotheses examine the existence of anchoring bias in the stable market and the volatile market.
H4.
Indian individual investors exhibit a stronger anchoring bias in volatile markets than in stable markets.
2.3. Behavioral Biases and Investment Performance
In behavioral finance, it has been asserted that biases are costly affairs as they influence investment decisions and subsequently impact investment performance. Empirical research on the disposition effect provides evidence of their detrimental effect on investment performance. For instance, Odean (1998) discovered that selling winning investments led to higher average excess returns in the following year than holding onto losing ones. Similarly, some studies (Wermers 2005; Icf et al. 2004) found that managers of underperforming funds were reluctant to sell their losing stocks. Another study (Choe and Eom 2009) observed a negative relationship between the disposition effect and investment performance, indicating that investors prone to the disposition effect were more likely to experience inferior investment performance in the future. However, Locke and Mann (2005) found no measurable costs associated with professional traders who are averse to realizing losses. Thus, the study suggests that traders who exhibit the disposition effect may not necessarily suffer significant costs.
There is no direct evidence of the impact of anchoring bias on investment performance. However, research suggests that anchoring can influence stock prices and investment decisions, as discussed in Section 2.2. It is important to note that anchoring bias may not always be negative or irrational. It can arise when individuals make incorrect estimates based purely on an anchor or rely solely on it and disregard other pertinent information, resulting in complex decision-making. Scholars assert that anchoring bias is not the consequence of human irrationality but rather a human resource rationality. They propose that the bias results from a rational trade-off between the time required for adjustment and the error cost caused by the insufficient adjustment (Rezaei 2021). As a result, the magnitude of anchoring bias can vary based on the cost associated with errors and time-related costs. Therefore, it is difficult to predict if investors who exhibit anchoring bias will necessarily have poor investment performance. The opposite scenario, in which investors who exhibit the bias experience positive investment performance, is also plausible.
Many researchers have conducted empirical studies investigating the influence of behavioral biases on investment performance. However, the issue of endogeneity has become a significant concern in these investigations, posing a challenge to finance research. It violates the assumption of exogeneity and makes it difficult to determine whether behavioral biases solely impact investment performance. There is a need to study the impact of behavioral biases in a controlled experimental setting, where external factors can be controlled and the problem of endogeneity can be mitigated. In this study, we employ a quasi-experimental design, explained in detail in the methodology section. Quasi-experiments are considered one of the most effective approaches to control for endogeneity (Reeb et al. 2012). Moreover, quasi-experiments can provide a solid basis for causally interpreting the results by ruling out reverse causality. Hence, we aim to investigate the impact of behavioral biases on investment performance in a laboratory setting. The following hypotheses are formulated to test the relationships:
H5.
Individuals with the disposition effect in their investment decision-making have lower portfolio performance.
H6.
Individuals with anchoring bias in their investment decision-making have lower portfolio performance.
3. Experimental Design
3.1. Quasi-Experimental Design
A quasi-experimental, repeated measures design allow every subject to trade in a simulated market environment in an interactive setting to test the research hypotheses. It is framed to examine the disposition effect and anchoring bias among Indian individual investors. This design is chosen for several reasons: first, it enhances internal validity by allowing participants to serve as their own control, effectively reducing individual variability. Second, it addresses the limitations of small sample size by increasing statistical power through repeated measurements. The experiment represents stable and volatile investment markets. Trade movements of Nifty indices such as consumer durable and pharma represented stable asset markets (stable markets). Trade movements of cryptocurrencies such as bitcoin and Ethereum represented volatile investment trades (volatile markets). Market volatility was created with historical price data (April 2014 to March 2020) of the selected assets.
Subjects took part in a virtual quasi-experiment using the Zoom app, where they viewed trade charts of two assets simultaneously using PowerPoint animation. Each asset trade started with a base price of INR 100 and exhibited five successive trade sessions. The simultaneous exhibit of trade sessions was presented as four trade scenarios for each stable and volatile market. A total of 16 scenarios were designed, each exhibiting five trade sessions. Subjects’ choice of selling or holding an asset comprise the data for our study. They could sell the two assets displayed simultaneously in the games at any time during the trading session (1 to 5) (Figure 1). The price charts of the two assets were unrelated. Each subject took 25–30 min to complete the investment game and survey. Subjects also filled out a Google form with demographic information and self-established loss-tolerance levels. A feedback form elicited the reasoning behind each trading decision.
We divided the games into profit and loss categories based on the final return. The initial price of each security was INR 100. We classified a game as a profit game if the security price at the fifth trading decision was greater than INR 100 and as a loss game if it was less than INR 100. Games were considered stable when price variation fell below 20%; otherwise, they were volatile. Using this method, we classified the games into two market scenarios—volatile and stable. Table 1 provides a summary of 16 investment games. The initial pair of games, G11 and G12, were used to familiarize subjects with the games. The games G21, G31, G41, G52, G61, and G81 were profitable, while the remaining games were losses. The games from G11 to G42 were classified under the stable market scenario, as their average standard deviation in both profit and loss games was below 20%. On the other hand, games from G51 to G82 were categorized as volatile asset market games, exhibiting higher volatility. These volatile games had average standard deviations of 127.86% in profit games and 42.31% in loss games (refer to Table 1). We also applied all the computations for the total market, which is the summation of the stable and volatile markets.
The convenience sampling method was chosen to ensure the subjects’ involvement in the experiment. One advantage of utilizing convenience sampling is obtaining investors of diverse socio-demographic attributes. Table 2 shows details of the subjects. Our subjects consisted of 14 males and 24 females, which accounted for 35% and 65% of the subject population, respectively. Among the subjects, 45% had low income, while 55% had high income. Regarding “employment”, 57.5% of the subjects were employed, while 42.5% were unemployed or were Ph.D. and master’s degree students. In terms of experience, 28% of respondents had more than two years of stock market exposure, while 72% had less than two years of experience.
3.2. Measurement of the Disposition Effect
We applied the Odean (1998) measure, known for its robustness in capturing market cycles and varied market volatility. The presence of the disposition effect can be determined by calculating the difference between the proportion of gains realized (PGR) and the proportion of losses realized (PLR) by an individual investor (i). The proportion of gains realized (PGRi) and proportion of losses realized (PLRi) for the ith individual is computed as
where RGi (RLi) is the number of trades by investor i with realized gains (losses), and PGi(PLi) is the number of potential trades by investor i with a gains (losses).
PGRi = RGi/(RGi + PGi), PLRi = RLi/(RLi + PLi)
DEi = PGRi − PLRi
The extent of the disposition effect depends on the difference between PGR and PLR. This method corresponds to a series of actions. Each investor’s market portfolio comprises stocks held for gains and those held for future trade. Finally, we calculate the PGR and PLR after analyzing the consequences of each selling decision. In this study, we modified the formula by including the time factor (early versus late) alongside realized gains, realized losses, and paper losses. If the subject sells the security in the first three trading decisions (1)–(3), the sales are considered early; otherwise, they are considered late. Thus, the new formula would be the difference between the proportion of realized gains early (PRGE) and the proportion of realized losses early (PGLE). The equations are stated below:
PGREi = RGEi/(RGEi + PGEi), PLREi = RLEi/(RLEi + PLEi)
DEi = PGREi − PLREi
The disposition effect is present if PGREi is greater than PLREi (PGREi > PLREi). If PGREi is equal to PLREi (PGREi = PLREi), the disposition effect is absent. The reverse disposition effect is verified if PGREi is less than PLREi (PGREi < PLREi).
In addition, we use two alternative metrics to evaluate the robustness of the initial metric. We assess the average holding time to realize losses (AHTL) and the average holding time to realize gains (AHTG) based on the definition proposed by Shefrin and Statman (1985). The disposition effect occurs when investors hold onto losers for too long and sell winners too soon. As per the specification, the disposition effect is computed by subtracting the average holding time to realize losses (AHTL) from the average holding time to realize gains (AHTG).
DEi = AHTLi − AHTWi
AHTL > AHTG—disposition effect exists.
AHTL = AHTG—no disposition effect.
AHTL < AHTG—reverse disposition effect.
Finally, we adopted an econometric approach to quantify the disposition effect. Building upon the simple ordinary least squares (OLS) model proposed by De Winne (2021), we have made modifications to suit our study. In our analysis, we consider the timing of the decision to sell a security as the dependent variable, while the outcome of the sell decision is regarded as the independent variable. In this study, we use the decision to sell a security (early or late) as the dependent variable and the outcome of the decision by selling the security as the independent variable. The model equation is as follows:
Salesi,j,t is equal to one if investor i sells security j in game t and is zero otherwise. Gaini,j,t equals one if investor i’s position in security j is a gain and is zero otherwise. If the β1 is positive and significant, it indicates the disposition effect as subjects sell a winning security early, while the intercept estimate corresponds to the investors selling a losing security late.
By employing these measures, we intend to assess the disposition effect comprehensively, considering both the comparison of early gains and losses and the average holding times for gains and losses.
3.3. Measurement of the Anchoring Bias
Based on the work of Kaustia et al. (2008), we developed a novel method for identifying anchoring bias in our research. In our experiment, subjects simultaneously play profit and loss games. We use the previous highest price as an anchor in profit games, and the previous lowest price is used as an anchor in the loss games because these prices may affect the selling decisions of subjects. Prior research has shown that price peaks and troughs are significant market anchors. On this premise, we hypothesize that investors’ selling decisions in profit games will be influenced by the previous high price, prompting them to sell when the current price approaches it. There are two instances in which the selling price of the subject is closer to the anchor. It can either be near the higher value or a lower value than the anchor value. We compute the Anchoring Index (AI) by using the following formula:
where RDPGi means the relative difference of profit games per investor i; and RDLGi means the relative difference of loss games per investor i
RDPGi = (Selling Price-Previous highest price)/Average difference of selling price and previous highest price of the pooled sample
RDLGi = (Selling Price-Previous lowest price)/Average difference of selling price and previous lowest price of the pooled sample.
AIi = RDPGi − RDLGi
The AI may take on any value from -infinity to +infinity. If there is no anchoring bias in the investor’s judgment, the value of AI will be 0. If the value of the AI is positive, it indicates that the investor is influenced more by the high price in the profit game than the low price in the loss game, and vice versa if the value of AI is negative. The AI measures how much the reference points influence an investor’s selling choice in profit and loss situations.
3.4. Regression Model to Measure Investor’s Portfolio Performance
In this section, a simple OLS regression model is developed to examine the impact of disposition effect (DE) and anchoring bias (AB) on the portfolio performance of individual investors (PP), that is,
Individual investors’ portfolio performance (PPi) is the dependent variable. We measure portfolio performance by computing portfolio return and portfolio risk. The independent variables are the disposition effect (DE) and anchoring bias (AB). They are measured using Equations (4) and (8). In addition, we include several socio-demographic variables such as gender (C1), age (C2), employment status (C3), and experience (C4) as control variables. A value of 1 is assigned to them if they are female, high-income earners, employed, and highly experienced, and a value of 0 is assigned if they fall in the opposite categories. We computed the portfolio return (PRi) and portfolio risk (PRRi) of each individual using the given formulas:
where
Ws = weightage of each security (i.e., 0.25 for each security)
Rs = total return earned in each security (using the holding return formula)
where
Ws = weightage of each security (i.e., 0.25 for each security)
RRs = probability of earning returns below the average offered by each security.
We estimate the OLS regression equation six times. First, we expect behavioral biases to negatively impact portfolio return when we employ portfolio return as a proxy for portfolio performance in stable, volatile, and total markets. Second, we estimate the equation using portfolio risk as a proxy for portfolio performance. We anticipate that behavioral biases positively affect portfolio risk across three-market volatility, which means that subjects who exhibit behavioral biases have taken on more risk than those who do not have them. Refer Appendix B for descriptive statistics including normality test, correlation analysis, and variance inflation factor for all the regression models.
4. Results and Findings
The results section commences by identifying behavioral biases (disposition effect and anchoring bias) across various market volatility levels. It concludes with findings from regression analyses that demonstrate the impact of behavioral biases on portfolio performance. All reported tests are based on one-sided p-values if not otherwise specified.
Table 3 shows the disposition effect results from two methods across different market volatilities. Using statistical analysis, we examined the difference between PGRE and PLRE. We then compared the disposition effect in the stable and volatile markets. We used two tests, one parametric (Welch’s t-test), and the other non-parametric (Wilcoxon signed rank test), for the distribution of the effect. The disposition effect is present but insignificant in a stable market, as the difference between PGRE and PLRE is positive (0.0083). However, both statistics show that DE is positive and significant for the volatile market (0.30) and the total market (0.175). Moreover, the DE in the volatile market (0.3) is significantly higher than the DE in the stable market (0.0083) (t stats = 2.225 at 5% sig. level; z stats = 3.313 at 1% sig. level). The findings are replicated using alternative methods, such as average holding time period and an econometric model. In the stable market, the disposition effect is observed to be positive (0.0083), but the p-value is high (0.436), indicating weak statistical significance. However, in both the volatile market and the total market, the disposition effect is positive and significant at the 1% and 5% significance levels, with values of 0.13 and 0.07, respectively. This suggests that participants tend to hold onto losing securities longer than winning securities. Notably, the disposition effect is significantly higher in the volatile market (0.13) compared to the stable market (0.0083), as indicated by both statistical measures. Furthermore, the result of regression model presented in Table 4 provides consistent evidence, with the beta coefficient being significant in the volatile and total markets, confirming the presence of the disposition effect, as it is observed that subjects tend to sell winning securities early. Overall, these results highlight the influence of market volatility on investors’ tendency to exhibit the disposition effect.
Table 5 shows anchoring bias across asset markets. The stable market’s mean relative difference of all profit games (MMRDPG) is −0.313. On average, subjects sell securities below the previous trading’s highest price compared to the average pooled sample selling the security against the anchor. However, the positive value of MMRDLG (1.617) indicates that, on average, the subjects’ selling price deviates above the previous lowest price in the loss games compared to the pooled sample. Thus, the AI calculated by subtracting MMRDPG from MMRDLG is −1.9307 (p = 0.00), indicating that subjects are more influenced by the previous lowest prices in loss games than by the previous highest prices in profit games. In the volatile market, the AI is positive (0.3920) but not statistically significant, indicating that subjects are more anchored to the previous high prices in loss games than the previous low prices. Similarly, in the total market, both MMRDPG and MMRDLG have positive values (0.412 and 1.015, respectively). Still, the value of the AI is significantly negative (−0.603), showing that subjects are more anchored to the previous lowest prices in losing games than to the previous highest prices in winning games. The results indicate that investors exhibiting the anchoring bias differ according to market volatility.
Table 6 shows the coefficients from the regression of portfolio return on behavioral biases across asset markets. Negative and statistically significant coefficients (−0.048 for SM at 10% sig, −2.243 for VMs at 1% sig, and −1.184 for TMs at 1%) imply that a stronger disposition effect is associated with lower portfolio returns across asset markets. Positive coefficients (0.007 for SM, 0.1181 for VMs, and 0.1812 for TMs) indicate that a higher anchoring bias is associated with a higher portfolio return. However, this association is statistically significant only in TMs at 5%. Moreover, the coefficients of control variables are not statistically significant, indicating that demographic attributes do not affect the impact of behavioral biases on portfolio performance. All the models are statistically significant and a good fit.
Additionally, we can see the effect of behavioral biases on portfolio risk in Table 7. The results show positive and statistically significant coefficients (0.540 for VMs at 1% sig and 0.313 for TMs at 1%) that imply that a stronger disposition effect is associated with greater portfolio risk. Investors who exhibit the disposition effect have a higher portfolio risk than those who do not. However, negative coefficients (−0.001 for SMs, −0.010 for VMs, and −0.017 for TMs) indicate that anchoring bias is lower with a higher portfolio risk, but this association is not statistically significant. Again, demographic variables are statistically insignificant in all markets. Overall, the model is statistically significant for the volatile and total markets.
5. Reliability and Validity of the Study
5.1. Reliability
The experiment is designed to examine the trade decisions taken in profit and loss scenarios in different markets by comparing the average return percentage of paired games using paired t-tests (Table 8). Table 8 shows that the asset returns of each market scenario in each game of the subjects statistically were different, thus establishing the reliability of the experiment design. The first game is an introduction to familiarize participants with the experiment, and it does not show a significant difference in asset returns.
5.2. Validity
Figure 2 and Figure 3 display the results of a feedback form with two open-ended prompts: (1) What information did you use to make your decision? and (2) Subjects’ final remarks about this experiment. The first question ensures that the answers were not random but were based on specific criteria by identifying the information base. The second prompt sought to assess the instrument’s face validity. The responses of 40 subjects were analyzed using thematic analysis. According to a thematic analysis of the subjects’ responses (Figure 2), 74% only used asset price pattern information (market price, return, and chart pattern) to trade, around 9% used holding time, and another 9% considered their loss-tolerance limit. The remaining 6% of respondents recalled their past experiences while making trading decisions. Furthermore, as shown in Figure 3, 55% of subjects said the experiment was informative and interesting, and 15% said it was well-structured, confirming its face validity. Moreover, 10% of subjects believe that additional information such as purchasing options, market information, and industry type should have been included in the experiment. In comparison, 10% believe this experiment helps make real-world investment decisions, and 7.5% believe it provides a good trading experience for novice investors. The remaining 2.5% believe that the experiment is lengthy.
6. Discussion
This section provides a summary and further discussion of the empirical results. The results from Table 3 show that the presence of the disposition effect is more pronounced in volatile markets compared to stable markets among investors. This finding is consistent when using the alternative method to measure the disposition effect. The results support existing research that highlights how investors’ preferences and beliefs are influenced by financial market cycles, market trends, and price path, leading to variations in their trading decisions (Grosshans and Zeisberger 2018; Borsboom and Zeisberger 2020; Bansal and Jacob 2022). There are several plausible explanations for this outcome. First, in a volatile market, the frequency and magnitude of price fluctuations are higher, leading to increased opportunities for investors to experience losses. As a result, loss aversion and risk aversion are amplified in volatile markets, making investors reluctant to realizing losses and more inclined to hold on to losing positions (Pflueger and Rinaldi 2022). Second, a volatile market is characterized by greater uncertainty and perceived risk. Investors may become more cautious and risk-averse during periods of market volatility, leading them to hold on to their existing losing positions. Third, volatile markets can evoke strong emotions like fear, anxiety, and panic, clouding investors’ judgment and amplifying the disposition effect (Tuckett 2009). Lastly, the proxy used to represent stable markets in this study—the stock market—is more secure, regulated, and established than volatile markets (such as the cryptocurrency market, which has only existed for a relatively short period (Hussain et al. 2020)). Therefore, market volatility plays a significant role in shaping investors’ trading decisions, as they tend to exhibit more-rational behavior in stable markets than volatile markets, leaving them vulnerable to the disposition effect. Future research could delve deeper into identifying the specific factors that exert a more significant influence on the presence of the disposition effect in volatile markets when compared to stable markets. Our findings contribute to the existing literature by demonstrating that the disposition effect is not uniform and can vary depending on market conditions (Cheng et al. 2013; Bernard et al. 2021). Furthermore, our research contributes to the emerging literature on the disposition effect in volatile markets, particularly the cryptocurrency market (Haryanto et al. 2020; Schatzmann and Haslhofer 2020).
Anchoring bias is notably significant in the stable market, as demonstrated in Table 4. The results indicate that investors are more influenced by the previous lowest price of losing securities than the previous highest price of winning securities. This finding suggests that investors tend to anchor their trading decisions to the lowest price levels they have encountered when dealing with losing securities. In volatile markets, investors are influenced more by the previous highest price than the previous lowest price, but this difference is insignificant. Hence, the manifestation of anchoring bias varies depending on market volatility. One possible explanation for anchoring bias in stable markets is that stable markets tend to exhibit more-predictable and -consistent patterns than volatile markets (Pincus and Kalman 2004). Investors often rely on these historical patterns and use them as anchors when making investment decisions. This reliance on past performance and established patterns can strengthen the anchoring bias, as investors may hesitate to deviate from the prevailing trends or reference points (De Bondt 1993; De Bondt 1998; Arkes et al. 2008; Baucells et al. 2011). Moreover, investors tend to anchor their trading decisions to the previous lowest price levels they have encountered when dealing with losing securities, compared to the previous highest price levels in winning securities, which can be attributed to loss aversion and regret aversion. By anchoring their decisions to the lowest price, investors can justify holding onto the security, believing they will have an opportunity to sell at a more-favorable price. Another factor contributing to this behavior is mental accounting, as investors often mentally separate their losing and winning securities as distinct entities (Zhang and Sussman 2018). This mental compartmentalization reinforces their attachment to the previous lowest price and influences their decision-making process. Our findings contribute to the existing empirical evidence that investors might anchor on previous high or low prices or 52-week high or low prices when making investment decisions (Hao et al. 2016; E. Lee and Piqueira 2019; Bian et al. 2021).
Lastly, the results presented in Table 5 and Table 6 examine the impact of behavioral biases on investors’ portfolio performance. We find that investors who exhibit the disposition effect tend to have lower portfolio returns and higher portfolio risk. These findings align with existing evidence from conducted studies (Odean 1998; Garvey and Murphy 2004; Aspara and Hoffmann 2015; Koestner et al. 2017; Choe and Eom 2009) that have all observed that the disposition effect is a costly behavioral bias. However, our results show the opposite outcome for anchoring bias. Investors who display anchoring bias have higher portfolio returns and lower portfolio risk. These results support the argument (Rezaei 2021; Laryea and Owusu 2022) that making decisions based on a reference price may not always be negative or irrational.
Furthermore, anchoring bias is not necessarily indicative of human irrationality but rather a result of rational considerations of time spent on adjustment and the potential cost of error due to insufficient adjustment (Rezaei 2021). In summary, our findings demonstrate that the disposition effect can be a costly bias for investors, leading to lower portfolio performance. On the other hand, anchoring bias does not necessarily have negative consequences and may even lead to improved portfolio performance. These results shed light on the nuanced nature of behavioral biases and their impact on investment outcomes.
7. Conclusions
The study aims to identify the two most ubiquitous biases in markets with different volatility levels and assess their impact on investors’ portfolio performance. A simulated investment game was designed to achieve this using historical price data from various assets, including equity indices and cryptocurrencies. The study’s main findings are as follows: the presence of both the disposition effect and anchoring bias was observed among individual investors in India. Second, market volatility can influence investors’ behavioral biases. The disposition effect was more prominent in volatile markets, while anchoring bias was significant in stable markets. This indicates that market volatility can shape and amplify specific biases. This finding can support studies arguing that investors’ preferences and beliefs vary with financial market cycles. Last, investors prone to the disposition effect tended to have lower portfolio performance, while those exhibiting anchoring bias demonstrated relatively better performance. This study has several limitations. Firstly, the sample size used is relatively small, which could impact the generalizability of the findings. Second, the measure of market volatility is based solely on standard deviation, which may not fully capture all dimensions of volatility. Using more-comprehensive measures such as VAR (Value at Risk) or expected-loss probability could provide stronger indicators of perceived risk (Borsboom and Zeisberger 2020). Furthermore, the study is confined to equity and crypto-assets markets, which limits the scope of its conclusions. For future research, it would be interesting to expand the study by increasing the number of subjects and applying simulation trading to other types of assets that have negative price fluctuations or low positive fluctuations. This would allow practitioners to examine the effect of behavioral biases on diversifiers, hedges, or safe-haven assets in an investment portfolio. Future studies can also give additional information to the subjects, such as buying options, industry information, and market indices. The findings of this research can be valuable for individual investors who seek to understand the behavioral biases that may lead to mistakes in their investment decisions. Investors can minimize risks and improve their investment returns by being more aware of the psychological factors influencing their investment choices. This research may interest financial institutions and government agencies performing similar studies to improve financial decision-making and investment behavior.
Author Contributions
Conceptualization, R.A. and M.R.; methodology, R.A. and M.R.; software, R.A.; validation, M.R.; formal analysis, R.A.; investigation, R.A.; data curation, R.A.; writing—R.A.; writing—review and editing, M.R.; visualization, M.R.; supervision, M.R.. All authors have read and agreed to the published version of the manuscript.
Funding
This research received no external funding.
Data Availability Statement
The data presented in this study are available on request.
Conflicts of Interest
The authors declare no conflict of interest.
Appendix A

Table A1.
Comprehensive literature review and research gaps.
| Behavioral Biases | Existing Literature | Research Gaps |
|---|---|---|
| Disposition effect | Country coverage, mostly in developed countries (Weber and Camerer 1998; Da Costa et al. 2008; Rau 2015; Braga and Fávero 2017; Dhar and Zhu 2006; Da Costa et al. 2013; Cueva et al. 2019). | Limited experimental literature on the disposition effect in developing countries. |
| Impact of price path or chart trends (Grosshans and Zeisberger 2018; Bansal and Jacob 2022), Market cycles (J. S. Lee et al. 2013; Bernard et al. 2021). | Existing research overlooks the impact of market volatility, a significant factor on investors’ disposition effect. | |
| Trading decisions (Weber and Camerer 1998; Dhar and Zhu 2006; Cueva et al. 2019; Rau 2015; Braga and Fávero 2017). | The effect of behavioral biases on investment performance or the portfolio performance of individual investors is understudied in the experimental literature. | |
| Anchoring Bias | Empirical studies with real market data on the different financial markets: Stock market (George and Hwang 2004; Li and Yu 2009; Li and Yu 2012; and Hao et al. 2016), Foreign exchange market (Westerhoff 2003); Money market (Campbell and Sharpe 2009); Real estate market (Bucchianeri and Minson 2013; Chang et al. 2016) | Lack of experimental studies on the anchoring bias on investors’ trading decisions. |
| Existing experimental studies on the anchoring bias in estimating stock returns (Kaustia et al. 2008); asking basic finance questions (Laryea and Owusu (2022) | Poor design and the inability to capture investors’ anchoring bias during complex financial decisions. |
Appendix B
Table A2.
Descriptive statistic of a regression model assessing behavioral biases’ effects on portfolio performance in a stable market.
Table A2.
Descriptive statistic of a regression model assessing behavioral biases’ effects on portfolio performance in a stable market.
| Descriptives | DE | AB | PR | PRR |
|---|---|---|---|---|
| Mean | 0.0083 | −1.930 | 0.047 | 1.638 |
| Median | 0 | −1.798 | 0.052 | 1.659 |
| Standard Deviation | 0.5967 | 1.995 | 0.098 | 0.247 |
| Minimum | −1 | −7.310 | −0.228 | 0.959 |
| Maximum | 1 | 1.425 | 0.214 | 2.202 |
| Count | 40 | 40 | 40 | 40 |
| Kurtosis | −0.709 | 0.950 | 0.421 | 1.169 |
| Skewness | −0.095 | −0.745 | −0.757 | −0.442 |
| Jarque–Bera | 1.046 | 4.222 | 3.62 | 2.502 |
Note. The above table shows the descriptive statistics of a regression model that examines the relationship between independent variables (disposition effect and anchoring bias) and dependent variables (portfolio return and portfolio risk) as proxies for portfolio performance. All variables are normally distributed, supported by significant p-values, rejecting the normality hypothesis of Jarque–Bera test.
Table A3.
Correlation matrix of a regression model in a stable market.
| Variables | DE | AB | PR | PRR |
|---|---|---|---|---|
| DE | 1 | |||
| AB | 0.234 | 1 | ||
| PR | (−0.298) * | 0.046 | 1 | |
| PRR | 0.116 | 0.03 | (−0.435) *** | 1 |
Note. ***, * show the 1% and 10% significance levels, respectively.
Table A4.
Descriptive statistic of a regression model assessing behavioral biases’ effects on portfolio performance in a volatile market.
Table A4.
Descriptive statistic of a regression model assessing behavioral biases’ effects on portfolio performance in a volatile market.
| Descriptives | DE | AB | PR | PRR |
|---|---|---|---|---|
| Mean | 0.30 | 0.392 | 3.60 | 2.240 |
| Median | 0.5 | 0.292 | 3.67 | 2.305 |
| Standard Deviation | 0.575 | 1.441 | 1.61 | 0.404 |
| Minimum | −1 | −2.368 | 0.61 | 1.380 |
| Maximum | 1 | 3.109 | 6.16 | 3.214 |
| Count | 40 | 40 | 40 | 40 |
| Kurtosis | −0.278 | −0.752 | −0.92 | −0.431 |
| Skewness | −0.776 | 0.088 | −0.20 | 0.050 |
| Jarque-Bera | 3.973 | 1.134 | 1.75 | 0.475 |
Note. The above table shows the descriptive statistics of a regression model examines the relationship between independent variables (disposition effect and anchoring bias) and dependent variables (portfolio return and portfolio risk) as proxies for portfolio performance. All variables are normally distributed, supported by significant p-values, rejecting the normality hypothesis of Jarque–Bera test.
Table A5.
Correlation matrix of a regression model in a volatile market.
| Variables | DE | AB | PR | PRR |
|---|---|---|---|---|
| DE | 1 | |||
| AB | 0.324 ** | 1 | ||
| PR | (−0.761) *** | −0.1407 | 1 | |
| PRR | 0.786 *** | 0.198133 | (−0.878) *** | 1 |
Note. ***and ** show the 1% and 5% significance levels, respectively.
Table A6.
Descriptive statistic of regression model assessing behavioral biases’ effects on portfolio performance in a total market.
Table A6.
Descriptive statistic of regression model assessing behavioral biases’ effects on portfolio performance in a total market.
| Descriptives | DE | AB | PR | PRR |
|---|---|---|---|---|
| Mean | 0.175 | −0.60345 | 1.819815 | 1.939243 |
| Median | 0.285714286 | −0.53038 | 1.827097 | 1.975436 |
| Standard Deviation | 0.541803006 | 1.167517 | 0.826258 | 0.255437 |
| Minimum | −1 | −3.37098 | 0.273896 | 1.440013 |
| Maximum | 1 | 1.619236 | 3.138147 | 2.509325 |
| Count | 40 | 40 | 40 | 40 |
| Kurtosis | −0.226150911 | −0.35523 | −0.91383 | −0.52168 |
| Skewness | −0.625431272 | −0.22967 | −0.24082 | −0.15919 |
| Jarque–Bera | 2.612 | 0.676 | 1.861 | 0.7666 |
Note. The above table shows the descriptive statistics of a regression model examines the relationship between independent variables (disposition effect and anchoring bias) and dependent variables (portfolio return and portfolio risk) as proxies for portfolio performance. All variables are normally distributed, supported by significant p-values, rejecting the normality hypothesis of Jarque–Bera test.
Table A7.
Correlation matrix of a regression model in total market.
| Variables | DE | AB | PR | PRR |
|---|---|---|---|---|
| DE | 1 | |||
| AB | 0.268 * | 1 | ||
| PR | (−0.721) *** | 0.053171 | 1 | |
| PRR | 0.667 *** | 0.074958 | (0.736) *** | 1 |
Note. *** and * show the 1%and 10% significance levels, respectively.
Table A8.
Variance Inflation Factor (VIF) of three regression models across different market scenarios.
Table A8.
Variance Inflation Factor (VIF) of three regression models across different market scenarios.
| Variable | Stable Market | Volatile Market | Total Market |
|---|---|---|---|
| Occupation | 1.87 | 1.95 | 1.95 |
| Experience | 1.45 | 1.54 | 1.46 |
| Income | 1.37 | 1.41 | 1.4 |
| Gender | 1.25 | 1.26 | 1.25 |
| Anchoring bias | 1.16 | 1.25 | 1.19 |
| Disposition effect | 1.1 | 1.21 | 1.17 |
| Mean VIF | 1.37 | 1.44 | 1.4 |
Note: The mean VIF values of independent and control variables in three regression models for different market scenarios show a moderate correlation between the explanatory variables. The VIF values ranging between 1 and 2 indicate a moderate level of correlation among the variables.
References
- Agarwalla, Sobhesh Kumar, Samir K. Barua, Joshy Jacob, and Jayanth R. Varma. 2015. Financial Literacy among Working Young in Urban India. World Development 67: 101–9. [Google Scholar] [CrossRef] [Green Version]
- Antonakis, John, Samuel Bendahan, Philippe Jacquart, and Rafael Lalive. 2014. Causality and Endogeneity: Problems and Solutions. In The Oxford Handbook of Leadership and Organizations. New York: Oxford University Press. [Google Scholar]
- Arkes, Hal R., David Hirshleifer, Danling Jiang, and Sonya Lim. 2008. Reference Point Adaptation: Tests in the Domain of Security Trading. Organizational Behavior and Human Decision Processes 105: 67–81. [Google Scholar] [CrossRef] [Green Version]
- Aspara, Jaakko, and Arvid O. I. Hoffmann. 2015. Selling Losers and Keeping Winners: How (Savings) Goal Dynamics Predict a Reversal of the Disposition Effect. Marketing Letters 26: 201–11. [Google Scholar] [CrossRef]
- Bansal, Avijit, and Joshy Jacob. 2022. Impact of Price Path on Disposition Bias. Journal of Banking and Finance 143: 106616. [Google Scholar] [CrossRef]
- Baucells, Manel, Martin Weber, and Frank Welfens. 2011. Reference-Point Formation and Updating. Management Science 57: 506–19. [Google Scholar] [CrossRef]
- Bernard, Sabine, Benjamin Loos, and Martin Weber. 2021. The Disposition Effect in Boom and Bust Markets. SSRN Electronic Journal. [Google Scholar] [CrossRef]
- Bhattacharya, Utpal, Craig W. Holden, and Stacey Jacobsen. 2012. Penny Wise, Dollar Foolish: Buy-Sell Imbalances on and around Round Numbers. Management Science 58: 413–31. [Google Scholar] [CrossRef] [Green Version]
- Bian, Timothy Yang, Jun Huang, Siqi Zhe, and Man Zhang. 2021. Anchoring Effects in the Chinese Art Market. Finance Research Letters 43: 1–6. [Google Scholar] [CrossRef]
- Borsboom, Charlotte, and Stefan Zeisberger. 2020a. What makes an investment risky? An analysis of price path characteristics. Journal of Economic Behavior & Organization 169: 92–125. [Google Scholar] [CrossRef]
- Braga, Robson, and Luiz Paulo Lopes Fávero. 2017. Disposition Effect and Tolerance to Losses in Stock Investment Decisions: An Experimental Study. Journal of Behavioral Finance 18: 271–80. [Google Scholar] [CrossRef]
- Bucchianeri, Grace W., and Julia A. Minson. 2013. A Homeowner’s Dilemma: Anchoring in Residential Real Estate Transactions. Journal of Economic Behavior and Organization 89: 76–92. [Google Scholar] [CrossRef]
- Bulipopova, Ekaterina, Vladislav Zhdanov, and Artem Simonov. 2014. Do Investors Hold That They Know? Impact of Familiarity Bias on Investor’s Reluctance to Realize Losses: Experimental Approach. Finance Research Letters 11: 463–69. [Google Scholar] [CrossRef]
- Campbell, Sean D., and Steven A. Sharpe. 2009. Anchoring Bias in Consensus Forecasts and Its Effect on Market Prices. Journal of Financial and Quantitative Analysis 44: 369–90. [Google Scholar] [CrossRef] [Green Version]
- Cao, Qian, Jianbiao Li, and Xiaofei Niu. 2022. Tempus Fugit: The Impact of Time Constraint on Investor Behavior. Journal of Economic Behavior and Organization 200: 67–81. [Google Scholar] [CrossRef]
- Chang, Chuang Chang, Ching Hsiang Chao, and Jin Huei Yeh. 2016. The Role of Buy-Side Anchoring Bias: Evidence from the Real Estate Market. Pacific Basin Finance Journal 38: 34–58. [Google Scholar] [CrossRef]
- Cheng, Teng Yuan, Chun I. Lee, and Chao Hsien Lin. 2013. An Examination of the Relationship between the Disposition Effect and Gender, Age, the Traded Security, and Bull-Bear Market Conditions. Journal of Empirical Finance 21: 195–213. [Google Scholar] [CrossRef]
- Choe, Hyuk, and Yunsung Eom. 2009. The Disposition Effect and Investment Performance in the Futures Market. Journal of Futures Markets 29: 496–522. [Google Scholar] [CrossRef]
- Chui, Peter M. W. 2001. An Experimental Study of the Disposition Effect: Evidence From Macau. Journal of Psychology and Financial Markets 2: 216–22. [Google Scholar] [CrossRef]
- Core, John E., and Wayne R. Guay. 2001. Stock Option Plans for Non-Executive Employees. Journal of Financial Economics 61: 253–87. [Google Scholar] [CrossRef] [Green Version]
- Cueva, Carlos, Iñigo Iturbe-Ormaetxe, Giovanni Ponti, and Josefa Tomás. 2019. An experimental analysis of the disposition effect: Who and when? Journal of Behavioral and Experimental Economics 81: 207–15. [Google Scholar] [CrossRef] [Green Version]
- Da Costa, Newton, Carlos Mineto, and Sergio Da Silva. 2008. Disposition Effect and Gender. Applied Economics Letters 15: 411–16. [Google Scholar] [CrossRef] [Green Version]
- Da Costa, Newton, Marco Goulart, Cesar Cupertino, Jurandir Macedo, and Sergio Da Silva. 2013. The Disposition Effect and Investor Experience. Journal of Banking and Finance 37: 1669–75. [Google Scholar] [CrossRef] [Green Version]
- De Bondt, Werner F. M. 1993. Betting on Trends: Intuitive Forecasts of Financial Risk and Return. International Journal of Forecasting 9: 355–71. [Google Scholar] [CrossRef]
- De Bondt, Werner F. M. 1998. A portrait of the individual investor. European Economic Review 42: 831–44. [Google Scholar] [CrossRef]
- De Winne, Rudy. 2021. Measuring the disposition effect. Journal of Behavioral and Experimental Finance 29: 100468. [Google Scholar] [CrossRef]
- Dhar, Ravi, and Ning Zhu. 2006. Up Close and Personal: Investor Sophistication and the Disposition Effect. Management Science 52: 726–40. [Google Scholar] [CrossRef]
- Garvey, Ryan, and Anthony Murphy. 2004. Are Professional Traders Too Slow to Realize Their Losses? Financial Analysts Journal 60: 35–43. [Google Scholar] [CrossRef]
- George, Thomas J., and Chuan Yang Hwang. 2004. The 52-Week High and Momentum Investing. Journal of Finance 59: 2145–76. [Google Scholar] [CrossRef]
- Gilovich, Thomas, Dale Griffin, and Daniel Kahneman, eds. 2002. Heuristics and Biases: The Psychology of Intuitive Judgment. New York: Cambridge University Press, pp. 397–420. [Google Scholar]
- Goetzmann, William N., and Nadav Peles. 1997. Cognitive Dissonance and Mutual Fund Investors. Journal of Financial Research 20: 145–58. [Google Scholar] [CrossRef]
- Grinblatt, Mark, and Matti Keloharju. 2001. What Makes Investors Trade? Journal of Finance 56: 589–616. [Google Scholar] [CrossRef]
- Grosshans, Daniel, and Stefan Zeisberger. 2018. All’s Well That Ends Well? On the Importance of How Returns Are Achieved. Journal of Banking & Finance 87: 397–410. [Google Scholar] [CrossRef] [Green Version]
- Guenther, Benno, and Grace Lordan. 2023. When the Disposition Effect Proves to Be Rational: Experimental Evidence from Professional Traders. Frontiers in Psychology 14: 1091922. [Google Scholar] [CrossRef] [PubMed]
- Hao, Ying, Hsiang Hui Chu, Keng Yu Ho, and Kuan Cheng Ko. 2016. The 52-Week High and Momentum in the Taiwan Stock Market: Anchoring or Recency Biases? International Review of Economics and Finance 43: 121–38. [Google Scholar] [CrossRef]
- Haryanto, Steven, Athor Subroto, and Maria Ulpah. 2020. Disposition Effect and Herding Behavior in the Cryptocurrency Market. Journal of Industrial and Business Economics 47: 115–32. [Google Scholar] [CrossRef]
- Hatch, Courtney Droms, Kurt Carlson, and William G. Droms. 2018. Effects of Market Returns and Market Volatility on Investor Risk Tolerance. Journal of Financial Services Marketing 23: 77–90. [Google Scholar] [CrossRef]
- Heath, Chip, Steven Huddart, and Mark Lang. 1999. Psychological Factors and Stock Option Exercise. Quarterly Journal of Economics 114: 601–27. [Google Scholar] [CrossRef] [Green Version]
- Hussain, Shahzad Syed Jawad, Elie Bouri, David Roubaud, and Ladislav Kristoufek. 2020. Safe Haven, Hedge and Diversification for G7 Stock Markets: Gold versus Bitcoin. Economic Modelling 87: 212–24. [Google Scholar] [CrossRef]
- Icf, Y., W. Paper, and A. Frazzini. 2004. THE DISPOSITION EFFECT AND UNDER- REACTION TO NEWS The Disposition Effect and Under-reaction to News. LXI 61: 2017–46. [Google Scholar] [CrossRef]
- Kahneman, Daniel, and Amos Tversky. 1979. Prospect Theory: An Analysis of Decision Under Risk. Econometrica 47: 99–127. [Google Scholar] [CrossRef] [Green Version]
- Kaustia, Markku, Eeva Alho, and Vesa Puttonen. 2008. How Much Does Expertise Reduce Behavioral Biases? The Case of Anchoring Effects in Stock Return Estimates. Financial Management 37: 391–412. [Google Scholar] [CrossRef]
- Koestner, Maximilian, Benjamin Loos, Steffen Meyer, and Andreas Hackethal. 2017. Do Individual Investors Learn from Their Mistakes? Journal of Business Economics 87: 669–703. [Google Scholar] [CrossRef]
- Kostopoulos, Dimitrios, Steffen Meyer, and Charline Uhr. 2021. Ambiguity about Volatility and Investor Behavior. Journal of Financial Economics 145. [Google Scholar] [CrossRef]
- Laryea, Esther, and Sally Peaches Owusu. 2022. The Impact of Anchoring Bias on Investment Decision-Making: Evidence from Ghana. Review of Behavioral Finance. [Google Scholar] [CrossRef]
- Lee, Eunju, and Natalia Piqueira. 2019. Behavioral Biases of Informed Traders: Evidence from Insider Trading on the 52-Week High. Journal of Empirical Finance 52: 56–75. [Google Scholar] [CrossRef]
- Lee, Jen Sin, Pi Hsia Yen, and Kam C. Chan. 2013. Market States and Disposition Effect: Evidence from Taiwan Mutual Fund Investors. Applied Economics 45: 1331–42. [Google Scholar] [CrossRef]
- Li, Jun, and Jianfeng Yu. 2009. Psychological Anchors, Underreaction, Overreaction, and Asset Prices. Working Paper 612–25. [Google Scholar]
- Li, Jun, and Jianfeng Yu. 2012. Investor Attention, Psychological Anchors, and Stock Return Predictability. Journal of Financial Economics 104: 401–19. [Google Scholar] [CrossRef]
- Locke, Peter. R., and Steven C. Mann. 2005. Professional trader discipline and trade disposition. Journal of Financial Economics 76: 401–44. [Google Scholar] [CrossRef]
- Odean, Terrance. 1998. Are Investors Reluctant to Realize Their Losses? The Journal of Finance 53: 1775–98. [Google Scholar] [CrossRef] [Green Version]
- Pflueger, Carolin, and Gianluca Rinaldi. 2022. Why Does the Fed Move Markets so Much? A Model of Monetary Policy and Time-Varying Risk Aversion. Journal of Financial Economics 146: 71–89. [Google Scholar] [CrossRef]
- Pincus, Steve, and Rudolf E. Kalman. 2004. Irregularity, Volatility, Risk, and Financial Market Time Series. Proceedings of the National Academy of Sciences of the United States of America 101: 13709–14. [Google Scholar] [CrossRef]
- Raghubir, Priya, and Sanjiv R. Das. 2010. The Long and Short of It: Why Are Stocks with Shorter Runs Preferred? Journal of Consumer Research 36: 964–82. [Google Scholar] [CrossRef]
- Rau, Holger A. 2015. The Disposition Effect in Team Investment Decisions: Experimental Evidence. Journal of Banking & Finance 61: 272–82. [Google Scholar] [CrossRef] [Green Version]
- Reeb, David, Mariko Sakakibara, and Ishtiaq P. Mahmood. 2012. From the Editors: Endogeneity in International Business Research. Journal of International Business Studies 43: 211–18. [Google Scholar] [CrossRef] [Green Version]
- Rezaei, Jafar. 2021. Anchoring Bias in Eliciting Attribute Weights and Values in Multi-Attribute Decision-Making. Journal of Decision Systems 30: 72–96. [Google Scholar] [CrossRef]
- Schatzmann, Jürgen E., and Bernhard Haslhofer. 2020. Bitcoin Trading is Irrational! An Analysis of the Disposition Effect in Bitcoin. arXiv arXiv:2010.12415. [Google Scholar]
- Shefrin, Hersh, and Meir Statman. 1985. The Disposition to Sell Winners Too Early and Ride Losers Too Long: Theory and Evidence. The Journal of Finance 40: 777–90. [Google Scholar] [CrossRef]
- Tuckett, David. 2009. Addressing the Psychology of Financial Markets. Economics 3: 20090040. [Google Scholar] [CrossRef] [Green Version]
- Tversky, Amos, and Daniel Kahneman. 1974. Judgment under Uncertainty: Heuristics and Biases. Science 185: 1124–31. [Google Scholar] [CrossRef]
- Weber, Martin, and Colin F. Camerer. 1998. The disposition effect in securities trading: An experimental analysis. Journal of Economic Behavior and Organization 33: 167–84. [Google Scholar] [CrossRef] [Green Version]
- Wermers, Russ R. 2005. Is Money Really ‘Smart’? New Evidence on the Relation Between Mutual Fund Flows, Manager Behavior, and Performance Persistence. SSRN Electronic Journal. [Google Scholar] [CrossRef] [Green Version]
- Westerhoff, Frank. 2003. Anchoring and Psychological Barriers in Foreign Exchange Markets. Journal of Behavioral Finance 4: 65–70. [Google Scholar] [CrossRef]
- Zahera, Syed Aliya, and Rohit Bansal. 2018. A Study of Prominence for Disposition Effect: A Systematic Review. Qualitative Research in Financial Markets 1. Available online: https://www.emerald.com/insight/content/doi/10.1108/QRFM-07-2018-0081/full/html (accessed on 15 July 2023).
- Zhang, C. Yiwei, and Abigail B. Sussman. 2018. Perspectives on mental accounting: An exploration of budgeting and investing. Financial Planning Review 1: e1011. [Google Scholar] [CrossRef] [Green Version]
Figure 1.
Game 11 (G11) represents Game 1 of Security 1, and Game 12 (G12) represents Game 1 of Security 2.
Figure 1.
Game 11 (G11) represents Game 1 of Security 1, and Game 12 (G12) represents Game 1 of Security 2.
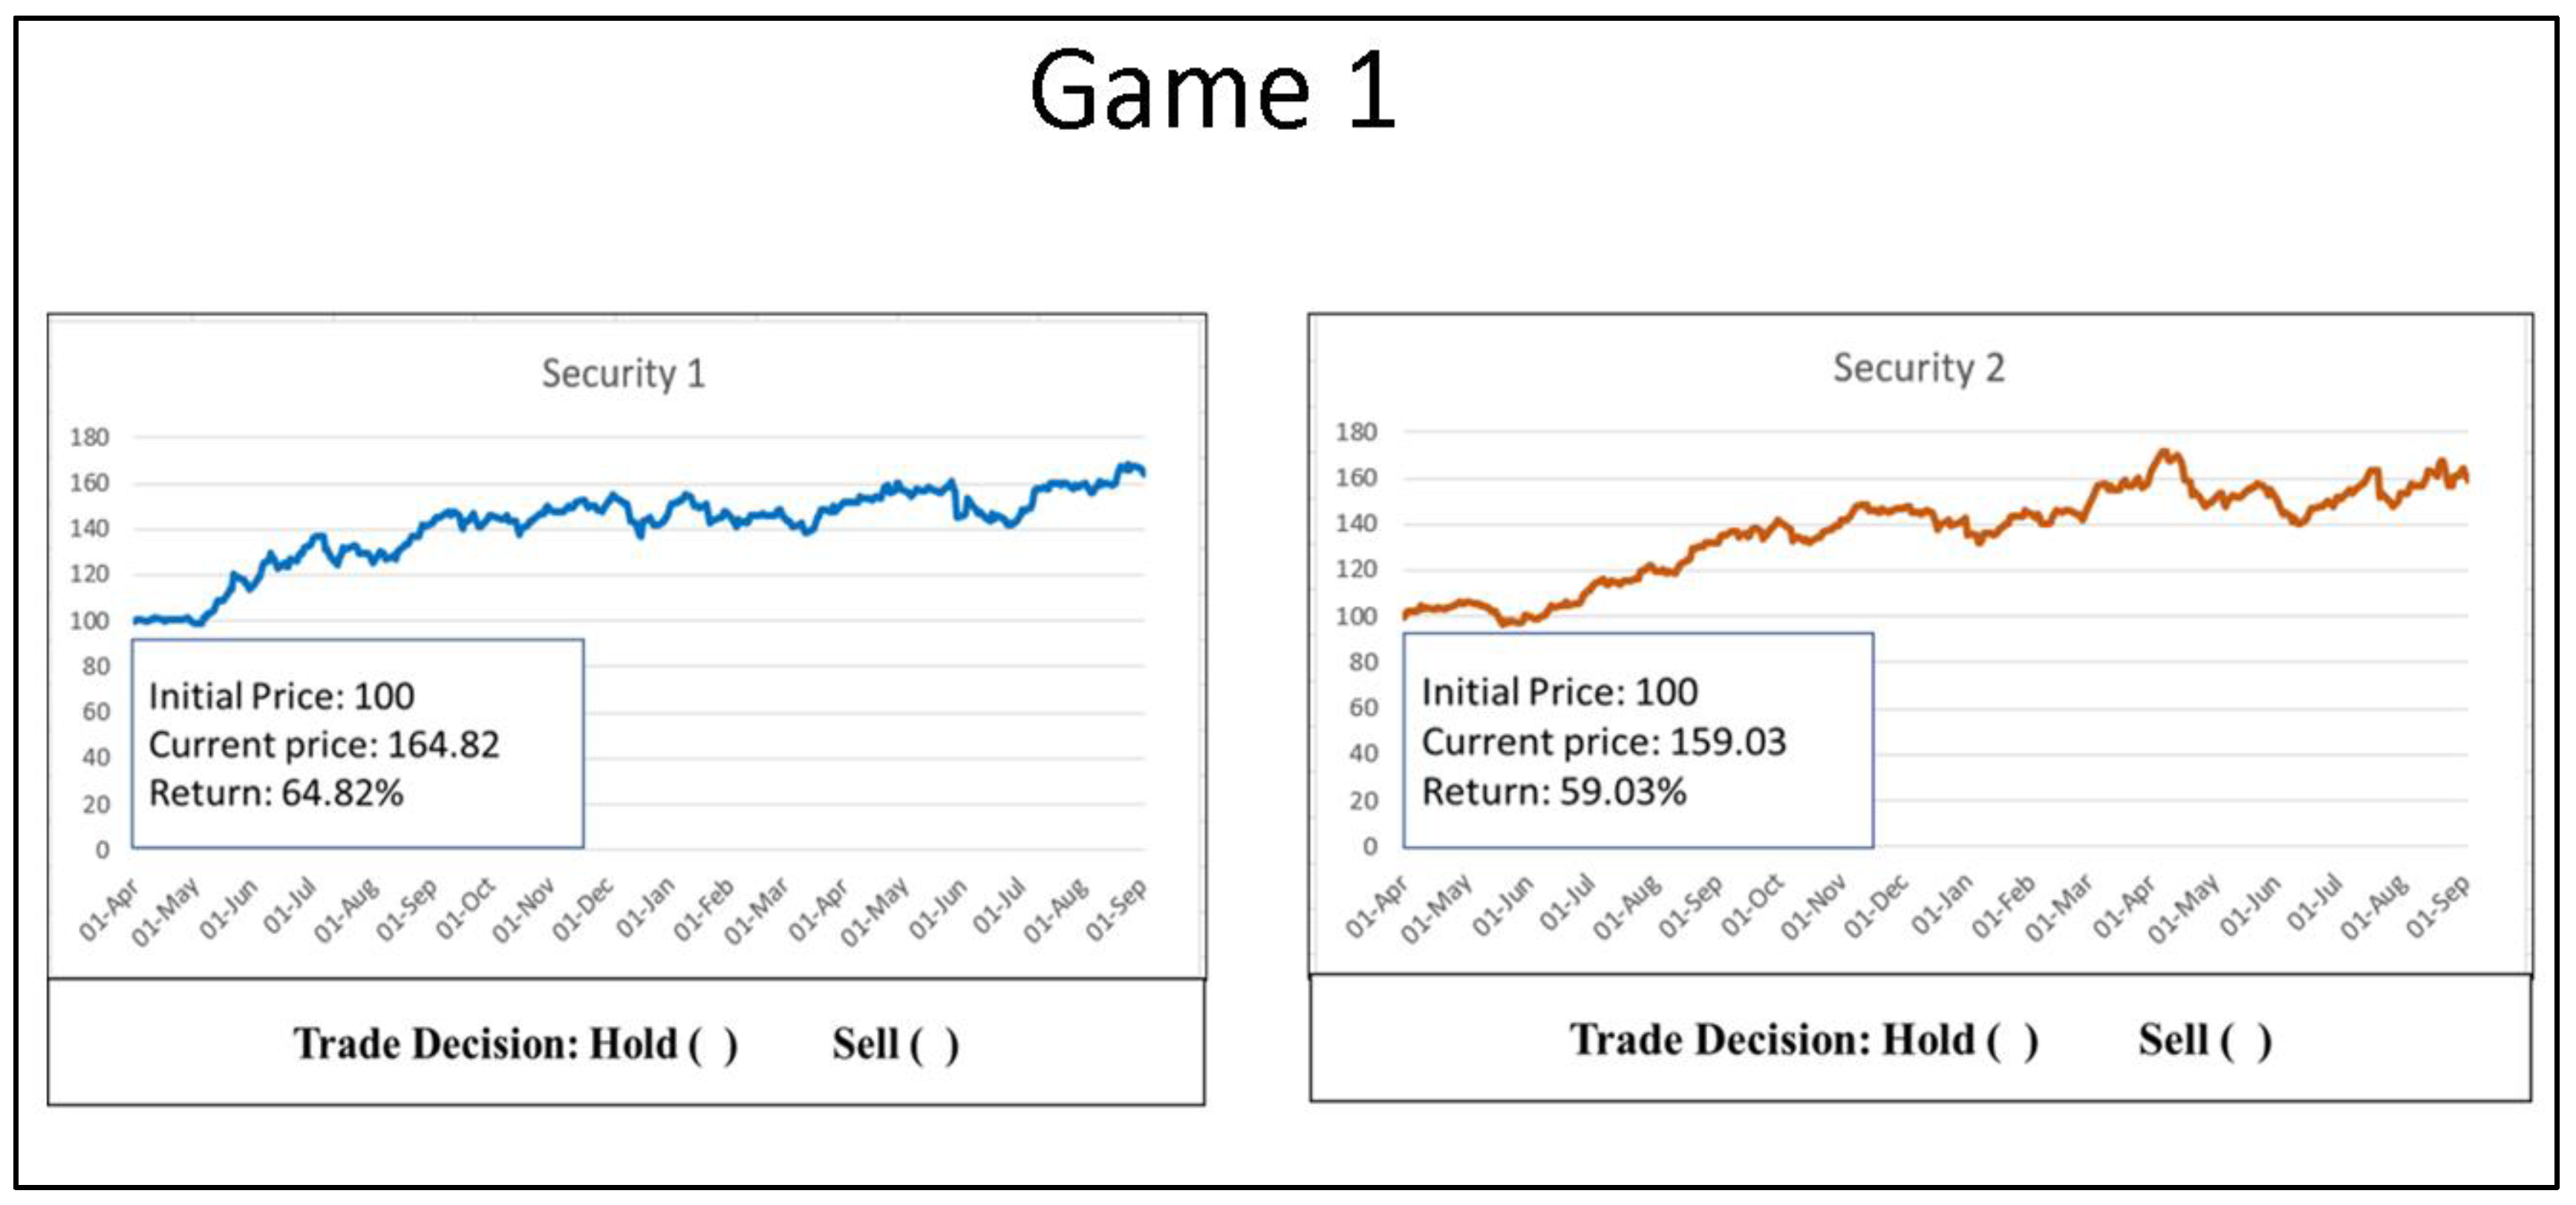
Figure 2.
A bar chart representing the information used by subjects while making trading decision.
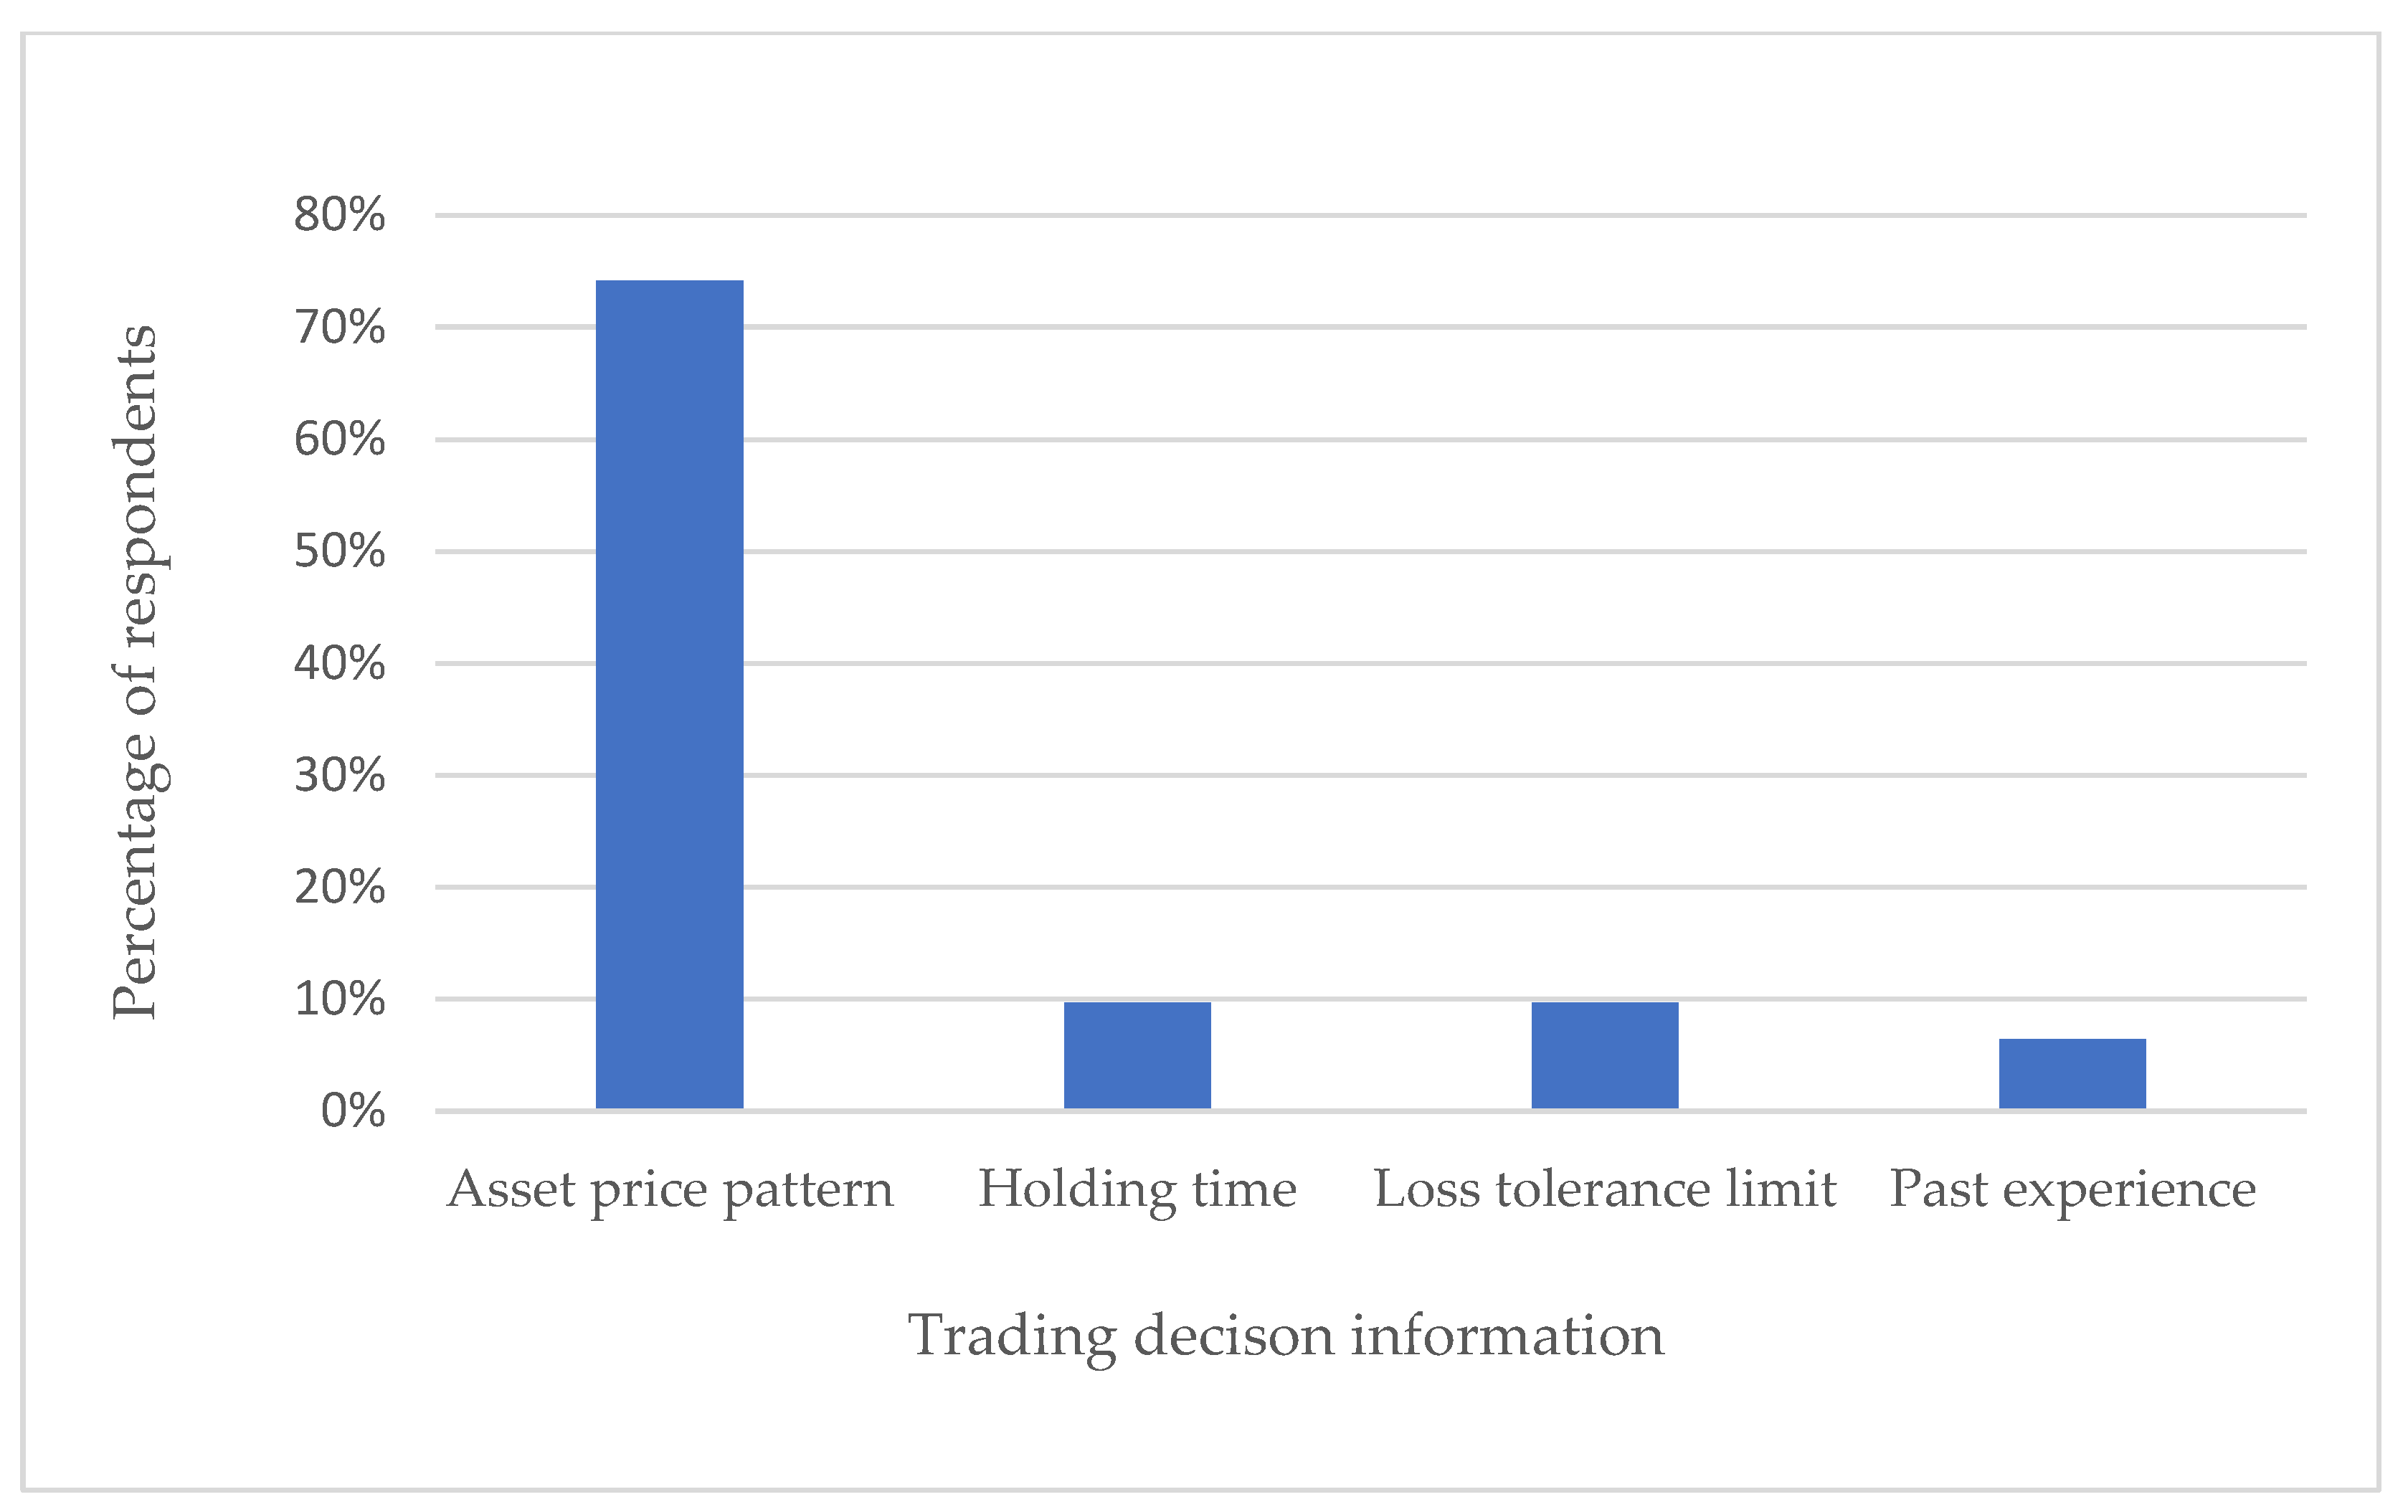
Figure 3.
Remarks on the experiment.
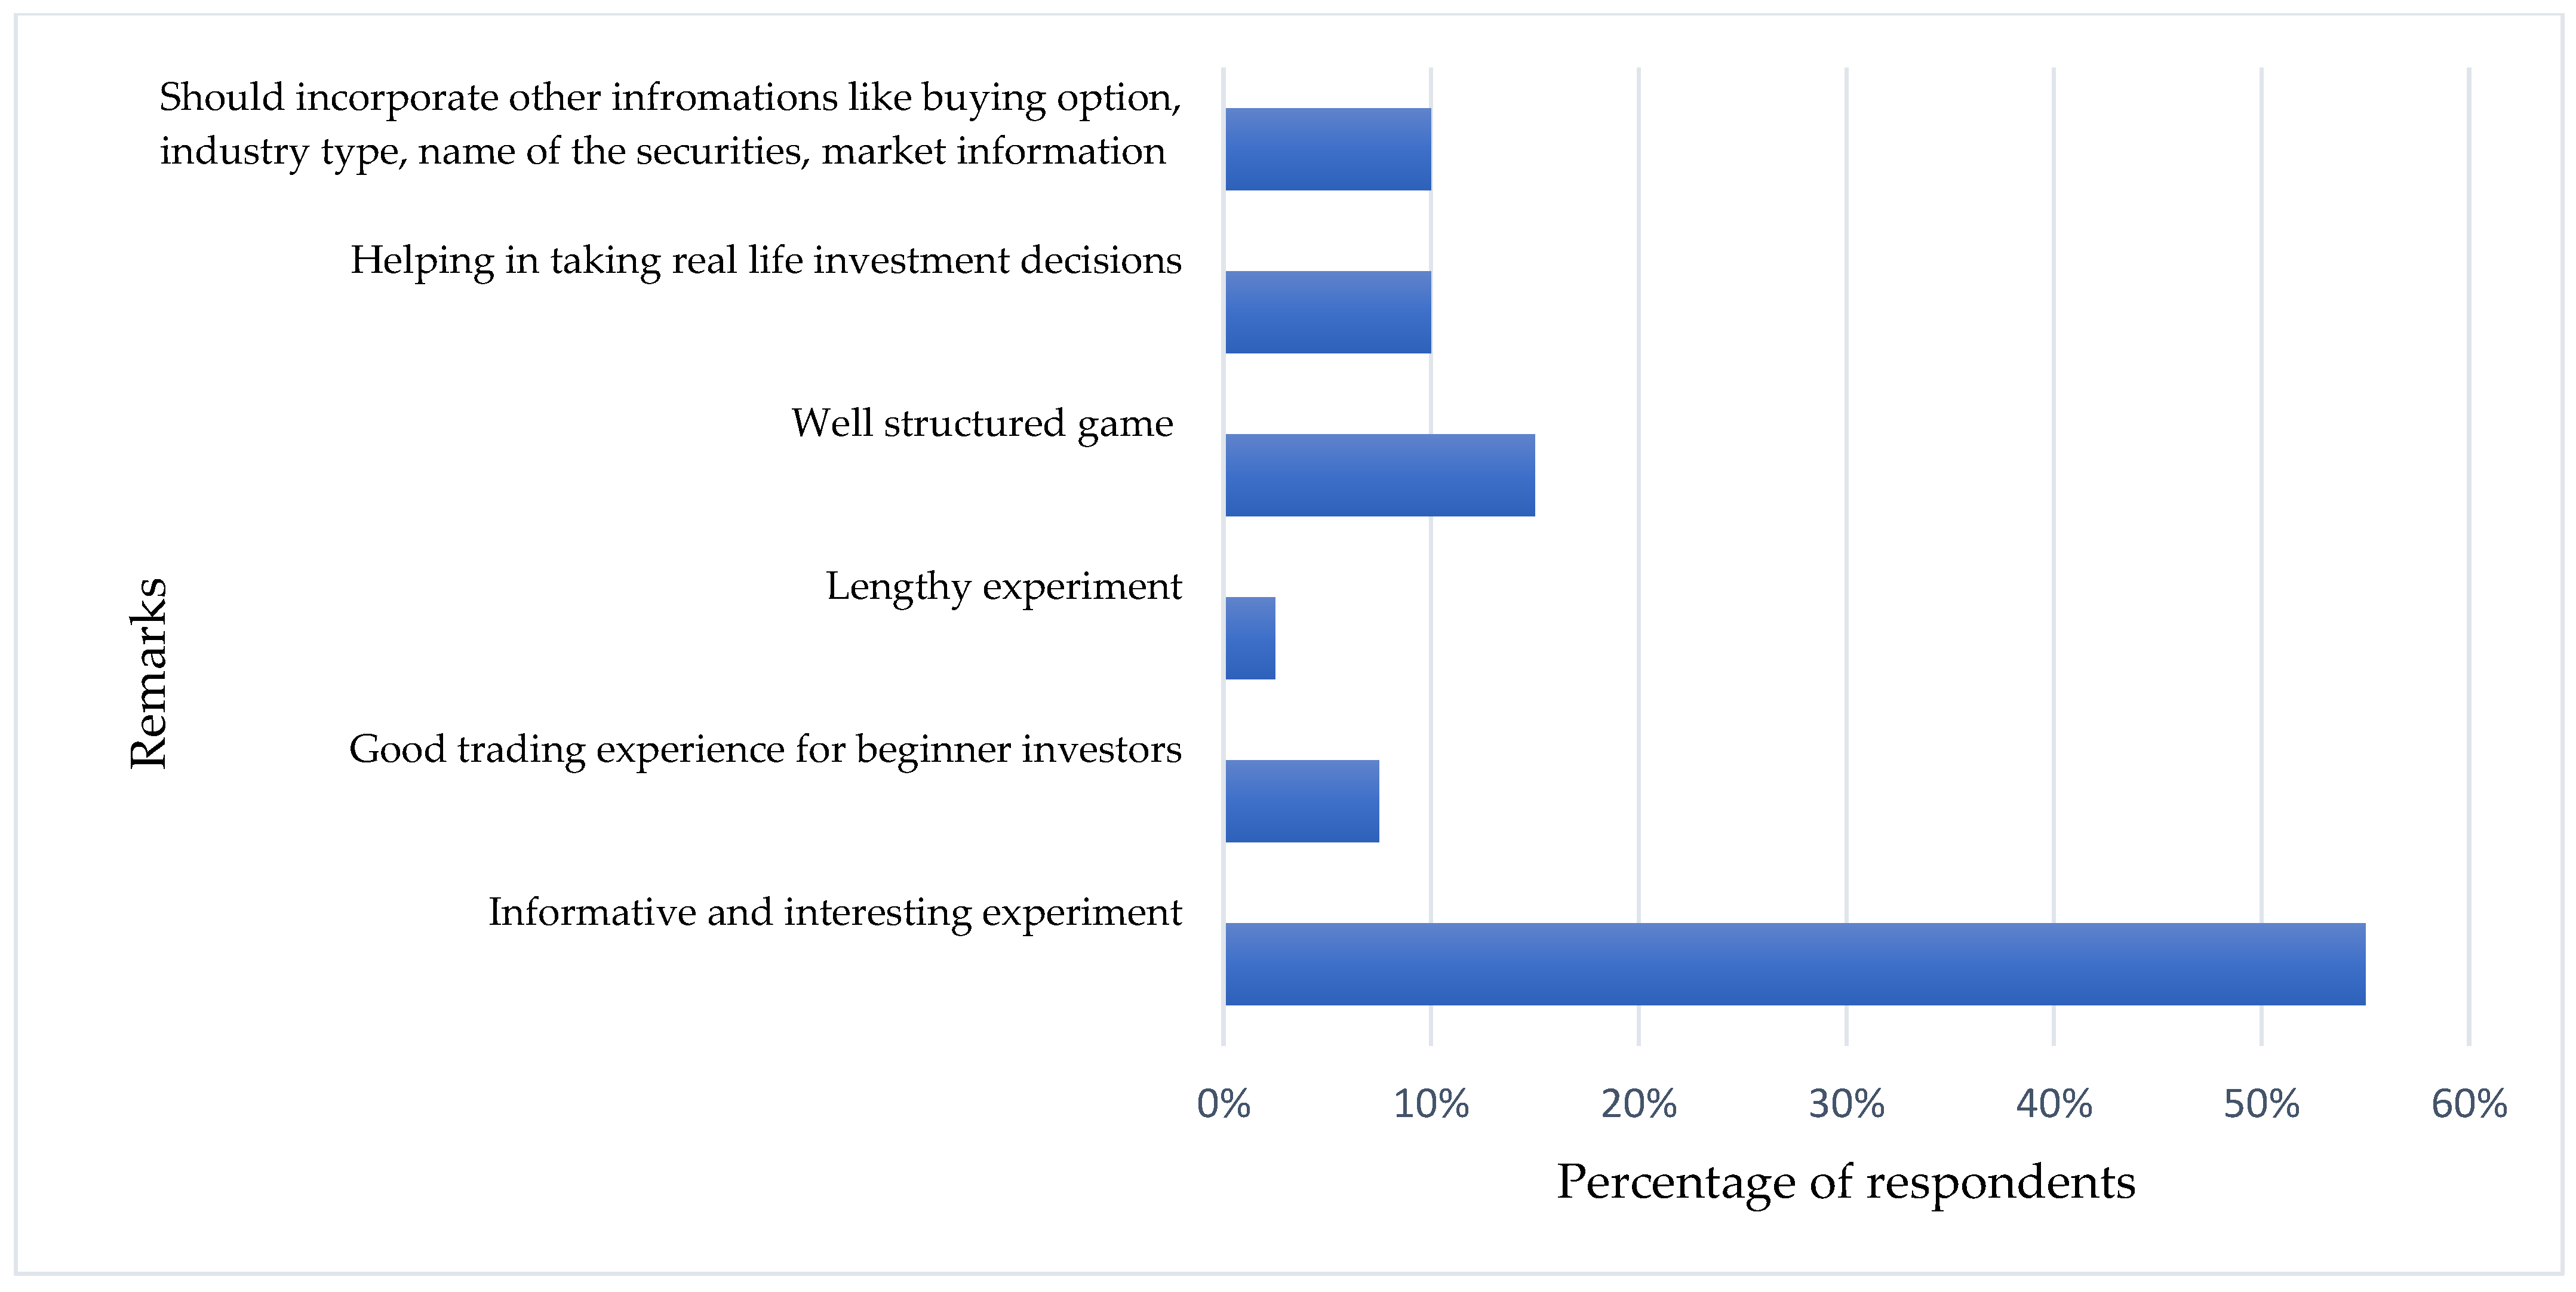
Table 1.
Summary of investment games in the experiment.
| Description | TR (%) | SD (%) | MV (%) | ML (%) | |
|---|---|---|---|---|---|
| Stable Market | Profit games | 16.30 | 10.69 | 22.01 | −5.98 |
| Loss games | 3.33 | 8.58 | 11.49 | −10.57 | |
| Volatile Market | Profit games | 305.71 | 127.86 | 362.53 | 35.94 |
| Loss games | −37.44 | 42.31 | 61.26 | −40.73 | |
| Total Market | Profit games | 155.87 | 64.09 | 184.91 | 21.58 |
| Loss games | −27.92 | 26.57 | 33.14 | −31.38 | |
Note: The above table presents the descriptive statistics of each market game in the experiment. There are five columns in the above table; the first and second columns describe the games, the third column shows the total return (TR) in percentage, the fourth column shows the standard deviation (SD) value in percentage of each game, and the fifth and sixth columns contain the maximum value (MV) and maximum loss (ML) in percentages, respectively.
Table 2.
Profile of subjects.
| Description | Frequency | Percentage | |
|---|---|---|---|
| Gender | Female | 14 | 35 |
| Male | 26 | 65 | |
| Income | Low income (<5 lacs) | 18 | 45 |
| High income (=>lacs) | 22 | 55 | |
| Employment | Employed | 23 | 57.50 |
| Unemployed | 17 | 42.50 | |
| Experience | More experienced (<2 years) | 11 | 28 |
| Less experienced (>2 years) | 29 | 73 | |
Note: Coding Scheme: {Gender (“Male = 0”, “Female = 1”)} {Income (“Low-income = 0”, “High- income = 1”)} {Employment (“Unemployed= 0”, “Employed = 1”)} {“Experience (“Less than 2 years = 0”, “more than 2 years = 1”)}.
Table 3.
Disposition effect across different asset markets (scenarios).
| 1. PGR-PLR Method | |||
| Variable | Stable Market | Volatile Market | Total Market |
| PGRE | 0.2735 | 0.6062 | 0.471 |
| PLRE | 0.2833 | 0.3062 | 0.296 |
| DE (PGRE > PLRE) | 0.0083 | 0.3 | 0.175 |
| Welch, t-statistic | 0.1021 | 3.6704 *** | 2.4278 ** |
| Wilcoxon, Z-statistic | 0.198 | 2.947 *** | 2.08 ** |
| DE in Volatile market > DE in Stable market; t-statistic = 2.225 **; z-statistic = 3.313 *** | |||
| 2. Average Holding Time Period | |||
| Variable | Stable Market | Volatile Market | Total Market |
| AHTL | 0.811 | 0.7562 | 0.7835 |
| AHTW | 0.82 | 0.6262 | 0.7057 |
| DE (AHTL > AHTW) | 0.008 | 0.13 | 0.0778 |
| Welch, t-statistic | 0.1899 | 2.8261 *** | 2.0203 ** |
| Wilcoxon, Z-statistic | 0.108 | 2.589 *** | 1.728 * |
| DE in Volatile market > DE in Stable market; t-statistic = 2.225 **; z-statistic = 2.574 *** | |||
Note: PGRE: Proportion of gains realized early; PLRE: Proportion of losses realized early; AHTL: Average holding time of losing assets; AHTW: Average holding time of winning assets; DE: Disposition effect. ***, **, and * show the 1%, 5%, and 10% significance levels, respectively.
Table 4.
Disposition effect using the regression models.
| Disposition Effect | Stable Market | Volatile Market | Total Market |
|---|---|---|---|
| Constant | 0.2950 *** | 0.248 *** | 0.2709 *** |
| Gain | −0.0154 | 0.3487 *** | 0.2048 *** |
| Overall significance | 0.792 | 0 | 0 |
| No. of observations | 240 | 320 | 560 |
| Adj. R sq | −0.00391 | 0.115222 | 0.042148 |
Note: The above table shows the results of regression models to check the disposition effect in different market scenarios. Model 1 represents a stable market, Model 2 represents a volatile market, and Model 3 represents the total market. The dependent variable is a dummy variable representing investors’ early or late sell decision; independent variable includes investor position in a security is a gain or loss. ***, shows the 1%, significance level.
Table 5.
Anchoring bias across different market volatility.
| Variable | Stable Market | Volatile Market | Total Market |
|---|---|---|---|
| MMRDPG | −0.313 | 0.956 | 0.412 |
| MMRDLG | 1.618 | 0.564 | 1.015 |
| AI index | −1.931 | 0.392 | −0.603 |
| Welch, t-statistic | 6.009 *** | 1.2879 | 2.966 *** |
| Wilcoxon, Z-statistic | 4.805 *** | 1.519 | 2.50 ** |
| AB in Stable market > AB in Volatile market; t-statistic = 5.97 ***; z-statistic = 4.61 *** | |||
Note. MMRDPG = Mean of the Mean Relative Difference of Profit games; MMRDLG = Mean of the Mean Relative Difference of Loss games; EM and TM have significant right-tailed t-test p-values, whereas AM has a significant left-tailed t-test p-value. *** and ** show the 1% and 5% significance levels, respectively.
Table 6.
Results of the regression models measuring the impact of behavioral biases on investors’ portfolio return.
Table 6.
Results of the regression models measuring the impact of behavioral biases on investors’ portfolio return.
| Variables | Stable Market | Volatile Market | Total Market |
|---|---|---|---|
| DE | (−0.048) * | (−2.243) *** | (−1.184) *** |
| (−0.026) | (−0.34) | −0.181 | |
| AB | 0.007 | 0.118 | 0.1812 ** |
| −0.008 | −0.133 | −0.085 | |
| Gender | 0.014 | −0.38 | −0.167 |
| −0.034 | −0.403 | −0.21 | |
| Income | −0.023 | −0.259 | −0.049 |
| −0.034 | −0.411 | (−0.213) | |
| Occupation | −0.037 | −0.195 | −0.102 |
| −0.034 | −0.486 | −0.253 | |
| Experience | −0.079 | −0.084 | −0.18 |
| −0.04 | −0.479 | −0.243 | |
| Constant | 0.113 | 4.633 | 2.33 |
| −0.039 | −0.428 | −0.218 | |
| Overall Significance | 0.088 | 0 | 0 |
| No. of Observations | 40 | 40 | 40 |
| Adj. R-sq | 0.138 | 0.545 | 0.528 |
Note. The above table shows the regression results of three models, each representing different asset markets. Model 1 represents the stable market, Model 2 represents the volatile market, and Model 3 represents the total market. The dependent variable is a Portfolio return, and independent variables include behavioral biases (disposition effect and anchoring bias). Demographic variables (age, gender, income, and occupation) are control variables. Standard error values are presented in parentheses. ***, **, and * show the 1%, 5%, and 10% significance levels, respectively.
Table 7.
Results of the regression models measuring the impact of behavioral biases on investors’ portfolio risk.
Table 7.
Results of the regression models measuring the impact of behavioral biases on investors’ portfolio risk.
| Variables | Stable Market | Volatile Market | Total Market |
|---|---|---|---|
| DE | 0.056 | 0.540 *** | 0.313 *** |
| −0.066 | −0.082 | −0.062 | |
| AB | −0.001 | −0.01 | −0.017 |
| −0.02 | −0.032 | −0.029 | |
| Gender | −0.245 | 0.0831 * | −0.087 |
| −0.087 | −0.098 | −0.071 | |
| Income | 0.094 | −0.005 | 0.028 |
| −0.087 | −0.1 | −0.072 | |
| Occupation | −0.038 | 0.11 | 0.035 |
| −0.102 | −0.118 | −0.086 | |
| Experience | −0.002 | 0.114 | 0.07 |
| −0.1 | −0.116 | −0.083 | |
| Constant | 1.693 | 1.960 *** | 1.849 *** |
| −0.095 | −0.104 | −0.074 | |
| Overall Significance | 0.124 | 0 | 0 |
| No. of Observations | 40 | 40 | 40 |
| Adj. R sq | 0.113 | 0.573 | 0.43 |
Note. The above table shows the regression results of three models, each representing different asset markets. Model 1 represents a stable market, Model 2 represents a volatile market, and Model 3 represents the total market. The dependent variable is a Portfolio risk; independent variables include behavioral biases (disposition effect and anchoring bias). Demographic variables (age, gender, income, and occupation) are control variables. Standard error values are presented in parentheses. ***, and * show the 1%, and 10% significance levels, respectively.
Table 8.
Result of the reliability test.
| Paired Games | μ1 (%) | μ2 (%) | p-Value (t-Test) |
|---|---|---|---|
| Games 11 and 12 | 48.07 | 41.58 | 0.54(2.30) |
| Games 21 and 22 | 5.49 | −12.44 | 0.05 (2.57) |
| Games 31 and 32 | 19.85 | −14.95 | 0.00 (2.57) |
| Games 41 and 42 | 19.96 | −10.23 | 0.00 (2.30) |
| Games 51 and 52 | −20.75 | 135.53 | 0.05 (−2.08) |
| Games 61 and 62 | 162.10 | −11.02 | 0.019 (2.77) |
| Games 71 and 72 | 434.81 | 42.83 | 0.01(2.57) |
| Games 81 and 82 | 11.60 | −24.90 | 0.07 (1.89) |
Note. T-statistics values are shown in parentheses.
Disclaimer/Publisher’s Note: The statements, opinions and data contained in all publications are solely those of the individual author(s) and contributor(s) and not of MDPI and/or the editor(s). MDPI and/or the editor(s) disclaim responsibility for any injury to people or property resulting from any ideas, methods, instructions or products referred to in the content. |
© 2023 by the authors. Licensee MDPI, Basel, Switzerland. This article is an open access article distributed under the terms and conditions of the Creative Commons Attribution (CC BY) license (https://creativecommons.org/licenses/by/4.0/).
Share and Cite
MDPI and ACS Style
Arora, R.; Rajendran, M. Moored Minds: An Experimental Insight into the Impact of the Anchoring and Disposition Effect on Portfolio Performance. J. Risk Financial Manag. 2023, 16, 349. https://doi.org/10.3390/jrfm16080349
AMA Style
Arora R, Rajendran M. Moored Minds: An Experimental Insight into the Impact of the Anchoring and Disposition Effect on Portfolio Performance. Journal of Risk and Financial Management. 2023; 16(8):349. https://doi.org/10.3390/jrfm16080349
Chicago/Turabian StyleArora, Riya, and Madhumathi Rajendran. 2023. "Moored Minds: An Experimental Insight into the Impact of the Anchoring and Disposition Effect on Portfolio Performance" Journal of Risk and Financial Management 16, no. 8: 349. https://doi.org/10.3390/jrfm16080349